Embed Size (px)
Citation preview

oCMO
Remedial Action Plan for theRoute 522 Bridge SiteEast Walnut Street
Lewistown, Mifflin County, Pennsylvania
Novembers, 1997Reviied February 16,1998Reviied May 13,1998
Prepared by:
idi R. Battista, ME J.C., P.GProject Hydrogeologist
Reviewed by:
MEISER A EARL, INC
Thomas A. Earl, PhD., P.G.Principal

TABLE OF CONTENTS
1.0 INTRODUCTION ..................................................... i
2.0 BACKGROUND ...................................................... 2
3.0 EXTENT OF CONTAMINATION STUDY ................................. 83.4 Sample Wells ................................................... 93.5 Conduct Pumping Tests .......................................... 113.6 Evaluate Data .................................................. 123.7 Prepare Report ................................................. 13
4.0 REMOVAL AND DISPOSAL PLAN ..................................... 14
5.0 CONTAINMENT MEASURES ......................................... 15
6.0 HEALTHAND SAFETYPLAN ......................................... 16
7.0 FACILITY SECURITY ................................................ 17
8.0 FIRE PROTECTION .................................................. 18
9.0 POST-WORK SITE CONTROL PLAN ................................... 19
10.0 SCHEDULE OF IMPLEMENTATION .................................... 20
LIST OF FIGURES AND TABLE
Figure 1: Site Location Map .................................................. 4Figure 2: Site Layout Map ................................................... 5Figure 3: Schedule of Implementation .......................................... 21
Table 1: PennDOT Well Construction Details ..................................... 6Table2: M5nh Mart #232 Well Construction Details ................................ 7
LIST OF APPENDICES
Appendix A: QA/QC Field Activities PlanAppendix B: Health and Safety Plan
AR00002I

1.0 INTRODUCTION
Mciscr AEarl, Inc. (M&E) has been retained by Nhtany Oil Company (NOC) to prepare
a Remedial Action Plan (RAP) pursuant to the United States Environmental Protection Agency
(USEPA) Region m Administrative Order by Consent (Order) for Abatement of Endangerment
related to the U.S. Route 522 Bridge Site (Bridge She), Lewistown, Pennsylvania (Docket No.
IH-97-005D). This Order is directed toward two Respondents: Nhtany Oil Company, Inc. and
Lorraine Y. Teyssaer of T-D Corporation. The objectives of the Order are to have the
respondents "abate, mitigate and/or eliminate any threat to public heahh and welfare and the
environment at the Route 522 She... posed by a discharge and/or threat of discharge of oil at or
from the Route 522 Site... by containing and preventing the migration of oil from the Site to the
KishacoquiHas Creek or any adjoining shorelines and navigable waters, assessing the extent of the
oil contamination at and from the Site, recovering oil from the She and property disposing and/or
arranging for the reuse or recycling of the recovered oil or ofl-contaminatrd materials." This RAP
addresses eight hems, as specified in the Order 1) extent of contamination study, 2) removal and
disposal plan; 3) containment plan; 4) heahh and safety plan; 5) facility security, 6) fire protection;
7) post-work she control plan; and 8) schedule of implementation.
AR000022

2.0 BACKGROUND
In June 1991, during the construction by the Pennsylvania Department of Transportation
(PennDOT) of a new U.S. Route 522 bridge over the KishacoquiUas Creek, adjacent to Minh
Mart #232 inLewistown, PA, PennDOT discovered oil in excavation areas around the old bridge
abutments. PennDOT installed nine monitoring wdls (MW01 through MW09) of which five
wells (MW03 through MW07) were in the area east of the bridge construction. Figure 1 is a She
Location Map. The locations of the weUs are shown on the She Layout Map, Figure 2. Table 1
summarizes the well construction details for WeUs MW03 through MW07. In August 1991, Well
MW05, located about 135 feet northeast of the Kshacoqufflas Creek, had measurable product in
it Reportedly, WeUMW04 also had measurable product In November 1996, the USEPA
conducted an assessment of the She which confirmed the presence of floating product in one,
unspecified She weUs and noted a discharge of oil into the Creek.
Adjacent to the Bridge She is a Mmh Mart convenience store property and a NOC bulk
plant facility. A pumping and treatment (PAT) system has been operating at this adjacent
property since December 4,1996. This PAT system pumps petroleum-contaminated water from
two monitoring wells (MW-2 and MW-5) through an iron-removal system, and then treats h
effectively through activated carbon to remove contaminants to below detection limits. All six
monitoring wells are sampled quarterly for benzene, toluene, ethyl benzene, xylenes (BTEX),
naphthalene, methyl tert butyl ether (MIBE), 1,2-dibromoethane (EDB) and 1,2-dichloroethane
(EDQ. The water is treated to below detection limits for the eight parameters tested and is then
discharged into an on-she drainage field.
Periodically, the iron-treatment system is "shocked" with time to remove the iron build-up.
During this cleaning process, the P&T system is shutdown. To eliminate the stopping of P&T
^ -2-
flR000023

system, a second iron-treatment system will be installed and its use will be alternated with the
existing iron-treatment system. The iron-treatment systems can then be alternated during the
cleaning period, thus eliminating any down time of the PAT system. If additional iron sediment
removal is required, a bag filter, or other type of filtration system, will be added after the iron*
treatment system to remove any remaining iron.
-3-
AR000021*

FIGURE 1Site Location Map
Route 522 Bridge SiteLewtotown, Pannsytvafiia
iFrom: USOS 7.5 mtoi. Lewtetown, PAQuadrangle, PR 1973. P11983, NAD27.
Scsde: r-1000*
Meiser & Earl, Inc. I Hydrogeologists1512 W.CoOege Avenue
State Coflege, Pennsylvania 16801(814)234-0813
flR000025

Kishacoquillas Creek —
AR000026

IJIII
1H
»o 'n g «n
+ IS! •? Sill
9 9 mmSmrim d. m&fa& mI *mm m »•O mfSm <«
oe> 3iW? G> o
2 2 5O :i'i;wM O ;i;:::Oij O<n lil Igi »ri iiSil l wS
P mmm•„ - _ ^ ^•8
s • «ci «M§*
Si
s
oo
iii <n
oO
o
41
I
m ................ ^1IMli
-6-
AR000027

00
8*N *a?"«s*1Ilu
JS TJ
IIlliii
•illiiii*___aiJilm3i
jB j?
(N
o
O :;O£ - :%mAO :;«fc 2oe :i«
m i|S O— >**;«SSiSi
^:;p|;i Q^cn
(M :WiK t™™::
KAsttS!D iH:oeO :• 'X-- <MA ':9ro 9PS i *
-7-
2 a
Sll
tn3 2
AR000028
•8
£

3.0 EXTENT OF CONTAMINATION STUDY
As per the Order, the objective of the Extent of Contamination Study is to "characterize
the nature, concentration, extent and depth of all oil contamination at the Site." To meet this
objective, M&E proposes the following tasks:
3.1 Acquire Information from PennDOT and Gain Property Access
M&E will attempt to acquire information regarding the wells and other field information
related to the Route 522 Bridge She from PennDOT. This information may include, but is not
limited to, well logs, analytical results, water-level measurements, reports, abandonment records
for Well MW07, aquifer test results, and maps. M&E will evaluate the PennDOT information
including the construction diagrams and logs of the PennDOT wells, to determine their suitability
for use in ground-water remediation and/or monitoring. NOC will attempt to obtain she access
agreements from PennDOT and any other neighboring properties deemed necessary for purposes
of installing a replacement well for Well MW07.
3n% Tiwtall Replacement Well
PennDOT reports that Well MW07, which was located along the southeastern side U.S.
Route 522, no longer exists. Replacement of this well is necessary to provide information
regarding the extent of contamination and as an observation well during pumping tests.
Therefore, M&E proposes to install a well to replace Well MW07 in the same general vicinity, on
PennDOT property, likely on the road easement. Access to this property will have been gained,
as described in Section 3.1, above.
Prior to drilling, M&E will contact the Pennsylvania One Call System, Inc. to have buried
utilities in the area identified. Drilling activities will follow M&E's Heahh and Safety Plan,
discussed in Section 6.0.
-8-
flR000029

M&E will provide a Pennsylvania-registered Professional Geologist who has current
OSHA hazardous-waste-site safety training to log the wells and oversee the well construction.
Depth to ground water in the vicinity of the former Well MW07 is expected to be about
15 feet from ground surface, so the well will be drilled to a depth of 35 feet, necessary to
encounter about 15 to 20 feet of saturation. A four-inch diameter well will be constructed using
Schedule 40 PVC pipe and screen (0.020-inch slots). Screen will be installed from total depth to
a few feet below the ground surface, followed by a short section of solid casing to the ground
surface. It is expected that this well will be completed as a flush-mounted well. A sand pack
(Morie #1) will be installed in the annuhis around the screen to just above the screen. Then, a
bentonhe seal will be placed above the sand pack followed by a manhole set into concrete at the
ground surface. The PVC casing wifl be fitted whh a locking plug or cap.
U. Survey WMli
The six Mwit Mart wells, four PennDOT wells, replacement well and the bridge survey
point will be surveyed to a common datum with reference to U.S. Geological Survey as a
benchmark. The locations will be placed on a new she map which willindude the entireMinit
Mart and Route 522 she areas.
14 Sample Wdla
To gain an understanding of the status of the wells and ground-water in the vicinity of the
Bridge She, A4&E proposes to sample PennDOT WeUs MW03 through MW06 and the
replacement well. The objectives of this task are to determine: 1) the extern of contamination;
2) the usefulness of any of these wells for ground-water remediation and; 3) ground-water flow
direction. This information will be combined whh existing ongoing information from the six
-9-
AR000030

monitoring wells at the adjacent Minit Mart site to more fully understand the existing Site
conditions.
M&E will provide a Pennsylvania-registered Professional Geologist who has current
OSHA hazardous-waste-site safety training to sample the monitoring wells. While sampling, the
atmosphere at the top of the wells will be evaluated for volatile organic compounds using a
photoionization detector (PID). Sampling activities will follow M&E's Health and Safety Plan,
discussed in Section 6.0.
Prior to sampling the wells, a water-level measurement will be taken, then a
decontaminated "thief-type" bailer will be lowered into the well to check for floating product.
The wells will then be purged using M&E's Redi-Flo2 Grundfos submersible pump or similar
pump. Purging will occur until field chemistry parameters of temperature, pH and specific
conductance stabilize. If the wells have low yields, then t minimum of one well volume will be
purged before sampling. The pump will be decontaminated prior to use and between wells using
an Alconox/potable water wash and a potable water rinse. The samples will be labeled, cooled
and transported on ice to Centre Analytical Laboratories, Inc. to be analyzed for BTEX, MTBE,
naphthalene, cumene, EDB, EDC, and lead (total). All field activities will follow M&E's "Quality
Assurance/Quality Control Plan for Field Activities'* attached as Appendix A.
Assuming that three well volumes are purged from each of the five wells, an estimated 80
gallons of water will be purged. For planning purposes, we will assume about 100 gallons of
purge water will be generated. The purge water will be either stored in "clean" tanks or drums, or
other suitable containers provided by NOC. NOC will be responsible for properly disposing of
the purge water. M&E will apply for t National Pollution Discharge Elimination System
(NPDES) permit to allow discharging of the treated water from the existing treatment system at
„,.„,. -10- .,._
AR00003I

the adjacent Minit Mart into the unnamed tributary to the Kishacoquillas Creek, located northwest
of the Bridge 522 site. The purge water can then be treated via the existing treatment system at
the adjacent Minit Mart site. Currently, the Minit Mart P&T system is treating 1.25 gallons per
minute (gpm) and is sized to handle 10 gpm.
3.5 Conduct Pumping Testa
M&E will conduct a step-drawdown/pumping test on PennDOT Well MW05, and possibly
MW07, to determine: 1) the hydraulic characteristics of the aquifer at this location, 2) a long-
term pumping rate, and 3) the area that could be influenced by this pumping. Field activities will
follow M&E's Health and Safety Plan, discussed in Section 6.0. Static water levels will be
measured in all five PennDOT wells, all six Minit Mart wells, and the Kishacoquillas Creek prior
to beginning the test. Downhole pressure transducers and a data logger and/or water-level meters
will be used to measure water levels in the pumping well and adjacent observation wells
(PennDOT Well MW04, the replacement well, and NOC Wells MW-6 and MW-4). From this
test, we hope to determine whether existing wells can effectively capture ground-water
contamination near the bridge abutment, whether PennDOT Well MW05 can possibly function as
a recovery well, and if so, at what pumping rate. Step tests will be conducted at 5 gpm, 10 gpm,
and 15 gpm for 30 minutes at each step. It is important that the pumping rate be held constant
during each step of the test. Following each step, the well will be allowed to recover to
approximately 90% of its original static level; the recovery time is typically no longer than the
time of pumping. During the pumping test, water-level measurements will be plotted versus time
on logarithmic graph paper to track the progress of the test. We anticipate that about 900 gallons
of water will be generated during the step test. The following information should be recorded
when conducting a pumping test:
-11-AR000032

1) The static water level of the well to be pumped and the observation wells;
2) The pump model used and the depth at which the pump is set;
3) The time and pumping rate at the start of the test and at each step;
4) Periodic water-level measurements and associated time throughout the test; and
5) Recovery water-level measurements and associated times once the pump is shut
off.
From the step-drawdown test graphed data, an optimum pumping rate will then be chosen which
can be sustained for a "steady-state test." M&E assumes that USEPA's "steady-state pump test"
is a constant-rate pumping test. Immediately after the wells have recovered from the step test, a
steady-state pumping test will be conducted to better define the yield of the aquifer. The "steady
state pump test** will be conducted for at least 1,000 minutes, approximately 17 hours. An
additional 6100 gallons of pumping-test water would be anticipated to be generated if the well can
be pumped at 6.1 gpm, resulting in an estimated 7,000 gallons of pumped water requiring proper
disposal as a result of this task. As described for the sampling task above (Section 3.4), NOC will
be responsible for providing suitable containers to hold the pumped water and for properly
disposing of the water.
3.6 Fivah i ate PiiaThe sampling data and analytical data will be tabulated and evaluated to determine the
extent of contamination. The water-level elevations, as determined from PennDOT survey data
(Table 1), will be contoured onto a Site map to determine the ground-water flow direction. The
adequacy of the existing PennDOT wells in terms of the Order's objectives and remediation
options will be evaluated and the need for additional wells, if any, will be determined. The
pumping test data will be evaluated to determine aquifer characteristics and the usefulness of Well
-12-AR000033
MW05 as a recovery well. Findings from this evaluation of data will determine more definitively
the next course of action. These findings will be presented as part of a Progress Report or in the
Extent of Contamination Study report.
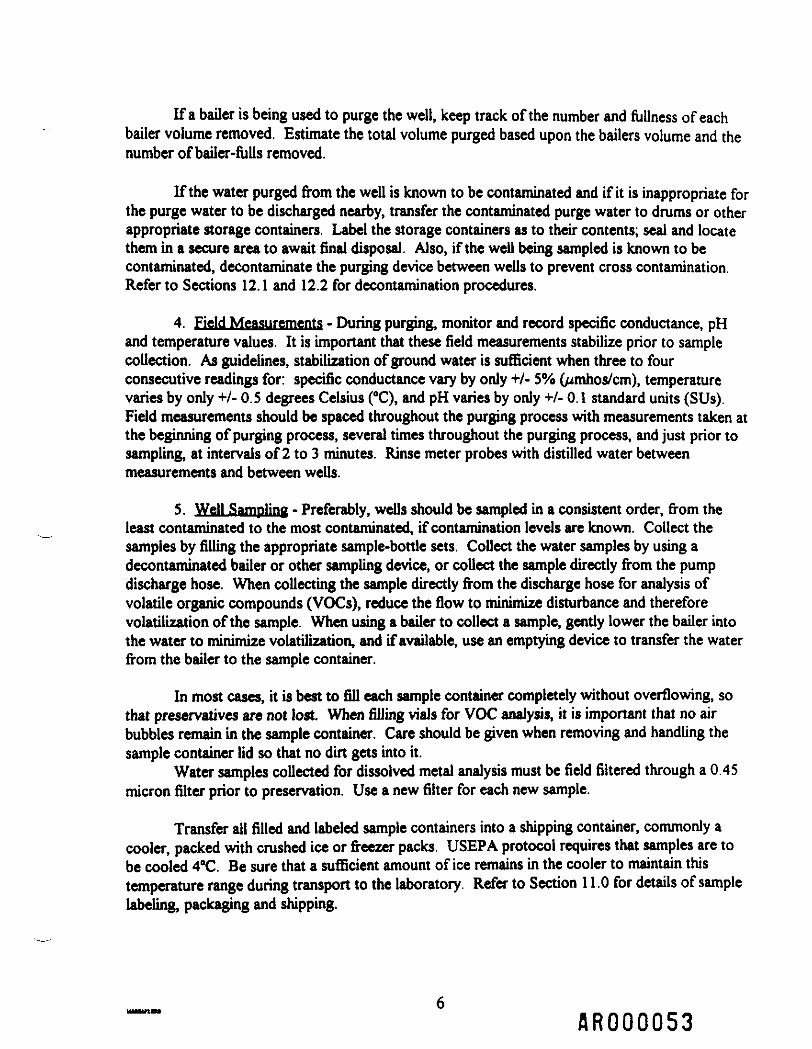
3.7 Prepare Report
M&E will prepare an Extent of Contamination Study report summarizing the findings of
this study and recommendations, if necessary, for further work. The results of the study, with
recommendations for removal of the oil, will be provided to USEPA for USEPA approval.
-13-
AR00003U

4.0 REMOVAL AND DISPOSAL PLAN
The need for the removal, disposal and/or treatment of oil and materials contaminated
with oil is dependent on the nature and extent of petroleum contamination found as a result of the
Extent of Contamination Study. A survey of residents near to the She to determine if they have a
well will be performed. Assuming, however, that petroleum contamination, either floating and/or
dissolved, exists within the PennDOT and/or shallow monitoring wells, options to mitigate the
petroleum contamination may include:
1) Remove the dissolved product by incorporating the recovery wells into the existing
activated carbon treatment system in operation at the adjacent Minit Mart facility. This option
assumes that the information gleaned from the pumping tests, including pumping rates, is
favorable, and that PennDOT allows the physical installations necessary to connect the recovery
well(s) to the Minh Mart treatment system.
2) Remove floating product by various means including: passive or active product
removal devices, or pumping to an oil/water separator.
The options for removal and disposal of the petroleum-contaminated ground water will be further
defined following the Extent of Contamination Study. A Removal and Disposal Plan will then be
prepared and submitted to the USEPA for their approval
NOC will be responsible for containerizing and properly disposing of any drill cuttings,
purge and sample water, used absorbents, and any other She-generated waste materials created
during implementation of the RAP. Petroleum-contaminated water will be properly treated before
disposal.
-14-
AROOQQ35

5.0 CONTAINMENT MEASURES
Implementation of this proposed RAP will not compromise existing highway structures,
i.e., the bridge abutment. Any purge water or pumping test water will be containerized to prevent
the opportunity for oil-contaminated ground water from reaching the Creek. No discharge of oil-
containing runoff is anticipated to enter the Kishacoquillas Creek during implementation of this
RAP.
-15-
AR000036

6.0 HEALTH AND SAFETY PLAN
A she-specific Health and Safety Plan (HASP) has been prepared pursuant to 8.5 (a) of
the Order. This HASP addresses heahh and safety issues specific to the implementation of the
Extent of Contamination Study (Section 3.0), and is attached as Appendix B.
-16-AR000037

7.0 FACILITY SECURITY
Facility security for implementation of the RAP applies mainly to the monitoring wells.
All existing PennDOT and proposed wells should be fitted whh a locking plug and securable
manhole cover to preclude access by unauthorized personnel. M&E or NOC will provide the
locking cap and secure manhole covers for the proposed weUs. With PennDOTs approval, M&E
will replace any locking plugs or manhole covers as necessary on the PennDOT wells. Any drums
or tanks containing purge or pumping test water can be secured inside the NOC bulk facility.
The adjacent Nfinit Mart fccUhyfaces the Bridge She. The NOC bulk finality office has
daily hours of 7:30 a.m. to 5:00 p.m. Mondays through Fridays, and during winter months is open
from 8:00 a.m. until noon. The Minit Mart is open 24 hours a day. Therefore, the Site is
continually under observation. NOC and/or M&E personnel also will check the wells periodically
to ensure their security.
-17-AR000038

8.0 FIRE PROTECTION
On-She fire protection during implementation of the RAP is not deemed necessary, based
on she conditions encountered to date at the adjacent Minit Mart property.
Fire protection will be provided by the Lewistown Volunteer Fire Companies. Several fire
companies serve the Lewistown area. The closest fire company to the Bridge Site is the City
Volunteer Fire Company, however, the 911 Emergency system would contact the closest fire
company available to the She.
State and County emergency management authorities will be notified as to the activities to
be conducted at the Site.
-18-AR000039

9.0 POST-WORK SITE CONTROL PLAN
Post-work site control will be maintained by periodic progress reports to be submitted to
the regulatory agency. These progress reports will include the operations and maintenance
activities related to the Removal and Disposal Plan implemented.
Site control of the wells and potential treatment system will be maintained by NOC bulk
plant facility staff The replacement well will be fitted whh a locking plug and a securable
manhole cover. NOC staff will be tasked to monitor and maintain the Site wells and associated
equipment. Drums or other containers containing product or used materials associated with the
operation of the Removal and Disposal Plan can be secured in the NOC bulk facility to prevent
tampering.
-19-
AROOOOUO

10.0 SCHEDULE OF IMPLEMENTATION
The Schedule of Implementation for the tasks described above is attached as Figure 3.
Any delays to the proposed Schedule of Implementation will be addressed as stated in Section
XVII of the Order. M&E will attempt to complete the RAP tasks expeditiously.
-20-
AROOOOUI

ncous
Aflfrin
UbnutiaaM*
PropvtyABOM
2 4
w«nSwiyAll
6
WMb
t
DM(1)
10 12
Rmrt
14 1C
^— •
RMHmlftDnpOMl_________________________________________________ PlMWEEKS
NOTE: Pvw4kpn«minfartiwillW provided lotto USEPA.(1) IwtadMhbanliMytnMa
SCHEDUL2.WK4
AROOOOl+2

APPENDIX A
QA/QC Plan for Field Activities
AROOOOU3

Quality Assurance / Quality Control
Plan for
Field Activities
Melser <& Earl, Inc.
1998
Prepared By:
Heidi R. Battista, P.G.
Thomas A. Earl, Ph.D., P.G.
MEISEX* EARL, INC \ Hydr«i>uluilrti
1S1JW.COUfOtAVB*J§,ITATlCOllIQ«,PWNiVl.V««Al«01 Fhon* 11* 234-0*13 FWL •! M34- )•) C-mM:
OoooQC

TABLE OF CONTENTS
Page Nn
1.0 OBJECTIVES ........................................................ l
2.0 RESPONSIBILITIES OF SITE PERSONNEL .............................. .2
3.O MONITORING-WELL SAMPLING ..................................... . . 3
4.0 SURFACE-WATER AND SEDIMENT SAMPLING ..................... ... 84.1 SURFACE-WATER SAMPLING .................................. .84.2 SEDIMENT SAMPLING . . . . . . . . . . . . . . . . . . . . . . . . . . . . . . . . . . . . . . . . . 9
5.0 SOIL SAMPLING .................................................... 105.1 SOILLOGGING ............................................... 105.2 SOIL SAMPLE COLLECTION .................................... 14
6.0 FLOW MEASUREMENT . . . . . . . . . . . . . . . . . . . . . . . . . . . . . . . . . . . . . . . . . . . 156.1 CUTTHROAT FLUME .......................................... 156.2 FLOWMETER ............................................. 166.3 CIRCULAR-ORIFICE WEIRS ................................ . . . . 18
7.0 SOIL-GAS SURVEYS ................................................ 26
8.0 AQUIFER TESTING ................................................ .288.1 SLUG TESTS ................................................. 288.2 BAIL TESTS .................................................. 308.3 PUMPING TESTS .............................................. 30
9.0 QUALITY-CONTROL SAMPLES . . . . . . . . . . . . . . . . . . . . . . . . . . . . . . . . . . . . . . . 33
10.0 SAMPLE PRESERVATION AND HANDLING. . .. . . . . . . . . . . . . . . . . . . . . . . . . . 34
11.0 SAMPLE RECORD KEEPING AND DOCUMENTATION . . . . . . . . . . . . . . . . . . . . 35
12.0 LABELING, PACKAGING AND SHIPPING OF SAMPLES . . . . . . . . . . . . . . . . . . . 37
AROOOOU5

TABLE OF CONTENTS
Page
13.0 DECONTAMINATION PROCEDURES .................................. 3813.1 DECONTAMINATION OF SUBMERSIBLE PUMPS .................. 3813.2 DISPOSABLE/DEDICATED EQUIPMENT .......................... 39
14.0 CALIBRATION PROCEDURES AND PREVENTATIVE MAINTENANCE.................................................................. 40
14.1 CALIBRATION OF FIELD METERS ............................... 40
AROOOOU6

LIST OF FIGURES AND TABLES
EigUTfiS Page No.
3.1 Sampling Record . . . . . . . . . . . . . . . . . . . . . . . . . . . . . . . . . . . . . . . . . . . . . . . . . . . . . . 43.2 Field Sheet . . . . . . . . . . . . . . . . . . . . . . . . . . . . . . . . . . . . . . . . . . . . . . . . . . . . . . . . . . . 5
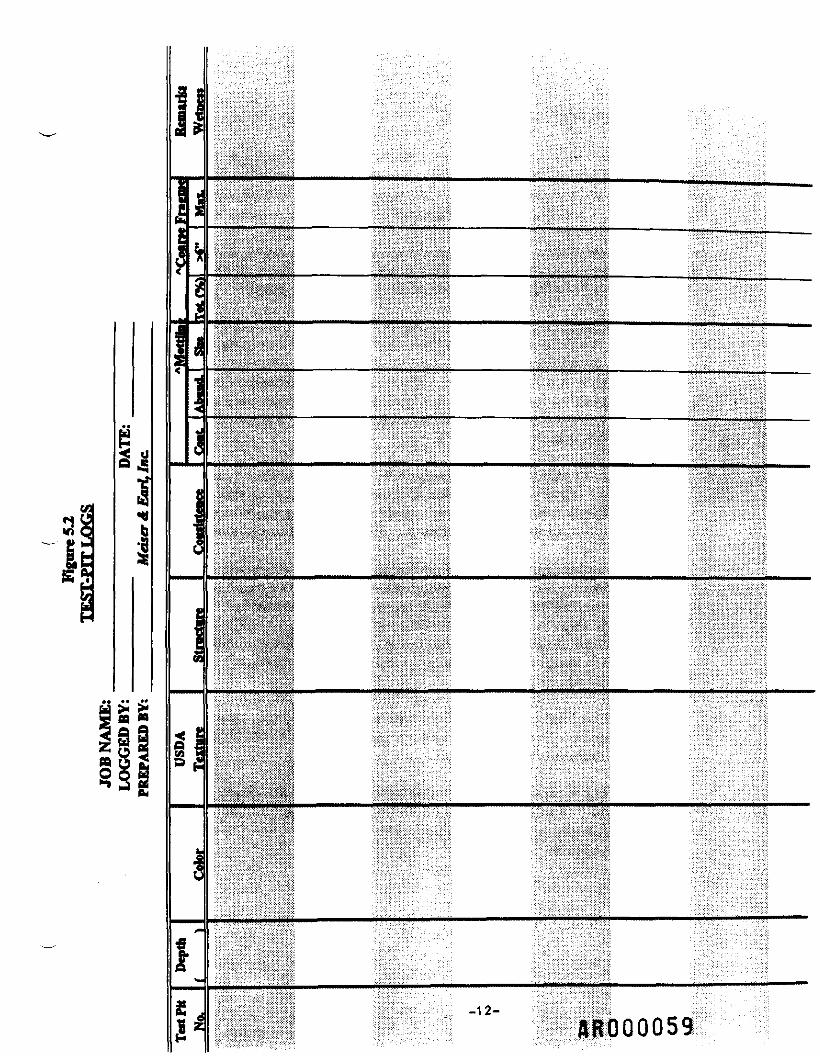
5.1 Soil Textural Triangle ................................................. 115.2 Test-Pit Logs Form .. . . . . . . . . . . . . . . . . . . . . . . . . . . . . . . . . . . . . . . . . . . . . . . . . . 12
6.1 Surface-Water Sampling - Physical Measurements . . . . . . . . . . . . . . . . . . . . . . . . . . . . 16
7.1 Soil-Gas Survey Summary .............................................. 26
8.1 Hvorslev Slug/Bail Testing Field Data Sheet ................................288.2 Pumping Test Data Form . . . . . . . . . . . . . . . . . . . . . . . . . . . . . . . . . . . . . . . . . . . . . . 31
11.1 Chain-of-Custody Form ................................................ 35
Tables
5.1 Soil Logging Criteria .................................................. 10
6.1 Orifice Discharges I'/i" x 1" OrificeCap ................................. 186.2 Orifice Discharges 2" x 1W Orifice Cap ................................... 196.3 Orifice Discharges 2'/2H x W1 Orifice Cap .................................. 206.4 Orifice Discharges 3" x 2" Orifice Cap ..................................... 216.5 Orifice Tables ... . . . . . . . . . . . . . . . . . . . . . . . . . . . . . . . . . . . . . . . . . . . . . . . . 22 & 23
14.1 pH Meter Calibration Procedures . . . . . . . . . . . . . . . . . . . . . . . . . . . . . . . . . . . . . . . . . 4014.2 Calibration Procedure for YSI Conductivity Meter Readings . . . . . . . . . . . . . . . . . . . . 4114.3 Compensation Procedure for YSI Conductivity Meter Readings . . . . . . . . . . . . . . . . . . 4214.4 HNUPI101 Calibration Procedures . . . . . . . . . . . . . . . . . . . . . . . . . . . . . . . . . . . . . . 4414.5 Dissolved Oxygen Meter Calibration Procedures . . . . . . . . . . . . . . . . . . . . . . . . . . . . .4514.6 MX241 Explosimeter Calibration Procedures ................................ 46
AROOOOt*?

1.0 OBJECTIVES
The purpose of the Quality Assurance/Quality Control (QA/QC) Plan for Field Activitiesat Meiser & Earl, Inc. (M&E) is to establish procedures for sampling activities so that the datagenerated from the field samples are scientifically reliable and representative of the mediasampled. Specifically, the objectives of the QA/QC Plan are:
o To ensure that all measurements made are representative of the media (i.e. water,soil, sediment and sludge) and conditions being measured;
o To ensure that all samples are collected according to acceptable and recognizedprocedures;
o To ensure the proper handling and management of samples during and after samplecollection;
o To ensure all samples are sufficiently documented to maintain indisputable trackingof each sample; and
o To be aware of and recognize deficiencies or errors which may affect data quality.
This QA/QC Plan is most useful in assuring continuity internally so that M&E's samplecollection and documentation is consistent.
The major areas addressed in this QA/QC Plan are for those activities conducted mostregularly at M&E. Those tasks not addressed by this Plan will be addressed, as needed, on aproject-specific basis,
AROOOOU8

2.0 RESPONSIBILITIES OF SITE PERSONNEL
During site activities, specific duties must be delegated to site personnel. Although notalways formally designated, the following responsibilities must be coordinated and taken intoaccount. In many cases, only one or two people may be necessary to fulfill these roles. Theresponsibilities of the personnel during field activities can be grouped into four major categoriesas follows:
1. Qn-Site Coordinator (QSC) - The OSC or the project manager is responsible for theoverall management of site operations. Responsibilities include site health and safety, emergencycoordination, community relations, document coordination, and sample packaging and shipping.
2. Site Safety Officer fSSQ) - The SSO is responsible for overseeing the implementationof the Health and Safety Plan (HASP) during site operations. All field personnel should befamiliar with the requirements of the HASP and know emergency procedures, such as the hospitalroute. The SSO is responsible for informing other site personnel of the HASP requirements andfor posting the HASP in a prominent location for easy access in case of an emergency.Enforcement of the HASP is the main responsibility of the SSO.
3. Drilling Supervisor - The drilling supervisor is responsible for monitoring the progressof the drilling contractor, documenting subsurface conditions encountered during drilling,collecting samples, and ensuring that the construction and installation of monitoring wells andpiezometers is in accordance with specifications.
4. Sampling Crew or Field Crew - The sampling crew is responsible for collectingsamples and data according to the requirements of this M&E QA/QC Plan. In general, the fieldcrew consists of personnel conducting all other field activities not specified in the foregoingdescriptions. The field crew can conduct activities such as test-pit logging, geophysicalsurveying, geologic mapping, etc.
AROOOOi+9

3.0 MONITORING-WELL SAMPLING
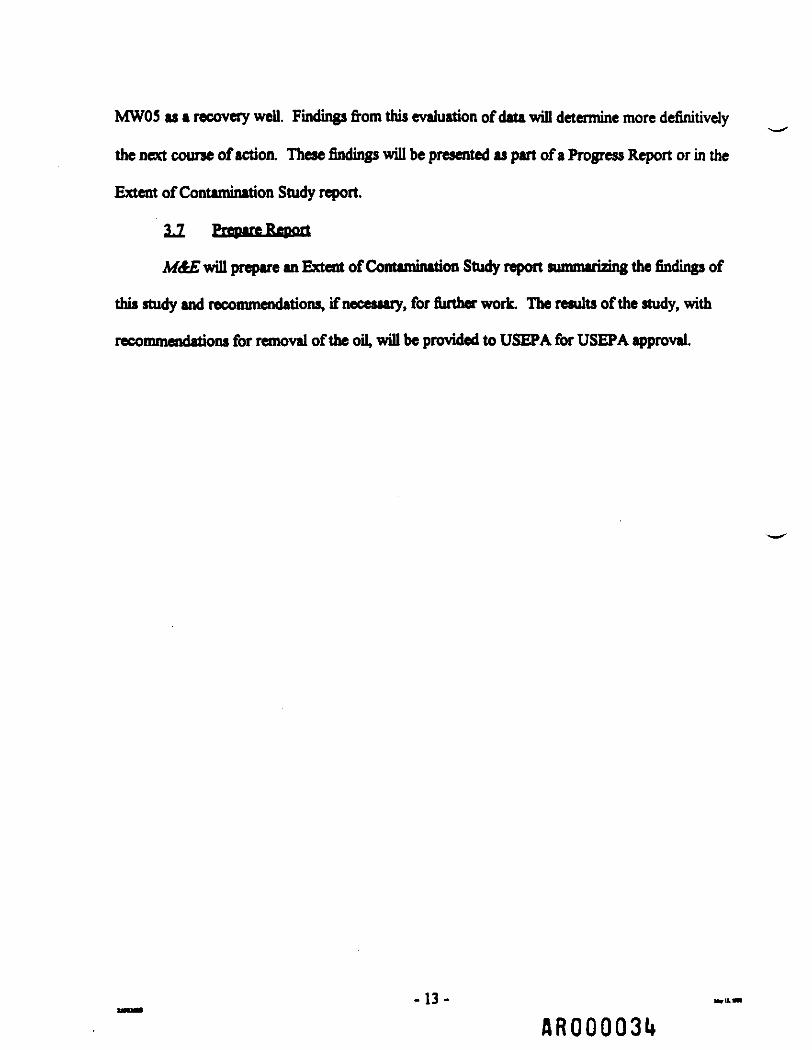
All samples are collected in accordance with United State Environmental ProtectionAgency (USEPA) protocol. Information gained during well sampling is recorded on the M&ESampling Record (Figure 3.1) or the M&E field sheet (Figure 3.2). The steps to sampling amonitoring well are as follows:
1. Measure the depth to water and the casing stick-ups - To the nearest hundredth of afoot, measure the depth to water from the top of the measuring point using an electric water-levelprobe. Usually, the top of the protective casing, commonly steel, is the measuring point. If thetop of the protective casing is uneven, a mark should be made along the rim from which allsuccessive measurements will be taken. Then measure the casing "stick up", i.e. the length of thecasing above ground surface. Also, measure the height difference between any inner casing andthe outer protective casing. Note the diameter of the outer protective and inner casings.
2. Determine the volume of water in the well • Either use the known well depth or plumbthe well to determine the depth. Based upon the well diameter and the height of water in the well,calculate the volume of water in the well.
3. Purge the well - It is important that the well water be evacuated to assure that thewater being sampled is representative, fresh, formation water. Prior to sampling, using adecontaminated pump or bailer, a minimum of three well volumes must be purged from the welland/or field measurements should be stabilized. If the well has a low well yield such that aconsiderable amount of time is required for the well to recover between purgings, purging onewell volume or purging until dry may be considered adequate.
If a pump is used to purge the well, make note of the depth at which the pump was set andat what depth the sample was collected, i.e. the pump intake depth. The pump should be set afew feet off the bottom of the borehole, if possible.
If a pump is being used for purging, periodically measure the flow to maintain the desiredpumping rate; use the bucket-and-stopwatch method. Appearance of the water, well integrity, asdetermined by visual inspection of the protective steel sleeve or casing, and any problemsencountered during purging should be noted on the field sheet (Figure 3.2). Also, periodicallymeasure the depth to water while purging to determine whether the pumping rate is appropriate.
AR000050
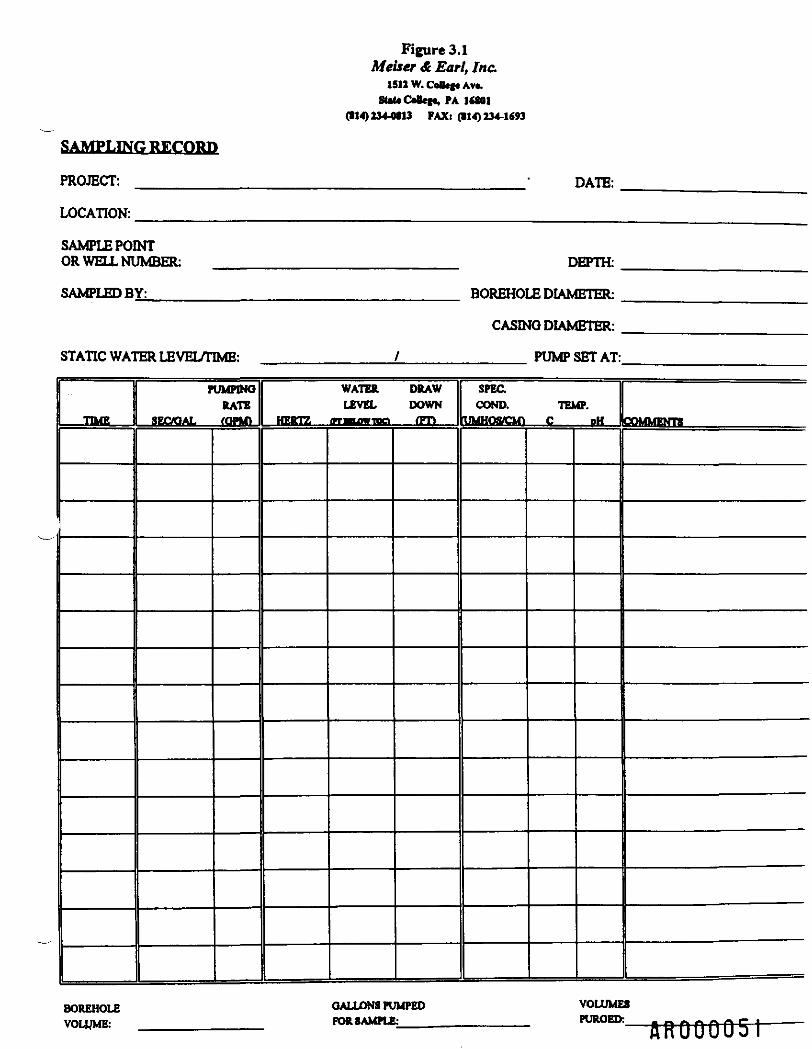
Figure 3.1Meiser & Earl, Inc.
ISUW.CafeftAv*.StiteCOfeft, PA IttOl
(IM) 2344113 PAXt (114)234-1693
SAMPLING RECOUP
PROJECT: _____________________________________ • DATE:
LOCATION:
S AMPLE POINTOR WELL NUMBER: _______________________ DEPTH:
SAMPLED BY;_____________________________ BOREHOLE DIAMETER:
CASINO DIAMETER:
STATIC WATER LEVEL/TIME: ____________/____________ PUMP SET AT:
1 PUMPINGRATE
SECVOAL fOPMl
BOREHOLEVOLUME:
WATER DRAWLEVEL DOWN
HERTZ ..._ (TTMLOWTOO _ ffTl_ _
SPEC IICOND. TEMP. tt
UUHWCM) C DH IcOMMFNTS
GALLONS PUMPEDFOR SAMPLE:
VOLUMESPURGED: «.^ * * n C 1anuuuuo i

Figure 3.2MEISERftEARUNC1512 West fclltpAvMM
StattColiefe.Pewuytvaw 1(301(814)234-080
TO
DDE
mitt
uono«own
wuno rat'« w•« m
NCSNTITBR
THE FOLLOWING WAS MOTED:
COPIESTO ___________ FIELD REPORTSIGNED _______________
- 5 - AR000052
If a bailer is being used to purge the well, keep track of the number and fullness of eachbailer volume removed. Estimate the total volume purged based upon the bailers volume and thenumber of bailer-fiills removed.
If the water purged from the well is known to be contaminated and if it is inappropriate forthe purge water to be discharged nearby, transfer the contaminated purge water to drums or otherappropriate storage containers. Label the storage containers as to their contents; seal and locatethem in a secure area to await final disposal. Also, if the well being sampled is known to becontaminated, decontaminate the purging device between wells to prevent cross contamination.Refer to Sections 12.1 and 12.2 for decontamination procedures.
4. Field Measurements - During purging, monitor and record specific conductance, pHand temperature values. It is important that these field measurements stabilize prior to samplecollection. As guidelines, stabilization of ground water is sufficient when three to fourconsecutive readings for: specific conductance vary by only +/- 5% ( mhos/cm), temperaturevaries by only +/- 0.5 degrees Celsius (°C), and pH varies by only +/- 0.1 standard units (SUs).Field measurements should be spaced throughout the purging process with measurements taken atthe beginning of purging process, several times throughout the purging process, and just prior tosampling, at intervals of 2 to 3 minutes. Rinse meter probes with distilled water betweenmeasurements and between wells.
5. Well Sampling - Preferably, wells should be sampled in a consistent order, from theleast contaminated to the most contaminated, if contamination levels are known. Collect thesamples by filling the appropriate sample-bottle sets. Collect the water samples by using adecontaminated bailer or other sampling device, or collect the sample directly from the pumpdischarge hose. When collecting the sample directly from the discharge hose for analysis ofvolatile organic compounds (VOCs), reduce the flow to minimize disturbance and thereforevolatilization of the sample. When using a bailer to collect a sample, gently lower the bailer intothe water to minimize volatilization, and if available, use an emptying device to transfer the waterfrom the bailer to the sample container.
In most cases, it is best to fill each sample container completely without overflowing, sothat preservatives are not lost. When filling vials for VOC analysis, it is important that no airbubbles remain in the sample container. Care should be given when removing and handling thesample container lid so that no dirt gets into it.
Water samples collected for dissolved metal analysis must be field filtered through a 0.45micron filter prior to preservation. Use a new filter for each new sample.
Transfer all filled and labeled sample containers into a shipping container, commonly acooler, packed with crushed ice or freezer packs. USEPA protocol requires that samples are tobe cooled 4°C. Be sure that a sufficient amount of ice remains in the cooler to maintain thistemperature range during transport to the laboratory. Refer to Section 11.0 for details of samplelabeling, packaging and shipping.
AR000053

4.0 SURFACE-WATER AND SEDIMENT SAMPLING
The methods described below for surface water and sediment sampling can be modifieddependent upon the site-specific sampling circumstances. It is important to collect samples inorder from downstream to upstream locations to assure that a representative, non-turbid sample iscollected. When collecting both surface water and sediment samples at the same samplinglocation, collect the surface water sample first prior to stirring up the sediments beneath thewater. Decontaminate the sampling instrumentation prior to and between sampling locations.
4.1 SURFACE-WATER SAMPLING
Protocols for sampling surface water are as follows:
1. Collect surface-water samples using a decontaminated glass jar or a 12-ouncestainless-steel container. Refer to Section 11.0 for decontamination procedures.
2. Collect samples upstream of any disturbance and upstream of the samplingpersonnel.
3. Do not disturb underlying sediments when collecting surface-water samples.
4. When filling containers for VOC analysis, collect the surface-water sample from anarea where the flow is least aerated.
5. Be careful not to overfill sample containers containing preservatives.
6. When necessary, take field measurements of pH, specific conductance,temperature and dissolved oxygen and record the results on the field sheet. Besure that the instrumentation is calibrated prior to use according toprocedures outlined in Section 13.
7. Flag or stake the location in the field and draw a depiction of the sampling locationin the field notes. Measure the distance and direction from the flag or stake to thesampling location and note this on the field sheet.
8. Label, package and ship the samples following the procedures outlined in Section11.0.
4.2 SEDIMENT SAMPLING
In most cases, sediment samples are collected at or near the source of the surface-watersamples to best characterize the quality of the stream at that point. Sediment samples are usuallycomposite samples comprised of material collected over a defined area or depth. Since theyoungest, most recently deposited sediments should be deposited at the surface and the older
HR00005U

sediments should be deposited at depth, care should be taken so that the sediments collected meetthe objectives of the sampling effort. Sediment sampling procedures are as follow:
1. Collect sediment samples in order from downstream to upstream locations sincethe stream bottom will be disturbed. Also, collect sediment samples upstream ofany disturbance, such as sampling personnel standing in the water.
2. Depending on the nature of the stream being sampled, sediment may be foundmore easily in areas of deposition such as pools and the inside of bends in thestream and in other areas of slow-moving water. Deeper sediment tends to reflectmore historic depositional environments.
3. Non-Volatile Analysis - For a grab sample, at each sampling location, use adecontaminated stainless-steel trowel or stainless-steel spoon to collect the sampleTransfer the sample minus extraneous materials, such as sticks, grass and stones,directly into the sample container and secure the container lid. The container lidshould remain closed at all times except when the container is being filled.
For a composite sample, transfer the sediment sample into a re-scalable plasticbag, for compositing before transferring the sediment to the appropriate samplecontainer. Using a stainless-steel spoon, remove any sticks, grass, stones andother extraneous debris. Seal the bag, then shake the contents to mix.
Volatile Analysis - For a grab sample, at each sampling location, the sediment iscollected into an EnCore sampler, or equivalent. If the parameters to be analyzedare suspected to be in low concentrations, i.e., 1-200 Mg/kg, one sample issufficient. If the parameters to be analyzed are presumed to possibly be greater,i.e., 100-200 Mg/kg* then collect three samples per location, or as per thelaboratory's instructions. The number of sediment samples needed per location isdependent on the laboratory's needs and the QA/QC requirements.
When collecting a composite sample for volatile analysis, collect several samplesinto EnCore samplers. The number of samples collected is dependent on thenature of the material being sampled and the area being composited. Note thenumber and locations of the samples in the field notes. The individual EnCoresamples will be composited at the laboratory. On the chain-of-custody form,describe which samples are to be composited.
4. Flag or stake each sampling location with the appropriate sampling locationnumber. Describe in the field notes where the sediment samples were collected.
5. Label, package and ship the samples according to the procedures described inSection 11. The samples collected for VOC analysis in the EnCore sampler mustbe received at the laboratory and preserved within 36 hours from the time ofcollection.
AR000055

5.0 SOIL SAMPLING
The soil sampling process often includes both describing or togging the soil, whether it bein a backhoe test pit or from split-spoon samples, and the collection of the soil samples.
5.1 SOIL LOGGING
Whenever a soil sample is collected, a soil description is recorded. At a minimum, the soilcharacteristics recorded should include:
o Sampling Location;o Sampling Depth;o Color; ando USDA Texture.
Typically in soil test pits, the following additional characteristics are noted:
o Structure;o Consistence;o Mottling;o Coarse Fragments;o Moisture content; ando Other comments.
Table 5.1 provides the soil-logging criteria for test pits excluding texture. The textureclassifications are presented on Figure 5.1, the soil textural triangle. The soil characteristicschoices are then recorded on the Test-Pit Logs form, Figure 5.2. The degree of definition of thesoil-logging information is dependent on the objective of the soil-description exercise.
When logging soils, use a decontaminated stainless-steel trowel or spoon to scrape thesample away from the formation. The soil can be transferred into a re-sealable plastic bag tofurther characterize, if necessary. It is always prudent to retain a soil sample for later reference.Be sure to label the sample container with the sampling location, depth and date.
AR000056

TABLE 5.1Soil-Logging Criteria
COLOR:
Hue-color 5R 10R 5YR 10YR
™ *i SSl BSSl
'
5Y
Value -bUck to white 1 -black 10- white
Chroma -gray to vivid 1 -gray 10-vivid
STRUCTURE:
GRADE
StDlfiturefejij£ak • indistinct in pUoeModerate. - evident in place and, when brokenilCQng - distinct in place, survive* whenremoved with little looae material
WET
Stickiiien - non-sticky, slightly sticky, stickyand very stickyPlasticity - non-plastic, slightly plastic, plasticand very plastic
TYPE
Bag- planesPrismatic - vertical, angular-ended prismsColumnar • vertical, rounded capsAngular A Subangular BlockyQranular - spheroidal, non-porousCnimh - spheroidal, porous
MOIST
Loose, very friable, friable, firm, very firm,extremely firm
CLASS
(General, see Structural Table for better value)very fine - -~<S mmfiflg - -5-10 mmmedium - 10-20 mmeojrjB - 20-50 mmvervcoarie - >50 mm
DRY
Loose, soft, slightly hard, hard, very hard,extremely hard
MOTTLING:
CONTRAST
Eliot - must look closelyQtstJQcJ - easy to see hue, value and chromaProminent - ouMandlns;
ABUNDANCE
Few-«3%ConmflQ - 2-20SManv->20%
SIZE
EQS~<SmmMedium -5- 15 mm£ojrjB->15mm
STONINESS: If > 1 5-20% by volume, use prefix
ROUNDED (add angular)
OimveBy-<3wCocWey-3-10"Stony - >10"
THIN-FLAT
Channery - <6"Flaggy -6-151*Stony ->l 5"
DRAINAGE CLASS:
DEPTH TO MOTTLES
Well Drained ->40"Moderately Well Drained - 20-40*Somewhat Poorly Drained - 10-20"Poorly Drained - 0-10* (some gleying)Very Poorly Drained • 0" (strong gleying)
SLOPE
slightModerate
Severe
SLOPE
0-8H
8-15%
>15H
FLOODPOTENTIAL
None
Rare
Frequent
DEPTH TOBEDROCK
>72"
48-72"
<48"
BOUNDARY
WIDTH
Abrupt -<1"Clear -1-25"Gradual - 2.5-S"Djffii 5* ^ ^ ^ ^ ^ ^ ^ ^ ^ ^ ^ ^ ^ ^ ^
SURFACE TOPOGRAPHY
Smooth - oUnarWaw - wide ooctetsIrregular - deeper pockets
TABLE5-1 HRB Prepared by Meiser & Earl. Inc. October 30, 1996AR000057

Figure 5.1Soil Textural Triangle
100% clay(2 microns)
10
100%sand Percent sand
-11-
AR000058
fi

5.2 SOIL SAMPLE COLLECTION
The collection of soil samples is similar to the collection of sediment samples, whether thesamples are shallow soil samples, samples from test pits or samples from drilling or augering.Care should be given to document the depth and location from which the sample was collected.As of December 13,1997, the way soil samples are collected for analysis of volatile organiccompounds (VOCs) has changed. USEPA1 SW-846 Update II sampling method (Method 5035)for soils to be analyzed for VOCs addresses how the samples are collected and analyzed.Therefore, the sampling method used depends on whether the samples collected are to beanalyzed for VOCs. M&E has adopted the following sampling procedures:
1. Non-Volatile Analysis - At each sampling location, use a decontaminatedstainless-steel trowel or stainless-steel spoon to collect the sample and transfer thesoil sample to the sample container. Auger or core samples may be transferreddirectly from the sampling device to the sample container. Quickly transfer thesample minus extraneous materials, such as sticks, grass and stones, directly intothe sample container and secure the container lid. Secure the container lid whenthe container is not being filled.
For a composite sample, transfer the soil sample to a clean, re-sealable plastic bagfor compositing before transferring the soil to the appropriate sample container.Using a stainless-steel spoon, remove any sticks, grass, stones and otherextraneous debris, then seal the bag and shake the contents to mix.
Volatile Analysis - At each sampling location, the soil is collected into a EnCoresampler, or equivalent. If the parameters to be analyzed are suspected to be in lowconcentrations, i.e., 1-200 /ig/kg, one sample is sufficient. If the parameters to beanalyzed are presumed to possibly be greater, i.e., 100-200 Mg/kg, then collectthree samples per location, or as per the laboratory's instructions. The number ofsoil samples needed per location is dependent on the laboratory's needs and theQA/QC requirements.
2. Flag or stake each sampling location with the appropriate sampling locationnumber. Describe where the soil samples were collected and the depths of samplecollection in the field notes.
3. Label, package and ship the samples according to procedures described in Section11.0. The samples collected for VOC analysis in the EnCore sampler must bereceived at the laboratory and preserved within 36 hours from the time ofcollection.
13
AR000060

6.0 FLOW MEASUREMENT
Volumetric flow rates can be determined using a variety of equipment and techniques.The measuring devices most often used by M&E staff are the cutthroat flume, the velocity- probeflow meter and the circular-orifice meters. Dependent on the layout of the channel beingmeasured and the flow, a simple method of converging the flow into a pipe, then timing theoutflow into a bucket is also a viable flow-measurement method.
6.1 CUTTHROAT FLUME
Ground-water flows emanating from wells during drilling and well development are mostoften measured using the cutthroat flume. The cutthroat flume is ideal for low-flow surface-watermeasurements (up to 1000 gallons per minute, gpm). Cutthroat flumes are useful since they canoperate under low-flow conditions. Plus, since this flume has a flat floor, it can be adapted to astream-channel bed or a concrete channel. The advantages of a flume versus a weir include itsability to self clean, and it is more suited to situations where there is limited head available, sincethe head loss is less through a flume. The major disadvantage to the flume is the time required toset it up in the channel. Time is required to find an appropriate location to place it and toproperly seal it in order to minimize short circuiting.
M&E's cutthroat flume measures 13 inches at its opening, 8 inches at its throat (whenexpanded to its maximum) by 18 inches long. The entrance arms to the flume expand to a totalwidth of 4 feet. A water channel greater in width than 4 feet may be more suited for the flowmeter. The throat of the flume is adjustable from 1 inch to 8 inches.
To operate the cutthroat flume, place the flume in the channel with the 13-inch openingand the flanges facing upstream. The flume is set into the channel such that the floor of the flumeis level and as little water as possible teaks around or under the flume. The flume should beplaced in an area where there is no more than a 1% slope of water entering 4 to 6 feet upgradientof the flume. Clear rocks and debris from directly upstream of the flume. If a complete seal cannot be made around the flume, an estimate of the water bypassing the flume throat should bemade and added on to the final flow estimate. The estimated volume and estimated error barsshould be noted on the field sheet. Once the flume is properly set, a reading from the staff gauge(h, in feet) at the front of the flume is made. The staff gauge ranges from 0 to 0.75 feet. Tocalculate the flow in gpm for an 8-inch wide cutthroat flume under free discharge conditions,multiply 1900 by ha2; for a 4-inch throat, multiply 932 by ha2; for a 2-inch throat, multiply 458 byha2; and for a 1-inch throat, multiply 225 by ha2.
6.2 FLOW METER
The flow meter is suited for surface-water flows over 1000 gpm or where the cutthroatflume cannot be placed property. The velocity-probe flow meter consists of a battery-operatedmeter and a velocity probe wand which attaches to the meter via a flexible corkscrew cable.Additional equipment needed to measure stream flow are a measuring tape at least as wide as thestream being measured, a scale (preferably 3 feet in length) and Surface-Water Sampling -Physical Measurements forms (Figure 6.1) or field sheets (Figure 3.2).
AR00006I

The Mead Instruments Model HP-302 velocity probe works best to measure laminar flowsin stream channels deep enough to cover the probe propeller. The flow meter measures flowsdown to 0.1 feet per second (fps). Locate an area of the stream which Is uniform in depth andflow, and free of large rocks. The measuring process is as follows:
1. Remove any large rocks directly upstream which could distort flow.
2. Extend the measuring tape across the stream normal to the direction of flow andfasten to the opposite side. Then, begin at the edge of the stream by measuring thedepth of the water and record this number on the Physical Measurement form(Figure 6.1).
3. Lower the velocity probe into the water 0.6 of the total stream depth. Position theprobe so that the propeller housing is parallel to flow and the propeller movesfreely, facing upstream. Record the meter reading in fps on the PhysicalMeasurement form.
4. Repeat this procedure across the stream at equal intervals. For smaller streams,the measurement interval may be 6 inches versus feet or several feet for widerstreams. As indicated on the Surface-Water Sampling - Physical Measurementform (Figure 6.1), the distance from the shoreline, stream-cell width, stream depthand velocity should be recorded for each measurement point. To determine theflow of the stream, the individual flows are determined in cubic feet per second(cfs) for each cell, then all the cells are added to determine the total flow in cfs forthe stream.
AR000062

Figure 6.1
SURFACE-WATER SAMPLING - PHYSICAL MEASUREMENTS
Meiser & Earl, Inc.
PROJECT:___________________________________ DATE:______ TIME:.
LOCATION LOCATIONCOUNTY:___________________________________ MUNICIPALITY:
SPECIFIC SAMPLELOCATION: __________________________________ COLLECTOR:
SAMPLE NUMBER:______________________________
DESCRIPTION:______ POND ______ SPRING ______ STREAM _____ OTHER
FIELD TEMPERATURE:_____ D.O.:_____ CONDUCTIVITY:_____ pH:MEASUREMENTS:
FLOW:_________ CPS _________ GPM
DISTANCE
CELLWIDTH(FEET)
DEPTH(FEET)
AVERAGEDEPTH(FEET)
VELOCITY(FT/ SEC)
AVERAGEVELOCITY(FT/SEC)
TOTALVELOCITY(FT3 /SEC)
FLOW(GPM)
TOTAL:-1 6—
flR000063

6.3 CIRCULAR-ORIFICE WEIRS
Circular-orifice weirs are used to measure ground-water flows from a well during apumping test. Each orifice weir is sized to measure a range of discharges. M&E's orifice meterscan measure flows ranging from 10 to 800 gpm. M&E has the following orifice cap sizes whichcan measure flows ranging from 20 gallons per minute (gpm) to 800 gpm:
1-1/2" x 1"2" x 1-1/4"2-1/2" x 1-3/4"3"x2B4" x 3"6"x4M8" x 5"
The flows (gpm) corresponding to the head (inches) read on the piezometer for each orifice weirsize are presented on Tables 6.1, 6.2. 6.3, 6.4 and 6.5.
The rate at which the well is to be pumped must be known to choose the mostappropriately sized orifice weir. If the anticipated pumping rates cover a wide range, severalorifice weirs may be used during a pumping test. Keep in mind that the accuracy of any givenorifice weir diminishes as it approaches its sizing limit.
Specifics of setting up an orifice weir are discussed in Groundwater and Wells by FletcherG. Driscoil, 1986, pages 537-541. A summary of this information is presented below.
1. The orifice is a round hole with clean, square edges in the center of a circular steelplate. The plate must be 1/16-inch thick around the circumference of the holewhich is fastened vertically against the outer end of a level discharge pipe so thatthe orifice is centered on the pipe. The pipe on which the orifice plate is mountedmust be horizontal and the discharge must be unimpeded.
2. The water must flow through a minimum of 6 feet of straight and level dischargepipe prior to entering the orifice plate. No obstructions which could causeturbulence should exist within the pipe bore or around the orifice plate.
AR00006U

Table 6.1ORIFICE DISCHARGES1 %" x 1" Orifice Cap
Q * Discharge in gpmQ = KA V5* * 1.02 KAfi A - Orifice area, in2 * * (0.5)2 - 0.7854* . *. ,~ «« ,* -.*,« 17 h " Head in inchesC - in (0.623) (0.7W4VS .g-3924v£ R " Orifice dia. - JJL - 6.21
Pipe dit. (Sen. 40) 1.61K - 0.623
Headinches5
6
7
8
9
10
11
12
13
14
15
16
17
18
19
20
21
22
23
24
25
26
GPM
8.77
9.61
10.4
11.1
11.8
12.4
13.0
13.6
14.1
14.7
15.2
15.7
16.2
16.6
17.1
17.5
18.0
18.4
18.8
19.2
19.6
20.0
Headinches272829
30
31
32
33
34
35
36
37
38
39
40
41
42
43
44
45
46
47
48
GEM20.4
20.8
21.1
21.5
21.8
22.2
22.5
22.9
23.2
23.5
23.9
24.2
24.5
24.8
25.1
25.4
25.7
26.0
26.3
26.6
26.9
27.2
Headinches49
50
51
52
53
54
55
56
57
58
59
60
61
62
63
64
65
66
67
68
69
70
£EM27.5
27.7
28.0
28.3
28.6
28.8
29.1
29.4
29.6
29.9
30.1
30.4
30.6
30.9
31.1
31.4
31.6
31.9
32.1
32.4
32.6
32.8
BASM WATER INSTRUMENTS, INC -18-15MS.RobfcWay;Denver,CO 80226

Table 6.2ORIFICE DISCHARGES2" x 1 %" Orifice Cap
Q * Discharge in gpmKA fi+ - iMflJS A - Orifice area, in2-K (0.625)2-1.227»M /A*,*. «<** /r h ** Head in inches8.02 (0.612) 1.227V* v A. T «_« jT K - from Lay & Bowler curve
R " Orifice dia. - 1.25 - 0.605Pipe dit, (Sen. 40) 2.067
K - 0.612Headinches5
678
9
10
11
12
13
14
15
16
17
18
19
20
21
22
23
24
25
26
fiEM13.5
14,8
15.9
17.0
18.1
19.0
20.0
20.9
21.7
22.5
23.3
24.1
24.8
25.5
26.2
26.9
27.6
28.2
28.9
29.5
30.1
30.7
Headinches272829
3031
32
33
34
35
36
37
38
39
40
41
42
43
44
45
46
47
48
fiEM31.3
31.9
32.4
33.0
33.5
34.1
34.6
35.1
35.6
36.1
36.6
37.1
37.6
38.1
38.6
39.0
39.5
39.9
40.4
40.8
41.3
41.7
Headinches495051
52
53
54
55
56
57
58
59
60
61
62
63
64
65
66
67
68
69
70
GEM42.1
42.6
43.0
43.4
43.8
44.3
44.7
45.1
45.5
45.9
46.3
46.6
47.0
47.4
47.8
48.2
48.6
48.9
49.3
49.7
50.0
50.4
BASKI WATER INSTRUMENTS, INC -1 9~
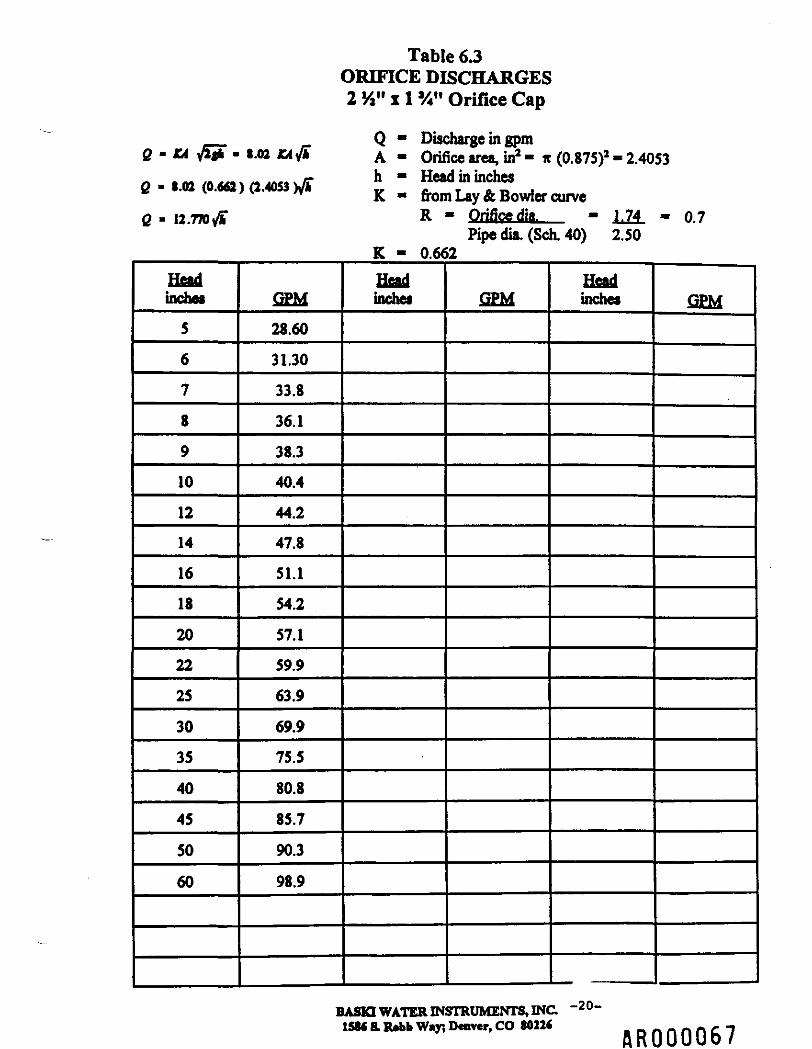
Table 6.3ORIFICE DISCHARGES2 %" x 1'//' Orifice Cap
Q " Discharge in gpm0 - d £7 - Ltt £l^ A- Orifice area, in2- it (0.875)2- 2.4053^ * ** M .»-« v* ,«» v yr h — Head in inchesQ - 1.02 (0.662) (2.4053 Mb _ - T . _ .^ n K - from Lay & Bowier curveC - n.TTOVS" R " Orifice dia. - 1.74 - 0.7
Pipe dia, (Sen. 40) 2.50K - 0.662
Headinches5
678
9
10
12
14
16
18
20
22
25
30
35
40
45
50
60
GPM
28.60
31.30
33.8
36.1
38.3
40.4
44.2
47.8
51.1
54.2
57.1
59.9
63.9
69.9
75.5
80.8
85.7
90.3
98.9
Headinches GPM
Headinches GEM
BASKI WATER INSTRUMENTS, INC ~2°-15M S. Rrtb W*r» Denver, CO 80226 AR000067
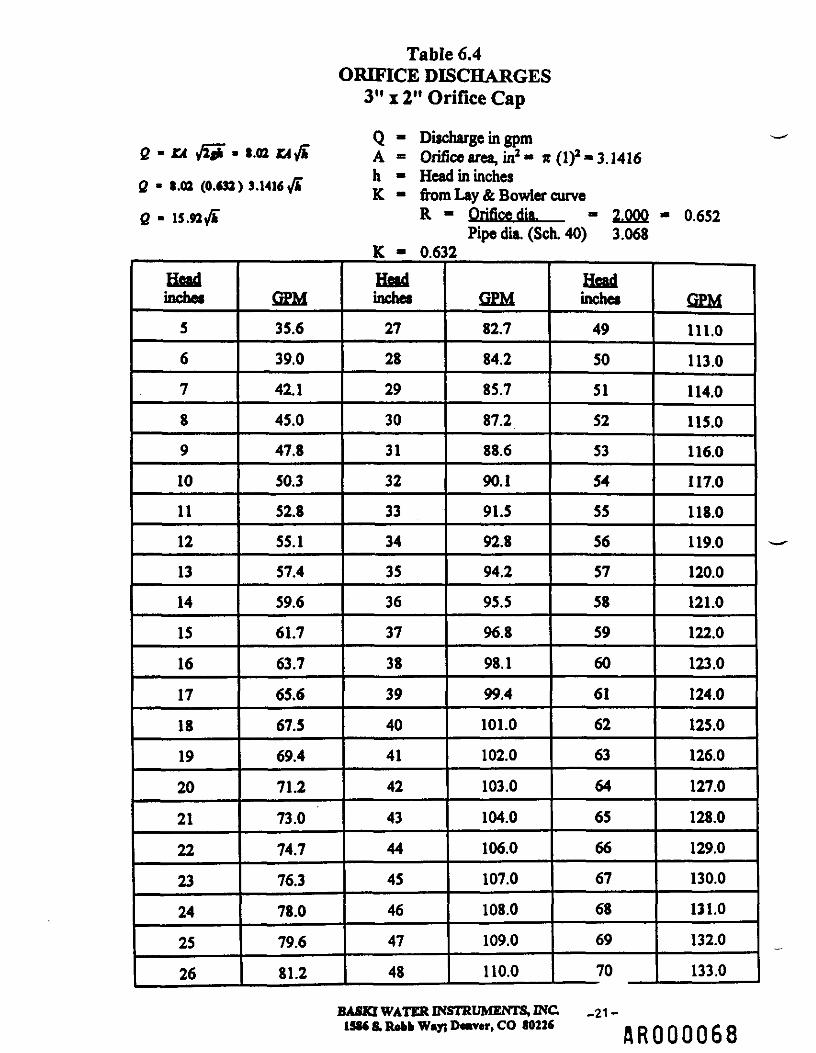
Table 6.4ORIFICE DISCHARGES
3" 12" Orifice Cap
Q - Discharge in gpmQ -£4 v5f* • I.02C4V* A» Orifice area, in2« ic (I)2-3.1416^ . A* /A *** v* , j,4 /r h " Head in inchesfi - 1.02 (0,632) 3.1416V* v «_ T o_« _iT K - from Lay & Bowler curvefi - 15.92$" R " Orifice dia, - 2.000 - 0.652
Pipe dia. (Sen. 40) 3.068K - 0.632
Headinches5
678
9
10
11
12
13
14
1516
17
18
19
20
21
22
23
24
25
26
GEM35.6
39.0
42.1
45.0
47.8
50.3
52.8
55.1
57.4
59.6
61.7
63.7
65.6
67.5
69.4
71.2
73.0
74.7
76.3
78.0
79.6
81.2
Headinches272829
30
31
32
33
34
35
36
37
38
39
40
41
42
43
44
45
46
47
48
GEM82.7
84.2
85.7
87.2
88.6
90.1
91.5
92.8
94.2
95.5
96.8
98.1
99.4
101.0
102.0
103.0
104.0
106.0
107.0
108.0
109.0
110.0
Headinches49
50
51
52
53
54
55
56
57
58
59
60
61
62
63
64
65
66
67
68
69
70
GPM
111.0
113.0
114.0
115.0
116.0
117.0
118.0
119.0
120.0
121.0
122.0
123.0
124.0
125.0
126.0
127.0
128.0
129.0
130.0
131.0
132.0
133.0
BASKI WATER INSTRUMENTS, INC«0226

Table 6.5
ORIFICE TABLESfor mtftiurrment of water thr*ugti pipe orifice* wiUi trrr discharge.
The following tablet have been complltd by th* Engineering Department of Layne and Bowler Division fromoriginal calibrations by Purdu* University.
HeadIn
•- — fc- —— >•TiTCfWfj
5.05.50.00.57.07.58.05.59.09.510.010.511.011.5124)12.513.013.9144)14.511015.516.016.5174)174164)
2"Grille*33435.4374)36.5404)41.441744.046446447J46.050.151.292453.454.455.5584S7.556-550.560.451382463.264.1
4' Pip*2%*CM do*56458.260463.361766.070472.474476.578460.462464.266.067.769591.292494.596.197.79941004102410341054
3'Orifle*6193.97.101.106.106.112.115.119.122.129.126.131.134.137.140.143.145.146.151.153.156.156.161.163.166.166.
3"Oriltc*76.60.63.66.90.93.96.99.102,105.107.110.113.115.116.120.122.12S.127.129.131.134.136.136.140.142.144.
••Pip*4'
Oriflc*146.153.160.166.172.178.164.190.196.201.206.211.216.221.226.230.236,239.244.246.252.256.261.265.269.273.276.
8'Grille*276.292.306.317.329.341.362.363,373.364.394.403.413.422.431.440.449,457.466.474.482.490.498.508.513.521.528.
4'Grille*136.141.148.154.160.165.171.176.181.166.191.195.200.206.209.213.217,222.228.230.234.237.241.245.249.252.258.
8- Pip*5'
OrtHe*222.233.243.253.263.272,281.269.298.306.314.322.329.337.344.351.368.365.371.378.384.391.397.403.408.415.421.
6'Orifle*364.371.368.403.419.433.448.461.478.488.900.513.525,537.548.560.571.501.592.603.613.623.833.643.663,662.671.
•'Oriflc*315.330.348.359.372.365.398.410.422.,434.446.456.487.477.487.497.507.517.528.536.546.554.563.571.580.588.507.
10- Mp*•rt'Orifle*361.400.417.436.451.467.482.407.511.525.538.552.566.578.590.603.614.626.638.649.660.871.662.692.703.711723.
7"Oriltet459.481.502.S23.543.562.580.506.616.632.648.664.860.695.710.725.738.753.767.781.7M.607.820.833.848.658.670.
7**Orifle*
553.560.608.630.654.877.698.721.742.782.782.801820.639.857.874.892.909.925.942.958.974.988.1004.1020.1034.1048.
••Oriflc*674.707.736.768.797.625.852.•TOOf*.904,929.953.976.999.1022.1044.1066.1086.1107.1127.1147.1167.1186.1206.1224.1242.1261.1278.
12' Pip*«•
Oriflc*TO*'•O.ft ftB39.872.WMWQ.942.975.1007.mifl1VMQ.inMl QB.ino«imra.1126.11541181.1208.1934I44#9t
1 1«Q\£&§.1284.tin*I*XM.1332.1356.117O141V.
1402.1424.1446.1468.1490.1511.
10'Grille*1113.i i*a1 1OQ.1220.fMQ1 AV.1317.11A4li)Q4.1408.1452.1494.KW1MO.1575.1613.1661.18691725.17601795.1A4A104V.1663.1896.*MAivZB.19801992!2023.2063.2083.2112.
184194)19.520.020.521.0214224)224234)234244)244294)294284)284274)274284)a, 5294)294304)30.5314)31432.032.5334)tl 444.0
34.034.5364)35.5364)
65.065466.767466.469470.070471472.4734744)74.7764764774)77.778479.279.980461482.082,783.484164465.466.188487.488.168.7894900904
108.71084109.61114)112.41117115.1116.4117.71184)120412141224124.1129412641274129.0130.11314132413161344139.9137.11384139.31404141.5142.6143.6144714541464147.9146.9
170.172.175.177.179.181.181186.166.190.192.194.198.198.200.202.204.208.207.208.211.211215.217.219.220.222.224.226.227.229.231.232,234.236237.
146.148.190.152.154.169.157.199.181.163.164.188.168.170.171.171175.178.178.179;161.181184.186.187.189.190.192.193.199.196.198.199201.202204.
280.284.268.291.299.298.302.308.308.311316.319.322.328.329.332.339.338.342.349.348.391.354.397.360.361366.369.371.374.377.380.361366.388.391.
536.543.550.997.564.970.577.564.590.997.603.610.616.622.629.639.841.847.691689.669.670.678.682.687.691699.704.710.719.720.726.731.736.742.747.
259.263.286.270.271278.280.283.266.289.292.299.298.302.309.307.310.311316.319.322.329.326.330.331336.338.341.344.346.349.392.364.357.359.362.
427.431436.444.449.469.460.468.471.478.461.488.491.496.501.508.511.516.521.928.530.539.539.544.546.561557.562.566.570.575.579.S61567.591.596.
681.690.899.708.717.729.734.742.751.799.787.779.783.791.799.807.815.822,630.837.845.862,WO.867.874.881.668.896.902.908.916.921930.938.943.980.
609.611621.828.637.646.692.660.667.676.662.688.696.701710.717.724.731.736.744.751.798.764.771:777.781790.796.602.608.814.620.626.832,636.844.
731743.751781772.781.790.799.608.817.626.639.844.882,661.888.677.888.894.902.910.918.926.831941.949,957.964.971978.986.994.1001.1008.1015.1023.
882.894.908.917.926.94ft951.982.973.981994.1005.10111029.10311048.1068.10811075.1089.1094.1104.1114.112111311142.1151.1160.1169.11711167.11911204.12111222.1230.
1064.10711092.11011120.11311147.1160.1173.11811199.1211.1224.12311249.1281.12711289.1207.13011320.1332.13411394.1366.1377.1388.13911410.1421.1431.1442.1452.14611473.1464.
1296.13111331.13411364.1381.1307.14111420.14411461.14711401.1507.1522.19311551.1566.1560.1994.1600.18211637.1690.1684.16711601.1708.17111731.1744.1767.1770.1783.1795.1801
1532.1562.1572.1592.1612.1632.1651.1670.1669.1708.1726.1744.17611760.1798.1816.1633.1890.1667.1664.1901.19111934.1950.1967.19611999.2014.2030.2046.2081.2076.2092.2107.2122.2137.
2142.2170.2199.2227.2254.2282,2309.2336.2362.2386.2414.2439.2465.2490.2514.253125612567.2611.2639.26512661.2704.2727.2750.2772.2795.2617.2839.2660.2662.29012925.29412987.2968.
AR000069

Table 6.5(Continued)
H**dm|—— M fc. , ,•nGnBjBj
364374374384)38431039.540.040.541441.5424)42441043444.0444494)454484464474474410415494)49.550.0504514151.5524)52.5
2'OfttlM
.91.291492491191794494.995496.198.797.397491491099.61004100.71014101.9102,410101018104.1104.61084109.71012108410741074108.41019108.4
4" Pip*2**'Ortfte*149.91914)152.01910154.01910156.01574)157.91664159.918041614162,7163.7164416641818167.416131894170.1171.01714*1724171717441719176.4177417111794)1794
VOrifto*239.241.242.244.245.247.249.250.252.291255.291251299.261.282.284.261267.261270.271.273.274.276.277.271280.261.281264.286.287.
3'OrlHe*206.201208.209.210.212.213.219.216.217.219.220.221.222.224.229.228.221229.231231.231234.236.231237.239.240.241.242.241246.248.
6* Pip*4'
Oriflc*394.391399.402,404.407.409.412.411417.420.422,421427.431432,431437.431442,444.447.448.461.464.461451481.461488.461470.472.
§•Ortfto*751797.762.787.772.777.781787.791797.602.807.812.611821.821631839.640.644.649.881891862,667.671.876.860.888.889.893.899.902.
4'Orlflo*364.367.369.371374.377.379.361.364.388.361391.393.389.301400.402.401407.401411.411411411420.422.424.429.429.431.431431437.
1'Plp*5'
Ortfto*600.604.601612,616.620.624.628.632.631631641647.661.661691681681670.671677.681.664.688.601.698.691702.709,701712.711719.
8"Oriflc*958.983.980.971962.981995.1001.1007.10111020.1028.1032.10311044.1090.1096.1062.1068.10711079.1089.1001.1068.1102.1108.11111119.1125.1130.11311141.1147.
••Orlfte*690.898.661.887.871879.884.880.899.901.908.912.917.922.928.931938.944.940,984.998.994.970.978.960.989.990.989.1000.1008.1010.1014.1019.
10- Pip*8WOrifle*1030.1037.1044.1091.1067.1084.1071.10711089,1091.10911104.1111.11111124.1130.1137.11411150.11511162.1188.1179.1181.1187.11911199.1208.1211.1217.12211229.1239.
7'Orifice1239.1247.12511284.1272.1281.1260.1297.1306.13111321.13211337.1349.13511360.13611378.13811391.139114011413.1421.1428.1436.144114811457.1464.1472.14711461
7WOrifle*1494.1904.1514.1524.1534.1544.15941564.1574.158115011003.16111622.1631.1640.1650.1698.16611677.16611689.1704.17111722.1731.1740.1749.1757.1768.1779.17811792.
••Orlfle*1A4A'Ocw.18311645.1857.1870.1M9iQQift.1694.1906.10 m•vio.102119411991196419711987.1990.2010.2021.20312044.2099.2068.2077.208120912109,2120.2131.2141.2192,2162.J1712163.
12' Pip*8*
Orifle*2151.91JMclOQ.2181.914M«im.Mna£cUM.2224.'yy Mu<M.2252.4OflAZZH.2260.2294.2308.2321.yyflft23402362!2375.2390.2402.2419.2428.2441.24542467.24802490.25052511253129412565.2968.2580.
10*Oriflc*3006.tfMBMil*.3049.VMMJ W.VKMJUWU.3110.*n ia3129.itAti9149,11 *aJI W,31613206.3227.324632613264.3303.3322.3340.33593377.3395.3414.3432.3490.3486.34813503.3521.3538.3956.3573.3591.3606.
51053454.0544594)99456.098457.097458096459.059460.060461.061462.062463.063464.064465.066466068467.0674JU ADO.U66469.069470.0
1094110.5111.0111411101124113.011341144)1144115.01164116.01184117.01174117.911141116119.4119.912041204121412141224122.71211123.6124.1124.5125.0125.41294126.3
180.71814182.41834184.01844169.71664187.41812180018941904181.419241934)1934194419541984197.0197419841CA *IW.42001200.9201.6202.420112019204620914208.12010207.6
288.269.291.292.291289.291207.209.300.301.309.304.301301304.300.310.311311314.319.31731ft310.320.321321324.329.326.327.329.330.331.
247.248.249.290.252.291294.299.256.297.291299,291.292.261264.268.288.267.288.299.270.271.272.273.271tintla.277.271279.260.281.262.261264.
474.471471481.461469.491480.492.404.491498.500.903.509.907.501911.511911517.611521.921529.927.529531.531939.537.539.541.641541
908.910.019.019.021927.932.931940.944.941962.991980.964.861972.978,960.984.961992,9911000.1004.1007.1011.10111019.10211026.1030.1034.10311041.
431441.443.449.447.441451.491455.457.459.481.461489.487.468.471.471475.477.479.481.481484.486.481490.491494.491497.491501.501505.
723.728.729.731731740.741748.740.791751799.762.761789.772.775.771762,789.781791.794.797.600.601806.810,811611819.622.625.828.831.
1152.1191116111611174.1179.1184.1190.11911200.1209.1210.12111221.1226.1231.1236.1241.12411291.1256.1281.1266.1271.12711281.12811291.1295.1300.1305.1310.1315.1310.1324.
1024.10211034.10311041104110511097.1082.1087.1071.10711081.1069.1090.1094.1090.1101110111111117.1121.1129.1130.1134.1139.1143.1147.1192.11911160.1184.1169.1173.1177.
1241.1247.1292.1298.1264.1270.127S.1281.1287.1282,-1298.1304.1309.13111320.13211331.1337.1342.1347.1393.1398.13911389.1374.1379.1365.1390,1399.1400.1406.1411.1418.1421.1421
14911500.1507.1514.1521.1928.1535.1541.154119911562.19811579.1982.15611999.1602.1008.16111621.16211634.1641.1647.16911880.1666.1672.1679.16611691.1697.1703.1710.1711
1600.1809.1617.1628.1634.1842.19511869.1667.1879.18811891.1899.1907.191119211931.1930.1947.19911983.1971.10711988.1904.2001.2000.2017.2024.2032.2039.2047.2054.2082,2060.
2194.2204.2214.2224.2235.22412255.2299.375.2299.22912309.2315.2324.2334.2344.2351239123712382.2392.2401.2411.2420.2429.2439.2448.2497.2466.24712485.2494.2503.2912.2521.
2592.26012617.2629.2641.26512685.2677.2666.2700.2712.2724.2735.2747.27512770.2781.27912604.28112826.26312640.2860.2671.2682.2893.2904.2915.2928.2936.2947.2958.2969.2979.
3625.3642.3659.367136913700.3728.37413759.37713792.3608.362S.3841.3857.39713869.3905.3921.3938.3952.39813961tAAM.4014.4030.4045.4080.4078.4091.4108.4121.4136.4151.4166.
AR000070

3. Combinations of pipe and orifice diameters must be assembled so that theanticipated head will be at least three times the diameter of the orifice.
4. A piezometer tube, 4 to 5 feet long, is installed on the discharge pipe to measurethe water head or pressure in the pipe. The piezometer tube is attached in a 1/8-inch or 1/4-inch diameter hole located exactly 24 inches before the orifice plate.The water level in the piezometer tube indicates the pressure head in the approachpipe when water is being pumped through the orifice. The piezometer tube mustbe free of air bubbles and not protrude beyond the inside surface of the pipe.
5. The rate of flow through the orifice varies with the pressure head for any givensize of orifice discharge pipe. The flow through the orifice is calculated from theequation: Q = AVC
where: Q - the flow per unit of timeA »the area of the orificeV - the velocity of flow through the orificeC = is the coefficient of discharge for the orifice.
Table 6.5 gives the flow (in gpm) based on the measured head in the piezometer for variouscombinations of orifice and pipe diameters (taken from: Layne. 1958. "Measurement of WaterFlow through Pipe Orifice with Free Discharge." Bulletin 501).
24AR00007I

7.0 SOIL-GAS SURVEYS
A soil-gas survey is a cursory method used to determine the concentration of VOCsemanating from the soil. Soil-gas surveys are best conducted in soils or overburden materialthrough which a steel rod can penetrate to a depth of about 2 feet and where the contaminants areVOCs. An HNU PI 101 photoionization detector (PFD) is used as the organic vapor analyzer(OVA). The design of a soil-gas survey will vary dependent upon site-specific conditions. Theslam bar/OVA technique which is used to conduct the survey is described below:
1. Lay out a sampling grid across the area of concern. Sketch this grid on the back of theM&E Soil-Gas Survey Summary form (Figure 7.1) or the M&E field sheet. At each surveylocation, remove any grass, debris, cement, macadam or other cover material.
2. Using a sledge hammer or equivalent, "slam" the 0.7-inch diameter steel rod into thesubsurface to a depth of about 2 feet or to maximum penetration. Record the penetration depth inthe field notes.
3. Then, withdraw the "slam bar" and immediately insert the extension probe of the HNUPID into the hole. The HNU Pro is used to quantify VOCs in parts per million (ppm). Whereapplicable, each slam bar hole is also screened using an explosimeter/oxygen meter (LEL/O2meter) to evaluate the oxygen content and lower explosive limit (LEL) of the soil gas.
4. The HNU and LEL/O2 meter probes must be decontaminated in an Alconox/potablewater wash and distilled water rinse, then completely dried prior to use. Between samplinglocations, the outside of both the HNU and LEL/O2 probes must be wiped clean and, if necessary,a new pipe cleaner is used to remove soil from the inside of the probe tips. Keep in mind that theHNU will not function properly if exposed to moisture; a negative reading may result. Be carefulnot to block the HNU and LEL/O2 probe tips with soil since this will limit its function.
5. Record the HNU and LEL/O2 meter readings on the M&E Soil-Gas Survey Summaryform (Figure 7.1) or the M&E field sheet. Make note of any nearby activities or VOC sources,such as automobile or truck traffic or spilled gasoline, which might influence the meter readings.If VOC contamination is detected at a sampling location, additional soil-gas samples will be takento aid in defining the lateral extent of contamination.
AR000072

Figure 7.1SOIL-GAS SURVEY SUMMARY
Meiser & Earl, Inc.
PROJECT: __________________________________________ DATE.LOCATION: ___________________________________________ XTM^
SLAM BARSURVEY LENGTH:CONDUCTORi
LOCATIONNUMBER
SLAM BARSTICK UPfAGSY FEET
SLAM BARDEPTH (BOS),
FEET
HNuREADINGfPPM)
SOILDESCRIPTION
-26-
AR000073

8.0 AQUIFER TESTING
Aquifer testing includes slug tests, bail tests, constant-rate pumping tests and step-drawdown tests as a means to determine aquifer characteristics such as specific capacity,transmissivity, hydraulic conductivity and storage values.
8.1 SLUG TESTS
A slug test is performed by adding a known volume of water or a solid cylinder to a welland observing the time that it takes for the water level to recover to its original level. Any wateradded to the well should be distilled/deionized water, i.e. clean water. This single-well test islimited in scope to the area directly adjacent to the well screen. The vertical testing area of theslug test is limited to the geologic formation adjacent to the well screen.
When conducting a slug test, the following items should be recorded on the M&EHvorslev Slug/Bail Testing Field Data Sheet (Figure 8.1) or the M&E field sheet:
1. The static water-level measurement;
2. The volume of the slug added and the time of the addition;
3. The changing water-level measurement (+/-0.01 inch) during the test; and
4. The time elapsed between water-level measurements.
The geologic well log and well-construction details are important for use in interpretingthe slug-test data. M&E uses In-Situ Data Loggers with pressure transducers to measure thewater levels during a slug test. This enables accurate and periodic measurements.
It is important that the screen and sand pack of the well be well developed to remove finesso that the test results are as representative as possible.
AR00007U
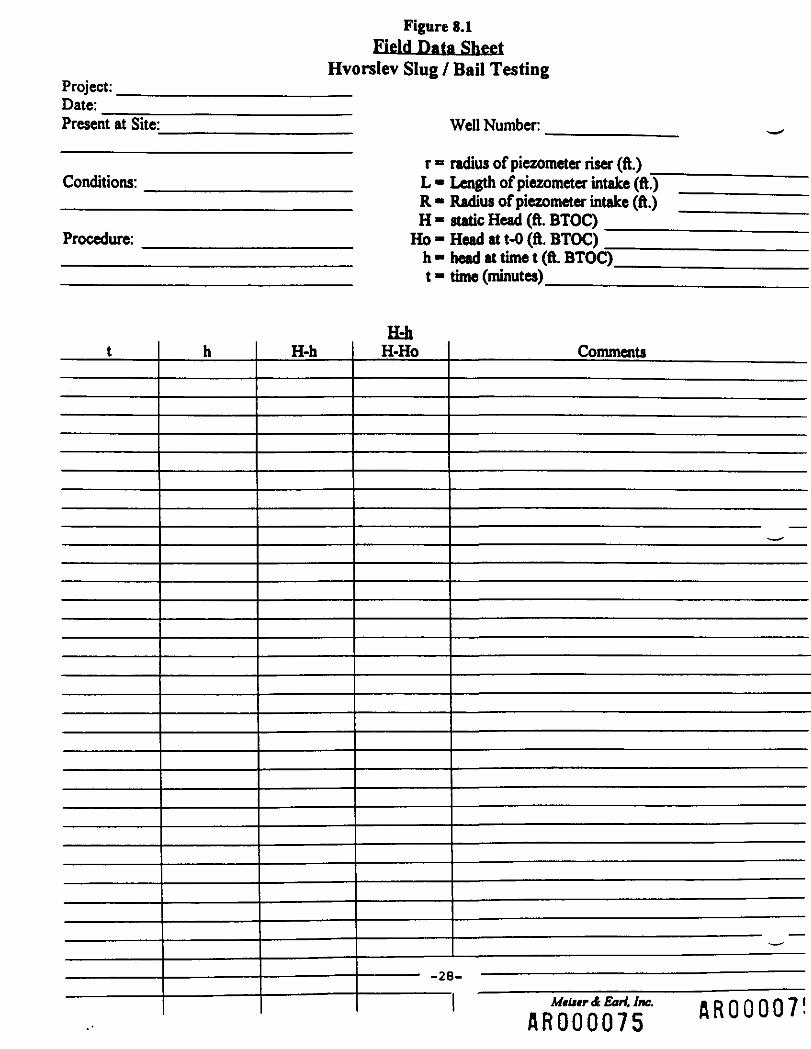
Figure 8.1Field Data Sheet
Hvorslev Slug / Bail TestingProject:Date:Present at Site:
Conditions:
Procedure:
t h H-h
r»L«R«H-Ho-h-t-
HfchH-Ho
—————— -26
Well Number: _
radius of piezometer riser (ft.)Length of piezometer intake (ft.)Radius or piezometer intake (ft.)static Head (ft. BTOC)Head at t-0 (ft. BTOC)head at time t (ft. BTOC)time (minutes)
Comments
—
—
i- —————————————————— • ——————
.JSrfiSi" flRQQOQ?!AR000075

8.2 BAIL TESTS
A bail test is essentially the same as a slug test but in reverse in that a known volume ofwater is removed or bailed from the well then the water level is observed until it returns to its pre-test static. The device used to withdraw or bail the water, such as a bailer, should bedecontaminated prior to its use. As with the slug test, the area tested is essentially limited to thatportion of the geologic formation exposed to the welt screen.
In addition to the information provided by the geologic well log and well constructiondetails, the following measurements should be recorded on the M&£ Hvorslev Slug/Bail TestingField Data Sheet (Figure 8.1) or the M&E field sheet:
1. The static water-level measurement prior to the start of the test;
2. The volume of water removed and the time of removal;
3. The changing water-level measurement (+/- 0.01 inch) during the test; and
4. The time elapsed between water-level measurements.
8.3 PUMPING TESTS
Pumping tests are conducted to determine: 1) the performance characteristics of a welland 2) the hydraulic parameters of the aquifer. The specific capacity of a well can be calculatedfrom the yield and drawdown measurements. This information can then be used to measure theproductive capacity of the well and to choose the pump size. Pumping tests involve removing orpumping water from a well and recording the water-level measurements, i.e. drawdown, over timein the pumping well and observation wells. The observation wells should be located so that theyproduce sufficient drawdown to provide usable data.
There are two types of pumping tests: 1) a step-drawdown test which involves pumpingthe well at successively greater pumping rates for relatively short time periods and 2) a constant-rate pumping test where the well is pumped at one rate for a significant length of time. A step-drawdown test usually precedes the pumping test as a means of determining an appropriatedischarge rate. Aquifer tests can evaluate a single zone of an aquifer if the pumping andobservation wells are all screened in or open to the same water-bearing zone of the aquifer, orwells screened in different zones can be evaluated during a pumping test. Because multiple wellsare involved in pumping tests, an average of the hydraulic conductivity of the aquifer can bedetermined. Aquifer boundaries, lithology and thickness are important when interpreting thepumping-test data. Also, changes in barometric pressure, stream levels and tidal oscillations canaffect drawdown data.
It is important that the discharge from the pump be piped far enough away from the wellto avoid recirculation. This is especially important for long-term pumping tests.
29flR000076

For a step-drawdown test, the time the well is pumped at each pumping rate is usually 30to 60 minutes depending on the well's response to pumping. It is important that the pumping ratebe held constant during each step of the test. Following each step, the well is allowed to recoverto approximately 90% of its original static level; the recovery period is typically no longer than thetime of pumping. During the pumping test, water-level measurements should be plotted versustime on logarithmic graph paper to track the progress of the test. The following informationshould be recorded on the M&E Pumping Test Data form (Figure 8.2) when conducting apumping test:
1. The static water levels of the well to be pumped and the observation wells;
2. The pump model used and the depth at which the pump is set;
3. The time and pumping rate at the start of the test and at each step;
4. Periodic water-level measurements and associated times throughout the test; and
5. Recovery water-level measurements and associated times once the pump is shutoff.
From the step-drawdown test graphed data, an optimum pumping rate can be chosenwhich can be sustained for a constant-rate test.
30AR000077

Figure 8 .2PUMPING TEST DATA Paffc .
^ ———Well* Date:
Project____________________ Location:
Conducted by:________________ Length of Test.
—— Well Data ————
Well Depth:Ctiina DiameterBorehole Diameter
Time(min.)
ElapsedTime(min.)
Static WtferLewl:Time:Meuurinfl Point:Depth toWater(manual)
(ft.)
Depth toWater(XD)(ft.)
Hermft/XD Data 1Remit Hi/Selection:XDtttm:XD Depth SettiiReference Level
Drawdown(ft.)
-31-
10/Valtie:
DischargeMeasurement
sec/aal
Pump Depth £PumpSize/Ty]HowQmeouifj™*"** Infill
PumpingRate(GPM)
«ttin£ue:nod:Well:
Comments
flRUUUU/8
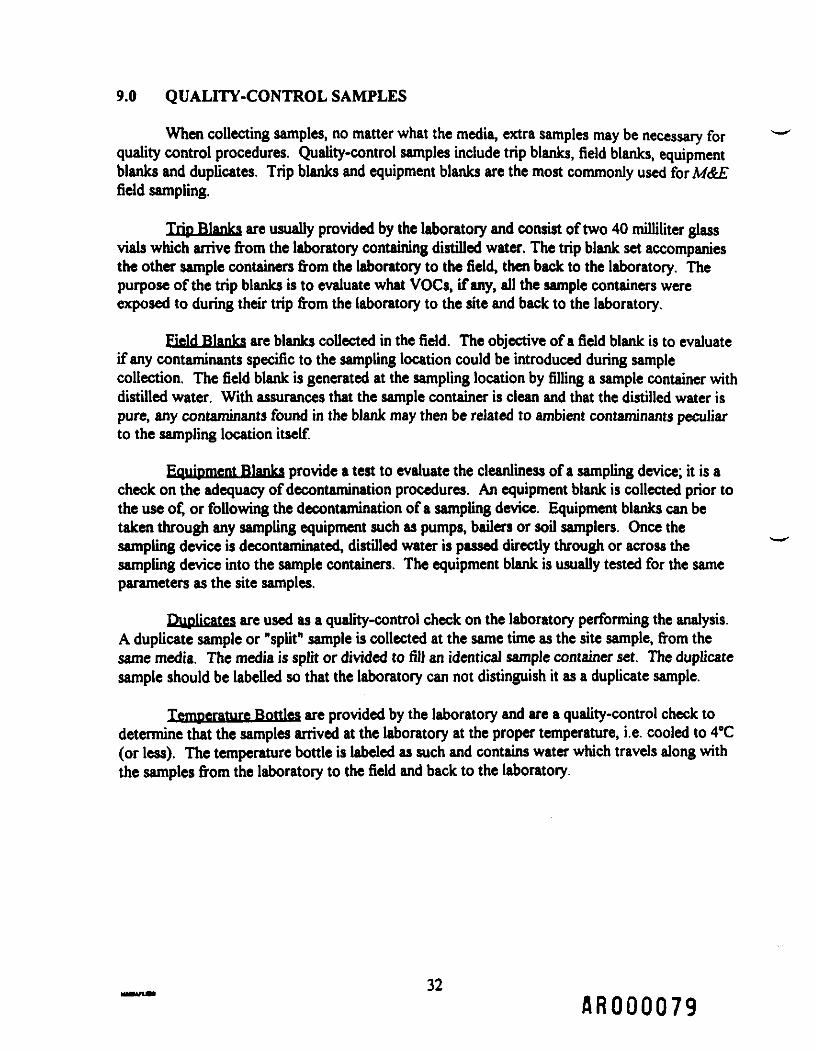
9.0 QUALITY-CONTROL SAMPLES
When collecting samples, no matter what the media, extra samples may be necessary forquality control procedures. Quality-control samples include trip blanks, field blanks, equipmentblanks and duplicates. Trip blanks and equipment blanks are the most commonly used for M&Efield sampling.
Trip Blanks are usually provided by the laboratory and consist of two 40 milliliter glassvials which arrive from the laboratory containing distilled water. The trip blank set accompaniesthe other sample containers from the laboratory to the field, then back to the laboratory. Thepurpose of the trip blanks is to evaluate what VOCs, if any, all the sample containers wereexposed to during their trip from the laboratory to the site and back to the laboratory.
Field Blanks are blanks collected in the field. The objective of a field blank is to evaluateif any contaminants specific to the sampling location could be introduced during samplecollection. The field blank is generated at the sampling location by filling a sample container withdistilled water. With assurances that the sample container is clean and that the distilled water ispure, any contaminants found in the blank may then be related to ambient contaminants peculiarto the sampling location itself.
Equipment Blanks provide a test to evaluate the cleanliness of a sampling device; it is acheck on the adequacy of decontamination procedures. An equipment blank is collected prior tothe use of, or following the decontamination of a sampling device. Equipment blanks can betaken through any sampling equipment such as pumps, bailers or soil samplers. Once thesampling device is decontaminated, distilled water is passed directly through or across thesampling device into the sample containers. The equipment blank is usually tested for the sameparameters as the site samples.
Duplicates are used as a quality-control check on the laboratory performing the analysis.A duplicate sample or "split" sample is collected at the same time as the site sample, from thesame media. The media is split or divided to fill an identical sample container set. The duplicatesample should be labelled so that the laboratory can not distinguish it as a duplicate sample.
Temperature Bottles are provided by the laboratory and are a quality-control check todetermine that the samples arrived at the laboratory at the proper temperature, i.e. cooled to 4°C(or less). The temperature bottle is labeled as such and contains water which travels along withthe samples from the laboratory to the field and back to the laboratory.
AR000079

10.0 SAMPLE PRESERVATION AND HANDLING
Collected samples must be handled carefully to ensure that the sample integrity ismaintained. Temperature changes, prolonged exposure to sunlight, excess holding times andimproper stabilizing agents are some of the factors which could alter the chemical parameters ofthe sample. Samples should be refrigerated immediately after collection. Labelling andappropriate, pre-measured concentrations of chemical preservative in each sample container aregenerally provided by the laboratory which supplies the bottles. Samples should be refrigeratedimmediately after collection. Note that samples collected in EnCore samplers for volatile organicanalysis should be received by the laboratory and preserved, according to Method 503 5, within36 hours of sample collection.
AR000080

11.0 SAMPLE RECORD KEEPING AND DOCUMENTATION
Sample record keeping includes field reports, chain-of-custody forms and any othersite-specific or task-specific documentation. Chain-of-custody forms accompany the samples inthe shipping container to the laboratory. Further information concerning sample shipping ispresented in Section 11,0. A discussion of some of these key documents is presented below.
Field Sheets - The M&E field sheets (Figure 3.2) are carbonless paper forms used torecord notes of field activities. Care is taken to ensure that good, legible and complete notes aretaken concerning field measurements and observations.
Chain-of-Custody Forms - A chain-of-custody form is the means by which the possessionand handling of a sample can be traced from the source to the laboratory (see Figure 11.1).Chain-of-custody procedures and a supporting documentation system serve to authenticate asample and demonstrate that tampering has not occurred. A sample is defined as under custody if:
a. It is in your actual possession.
b. It is in your view, after being in your physical possession.
c. It was in your physical possession and then you locked it up to prevent tampering.
d. It is in a designated and identified secure area.
Each sample container should be described on the chain-of-custody form. Note whetherthe sample is a grab sample or a composite sample. In the case of composite samples collectedwith an EnCore sampler for volatile analysis, note on the chain-of-custody form which samplesare to be composited. When transferring the possession of samples (to the shipper, laboratory,etc.) the individuals relinquishing and receiving the samples will sign, date and note the time onthe Chain-of-Custody form (Figure 11.1). The signed original chain-of-custody form will beplaced in a sealed plastic bag within the sample shipping container to accompany the samples. Asigned copy of the chain-of-custody form will be kept by M&E. If necessary, each shippingcontainer will be custody-sealed for shipment to the laboratory.
AR00008I

Of&
ijia
-35- AR000082

12.0 LABELING, PACKAGING AND SHIPPING OF SAMPLES
Sample Container Labeling - The sample containers should be labeled prior to samplecollection, since wet labels are difficult to write on. Using waterproof ink, identify each containerwith the sampling location (such as the site name and the well or stream location identificationnumber), date, time of sample collection, collector's initials and whether the sample is a grab orcomposite sample.
If needed, each label can be taped onto the container using clear packaging tape to assurethe label's placement and to minimize any damage of the label during sample collection ortransport. This is helpful to assure that the label stays intact and legible if the container becomeswet.
Sample Packaging and Shipping - Sample containers should be packaged in an ice cooleror other sturdy, insulated shipping container. Sample containers should be packed with enoughice to cool the containers to 0 to 4°C until they reach the laboratory. Ice packs or loose icepacked in sealed plastic bags can be used. Care should be taken to prevent water from melted icefrom leaking out into the container thus possibly damaging the sample-container labels. Otherpackaging material such as newspaper, styrofoam nuggets, etc. can be used to minimize themovement of the sample containers.
Include in the shipping container a completed Chain-of-Custody form. The laboratoryusually provides the Chain-of-Custody form. Section 10.0 describes these forms in more detail.Because the Chain-of-Custody form cannot be completed until the shipping container istransferred in person to the shipper or to the laboratory, the cooler cannot be closed and secureduntil the form is completed and included in the container. Place any paper work into a sealedplastic bag before placement in the cooler.
Remove any old, irrelevant labels from the outside of the shipping container. Close andsecure the cooler or shipping container, including the outside drain, with packing tape. Attach theshipping label to the top of the container.
In most cases, the samples will be shipped for overnight delivery to the laboratory. Theimmediacy of the shipping will be dictated by the sample holding times and cooling effectivenessof the ice included in the shipping container. It is however, preferred and common that samplesare shipped for overnight delivery. EnCore samplers collected for volatile analysis must bereceived by the laboratory and preserved within 36 hours of sample collection.
36
AR000083

13.0 DECONTAMINATION PROCEDURES
Ail sampling equipment should be laboratory cleaned or decontaminated, and if possible,dedicated to each sampling point. As an alternative, disposable sampling equipment can be used.For reusable or non-dedicated sampling equipment, the following decontamination procedureswill be followed prior to sampling and between sampling locations.
1. Wash and/or purge equipment with a laboratory grade detergent (i.e., Alconox)and potable water mixture;
2. Rinse with potable water three times;
3. Rinse with distilled water two times;
4. If the sample is to be analyzed for metals, equipment can be rinsed with 10% nitricacid rinse (reagent grade nitric acid diluted with distilled water).
5. Double rinse with distilled water only if sample is to be analyzed for metals.
Field instrumentation such as pH meters, specific conductance meters, dissolved oxygenmeters, and temperature probes or thermometers will be decontaminated prior to use and betweenmeasurements by rinsing with distilled water.
13.1 DECONTAMINATION OF SUBMERSIBLE PUMPS
Submersible pumps should be decontaminated prior to use and between samplinglocations, unless they are dedicated to a specific well. Submersible pump decontaminationprocedures consist of:
1. Wash internal and external portion of pump and hoses with a laboratory gradedetergent (i.e., Alconox) and potable water mixture followed by a potable waterrinse;
2. Thoroughly flush the internal portion of the pump and hoses with potable water;
3. Rinse the internal and external portions of the pump with distilled water;
4. Place the decontaminated pump and hose onto clean polyethylene sheeting or otherclean surface during transport or storage until use.
13.2 DISPOSABLE/DEDICATED EQUIPMENT
If possible, disposable or dedicated equipment should be used for sampling to avoid thepossibility of cross contamination between sampling locations. Dedicated pumps are especiallyconvenient and can be cost effective considering the time savings of not decontaminating.Dedicated or disposable bailers and/or bailer rope should be used when possible to avoid cross
37
AR00008U
contamination between wells. In addition, polyethylene sheeting or similar material could beplaced around each well to avoid contamination of rope and equipment. Decontaminatedequipment should be handled using disposable, vinyl or latex surgical gloves.
38ftROOOOSS

14.0 CALIBRATION PROCEDURES AND PREVENTATIVE MAINTENANCE
Prior to use, all relevant equipment will be examined to determine that it is in operatingcondition. This includes checking the manufacturer's operating manuals to ensure that allmaintenance items are being observed. Field notes from previous sampling trips and equipmentsign-out sheets should be reviewed so that any prior equipment problem notations are notoverlooked and also to ensure that all necessary repairs to equipment have been carried out.
14.1 CALIBRATION OF FIELD METERS
Field meters to be used during sampling, namely the pH, specific conductance and dissolvedoxygen meters, must be calibrated to ensure acceptable accuracy and precision. M&E'sequipment manager or other trained individual will perform this activity.
pH Meter - The pH meter must be calibrated at least once each day using two different pHbuffer solutions. The pH meter calibration procedures are given on Table 14.1. Rinse the probethoroughly between buffer measurements with distilled water and again after calibration iscompleted. If unacceptable deviations occur, consult the operating manual for the appropriateaction. Record the number of the pH unit used and the calibration readings on the M&E fieldsheet.
Specific Conductance Meter - The M&E YSI conductivity meters should be calibrated atleast monthly against a known KC1 solution. Calibration instructions are given on Table 14.2.Note that specific conductance is temperature-dependent and therefore the meter readings mustbe adjusted to reflect the temperature of the standard solution. Compensation procedures for theYSI conductivity meters are presented on Table 14.3. Each conductivity meter is numbered andcalibrated to a corresponding numbered probe. Be sure to use only meters and probes having thesame number.
The specific conductance meter will be red-lined daily or between sampling locations. Therange of the specific conductance meter is 0 to 50,000 mhos/cm over three scales. Note on theM&E field sheet the number of the meter used and the time and date of calibration and red-lining.
AR000086

Table 14.1pH Meter Calibration Procedures
For Beckman 110,11,12,20 and 21 Meters
1. Buffer solutions of pH 4.0 and 7.0 should be prepared.
2. Connect the pH and automatic temperature compensation (ATC) electrodes to the meter.
3. Turn the meter on and clear the instrument by pressing the key marked V. The displaywill read "clr".
4. Rinse the electrodes with distilled water and blot dry with a clean tissue.
5. Immerse the electrodes into the first standard (STD 1), press the "pH" key then the "std"key.
6. After the eye symbol stops flashing, the display will read the pH of STD 1.
7. Remove the electrodes from STD 1 and rinse them with distilled water.
8. Immerse the electrodes into the second standard (STD 2) then press the key marked "std"
9. Once the eye symbol stops flashing, the display will read the pH of STD 2.
10. Rinse the electrodes with distilled water before immersing them into a sample.
11. Press the "pH" key then wait for the eye symbol to stop flashing. Once the eye symbolceases flashing, the display will read the pH of the sample.
-40-
AR000087

Table 14.2Conductivity Meter Calibration Procedures
For YSI Model 33
1 . Calibration should be performed at 25 degrees Celsius.
2. - Select a glass or plastic container several inches taller than the cell and at least 2 inchesgreater in diameter.
Clean and dry this container, then fill to a depth of at least 2 inches greater than theheight of the working part of the cell.
Rinse the cell by pouring calibrator solution into and over the cell.
Connect the cell to the conductance meter and immerse the cell in calibrator solution.
For 2 minutes, stir the solution with the cell. Also move the cell up and down to forcethe solution through and purge the solution of bubbles.
Position the cell in the center of the solution, at least 1 inch away from the containerwall.
Record temperature and conductance-meter readings.
3. Calculations: If the meter does not read the correct value for the calibrator solution,calculate a correction factor as follows:
Cell constant - Actual Calibrator Solution Conductivity
To calculate the specific conductance of the sample:
Sample Conductivity m Conductance-Meter Reading x Cell Constant
NOTE: This calibration procedure is for the individual fifilfa. If a different cell is used, itmust be calibrated for that meter.
-41-
AR000088

Table 14.3Conductivity Meter Compensation Procedure
For YSI Model 33
1. Field conductivity readings are useful only if instrumentation error and temperature arecompensated. The following procedure is suggested in order to accomplish this. Multiplythe specific conductivity reading (SpC) obtained in the field by the current cell constant (CQposted near the meter storage area. This compensates for instrumentation error. In fieldnotes, note the number of the instrument used.
STEP 1(80-SpC xCC
2. Multiply Step 1 (S,) result by 0.02.
STEP 2 (SJ - [SpC i CCJ x 0.02
3. Compute plus or minus the difference between the final field temperature reading (T *C)and 25° Celsius.
STEP 3 (S,) - [Tim *c " 25 "d
4. Multiply Step 2 (Sj) result by the positive value of Step 3 (S,) result.
STEP4-(SJ-S1xS,
5. Take Step 4 (SJ resuh and add to (if field temperature is less than 25 *C) or subtract from (iffield temperature is greater than 25 °C) the Step 1 (S,) result. This reading is nowtemperature compensated and should conform to laboratory conductivity values.
STEP 5 (Sj) IF TH.M < 25*C THEN S, + S4
IF T > 25'C THEN S, - S4
Example:The final specific oondnntinr* reading obtained in the field was 1,450 jimbot/cm at 23* Celsius.The current octl constant ii 1.07.
S, -1,450 Mmhoe/cm (SpC) x 1.07 (CC) - 1,551.50 iunhos/cm
S, - 1,551.50 juntos/cm (S,) x 0.02 - 31.03 pmhoa/cm
S, - 23*C - 25"C (W - -2
S4 - 31.03 nmhot/cm (83) x 2°C (S,) - 62.06 Minhos/om
Sj - 1,551.50 )imbos/om (S,) + 62.06 (SJ - 1,613.56 tunhoi/cni
-42-
AR000089

Table 14.4HNU PI 101 Calibration Procedures
Calibration:
1. Attach probe with aluminum extension to the meter.
2. Turn top knob to "BATT" to check battery charge. If needle reads in "BAIT CHK" zone,charge battery per instructions below.
3. Turn top knob to "STANDBY".
4. Attach regulator to calibration gas.
5. Attach regulator hose to probe extension.
6. Open regulator and check that there is calibration gas.
7. Turn top knob to the 0 - 200 scale.
8. Unlock and adjust "SPAN" knob until needle reads 56 ppm; then lock "SPAN" knob.
9. Record "SPAN" number in HNU calibration notebook.
Battery Charging
1. While extension probe is attached to the meter, plug battery-recharging unit into the meterthen into outlet.
2. Be sure top knob is in the "OFF" position during recharging.
-44-
AR000090

Table 14.5Calibration Procedures
For Model 54A Oxygen Meter
The YSI Model 54A oxygen meter should be calibrated in the field prior to its use accordingto its operation and maintenance manual based on ambient field temperature and altitude.Detailed calibration instructions are printed on the back of the meter. When calibrating the probe,keep the probe in the open-ended bottle with several drops of water. The calibration proceduresare as follows.
1. With the switch in the "OFF" position, adjust the meter to zero using the zeroknob.
2. Move the switch to "RED LINE" and use the red-line knob to adjust theneedle to line up with the red line.
3. Connect the probe to the meter and allow to stabilize for 15 minutes. Theprobe can be in the calibration chamber or in ambient air.
4. Put a few drops of H2O in the open-ended bottle.
5. Place the probe in the bottle (which simulates humidity).
6. Wait 10 minutes for temperature stabilization.
7. Switch to "TEMP" and read and record the temperature on the °C scale.
8. Refer to Table I (on the back of the meter) for the temperature-calibrationvalue.
9. Determine the altitude of the sampling location.
10. Refer to Table n (on the back of the meter) for the altitude-correction factor.
11. Multiply the temperature-calibration value by the altitude-correction factor toobtain the correct calibration value.
12. Move the switch to the appropriate mg/1 range and adjust the calibration("CAL") knob until the meter reads the corrected calibration value from Item11.
13. Wait 2 minutes to verify calibration stability.
14. To measure dissolved oxygen, place the probe in the sample and stir thesample by raising and lowering the probe about 1 foot per second.
15. Allow sufficient time for temperature stabilization.
16. Read and record the dissolved oxygen value from the meter on the M&E fieldsheet. _45_
AR00009I
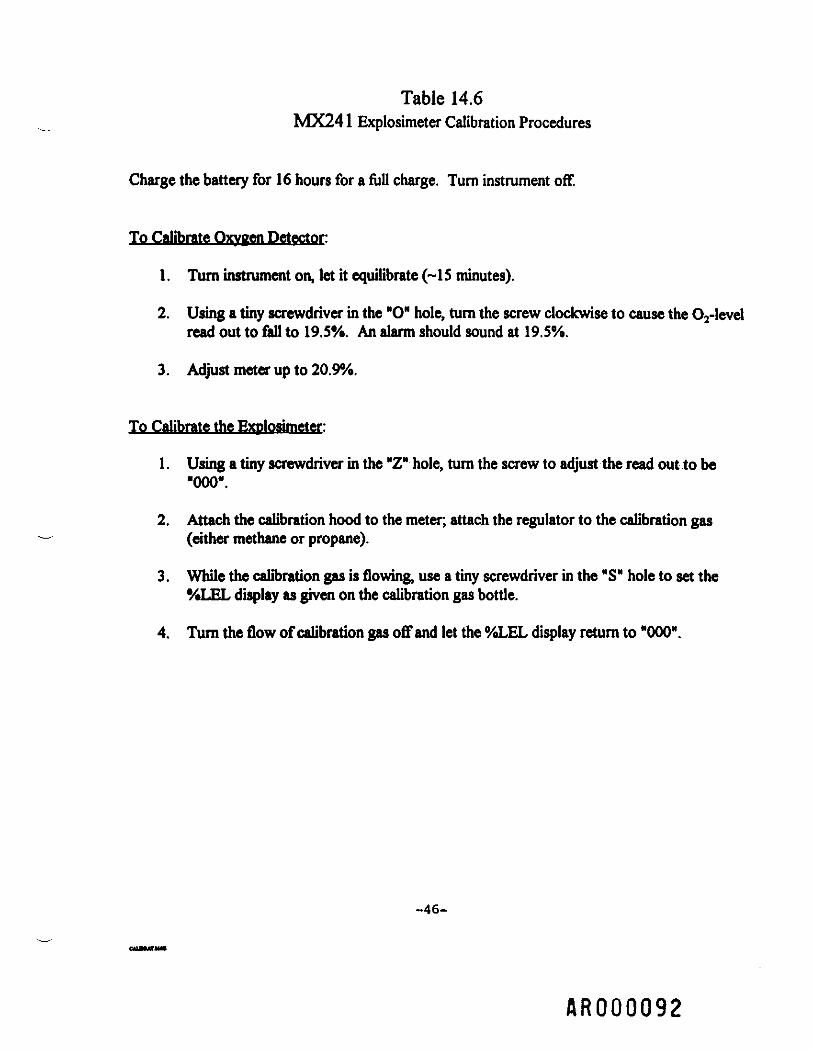
Table 14.6MX241 Explosimeter Calibration Procedures
Charge the battery for 16 hours for a full charge. Turn instrument off
To Calibrate Oxygen Detector:
1. Turn instrument on, let it equilibrate (-15 minutes).
2. Using a tiny screwdriver in the "O" hole, turn the screw clockwise to cause the O2-levelread out to fall to 19.5%. An alarm should sound at 19.5%.
3. Adjust meter up to 20.9%.
To Calibrate the Explosimeter:
1. Using a tiny screwdriver in the "Z" hole, turn the screw to adjust the read out to be"000".
2. Attach the calibration hood to the meter, attach the regulator to the calibration gas(either methane or propane).
3. While the calibration gas is flowing, use a tiny screwdriver in the "S" hole to set the•/oLEL display as given on the calibration gas bottle.
4. Turn the flow of calibration gas off and let the %LEL display return to "000".
-46-
AR000092

APPENDIX B
Health and Safety Plan
AR000093

HEALTH AND SAFETY PLAN
QUICK CHECKLISTA. SITE RESOURCES
SITE:
LOCATION /ADDRESS:
SITE PHONE NO.:
Phone Location / Accessible hours:
Route 522 Bridge Site
East Walnut Street (Route 522)
Lewistown, PA 17044
(717) 248-0189 or (800) 572-0808 Adjacent Nfttany OHCompany (NOC) Office
Inilde Minit Mart or NOC office NOC Office7:30 am-5:00pm M-F
8:00am-12:00pm Saturdayi (winter only)Minit Mart - open 24 houn
Is there Cellular Phone Service in the site area? (YES or NO) YM
Site Contact Name / Phone No. :Sam Sleek
(814)342-5865(800)870-2140
Water Supply:
Other:
Inside ftore or NOC garage.
Electricity In NOC bulk facility.B. EMERGENCY PHONE NUMBERS (include name of each)
IS THERE 91 1 SERVICE?
NEAREST PHONELOCATION:
FIRE DEPARTMENT:
EMERGENCY ROOM:
POLICE:
OTHER:
Inside Minit Mart orNOC Office
911
(717) 248-7181
911
YES X
AMBULANCE:
HOSPITAL:
POISON CONTROLCENTER:
AIRPORT:
NO
911
Lewistown Hospital(717) 248-5411
(800) 352-7001(717)275-6116
ReedsvlUe/Mifflin Co.(717) 667-2400
(717) 248-9607 - Lewistown Borough - Non-EmergencyC1\T\ 248-4453 - State Police
C. EMERGENCY CONTACTS
Meiser& Earl, Inc. Office -(8 1 4) 234-08 13
Tom Earl -(814) 237-6989
Bob Hershey - (814 ) 23 1-0829
Mike McCamley - (814 ) 237-8098
Andy McKinnon -(814) 237-9209
Jav Lvnch - C8 1 4 > 422-8584
Meiser & Earl. Inc. FAX - (814) 234-1693
Ed Meiser - (814 ) 237-6730
Jim Eby- (814) 237-9649
Heidi Battista - (814 ) 237-7237
John Washington - (814 ) 238-8724
Bain Cameron - C8141 237-953 1
Page.ofS AR00009II
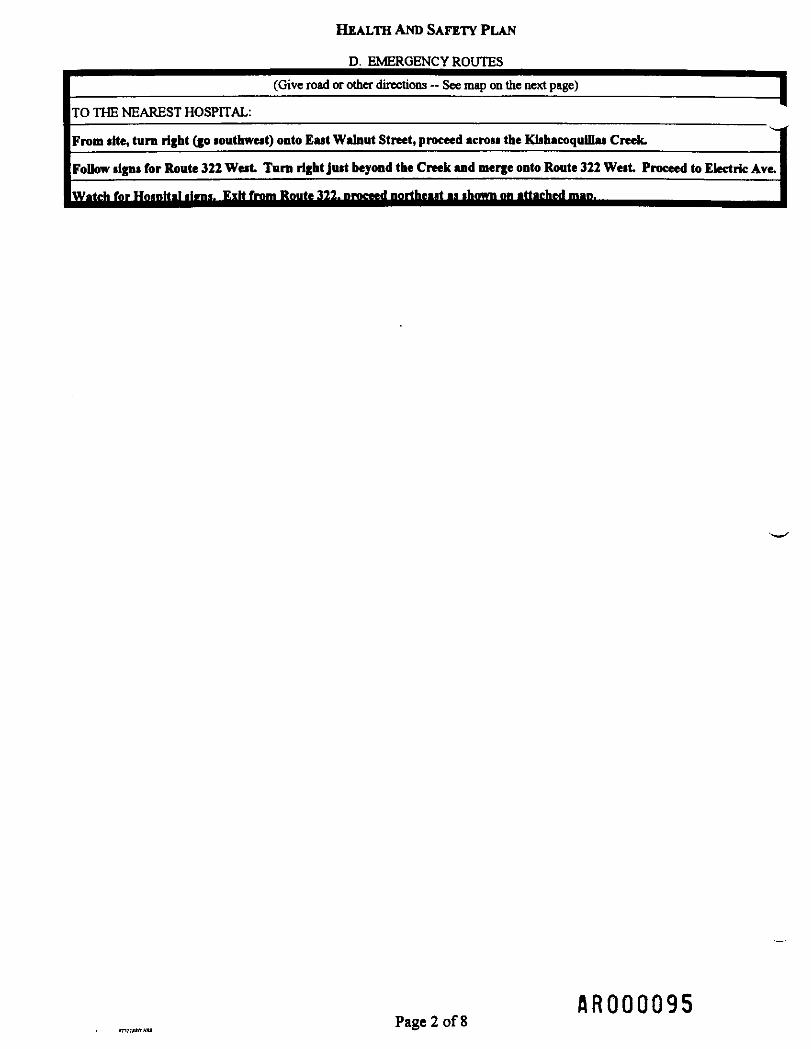
HEALTH AND SAFETY PLAN
D. EMERGENCY ROUTES(Give road or other directions - See map on the next page)
TO THE NEAREST HOSPITAL:
From ifte, turn right (go southwest) onto East Walnut Street, proceed across the Kiahacoqulllas Creek.
Follow signs for Route 322 West Turn right just beyond the Creek and merge onto Route 322 West Proceed to Electric Ave.
Watch for Hosnftal ilvni. EiH from Route 322. nroceed northeast aa shown on attached man.
AR000095Page 2 of8

Hospital Route Map to Lewistown Hospital from Route 522 Bridge Site
Lewistown, Pennsylvania7.5-Minute Quadrangle

HEALTH AND SAFETY PLAN
E. GENERAL INFORMATIONPLAN PREPARED BY:
APPROVED BY:
REVISED BY:
Heidi Battista, Mciser & Earl, Inc.
SITE SAFETY AND HEALTH SUPERVISOR / BACKUP:
SITE SAFETY MEETINGS:
Frequency of meetings:
OBJECTIVE (include description of workto be performed):
PA ONE CALL CONTACTED:
DATE:
DATE:
DATE:
10/29/97 |
Andy McKinnon (M&E)Heidi Battista (M&E)
Held at site.
First day of eachnew task and as
necessary.
Documentation attached? (YES or NO) Yes
Sample existing wells; drill, construct & sample new monitoring wells;conduct pumping tests.
Will call prior to beginning field work
PROPOSED DATE(S) OF INVESTIGATION:
BACKGROUND REVIEW:
OVERALL HAZARD:
DATE /TIME: —
Fall and Winter 1997/1998
CompleteSeriooi:
Low:
Moderate:
Unfawwa:
X
F. SITE/WASTE CHARACTERISTICS
WASTE TYPE(S):Liquid:
Stndft*:
Solid:
OM:
Comow: IgaiUMr.
RjdioMtivo: Volatile:CHARACTERISTIC(S):
Reactive: Unknown:
Toxic: Other:
EXISTING ANALYTICAL DATA: See Table 3, attached.
FACILITY DESCRIPTION: U.S. Route 522 (East Walnut Street) with bridge which crosses the Klihacoquillu Creek.Site bordered by convenience store (Mlntt Mart) with fuel Islands, Ntttany OD Company bulk facility and single family homes.
Principal Disposal Method (type and location): Petroleum-contaminated ground water under PennDOT right of way
Unusual Features (site entrance, dike integrity, power lines, terrain, surface waters, etc): U.S. Route 522 (busy roadway), buriedutilities, overhead line*, creek, busy convenience store.
Status (active, inactive, unknown): Active; pumping and treatment system at adjacent Minit Mart; five PennDOT wells inRoute 522 roadway.
HISTORY (Worker or non-worker injury, complaints from public; previous agency action):None known.PennDOT installed and sampled wells along Route 522 during replacement of bridge hi 1991.
AR000097Paee4of8

HEALTH AND SAFETY PLAN
SAFETY AND HEALTH RISK OR HAZARD ANALYSIS:
IflSfc
Measure water levels, measure for floating product andsample PennDOT monitoring wells.
Conduct pumping tests.
Install and construct monitoring wells.
Operation
Vehicular traffic, inhalation of BTEX-contaminated groundwater, physical hazards of collecting ground-water samples
and temperature extremes.
Vehicular traffic, inhalation of BTEX-contaminated groundwater, physical hazards of collecting ground-water samples
and temperature extremes.
Vehicular traffic, electrocution, dust from wen installation,inhalation of petroleum-contaminated ground water and
tentneratnre cTtremei.
G. HAZARD EVALUATION(List Chemicals known or suspected. Attach corresponding Hazard Evaluation of Chemicals forms):
Suspected contaminants are petroleum hydrocarbons Including benzene, toluene, ethylbenzene, xylenes (BTEX), and methyltert butyl ether (MTBE). See attached table summarizing BTEX characteristics.
H. COMPREHENSIVE WORK PLANS
OBJECTIVE: Sec Remedial Action Plan.
PERIMETER ESTABLISHMENT (/):
Site Secured?
Contamination Zone(s)Identified?
Decontamination AreaIdentified?
Nearest Phone Identified?
No
No
Yes, near spigot at NOC bulkfacility.
Yes, inside bulk faculty officeor Mlntt Mart
Map/Sketch Attached?
Perimeter Identified?
Work Zones Identified?
Entrance and ParkingIdentified?
Other
Yea
Yes, area encompassingexisting PennDOT wells
Partially; each existing welland proposed wells.
Yes, at NOC bulk facility.
Electricity at NOC bulkfacility.
PERSONAL PROTECTION: Yet
Recommended Level of Protection (A, B, C and/or D): D
Description: Steel-toed boots, protective gloves, safety glasses, vinyl or neoprene gloves.
Modifications: Upgrade to Level C if PID readings exceed the action level
AR000098Paoe S nfK

HEALTH AND SAFETY PLAN
SURVEILLANCE EQUIPMENT AND MATERIALS |
Equipment / Unit Number
proExplosimeter
Calibration Date / Initials ^
Calibrated prior to use each day. "~"
Calibrated prior to use each day.
AIR, PERSONNEL AND ENVIRONMENTAL SAMPLING TECHNIQUES:
Air
Surface Water:
Sediment:
SITE COMMUNICATIONS:
NA
See M&E QA/QC Plan forField Activities.
See M&E QA/QC Plan forField Activities.
Ground Water
Soil:
Other:
See M&E QA/QC Plan forField Activities.
NA
NA
Voice, hand signals
DECONTAMINATION PROCEDURES / DUTIES: Decontaminate water-level meters, product measuring devices, andsampling equipment prior to and between sampling locations using an Akonoi/potable water wash and potable water rinse.Sampling devices also will have a distilled water rinse. Decon station to be located adjacent to NOC bulk faculty garage.
Special Equipment or Procedures: Grundfba Redi-Flow2 pump and controller, or similar; pressure transducers.
PROJECT TEAM MEMBER: Andy McKlnnon, Mike McCamky, Held! Battista (M&E).
RESPONSIBILITY: Purve and flamnle well*: ovenee drfllln* and well construction: conduct numnlnv testa.I. COMPREHENSIVE WORK PLANS (Continued)
WORK LIMITATIONS (Time of day, etc.): Field work is limned to daylight hours only.
CONFINED SPACE ENTRY PROCEDURES: No confined space entry is anticipated
INVESTIGATION-DERIVED MATERIAL DISPOSAL: Ntttany Oil Company wifl be responsible for the proper disposalof site-venerated waste Includlnc nuive and numninv text water.
J. EMERGENCY RESPONSE PLAN
Pre-Emergency Planning:
Personnel roles, lines of authority and communication:
Emergency recognition and prevention:
Safe distances and rally points:
Site security and control:
Evacuation routes and procedures:
Decontamination procedures:
Emergency medical treatment and first aid:
Emergency alerting and response:
Critique of response and follow up
PPE and emergency equipment
Conduct itte health & safety meeting
Field supervision by M&E
Keep alert; use common sense; repair potential problems
at bulk facility office
NA
See Section D
See Section H
Use vehicle first-aid kit; call 911
Normal voice; vehicle horn; call 911
Review procedures within one week of emergency response.
Steel-toed boots, protective gloves; safety glasses, vinyl orneonrene cloves.
K. SPILL CONTAINMENT PROGRAM
nllh of m will be cleaned U
AR000099Paee6of8

HEALTH AND SAFETY PLAN
TRAINING AND MEDICAL SURVEILLANCE
VVippMMUt
V
V
V
/
V"
Project Team Member
Tom EarlMeiser & Earl, Inc.
EdMeiserMeiser & Earl, Inc.
BobHersheyMeiser & Earl, Inc.
John WashingtonMeiser & Earl, Inc.
James EbyMeiser & Earl, Inc.
Heidi BattistaMeiser & Earl, Inc.
Mike McCamleyMeiser & Earl, Inc.
Jay LynchMeiser & Earl, Inc.
Andy McKinnonMeiser & Earl, Inc.
Bain CameronMeiser & Earl, Inc.
Roger PollokMeiser & Earl Jnr.
Training(Course and Date)
40-Hour Hazardous Waste Training, July 19888-Hour Refresher Course, April 18, 1997
CPRMay21,1997First Aid May 23, 19%
40-Hour Hazardous Waste Training, April 1 9888-Hour Refresher Course, April 1 8, 1 997
CPR May 14, 1997First Aid April 24, 1996
40-Hour Hazardous Waste Training, December 19898-Hour Refresher Course, April 18, 1997
CPR May 12, 1997First Aid April 20, 1995
40-Hour Hazardous Waste Training, April 19888-Hour Refresher Course, April 18, 1997
CPR May 19, 1997First Aid May 19, 1997
40-Hour Hazardous Waste Training, Jury 19878-Hour Refresher Course, April 18, 1997
CPR January 13, 1997First Aid January 16, 1997
40-Hour Hazardous Waste Training, April 19888-Hour Refresher Course, April 18, 1997
CPR May 19, 1997First Aid May 23, 19%
40-Hour Hazardous Waste Training, April 1 9888-Hour Refresher Course, April 18, 1997
CPR May 19, 1997
40-Hour Hazardous Waste Training, January 19878-Hour Refresher Course, April 1 8, 1 997
40-Hour Hazardous Waste Training, December 1 9898-Hour Refresher Course, April 18, 1997
CPR May 12, 1997First Aid April 27, 1995
40-Hour Hazardous Waste Training, Jury 1 4, 1 9948-Hour Refresher Course, April 18, 1997
CPR May 3, 1997First Aid April 20, 1995
40-Hour Hazardous Waste Training, July 19888-Hour Refresher Course. Aoril 1 8. 1 997
Medical Surveillance(Date of Most Recent
Physical)
June 24, 1997
June 24, 1997
June 24, 1997
June 24, 1997
June 24, 1997
June 24, 1997
June 24, 1997
June 24, 1997
June 24, 1997
June 24, 1997
June 24, 1997
A R O O O I O OPace 7 of8

HEALTH AND SAFETY PLAN
M. ON-SITE SAFETY MEETINGPROJECT:
DATE /TIME:
ADDRESS:
SPECIFIC LOCATION:
TYPE OF WORK:
Route 522 Bridge Site |
East Walnut Street (Route 522)Lewistown, PA 17044
SAFETY TOPICS PRESENTED (Checklist)
REVIEW OF HEALTH AND SAFETY PLAN (HASP):
PROTECTIVE CLOTHING/EQUIPMENT:
CHEMICAL HAZARDS:
PHYSICAL HAZARDS:
EMERGENCY PROCEDURES:
HOSPITAL/CLINIC AND ADDRESS:
DIRECTIONS TO HOSPITAL:
SPECIAL EQUIPMENT:
LOCATION WHERE HASP WILL BE KEPT:
OTHER: N-
ATTENDANCE:
Name (Printed) Signature
MEETING CONDUCTED BY:
Narqe Printed
SITE SAFETY OFFICER:
TEAM LEADER:
Signature
A R O O O I O IPace 8 ofR

• n
£8"frJ!al|
3!
5
3
3
3
a
aaf
31
Ejf J af if I i9
$
sis? a* t
*s *\ *> a: *i •*!• -•" • w9ff.vlvf f
1
= ,
i |L Mil f? 11= T !'2 a-
« a 5 t

**n t-JwfZ5
2
2
^
is § §3
g;
9" '«*•!99
S 99
<n-*te»i*ivi Ww> W ."; «.9l9f9?91 f
* "5- "l1 99
§"" '***•f r
0,
Mate
only a 10
ftaii
C «nd
u*l
11 i. Hi! iW
by AP d
Snpte
r<cldL
BTCXttMtyacd by E
TTHmlyad
by Mo
Smffccolcctodttl
S^kcolKttdMl
The PACEP SttMtan
*A««qiMHtCa(dilk)
McaMptacr" (AcH
O - GMobw R
O - Dieid RM«
-NotDetocKd.
tecbonlaiMiMi
l, TBA - 50 ait
L - Ccnte
C - Mea
ADEP
StM
Not • P A
(1) S
tktoc
(1) B
O) T
(4> S
(S) S
(6) T
(7) *
da ORO
ORO
ND Dcte
i/l,
CAL
ILFC
• PA
"
COoCDCDCD

s Sii
flWe 'U1"•
Is I!
, - „ if<CDcrC.
O
M*8
*i
I
!N61fill
Jfff'!
s1ifi
1F? !S!Jl•„ aaSasIi! S*?«
IT?
RlI IFIB
-ei«* 9
f] W.I Tl
1i!
"onsfls
'ffi
a
1*i»im
ITA R O O O I O U


![Untitled-1 [] 522 Plaster.pdf · Cizallas para vendajes enyesados BERGMANN 522-100 ESMARCH 522-110 20.0 cm 522-112 22.0 cm SEIJTIN 522-130 23.0 cm STILLE 522-140 24.0 cm STILLE 522-150](https://img.pdfslide.net/doc/110x75/60243f2763d73b35317c25cf/untitled-1-522-plasterpdf-cizallas-para-vendajes-enyesados-bergmann-522-100.jpg)