Embed Size (px)
Citation preview
Offshore Activities and Financial vs OperationalHedging
Gerard Hoberg and S. Katie Moon∗
August 12, 2014
∗The University of Southern California, and the Securities and Exchange Commission, respectively. Wethank Yue Wu for excellent research assistance and Christopher Ball for especially helpful comments regard-ing the use of metaHeuristica software. We thank Chuck Dale, Rachita Gullapalli, and Laurent Fresard forexcellent comments and suggestions. We also thank seminar participants at the Securities and ExchangeCommission. Any remaining errors are ours alone. The Securities and Exchange Commission, as a matter ofpolicy, disclaims responsibility for any private publication or statement by any of its employees. The viewsexpressed herein are those of the authors and do not necessarily reflect the views of the Commission or ofthe authors’ colleagues on the staff of the Commission.
Offshore Activities and Financial vs OperationalHedging
ABSTRACT
A key question is why many globally active firms forgo foreign exchange hedgingdespite its low costs. We propose an explanation based on incomplete hedging marketsthat further suggests that operational hedging is often a more effective hedge. We use10-K filings to construct text-based measures of financial hedging and three offshoreactivities: the sale of output, the purchase of input, and the ownership of assets thatproduce input. We find that firms do use foreign exchange hedging when it is effective asa hedge against both foreign price risk and demand shocks (quantity risk). Otherwise,firms purchase input from the same nations they sell output to, a highly effectiveoperational hedge. A series of natural experiments based on the introduction of newcurrency instruments confirms a likely causal relationship.
1 Introduction
Existing research has a difficult time explaining why many firms with global activities do
not hedge using foreign exchange derivatives despite the fact that it is relatively inexpensive.
Because unwanted risk can expose firms to potential distress, force them to issue securities at
times of poor liquidity, or force them to postpone investments or reduce payouts, most firms
have incentives to hedge.1 This question is made more salient by recent evidence in Hoberg
and Moon (2014) (henceforth HM) suggesting that investors demand risk premia when firms
sell their output overseas to high consumption risk nations. In this paper, we consider the
decision to hedge from the manager’s perspective. We find that foreign exchange hedging
(henceforth FX hedging) may not be used in many cases because it is not an effective hedge,
and in these cases, operational hedging is a strong substitute.
A key tension surrounding the decision to hedge is incomplete hedging markets. Firms
that sell output overseas are not only exposed to currency or price risk, but also to quantity
risk in the form of potentially systematic demand shocks in the nations they sell to. For
example, a large negative shock to consumption in target nations should translate to a
negative demand shock for the U.S. firms selling output to the given nation. The link
between demand shocks and shocks to consumption growth is strong, as the output the firm
sells to the target nation is likely consumed there, either directly or through intermediate
input to more finished products. FX hedging alone might be ineffective because consumption
growth in the given nation might not correlate with exchange rates. In all, firms face both
foreign exchange price risk and consumption quantity risk when they sell goods abroad, and
face incomplete hedging markets because FX hedges are often only effective regarding the
former.
Operational hedges come closer to completing this market. HM show that the purchase
of input (when it is not bundled with the ownership of producing assets) is an effective hedge
1See Smith and Stulz (1985) for related details. One might argue that ultra-large and successful firmslike Google or General Electric are exempt from this concern due to their extraordinary liquidity. We note,however, that the average firm in our sample is the average firm in the Compustat Universe, and suchultra-liquid firms are likely the exception.
1
against consumption growth risk. Hence, in markets where FX hedges have poor efficacy,
the use of operational hedges (such as the purchase of input from the same nations a firm
sells output to) is a strong substitute. For example, proceeds from the sale of output can be
used to directly purchase input in the same nation. This (A) foregoes the need to convert
the foreign currency to dollars and (B) also reduces the exposure to consumption growth
risk because the purchase of input is counter-cyclical as documented in HM. Unlike FX
derivatives, the operational hedge thus has the potential to neutralize both price risk and
quantity risk.
We measure the efficacy of FX hedging by computing the R2 of a regression of each
nation’s consumption growth on innovations in the same nation’s exchange rates. A nation
with a low R2 lacks high quality FX hedging instruments, and firms engaged in offshore sales
to such a nation have a strong incentive to consider operational hedges. We find that the
R2 varies strongly across nations. Among firms that engage in the offshore sale of output,
firms are more likely to use financial hedging when the efficacy of FX derivatives as a hedge
against consumption risk is higher (higher R2). However, they are less likely to use financial
hedging and are more likely to use operational hedging when the efficacy of FX hedging is
poor. The central form of operational hedging we focus on is the purchase of input from the
same nation where a firm sells output.
Because the purchase of input from offshore sources not only serves as a hedge, but also
entails economic activity that has its own net present value, it is natural to ask whether the
link we identify between FX hedging efficacy and the offshore purchase of input is due to
this link instead of the operational hedging channel. There are two reasons why we reject
this explanation. First, as we will discuss later, we consider difference-in-difference natural
experiments where only the efficacy of FX hedging is shocked, and find strong results. Second,
we note that the purchase of offshore input actually comes in two forms: (A) the purchase
of input without ownership of producing assets, and (B) the purchase of input bundled with
the ownership of producing assets. If the large shifts in the use of offshore input we find are
due to economic incentives relating to the profitability of buying input abroad, we would
2
expect that both (A) and (B) should decrease when the efficacy of FX hedging increases.
However, we find that (B) is not statistically linked to FX hedging efficacy, and in contrast,
(A) is strongly negatively linked. Because HM document that only activity (A) is effective
as a hedge, this finding is strongly consistent only with the hedging channel.
In all, our evidence is consistent with a causal role of FX hedging efficacy on the choice
to use operational hedging policies. Despite the fact that our study benefits from direct
measurement of highly specific activities, which improves identification, fully establishing
causality in this international environment is difficult. Endogeneity concerns come in two
forms: potential reverse causality and potential omitted variables. We first note that our
key independent variable, the R2 of nation-specific regressions of consumption growth on
changes in FX rates, is measured using deeply lagged data. As a result, it is highly unlikely
that reverse causality can explain our results, as that would require that offshoring activity
after 1997 causes hedging efficacy in the 1970s and 1980s.
However, a host of omitted variables might endogenously explain both a low R2 and also
the purchase of offshore input, giving rise to more salient endogeneity concerns through the
omitted variables channel. We consider three issues to address this concern: (1) controls
for variables that are likely related to hedging efficacy and offshoring, (2) the use of both
nation and firm fixed effects to fully rule out national characteristics and firm characteristics
as omitted variables, and (3) quasi-natural experiments based on the launch of new FX
derivative products. Regarding controls, we consider GDP levels, GNP per capita, distance
from the U.S., political stability, a measure of the rule of law, and a measure of corruption.
The most convincing evidence against omitted variables is produced by our quasi-natural
experiments. We consider a difference-in-difference methodology that examines the use of
operational hedging before and after the launch of new FX derivative products on the floor
of the Chicago Mercantile Exchange (CME). These tests are particularly discriminating
because only specific nations are affected by the launch of each new product, and also
because these new product launches occur on four distinct dates: 1999, 2002, 2006, and
2009. Moreover, we consider two types of new product launches: (1) the introduction of FX
3
derivatives for medium sized nations for which such contracts were not previously traded, and
(2) the introduction of more liquid FX contracts with smaller denominations that resulted
in improved liquidity due to trading from a larger set of agents. In all cases, we find that the
introduction of the new products for the treated nations resulted in a decrease in the use of
operational hedging.
Our difference-in-difference approach has two limitations. First, it is possible that the
launch of these new FX derivative products associates with a latent economic shock that both
causes the CME to launch the new products, and at the same time reduces the incentives to
participate in offshore activities. We note that such a shock is highly unlikely, as it would
seem more likely that new FX products would be launched when there is more (not less)
demand for offshore activities with the treated nations. The second limitation relates to the
fact that the majority of FX derivatives are traded over the counter and not on the CME.
Hence, it was possible to do FX hedging using OTC contracts even before the launch of the
new CME products. We note that this limitation is mitigated because the visible trading
of contracts on the CME likely had material spillover effects onto the OTC markets due to
the price transparency and cross market arbitrage this liquid trading entails. These OTC
benefits are in addition to the direct benefits of trading on the CME itself. Furthermore,
if trading on the CME was irrelevant, then we should not find any link to offshore activity.
As we find strong results, we conclude that the improved efficacy of financial hedging likely
causes substitutions away from operational hedging and toward FX hedging. This can jointly
explain why some firms might not participate in FX hedging despite its low cost, and why
many firms appear to use operational hedging.
In all, our paper makes several contributions. First, we present novel hypotheses regard-
ing the use of operational hedging through the channel of offshore input that is done without
the ownership of producing assets. Second, we illustrate how text analytic methods can be
used to identify highly specialized activities associated with FX hedging and offshore activ-
ities using an extensive time-varying network of offshoring activities with over 200 nations,
which has many additional research applications. This network, also used in HM, identifies
4
three types of offshoring activities (the sale of output, the purchase of input without own-
ership of assets, and the purchase of input with the ownership of assets) to more than 200
nations over a period extending from 1997 to 2011. Third, we present robust econometric
results supporting the role of operational hedging through highly specialized associations in
the data and also through strict controls and natural experiments.
The remainder of this paper proceeds as follows. In Section 2, we summarize the existing
literature and discuss our key hypotheses. Section 3 describes our offshore data and financial
hedging data in details. Section 4 presents descriptive statistics on our measures of hedging
efficacy and offshore input activities. Section 5 presents our results on the link between
hedging efficacy and financial vs. operational hedging decisions. In Section 6, we discuss our
natural experiments using the CME’s launching events of new FX derivative products and
present the difference-in-differences estimations. Section 7 concludes.
2 Literature and Hypotheses
2.1 Foreign Exchange Risk and Hedging
Many existing studies examine whether corporate hedging activities can enhance firm value.
See for example Smith and Stulz (1985), Froot, Scharfstein, and Stein (1993), DeMarzo and
Duffie (1995), Haushalter (2000) and Graham and Rogers (2002) among others. In interna-
tional finance, many earlier studies focus on measuring firm exposure to foreign exchange
risk (Jorion (1990), Amihud (1994), and Bartov and Bodnar (1994)) based on international
theories that predict that foreign exchange risk might be priced (see Solnik (1974), Solnik
(1977), Stulz (1981), Adler and Dumas (1983), and Dumas and Solnik (1995)), and exam-
ining the effect of financial hedging on foreign exchange risk exposure. Geczy, Minton, and
Schrand (1997) examine the use of currency derivatives and find that firms with greater for-
eign exchange-rate exposure are more likely to use currency derivatives. Allayannis and Ofek
(2001) examine whether firms use currency derivatives either for hedging or for speculative
purpose with a sample of S&P 500 non-financial firms, and suggest that the use of such
5
derivatives reduces exchange-rate risk that those firms with foreign sales might face. Al-
layannis and Weston (2001) find a positive relation between firm value and the use of foreign
currency derivatives with a sample of large U.S. non financial firms in early 1990’s. Brown
(2001) finds that informational asymmetries, facilitation of international contracting, and
competitive pricing concerns motivate financial hedging by examining the foreign exchange
risk management programs at a single large multinational corporation in detail.
Allayannis, Ihrig, and Weston (2001), Pantzalis, Simkins, and Laux (2001) and Kim,
Mathur, and Nam (2006) further expand the scope of FX hedging activities by compar-
ing financial hedging and operational hedging. Allayannis, Ihrig, and Weston (2001) find
that operational hedging is not an effective substitute for financial risk management, and
increases firm value only when used in combination with financial hedging. In contrast,
Pantzalis, Simkins, and Laux (2001) find that operational hedges are significant determi-
nants of exchange rate risk for multinational corporations. Kim, Mathur, and Nam (2006)
find that operational hedging can be effective in managing long-term exposure, while finan-
cial hedging can be effective for managing short-term exposure. Overall, the previous studies
do not document substitution between financial hedging and operational hedging strategies.
Although these studies have made considerable headway in understanding firm decisions
regarding financial hedging and operational hedging strategies, operational hedging has gen-
erally received little attention in the literature and is less well-understood. This is likely due
in part to data limitations. We also note that some earlier studies define operational hedg-
ing as geographic dispersion in operations. This is distinct from the operational hedging we
focus on, which is the decision to buy input from the same nation where a firm sells output.
Hence, our study also expands the debate regarding the types of operational hedges that
might be available to firms.
Our paper overcomes data limitations in the literature because we are able to measure
offshoring activities at the firm level for multiple types of offshoring activities, and we can
separately measure these activities in each year. This process, which is based on text an-
alytics of 10-Ks, creates a rich time-varying network of offshoring activities for each firm.
6
Therefore, our empirical analysis can assess operational hedging in greater detail than in
previous studies. Also, we are able to link theoretical predictions only to specific forms of
offshoring activities and not to others, which improves our ability to test alternatives. We
also use shocks to the liquidity of existing FX hedges as a quasi-natural experiment, which
allows us to uniquely identify changes in offshoring activities that are uniquely related to
the costs of hedging.
Also relevant to our study are the theoretical works relating to offshoring decisions. Some
studies explore optimal firm organization in the international context based on incomplete
contracting and the property-rights theory of firm boundaries (Spencer (2005) and Helpman
(2006) provide surveys of this literature). Other studies view offshoring as trade in tasks,
and seek to identify the characteristics of tasks that are good for offshoring (See Autor,
Levy, and Murnane (2003), Antras, Garicano, and Rossi-Hansberg (2006), and Grossman
and Rossi-Hansberg (2008)). However, little has been established empirically.
Regarding offshoring input, recent work by Moon and Phillips (2013) examines U.S.
manufacturing firms’ outsourcing decisions (both domestic and international) and their im-
plications on financing decisions using purchase obligations data from firm 10-K filings.
Many studies also consider industry-level outsourcing based on survey data. For links to
firm innovation or financial performance, for example, see Kotabe (1990), and Kotabe and
Murray (1999). For links to labor markets, see Feenstra and Hanson (1999) and Bergin,
Feenstra, and Hanson (2007). Other studies consider plant-level or aggregate-level data
from the Census Bureau and the Bureau of Economic Analysis. For example, see Bernard,
Jensen, Redding, and Schott (2007) and Bernard, Jensen, and Schott (2009) for excellent
reviews of this literature. Yet, no studies to our knowledge use firms’ own disclosure about
their offshoring activities to address financial and operational hedging motives.
2.2 Hypotheses
A stylized way to view the intuition of our paper is that a firm selling goods overseas is
exposed to risks inherent to the revenues generated by overseas sales, which can be written
7
as P · Q, where P is price and Q is quantity sold. The existing literature focuses on FX
hedging, which directly hedges risk inherent to P (currency exchange rates should account
for inflation and shocks to national price levels). Because any link between FX derivatives
and quantity risk is not direct, these derivatives might or might not be an effective hedge
against variation in Q. The first issue we focus on is that the existence of Q-risk, and the
potential low efficacy of FX derivatives in hedging Q-risk, likely explain at least in part why
many firms do not hedge using FX derivatives despite the low costs of doing so. In particular,
this is because the market is incomplete regarding the ability to hedge Q-risk, an issue that
receives little attention in the existing literature, which focuses on P -risk.
Our focus on Q-risk in this article is in part motivated by HM, who find that exposure
to consumption growth risk (an important form of Q-risk) is likely priced by investors,
and hence is likely difficult to diversify. Before we consider operational hedging, the initial
prediction is that firms will use FX derivatives aggressively when they sell output to nations
for which FX derivatives are effective as hedges against Q-risk (this argument takes it as
given that they are relatively effective with respect to P -risk). Firms are more likely to
eschew FX derivative hedging otherwise.
Hypothesis 1: Firms will use more FX hedging when the efficacy of this FX hedge
against consumption risk (an important form Q-risk) is strong.
Our illustration is easily extended to explain when operational hedging can be more
effective. If we assume that input costs are variable for simplicity, then by purchasing input
from a target nation, a firm’s overall exposure to the given nation becomes PQ−αPQ, where
α is the rate of variable cost.2 This expression simplifies to (1 − α)PQ, which is a smaller
risk exposure than PQ (the exposure of a firm that does not purchase input in the target
nation) whenever variable costs are positive (α > 0). We further note that these expressions
give that the purchase of input from the target nation (the operational hedge) is effective
as a hedge against both P -risk and Q-risk, as higher α linearly scales down total exposure.
2We note that this requires the simplifying assumption that price levels of input and output are fullycorrelated. We note that in practice, some residual (likely idiosyncratic) risk will remain unhedged, andmake this simplifying assumption only for illustrative purposes.
8
Hence, operational hedging through the purchase of input can complete the market, and
motivates our second hypothesis.3
Hypothesis 2: Firms will eschew FX hedging when its efficacy is poor, and instead, they
will use operational hedging in the form of purchasing input from the same target nations
they sell output to.
We note that H2 specifically relates to external input (the purchase of input abroad
without the simultaneous ownership of assets). The hedging efficacy of offshore input is
based on the prediction that the cost of buying input in a nation is likely to be counter-
cyclical. This is expected due to the high marginal utility that citizens in the target nation
would face in bad times. In such times, employees should be willing to work for lower wages,
and the cost of raw materials needed for input should be also lower due to reduced domestic
demand. These predictions are supported by the production-based equilibrium model in
Tuzel and Zhang (2013). HM provide strong supporting evidence that offshore external
input is indeed associated with a negative risk premium.
The model in Tuzel and Zhang (2013), also with empirical support in HM, further suggests
that purchasing input should be less counter-cyclical if the firm bundles this activity with
the ownership of assets. In particular, the value of the assets themselves is likely to be
pro-cyclical, counterbalancing the counter-cyclical nature of purchasing input. This leads to
our final hypothesis.
Hypothesis 3: The predicted link between FX hedging and offshore external input in
Hypothesis 2 does not extend to offshore internal input (the purchase of input bundled with
the ownership of assets), which is not a robust operational hedge for consumption risk.
3It is natural to view the fact that operational hedging can only be scaled to the factor (1 − α) of thetotal exposure as a potential limitation of operational hedging. We note that this limit is, in fact, fictitious.A firm can fully neutralize its risk exposure using operational hedging by purchasing more input from thetarget nation than it needs to produce its own output. For example, by purchasing α
1−αPQ in additionalexcess input, its risk exposure to the target nation would be reduced to zero. Hence, a more extremeform of operational hedging would entail purchasing more input than is needed, and re-selling this excessinput to domestic buyers. This example might seem extreme, but we note that many firms espouse verticalintegration, and we make this point to illustrate that the operational hedge not only completes the market,but it can also be scaled.
9
Comparing Hypothesis 2 and Hypothesis 3 not only bears relevance due to the theoretical
arguments raised by Tuzel and Zhang (2013). These predictions are also relevant because
they disagree with the predictions of an important alternative hypothesis. The alternative
is that any changes we might observe in the use of offshoring input are potentially driven
by economic incentives relating to the profitability of acquiring input at lower costs (and
not by hedging incentives). Importantly, this alternative does not distinguish strongly be-
tween external and internal input. Hence, this alternative likely predicts that both forms of
offshoring input (external and internal) should be related to our key variables in a positive
and significant way. In contrast, the hedging theory predicts that only external input will
be positively related to incentives to hedge.
We therefore note that the hedging motives provide a sharp set of predictions overall that
are likely separable from alternatives. Yet we also go beyond these predictions and consider
natural experiments. We find strong support for our three hypotheses.
3 Data and Variables
We collect and electronically process offshoring data and financial hedging data from the
SEC’s Edgar 10-K filings. We utilize software provided by metaHeuristica LLC for parsing
the text documents. We then merge the database with the Compustat data using the SEC
Analytics table for CIK to gvkey links. Our sample period covers from 1997 to 2011, as 1997
is the first year of full electronic coverage of 10-K filings in the SEC Edgar database. We
apply a number of basic screens to ensure that our analysis covers firms that are non-trivial
publicly traded firms in the given year. We also discard firms with a missing SIC code or a
SIC code in the range of 6000 to 6999 to exclude financial firms. We also require that each
firm has a valid link from the 10-K CIK to the Compustat data.4
In the remainder of this section, we first describe our offshoring data in detail, including
4Our paper contributes to a growing literature that considers text-based analysis to test theoreticalhypotheses in Finance. Early financial studies using text include Antweiler and Frank (2004) and Tetlock(2007). Regarding SEC disclosures, earlier work includes Hanley and Hoberg (2010), Hoberg and Phillips(2010a), Loughran and McDonald (2011) and Garcia and Norli (2012). See Sebastiani (2002) for a reviewof text analytic methods.
10
how we construct our lists of nation words and offshoring words to identify each firm’s
offshoring activities from its 10-K. Then, we discuss how we create our financial hedging
data by identifying each firm’s use of currency derivative products from its 10K.
3.1 Offshoring Data and Variables
We first compile a complete list of nation words for 236 nations and 25 regions, considering
variations that include official and non-official nation names, and their adjective forms. Then,
we create another extensive list of the nearest neighbor words that co-exist with nation
words from 10-K filings in the base-year 1997. Nearest neighbor words are those that occur
within a 25 word window of any of the nation words. We then manually categorize all
roughly 5,000 nearest neighbor words that are mentioned more than 100 times, in order to
determine whether the word refers to any of the following offshoring activities: A) Output, B)
External input, C) Internal input, and D) Indeterminate input. For example,“Sell”, “Sales”,
“Revenues”, “Markets”, “Consumers”, “Store”, “Export” and “Distribute” are regarded as
A) Output. “Supplier”, “Vendor”, “Subcontract”, “Import” and “Purchase & From” are
regarded as B) External input. C) Internal input include “Subsidiary”, “Facility”, “Plant”,
“Venture”, “Factory” and “Warehouse” for example. Finally, some input words that are not
explicitly identified as either external input or internal input such as “Manufacture” and
“Produce” are regarded as D) Indeterminate input, as the subject of the paragraph is not
clear in these cases. We refer to the full list as offshore words throughout the paper. In
Appendix 1, we report the complete list of words for each activity.
We then reexamine all 10-K filings in the base-year 1997 and extract all paragraphs that
contain words from both lists: (nation words and offshore words). Our approach to extract
paragraphs instead of sentences intends to reduce false negatives. This choice is due to the
fact that many firms discuss their offshoring activities over several sentences, and hence
just one sentence often misses pairings of nation words and offshore words. Our paragraph
approach may generate false positives. To address this issue, we set a maximum distance
between nation words and offshore words at 25 words, and drop hits when the two words
11
are more than 25 words apart even if they are in the same paragraph.5
For our 1997 database of hits, we then assess success rates based on whether each hit
correctly identifies one of the four offshoring activities. Manual validation reveals that our
success rate ranges from 75% to 90%. As an additional quality check, we examine paragraphs
that contain nation words but no offshore words, and confirm that nearest neighbor words
associated with nation words in these cases are not related to offshoring. For example,
such unrelated discussions might mention words such as “University”, “Patent”, “Carry-
forwards”, “Airlines” and “Court”.
Our final step is to run our final methodology for all 10K filings from 1997 to 2011.
This generates a full panel of offshoring data of 293,050 observations with the raw counts of
how many times a given firm mentions any of the four offshoring activities in each nation.
Our final sample is then reduced to 212,613 observations where we observe non-zero offshore
output activity (offshore output is the sale of output to the given nation-year of the observa-
tion). We focus on this reduced sample of offshore output activity because we are interested
in examining how firms hedge the risk that their offshore sales might expose them to, and
hence these are the observations that entail a material hedging decision. We provide more
details regarding offshoring statistics in the next section.
In our tests, we focus on the following three offshoring variables: External Input Dummy,
Internal Input Dummy, and Relative External versus Internal Input. The External Input
Dummy and Internal Input Dummy are one if the firm discusses its offshore external and
internal input respectively with the relevant vocabulary in our offshore words list along with
the given nation word in a given year. Relative External versus Internal Input is computed
as External Input Dummy divided by the sum of both External Input Dummy and Internal
Input Dummy. By explicitly contrasting external input versus internal input activities, this
measure directly assesses the extent to which the given firm engages in offshore external input
relative to internal input activities. This variable cannot be computed for observations that
5We conclude that the distance of 25 words is robust and quite accurate after manually inspectingalternatives such as 5, 15, 30 or 50 words.
12
do not have either offshore external or internal input activities. All of our offshoring variables
are firm-nation-year level observations from 1997 to 2011.
3.2 Financial Hedging Data and Variables
We create financial hedging variables by searching 10Ks for statements that indicate the use
of FX currency derivative products. We consider searches based on the following three word
lists: A) “Currency” or “Foreign Exchange”, B) “Forward”, “Future”, “Option”, “Swap”,
“Spot”, “Derivative”, “Hedge”, “Hedging”, or “Hedged”, and C) “Contract”, “Position”,
“Instrument”, “Agreement”, “Obligation”, “Transaction”, or “Strategy”. In order to con-
clude that a firm uses FX derivatives hedging, we require that the firm mentions at least
one word from each of these lists (or their plural forms if they are nouns) in close proximity
within a paragraph.
We extract paragraphs instead of sentences for the purpose of reducing false negatives. In
many cases, writers need more than one sentence to fully convey their use of these products.
As before, we set the same maximum distance between words from the three lists at 25 words.
More specifically, all three words must appear in a window where the furthest two words
are no more than 25 words apart. We additionally exclude hits with phrases that would
make them false positives. These phrases include “in the future” and “forward-looking” for
example. We then manually assess hit success rates based on whether each hit correctly
identifies the use of currency derivative products for our base-year 1997. Manual validation
reveals that our success rate ranges from 80% to 97%.
Our text-based approach is particularly stable because our sample period starts in 1997,
and FASB issued SFAS No. 119, Disclosure about Derivative Financial Instruments and Fair
Value of Financial Instruments, in October 1994. SFAS No. 119 requires firms to disclose
their use of derivative financial instruments - futures, forwards, swaps, option contracts,
and other financial instruments with similar characteristics.6 Earlier studies that use this
6SFAS No. 119 was effective for financial statements issued during fiscal years ending after December 15,1994 for entities with greater than $150 million in total assets, and effective after December 15, 1995 for theentities with less than $150 million in total assets.
13
approach to identify firm financial hedging motives include Wong (2000), Graham and Rogers
(2002), and Kim, Mathur, and Nam (2006).
We use information from this text search to create the following two variables that mea-
sure financial hedging activities: Financial Hedging Dummy and Log(1+#FHedge). The
Financial Hedging Dummy is one if a firm discloses its use of any types of currency deriva-
tive products in its 10K in the given year. Log(1+#FHedge) is the natural logarithm of
one plus the raw count of how many times a firm mentions currency derivatives in its 10K
in the given year. These variables are firm-year level observations from 1997 to 2011. The
dimensionality of this panel data thus differs from the offshoring variables we consider, which
are defined at the firm-nation-year level. This difference is due to the fact that firms only
disclose their use of currency derivative contracts, and they generally do not discuss them in
adequate detail to assess which specific foreign currency products they hold. In contrast, as
noted above, we are able to measure offshoring activities separately for each nation. Hence,
when considering FX hedging, we limit our analysis to firm-year panel data models, although
we use firm-nation-year panel data models when we assess operational hedging. Despite this
limitation, we find strong support for all three hypotheses.
For robustness, we also consider U.S. firms’ use of foreign currency debt in addition to
their use of foreign currency derivatives. In contrast to foreign currency derivatives that
are mainly used for hedging purposes, the motivation to use foreign currency debt is less
clear. In some cases, firms might issue foreign debt because they offer cheaper interest
rates. Because it would be difficult to separately identify when foreign debt might instead
be used for hedging purposes, we consider a robustness specification where we assume that all
foreign currency debt issues are potentially related to hedging activities. Hence we consider
a financial hedging variable that includes foreign debt issues in the recent past. We obtain
foreign currency debt issues data from both the Securities Data Corporation (SDC) and
the DealScan databases. We obtain foreign public debt issuance data from the SDC, and
private foreign debt placement data from the DealScan. The DealScan database contains
private debt placement information including term loans and revolving credit lines made to
14
U.S. firms by foreign banks and syndicates of lenders. We exclude 364-day facilities and any
other loan with less than a one year maturity. We thus consider a variable Financial Hedging
Dummy (with FX Debt), that is one if a firm either discloses its use of any types of currency
derivative products in its 10K in the given year or if it issued any foreign currency debt
during 5 years prior to the given year from 1997 to 2011. This variable is at the firm-year
level and is analogous to Financial Hedging Dummy. The correlation between the Financial
Hedging Dummy (with FX Debt) and Financial Hedging Dummy is 0.68.
4 Hedging Effectiveness and Offshore Input Activities
In this section, we describe how we measure the efficacy of FX hedging, and present descrip-
tive statistics and figures to summarize our key variables and univariate relationships.
For each nation, we measure the efficacy of FX hedging (henceforth the FX RSQ) by
computing the R2 of a regression of each nation’s consumption growth on the changes in the
same nation’s exchange rates. Annual consumption data from 1970 to 2011 are obtained from
the World Bank, and each nation’s consumption growth is defined as the natural logarithm
of its consumption in U.S. dollars in the given year divided by its lagged consumption. We
create both a static and a separate time-varying R2 for robustness analyses. The static R2
is the estimated R2 of a regression using available consumption and exchange rate data from
the World Bank from 1970 until 1990, which is seven years prior to the start year of our
sample period.7 We focus on the static R2 as our main variable of interest in order to be
conservative, and because this helps to rule out reverse causality in our regressions. The
time-varying R2 is computed analogously using a 20 prior year rolling window (including the
year [t-5, t-25] ) for our sample period. Although we focus on the static measure, we note
that our results are robust to using time-varying R2.
Figure 1 displays consumption growth and exchange rate changes for three different
nations in different FX RSQ terciles.
7We additionally require at least 5 years of available data. If a nation has less than 5 years of availableconsumption and exchange rates data, we set its FX RSQ to zero.
15
[Insert Figure 1 Here]
The United Kingdom, Philippines, and China are in the highest, medium, and lowest ter-
cile of FX RSQ among the over 150 nations with offshore outputs in our sample, respectively.
The figure shows that our measure of FX hedging efficacy well captures the effectiveness of a
nation’s currency as a hedge against the nation’s underlying consumption risk. In particular,
the exchange rates almost perfectly comove with consumption growth in nations with a high
FX RSQ, while the exchange rates shows no significant relation with consumption growth
in nations with a low FX RSQ. We further note that there exist three rough categories of
exchange rate regimes: free or managed exchange rates, fixed or pegged exchange rates, and
currencies with a target zone or a crawling peg (see Bekaert and Hodrick (2012) for more
details). For example, the United Kingdom allows the value of its currency to be determined
freely (free floating regime), while the Philippines often intervenes in the foreign exchange
market (managed floating regime), and China actively intervenes to stabilize its currency
relative to major currencies (pegged regime).
We note that exchange rate regimes and many other potential factors might be relevant
in determining the relationship between consumption growth and exchange rate changes.
Despite this, our measure of R2 will still correctly sort nations into hedging efficacy groups,
as the actual changes in exchange rates are what matters in determining hedging efficacy. We
also note that our controls for country fixed effects in our panel data regressions further ensure
that any underlying country-specific factors relating to the issues determining exchange rate
regimes are fully controlled for in our regressions, ruling out bias from this class of omitted
variables.
Figure 2 shows the distribution of the FX RSQ measure and U.S. firms’ offshoring input
activities around the world. Figures (a) and (b) display each nation’s estimated FX RSQ
using the static and time-varying forms, respectively. Figure (c) and (d) display maps
of the counter-party nations experiencing the most offshoring external and internal input
respectively over our sample period from 1997 to 2011. Brighter shades of blue indicate
16
greater intensity for each measure.
[Insert Figure 2 Here]
The static and time-varying FX RSQ figures show that those two measures are quali-
tatively similar, with the exception of east European nations, for which FX RSQ increases
over time. The external input figure (c) shows that U.S. firms significantly rely on sources
in southeast Asia to obtain external input. The internal input figure in (d) shows that U.S.
firms do more internal input than external input in Latin America and Europe, possibly due
to the geographical proximity of these regions to the U.S., making ownership of assets easier
to manage.
Table 1 displays a list of 150 nations where U.S. firms in our sample participate in offshore
output activity over our sample period from 1997 to 2011. The table displays the estimated
FX RSQ and the number of total mentions of each nation word by the firms in our sample.
The table shows that large European nations tend to have reliably high FX RSQ. It is also
worth noting that many nations with high levels of offshore output activity also have a low
FX RSQ (for example China, Mexico, and Brazil).
[Insert Table 1 Here]
Table 2 presents summary statistics for our variables. In our extended dataset, 69%
of U.S. firms participate in offshoring output, and most of these offshoring firms (about
85%) actually do both offshore output and input at the same time. Among the firms that
participate in offshoring output, 28% and 73% of the U.S. firms use offshore external input
and internal input, respectively. The table also presents descriptive statistics for our financial
hedging variables. 57% of U.S. firms with offshoring output disclose in their 10Ks that they
hold currency derivative contracts and the average count of textual mentions of currency
derivatives is 2.5. Furthermore, 75% of U.S firms with offshoring output either use FX
derivative instruments or have outstanding FX debt.
[Insert Table 2 Here]
17
The table also summarizes variables describing national characteristics and firm financial
characteristics. These variables will be considered in the next table to examine the extent
to which these variables correlate strongly with our key measures of offshoring and hedging.
To facilitate the economic interpretation of the results, we standardize all variables prior to
running regressions so that they have unit standard deviation and winsorize all non-binary
variables at the top and bottom 1% of the distribution.
Table 3 displays Pearson correlation coefficients between our key offshoring and hedging
variables and national (in Panel A) or firm (in Panel B) characteristic variables.
[Insert Table 3 Here]
We first note that our offshoring input variables correlate only weakly to moderately with
all of the national or firm characteristic variables we consider. In particular, no correlation
coefficient with the characteristic variables exceeds 20% in absolute magnitude. This finding
illustrates that the information contained in our offshoring input variables is quite novel
given variables in the existing literature.
Importantly, we note that our offshore external input measure (External Input Dummy) is
negatively correlated with FX RSQ, and this is more pronounced for the alternative measure:
Relative External versus Internal Input. We find that our hedging efficacy measure, FX RSQ,
is positively correlated with many factors generally considered to be related to whether a
nation is developed or not, including GDP, GNP per capita, political stability, corruption,
and rule of law measures. The national governance measures including political stability,
corruption control, rule of law, voice/accountability, government effectiveness, and regulatory
quality are from the Worldwide Governance Indicators database, which is available from the
World Bank website.8 The correlation coefficients between these variables are as large as
70-85%. Therefore we use only one of these variables at a time in our regressions to avoid
multicollinearity concerns.
In the next section, we will show that FX hedging efficacy is not simply a matter of
8See Lopez de Silanes, La Porta, Shleifer, and Vishny (1998) for a discussion regarding some of thesevariables.
18
whether a nation is developed or developing. For example, we find strong links between FX
RSQ and hedging policies even after controlling for all of the factors considered above. We
also consider natural experiments based on the launch of new FX derivative products. These
models also include nation-fixed effects, and hence we rule out the possibility that national
characteristics can explain for our results. It is also worth noting that offshore external input
is negatively correlated with GNP per capita, while offshore internal input is more strongly
negatively correlated with the distance between the U.S. and the foreign nation.
We also note that several correlations between our key variables and other characteris-
tics are of independent interest. The negative (positive) correlation between the external
(internal) input dummy and firm size indicates that relatively small firms are more likely
to participate in external input activities in foreign nations. Firm profitability measured by
operating margin is positively correlated with both types of offshore input activities. Also,
the financial hedging measure is strongly and positively related to both firm size and the
percentage of foreign sales.
5 Operational Hedging vs. Financial Hedging
In this section, we examine the economic link between the efficacy of FX hedging regarding
consumption risk (FX RSQ) and firm use of offshore external input. If the sale of offshore
output generates exposure to consumption risk, firms with overseas sales would have incen-
tives to hedge these activities. If FX derivative instruments are effective as hedges against
consumption risk (not just against currency risk), we would then expect that firms with
offshore output would be more likely to use financial derivative hedging. In contrast, firms
will resort to operational hedging instead if FX derivatives are poor hedges as they face
incomplete financial hedging markets.
5.1 Operational Hedging
[Insert Table 4 Here]
19
Table 4 displays summary statistics regarding offshore input decisions for firms with
varying levels of FX hedging efficacy. One observation is one firm-nation-year based on our
primary sample where offshore output activity is observed. In particular, we form quintiles
by sorting observations on FX RSQ in each year. The mean FX RSQ in the first, third and
fifth quintile is 0.007, 0.629, and 0.929, respectively. These statistics indicate that nations are
highly heterogeneous regarding the comovement between exchange rates and consumption
growth. We also note that roughly 40% of our sample has no offshore input operations de-
spite having offshore output operations. We also note that U.S. firms participate in offshore
internal input operations relatively more than external input operations. Most relevant,
however, we note that the percentage of firms engaged in external input decreases signifi-
cantly as FX RSQ increases. In contrast, the percentage of firms engaged in internal input
increases weakly as FX RSQ increases.
We next consider firm-nation-year panel data regressions where the dependent variable
is one of our text-based measures of offshore input activities. We first consider the offshore
external input dummy. We are particularly interested in examining the link between a firm’s
offshore external input to a nation and the nation’s FX RSQ measure. We control for each
nation’s economic characteristics including GDP, GNP per capita, geographical proximity
to the U.S., and political stability. We do not include nation-fixed effects in all specifications
because our variable of interest FX RSQ is a nation-specific variable. However, we include
nation-fixed effects in the last specification where we examine the interaction between FX
RSQ and the firm’s offshore output focus, which serves to mitigate the concern that our
results can be explained by unobserved national characteristics. We also consider natural
experiments later in this study to fully address this concern. To facilitate the economic
interpretation of the results, we standardize the independent variables so that they have
unit standard deviation in all of our regressions. Firm specific control variables are lagged,
and all specifications include year-fixed effects and standard errors are clustered by nation.
[Insert Table 5 Here]
The results are displayed in Table 5. Columns one to three examine the effect of FX
20
RSQ on firm external offshore input decisions. We consider industry, firm, and both firm
and region fixed effects in addition to year-fixed effects. Columns four and five display speci-
fications that additionally include the interaction term between FX RSQ and the percentage
of offshore output to the given nation. This test is relevant because although all firms in
our sample engage in offshore output (as described earlier), some firms focus more on some
nations relative to others. Hence, the cross term examines whether offshore external input is
more strongly related to the FX RSQ when the extensive margin of offshore output is larger
with the given nation, which is an intuitive prediction that allows us to run our analysis
even with nation-fixed effects. The first three rows of the table show our first main result:
firms are less likely to participate in offshore external input with a given nation when its FX
RSQ is higher. The latter two columns reinforce this conclusion as the cross term is also
negative and highly significant. The economic impact of FX RSQ is comparable to that of
national GDP or GNP per capita. These results support our Hypothesis 2 that the firms
will use operational hedging when the efficacy of financial hedging is poor. Importantly, the
main results are also robust to including nation-fixed effects in column five.
We next consider analogous tests for internal input in Table 6. From our Hypothesis
3, we expect that the link between financial hedging efficacy and external input will not
apply to internal input. In particular, internal input is less likely to be a viable operational
hedge for consumption risk because of the cyclical aspects of the offshore assets that offshore
internal input firms own.
[Insert Table 6 Here]
The results in Table 6 show that the link between FX RSQ and internal input decisions
is negative, but not as pronounced relative to external input decisions. Columns one to
three reveal that the effect for internal input is in fact insignificant, which is consistent with
Hypothesis 3. However, the last two columns show that the interaction between FX RSQ and
the percentage of offshore output to the given nation is significant at the 5-10% level and the
economic magnitudes are comparable to those for external input in Table 5. One potential
explanation for these finding is that some firms engage in both external and internal input
21
activities, and this association might lead the results in Table 6 to partially resemble those in
Table 5. If so, our quasi-natural experiment test should be more discriminating. We indeed
find stronger results in those tests, and we also note later in this section that we also find
stronger substitution evidence in Table 7.
We also note the following results that are of independent interest regarding Table 5 and
Table 6. Both external and internal input decisions are positively related to the size of the
nation, but only external input is significantly and negatively related to GNP per capita. It
is also worth noting that the distance from the U.S. to each nation plays an important role
for internal input decisions. This indicates that firms are more likely to use offshore internal
input in large and nearby nations. In contrast, they are more likely to engage in external
input with counter-party nations that might provide low cost labor and raw materials.
We next further stress test Hypothesis 3 by directly contrasting external input and in-
ternal input decisions.
[Insert Table 7 Here]
The dependent variable in Table 7 is a firm’s relative choice between external and internal
input with each nation. This is computed by taking the ratio of the external input dummy
to the sum of the external input and internal input dummies. This variable is particularly
useful to challenge whether our hedging results are indeed stronger for external input than
they are for internal input, which is not clear given the previous tables. In particular, this
variable offers the opportunity examine whether firms use more external input relative to
internal input when the FX RSQ is low and the value of operational hedging is likely to be
high.
Columns one to three of Table 7 show a strong negative link between the FX RSQ and
the relative external input variable. Although results for the cross term are not significant in
the fourth column, the result is robust in the most stringent test that includes nation-fixed
effects in column five. In all, these results show strong support for our hypothesized negative
link between FX RSQ and external input decisions through the operation hedging channel.
22
5.2 Financial Hedging
The results in the previous section show strong support for the conclusion that firms use
operational hedging when the efficacy of financial hedging against consumption risk is poor.
In this section, we now focus on the related financial hedging decision.
In Table 8, we estimate firm-year panel data regressions (as before, we limit the sample
to firms engaged in offshore output) where the dependent variable is a measure of financial
hedging activity. We note that we use a firm-year panel in this test, which is different
from the firm-nation-year panel in the previous section. This choice is due to the fact that
although we do measure offshore activity nation-by-nation, we do not have adequate data to
separately measure whether firms specifically use FX derivatives to hedge activities in some
nations but not in others.
Columns one and two of Table 8 consider our first measure of financial hedging, the
financial hedging dummy. This variable is one if a firm discloses its use of any types of
currency derivative products including forwards, futures, swaps and options in its 10K for a
given year. Columns three and four consider a broader hedging dummy which includes the
use of FX debt as an additional hedging vehicle for robustness. The dependent variable in
those columns is one if a firm either discloses its use of any types of FX derivative products
or if it issued any FX debt during the 5 years prior to the given year. We only consider this
test as robustness as the literature is not clear regarding whether firms issue foreign debt due
to hedging motives or if they do so to tap a cost of capital (or both).9 The third dependent
variable in columns five and six is the natural logarithm of one plus the raw count of a firm’s
mentions of FX derivatives in its 10K in the given year.
Because the panel data is based on firm-year observations as discussed above, we also
note that any nation-specific independent variables included in the regressions such as FX
9As our baseline, we define financial hedgers as firms that use FX derivatives, as mentioned in their 10-K.Allayannis and Weston (2001) additionally include foreign debt issuers in their definition of hedgers in a testof robust analysis, and find that their results do not change. We follow this convention and examine the roleof foreign debt as a matter of robustness. See Kedia and Mozumdar (2003) for empirical findings regardingthe determinants of foreign debt issuers in detail.
23
RSQ, GDP, GNP per capita, the distance from U.S., and business environment proxies, are
all based on annual firm averages over the nations where a firm has offshore outputs.
[Insert Table 8 Here]
The results are displayed in Table 8. The results are consistent across all specifications
and show that the FX RSQ variable is significantly positively related to FX hedging activity.
These findings strongly support our Hypothesis 1 that firms will use more financial hedging
when currency hedging against consumption risk is more effective. We also note that hedging
decisions are also positively related to firm size, foreign sales as the percentage of total sales,
Cash/Assets, and the average distance to offshoring nations.
Overall, our results broadly support our hypotheses. Firms with offshore output activities
are more (less) likely to use financial hedging using currency derivatives when the efficacy of
financial hedging against consumption risk is superior (poor).
6 Natural Experiments
6.1 Launch of new FX Derivative Products
In this section, we consider natural experiments to explore a potential causal relationship
between hedging efficacy and operational hedging decisions. Our experiments are based
on a series of events where the Chicago Mercantile Exchange (CME) launched new FX
derivative products. These events are well-suited for our refined panel data structure based on
annual firm-nation observations. In particular, only the specific nations associated with the
newly introduced currency derivatives should be affected by the launch of the new products.
Although the majority of FX derivatives are traded over the counter due to the possibility
of contract customization, standardized exchange trades have become popular over time.
The likely reasons for the increasing use of exchange traded derivatives include the very
large contract size used in OTC markets in general, price transparency, lower transaction
costs, and reduced counter-party default risk. Even if corporations primarily trade financial
derivatives using OTC contracts, they should still be affected by the launch of the new CME
24
products through significant spill-over effects through the liquidity and price transparency
channels.10
The shocks to derivative hedging liquidity that these new product launches entail allow
us to test our central hypothesis that the availability of high quality hedging instruments
(complete markets with minimal friction) causes firms to reduce operational hedging in the
form of offshore external input to the same nations where firms sell output. We also note
a more refined prediction: the predicted decrease in operational hedging should only arise
in nations where the FX RSQ is high (i.e., where currency price comoves strongly with a
given nation’s consumption growth). The foundation for this additional prediction is that
improved hedge liquidity will not induce a firm to forgo operational hedging if the derivatives
themselves in the given nation are not effective in hedging consumption risk in the first place.
In two of our new product launch years, 2006 and 2009, our sample contains some treated
nations with high FX RSQ and some with low FX RSQ, which allows us to consider a
separate triple difference-in-difference estimation examining this more refined prediction.
During our sample period, new products are launched in five distinct years: 1999, 2002,
2004, 2006, 2009.11 Our objective is to isolate nation-year new product launch events that
are least contaminated by other major events in the same nations. Hence we carefully review
all of the newly launched product events and discuss whether this exclusion criterion is met.
In all cases, our tests are not contaminated by worldwide events as we are able to control
for year-fixed effects. Because these shocks occur during the middle of our sample, we are
additionally able to include nation-fixed effects and firm-fixed effects in various specifications.
Our quasi-natural experiments thus benefit from being staggered in time series, in cross
section across firms, and in cross section across various nations, a feature that with the
numerous fixed effects helps to rule out the hypothesis that omitted variables might explain
our findings. In particular, we employ a difference-in-difference approach and thus only
consider treatment effects for the nations that are treated in that the CME launched new
derivative products relating to their currencies. Generally, the nations treated with new
10See Dale (1981) for a discussion on the hedging effectiveness of currency futures markets.11Table A.1 shows the complete list of new product launch histories for the CME.
25
product launches have few notable events occurring during the year of treatment with the
exception of 2004. We now discuss each of the launch years.
In 1999, CME started trading EURO FX, E-mini EURO FX, and E-mini Japanese Yen.12
This year was unusual relative to other event years because in January of 1999, the Euro
became a new currency and unified monetary policy was introduced. The 11 treated nations
include Austria, Belgium, Finland, France, Germany, Ireland, Italy, Luxembourg, Nether-
lands, Portugal, and Spain. We also importantly note that the 11 treated nations did not
join the European Union (EU) in this same year.13 Although the creation of the EU occurred
in a different year, the EMU did launch a unified monetary policy in 1999, which might be a
cause for concern. For example, a unified monetary policy might result in changes in the risk
profile of these nations. For this reason, we will interpret results for 1999 with some caution.
However, we include all of the treated nations including the Euro nations in our 1999 test
because the introduction of the new currency (the Euro) is a particularly stark example of a
shock to the efficacy of hedging. More succinctly, one can view the simultaneous launch of
the new currency, alongside the launch of the CME derivative products, to be a single event
that provides US firms with a strong positive shock to hedging efficacy.
Japan is also in the treated group in 1999 as its E-mini contacts started trading in the
same year. The E-mini contract can be traded for a fraction of the value of a normal futures
contracts traded on the CME’s Globex electronic trading platform. E-mini contracts pro-
vide trading advantages, including higher liquidity, tighter spreads, greater affordability for
individual investors due to lower margin requirements, and several tax advantages. Impor-
tant from our perspective is the improved liquidity that they should bring to the Japanese
12The E-mini contract represents a fraction of the value of a normal futures contract traded on theCME’s Globex electronic trading platform. E-micro is also available at the CME which is a futures contractrepresenting an even smaller fraction of the value of the normal futures contracts than the correspondingE-mini. For example, the contract size of Euro FX E-mini and E-micro is 62,500 and 12,500 respectively,while the contract size of a normal futures contract is 125,000.
13These nations joined the European Union (EU) far before they joined the European Monetary Union(EMU). The year that each of the 11 treated nations joined the EU is as follows: Austria (1995), Belgium(1958), Finland (1995), France (1958), Germany (1958), Ireland (1973), Italy (1958), Luxembourg (1958),Netherlands (1958), Portugal (1986), Spain (1986). We note that these dates all precede our sample period,and hence our identification of hedging efficacy through the introduction of the Euro is not contaminated byother economic information associated with the distinct event of joining of the European Union.
26
Yen market as a whole. We consider a robustness test in which we exclude the European
nations in 1999 from our sample (due to potential concerns about the aforementioned mon-
etary policy), which would leave only Japan as a treated nation in 1999. We note that
even in this stark setting based only on Japan, we continue to see statistically significant
evidence consistent with our primary hypothesis that the shock was followed by a reduction
in operational hedging activities, especially external offshore input activities in the treated
nation. We report results for this test using only Japan in 1999 in the Online Appendix to
this paper.
In 2002, the CME started trading contracts on Norwegian Krona and Swedish Krona,
and these two nations are the treated group for the 2002 event. To our knowledge, this
event is particularly free of contamination from other events as we are not aware of other
major events for these two nations at this time. Hence results for our difference-in-difference
test surrounding the 2002 event should be particularly indicative of a causal link between
hedging efficacy and operational hedging through offshore external input.
In 2004, the CME started trading contracts on Czech Koruna, Hungarian Forint and
Polish Zloty. However, this event is problematic because all three countries joined the EU
in the same year. Because the economic impact of accession to the EU is likely greater than
the effect of newly launched CME products, we drop this year from our analysis and do not
consider it further. This decision is further reinforced by the fact that these three nations
were previously relatively inactive regarding foreign trade.
In 2006, the CME started trading contracts on the Chinese Renminbi, Israel Shekel
and Korean Won. The affected nations for 2006 are thus China, Israel, and South Korea.
However, two of these nations (China and Israel) have FX RSQ values that are below 0.1,
indicating that the newly launched derivative products have low efficacy in hedging con-
sumption growth risk even if they are available with minimal transaction costs. Hence we
do not predict any changes in operational hedging for China and Israel. In our primary
test, we therefore only include South Korea as a treated nation. We additionally consider
China and Israel in a final test reported at the end of this section that is based on a triple
27
difference-in-difference specification that allows us to test for differential treatment effects
for nations with high versus low FX RSQ as discussed above.
Lastly, in 2009, the CME began trading E-Micro contracts on the EURO, GBP, AUD,
JPY, CAD, CHF, and Turkish Lira. The 16 EMU member nations are thus affected by this
event as they use the Euro. These nations include the previous 11 initial EMU members
(Austria, Belgium, Finland, France, Germany, Ireland, Italy, Luxembourg, Netherlands,
Portugal, and Spain) and five more nations (Greece, Slovenia, Cyprus, Malta, and Slovak
Republic). Also, the United Kingdom, Australia, Japan, Canada, Switzerland, and Turkey
are also included in the treated group for 2009. Three of these nations (Slovak Republic,
Slovenia, and Turkey) have FX RSQ values that are below 0.1. Hence the newly launched
derivative products for these three nations have low efficacy in hedging consumption growth
risk even if they were freely available. In our primary test, as we did for China and Israel
in 2006, we exclude these three nations from our sample of treated nations, but separately
include them in a later triple differences test.
We use these events to identify the potential causal role of hedging efficacy on the choice
of financial versus operational hedging policy. We compare U.S. firms’ offshore external input
decisions in the treated and control nations before and after each event using a difference-
in-difference framework.
6.2 Difference-in-difference Tests
We consider three sets of difference-in-difference (DD) regressions. Analogous to our tests
in Table 5 to Table 7, we consider the following three dependent variables in turn: external
offshore input dummy, internal offshore input dummy, and relative external versus internal
input. Our first test based on external offshore input is a direct test of operational hedging.
We implement the DD model using a regression framework that includes a post-event dummy,
a treated group dummy, and the post-event dummy interacted with the treated group dummy
as independent variables. We also include a standard set of controls as before. The treated
group dummy is one for nations that were affected by each event described in detail in the
28
previous section. The key variable of interest is the post-event dummy interacted with the
treated group dummy. We expect that the interaction term will have a significant negative
coefficient for each event.
[Insert Table 9 Here]
Table 9 presents the regression results for external input activities. All specifications
include either firm and region or nation fixed effects in addition to year-fixed effects. We
note that including nation-fixed effects is a particularly rigid test that sets a high bar. This
specification rules out potential unobserved nation characteristics as omitted variables.
Throughout columns one to eight except for the 2006 event, we find strong support for the
conclusion that the new product introductions by the CME for the treated nations resulted
in a significant decrease in U.S. firms’ use of operational hedging in the form of offshore
external input activities. The economic interpretation for the estimated coefficients (-0.0147
to -0.0183) of the interaction terms between the post-event dummy and the treated group
dummy implies that the improved FX hedging efficacy for the treated nations decreases
a firm’s likelihood of offshoring external input by roughly 1.5% to 2.0%. These results are
consistent with our hypothesis that improved FX hedging efficacy, through the introductions
of new currency derivative products, led to a decrease in firms’ use of operational hedging.
In particular, firms will more strongly favor financial hedging after the new products are
launched particularly due to their improved liquidity.
We also note that the lack of significance in 2006, where the key cross term is negative
but not significant, is likely due to lower power. The sample of treated nations in 2006 only
includes a single nation, South Korea. Despite this low power, we will note later in this
section that we do see a statistically significant substitution effect toward offshore internal
input and away from offshore external input based on the relative external versus internal
input variable in 2006.
[Insert Table 10 Here]
29
We next consider analogous tests for internal offshore input as the dependent variable in
Table 10. Unlike external offshore input where the prediction of reduced operational hedging
is clear, we note that predictions are ambiguous for internal input (see Tuzel and Zhang
(2013) and Hoberg and Moon (2014)). Internal input bundles the purchase of input with
the ownership of assets. Regarding efficacy as an operational hedge, the ownership of assets
generates exposure and likely reduces hedge efficacy. However, the purchase of input serves
as an operational hedge and improves hedge efficacy. These forces are in opposite directions,
and it is thus an empirical question regarding whether the hedge-effect or the exposure-effect
dominates. The results in Table 10 are somewhat mixed and are thus consistent with the
aforementioned theoretical ambiguity. We find negative and significant coefficients for the
key interaction term for some specifications, but we find a positive and significant effect for
2006.
[Insert Table 11 Here]
We next conduct an additional set of the tests that directly contrasts external and internal
input in Table 11. We use the same dependent variable as in Table 7, which is the relative
external versus internal input, which is computed as the external input dummy divided by
the sum of both the external and internal input dummies. As before, we thus only include
observations where either external or internal input is present, and we thus are assessing
the relative choice between these two activities. Across all specifications in Table 11, we
find that the key interaction term between the treated group and the post-event dummies
(Treated * Post) is negative and significant. These results strongly support the conclusion
that the launch of the new currency derivative products led to a decrease in external input
operations relative to internal input operations. This is consistent with firms substituting
toward internal input operations after the shocks due to reduced need for operational hedging
after the shocks.
30
6.3 Triple Differences
In the previous difference-in-difference tests, we excluded nations with low FX RSQ from
our set of treated nations (this only affected the 2006 and 2009 tests). The objective was
to cleanly examine the impact of shocks to hedging cost for treated nations where the for-
eign exchange derivatives could be attractive as substitutes for operational hedges. As we
discussed above, when FX RSQ is low, this is not the case. In this section, we include the
treated nations in 2006 and 2009 with low FX RSQ and we thus consider a triple difference-
in-difference specification. The objective is to examine our hypothesis that the shift away
from operational hedging toward financial hedging will only occur for treated nations where
FX hedging is effective as a hedge against consumption risk. Hence we expect a significant
differential reaction for high and low FX RSQ treated nations, and the available data in 2006
and 2009 empowers us to consider this more refined prediction.
[Insert Table 12 Here]
In Table 12, we reconsider the tests in Tables 9 to 11 for 2006 and 2009 with one key
change: we introduce a new dummy variable that equals one if the treated nation’s estimated
FX RSQ is greater than the median of all nations in our sample and we also include all of
its three-way interaction terms with the treated group and the post-event dummies. From
the Appendix Table A.2, we note that the treated nations with FX RSQ below the sample
median (0.322) are China and Israel in 2006, and the Slovak Republic, Slovenia and Turkey
in 2009. All of the other treated nations in our sample have FX RSQ that is greater than
the sample median.
Rows 1 to 6, and rows 7 and 12 in Table 12 display the test results for 2006 and 2009,
respectively. For each year, we consider all three dependent variables we considered in Tables
9 to 11 (external input dummy, internal input dummy, and relative external versus internal
input). For each specification, we also consider a model with firm, region and year fixed
effects, and also a model with nation and year fixed effects.
The table first shows that the key triple interaction term is negative regarding the external
31
input dummy for both events. However, they are strongly significant only for the 2006 event.
The triple interaction is negative but is not significant in 2009. The internal input results are
mixed, as the signs for the triple interaction are negative in 2006 and positive in 2009. The
mixed findings for internal input echo our earlier discussions regarding mixed theoretical
predictions for internal input, which bundles asset ownership with the purchase of input.
Perhaps the most powerful test is the direct contrast between external and internal input in
rows 5 and 6, and rows 11 and 12. These results suggest that for both 2006 and 2009, we
find a significant decrease in external input operations relative to internal input operations.
These findings support the conclusion that the introduction of the new currency products
resulted in a decrease in operational hedging activities, but only for the treated nations with
high FX efficacy (high FX RSQ) as a hedge against consumption risk.
Overall, our difference-in-difference results support the conclusion that poor financial
hedge efficacy likely causes substitutions away from financial hedging and toward operational
hedging in the form of offshore external input. These results cast new light on the debate
regarding why some firms do not participate in FX hedging despite the fact that it is relatively
inexpensive.
7 Conclusion
Our paper proposes novel economic hypotheses regarding why many firms with global ac-
tivities do not financially hedge overseas risks despite the stylized fact that it is relatively
inexpensive to do so. Based on recent evidence in Hoberg and Moon (2014) suggesting that
investors demand risk premia when firms sell their output overseas to high consumption risk
nations, we examine in this paper whether operational hedging is a strong substitute for
financial hedging when financial hedging efficacy is poor. Our study also makes the intel-
lectual contribution that the sale of output overseas generates revenues, and revenues are
equal to price times quantity, and hence hedging policies must consider the risk inherent to
both prices and quantities sold. The existing literature focuses primarily on price risk alone,
which can be directly hedged through financial currency derivatives. Quantity risk, on the
32
other hand, is theoretically linked to consumption growth risk in the given nation, and we
show that the efficacy of FX derivatives in hedging this risk varies widely across nations.
Our main hypothesis is that offshore external input (the purchasing input without owning
input producing assets) is a strong operational hedge that firms will consider especially when
FX derivatives are poor hedges against Q risk. The use of external input, in particular,
should hedge both P and Q risk. In contrast, FX derivatives, while always effective against
P risk, may or may not be effective against Q risk depending on the nation in question. We
thus predict and find that the use of external input as an operational hedge should be most
prevalent in nations for which exchange rates do not comove strongly with consumption
growth (as measured using the RSQ of a regression of consumption growth on exchange rate
changes).
We measure U.S. firms’ operational hedging activities for each firm in each year across
all nations using text analysis of firm 10-K discussions of offshore activities. We focus on
firm-nation-year observations associated with observed offshore sales of output. This ensures
that the firms in our sample have hedging motives, and hence we can explore which hedging
tools they use across various nations. We also measure firm financial hedging strategies using
10-K disclosures.
Our findings support the conclusion that a key tension surrounding the decision to hedge
is incomplete hedging markets. We find that firms are more likely to use financial hedging
when the efficacy of currency derivatives as a hedge against consumption risk is higher. In
contrast, they are less likely to use financial hedging, and are more likely to use operational
hedging when the efficacy of financial hedging is poor.
We also consider quasi-natural experiments by identifying a number of new derivative
product launches by the Chicago Mercantile Exchange. These shocks affect many nations
in many different years, allowing us to construct difference-in-difference models that can
strongly control for overall economic trends, unobserved nation characteristics, and that can
focus on changes occurring with respect to treated nations only surrounding the date of
treatment. We find strong results supporting the conclusion that shocks that improve the
33

efficacy of financial hedging cause firms to substitute away from operational hedging (offshore
external input). Our results cast new light on the debate regarding why some firms with
overseas risk exposure do not participate in FX hedging despite the fact that it is relatively
inexpensive to do so.
34
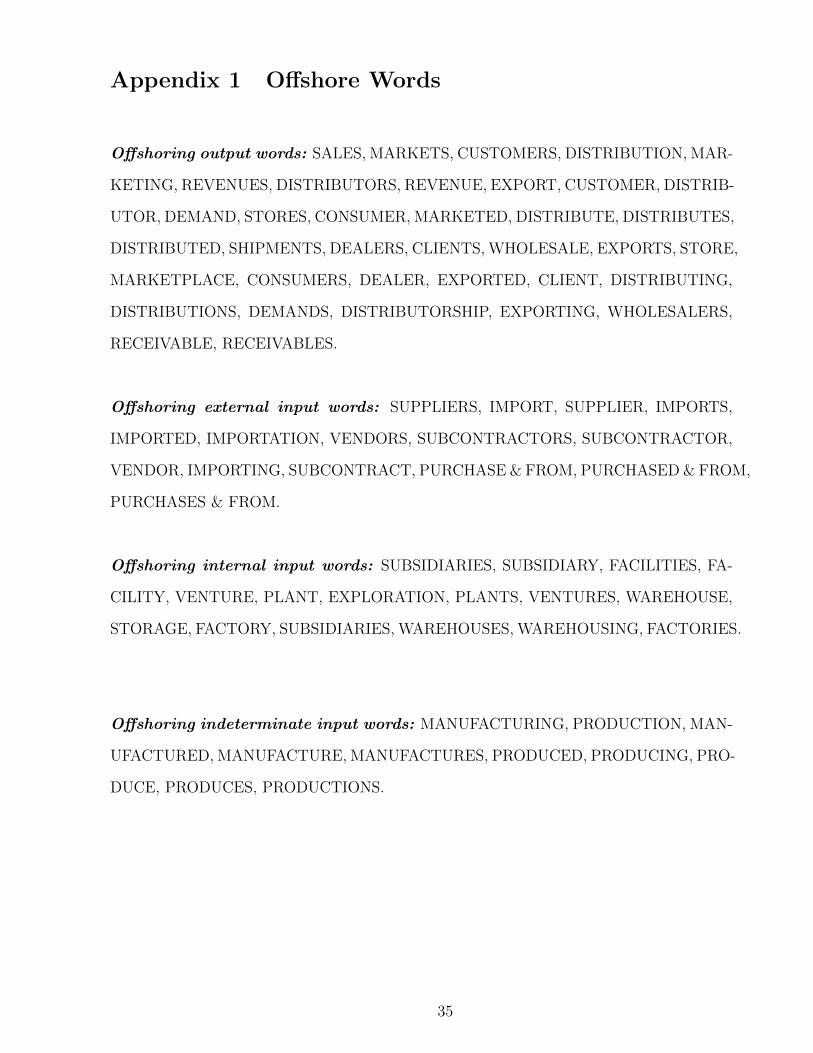
Appendix 1 Offshore Words
Offshoring output words: SALES, MARKETS, CUSTOMERS, DISTRIBUTION, MAR-
KETING, REVENUES, DISTRIBUTORS, REVENUE, EXPORT, CUSTOMER, DISTRIB-
UTOR, DEMAND, STORES, CONSUMER, MARKETED, DISTRIBUTE, DISTRIBUTES,
DISTRIBUTED, SHIPMENTS, DEALERS, CLIENTS, WHOLESALE, EXPORTS, STORE,
MARKETPLACE, CONSUMERS, DEALER, EXPORTED, CLIENT, DISTRIBUTING,
DISTRIBUTIONS, DEMANDS, DISTRIBUTORSHIP, EXPORTING, WHOLESALERS,
RECEIVABLE, RECEIVABLES.
Offshoring external input words: SUPPLIERS, IMPORT, SUPPLIER, IMPORTS,
IMPORTED, IMPORTATION, VENDORS, SUBCONTRACTORS, SUBCONTRACTOR,
VENDOR, IMPORTING, SUBCONTRACT, PURCHASE & FROM, PURCHASED & FROM,
PURCHASES & FROM.
Offshoring internal input words: SUBSIDIARIES, SUBSIDIARY, FACILITIES, FA-
CILITY, VENTURE, PLANT, EXPLORATION, PLANTS, VENTURES, WAREHOUSE,
STORAGE, FACTORY, SUBSIDIARIES, WAREHOUSES, WAREHOUSING, FACTORIES.
Offshoring indeterminate input words: MANUFACTURING, PRODUCTION, MAN-
UFACTURED, MANUFACTURE, MANUFACTURES, PRODUCED, PRODUCING, PRO-
DUCE, PRODUCES, PRODUCTIONS.
35
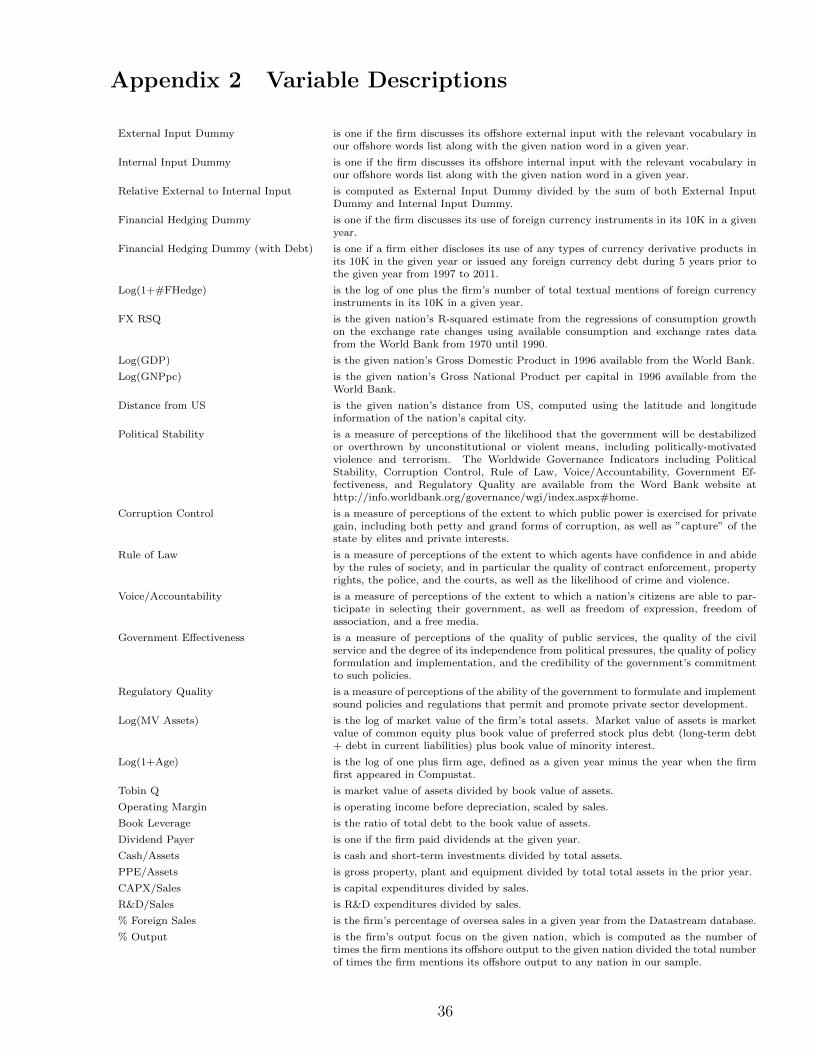
Appendix 2 Variable Descriptions
External Input Dummy is one if the firm discusses its offshore external input with the relevant vocabulary inour offshore words list along with the given nation word in a given year.
Internal Input Dummy is one if the firm discusses its offshore internal input with the relevant vocabulary inour offshore words list along with the given nation word in a given year.
Relative External to Internal Input is computed as External Input Dummy divided by the sum of both External InputDummy and Internal Input Dummy.
Financial Hedging Dummy is one if the firm discusses its use of foreign currency instruments in its 10K in a givenyear.
Financial Hedging Dummy (with Debt) is one if a firm either discloses its use of any types of currency derivative products inits 10K in the given year or issued any foreign currency debt during 5 years prior tothe given year from 1997 to 2011.
Log(1+#FHedge) is the log of one plus the firm’s number of total textual mentions of foreign currencyinstruments in its 10K in a given year.
FX RSQ is the given nation’s R-squared estimate from the regressions of consumption growthon the exchange rate changes using available consumption and exchange rates datafrom the World Bank from 1970 until 1990.
Log(GDP) is the given nation’s Gross Domestic Product in 1996 available from the World Bank.
Log(GNPpc) is the given nation’s Gross National Product per capital in 1996 available from theWorld Bank.
Distance from US is the given nation’s distance from US, computed using the latitude and longitudeinformation of the nation’s capital city.
Political Stability is a measure of perceptions of the likelihood that the government will be destabilizedor overthrown by unconstitutional or violent means, including politically-motivatedviolence and terrorism. The Worldwide Governance Indicators including PoliticalStability, Corruption Control, Rule of Law, Voice/Accountability, Government Ef-fectiveness, and Regulatory Quality are available from the Word Bank website athttp://info.worldbank.org/governance/wgi/index.aspx#home.
Corruption Control is a measure of perceptions of the extent to which public power is exercised for privategain, including both petty and grand forms of corruption, as well as ”capture” of thestate by elites and private interests.
Rule of Law is a measure of perceptions of the extent to which agents have confidence in and abideby the rules of society, and in particular the quality of contract enforcement, propertyrights, the police, and the courts, as well as the likelihood of crime and violence.
Voice/Accountability is a measure of perceptions of the extent to which a nation’s citizens are able to par-ticipate in selecting their government, as well as freedom of expression, freedom ofassociation, and a free media.
Government Effectiveness is a measure of perceptions of the quality of public services, the quality of the civilservice and the degree of its independence from political pressures, the quality of policyformulation and implementation, and the credibility of the government’s commitmentto such policies.
Regulatory Quality is a measure of perceptions of the ability of the government to formulate and implementsound policies and regulations that permit and promote private sector development.
Log(MV Assets) is the log of market value of the firm’s total assets. Market value of assets is marketvalue of common equity plus book value of preferred stock plus debt (long-term debt+ debt in current liabilities) plus book value of minority interest.
Log(1+Age) is the log of one plus firm age, defined as a given year minus the year when the firmfirst appeared in Compustat.
Tobin Q is market value of assets divided by book value of assets.
Operating Margin is operating income before depreciation, scaled by sales.
Book Leverage is the ratio of total debt to the book value of assets.
Dividend Payer is one if the firm paid dividends at the given year.
Cash/Assets is cash and short-term investments divided by total assets.
PPE/Assets is gross property, plant and equipment divided by total total assets in the prior year.
CAPX/Sales is capital expenditures divided by sales.
R&D/Sales is R&D expenditures divided by sales.
% Foreign Sales is the firm’s percentage of oversea sales in a given year from the Datastream database.
% Output is the firm’s output focus on the given nation, which is computed as the number oftimes the firm mentions its offshore output to the given nation divided the total numberof times the firm mentions its offshore output to any nation in our sample.
36
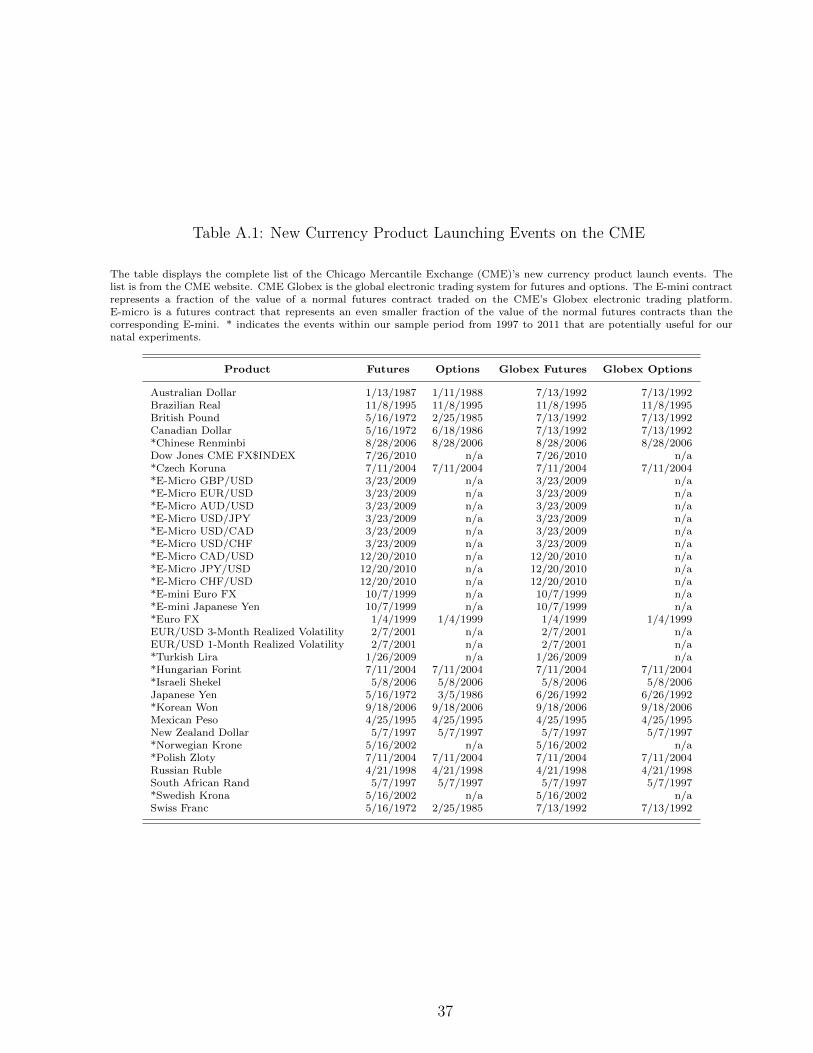
Table A.1: New Currency Product Launching Events on the CME
The table displays the complete list of the Chicago Mercantile Exchange (CME)’s new currency product launch events. Thelist is from the CME website. CME Globex is the global electronic trading system for futures and options. The E-mini contractrepresents a fraction of the value of a normal futures contract traded on the CME’s Globex electronic trading platform.E-micro is a futures contract that represents an even smaller fraction of the value of the normal futures contracts than thecorresponding E-mini. * indicates the events within our sample period from 1997 to 2011 that are potentially useful for ournatal experiments.
Product Futures Options Globex Futures Globex Options
Australian Dollar 1/13/1987 1/11/1988 7/13/1992 7/13/1992Brazilian Real 11/8/1995 11/8/1995 11/8/1995 11/8/1995British Pound 5/16/1972 2/25/1985 7/13/1992 7/13/1992Canadian Dollar 5/16/1972 6/18/1986 7/13/1992 7/13/1992*Chinese Renminbi 8/28/2006 8/28/2006 8/28/2006 8/28/2006Dow Jones CME FX$INDEX 7/26/2010 n/a 7/26/2010 n/a*Czech Koruna 7/11/2004 7/11/2004 7/11/2004 7/11/2004*E-Micro GBP/USD 3/23/2009 n/a 3/23/2009 n/a*E-Micro EUR/USD 3/23/2009 n/a 3/23/2009 n/a*E-Micro AUD/USD 3/23/2009 n/a 3/23/2009 n/a*E-Micro USD/JPY 3/23/2009 n/a 3/23/2009 n/a*E-Micro USD/CAD 3/23/2009 n/a 3/23/2009 n/a*E-Micro USD/CHF 3/23/2009 n/a 3/23/2009 n/a*E-Micro CAD/USD 12/20/2010 n/a 12/20/2010 n/a*E-Micro JPY/USD 12/20/2010 n/a 12/20/2010 n/a*E-Micro CHF/USD 12/20/2010 n/a 12/20/2010 n/a*E-mini Euro FX 10/7/1999 n/a 10/7/1999 n/a*E-mini Japanese Yen 10/7/1999 n/a 10/7/1999 n/a*Euro FX 1/4/1999 1/4/1999 1/4/1999 1/4/1999EUR/USD 3-Month Realized Volatility 2/7/2001 n/a 2/7/2001 n/aEUR/USD 1-Month Realized Volatility 2/7/2001 n/a 2/7/2001 n/a*Turkish Lira 1/26/2009 n/a 1/26/2009 n/a*Hungarian Forint 7/11/2004 7/11/2004 7/11/2004 7/11/2004*Israeli Shekel 5/8/2006 5/8/2006 5/8/2006 5/8/2006Japanese Yen 5/16/1972 3/5/1986 6/26/1992 6/26/1992*Korean Won 9/18/2006 9/18/2006 9/18/2006 9/18/2006Mexican Peso 4/25/1995 4/25/1995 4/25/1995 4/25/1995New Zealand Dollar 5/7/1997 5/7/1997 5/7/1997 5/7/1997*Norwegian Krone 5/16/2002 n/a 5/16/2002 n/a*Polish Zloty 7/11/2004 7/11/2004 7/11/2004 7/11/2004Russian Ruble 4/21/1998 4/21/1998 4/21/1998 4/21/1998South African Rand 5/7/1997 5/7/1997 5/7/1997 5/7/1997*Swedish Krona 5/16/2002 n/a 5/16/2002 n/aSwiss Franc 5/16/1972 2/25/1985 7/13/1992 7/13/1992
37
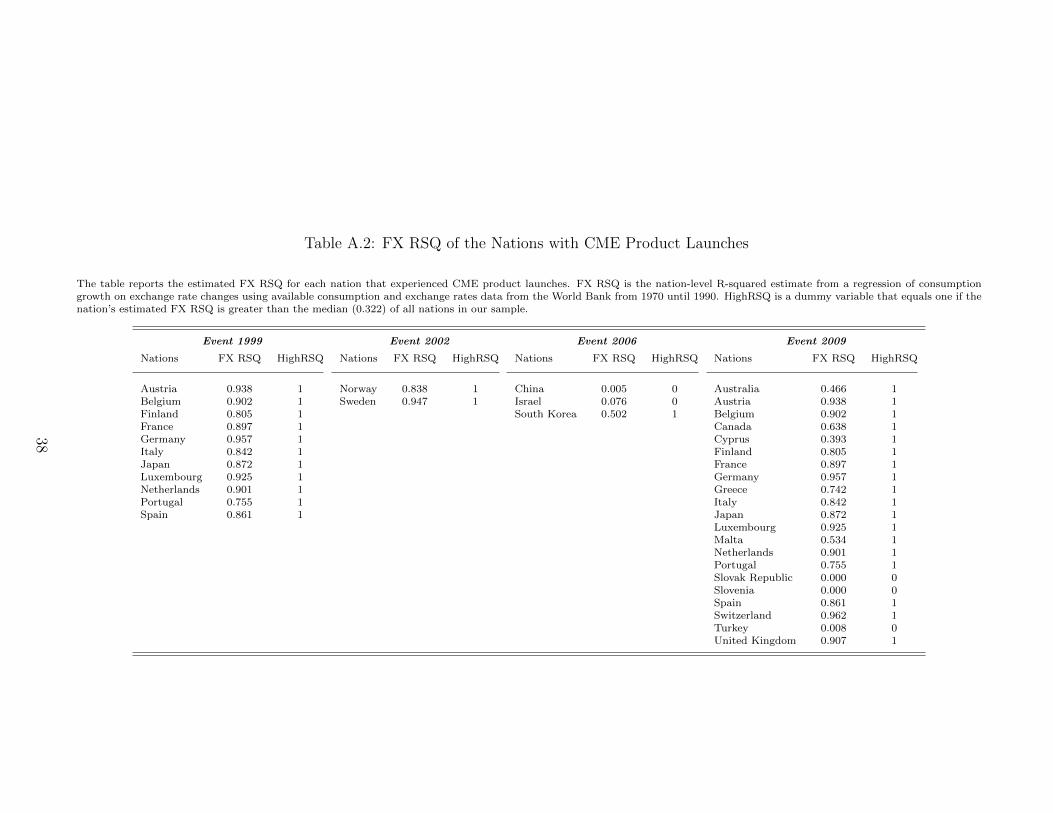
Table A.2: FX RSQ of the Nations with CME Product Launches
The table reports the estimated FX RSQ for each nation that experienced CME product launches. FX RSQ is the nation-level R-squared estimate from a regression of consumptiongrowth on exchange rate changes using available consumption and exchange rates data from the World Bank from 1970 until 1990. HighRSQ is a dummy variable that equals one if thenation’s estimated FX RSQ is greater than the median (0.322) of all nations in our sample.
Event 1999 Event 2002 Event 2006 Event 2009
Nations FX RSQ HighRSQ Nations FX RSQ HighRSQ Nations FX RSQ HighRSQ Nations FX RSQ HighRSQ
Austria 0.938 1 Norway 0.838 1 China 0.005 0 Australia 0.466 1Belgium 0.902 1 Sweden 0.947 1 Israel 0.076 0 Austria 0.938 1Finland 0.805 1 South Korea 0.502 1 Belgium 0.902 1France 0.897 1 Canada 0.638 1Germany 0.957 1 Cyprus 0.393 1Italy 0.842 1 Finland 0.805 1Japan 0.872 1 France 0.897 1Luxembourg 0.925 1 Germany 0.957 1Netherlands 0.901 1 Greece 0.742 1Portugal 0.755 1 Italy 0.842 1Spain 0.861 1 Japan 0.872 1
Luxembourg 0.925 1Malta 0.534 1Netherlands 0.901 1Portugal 0.755 1Slovak Republic 0.000 0Slovenia 0.000 0Spain 0.861 1Switzerland 0.962 1Turkey 0.008 0United Kingdom 0.907 1
38
References
Adler, Michael, and Bernard Dumas, 1983, International portfolio choice and corporation
finance: A synthesis, Journal of Finance 38, 925–984.
Allayannis, George, Jane Ihrig, and James P Weston, 2001, Exchange-rate hedging: Finan-
cial versus operational strategies, American Economic Review pp. 391–395.
Allayannis, George, and Eli Ofek, 2001, Exchange rate exposure, hedging, and the use of
foreign currency derivatives, Journal of international money and finance 20, 273–296.
Allayannis, George, and James P Weston, 2001, The use of foreign currency derivatives and
firm market value, Review of Financial Studies 14, 243–276.
Amihud, Yakov, 1994, Evidence on exchange rates and valuation of equity shares, in Ex-
change Rates and Corporate Performance. (Irwin Professional Publishing.
Antras, Pol, Luis Garicano, and Esteban Rossi-Hansberg, 2006, Offshoring in a Knowledge
Economy, Quarterly Journal of Economics 121, 31–77.
Antweiler, Werner, and Murray Frank, 2004, Is all that talk just noise? the information
content of internet stock message boards, Journal of Finance 52, 1259–1294.
Autor, David, Frank Levy, and Richard J. Murnane, 2003, The Skill Content of Recent
Technological Change: An Empirical Exploration, Quarterly Journal of Economics 118,
1279–1333.
Bartov, Eli, and Gordon M. Bodnar, 1994, Firm valuation, earnings expectations, and the
exchange rate exposure effect, Journal of Finance 49, 1755–1785.
Bekaert, Geert, and Robert J. Hodrick, 2012, International Financial Management (Prentice
Hall).
Bergin, Paul R., Robert C. Feenstra, and Gordon H. Hanson, 2007, Outsourcing and volatil-
ity, NBER Working Paper.
Bernard, Andrew, J. Bradford Jensen, Stephen J. Redding, and Peter K. Schott, 2007, Firms
in international trade, NBER Working Paper.
Bernard, Andrew, J. Bradford Jensen, and Peter K. Schott, 2009, Importers, exporters and
multinationals: a portrait of firms in the US that trade goods, in Producer Dynamics:
New Evidence from Micro Data pp. 513–552. University of Chicago Press.
Brown, Gregory W, 2001, Managing foreign exchange risk with derivatives, Journal of Fi-
nancial Economics 60, 401–448.
39
Dale, Charles, 1981, The Hedging Effectiveness of Currency Futures Markets, The Journal
of Futures Markets 1, 77–88.
DeMarzo, Peter M, and Darrell Duffie, 1995, Corporate incentives for hedging and hedge
accounting, Review of Financial Studies 8, 743–771.
Dumas, Bernard, and Bruno Solnik, 1995, The world price of foreign exchange risk, Journal
of Finance 82, 445–479.
Feenstra, Robert C., and Gordon H. Hanson, 1999, The impact of outsourcing and high-
technology capital on wages: Estimates for the U.S., 1972-1990, Quarterly Journal of
Economics 114, 907–940.
Froot, Kenneth A, David S Scharfstein, and Jeremy C Stein, 1993, Risk managements coor-
dinating corporate investment and financing policies, Journal of Finance 48, 1629–1658.
Garcia, Diego, and Oyvind Norli, 2012, Geographic dispersion and stock returns, Journal of
Financial Economics 106, 547–565.
Geczy, Christopher, Bernadette A Minton, and Catherine Schrand, 1997, Why firms use
currency derivatives, Journal of Finance 52, 1323–1354.
Graham, John R, and Daniel A Rogers, 2002, Do firms hedge in response to tax incentives?,
Journal of Finance 57, 815–839.
Grossman, Gene M., and Esteban Rossi-Hansberg, 2008, Trading Tasks: A Simple Theory
of Offshoring, American Economic Review 98, 1978–1997.
Hanley, Kathleen, and Gerard Hoberg, 2010, The information content of IPO prospectuses,
Review of Financial Studies 23, 2821–2864.
Haushalter, G David, 2000, Financing policy, basis risk, and corporate hedging: Evidence
from oil and gas producers, Journal of Finance 55, 107–152.
Helpman, Elhanan, 2006, Trade, FDI, and The Organization Of Firms, Journal of Economic
Literature 44, 589–630.
Hoberg, Gerard, and Katie Moon, 2014, Offshore activities and global consumption risk,
Working Paper, University of Maryland.
Hoberg, Gerard, and Gordon Phillips, 2010a, Text-based network industry classifications
and endogenous product differentiation, University of Maryland Working Paper.
Jorion, Philippe, 1990, The exchange-rate exposure of US multinationals, Journal of Business
63, 331–345.
40
Kedia, Simi, and Abon Mozumdar, 2003, Foreign currency–denominated debt: An empirical
examination*, The Journal of Business 76, 521–546.
Kim, Young Sang, Ike Mathur, and Jouahn Nam, 2006, Is operational hedging a substitute
for or a complement to financial hedging?, Journal of Corporate Finance 12, 834–853.
Kotabe, Masaaki, 1990, The relationship between offshore sourcing and innovativeness of
U.S. multinational firms: An empirical investigation, Journal of Business Studies 21,
623638.
, and Janet Y. Murray, 1999, Sourcing strategies of U.S. service companies: a modified
transaction cost analysis, Strategic Management Journal 20, 791809.
Lopez de Silanes, Florencio, Rafael La Porta, Andrei Shleifer, and Robert Vishny, 1998, Law
and finance, Journal of Political Economy 106, 1113–1155.
Loughran, Tim, and Bill McDonald, 2011, When is a liability not a liability? Textual
analysis, dictionaries, and 10-Ks, Journal of Finance 66, 35–65.
Moon, S. Katie, and Gordon Phillips, 2013, Outsourcing Supply Contracts, Human Capital
and Firm Financing Decisions, Working Paper.
Pantzalis, Christos, Betty J Simkins, and Paul A Laux, 2001, Operational hedges and the
foreign exchange exposure of us multinational corporations, Journal of International Busi-
ness Studies 32, 793–812.
Sebastiani, Fabrizio, 2002, Machine learning in automated text categorization, ACMCS 34,
1–47.
Smith, Clifford W, and Rene M Stulz, 1985, The determinants of firms’ hedging policies,
Journal of Financial and Quantitative Analysis 20, 391–405.
Solnik, Bruno, 1974, An Equilibrium Model of the International Capital Market, Journal of
Economic Theory 8, 500–524.
, 1977, Testing international asset pricing: Some pessimistic views, Journal of Fi-
nance 32, 503–512.
Spencer, Barbara J., 2005, International Outsourcing And Incomplete Contracts, Canadian
Journal of Economics 38, 1107–1135.
Stulz, Ren, 1981, A model of international asset pricing, Journal of Financial Economics 9,
383–406.
Tetlock, Paul C., 2007, Giving content to investor sentiment: The role of media in the stock
market, Journal of Finance 62, 1139–1168.
41

Tuzel, Selale, and Miao Zhang, 2013, Local Risk, Local Factors, and Asset Prices, Working
Paper.
Wong, M.H. Franco, 2000, The association between sfas no. 119 derivatives disclosures and
the foreign exchange risk exposure of manufacturing firms, Journal of Accounting Research
38.
42
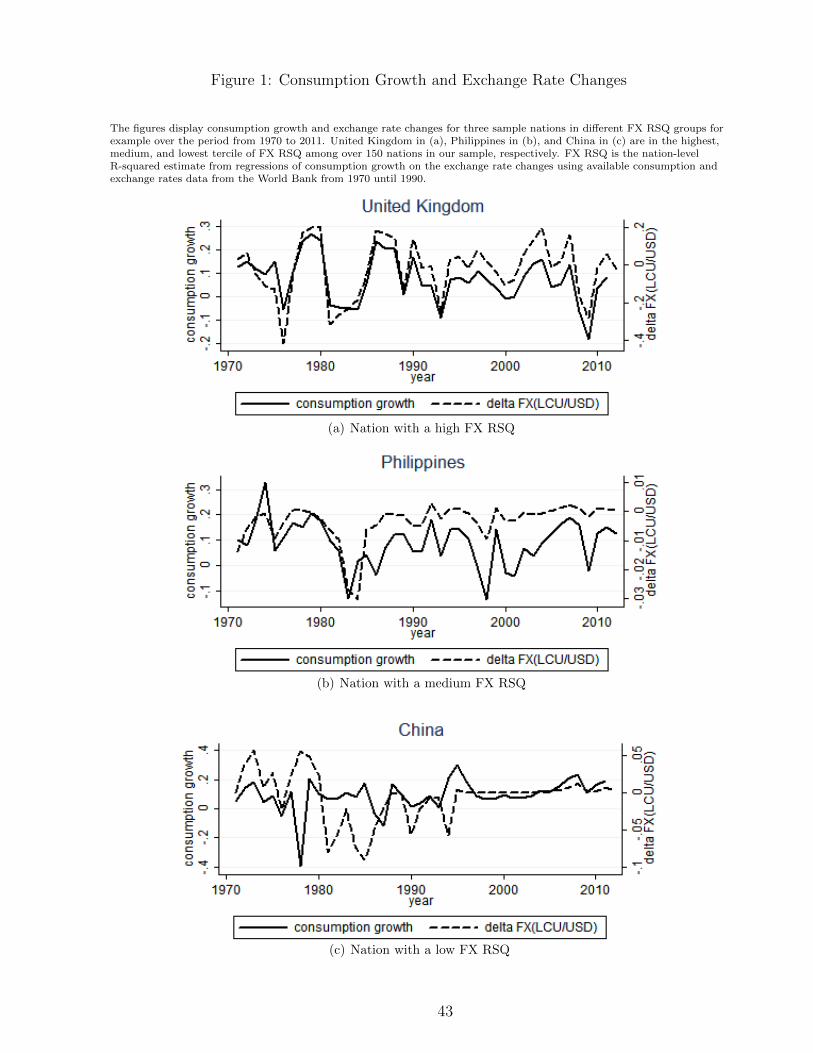
Figure 1: Consumption Growth and Exchange Rate Changes
The figures display consumption growth and exchange rate changes for three sample nations in different FX RSQ groups forexample over the period from 1970 to 2011. United Kingdom in (a), Philippines in (b), and China in (c) are in the highest,medium, and lowest tercile of FX RSQ among over 150 nations in our sample, respectively. FX RSQ is the nation-levelR-squared estimate from regressions of consumption growth on the exchange rate changes using available consumption andexchange rates data from the World Bank from 1970 until 1990.
(a) Nation with a high FX RSQ
(b) Nation with a medium FX RSQ
(c) Nation with a low FX RSQ
43
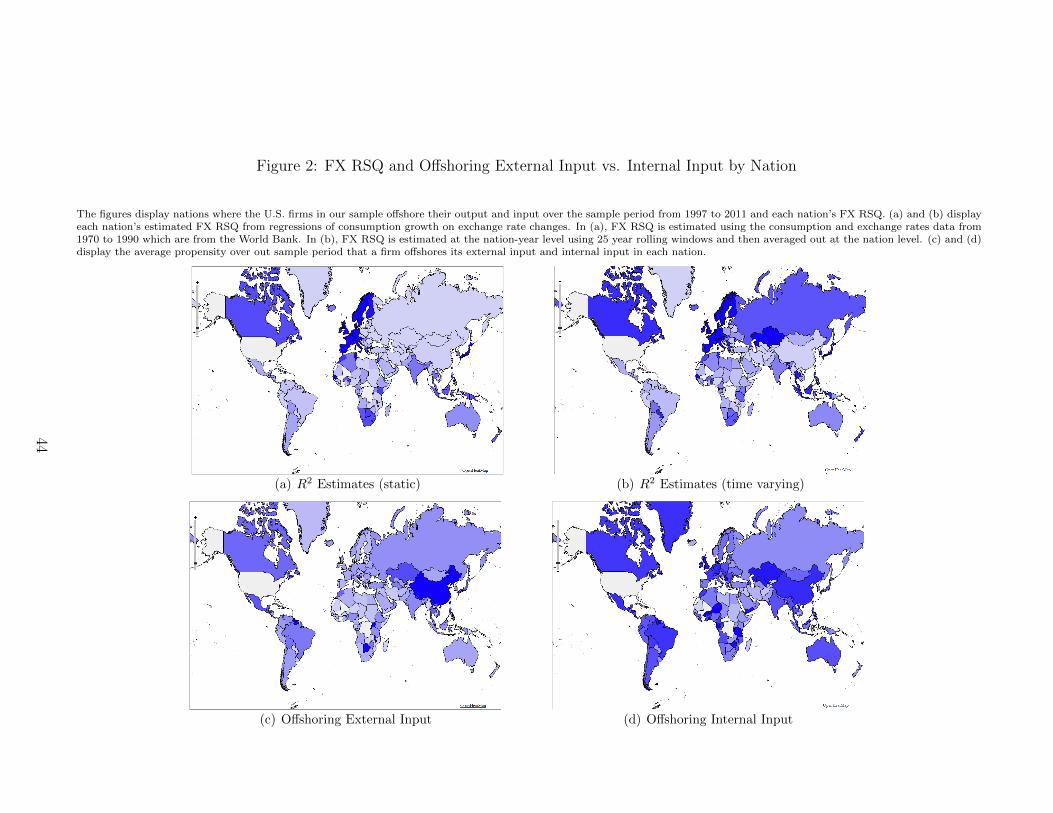
Figure 2: FX RSQ and Offshoring External Input vs. Internal Input by Nation
The figures display nations where the U.S. firms in our sample offshore their output and input over the sample period from 1997 to 2011 and each nation’s FX RSQ. (a) and (b) displayeach nation’s estimated FX RSQ from regressions of consumption growth on exchange rate changes. In (a), FX RSQ is estimated using the consumption and exchange rates data from1970 to 1990 which are from the World Bank. In (b), FX RSQ is estimated at the nation-year level using 25 year rolling windows and then averaged out at the nation level. (c) and (d)display the average propensity over out sample period that a firm offshores its external input and internal input in each nation.
(a) R2 Estimates (static) (b) R2 Estimates (time varying)
(c) Offshoring External Input (d) Offshoring Internal Input
44
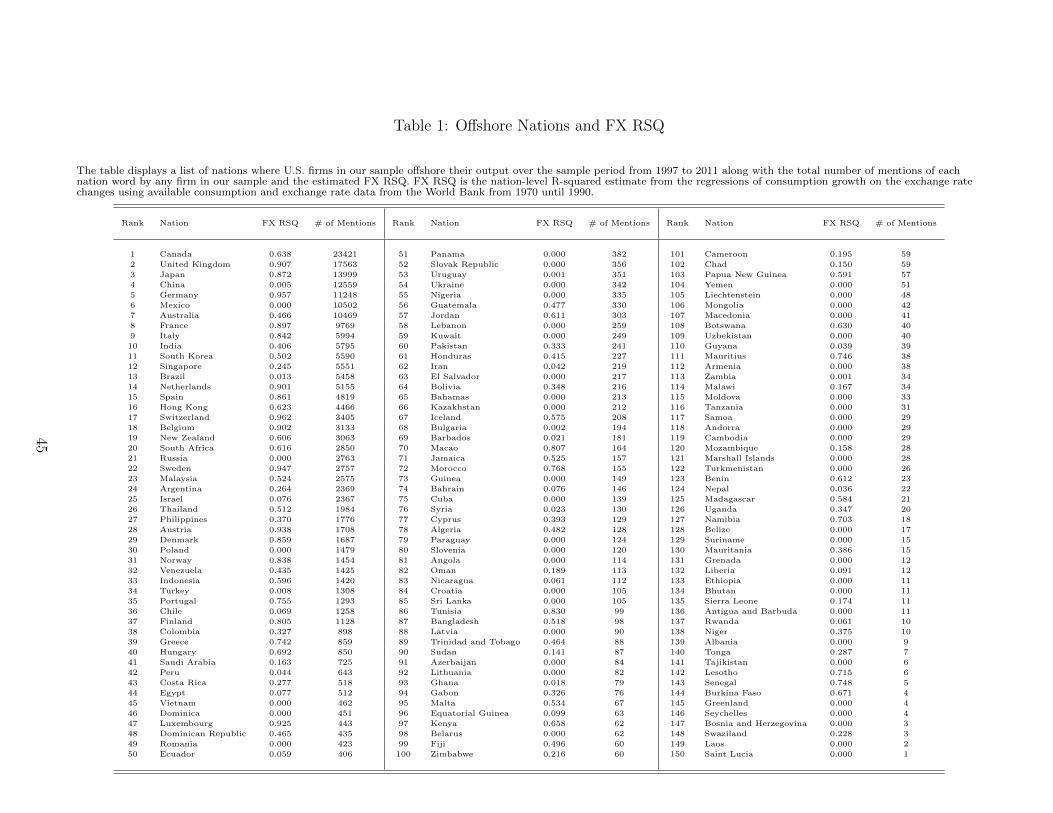
Table 1: Offshore Nations and FX RSQ
The table displays a list of nations where U.S. firms in our sample offshore their output over the sample period from 1997 to 2011 along with the total number of mentions of eachnation word by any firm in our sample and the estimated FX RSQ. FX RSQ is the nation-level R-squared estimate from the regressions of consumption growth on the exchange ratechanges using available consumption and exchange rate data from the World Bank from 1970 until 1990.
Rank Nation FX RSQ # of Mentions Rank Nation FX RSQ # of Mentions Rank Nation FX RSQ # of Mentions
1 Canada 0.638 23421 51 Panama 0.000 382 101 Cameroon 0.195 59
2 United Kingdom 0.907 17563 52 Slovak Republic 0.000 356 102 Chad 0.150 59
3 Japan 0.872 13999 53 Uruguay 0.001 351 103 Papua New Guinea 0.591 57
4 China 0.005 12559 54 Ukraine 0.000 342 104 Yemen 0.000 51
5 Germany 0.957 11248 55 Nigeria 0.000 335 105 Liechtenstein 0.000 48
6 Mexico 0.000 10502 56 Guatemala 0.477 330 106 Mongolia 0.000 42
7 Australia 0.466 10469 57 Jordan 0.611 303 107 Macedonia 0.000 41
8 France 0.897 9769 58 Lebanon 0.000 259 108 Botswana 0.630 40
9 Italy 0.842 5994 59 Kuwait 0.000 249 109 Uzbekistan 0.000 40
10 India 0.406 5795 60 Pakistan 0.333 241 110 Guyana 0.039 39
11 South Korea 0.502 5590 61 Honduras 0.415 227 111 Mauritius 0.746 38
12 Singapore 0.245 5551 62 Iran 0.042 219 112 Armenia 0.000 38
13 Brazil 0.013 5458 63 El Salvador 0.000 217 113 Zambia 0.001 34
14 Netherlands 0.901 5155 64 Bolivia 0.348 216 114 Malawi 0.167 34
15 Spain 0.861 4819 65 Bahamas 0.000 213 115 Moldova 0.000 33
16 Hong Kong 0.623 4466 66 Kazakhstan 0.000 212 116 Tanzania 0.000 31
17 Switzerland 0.962 3405 67 Iceland 0.575 208 117 Samoa 0.000 29
18 Belgium 0.902 3133 68 Bulgaria 0.002 194 118 Andorra 0.000 29
19 New Zealand 0.606 3063 69 Barbados 0.021 181 119 Cambodia 0.000 29
20 South Africa 0.616 2850 70 Macao 0.807 164 120 Mozambique 0.158 28
21 Russia 0.000 2763 71 Jamaica 0.525 157 121 Marshall Islands 0.000 28
22 Sweden 0.947 2757 72 Morocco 0.768 155 122 Turkmenistan 0.000 26
23 Malaysia 0.524 2575 73 Guinea 0.000 149 123 Benin 0.612 23
24 Argentina 0.264 2369 74 Bahrain 0.076 146 124 Nepal 0.036 22
25 Israel 0.076 2367 75 Cuba 0.000 139 125 Madagascar 0.584 21
26 Thailand 0.512 1984 76 Syria 0.023 130 126 Uganda 0.347 20
27 Philippines 0.370 1776 77 Cyprus 0.393 129 127 Namibia 0.703 18
28 Austria 0.938 1708 78 Algeria 0.482 128 128 Belize 0.000 17
29 Denmark 0.859 1687 79 Paraguay 0.000 124 129 Suriname 0.000 15
30 Poland 0.000 1479 80 Slovenia 0.000 120 130 Mauritania 0.386 15
31 Norway 0.838 1454 81 Angola 0.000 114 131 Grenada 0.000 12
32 Venezuela 0.435 1425 82 Oman 0.189 113 132 Liberia 0.091 12
33 Indonesia 0.596 1420 83 Nicaragua 0.061 112 133 Ethiopia 0.000 11
34 Turkey 0.008 1308 84 Croatia 0.000 105 134 Bhutan 0.000 11
35 Portugal 0.755 1293 85 Sri Lanka 0.000 105 135 Sierra Leone 0.174 11
36 Chile 0.069 1258 86 Tunisia 0.830 99 136 Antigua and Barbuda 0.000 11
37 Finland 0.805 1128 87 Bangladesh 0.518 98 137 Rwanda 0.061 10
38 Colombia 0.327 898 88 Latvia 0.000 90 138 Niger 0.375 10
39 Greece 0.742 859 89 Trinidad and Tobago 0.464 88 139 Albania 0.000 9
40 Hungary 0.692 850 90 Sudan 0.141 87 140 Tonga 0.287 7
41 Saudi Arabia 0.163 725 91 Azerbaijan 0.000 84 141 Tajikistan 0.000 6
42 Peru 0.044 643 92 Lithuania 0.000 82 142 Lesotho 0.715 6
43 Costa Rica 0.277 518 93 Ghana 0.018 79 143 Senegal 0.748 5
44 Egypt 0.077 512 94 Gabon 0.326 76 144 Burkina Faso 0.671 4
45 Vietnam 0.000 462 95 Malta 0.534 67 145 Greenland 0.000 4
46 Dominica 0.000 451 96 Equatorial Guinea 0.099 63 146 Seychelles 0.000 4
47 Luxembourg 0.925 443 97 Kenya 0.658 62 147 Bosnia and Herzegovina 0.000 3
48 Dominican Republic 0.465 435 98 Belarus 0.000 62 148 Swaziland 0.228 3
49 Romania 0.000 423 99 Fiji 0.496 60 149 Laos 0.000 2
50 Ecuador 0.059 406 100 Zimbabwe 0.216 60 150 Saint Lucia 0.000 1
45
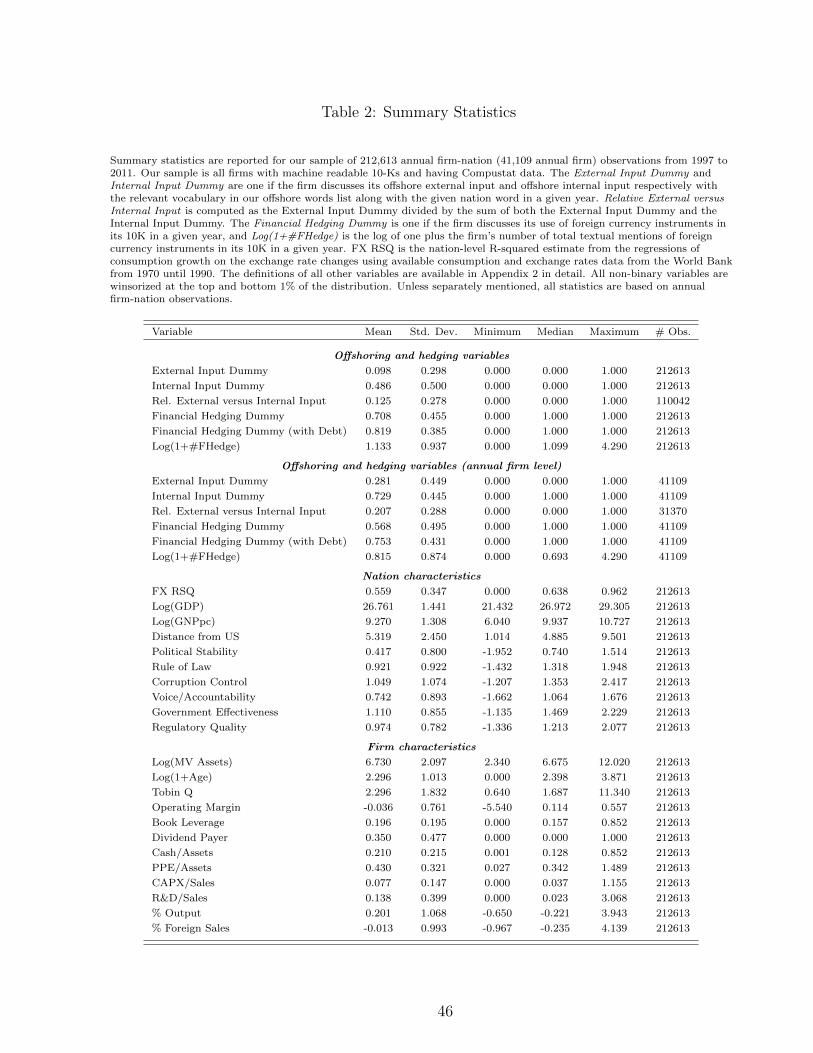
Table 2: Summary Statistics
Summary statistics are reported for our sample of 212,613 annual firm-nation (41,109 annual firm) observations from 1997 to2011. Our sample is all firms with machine readable 10-Ks and having Compustat data. The External Input Dummy andInternal Input Dummy are one if the firm discusses its offshore external input and offshore internal input respectively withthe relevant vocabulary in our offshore words list along with the given nation word in a given year. Relative External versusInternal Input is computed as the External Input Dummy divided by the sum of both the External Input Dummy and theInternal Input Dummy. The Financial Hedging Dummy is one if the firm discusses its use of foreign currency instruments inits 10K in a given year, and Log(1+#FHedge) is the log of one plus the firm’s number of total textual mentions of foreigncurrency instruments in its 10K in a given year. FX RSQ is the nation-level R-squared estimate from the regressions ofconsumption growth on the exchange rate changes using available consumption and exchange rates data from the World Bankfrom 1970 until 1990. The definitions of all other variables are available in Appendix 2 in detail. All non-binary variables arewinsorized at the top and bottom 1% of the distribution. Unless separately mentioned, all statistics are based on annualfirm-nation observations.
Variable Mean Std. Dev. Minimum Median Maximum # Obs.
Offshoring and hedging variables
External Input Dummy 0.098 0.298 0.000 0.000 1.000 212613
Internal Input Dummy 0.486 0.500 0.000 0.000 1.000 212613
Rel. External versus Internal Input 0.125 0.278 0.000 0.000 1.000 110042
Financial Hedging Dummy 0.708 0.455 0.000 1.000 1.000 212613
Financial Hedging Dummy (with Debt) 0.819 0.385 0.000 1.000 1.000 212613
Log(1+#FHedge) 1.133 0.937 0.000 1.099 4.290 212613
Offshoring and hedging variables (annual firm level)
External Input Dummy 0.281 0.449 0.000 0.000 1.000 41109
Internal Input Dummy 0.729 0.445 0.000 1.000 1.000 41109
Rel. External versus Internal Input 0.207 0.288 0.000 0.000 1.000 31370
Financial Hedging Dummy 0.568 0.495 0.000 1.000 1.000 41109
Financial Hedging Dummy (with Debt) 0.753 0.431 0.000 1.000 1.000 41109
Log(1+#FHedge) 0.815 0.874 0.000 0.693 4.290 41109
Nation characteristics
FX RSQ 0.559 0.347 0.000 0.638 0.962 212613
Log(GDP) 26.761 1.441 21.432 26.972 29.305 212613
Log(GNPpc) 9.270 1.308 6.040 9.937 10.727 212613
Distance from US 5.319 2.450 1.014 4.885 9.501 212613
Political Stability 0.417 0.800 -1.952 0.740 1.514 212613
Rule of Law 0.921 0.922 -1.432 1.318 1.948 212613
Corruption Control 1.049 1.074 -1.207 1.353 2.417 212613
Voice/Accountability 0.742 0.893 -1.662 1.064 1.676 212613
Government Effectiveness 1.110 0.855 -1.135 1.469 2.229 212613
Regulatory Quality 0.974 0.782 -1.336 1.213 2.077 212613
Firm characteristics
Log(MV Assets) 6.730 2.097 2.340 6.675 12.020 212613
Log(1+Age) 2.296 1.013 0.000 2.398 3.871 212613
Tobin Q 2.296 1.832 0.640 1.687 11.340 212613
Operating Margin -0.036 0.761 -5.540 0.114 0.557 212613
Book Leverage 0.196 0.195 0.000 0.157 0.852 212613
Dividend Payer 0.350 0.477 0.000 0.000 1.000 212613
Cash/Assets 0.210 0.215 0.001 0.128 0.852 212613
PPE/Assets 0.430 0.321 0.027 0.342 1.489 212613
CAPX/Sales 0.077 0.147 0.000 0.037 1.155 212613
R&D/Sales 0.138 0.399 0.000 0.023 3.068 212613
% Output 0.201 1.068 -0.650 -0.221 3.943 212613
% Foreign Sales -0.013 0.993 -0.967 -0.235 4.139 212613
46
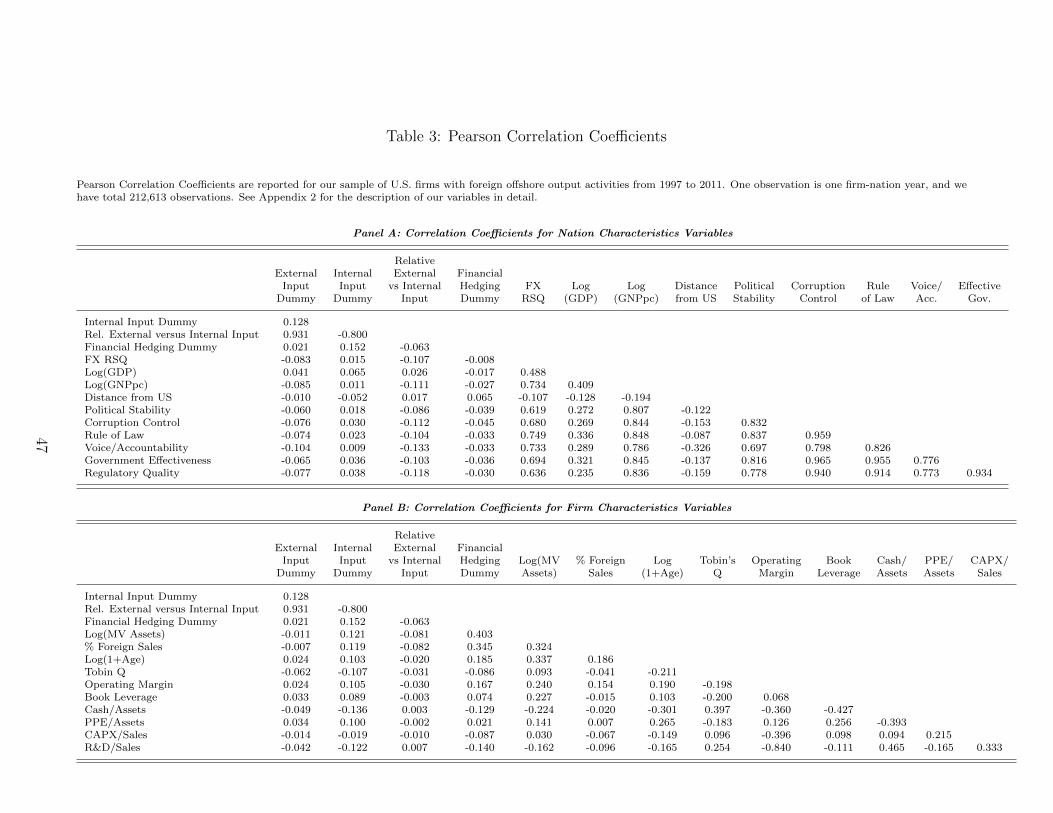
Table 3: Pearson Correlation Coefficients
Pearson Correlation Coefficients are reported for our sample of U.S. firms with foreign offshore output activities from 1997 to 2011. One observation is one firm-nation year, and wehave total 212,613 observations. See Appendix 2 for the description of our variables in detail.
Panel A: Correlation Coefficients for Nation Characteristics Variables
RelativeExternal Internal External Financial
Input Input vs Internal Hedging FX Log Log Distance Political Corruption Rule Voice/ EffectiveDummy Dummy Input Dummy RSQ (GDP) (GNPpc) from US Stability Control of Law Acc. Gov.
Internal Input Dummy 0.128Rel. External versus Internal Input 0.931 -0.800Financial Hedging Dummy 0.021 0.152 -0.063FX RSQ -0.083 0.015 -0.107 -0.008Log(GDP) 0.041 0.065 0.026 -0.017 0.488Log(GNPpc) -0.085 0.011 -0.111 -0.027 0.734 0.409Distance from US -0.010 -0.052 0.017 0.065 -0.107 -0.128 -0.194Political Stability -0.060 0.018 -0.086 -0.039 0.619 0.272 0.807 -0.122Corruption Control -0.076 0.030 -0.112 -0.045 0.680 0.269 0.844 -0.153 0.832Rule of Law -0.074 0.023 -0.104 -0.033 0.749 0.336 0.848 -0.087 0.837 0.959Voice/Accountability -0.104 0.009 -0.133 -0.033 0.733 0.289 0.786 -0.326 0.697 0.798 0.826Government Effectiveness -0.065 0.036 -0.103 -0.036 0.694 0.321 0.845 -0.137 0.816 0.965 0.955 0.776Regulatory Quality -0.077 0.038 -0.118 -0.030 0.636 0.235 0.836 -0.159 0.778 0.940 0.914 0.773 0.934
Panel B: Correlation Coefficients for Firm Characteristics Variables
RelativeExternal Internal External Financial
Input Input vs Internal Hedging Log(MV % Foreign Log Tobin’s Operating Book Cash/ PPE/ CAPX/Dummy Dummy Input Dummy Assets) Sales (1+Age) Q Margin Leverage Assets Assets Sales
Internal Input Dummy 0.128Rel. External versus Internal Input 0.931 -0.800Financial Hedging Dummy 0.021 0.152 -0.063Log(MV Assets) -0.011 0.121 -0.081 0.403% Foreign Sales -0.007 0.119 -0.082 0.345 0.324Log(1+Age) 0.024 0.103 -0.020 0.185 0.337 0.186Tobin Q -0.062 -0.107 -0.031 -0.086 0.093 -0.041 -0.211Operating Margin 0.024 0.105 -0.030 0.167 0.240 0.154 0.190 -0.198Book Leverage 0.033 0.089 -0.003 0.074 0.227 -0.015 0.103 -0.200 0.068Cash/Assets -0.049 -0.136 0.003 -0.129 -0.224 -0.020 -0.301 0.397 -0.360 -0.427PPE/Assets 0.034 0.100 -0.002 0.021 0.141 0.007 0.265 -0.183 0.126 0.256 -0.393CAPX/Sales -0.014 -0.019 -0.010 -0.087 0.030 -0.067 -0.149 0.096 -0.396 0.098 0.094 0.215R&D/Sales -0.042 -0.122 0.007 -0.140 -0.162 -0.096 -0.165 0.254 -0.840 -0.111 0.465 -0.165 0.333
47
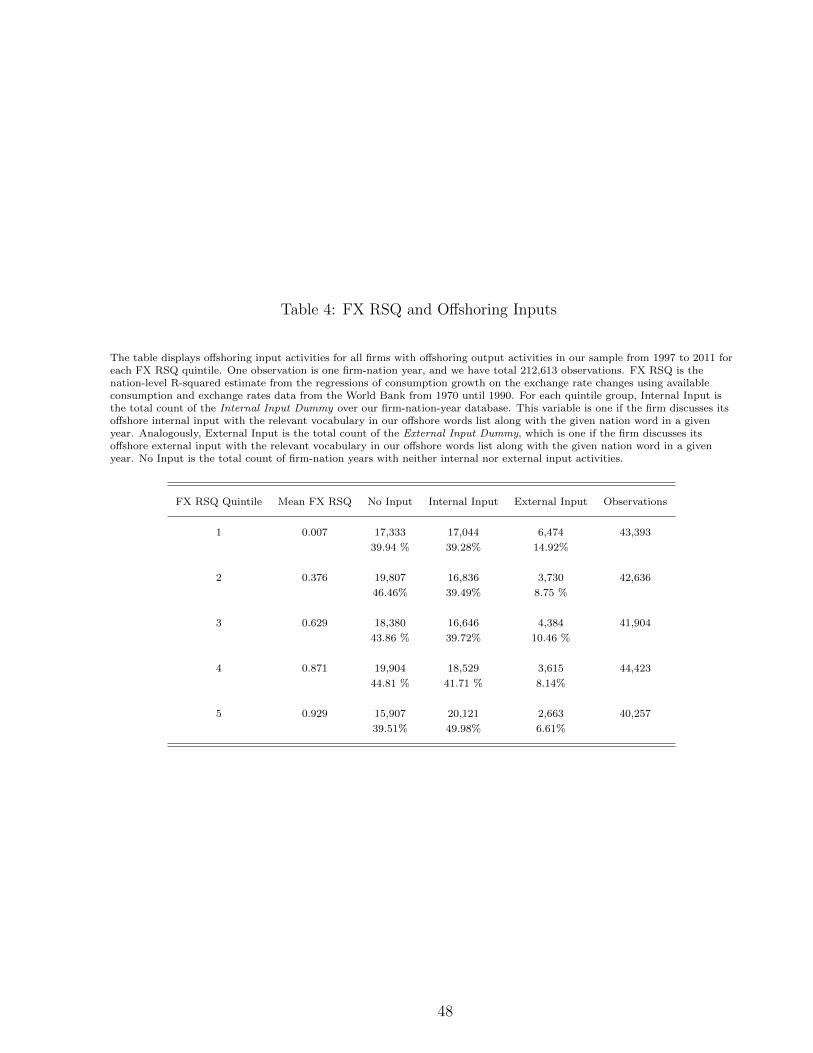
Table 4: FX RSQ and Offshoring Inputs
The table displays offshoring input activities for all firms with offshoring output activities in our sample from 1997 to 2011 foreach FX RSQ quintile. One observation is one firm-nation year, and we have total 212,613 observations. FX RSQ is thenation-level R-squared estimate from the regressions of consumption growth on the exchange rate changes using availableconsumption and exchange rates data from the World Bank from 1970 until 1990. For each quintile group, Internal Input isthe total count of the Internal Input Dummy over our firm-nation-year database. This variable is one if the firm discusses itsoffshore internal input with the relevant vocabulary in our offshore words list along with the given nation word in a givenyear. Analogously, External Input is the total count of the External Input Dummy, which is one if the firm discusses itsoffshore external input with the relevant vocabulary in our offshore words list along with the given nation word in a givenyear. No Input is the total count of firm-nation years with neither internal nor external input activities.
FX RSQ Quintile Mean FX RSQ No Input Internal Input External Input Observations
1 0.007 17,333 17,044 6,474 43,393
39.94 % 39.28% 14.92%
2 0.376 19,807 16,836 3,730 42,636
46.46% 39.49% 8.75 %
3 0.629 18,380 16,646 4,384 41,904
43.86 % 39.72% 10.46 %
4 0.871 19,904 18,529 3,615 44,423
44.81 % 41.71 % 8.14%
5 0.929 15,907 20,121 2,663 40,257
39.51% 49.98% 6.61%
48
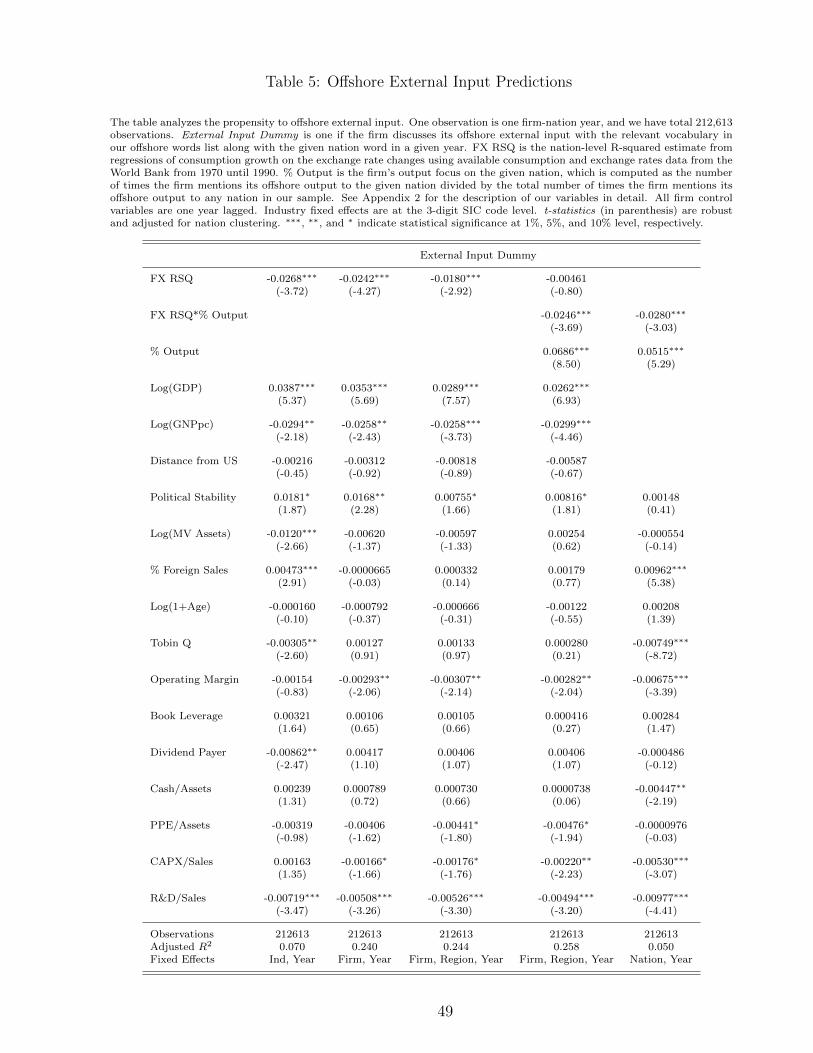
Table 5: Offshore External Input Predictions
The table analyzes the propensity to offshore external input. One observation is one firm-nation year, and we have total 212,613observations. External Input Dummy is one if the firm discusses its offshore external input with the relevant vocabulary inour offshore words list along with the given nation word in a given year. FX RSQ is the nation-level R-squared estimate fromregressions of consumption growth on the exchange rate changes using available consumption and exchange rates data from theWorld Bank from 1970 until 1990. % Output is the firm’s output focus on the given nation, which is computed as the numberof times the firm mentions its offshore output to the given nation divided by the total number of times the firm mentions itsoffshore output to any nation in our sample. See Appendix 2 for the description of our variables in detail. All firm controlvariables are one year lagged. Industry fixed effects are at the 3-digit SIC code level. t-statistics (in parenthesis) are robustand adjusted for nation clustering. ∗∗∗, ∗∗, and ∗ indicate statistical significance at 1%, 5%, and 10% level, respectively.
External Input Dummy
FX RSQ -0.0268∗∗∗ -0.0242∗∗∗ -0.0180∗∗∗ -0.00461(-3.72) (-4.27) (-2.92) (-0.80)
FX RSQ*% Output -0.0246∗∗∗ -0.0280∗∗∗
(-3.69) (-3.03)
% Output 0.0686∗∗∗ 0.0515∗∗∗
(8.50) (5.29)
Log(GDP) 0.0387∗∗∗ 0.0353∗∗∗ 0.0289∗∗∗ 0.0262∗∗∗
(5.37) (5.69) (7.57) (6.93)
Log(GNPpc) -0.0294∗∗ -0.0258∗∗ -0.0258∗∗∗ -0.0299∗∗∗
(-2.18) (-2.43) (-3.73) (-4.46)
Distance from US -0.00216 -0.00312 -0.00818 -0.00587(-0.45) (-0.92) (-0.89) (-0.67)
Political Stability 0.0181∗ 0.0168∗∗ 0.00755∗ 0.00816∗ 0.00148(1.87) (2.28) (1.66) (1.81) (0.41)
Log(MV Assets) -0.0120∗∗∗ -0.00620 -0.00597 0.00254 -0.000554(-2.66) (-1.37) (-1.33) (0.62) (-0.14)
% Foreign Sales 0.00473∗∗∗ -0.0000665 0.000332 0.00179 0.00962∗∗∗
(2.91) (-0.03) (0.14) (0.77) (5.38)
Log(1+Age) -0.000160 -0.000792 -0.000666 -0.00122 0.00208(-0.10) (-0.37) (-0.31) (-0.55) (1.39)
Tobin Q -0.00305∗∗ 0.00127 0.00133 0.000280 -0.00749∗∗∗
(-2.60) (0.91) (0.97) (0.21) (-8.72)
Operating Margin -0.00154 -0.00293∗∗ -0.00307∗∗ -0.00282∗∗ -0.00675∗∗∗
(-0.83) (-2.06) (-2.14) (-2.04) (-3.39)
Book Leverage 0.00321 0.00106 0.00105 0.000416 0.00284(1.64) (0.65) (0.66) (0.27) (1.47)
Dividend Payer -0.00862∗∗ 0.00417 0.00406 0.00406 -0.000486(-2.47) (1.10) (1.07) (1.07) (-0.12)
Cash/Assets 0.00239 0.000789 0.000730 0.0000738 -0.00447∗∗
(1.31) (0.72) (0.66) (0.06) (-2.19)
PPE/Assets -0.00319 -0.00406 -0.00441∗ -0.00476∗ -0.0000976(-0.98) (-1.62) (-1.80) (-1.94) (-0.03)
CAPX/Sales 0.00163 -0.00166∗ -0.00176∗ -0.00220∗∗ -0.00530∗∗∗
(1.35) (-1.66) (-1.76) (-2.23) (-3.07)
R&D/Sales -0.00719∗∗∗ -0.00508∗∗∗ -0.00526∗∗∗ -0.00494∗∗∗ -0.00977∗∗∗
(-3.47) (-3.26) (-3.30) (-3.20) (-4.41)
Observations 212613 212613 212613 212613 212613Adjusted R2 0.070 0.240 0.244 0.258 0.050Fixed Effects Ind, Year Firm, Year Firm, Region, Year Firm, Region, Year Nation, Year
49
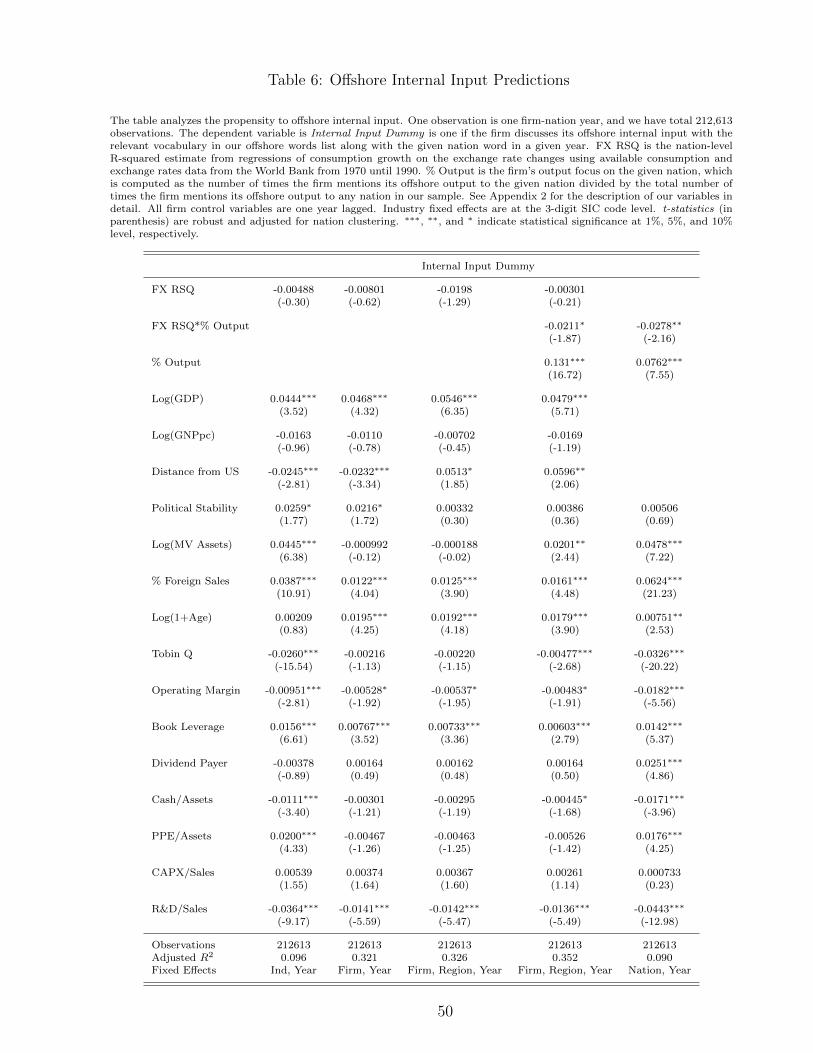
Table 6: Offshore Internal Input Predictions
The table analyzes the propensity to offshore internal input. One observation is one firm-nation year, and we have total 212,613observations. The dependent variable is Internal Input Dummy is one if the firm discusses its offshore internal input with therelevant vocabulary in our offshore words list along with the given nation word in a given year. FX RSQ is the nation-levelR-squared estimate from regressions of consumption growth on the exchange rate changes using available consumption andexchange rates data from the World Bank from 1970 until 1990. % Output is the firm’s output focus on the given nation, whichis computed as the number of times the firm mentions its offshore output to the given nation divided by the total number oftimes the firm mentions its offshore output to any nation in our sample. See Appendix 2 for the description of our variables indetail. All firm control variables are one year lagged. Industry fixed effects are at the 3-digit SIC code level. t-statistics (inparenthesis) are robust and adjusted for nation clustering. ∗∗∗, ∗∗, and ∗ indicate statistical significance at 1%, 5%, and 10%level, respectively.
Internal Input Dummy
FX RSQ -0.00488 -0.00801 -0.0198 -0.00301(-0.30) (-0.62) (-1.29) (-0.21)
FX RSQ*% Output -0.0211∗ -0.0278∗∗
(-1.87) (-2.16)
% Output 0.131∗∗∗ 0.0762∗∗∗
(16.72) (7.55)
Log(GDP) 0.0444∗∗∗ 0.0468∗∗∗ 0.0546∗∗∗ 0.0479∗∗∗
(3.52) (4.32) (6.35) (5.71)
Log(GNPpc) -0.0163 -0.0110 -0.00702 -0.0169(-0.96) (-0.78) (-0.45) (-1.19)
Distance from US -0.0245∗∗∗ -0.0232∗∗∗ 0.0513∗ 0.0596∗∗
(-2.81) (-3.34) (1.85) (2.06)
Political Stability 0.0259∗ 0.0216∗ 0.00332 0.00386 0.00506(1.77) (1.72) (0.30) (0.36) (0.69)
Log(MV Assets) 0.0445∗∗∗ -0.000992 -0.000188 0.0201∗∗ 0.0478∗∗∗
(6.38) (-0.12) (-0.02) (2.44) (7.22)
% Foreign Sales 0.0387∗∗∗ 0.0122∗∗∗ 0.0125∗∗∗ 0.0161∗∗∗ 0.0624∗∗∗
(10.91) (4.04) (3.90) (4.48) (21.23)
Log(1+Age) 0.00209 0.0195∗∗∗ 0.0192∗∗∗ 0.0179∗∗∗ 0.00751∗∗
(0.83) (4.25) (4.18) (3.90) (2.53)
Tobin Q -0.0260∗∗∗ -0.00216 -0.00220 -0.00477∗∗∗ -0.0326∗∗∗
(-15.54) (-1.13) (-1.15) (-2.68) (-20.22)
Operating Margin -0.00951∗∗∗ -0.00528∗ -0.00537∗ -0.00483∗ -0.0182∗∗∗
(-2.81) (-1.92) (-1.95) (-1.91) (-5.56)
Book Leverage 0.0156∗∗∗ 0.00767∗∗∗ 0.00733∗∗∗ 0.00603∗∗∗ 0.0142∗∗∗
(6.61) (3.52) (3.36) (2.79) (5.37)
Dividend Payer -0.00378 0.00164 0.00162 0.00164 0.0251∗∗∗
(-0.89) (0.49) (0.48) (0.50) (4.86)
Cash/Assets -0.0111∗∗∗ -0.00301 -0.00295 -0.00445∗ -0.0171∗∗∗
(-3.40) (-1.21) (-1.19) (-1.68) (-3.96)
PPE/Assets 0.0200∗∗∗ -0.00467 -0.00463 -0.00526 0.0176∗∗∗
(4.33) (-1.26) (-1.25) (-1.42) (4.25)
CAPX/Sales 0.00539 0.00374 0.00367 0.00261 0.000733(1.55) (1.64) (1.60) (1.14) (0.23)
R&D/Sales -0.0364∗∗∗ -0.0141∗∗∗ -0.0142∗∗∗ -0.0136∗∗∗ -0.0443∗∗∗
(-9.17) (-5.59) (-5.47) (-5.49) (-12.98)
Observations 212613 212613 212613 212613 212613Adjusted R2 0.096 0.321 0.326 0.352 0.090Fixed Effects Ind, Year Firm, Year Firm, Region, Year Firm, Region, Year Nation, Year
50
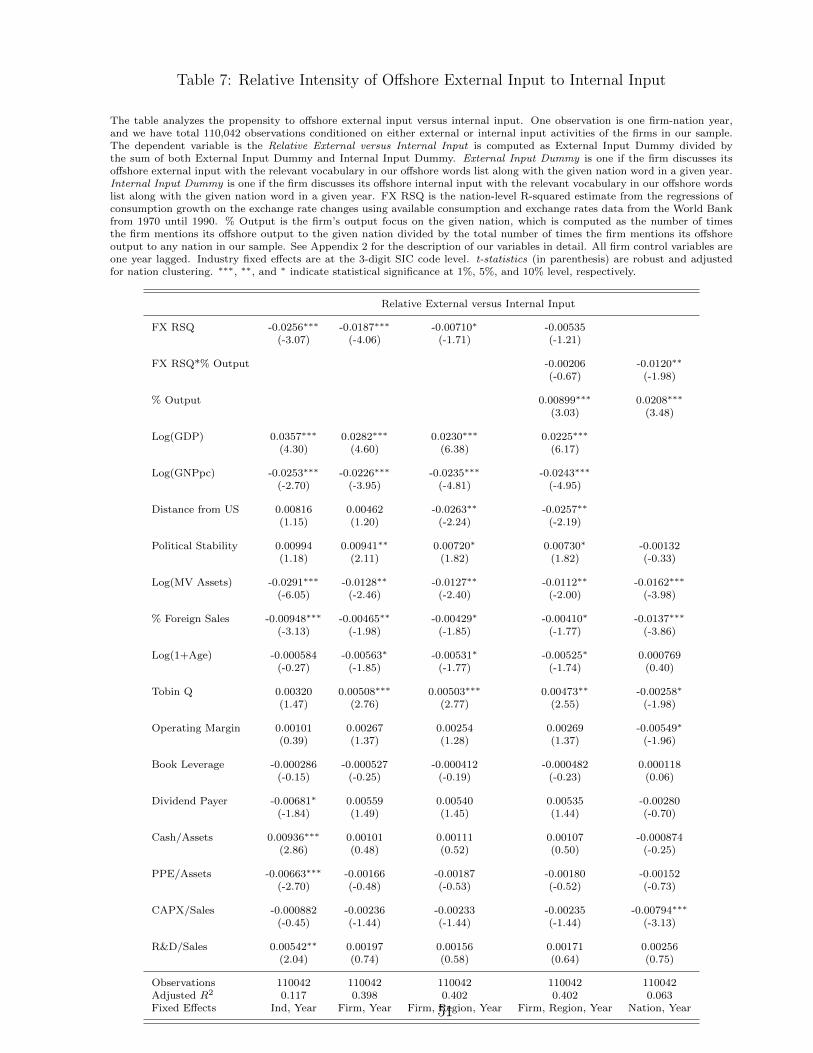
Table 7: Relative Intensity of Offshore External Input to Internal Input
The table analyzes the propensity to offshore external input versus internal input. One observation is one firm-nation year,and we have total 110,042 observations conditioned on either external or internal input activities of the firms in our sample.The dependent variable is the Relative External versus Internal Input is computed as External Input Dummy divided bythe sum of both External Input Dummy and Internal Input Dummy. External Input Dummy is one if the firm discusses itsoffshore external input with the relevant vocabulary in our offshore words list along with the given nation word in a given year.Internal Input Dummy is one if the firm discusses its offshore internal input with the relevant vocabulary in our offshore wordslist along with the given nation word in a given year. FX RSQ is the nation-level R-squared estimate from the regressions ofconsumption growth on the exchange rate changes using available consumption and exchange rates data from the World Bankfrom 1970 until 1990. % Output is the firm’s output focus on the given nation, which is computed as the number of timesthe firm mentions its offshore output to the given nation divided by the total number of times the firm mentions its offshoreoutput to any nation in our sample. See Appendix 2 for the description of our variables in detail. All firm control variables areone year lagged. Industry fixed effects are at the 3-digit SIC code level. t-statistics (in parenthesis) are robust and adjustedfor nation clustering. ∗∗∗, ∗∗, and ∗ indicate statistical significance at 1%, 5%, and 10% level, respectively.
Relative External versus Internal Input
FX RSQ -0.0256∗∗∗ -0.0187∗∗∗ -0.00710∗ -0.00535(-3.07) (-4.06) (-1.71) (-1.21)
FX RSQ*% Output -0.00206 -0.0120∗∗
(-0.67) (-1.98)
% Output 0.00899∗∗∗ 0.0208∗∗∗
(3.03) (3.48)
Log(GDP) 0.0357∗∗∗ 0.0282∗∗∗ 0.0230∗∗∗ 0.0225∗∗∗
(4.30) (4.60) (6.38) (6.17)
Log(GNPpc) -0.0253∗∗∗ -0.0226∗∗∗ -0.0235∗∗∗ -0.0243∗∗∗
(-2.70) (-3.95) (-4.81) (-4.95)
Distance from US 0.00816 0.00462 -0.0263∗∗ -0.0257∗∗
(1.15) (1.20) (-2.24) (-2.19)
Political Stability 0.00994 0.00941∗∗ 0.00720∗ 0.00730∗ -0.00132(1.18) (2.11) (1.82) (1.82) (-0.33)
Log(MV Assets) -0.0291∗∗∗ -0.0128∗∗ -0.0127∗∗ -0.0112∗∗ -0.0162∗∗∗
(-6.05) (-2.46) (-2.40) (-2.00) (-3.98)
% Foreign Sales -0.00948∗∗∗ -0.00465∗∗ -0.00429∗ -0.00410∗ -0.0137∗∗∗
(-3.13) (-1.98) (-1.85) (-1.77) (-3.86)
Log(1+Age) -0.000584 -0.00563∗ -0.00531∗ -0.00525∗ 0.000769(-0.27) (-1.85) (-1.77) (-1.74) (0.40)
Tobin Q 0.00320 0.00508∗∗∗ 0.00503∗∗∗ 0.00473∗∗ -0.00258∗
(1.47) (2.76) (2.77) (2.55) (-1.98)
Operating Margin 0.00101 0.00267 0.00254 0.00269 -0.00549∗
(0.39) (1.37) (1.28) (1.37) (-1.96)
Book Leverage -0.000286 -0.000527 -0.000412 -0.000482 0.000118(-0.15) (-0.25) (-0.19) (-0.23) (0.06)
Dividend Payer -0.00681∗ 0.00559 0.00540 0.00535 -0.00280(-1.84) (1.49) (1.45) (1.44) (-0.70)
Cash/Assets 0.00936∗∗∗ 0.00101 0.00111 0.00107 -0.000874(2.86) (0.48) (0.52) (0.50) (-0.25)
PPE/Assets -0.00663∗∗∗ -0.00166 -0.00187 -0.00180 -0.00152(-2.70) (-0.48) (-0.53) (-0.52) (-0.73)
CAPX/Sales -0.000882 -0.00236 -0.00233 -0.00235 -0.00794∗∗∗
(-0.45) (-1.44) (-1.44) (-1.44) (-3.13)
R&D/Sales 0.00542∗∗ 0.00197 0.00156 0.00171 0.00256(2.04) (0.74) (0.58) (0.64) (0.75)
Observations 110042 110042 110042 110042 110042Adjusted R2 0.117 0.398 0.402 0.402 0.063Fixed Effects Ind, Year Firm, Year Firm, Region, Year Firm, Region, Year Nation, Year51
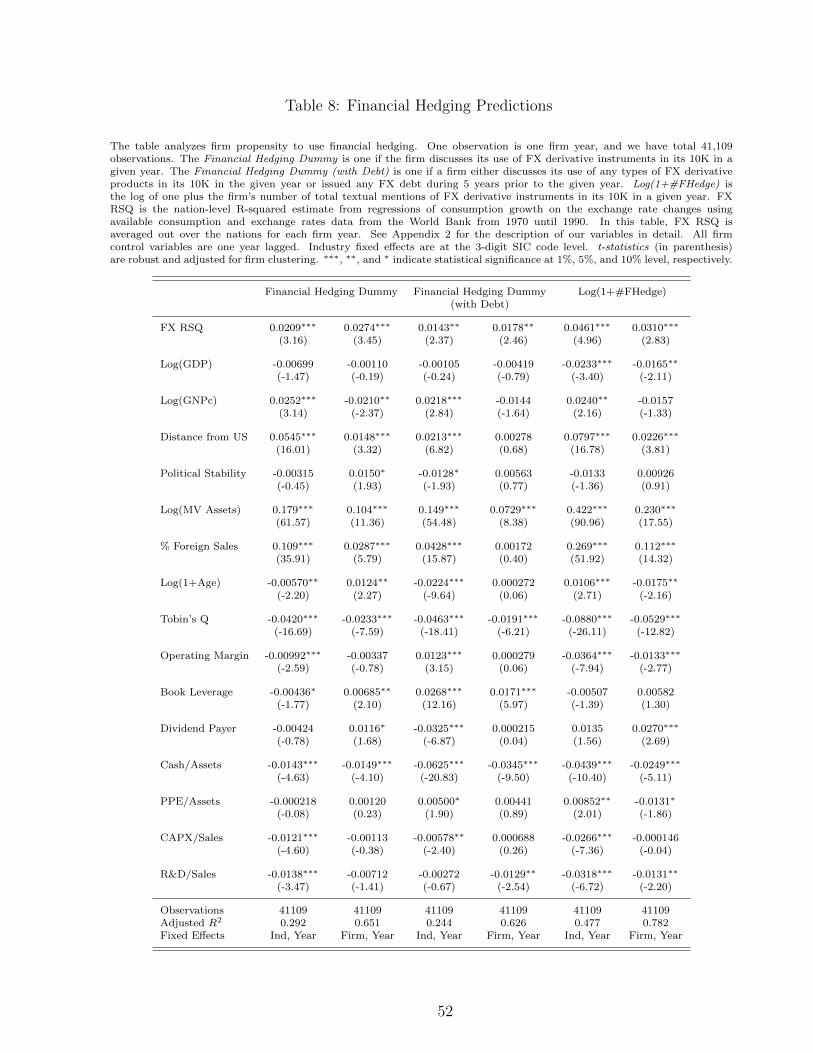
Table 8: Financial Hedging Predictions
The table analyzes firm propensity to use financial hedging. One observation is one firm year, and we have total 41,109observations. The Financial Hedging Dummy is one if the firm discusses its use of FX derivative instruments in its 10K in agiven year. The Financial Hedging Dummy (with Debt) is one if a firm either discusses its use of any types of FX derivativeproducts in its 10K in the given year or issued any FX debt during 5 years prior to the given year. Log(1+#FHedge) isthe log of one plus the firm’s number of total textual mentions of FX derivative instruments in its 10K in a given year. FXRSQ is the nation-level R-squared estimate from regressions of consumption growth on the exchange rate changes usingavailable consumption and exchange rates data from the World Bank from 1970 until 1990. In this table, FX RSQ isaveraged out over the nations for each firm year. See Appendix 2 for the description of our variables in detail. All firmcontrol variables are one year lagged. Industry fixed effects are at the 3-digit SIC code level. t-statistics (in parenthesis)are robust and adjusted for firm clustering. ∗∗∗, ∗∗, and ∗ indicate statistical significance at 1%, 5%, and 10% level, respectively.
Financial Hedging Dummy Financial Hedging Dummy Log(1+#FHedge)(with Debt)
FX RSQ 0.0209∗∗∗ 0.0274∗∗∗ 0.0143∗∗ 0.0178∗∗ 0.0461∗∗∗ 0.0310∗∗∗
(3.16) (3.45) (2.37) (2.46) (4.96) (2.83)
Log(GDP) -0.00699 -0.00110 -0.00105 -0.00419 -0.0233∗∗∗ -0.0165∗∗
(-1.47) (-0.19) (-0.24) (-0.79) (-3.40) (-2.11)
Log(GNPc) 0.0252∗∗∗ -0.0210∗∗ 0.0218∗∗∗ -0.0144 0.0240∗∗ -0.0157(3.14) (-2.37) (2.84) (-1.64) (2.16) (-1.33)
Distance from US 0.0545∗∗∗ 0.0148∗∗∗ 0.0213∗∗∗ 0.00278 0.0797∗∗∗ 0.0226∗∗∗
(16.01) (3.32) (6.82) (0.68) (16.78) (3.81)
Political Stability -0.00315 0.0150∗ -0.0128∗ 0.00563 -0.0133 0.00926(-0.45) (1.93) (-1.93) (0.77) (-1.36) (0.91)
Log(MV Assets) 0.179∗∗∗ 0.104∗∗∗ 0.149∗∗∗ 0.0729∗∗∗ 0.422∗∗∗ 0.230∗∗∗
(61.57) (11.36) (54.48) (8.38) (90.96) (17.55)
% Foreign Sales 0.109∗∗∗ 0.0287∗∗∗ 0.0428∗∗∗ 0.00172 0.269∗∗∗ 0.112∗∗∗
(35.91) (5.79) (15.87) (0.40) (51.92) (14.32)
Log(1+Age) -0.00570∗∗ 0.0124∗∗ -0.0224∗∗∗ 0.000272 0.0106∗∗∗ -0.0175∗∗
(-2.20) (2.27) (-9.64) (0.06) (2.71) (-2.16)
Tobin’s Q -0.0420∗∗∗ -0.0233∗∗∗ -0.0463∗∗∗ -0.0191∗∗∗ -0.0880∗∗∗ -0.0529∗∗∗
(-16.69) (-7.59) (-18.41) (-6.21) (-26.11) (-12.82)
Operating Margin -0.00992∗∗∗ -0.00337 0.0123∗∗∗ 0.000279 -0.0364∗∗∗ -0.0133∗∗∗
(-2.59) (-0.78) (3.15) (0.06) (-7.94) (-2.77)
Book Leverage -0.00436∗ 0.00685∗∗ 0.0268∗∗∗ 0.0171∗∗∗ -0.00507 0.00582(-1.77) (2.10) (12.16) (5.97) (-1.39) (1.30)
Dividend Payer -0.00424 0.0116∗ -0.0325∗∗∗ 0.000215 0.0135 0.0270∗∗∗
(-0.78) (1.68) (-6.87) (0.04) (1.56) (2.69)
Cash/Assets -0.0143∗∗∗ -0.0149∗∗∗ -0.0625∗∗∗ -0.0345∗∗∗ -0.0439∗∗∗ -0.0249∗∗∗
(-4.63) (-4.10) (-20.83) (-9.50) (-10.40) (-5.11)
PPE/Assets -0.000218 0.00120 0.00500∗ 0.00441 0.00852∗∗ -0.0131∗
(-0.08) (0.23) (1.90) (0.89) (2.01) (-1.86)
CAPX/Sales -0.0121∗∗∗ -0.00113 -0.00578∗∗ 0.000688 -0.0266∗∗∗ -0.000146(-4.60) (-0.38) (-2.40) (0.26) (-7.36) (-0.04)
R&D/Sales -0.0138∗∗∗ -0.00712 -0.00272 -0.0129∗∗ -0.0318∗∗∗ -0.0131∗∗
(-3.47) (-1.41) (-0.67) (-2.54) (-6.72) (-2.20)
Observations 41109 41109 41109 41109 41109 41109Adjusted R2 0.292 0.651 0.244 0.626 0.477 0.782Fixed Effects Ind, Year Firm, Year Ind, Year Firm, Year Ind, Year Firm, Year
52
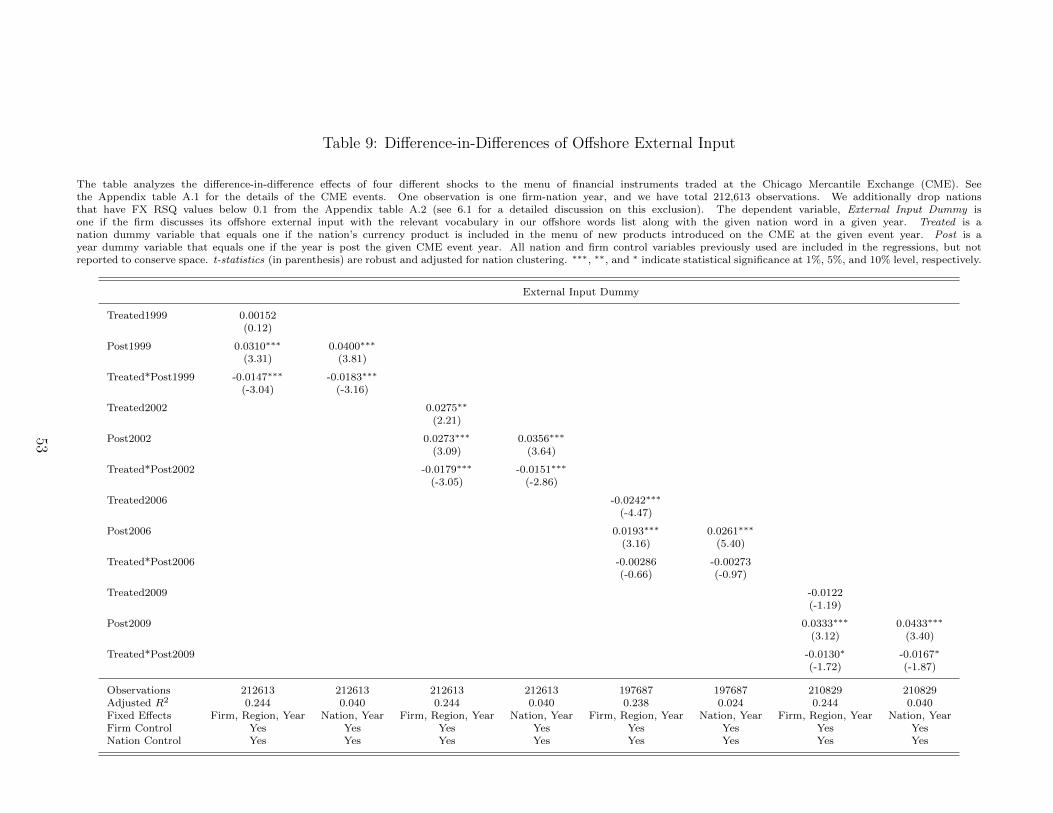
Table 9: Difference-in-Differences of Offshore External Input
The table analyzes the difference-in-difference effects of four different shocks to the menu of financial instruments traded at the Chicago Mercantile Exchange (CME). Seethe Appendix table A.1 for the details of the CME events. One observation is one firm-nation year, and we have total 212,613 observations. We additionally drop nationsthat have FX RSQ values below 0.1 from the Appendix table A.2 (see 6.1 for a detailed discussion on this exclusion). The dependent variable, External Input Dummy isone if the firm discusses its offshore external input with the relevant vocabulary in our offshore words list along with the given nation word in a given year. Treated is anation dummy variable that equals one if the nation’s currency product is included in the menu of new products introduced on the CME at the given event year. Post is ayear dummy variable that equals one if the year is post the given CME event year. All nation and firm control variables previously used are included in the regressions, but notreported to conserve space. t-statistics (in parenthesis) are robust and adjusted for nation clustering. ∗∗∗, ∗∗, and ∗ indicate statistical significance at 1%, 5%, and 10% level, respectively.
External Input Dummy
Treated1999 0.00152(0.12)
Post1999 0.0310∗∗∗ 0.0400∗∗∗
(3.31) (3.81)
Treated*Post1999 -0.0147∗∗∗ -0.0183∗∗∗
(-3.04) (-3.16)
Treated2002 0.0275∗∗
(2.21)
Post2002 0.0273∗∗∗ 0.0356∗∗∗
(3.09) (3.64)
Treated*Post2002 -0.0179∗∗∗ -0.0151∗∗∗
(-3.05) (-2.86)
Treated2006 -0.0242∗∗∗
(-4.47)
Post2006 0.0193∗∗∗ 0.0261∗∗∗
(3.16) (5.40)
Treated*Post2006 -0.00286 -0.00273(-0.66) (-0.97)
Treated2009 -0.0122(-1.19)
Post2009 0.0333∗∗∗ 0.0433∗∗∗
(3.12) (3.40)
Treated*Post2009 -0.0130∗ -0.0167∗
(-1.72) (-1.87)
Observations 212613 212613 212613 212613 197687 197687 210829 210829Adjusted R2 0.244 0.040 0.244 0.040 0.238 0.024 0.244 0.040Fixed Effects Firm, Region, Year Nation, Year Firm, Region, Year Nation, Year Firm, Region, Year Nation, Year Firm, Region, Year Nation, YearFirm Control Yes Yes Yes Yes Yes Yes Yes YesNation Control Yes Yes Yes Yes Yes Yes Yes Yes
53
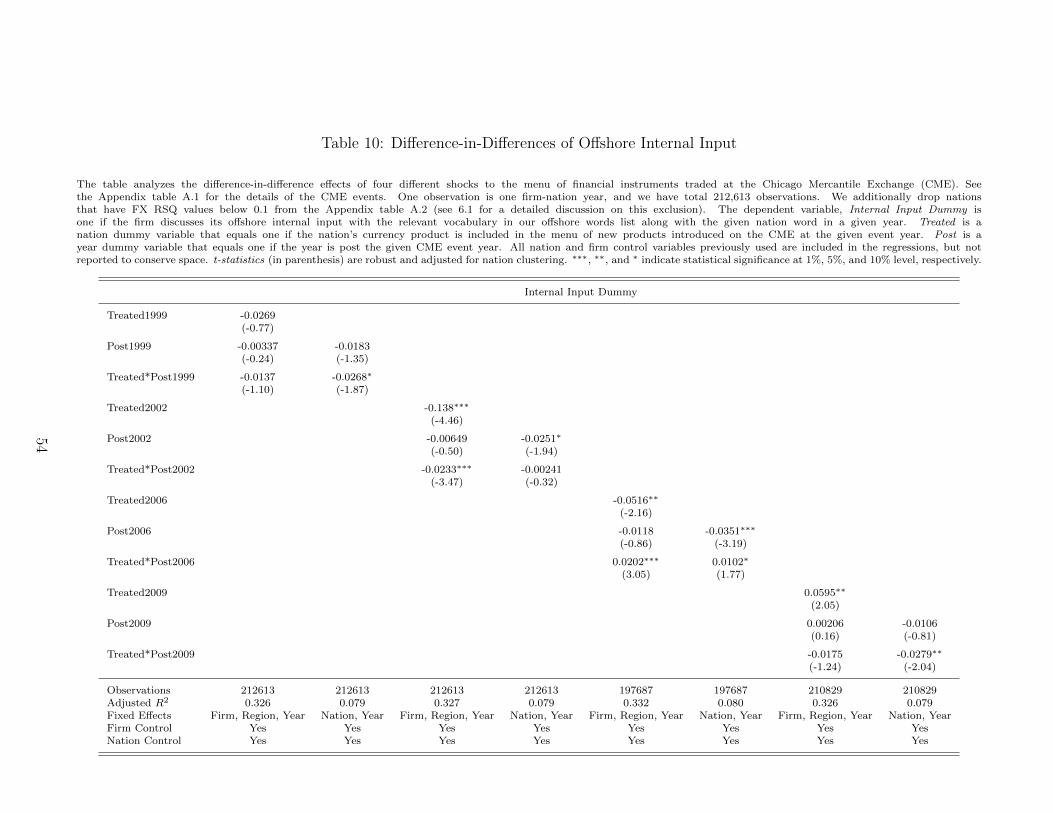
Table 10: Difference-in-Differences of Offshore Internal Input
The table analyzes the difference-in-difference effects of four different shocks to the menu of financial instruments traded at the Chicago Mercantile Exchange (CME). Seethe Appendix table A.1 for the details of the CME events. One observation is one firm-nation year, and we have total 212,613 observations. We additionally drop nationsthat have FX RSQ values below 0.1 from the Appendix table A.2 (see 6.1 for a detailed discussion on this exclusion). The dependent variable, Internal Input Dummy isone if the firm discusses its offshore internal input with the relevant vocabulary in our offshore words list along with the given nation word in a given year. Treated is anation dummy variable that equals one if the nation’s currency product is included in the menu of new products introduced on the CME at the given event year. Post is ayear dummy variable that equals one if the year is post the given CME event year. All nation and firm control variables previously used are included in the regressions, but notreported to conserve space. t-statistics (in parenthesis) are robust and adjusted for nation clustering. ∗∗∗, ∗∗, and ∗ indicate statistical significance at 1%, 5%, and 10% level, respectively.
Internal Input Dummy
Treated1999 -0.0269(-0.77)
Post1999 -0.00337 -0.0183(-0.24) (-1.35)
Treated*Post1999 -0.0137 -0.0268∗
(-1.10) (-1.87)
Treated2002 -0.138∗∗∗
(-4.46)
Post2002 -0.00649 -0.0251∗
(-0.50) (-1.94)
Treated*Post2002 -0.0233∗∗∗ -0.00241(-3.47) (-0.32)
Treated2006 -0.0516∗∗
(-2.16)
Post2006 -0.0118 -0.0351∗∗∗
(-0.86) (-3.19)
Treated*Post2006 0.0202∗∗∗ 0.0102∗
(3.05) (1.77)
Treated2009 0.0595∗∗
(2.05)
Post2009 0.00206 -0.0106(0.16) (-0.81)
Treated*Post2009 -0.0175 -0.0279∗∗
(-1.24) (-2.04)
Observations 212613 212613 212613 212613 197687 197687 210829 210829Adjusted R2 0.326 0.079 0.327 0.079 0.332 0.080 0.326 0.079Fixed Effects Firm, Region, Year Nation, Year Firm, Region, Year Nation, Year Firm, Region, Year Nation, Year Firm, Region, Year Nation, YearFirm Control Yes Yes Yes Yes Yes Yes Yes YesNation Control Yes Yes Yes Yes Yes Yes Yes Yes
54
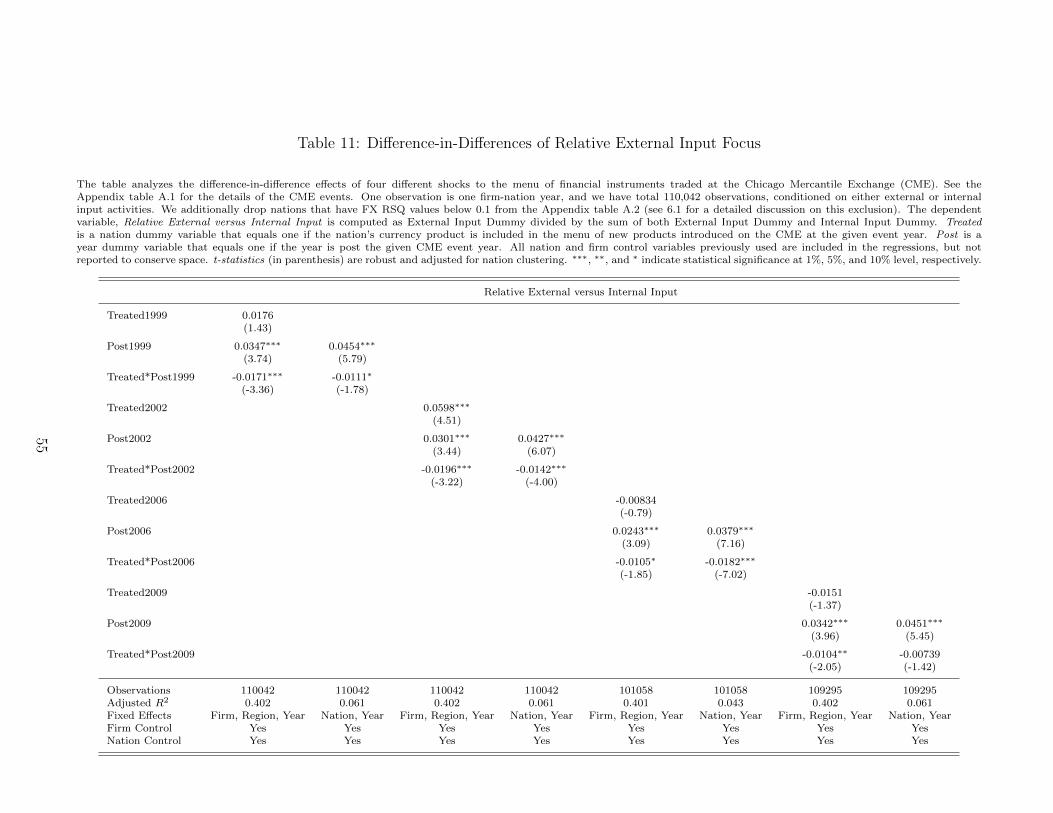
Table 11: Difference-in-Differences of Relative External Input Focus
The table analyzes the difference-in-difference effects of four different shocks to the menu of financial instruments traded at the Chicago Mercantile Exchange (CME). See theAppendix table A.1 for the details of the CME events. One observation is one firm-nation year, and we have total 110,042 observations, conditioned on either external or internalinput activities. We additionally drop nations that have FX RSQ values below 0.1 from the Appendix table A.2 (see 6.1 for a detailed discussion on this exclusion). The dependentvariable, Relative External versus Internal Input is computed as External Input Dummy divided by the sum of both External Input Dummy and Internal Input Dummy. Treatedis a nation dummy variable that equals one if the nation’s currency product is included in the menu of new products introduced on the CME at the given event year. Post is ayear dummy variable that equals one if the year is post the given CME event year. All nation and firm control variables previously used are included in the regressions, but notreported to conserve space. t-statistics (in parenthesis) are robust and adjusted for nation clustering. ∗∗∗, ∗∗, and ∗ indicate statistical significance at 1%, 5%, and 10% level, respectively.
Relative External versus Internal Input
Treated1999 0.0176(1.43)
Post1999 0.0347∗∗∗ 0.0454∗∗∗
(3.74) (5.79)
Treated*Post1999 -0.0171∗∗∗ -0.0111∗
(-3.36) (-1.78)
Treated2002 0.0598∗∗∗
(4.51)
Post2002 0.0301∗∗∗ 0.0427∗∗∗
(3.44) (6.07)
Treated*Post2002 -0.0196∗∗∗ -0.0142∗∗∗
(-3.22) (-4.00)
Treated2006 -0.00834(-0.79)
Post2006 0.0243∗∗∗ 0.0379∗∗∗
(3.09) (7.16)
Treated*Post2006 -0.0105∗ -0.0182∗∗∗
(-1.85) (-7.02)
Treated2009 -0.0151(-1.37)
Post2009 0.0342∗∗∗ 0.0451∗∗∗
(3.96) (5.45)
Treated*Post2009 -0.0104∗∗ -0.00739(-2.05) (-1.42)
Observations 110042 110042 110042 110042 101058 101058 109295 109295Adjusted R2 0.402 0.061 0.402 0.061 0.401 0.043 0.402 0.061Fixed Effects Firm, Region, Year Nation, Year Firm, Region, Year Nation, Year Firm, Region, Year Nation, Year Firm, Region, Year Nation, YearFirm Control Yes Yes Yes Yes Yes Yes Yes YesNation Control Yes Yes Yes Yes Yes Yes Yes Yes
55
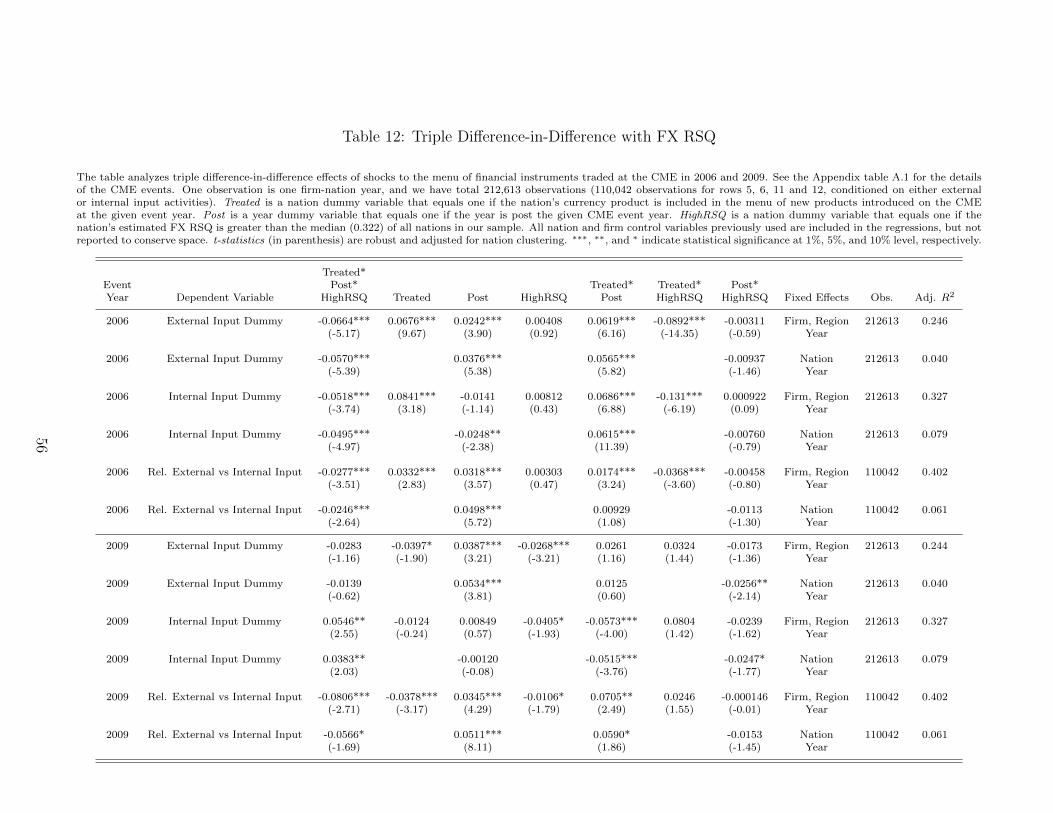
Table 12: Triple Difference-in-Difference with FX RSQ
The table analyzes triple difference-in-difference effects of shocks to the menu of financial instruments traded at the CME in 2006 and 2009. See the Appendix table A.1 for the detailsof the CME events. One observation is one firm-nation year, and we have total 212,613 observations (110,042 observations for rows 5, 6, 11 and 12, conditioned on either externalor internal input activities). Treated is a nation dummy variable that equals one if the nation’s currency product is included in the menu of new products introduced on the CMEat the given event year. Post is a year dummy variable that equals one if the year is post the given CME event year. HighRSQ is a nation dummy variable that equals one if thenation’s estimated FX RSQ is greater than the median (0.322) of all nations in our sample. All nation and firm control variables previously used are included in the regressions, but notreported to conserve space. t-statistics (in parenthesis) are robust and adjusted for nation clustering. ∗∗∗, ∗∗, and ∗ indicate statistical significance at 1%, 5%, and 10% level, respectively.
Treated*Event Post* Treated* Treated* Post*Year Dependent Variable HighRSQ Treated Post HighRSQ Post HighRSQ HighRSQ Fixed Effects Obs. Adj. R2
2006 External Input Dummy -0.0664*** 0.0676*** 0.0242*** 0.00408 0.0619*** -0.0892*** -0.00311 Firm, Region 212613 0.246(-5.17) (9.67) (3.90) (0.92) (6.16) (-14.35) (-0.59) Year
2006 External Input Dummy -0.0570*** 0.0376*** 0.0565*** -0.00937 Nation 212613 0.040(-5.39) (5.38) (5.82) (-1.46) Year
2006 Internal Input Dummy -0.0518*** 0.0841*** -0.0141 0.00812 0.0686*** -0.131*** 0.000922 Firm, Region 212613 0.327(-3.74) (3.18) (-1.14) (0.43) (6.88) (-6.19) (0.09) Year
2006 Internal Input Dummy -0.0495*** -0.0248** 0.0615*** -0.00760 Nation 212613 0.079(-4.97) (-2.38) (11.39) (-0.79) Year
2006 Rel. External vs Internal Input -0.0277*** 0.0332*** 0.0318*** 0.00303 0.0174*** -0.0368*** -0.00458 Firm, Region 110042 0.402(-3.51) (2.83) (3.57) (0.47) (3.24) (-3.60) (-0.80) Year
2006 Rel. External vs Internal Input -0.0246*** 0.0498*** 0.00929 -0.0113 Nation 110042 0.061(-2.64) (5.72) (1.08) (-1.30) Year
2009 External Input Dummy -0.0283 -0.0397* 0.0387*** -0.0268*** 0.0261 0.0324 -0.0173 Firm, Region 212613 0.244(-1.16) (-1.90) (3.21) (-3.21) (1.16) (1.44) (-1.36) Year
2009 External Input Dummy -0.0139 0.0534*** 0.0125 -0.0256** Nation 212613 0.040(-0.62) (3.81) (0.60) (-2.14) Year
2009 Internal Input Dummy 0.0546** -0.0124 0.00849 -0.0405* -0.0573*** 0.0804 -0.0239 Firm, Region 212613 0.327(2.55) (-0.24) (0.57) (-1.93) (-4.00) (1.42) (-1.62) Year
2009 Internal Input Dummy 0.0383** -0.00120 -0.0515*** -0.0247* Nation 212613 0.079(2.03) (-0.08) (-3.76) (-1.77) Year
2009 Rel. External vs Internal Input -0.0806*** -0.0378*** 0.0345*** -0.0106* 0.0705** 0.0246 -0.000146 Firm, Region 110042 0.402(-2.71) (-3.17) (4.29) (-1.79) (2.49) (1.55) (-0.01) Year
2009 Rel. External vs Internal Input -0.0566* 0.0511*** 0.0590* -0.0153 Nation 110042 0.061(-1.69) (8.11) (1.86) (-1.45) Year
56