Embed Size (px)
Citation preview
OVERVIEW OF THECANADIAN DAIRY INDUSTRY
Gilles Froment, M.Sc., P.Ag.COO
Canadian Dairy Commission, OttawaFebruary 21, 2014
1
DM272659
OUTLINE The Canadian marketing system and its
component 3 pillars of supply management Seasonality programs Milk pools Marketing and innovation initiatives Current issues
2

THE CANADIAN MILK MARKETING SYSTEM AND ITS COMPONENTS
3
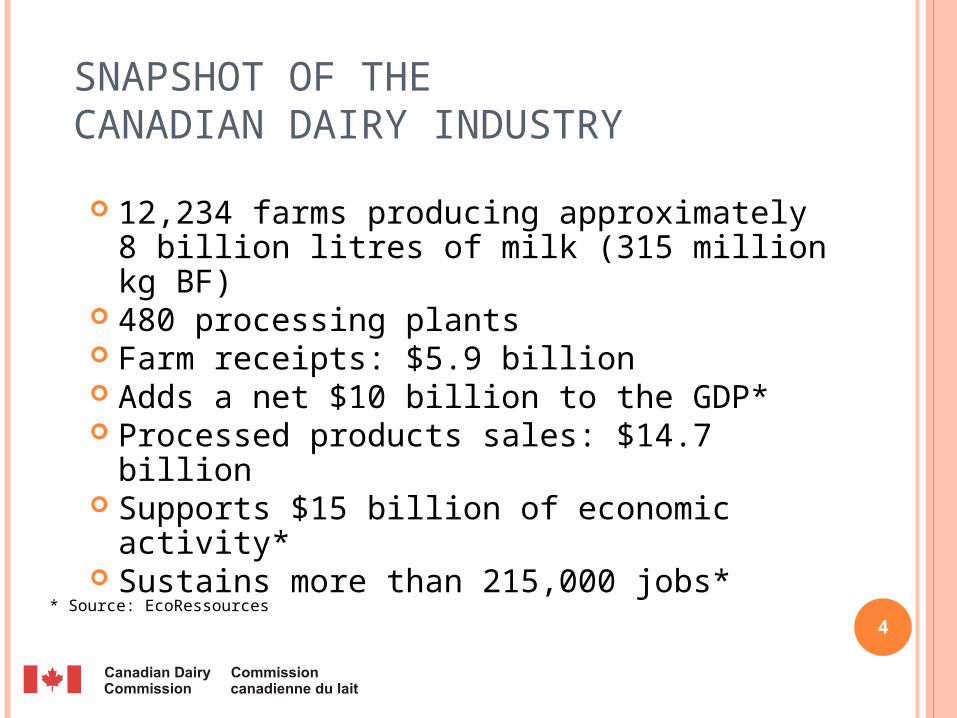
SNAPSHOT OF THECANADIAN DAIRY INDUSTRY
12,234 farms producing approximately 8 billion litres of milk (315 million kg BF)
480 processing plants Farm receipts: $5.9 billion Adds a net $10 billion to the GDP* Processed products sales: $14.7 billion Supports $15 billion of economic activity* Sustains more than 215,000 jobs*
4* Source: EcoRessources
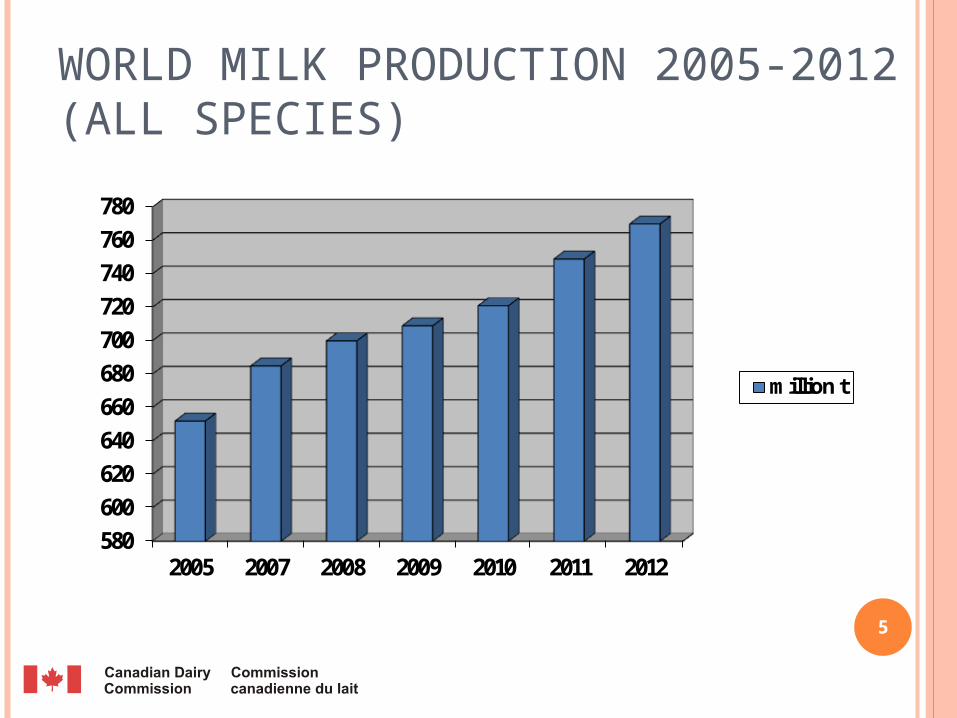
WORLD MILK PRODUCTION 2005-2012(ALL SPECIES)
580600620640660680700720740760780
2005 2007 2008 2009 2010 2011 2012
million t
5
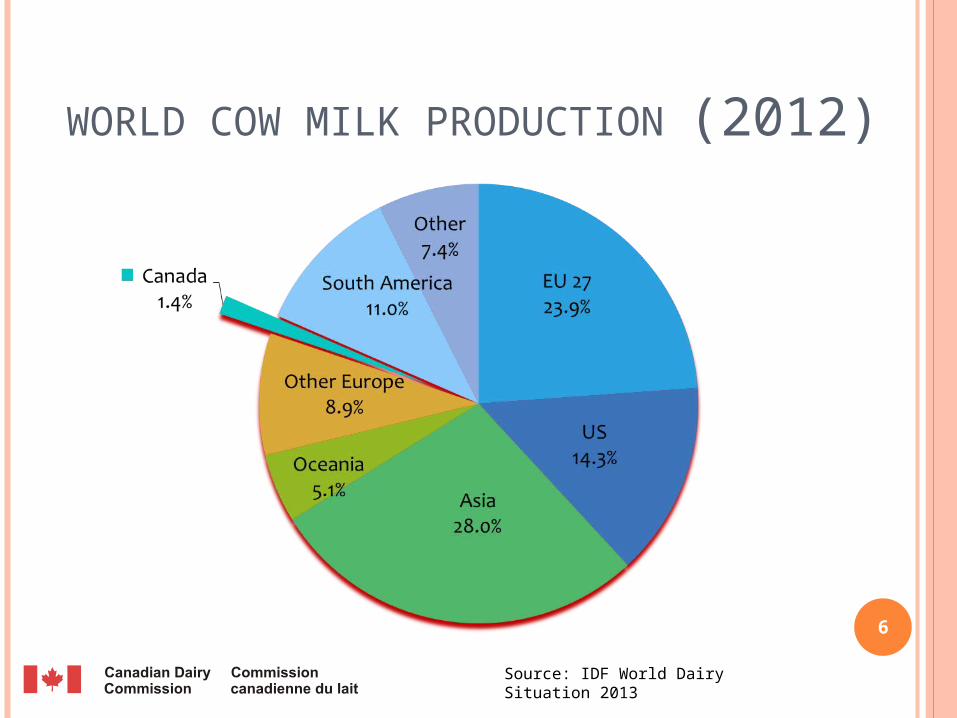
WORLD COW MILK PRODUCTION
(2012)
Source: IDF World Dairy Situation 20136
6

CANADA’S MILK MARKETING SYSTEM
7
Producer
Marketing Board (provincial)
Processor
Further processor
Consumer
Retailer
Regulated marketUnregulated market

CMSMC
Canadian Milk Supply Management Committee
Permanent body of signatories of the National Milk Marketing Plan - NMMP (voting members)
One vote per province Dairy Farmers of Canada, Dairy Processors
Association of Canada and Consumers’ Association of Canada (non-voting members)
Responsible for policy determination and supervision of the NMMP provisions
Meets 4 times a year Virtually all decisions require unanimity 8
9
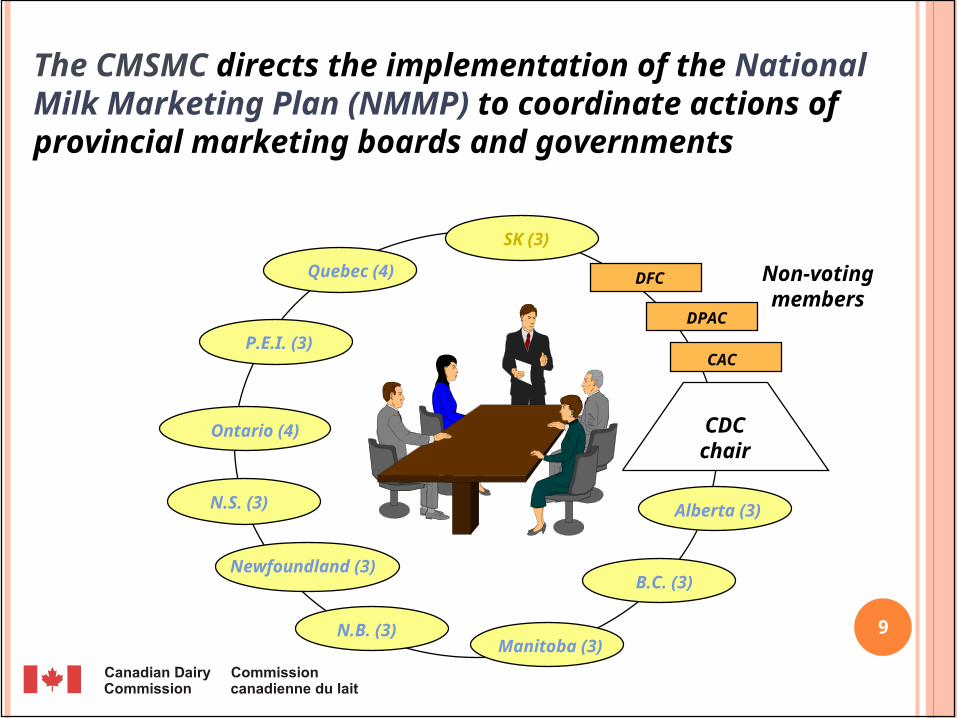
The CMSMC directs the implementation of the National Milk Marketing Plan (NMMP) to coordinate actions of provincial marketing boards and governments
Non-votingmembers
CDCchair
DPAC
CAC
DFC
SK (3)
Quebec (4)
P.E.I. (3)
Ontario (4)
N.S. (3)
N.B. (3)
Newfoundland (3)
Alberta (3)
B.C. (3)
Manitoba (3)
NMMP
National Milk Marketing Plan Federal-provincial agreement Regulates marketing of industrial milk Balances supply and demand Sets out the establishment, distribution and
adjustment of industrial milk quota
10
THE CANADIAN DAIRY COMMISSION
Crown corporation created in 1966 Reports to Parliament through Minister of
Agriculture 3 commissioners, 60 employees Generally deals with industrial milk Total budget for 2013-2014: $7.75 million Funded by government, dairy producers,
commercial operations, and the marketplace
11

LEGISLATED MANDATE
Provide efficient producers of milk and cream with the opportunity to obtain a fair return for their labour and investment.
Provide consumers of dairy products with a continuous and adequate supply of dairy products of high quality.
12

OVERVIEW OF KEY ACTIVITIES Chair the CMSMC Calculate Estimated Requirements (demand) Recommend Market Sharing Quota Establish Support Prices Administer Revenue and Market Sharing
Agreements (pools) Administer Special Milk Class Permit Program Carry out external audits Create and administer marketing programs Remove surplus production Administer Seasonality Programs
13
MILK CLASSES
14
Industrial (Classes 2-4) used in the manufacture
of butter, cheese, ice cream, yogurt, milk powders
longer shelf life federal responsibility
– interprovincial trade of product
Fluid (Class 1) used in 1%, 2%, skim
milk, etc. and creams short shelf life provincial
responsibility – historically made and consumed in province of origin
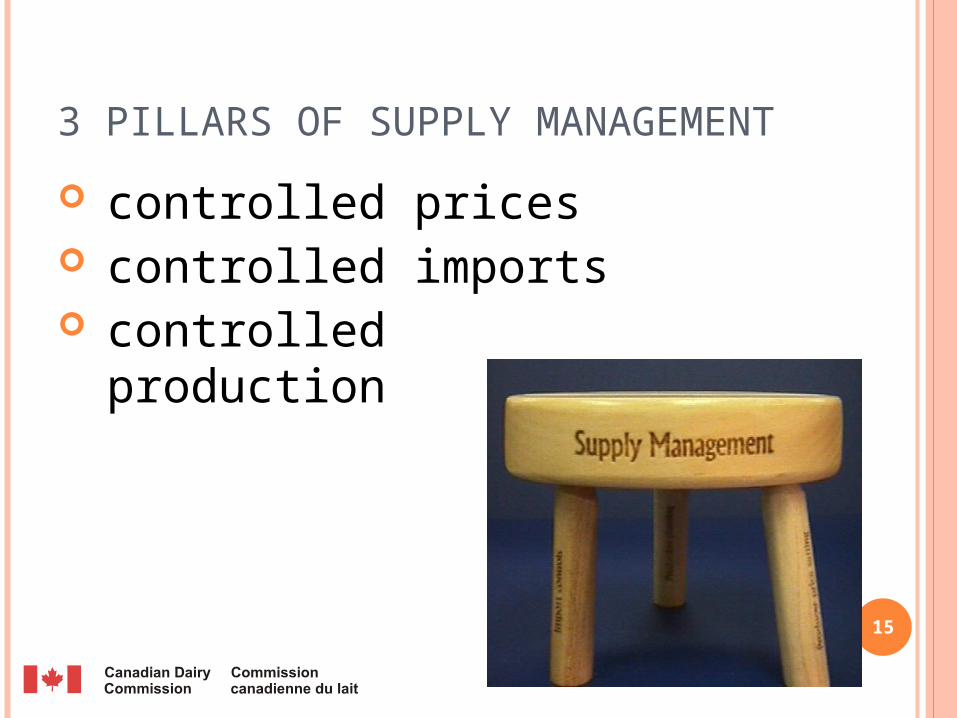
3 PILLARS OF SUPPLY MANAGEMENT
controlled prices controlled imports controlled production
15
PILLAR 1: CONTROLLED PRICES Industrial milk prices Are determined by provinces based on
CDC support prices and vary depending on the end use of the milk
Support prices are the prices at which the CDC buys and sells butter and skim milk powder under its various programs.
Support prices are usually announced in November or December by the CDC to be effective February 1.
16
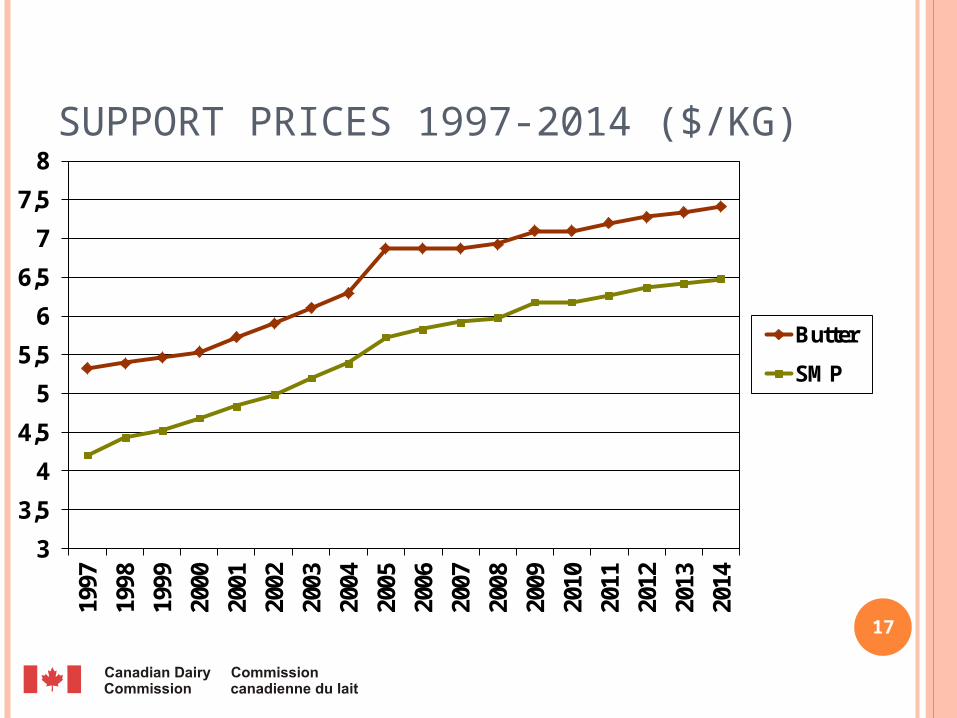
SUPPORT PRICES 1997-2014 ($/KG)
3
3,5
4
4,5
5
5,5
6
6,5
7
7,5
8
1997
1998
1999
2000
2001
2002
2003
2004
2005
2006
2007
2008
2009
2010
2011
2012
2013
2014
Butter
SMP
17
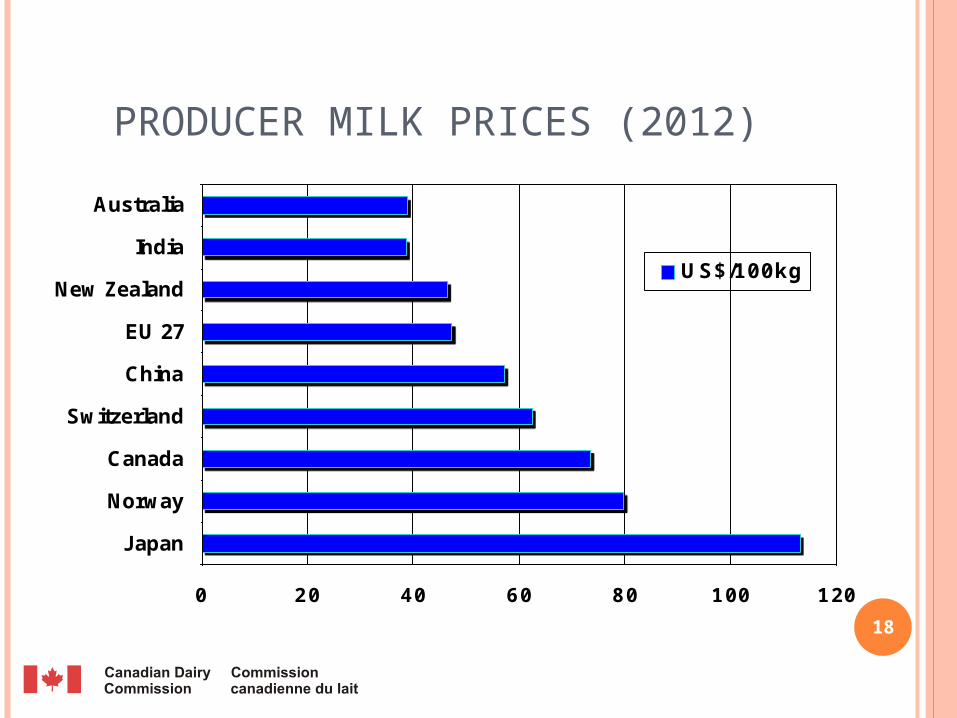
PRODUCER MILK PRICES (2012)
0 20 40 60 80 100 120
Japan
Norway
Canada
Switzerland
China
EU 27
New Zealand
India
Australia
US$/100kg
18
19
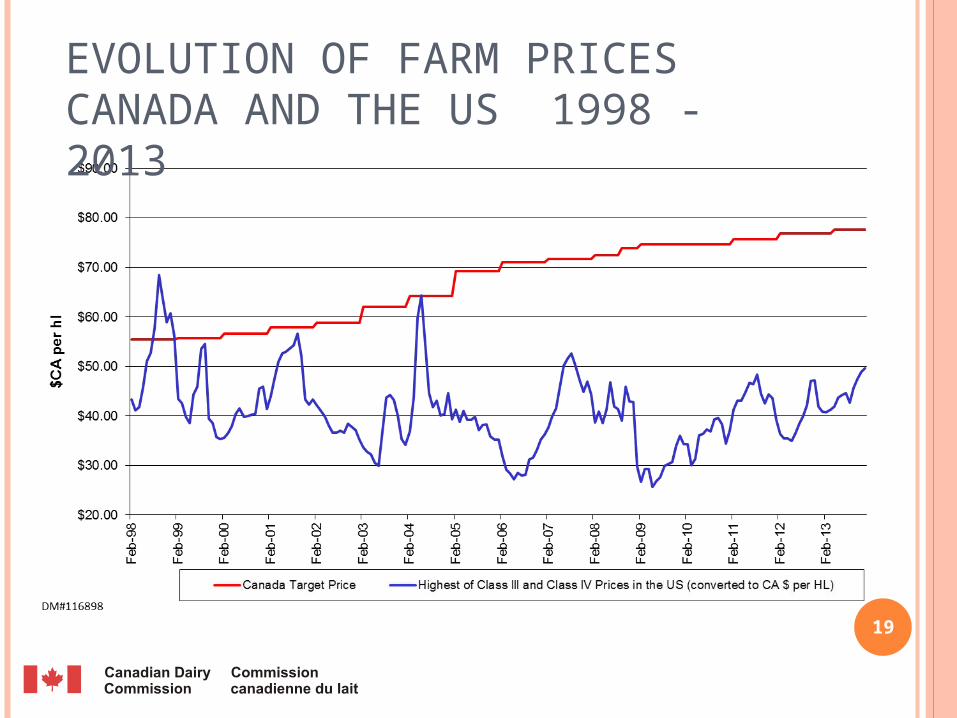
EVOLUTION OF FARM PRICESCANADA AND THE US 1998 - 2013
PILLAR 1: CONTROLLED PRICES Fluid milk prices are determined by provinces according
to a formula 50% indexed COP 50% CPI
Valid until February 1, 2016 Applied once per year (in February)
20
MILK PRICES IN LAST 12 MONTHSENDING DECEMBER 2013
Average in-quota revenues : $77.99/hl
Average price for fluid: $94.78/hl
Average price for industrial: $66.63/hl
21
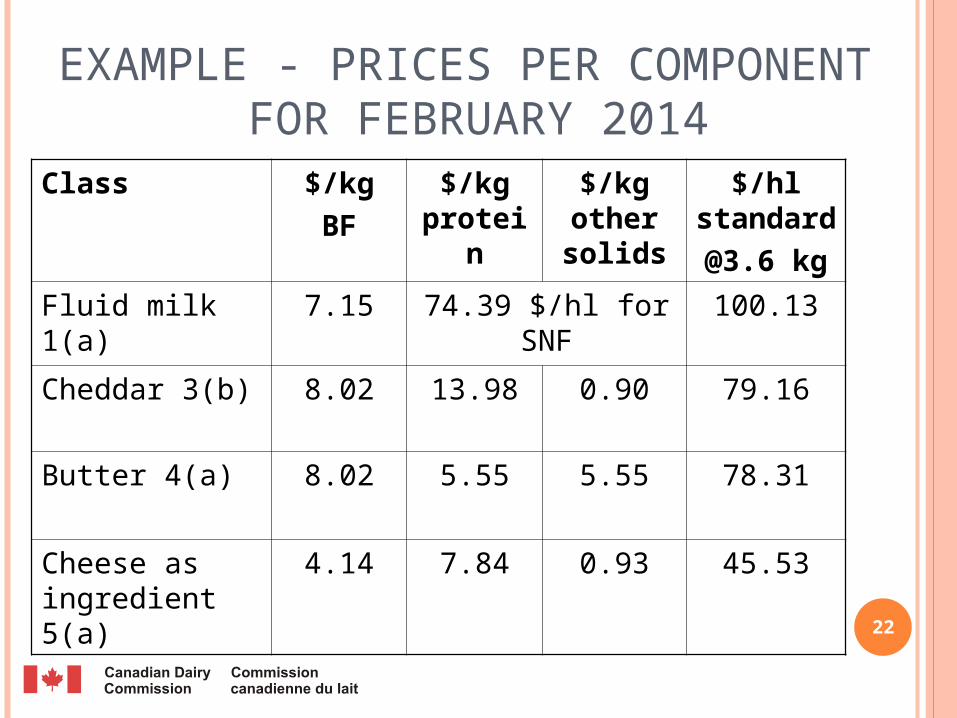
EXAMPLE - PRICES PER COMPONENT FOR FEBRUARY 2014
Class $/kg
BF
$/kg protein
$/kg other solids
$/hl standard
@3.6 kg
Fluid milk 1(a) 7.15 74.39 $/hl for SNF 100.13
Cheddar 3(b) 8.02 13.98 0.90 79.16
Butter 4(a) 8.02 5.55 5.55 78.31
Cheese as ingredient 5(a)
4.14 7.84 0.93 45.53
22
PILLAR 2: CONTROLLED IMPORTS
Most dairy products are protected by Tariff Rate Quota (TRQs).
Above TRQs, dairy products have a tariff of almost 300%.
23
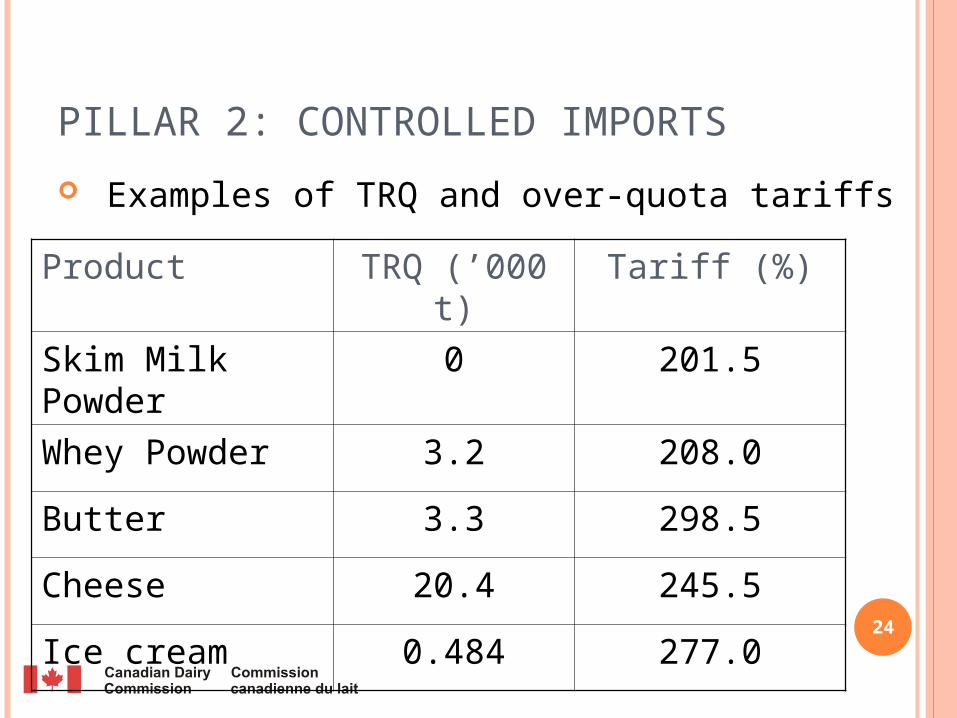
PILLAR 2: CONTROLLED IMPORTS
Examples of TRQ and over-quota tariffs
Product TRQ (’000 t) Tariff (%)
Skim Milk Powder 0 201.5
Whey Powder 3.2 208.0
Butter 3.3 298.5
Cheese 20.4 245.5
Ice cream 0.484 277.024
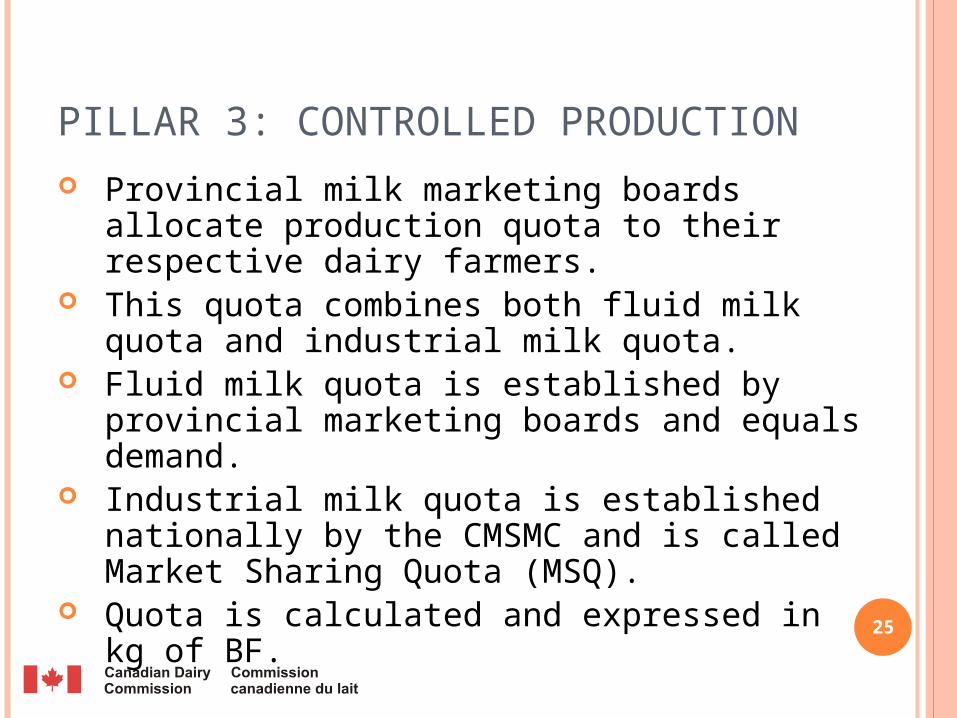
PILLAR 3: CONTROLLED PRODUCTION
Provincial milk marketing boards allocate production quota to their respective dairy farmers.
This quota combines both fluid milk quota and industrial milk quota.
Fluid milk quota is established by provincial marketing boards and equals demand.
Industrial milk quota is established nationally by the CMSMC and is called Market Sharing Quota (MSQ).
Quota is calculated and expressed in kg of BF. 25
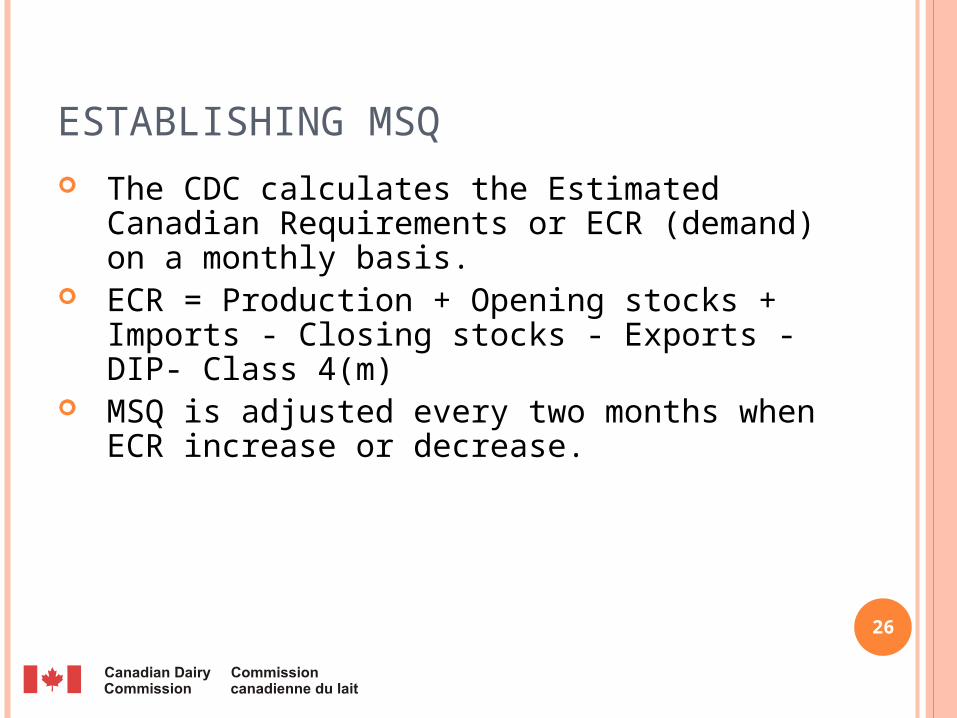
ESTABLISHING MSQ The CDC calculates the Estimated Canadian
Requirements or ECR (demand) on a monthly basis.
ECR = Production + Opening stocks + Imports - Closing stocks - Exports - DIP- Class 4(m)
MSQ is adjusted every two months when ECR increase or decrease.
26
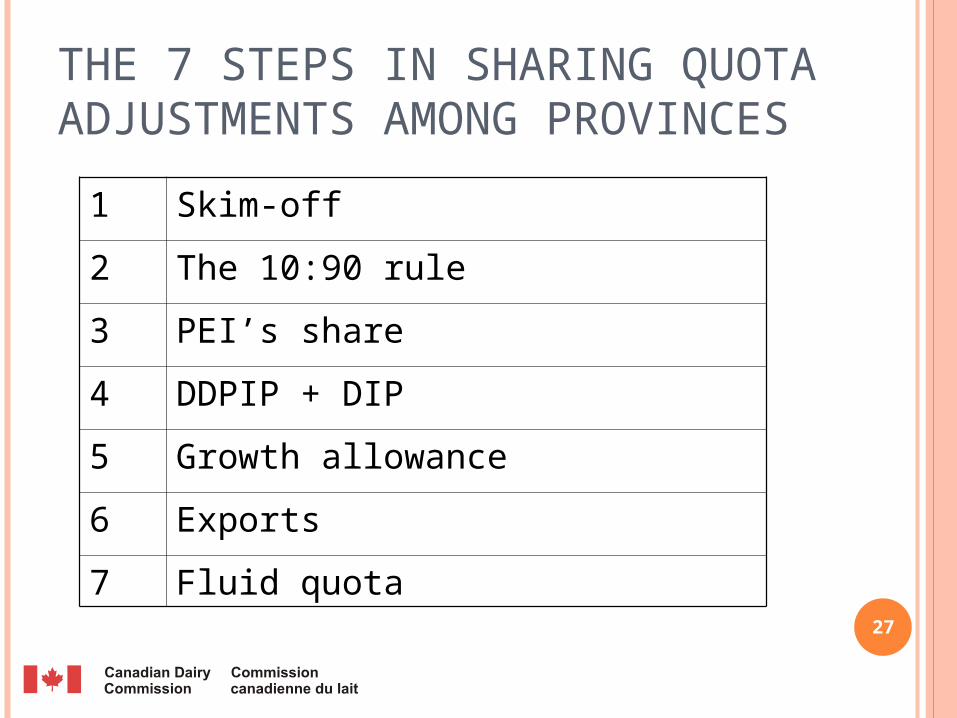
THE 7 STEPS IN SHARING QUOTA ADJUSTMENTS AMONG PROVINCES
1 Skim-off
2 The 10:90 rule
3 PEI’s share
4 DDPIP + DIP
5 Growth allowance
6 Exports
7 Fluid quota27
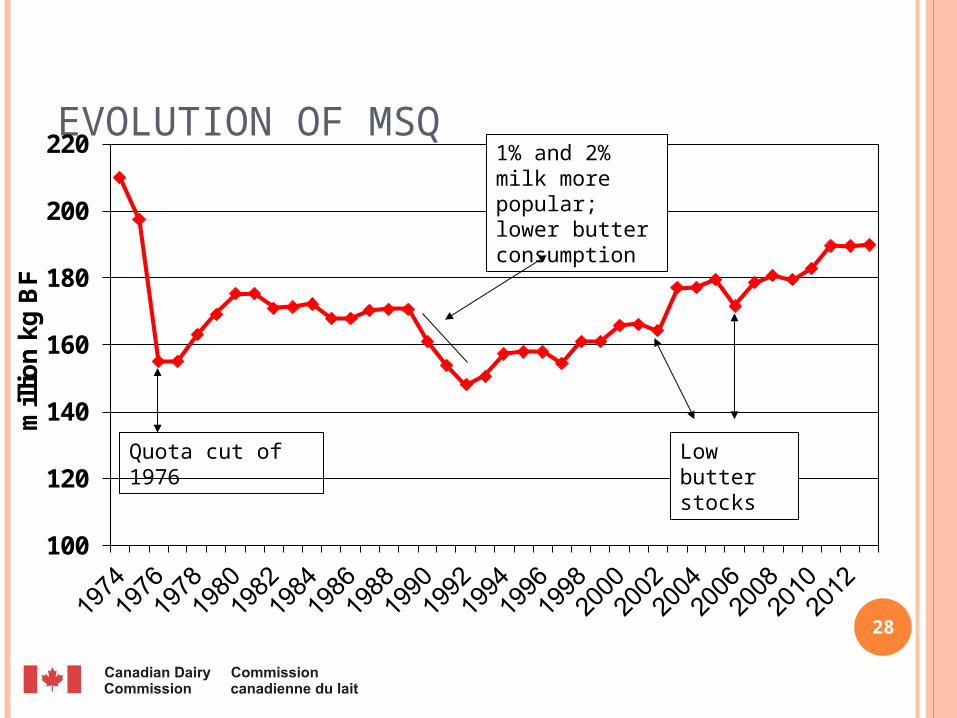
EVOLUTION OF MSQ
100
120
140
160
180
200
220
mil
lio
n k
g B
F
28
Quota cut of 1976
1% and 2% milk more popular; lower butter consumption
Low butter stocks
RESPECTING PRODUCTION TARGETS Provincial production targets:
Upper limit: 0.5% Lower limit: 1.5%
Provinces are free to have their own policies to adjust their farm quota or not, however, provinces will be penalized if they over or under produce their share of quota.
Over production: no payment for the milk + penalty
Under production: lost opportunity to produce
29
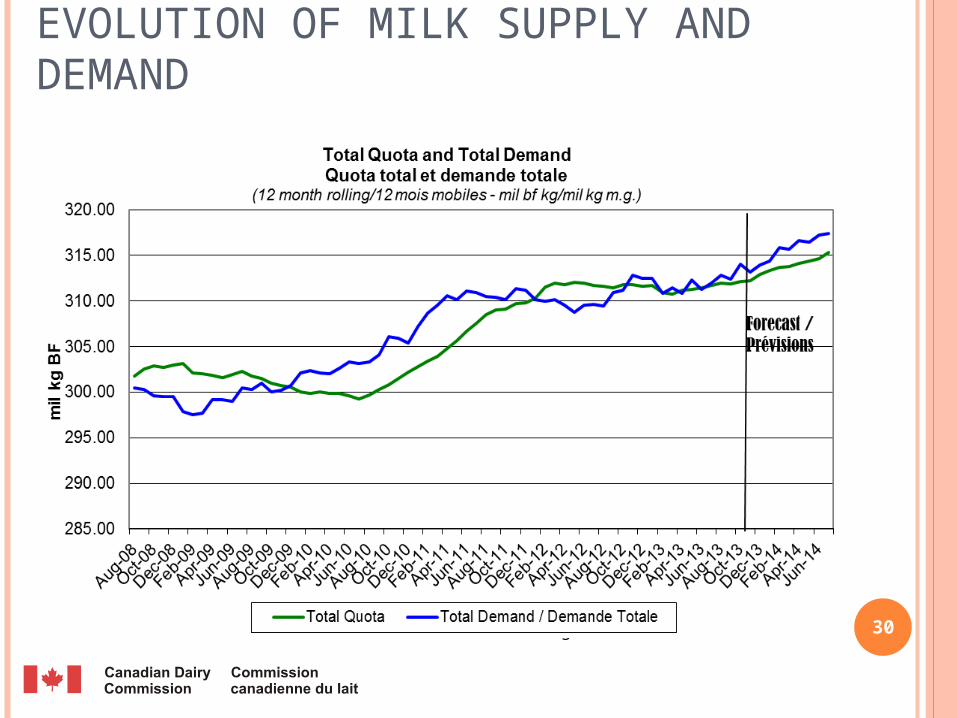
EVOLUTION OF MILK SUPPLY AND DEMAND
30Forecast includes a 1% growth allowance
CDC SEASONALITY PROGRAMS
While milk production is quite stable year round, people consume more dairy products in the fall/winter and less in the spring.
To offset this, the CDC buys and stores butter and skim milk powder in the spring and puts those products back in the market in the fall/winter.
These transactions are done at support prices.
31
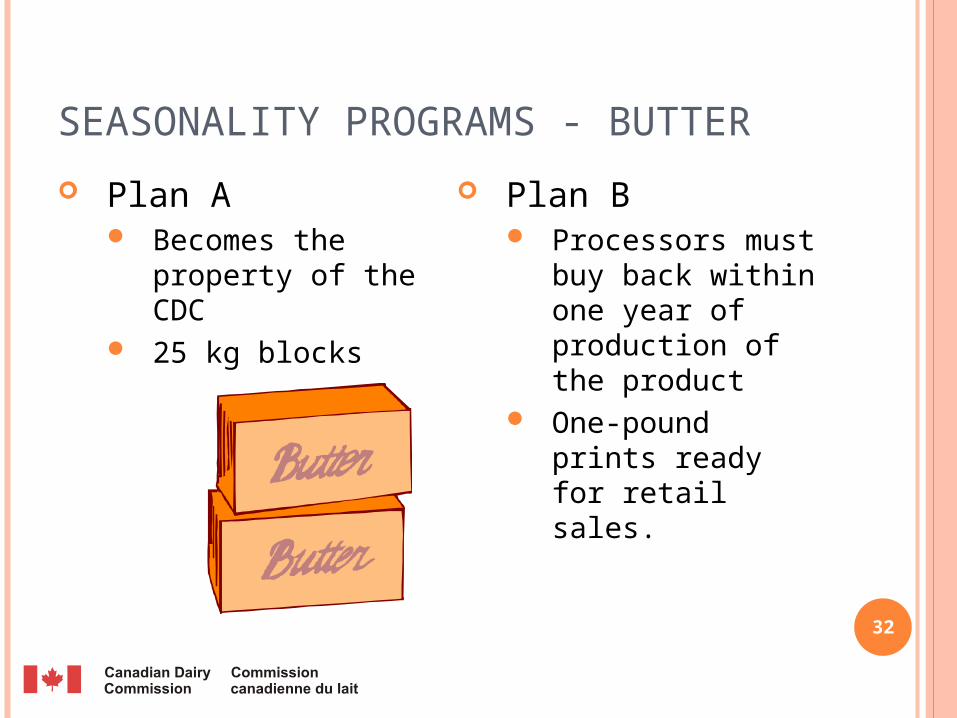
SEASONALITY PROGRAMS - BUTTER
32
Plan A Becomes the
property of the CDC
25 kg blocks
Plan B Processors must
buy back within one year of production of the product
One-pound prints ready for retail sales.
MANAGING SURPLUSES• Production is managed on a butterfat basis.• Surpluses of milk solids non fat (SNF) arise
because consumers want the fat portion of the milk more than the SNF portion.
• The CDC buys the surplus SNF and disposes of it by exporting it or selling it for animal feed.
• Both these markets yield a lower return to producers than regular sales.
33
CDC IMPORT / EXPORT
34
IMPORTS According to WTO
(3,274 t) Butter: sold to further
processors Cheese: private sector
imports (20,412 t)
EXPORTS Subsidized exports
according to WTO limits (none to USA)
SMP (CDC exports to Cuba and Mexico)
Permits for private exporters including non-contingent classes

THE MILK POOLS35
POOLS WERE ESTABLISHED IN THEMID-1990’S IN RESPONSE TO… Increased concentration at the retail and
processing levels New trade rules (FTA, NAFTA, WTO) Differing provincial policies (for ex. milk
allocation to plants) Fluid milk moving between provinces Inequities in producer returns
36
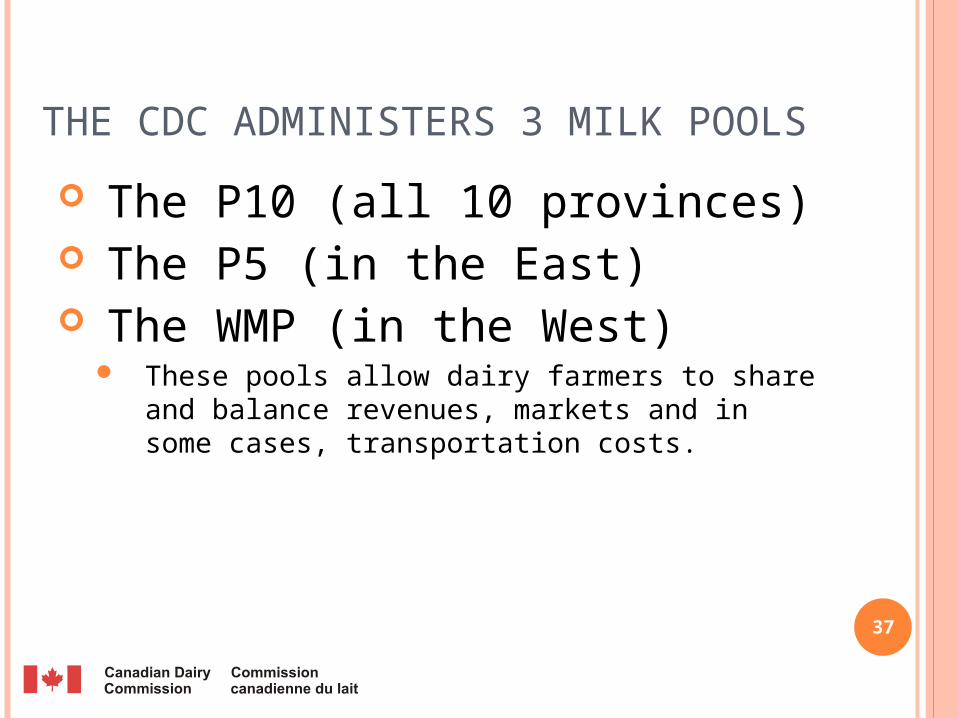
THE CDC ADMINISTERS 3 MILK POOLS
The P10 (all 10 provinces) The P5 (in the East) The WMP (in the West)
These pools allow dairy farmers to share and balance revenues, markets and in some cases, transportation costs.
37
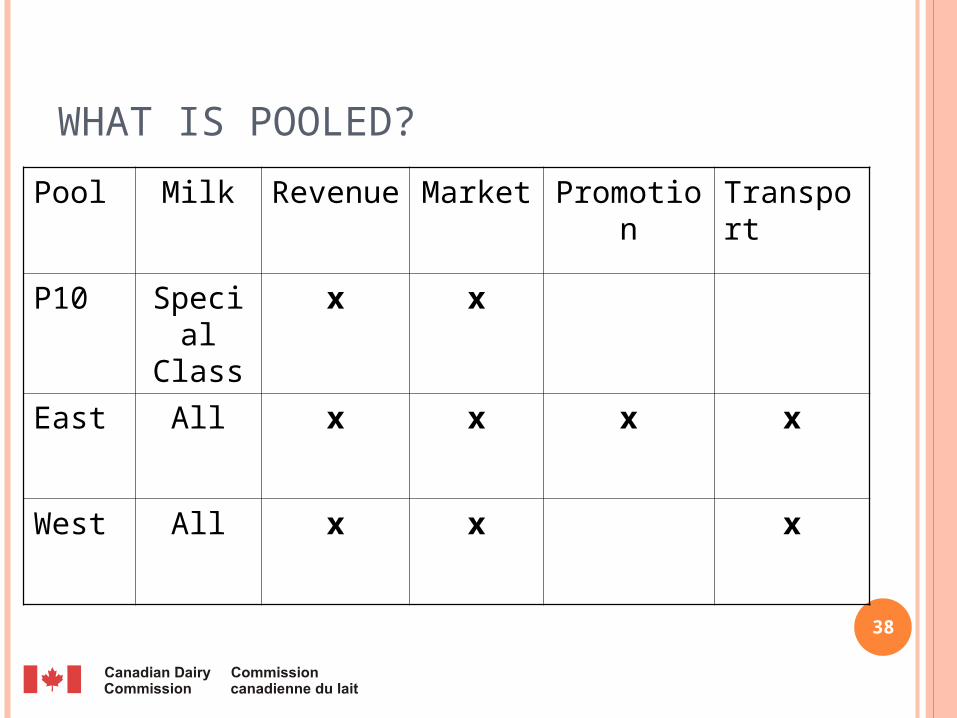
WHAT IS POOLED?
Pool Milk Revenue Market Promotion Transport
P10 Special Class
x x
East All x x x x
West All x x x
38
HOW POOLS ARE ADMINISTERED
Provinces report production and sales data (by milk class) monthly to the CDC.
The CDC calculates money transfers between members to equalize returns.
The CDC calculates quota allocation when demand changes.
The CDC keeps a bank account for pool operations. 39
RESULTING IN HARMONIZATION OF…
Multiple component pricing Producer prices Milk classification Quota policies
POOL = RISK MANAGEMENT TOOL
40
CURRENT ISSUES41
CURRENT ISSUES
Increased imports and cross-border shopping Harmonization issues within regional pools
Quota management Audit rules
National all milk pool Milk allocation to plants
Marketing/Innovation Special Classes, Dairy Marketing Program and
CDC Dairy Innovation Program Trade negotiations Focus market growth
42
Several countries still have high budget expenditure for the milk sector EU - €3,5 billion on average 2008-2011 US – approx. $4 billion per year ($40 billion in the
last decade) – New Farm Bill? These subsidies contribute to depressed Pw Trade agreements
WTO CETA (additional cheese imports) TPP ?
Producing milk in Northern hemisphere is more costly than in the Southern hemisphere
SOME OBSERVATIONS ON TRADE
43
1% permanent growth allowance for added flexibility in supply
Dairy Innovation Program Skim Milk Redirection Program Mozzarella market and fresh pizza - Class 3(d) More flexible allocation policies (yogurt and fine
cheeses) On-going development of market of SNF
Reduce structural surplus Opportunity to add value and increase returns to producers
without increasing price to consumers
INCREASED FOCUS ON ADDITIONAL FLEXIBILITY TO GROW THE MARKET
44

A NOTE OF INTEREST FOR STUDENTS…
45
CDC GRADUATE SCHOLARSHIPS • To ensure that Canada has enough specialists in the areas of
• Food and dairy sciences• Economics and policy (supply mgt.)
• Animal science• CDC commitment: $3 million over 5 years
• 70 M.Sc.’s and 25 Ph.D.’s• Renewed for the last time 2011-2016
46
QUESTIONS
www.cdc-ccl.gc.cawww.dairyinfo.gc.ca
www.milkingredients.ca47