Embed Size (px)
Citation preview

Borough of Oadby & Wigston
Directorate of Community Services
Oadby and Wigston Core Strategy
Leicester Principal Urban Area Strategic Planning Context
Directorate of Community Services Oadby and Wigston Borough Council
October 2009
Contents 1. Introduction 2. Extent of Leicester Principal Urban Area 3. Green Wedges 4. Hierarchy of Centres 5. Transport Corridors 6. Employment Development 7. Housing 8 Commuting Appendix 1 – PUA Composition Appendix 2 – Retail Floorspace Statistics Appendix 3 – Public Transport Frequencies Appendix 4 – Employment Land Supply & Demand
1. Introduction 1.1 This document seeks to summarise elements of existing published reports
and emergent development plan documents in order to express the strategic planning context of the Leicester Principal Urban Area (PUA).
1.2 Due to the timing of the preparation of various development plan documents
by local planning authorities it is not necessarily intended that they will all respond to the strategic planning context immediately. However, this document provides a basis upon which consideration can be given in the future.
1.3 By convention, the component elements of the PUA are described clockwise
from due north. In terms of local authorities, this sequence is Leicester City, Charnwood Borough, Harborough District, Oadby & Wigston Borough, and Blaby District. This sequence does not indicate any order of precedence.
1.4 The documents that have informed this strategic planning context include:
• Leicester City Core Strategy Submission (Sept 2009)
• Charnwood Borough Core Strategy Further Consultation (Oct 2008)
• Harborough District Core Strategy Alternative Options Consultation (June 2009)
• Oadby & Wigston Borough Core Strategy Submission (Sept 2009)
• Blaby District Core Strategy Publication Consultation (July 2009) 1.5 Other key sources include:
• CgMs Central Leicestershire Retail Study (2003)
• PACEC Leicester & Leicestershire Housing Market Area Employment Land Study (December 2008)
• Leicestershire / Central Leicestershire Bus Map (June 2009)
• Strategic Housing Market Area Assessment (2008)
• River Soar and Grand Union Canal Strategy (2009) 1.6 Officers of each of the PUA Authorities, including Leicestershire County
Council have been consulted on a draft of this document and where relevant, their comments have been included. A background paper has been produced which documents the comments, responses and a changes to the document as a result of the consultation.
2. Extent of Leicester Principal Urban Area 2.1 The built up area centred on Leicester is designated as one of 5 Principal
Urban Areas in the region by Policy 3 of the East Midlands Regional Plan. Policy 1 of the Three Cities Sub-Regional Strategy in that plan further defines the built up area centred on Leicester as comprising:
Table 2.1 RSS Policy 3 Definition of Leicester PUA Local Authority PUA Settlements
Leicester City Whole Area Charnwood Borough Birstall
Thurmaston Harborough District Scraptoft
Thurnby & Bushby Oadby & Wigston Borough Oadby
Wigston South Wigston
Blaby District Glen Parva Braunstone Leicester Forest East Kirby Muxloe Glenfield
2.2 For the avoidance of doubt, Meridian Park, Fosse Park and Grove Park
commercial estates are part of the built up area of Braunstone and thus of the PUA.
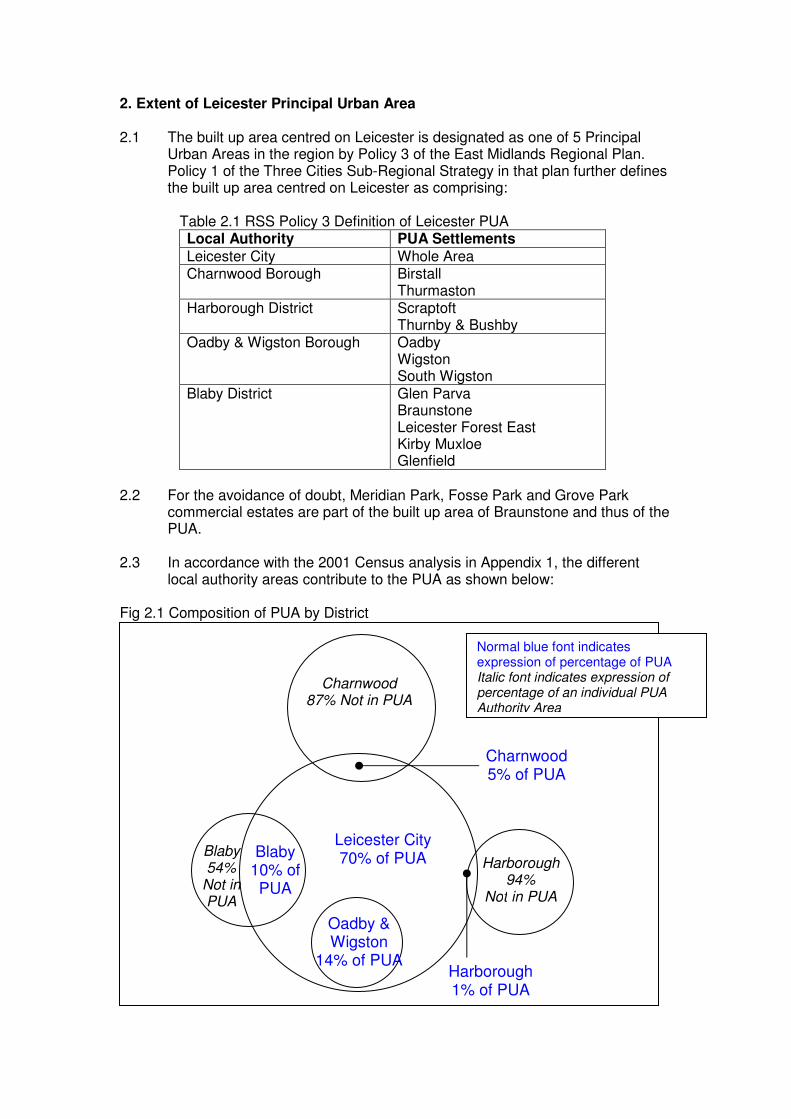
2.3 In accordance with the 2001 Census analysis in Appendix 1, the different
local authority areas contribute to the PUA as shown below: Fig 2.1 Composition of PUA by District
Leicester City 70% of PUA
Oadby & Wigston
14% of PUA
Blaby 10% of PUA
Charnwood 5% of PUA
Harborough 1% of PUA
Charnwood 87% Not in PUA
Harborough 94%
Not in PUA
Blaby 54%
Not in PUA
Normal blue font indicates expression of percentage of PUA Italic font indicates expression of percentage of an individual PUA Authority Area
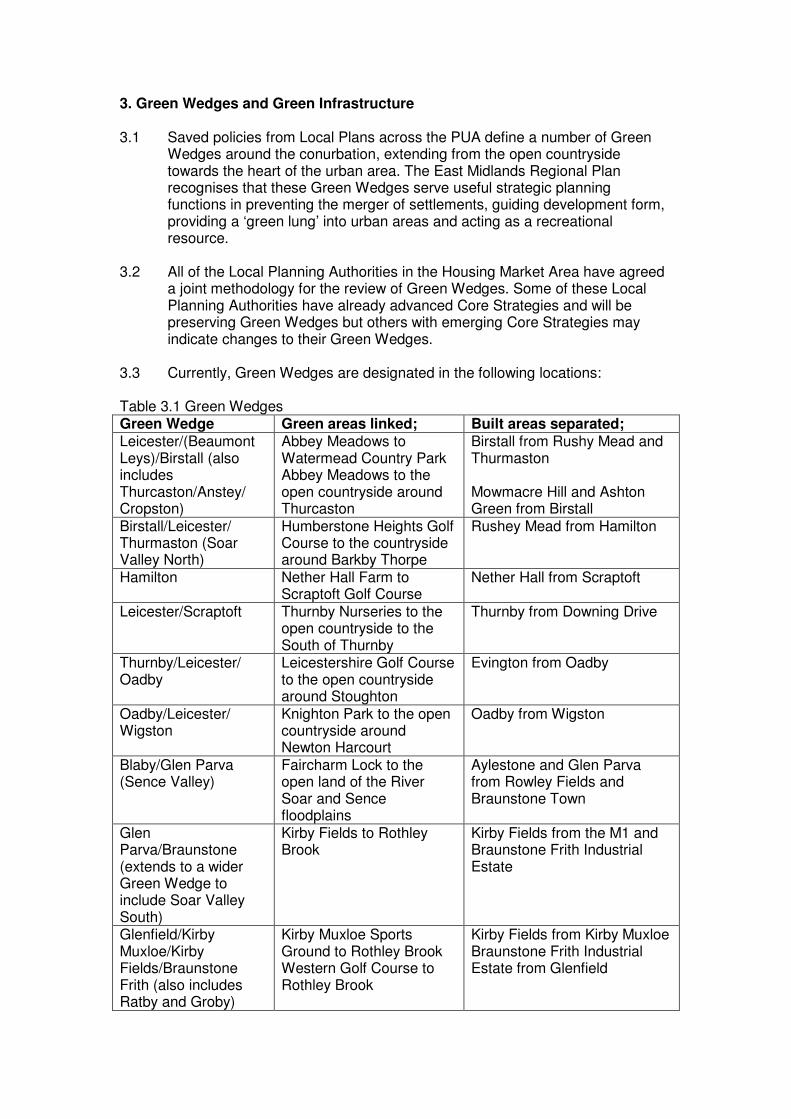
3. Green Wedges and Green Infrastructure 3.1 Saved policies from Local Plans across the PUA define a number of Green
Wedges around the conurbation, extending from the open countryside towards the heart of the urban area. The East Midlands Regional Plan recognises that these Green Wedges serve useful strategic planning functions in preventing the merger of settlements, guiding development form, providing a ‘green lung’ into urban areas and acting as a recreational resource.
3.2 All of the Local Planning Authorities in the Housing Market Area have agreed
a joint methodology for the review of Green Wedges. Some of these Local Planning Authorities have already advanced Core Strategies and will be preserving Green Wedges but others with emerging Core Strategies may indicate changes to their Green Wedges.
3.3 Currently, Green Wedges are designated in the following locations: Table 3.1 Green Wedges Green Wedge Green areas linked; Built areas separated; Leicester/(Beaumont Leys)/Birstall (also includes Thurcaston/Anstey/ Cropston)
Abbey Meadows to Watermead Country Park Abbey Meadows to the open countryside around Thurcaston
Birstall from Rushy Mead and Thurmaston Mowmacre Hill and Ashton Green from Birstall
Birstall/Leicester/ Thurmaston (Soar Valley North)
Humberstone Heights Golf Course to the countryside around Barkby Thorpe
Rushey Mead from Hamilton
Hamilton Nether Hall Farm to Scraptoft Golf Course
Nether Hall from Scraptoft
Leicester/Scraptoft Thurnby Nurseries to the open countryside to the South of Thurnby
Thurnby from Downing Drive
Thurnby/Leicester/ Oadby
Leicestershire Golf Course to the open countryside around Stoughton
Evington from Oadby
Oadby/Leicester/ Wigston
Knighton Park to the open countryside around Newton Harcourt
Oadby from Wigston
Blaby/Glen Parva (Sence Valley)
Faircharm Lock to the open land of the River Soar and Sence floodplains
Aylestone and Glen Parva from Rowley Fields and Braunstone Town
Glen Parva/Braunstone (extends to a wider Green Wedge to include Soar Valley South)
Kirby Fields to Rothley Brook
Kirby Fields from the M1 and Braunstone Frith Industrial Estate
Glenfield/Kirby Muxloe/Kirby Fields/Braunstone Frith (also includes Ratby and Groby)
Kirby Muxloe Sports Ground to Rothley Brook Western Golf Course to Rothley Brook
Kirby Fields from Kirby Muxloe Braunstone Frith Industrial Estate from Glenfield
Beaumont Leys/Glenfield/ Anstey/Groby
Gorse Hill City Farm to the A46 corridor and Rothley Brook
Glenfield from Beaumont Leys
3.4 The River Soar and Grand Union Canal Corridor provides a key element of
Green Infrastructure running through the PUA, from Birstall and Thurmaston in the north to South Wigston in the south. The PUA Authorities have worked jointly with other partners to produce a River Soar and Grand Union Canal Strategy for a 23 mile long stretch of the corridor between Loughborough and Kilby Bridge which include the entire section that runs through the PUA.
3.5 The strategy sets out the wider rationale, context, strategic priorities and
actions for maximising the positive economic, social and environmental contribution of the River Soar and Grand Union Canal Corridor.
3.6 The Strategy notes that the Corridor is not currently fulfilling its potential for
a number of reasons, including its low profile and poor accessibility in places. It recommends a series of actions to improve the physical landscape of the Waterway and more crucially how the Waterway is utilised. The emphasis is on outlining a route-map of short to medium term interventions that are realistic and affordable, and can help to put in place the conditions to secure long term change.
3.7 This strategy complements the emerging Local Development Frameworks
and the Masterplans guiding development in central Leicester, Charnwood, Blaby and Oadby, and Wigston. It provides a unified strategy for the Waterway as it passes through this part of Leicestershire.
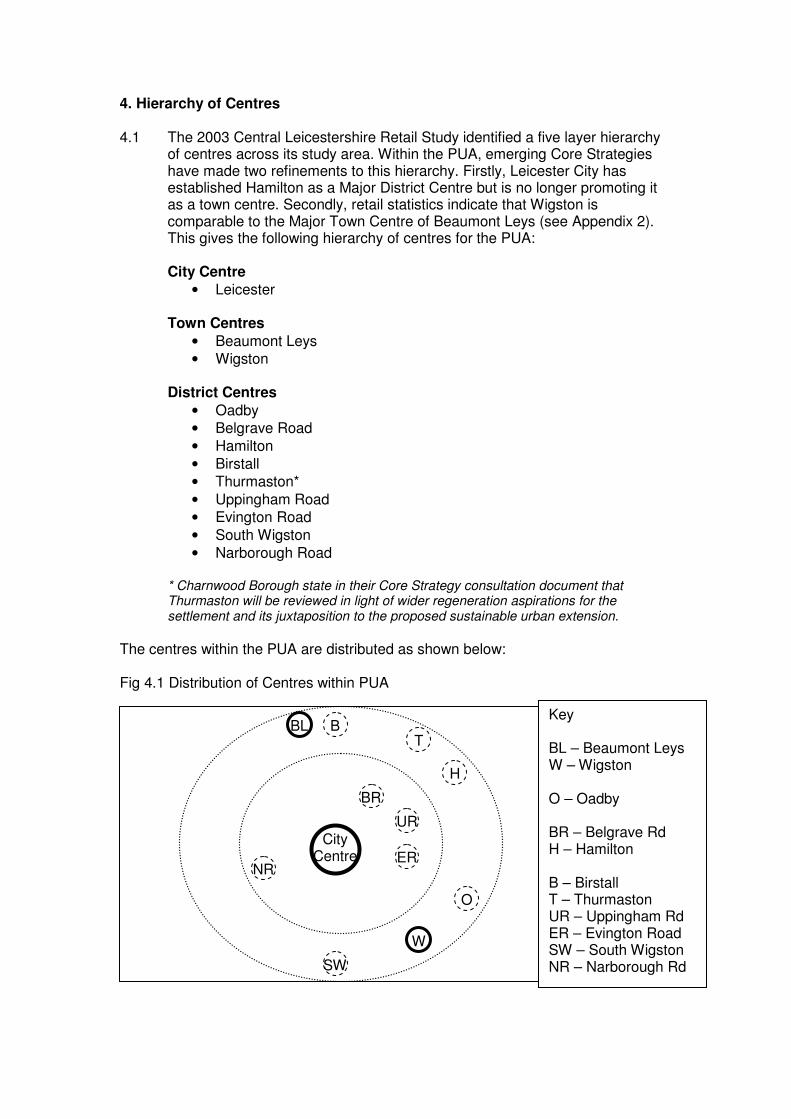
4. Hierarchy of Centres 4.1 The 2003 Central Leicestershire Retail Study identified a five layer hierarchy
of centres across its study area. Within the PUA, emerging Core Strategies have made two refinements to this hierarchy. Firstly, Leicester City has established Hamilton as a Major District Centre but is no longer promoting it as a town centre. Secondly, retail statistics indicate that Wigston is comparable to the Major Town Centre of Beaumont Leys (see Appendix 2). This gives the following hierarchy of centres for the PUA:
City Centre
• Leicester Town Centres
• Beaumont Leys
• Wigston District Centres
• Oadby
• Belgrave Road
• Hamilton
• Birstall
• Thurmaston*
• Uppingham Road
• Evington Road
• South Wigston
• Narborough Road * Charnwood Borough state in their Core Strategy consultation document that Thurmaston will be reviewed in light of wider regeneration aspirations for the settlement and its juxtaposition to the proposed sustainable urban extension.
The centres within the PUA are distributed as shown below: Fig 4.1 Distribution of Centres within PUA
City Centre
BL
O
W
BR
H
UR
B T
ER
SW
NR
Key BL – Beaumont Leys W – Wigston O – Oadby BR – Belgrave Rd H – Hamilton B – Birstall T – Thurmaston UR – Uppingham Rd ER – Evington Road SW – South Wigston NR – Narborough Rd
5. Transport Corridors 5.1 The highway structure of Leicester PUA is defined by two ring-roads, an inner
ring-road around the city centre and an outer ring-road around a wider central area, with a number of radial routes running out from the inner ring-road to the outer ring-road and beyond. Bus routes are often complex. In order to help analysis of the various routes this section focuses on those services that extend beyond the outer ring road and therefore serve the largest part of the PUA by travelling towards its extremity and those services that serve the town and district centres within the PUA. This section refers to centrifugal services – this indicates that account is only being taken of services travelling in one direction, usually outbound.
5.2 Paragraph 14.21 of the Central Leicestershire Local Transport Plan 2006-
2011 states: ‘We have found that the best way to increase bus patronage is to include as many bus priority and bus service related infrastructure measures as possible, and appropriate, along a corridor as a package of measures in a single project. This results in a quality bus corridor’.
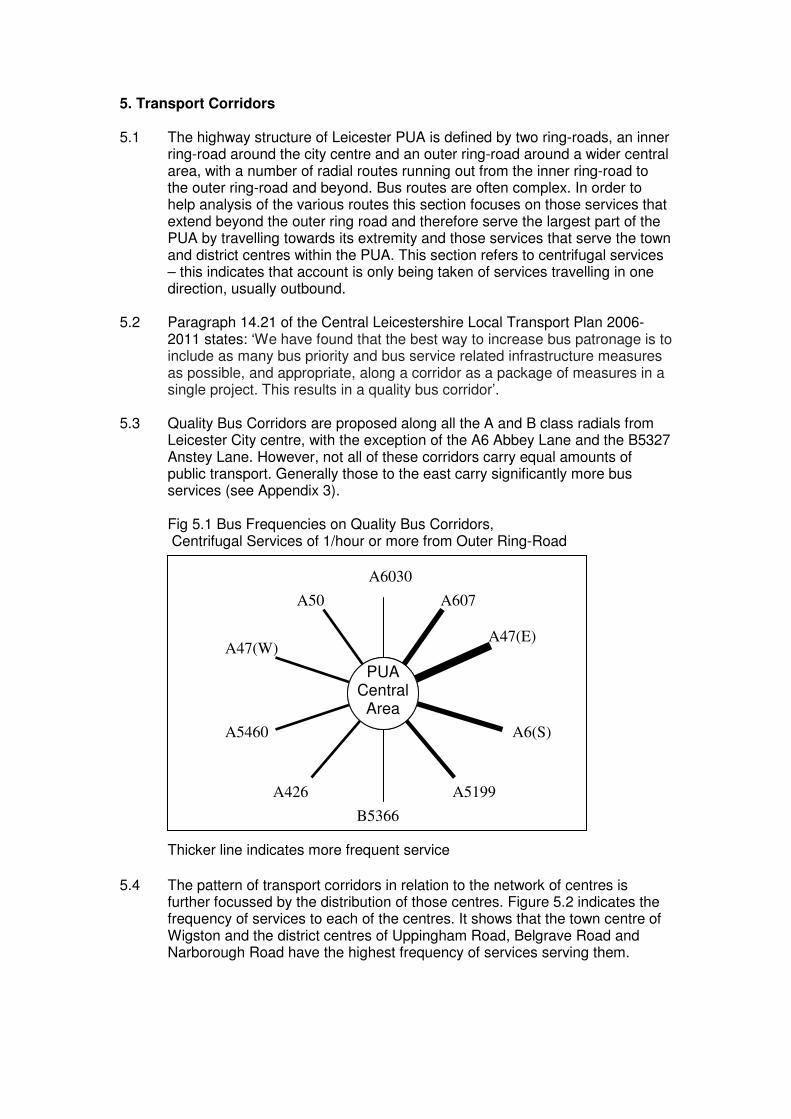
5.3 Quality Bus Corridors are proposed along all the A and B class radials from
Leicester City centre, with the exception of the A6 Abbey Lane and the B5327 Anstey Lane. However, not all of these corridors carry equal amounts of public transport. Generally those to the east carry significantly more bus services (see Appendix 3).
Fig 5.1 Bus Frequencies on Quality Bus Corridors,
Centrifugal Services of 1/hour or more from Outer Ring-Road
Thicker line indicates more frequent service
5.4 The pattern of transport corridors in relation to the network of centres is
further focussed by the distribution of those centres. Figure 5.2 indicates the frequency of services to each of the centres. It shows that the town centre of Wigston and the district centres of Uppingham Road, Belgrave Road and Narborough Road have the highest frequency of services serving them.
A6030
A607
A47(E)
A6(S)
A5199
B5366
A426
A5460
A47(W)
A50
PUA Central
Area
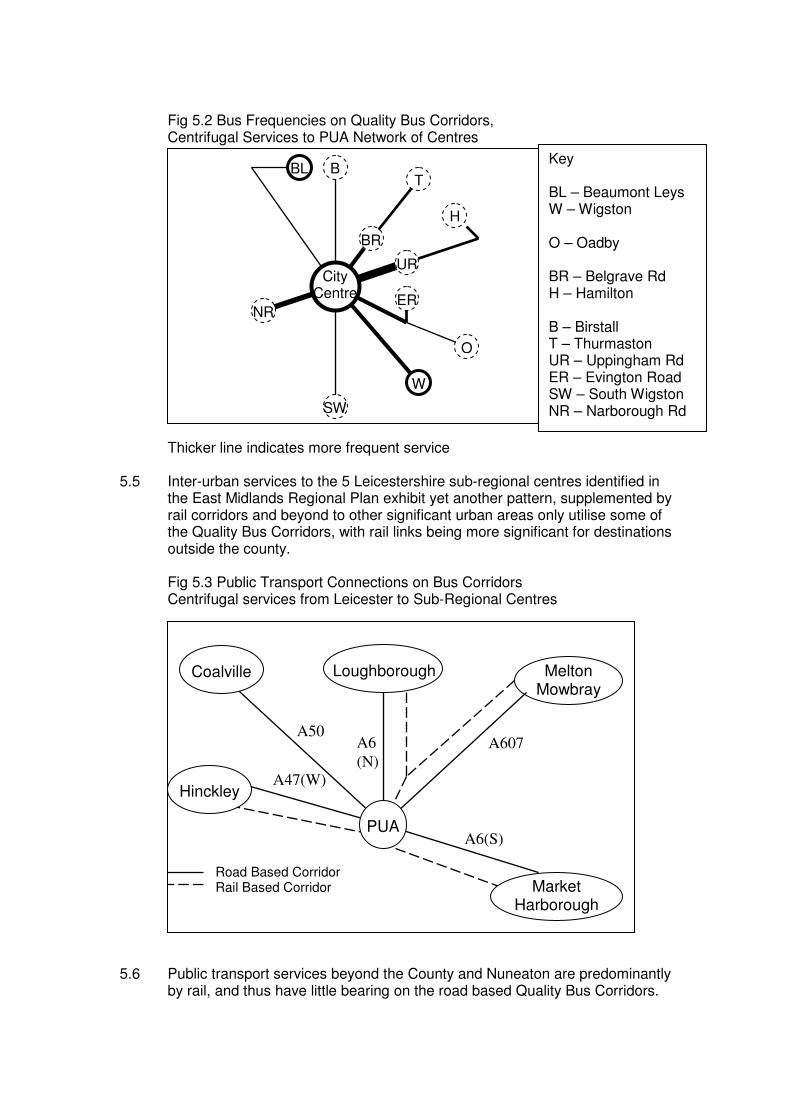
Fig 5.2 Bus Frequencies on Quality Bus Corridors, Centrifugal Services to PUA Network of Centres
Thicker line indicates more frequent service 5.5 Inter-urban services to the 5 Leicestershire sub-regional centres identified in
the East Midlands Regional Plan exhibit yet another pattern, supplemented by rail corridors and beyond to other significant urban areas only utilise some of the Quality Bus Corridors, with rail links being more significant for destinations outside the county.
Fig 5.3 Public Transport Connections on Bus Corridors Centrifugal services from Leicester to Sub-Regional Centres
Road Based Corridor Rail Based Corridor
5.6 Public transport services beyond the County and Nuneaton are predominantly
by rail, and thus have little bearing on the road based Quality Bus Corridors.
A47(W)
City Centre
BL
O
W
BR
H
UR
B T
ER
SW
NR
Key BL – Beaumont Leys W – Wigston O – Oadby BR – Belgrave Rd H – Hamilton B – Birstall T – Thurmaston UR – Uppingham Rd ER – Evington Road SW – South Wigston NR – Narborough Rd
Loughborough
A607
A6(S)
A50
Coalville Melton Mowbray
A6
(N)
PUA
Hinckley
Market Harborough
5.7 It should be noted that this document provides a snapshot in time and that bus routes and frequencies will change. However, overall service frequencies on the major bus corridors and to major destinations are likely to remain reasonably consistent over time.
5.8 Further work could usefully be done on transport corridors in the future. Some
of this is likely to be informed through the emerging evidence base for Local Transport Plan 3, the Transport Chapter for the Leicester and Leicestershire Economic Assessment and the emerging Leicester and Leicestershire Integrated Transport Model.
5.9 The Central Leicestershire Local Transport Plan sets out the following longer
term transport strategy for Central Leicestershire, which includes the PUA. This is as follows:
2006-2011
• Quality bus corridors on radial routes into the City.
• Junction alterations at the outer ring to ensure better use of that orbital route.
• Inner city centre road alterations to allow for increased bus stopping and improved circulation.
• Two further park and ride sites.
• Real time information.
• Intelligent transport systems to improve vehicle flows and safety.
• A comprehensive and coordinated behavioural change and travel promotion package.
• Improved management of the buses.
2011-2016 5.10 The high level outcomes for the second stage from 2011 to 2016 will be to
substantially complete the same sort of policies and schemes embarked upon during the first stage. Bus loadings are likely to be sufficiently high on key corridors to justify the consideration of bus based mass rapid transit proposals. A measured increase in cycling and walking is anticipated. The capacity of the existing network for general vehicles and buses will have been maximised and there will be optimum real time information provision to passengers and drivers. Quality of life and the public realm will continue to improve.
5.11 The Local Transport Plan also includes high level outcomes for the period
from 2016 to 2036. However, these are more aspirational because the evidence base so far ahead is very limited.
6. Employment Development 6.1 The 2008 Leicester & Leicestershire Housing Market Area Employment Land
Study assessed the need for new office, industrials and warehouse development up to 2026, and compared this with committed provision.
6.2 However, it is difficult to build this into a picture for the PUA, because the
employment land study only provides information at the level of whole Local Planning Authority Areas. An approximate employment model of the PUA can be built from whole Local Planning Authority area data, taking into account not just the physical extent of the Leicester conurbation, but also the wider economic footprint of the PUA in terms of employment sites and labour supply. In order of certainty, this model is constructed as follows:
6.3 Leicester City – Wholly within the PUA economic model. 6.4 Oadby & Wigston Borough – As only the Hamlet of Kilby Bridge lies outside
the PUA, effectively wholly within the PUA economic model. 6.5 Blaby District – The emerging Blaby Core Strategy recognises a threefold
division of the District between an urban northern area, an intermediate central area and a rural southern area. Most of the northern area is part of the PUA, as are the key employment areas of the central area (e.g. Meridian and Grove Parks). The rest of the central area can be considered to be functionally part of the PUA in employment site and labour supply terms. Though the rural southern area is not strongly economically related to the PUA, the economy of this area is not sufficiently large to distort an understanding of the PUA, whereas excluding the northern and central areas from the PUA would create such a distortion. Estimated as wholly within the PUA economic model.
6.6 Charnwood Borough – The emerging Charnwood Core Strategy recognises
a two-fold division of the Borough into North Charnwood and South Charnwood. North Charnwood is centred on Loughborough which has a significant and distinct economy of its own that would distort a picture of the Leicester conurbation if included within a model of the PUA economy. In contrast South Charnwood is largely part of the PUA, with those elements outside the PUA still being within the economic footprint of the conurbation. Consequently, it is necessary to include South Charnwood in any model of the PUA economy, but to exclude North Charnwood. Though this is easy to do in terms of employment sites, it has not been done in terms of demand. Consequently, the demand for employment development in South Charnwood is estimated as half the total demand for the Borough.
6.7 Harborough District – A relatively small part of Harborough District is part of
the PUA, and that area does not include any significant employment sites. In contrast, there are significant and distinct economies centred around Harborough and Lutterworth that would distort any picture of the Leicester conurbation if included in a model of the PUA economy. Effectively wholly outside the PUA economic model.
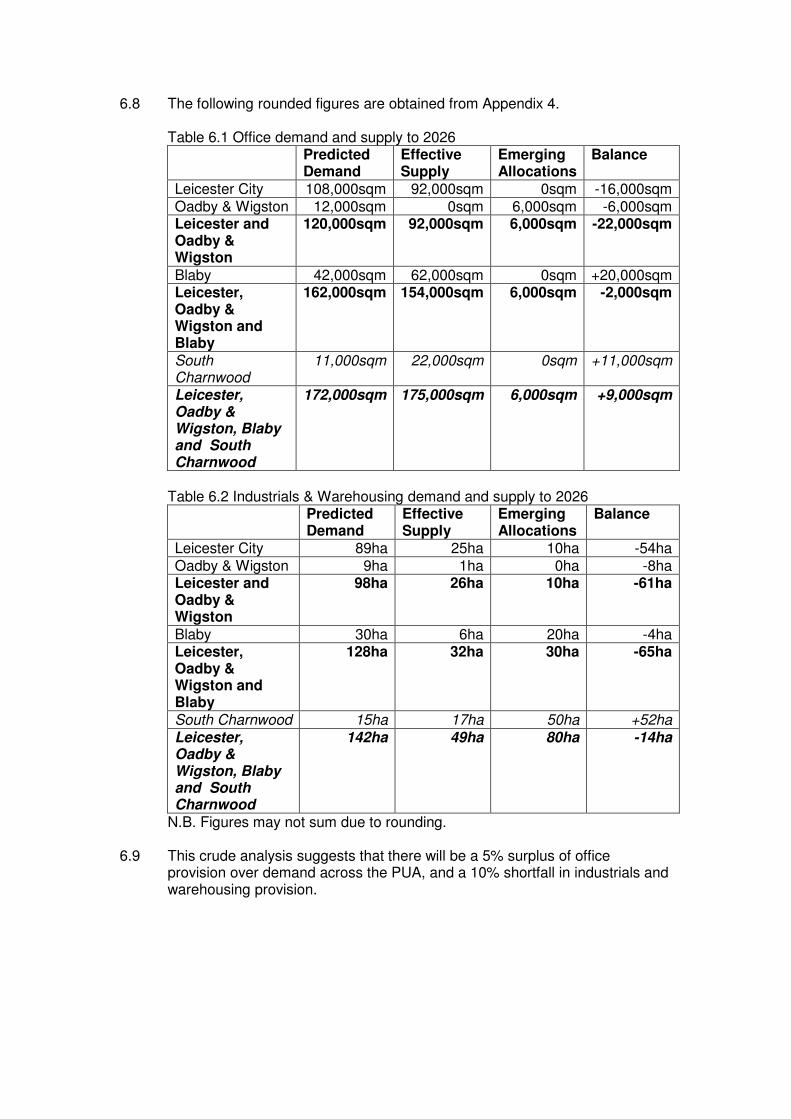
6.8 The following rounded figures are obtained from Appendix 4.
Table 6.1 Office demand and supply to 2026 Predicted
Demand Effective Supply
Emerging Allocations
Balance
Leicester City 108,000sqm 92,000sqm 0sqm -16,000sqm Oadby & Wigston 12,000sqm 0sqm 6,000sqm -6,000sqm Leicester and Oadby & Wigston
120,000sqm 92,000sqm 6,000sqm -22,000sqm
Blaby 42,000sqm 62,000sqm 0sqm +20,000sqm Leicester, Oadby & Wigston and Blaby
162,000sqm 154,000sqm 6,000sqm -2,000sqm
South Charnwood
11,000sqm 22,000sqm 0sqm +11,000sqm
Leicester, Oadby & Wigston, Blaby and South Charnwood
172,000sqm 175,000sqm 6,000sqm +9,000sqm
Table 6.2 Industrials & Warehousing demand and supply to 2026 Predicted
Demand Effective Supply
Emerging Allocations
Balance
Leicester City 89ha 25ha 10ha -54ha Oadby & Wigston 9ha 1ha 0ha -8ha Leicester and Oadby & Wigston
98ha 26ha 10ha -61ha
Blaby 30ha 6ha 20ha -4ha Leicester, Oadby & Wigston and Blaby
128ha 32ha 30ha -65ha
South Charnwood 15ha 17ha 50ha +52ha Leicester, Oadby & Wigston, Blaby and South Charnwood
142ha 49ha 80ha -14ha
N.B. Figures may not sum due to rounding. 6.9 This crude analysis suggests that there will be a 5% surplus of office
provision over demand across the PUA, and a 10% shortfall in industrials and warehousing provision.
7. Housing 7.1 The housing strategy for Leicester and Leicestershire Housing Market Area is
initially focus growth within the Principal Urban Area. During the plan period, and in particular towards the end of the Plan period (2026), planned need for housing developments will be met through the delivery of Sustainable Urban Extensions of the existing Principal Urban Area.
7.2 The East Midlands Regional Plan (2009) suggests that the best opportunity
for additional provision has been identified as being to the west of Leicester in Blaby and to the north of Leicester in Charnwood. A lack of transport infrastructure, specifically in relation to the Strategic Highway Network, indicates that major extensions to the Principal Urban Area of Oadby and Wigston and the Harborough Principal Urban Area would be problematic.
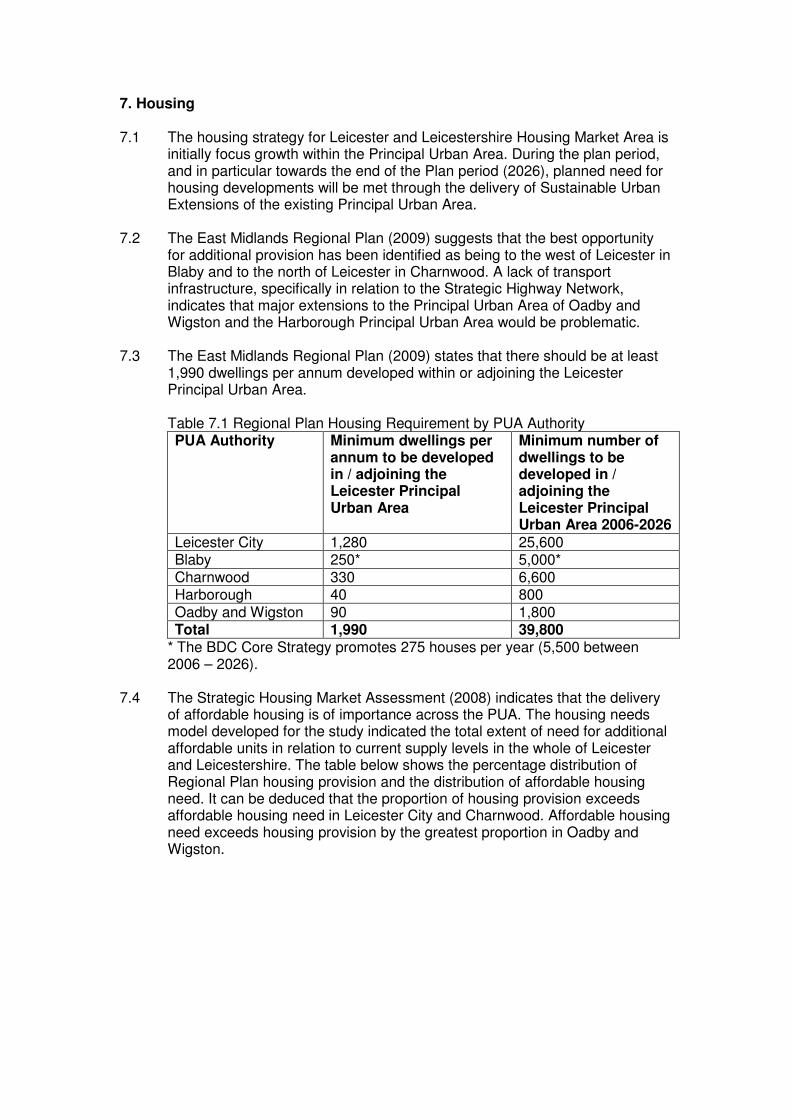
7.3 The East Midlands Regional Plan (2009) states that there should be at least
1,990 dwellings per annum developed within or adjoining the Leicester Principal Urban Area.
Table 7.1 Regional Plan Housing Requirement by PUA Authority PUA Authority Minimum dwellings per
annum to be developed in / adjoining the Leicester Principal Urban Area
Minimum number of dwellings to be developed in / adjoining the Leicester Principal Urban Area 2006-2026
Leicester City 1,280 25,600 Blaby 250* 5,000* Charnwood 330 6,600 Harborough 40 800 Oadby and Wigston 90 1,800 Total 1,990 39,800
* The BDC Core Strategy promotes 275 houses per year (5,500 between 2006 – 2026).
7.4 The Strategic Housing Market Assessment (2008) indicates that the delivery
of affordable housing is of importance across the PUA. The housing needs model developed for the study indicated the total extent of need for additional affordable units in relation to current supply levels in the whole of Leicester and Leicestershire. The table below shows the percentage distribution of Regional Plan housing provision and the distribution of affordable housing need. It can be deduced that the proportion of housing provision exceeds affordable housing need in Leicester City and Charnwood. Affordable housing need exceeds housing provision by the greatest proportion in Oadby and Wigston.

Table 7.2 Distribution of Housing Provision and Affordable Housing Need PUA Authority
Minimum dwellings per annum to be developed in / adjoining the Leicester Principal Urban Area
Distributon of RSS Provision
Affordable Housing Need per annum
Distribution of Affordable Housing Need
Leicester City
1,280 64% 704 54%
Blaby 250* 13% 233 18% Charnwood 330 17% 125 10% Harborough 40 2% 26 2% Oadby and Wigston
90 5% 214 16%
Total 1,990 100% 1303 100%
* The BDC Core Strategy promotes 275 houses per year (5,500 between 2006 – 2026).
7.5 All PUA Authorities have prepared Affordable Housing Viability Assessments
which considers the viability of various policy approaches toward meeting the identified level of affordable housing need.
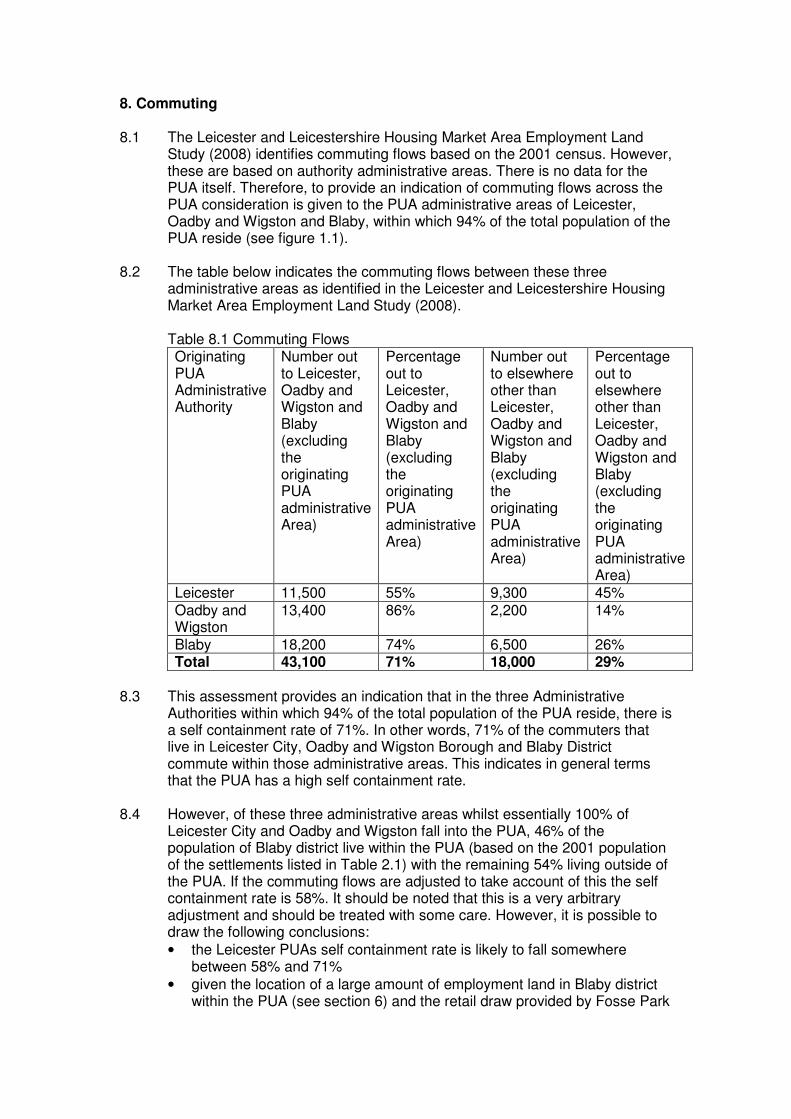
8. Commuting 8.1 The Leicester and Leicestershire Housing Market Area Employment Land
Study (2008) identifies commuting flows based on the 2001 census. However, these are based on authority administrative areas. There is no data for the PUA itself. Therefore, to provide an indication of commuting flows across the PUA consideration is given to the PUA administrative areas of Leicester, Oadby and Wigston and Blaby, within which 94% of the total population of the PUA reside (see figure 1.1).
8.2 The table below indicates the commuting flows between these three
administrative areas as identified in the Leicester and Leicestershire Housing Market Area Employment Land Study (2008).
Table 8.1 Commuting Flows Originating PUA Administrative Authority
Number out to Leicester, Oadby and Wigston and Blaby (excluding the originating PUA administrative Area)
Percentage out to Leicester, Oadby and Wigston and Blaby (excluding the originating PUA administrative Area)
Number out to elsewhere other than Leicester, Oadby and Wigston and Blaby (excluding the originating PUA administrative Area)
Percentage out to elsewhere other than Leicester, Oadby and Wigston and Blaby (excluding the originating PUA administrative Area)
Leicester 11,500 55% 9,300 45% Oadby and Wigston
13,400 86% 2,200 14%
Blaby 18,200 74% 6,500 26% Total 43,100 71% 18,000 29%
8.3 This assessment provides an indication that in the three Administrative
Authorities within which 94% of the total population of the PUA reside, there is a self containment rate of 71%. In other words, 71% of the commuters that live in Leicester City, Oadby and Wigston Borough and Blaby District commute within those administrative areas. This indicates in general terms that the PUA has a high self containment rate.
8.4 However, of these three administrative areas whilst essentially 100% of
Leicester City and Oadby and Wigston fall into the PUA, 46% of the population of Blaby district live within the PUA (based on the 2001 population of the settlements listed in Table 2.1) with the remaining 54% living outside of the PUA. If the commuting flows are adjusted to take account of this the self containment rate is 58%. It should be noted that this is a very arbitrary adjustment and should be treated with some care. However, it is possible to draw the following conclusions:
• the Leicester PUAs self containment rate is likely to fall somewhere between 58% and 71%
• given the location of a large amount of employment land in Blaby district within the PUA (see section 6) and the retail draw provided by Fosse Park
and Leicester City itself, it is likely that this will be a major attractor for commuters and therefore the self containment rate is likely to be nearer 71% than 58%
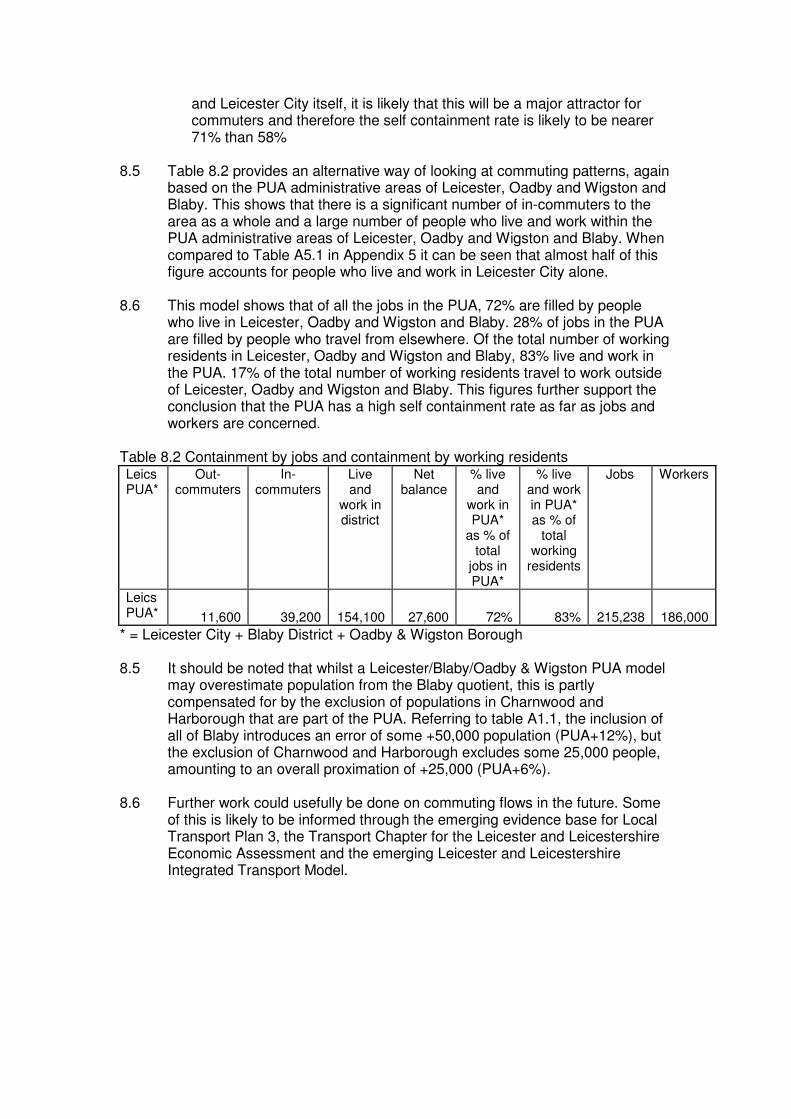
8.5 Table 8.2 provides an alternative way of looking at commuting patterns, again based on the PUA administrative areas of Leicester, Oadby and Wigston and Blaby. This shows that there is a significant number of in-commuters to the area as a whole and a large number of people who live and work within the PUA administrative areas of Leicester, Oadby and Wigston and Blaby. When compared to Table A5.1 in Appendix 5 it can be seen that almost half of this figure accounts for people who live and work in Leicester City alone. 8.6 This model shows that of all the jobs in the PUA, 72% are filled by people who live in Leicester, Oadby and Wigston and Blaby. 28% of jobs in the PUA are filled by people who travel from elsewhere. Of the total number of working residents in Leicester, Oadby and Wigston and Blaby, 83% live and work in the PUA. 17% of the total number of working residents travel to work outside of Leicester, Oadby and Wigston and Blaby. This figures further support the conclusion that the PUA has a high self containment rate as far as jobs and workers are concerned. Table 8.2 Containment by jobs and containment by working residents Leics PUA*
Out-commuters
In-commuters
Live and
work in district
Net balance
% live and
work in PUA*
as % of total
jobs in PUA*
% live and work in PUA* as % of
total working
residents
Jobs Workers
Leics PUA* 11,600 39,200 154,100 27,600 72% 83% 215,238 186,000
* = Leicester City + Blaby District + Oadby & Wigston Borough 8.5 It should be noted that whilst a Leicester/Blaby/Oadby & Wigston PUA model
may overestimate population from the Blaby quotient, this is partly compensated for by the exclusion of populations in Charnwood and Harborough that are part of the PUA. Referring to table A1.1, the inclusion of all of Blaby introduces an error of some +50,000 population (PUA+12%), but the exclusion of Charnwood and Harborough excludes some 25,000 people, amounting to an overall proximation of +25,000 (PUA+6%).
8.6 Further work could usefully be done on commuting flows in the future. Some
of this is likely to be informed through the emerging evidence base for Local Transport Plan 3, the Transport Chapter for the Leicester and Leicestershire Economic Assessment and the emerging Leicester and Leicestershire Integrated Transport Model.

Appendix 1 – PUA Composition Table A1.1 PUA Composition by 2001 Census Population Authority Area
Total Area Population
Sub-areas within PUA
Sub-area population
PUA population
Leicester City 279,923 Leicester City 279,923 279,923 Charnwood Borough
153,462 Birstall Thurmaston
11,480 8,945
20,425
Harborough District
76,559 Scraptoft Thurnby & Bushby
1,521 3,147
4,668
Oadby & Wigston Borough
55,795 Oadby & Wigston Borough
55,795 55,795
Blaby District 90,252 Glen Parva Braunstone LF East Kirby Muxloe Glenfields
5,902 14,981 6,496 4,523 9,721
41,623
Totals 655,991 402,434 402,434

Appendix 2 – Retail Floorspace Statistics Table A2.1 Retail Floorspace Statistics Centre Retail Floorspace (sqm)
Leicester 379,800 Wigston 35,900 Beaumont Leys 29,300 Oadby 11,100 Source: 2004 Retail Floorspace Statistics
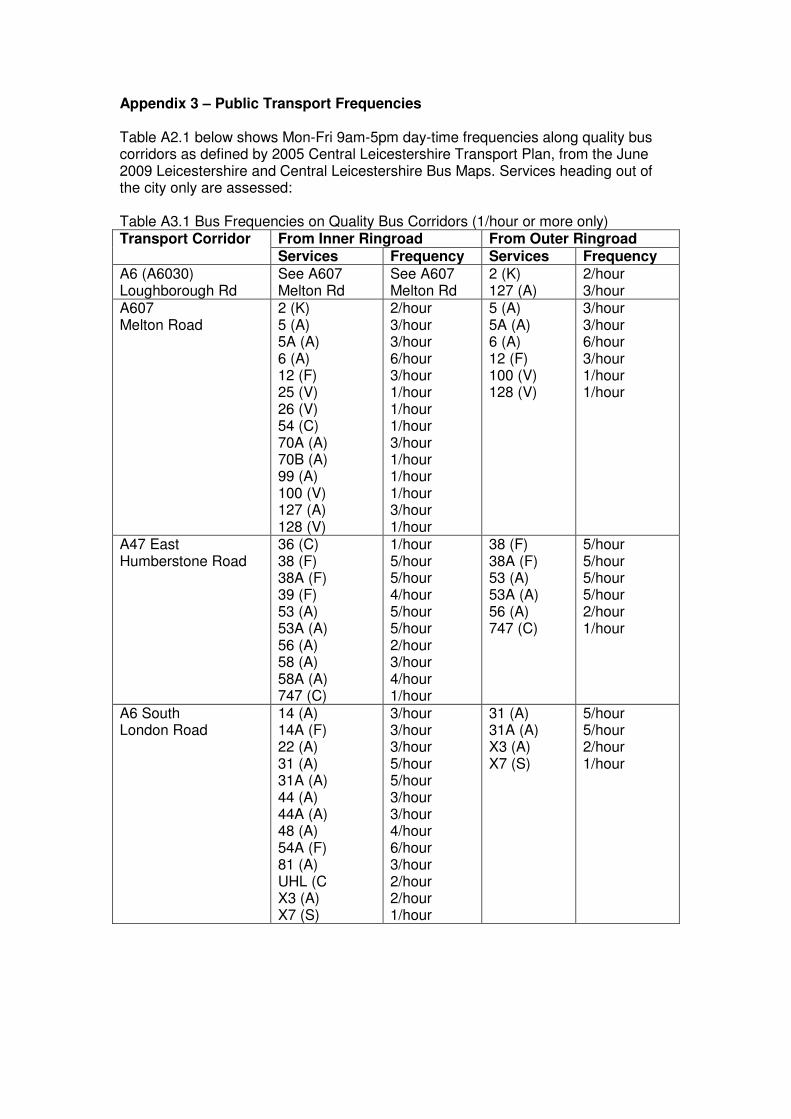
Appendix 3 – Public Transport Frequencies Table A2.1 below shows Mon-Fri 9am-5pm day-time frequencies along quality bus corridors as defined by 2005 Central Leicestershire Transport Plan, from the June 2009 Leicestershire and Central Leicestershire Bus Maps. Services heading out of the city only are assessed: Table A3.1 Bus Frequencies on Quality Bus Corridors (1/hour or more only)
From Inner Ringroad From Outer Ringroad Transport Corridor Services Frequency Services Frequency
A6 (A6030) Loughborough Rd
See A607 Melton Rd
See A607 Melton Rd
2 (K) 127 (A)
2/hour 3/hour
A607 Melton Road
2 (K) 5 (A) 5A (A) 6 (A) 12 (F) 25 (V) 26 (V) 54 (C) 70A (A) 70B (A) 99 (A) 100 (V) 127 (A) 128 (V)
2/hour 3/hour 3/hour 6/hour 3/hour 1/hour 1/hour 1/hour 3/hour 1/hour 1/hour 1/hour 3/hour 1/hour
5 (A) 5A (A) 6 (A) 12 (F) 100 (V) 128 (V)
3/hour 3/hour 6/hour 3/hour 1/hour 1/hour
A47 East Humberstone Road
36 (C) 38 (F) 38A (F) 39 (F) 53 (A) 53A (A) 56 (A) 58 (A) 58A (A) 747 (C)
1/hour 5/hour 5/hour 4/hour 5/hour 5/hour 2/hour 3/hour 4/hour 1/hour
38 (F) 38A (F) 53 (A) 53A (A) 56 (A) 747 (C)
5/hour 5/hour 5/hour 5/hour 2/hour 1/hour
A6 South London Road
14 (A) 14A (F) 22 (A) 31 (A) 31A (A) 44 (A) 44A (A) 48 (A) 54A (F) 81 (A) UHL (C X3 (A) X7 (S)
3/hour 3/hour 3/hour 5/hour 5/hour 3/hour 3/hour 4/hour 6/hour 3/hour 2/hour 2/hour 1/hour
31 (A) 31A (A) X3 (A) X7 (S)
5/hour 5/hour 2/hour 1/hour
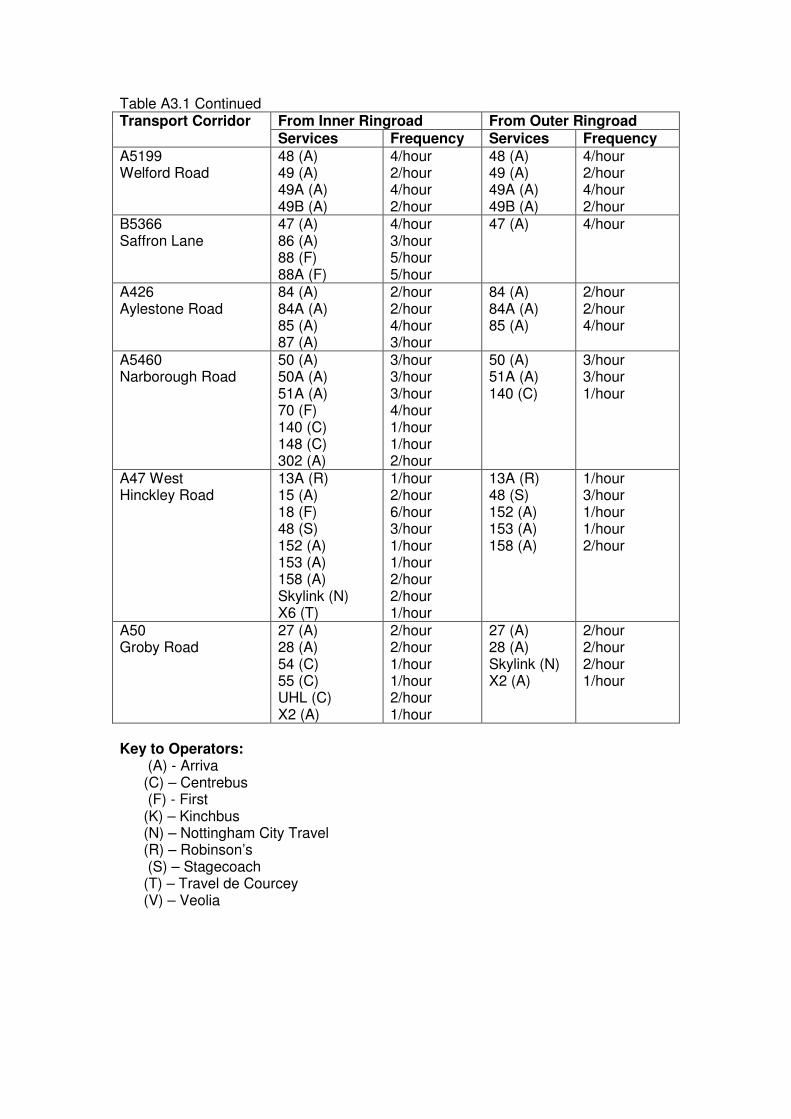
Table A3.1 Continued From Inner Ringroad From Outer Ringroad Transport Corridor Services Frequency Services Frequency
A5199 Welford Road
48 (A) 49 (A) 49A (A) 49B (A)
4/hour 2/hour 4/hour 2/hour
48 (A) 49 (A) 49A (A) 49B (A)
4/hour 2/hour 4/hour 2/hour
B5366 Saffron Lane
47 (A) 86 (A) 88 (F) 88A (F)
4/hour 3/hour 5/hour 5/hour
47 (A) 4/hour
A426 Aylestone Road
84 (A) 84A (A) 85 (A) 87 (A)
2/hour 2/hour 4/hour 3/hour
84 (A) 84A (A) 85 (A)
2/hour 2/hour 4/hour
A5460 Narborough Road
50 (A) 50A (A) 51A (A) 70 (F) 140 (C) 148 (C) 302 (A)
3/hour 3/hour 3/hour 4/hour 1/hour 1/hour 2/hour
50 (A) 51A (A) 140 (C)
3/hour 3/hour 1/hour
A47 West Hinckley Road
13A (R) 15 (A) 18 (F) 48 (S) 152 (A) 153 (A) 158 (A) Skylink (N) X6 (T)
1/hour 2/hour 6/hour 3/hour 1/hour 1/hour 2/hour 2/hour 1/hour
13A (R) 48 (S) 152 (A) 153 (A) 158 (A)
1/hour 3/hour 1/hour 1/hour 2/hour
A50 Groby Road
27 (A) 28 (A) 54 (C) 55 (C) UHL (C) X2 (A)
2/hour 2/hour 1/hour 1/hour 2/hour 1/hour
27 (A) 28 (A) Skylink (N) X2 (A)
2/hour 2/hour 2/hour 1/hour
Key to Operators:
(A) - Arriva (C) – Centrebus (F) - First (K) – Kinchbus (N) – Nottingham City Travel (R) – Robinson’s (S) – Stagecoach (T) – Travel de Courcey (V) – Veolia

Table A3.2 Summary of Table A3.1 Public Transport Corridor
Bus Services from Inner Ring Road
Bus Services from Outer Ring Road
A6 (A6030) Loughborough Rd
See A607 Melton Road 5/hour
A607 Melton Road
30/hour 17/hour
A47 East Humberstone Road
35/hour 23/hour
A6 South London Road
43/hour 17/hour
A5199 Welford Road
12/hour 12/hour
B5366 Saffron Lane
17/hour 4/hour
A426 Aylestone Road
11/hour 8/hour
A5460 Narborough Road
17/hour 7/hour
A47 West Hinckley Road
19/hour 8/hour
A50 Groby Road
9/hour 7/hour

Table A3.3 Bus Frequencies on Quality Bus Corridors (1/hour or more only) To Network of PUA Centres Public Transport Corridor
PUA Centre Services Frequency Total Frequency
A6 (A6030) Loughborough Rd
Birstall 2 99
2/hour 1/hour
3/hour
A607 Melton Road
Thurmaston 6 6/hour 6/hour
A607 Melton Road
Belgrave Road 2 6 25 99 127
2/hour 6/hour 1/hour 1/hour 3/hour
13/hour
A47 East Humberstone Road
Hamilton 58 58A
3/hour 4/hour
7/hour
A47 East Humberstone Road
Uppingham Road
38 38A 53 53A 56 747
5/hour 5/hour 5/hour 5/hour 2/hour 1/hour
23/hour
A6 South London Road
Evington Rd 22 81A
3/hour 3/hour
6/hour
A6 South London Road
Oadby 31
5/hour
5/hour
A5199 Welford Road
Wigston 48 49 49A 49B
4/hour 2/hour 4/hour 2/hour
12/hour
B5366 Saffron Lane
South Wigston 47 4/hour 4/hour
A5460 Narborough Road
Narborough Road
50 (A) 50A (A) 51A (A) 70 (F) 140 (C) 148 (C) 302 (A)
3/hour 3/hour 3/hour 4/hour 1/hour 1/hour 2/hour
17/hour
A50 Groby Road
Beaumont Leys UHL 2/hour 2/hour
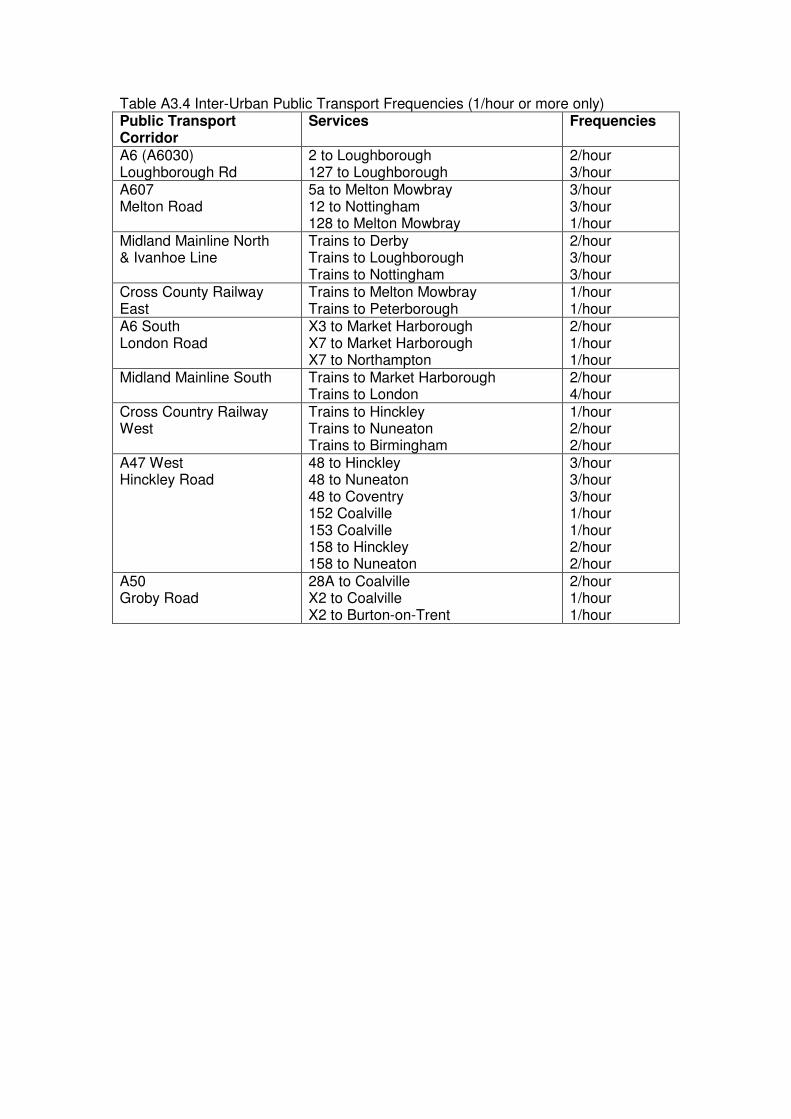
Table A3.4 Inter-Urban Public Transport Frequencies (1/hour or more only) Public Transport Corridor
Services Frequencies
A6 (A6030) Loughborough Rd
2 to Loughborough 127 to Loughborough
2/hour 3/hour
A607 Melton Road
5a to Melton Mowbray 12 to Nottingham 128 to Melton Mowbray
3/hour 3/hour 1/hour
Midland Mainline North & Ivanhoe Line
Trains to Derby Trains to Loughborough Trains to Nottingham
2/hour 3/hour 3/hour
Cross County Railway East
Trains to Melton Mowbray Trains to Peterborough
1/hour 1/hour
A6 South London Road
X3 to Market Harborough X7 to Market Harborough X7 to Northampton
2/hour 1/hour 1/hour
Midland Mainline South Trains to Market Harborough Trains to London
2/hour 4/hour
Cross Country Railway West
Trains to Hinckley Trains to Nuneaton Trains to Birmingham
1/hour 2/hour 2/hour
A47 West Hinckley Road
48 to Hinckley 48 to Nuneaton 48 to Coventry 152 Coalville 153 Coalville 158 to Hinckley 158 to Nuneaton
3/hour 3/hour 3/hour 1/hour 1/hour 2/hour 2/hour
A50 Groby Road
28A to Coalville X2 to Coalville X2 to Burton-on-Trent
2/hour 1/hour 1/hour

Appendix 4 – Employment Land Supply & Demand The following information is abstracted from tables J1.2-13 of the 2008 PACEC Leicester & Leicestershire HMA Employment Land Study, and from emerging Core Strategies. Table A4.1 Office Supply
Committed Supply Proposed Supply Offices Site sqm Site sqm
Leicester City NBQ Phase 1. Abbey Meadows Phases 1 & 2. Other.
47,200 44,000 760
- 0
Oadby & Wigston Borough
- 0 Town Centre Regeneration.
6,000
Blaby District Grove Park. Kirby Park Farm. Carlton Park.
16,700 9,520 35,480
- 0
South Charnwood Watermead Business Park.
21,600 - 0
Table A4.2 Industrials & Warehousing Supply
Committed Supply Proposed Supply Industrials & Warehousing Site ha Site ha Leicester City Gypsy Lane Brickworks.
Troon Industrial Area. Humberstone Sidings. Lewisher Road. Ashton Business Park. Barkby Road. Uxbridge Road. Fairway Business Park. Small Sites.
5.1 2.1 1.3 2.4 2.1 1.4 1.2 6.0 3.1
Ashton Green 10
Oadby & Wigston Borough
Tiger’s Road Magna Road Ind. Est.
0.8 0.6
- 0
Blaby District Quarry Lane. Warrens Ind. Est. Whetstone Pastures. Stoney Stanton Sites.
3.6 1.1 0.5 0.8
Warrens Ind. Est. 20
South Charnwood Hallamfields, Birstall The Warren, East Goscote. Rothley Lodge.
6.0 4.8 5.9
East of Thurmaston 50
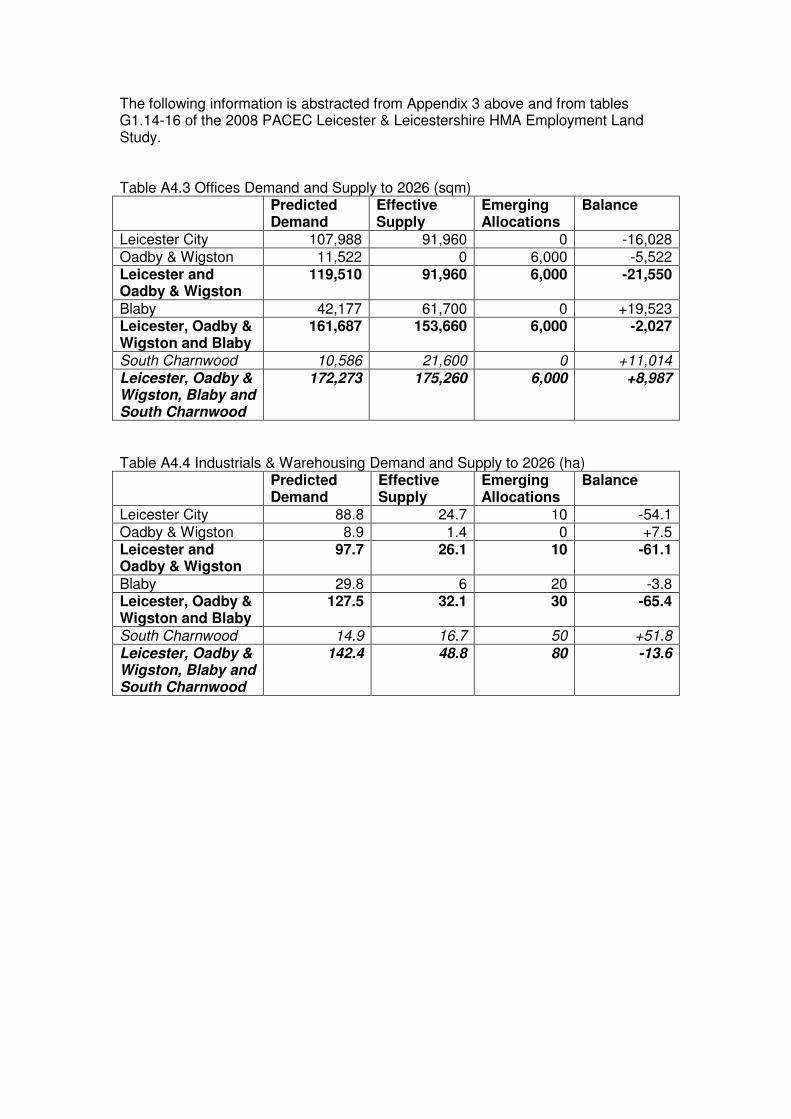
The following information is abstracted from Appendix 3 above and from tables G1.14-16 of the 2008 PACEC Leicester & Leicestershire HMA Employment Land Study. Table A4.3 Offices Demand and Supply to 2026 (sqm) Predicted
Demand Effective Supply
Emerging Allocations
Balance
Leicester City 107,988 91,960 0 -16,028 Oadby & Wigston 11,522 0 6,000 -5,522 Leicester and Oadby & Wigston
119,510 91,960 6,000 -21,550
Blaby 42,177 61,700 0 +19,523 Leicester, Oadby & Wigston and Blaby
161,687 153,660 6,000 -2,027
South Charnwood 10,586 21,600 0 +11,014 Leicester, Oadby & Wigston, Blaby and South Charnwood
172,273 175,260 6,000 +8,987
Table A4.4 Industrials & Warehousing Demand and Supply to 2026 (ha) Predicted
Demand Effective Supply
Emerging Allocations
Balance
Leicester City 88.8 24.7 10 -54.1 Oadby & Wigston 8.9 1.4 0 +7.5 Leicester and Oadby & Wigston
97.7 26.1 10 -61.1
Blaby 29.8 6 20 -3.8 Leicester, Oadby & Wigston and Blaby
127.5 32.1 30 -65.4
South Charnwood 14.9 16.7 50 +51.8 Leicester, Oadby & Wigston, Blaby and South Charnwood
142.4 48.8 80 -13.6
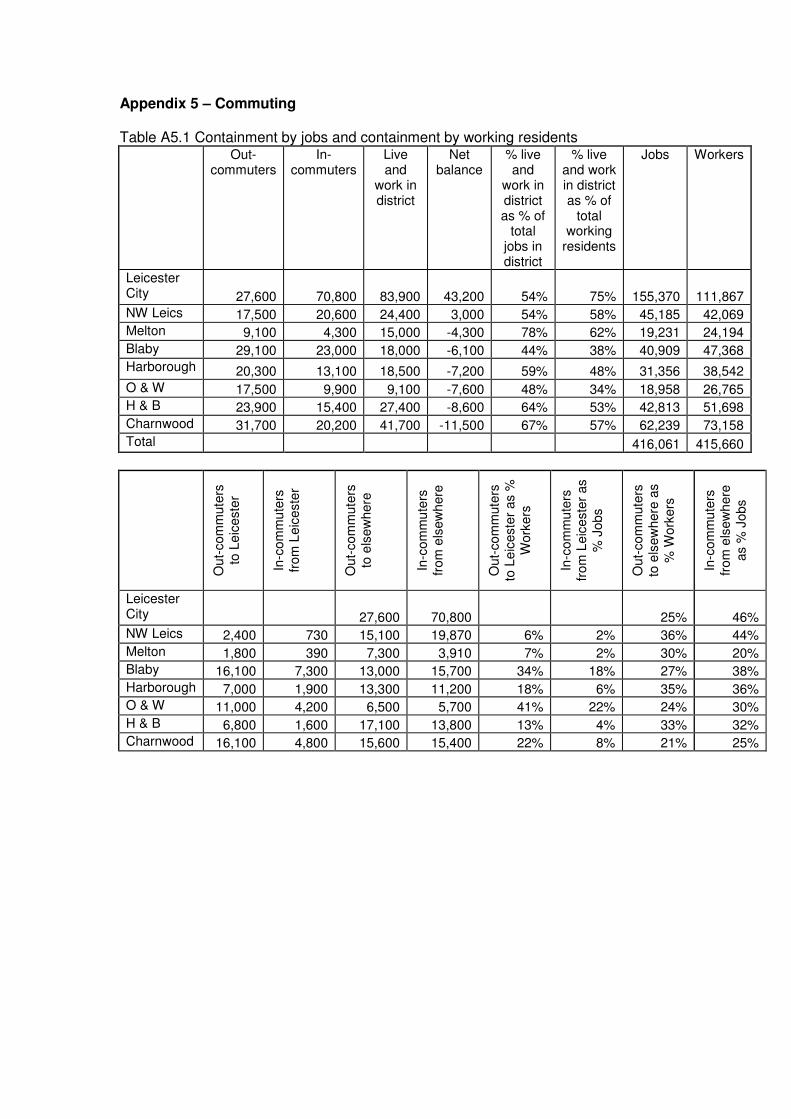
Appendix 5 – Commuting Table A5.1 Containment by jobs and containment by working residents Out-
commuters In-
commuters Live and
work in district
Net balance
% live and
work in district as % of
total jobs in district
% live and work in district as % of
total working
residents
Jobs Workers
Leicester City 27,600 70,800 83,900 43,200 54% 75% 155,370 111,867
NW Leics 17,500 20,600 24,400 3,000 54% 58% 45,185 42,069
Melton 9,100 4,300 15,000 -4,300 78% 62% 19,231 24,194
Blaby 29,100 23,000 18,000 -6,100 44% 38% 40,909 47,368
Harborough 20,300 13,100 18,500 -7,200 59% 48% 31,356 38,542
O & W 17,500 9,900 9,100 -7,600 48% 34% 18,958 26,765
H & B 23,900 15,400 27,400 -8,600 64% 53% 42,813 51,698
Charnwood 31,700 20,200 41,700 -11,500 67% 57% 62,239 73,158
Total 416,061 415,660
Out-
com
mute
rs
to L
eic
este
r
In-c
om
mu
ters
fr
om
Leic
este
r
Out-
com
mute
rs
to e
lsew
here
In-c
om
mu
ters
fr
om
els
ew
here
Out-
com
mute
rs
to L
eic
este
r as %
W
ork
ers
In-c
om
mu
ters
fr
om
Leic
este
r as
% J
obs
Out-
com
mute
rs
to e
lsew
here
as
% W
ork
ers
In-c
om
mu
ters
fr
om
els
ew
here
as %
Jobs
Leicester City 27,600 70,800 25% 46%
NW Leics 2,400 730 15,100 19,870 6% 2% 36% 44%
Melton 1,800 390 7,300 3,910 7% 2% 30% 20%
Blaby 16,100 7,300 13,000 15,700 34% 18% 27% 38%
Harborough 7,000 1,900 13,300 11,200 18% 6% 35% 36%
O & W 11,000 4,200 6,500 5,700 41% 22% 24% 30%
H & B 6,800 1,600 17,100 13,800 13% 4% 33% 32%
Charnwood 16,100 4,800 15,600 15,400 22% 8% 21% 25%