Embed Size (px)
Citation preview
ORN I_/TM-11582
OAK RIDGENATIONAL
LABORATORY Calmac Ice Storage Test Report
MARTIN MARIETTA
Therese K. Stovall
I
MANAGEDBY /MARTINMARIETTAENERGYSYSTEMS,INC.FORTHEUNITEDSTATES I
DEPARTMENTOFENERGY DISTRIBUTIOt"" O_: T_-_S OOCL'I',/tENTp, IS UNLIMi1ED
This report has been reproduceddirectly from the best available copy.
Av&ilable to DOE and DOE contractors from the Office of Scientific and Techni-
cal Information, P.O. Box 62, Oak Ridge, TN 37831; prices available from (615)576-8401, FTS 626-8401.
Available to the public from the National Technical Information Service, U.S.Department of Commerce, 5285 Port Royal Rd., Springfield,VA 22161.
This report was prepared as an account of work sponsored by an agency ofthe United States Government. Neither the United States Government nor anyagency thereof, nor any of their employees, makes any warrqnty, express orimplied, or assumes any legal liability or responsibility fo_ accuracy, corn-pleteness, or usefulness of any information, apparatus, product, or process dis-closed, or represents that its use would not infringe privately owned rights.Reference herein to any specific commercial product, process, or service bytrade name, trademark, manufacturer, or otherwise, does not necessarily consti-tute or imply its endorsement, recommendation, or favoring by the United StatesGovernment or any agency thereof. The views and opinions of authorsexpressed herein do .ct necessarily state or reflect those of the United StatesGovernment or any agency thereof.
ORNL/TM- -I 1582
DE92 000416
Engineering Technology Division
CALMAC ICE STORAGE TEST REPORT
Therese IC Stovall
DATE PUBLISHED: August 1991
Prepared for theElectric Power Research Institute
under Interagency Agreement No. DOE ERD-85-502
Prepared by theOAK RIDGE NATIONAL LABORATORY
Oak Ridge, Tennessee 37831-6285managed by
MARTIN MARIETTA ENERGY SYSTEMS, INC.for the
U.S. DEPARTMENT OF ENERGY
under contract DE-AC05-840R21400 r_._A__)T[R
,-....i¢--.--,-¢r, tr_l ITIf'_,f'.. I ,' ' .... "- ':'":. i .,.... -, -. r- \._,i._21.,._._, , ,,1_.._ ....
111
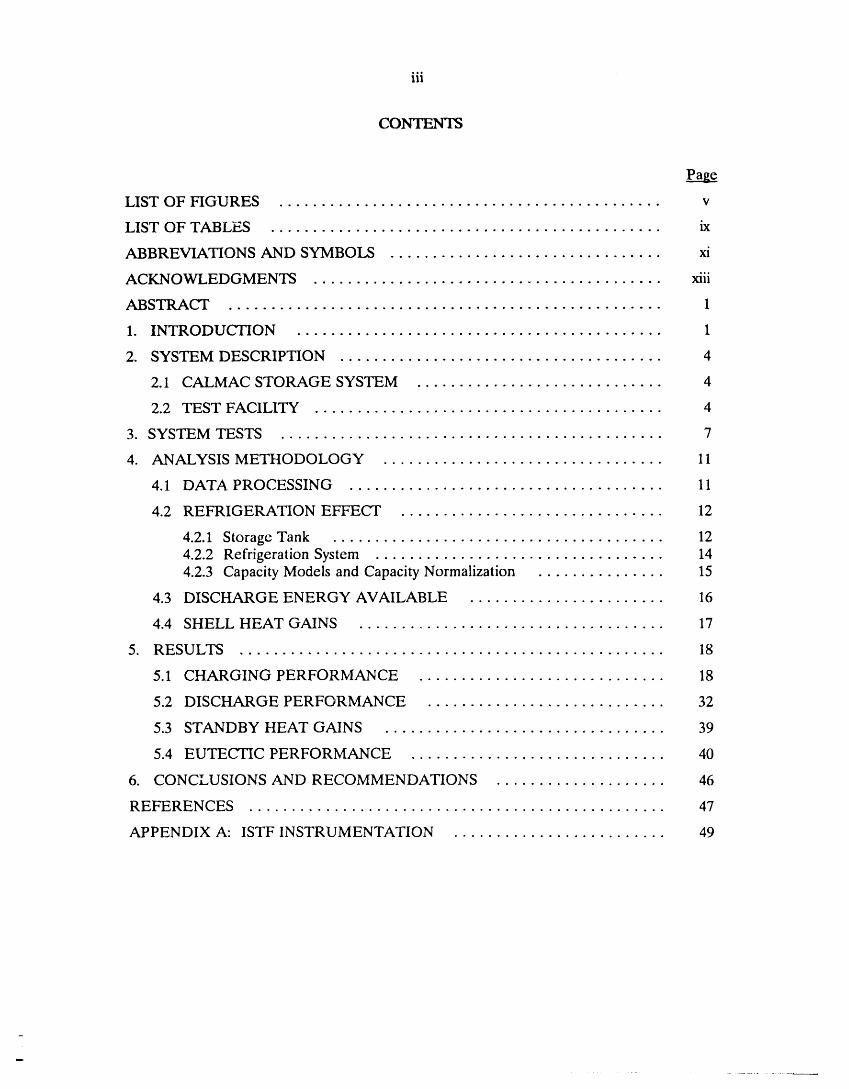
LIST OF FIGURES ............................................. v
LIST OF TABLES .............................................. ix
ABBREVIATIONS AND SYMBOLS ................................ xi
ACKNOWLEDGMENTS ......................................... xiii
ABSTRACT ................................................... 1
1. INTRODUCTION ........................................... 1
2. SYSTEM DESCRIPTION ...................................... 4
2.1 CALMAC STORAGE SYSTEM ............................. 4
2.2 TEST FACILITY ......................................... 4
3. SYSTEM TESTS ............................................. 7
4. ANALYSIS METHODOLOGY ................................. 11
4.1 DATA PROCESSING ..................................... 11
4.2 REFRIGERATION EFFECT ............................... 12
4.2.1 Storage Tank ....................................... 124.2.2 Refrigeration System .................................. 144.2.3 Capacity Models and Capacity Normalization ............... 15
4.3 DISCHARGE ENERGY AVAILABLE ....................... 16
4.4 SHELL HEAT GAINS .................................... 17
5. RESULTS .................................................. 18
5.1 CHARGING PERFORMANCE ............................. 18
5.2 DISCHARGE PERFORMANCE ............................ 32
5.3 STANDBY HEAT GAINS ................................. 39
5.4 EUTECTIC PERFORMANCE .............................. 40
6. CONCLUSIONS AND RECOMMENDATIONS .................... 46
REFERENCES ................................................. 47
APPENDIX A: ISTF INSTRUMENTATION ......................... 49
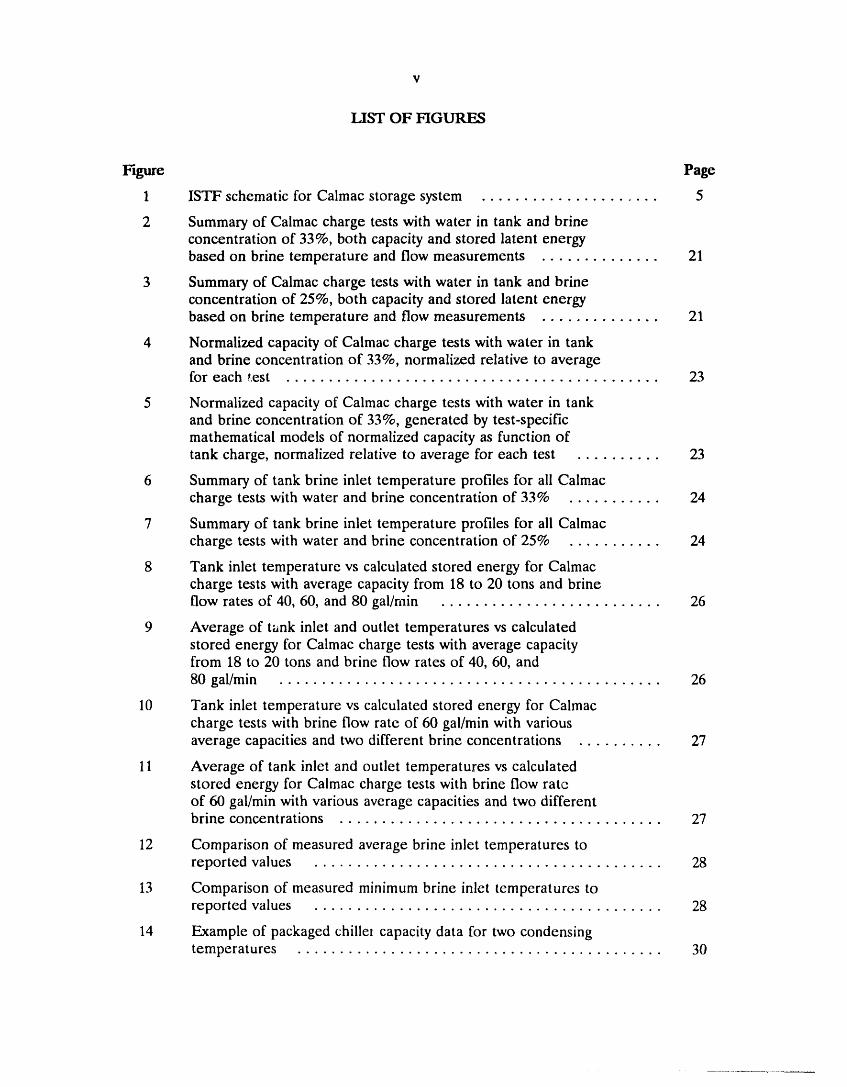
LIST OF FIGURF__
Figure Page
1 ISTF schematic for Calmac storage system ..................... 5
2 Summary of Calmac charge tests with water in tank and brineconcentration of 33%, both capacity and stored latent energybased on brine temperature and flow measurements .............. 21
3 Summary of Calmac charge tests with water in tank and brineconcentration of 25%, both capacity and stored latent energybased on brine temperature and flow measurements .............. 21
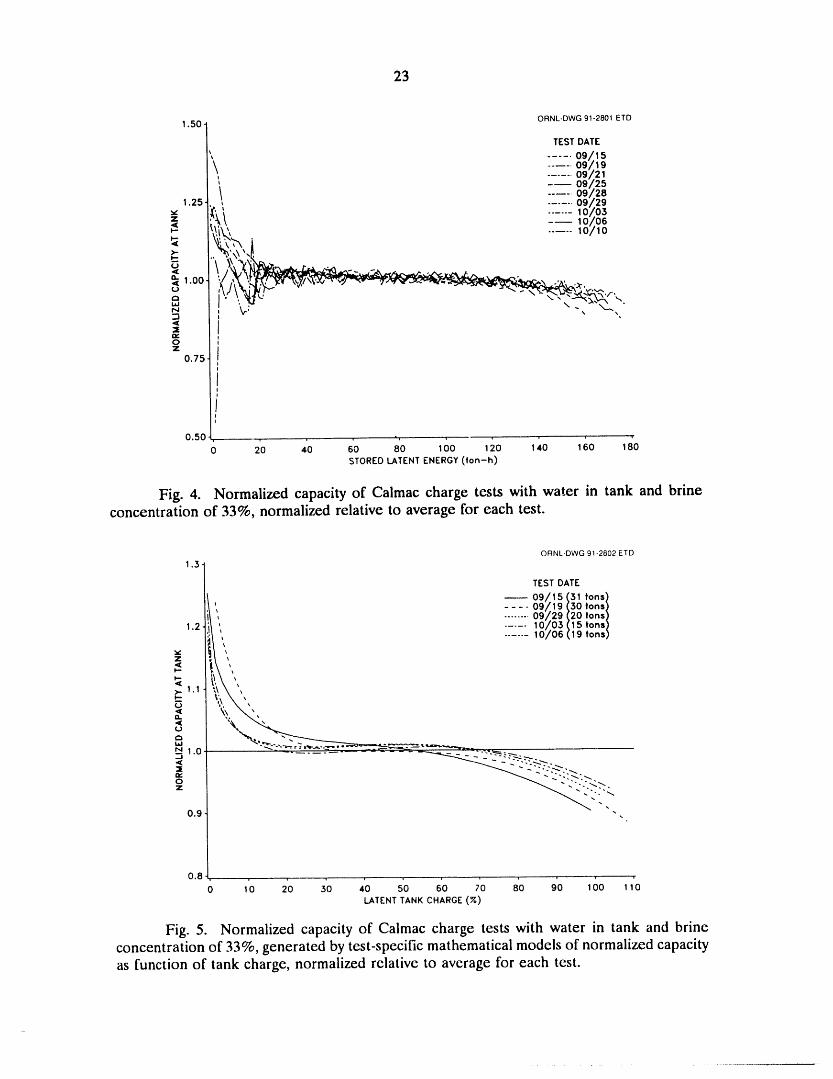
4 Normalized capacity of Calmac charge tests with water in tankand brine concentration of 33%, normalized relative to averagefor each _,est ............................................ 23
5 Normalized capacity of Calmac charge tests with water in tankand brine concentration of 33%, generated by test-specificmathematical models of normalized capacity as function oftank charge, normalized relative to average for each test .......... 23
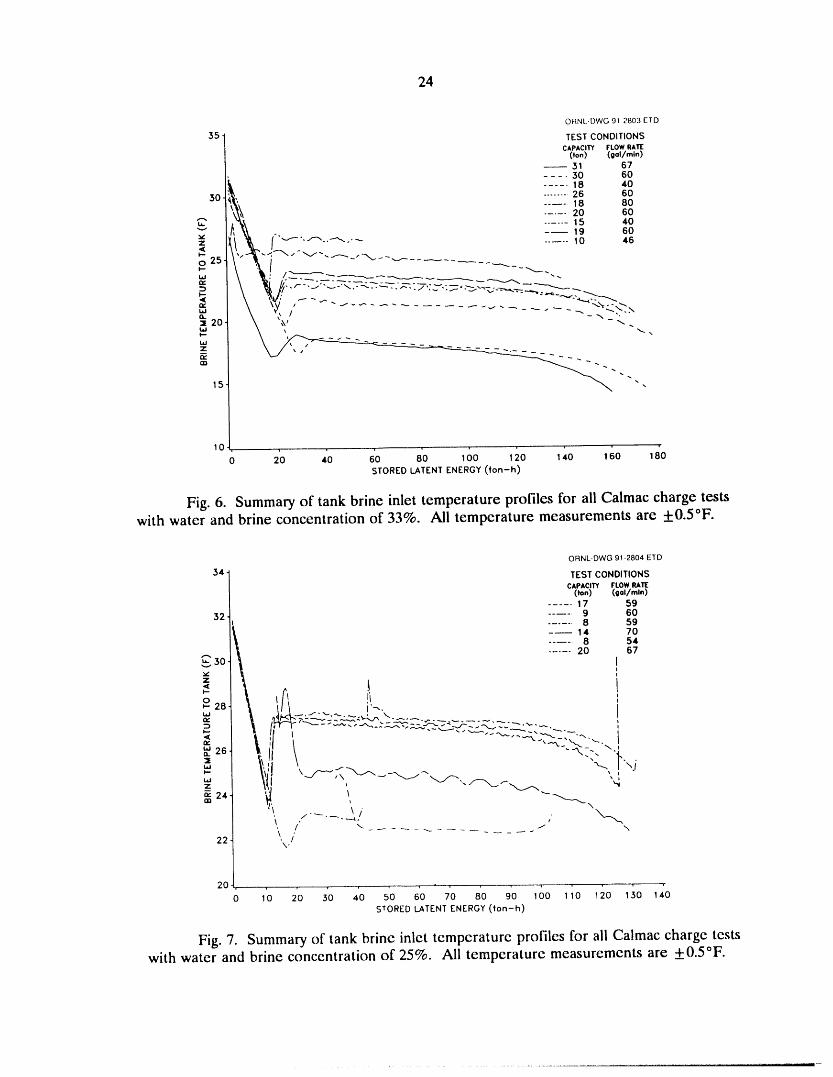
6 Summary of tank brine inlet temperature profiles for ali Calmaccharge tests with water and brine concentration of 33% ........... 24
7 Summary of tank brine inlet temperature profiles for ali Calmaccharge tests with water and brine concentration of 25% ........... 24
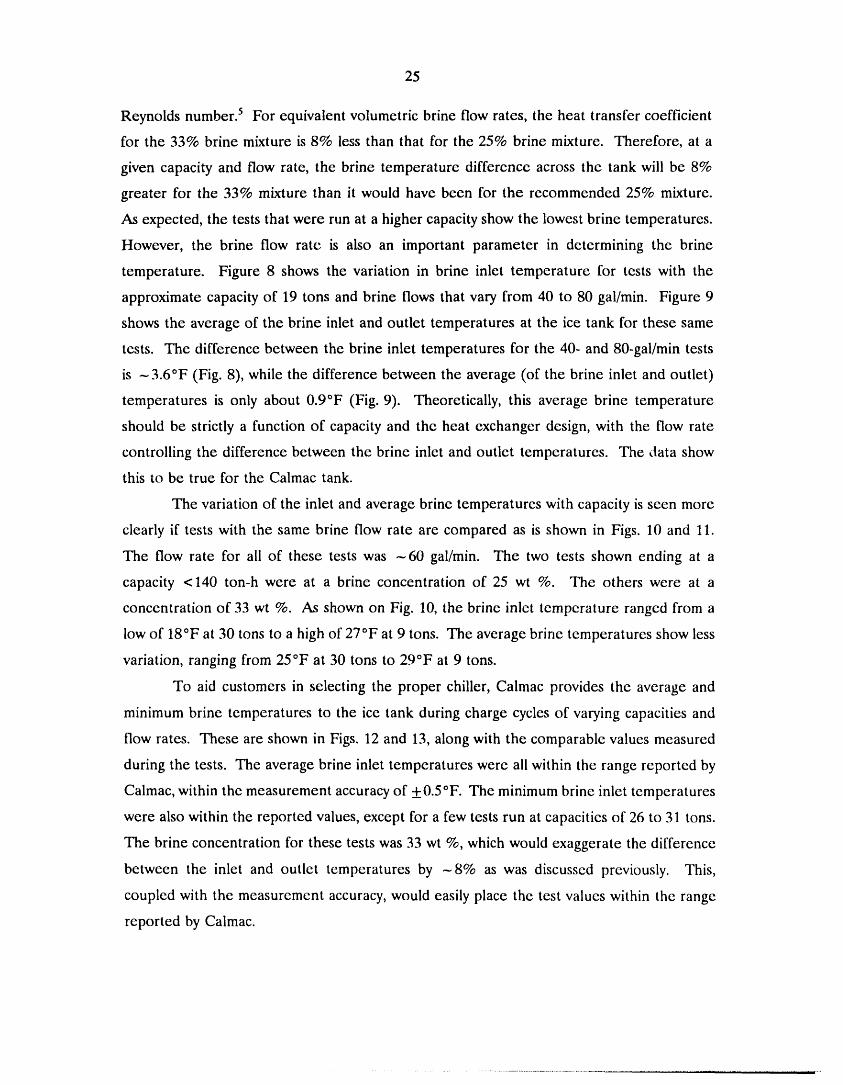
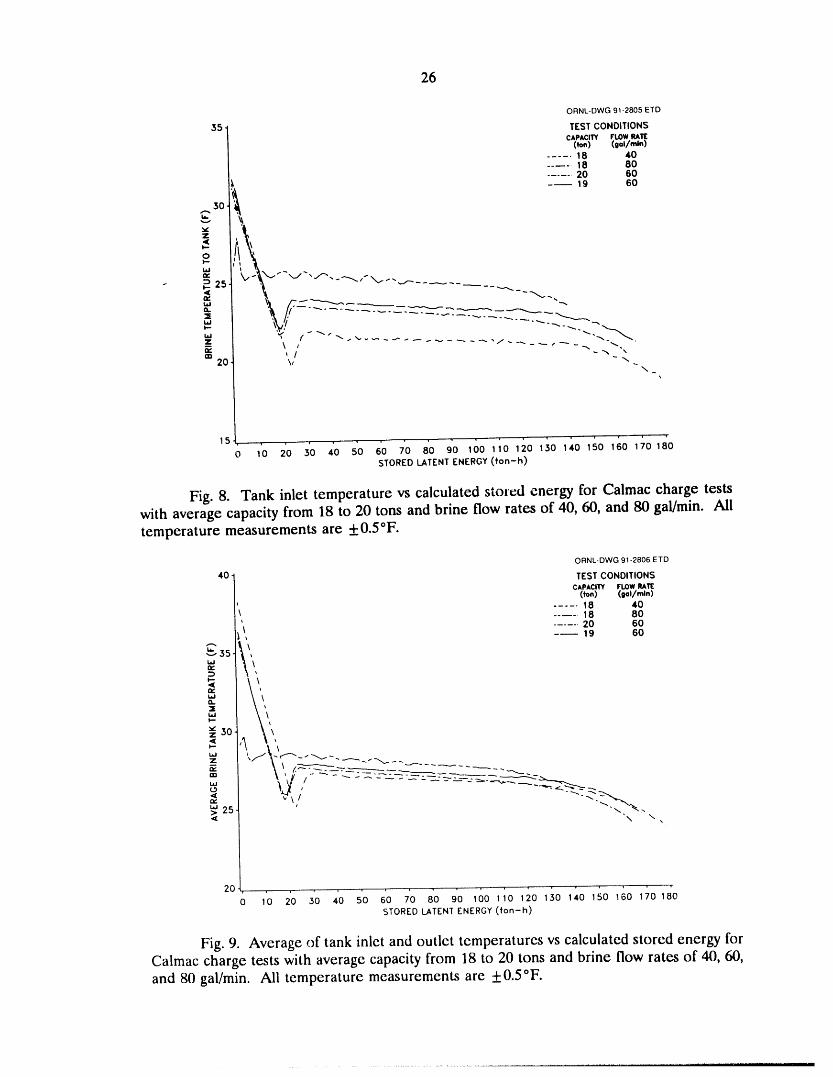
8 Tank inlet temperature vs calculated stored energy for Calmaccharge tests with average capacity from 18 to 20 tons and brineflow rates of 40, 60, and 80 gal/min .......................... 26
9 Average of tank inlet and outlet temperatures vs calculatedstored energy for Calmac charge tests with average capacityfrom 18 to 20 tons and brine flow rates of 40, 60, and80 gal/min ............................................. 26
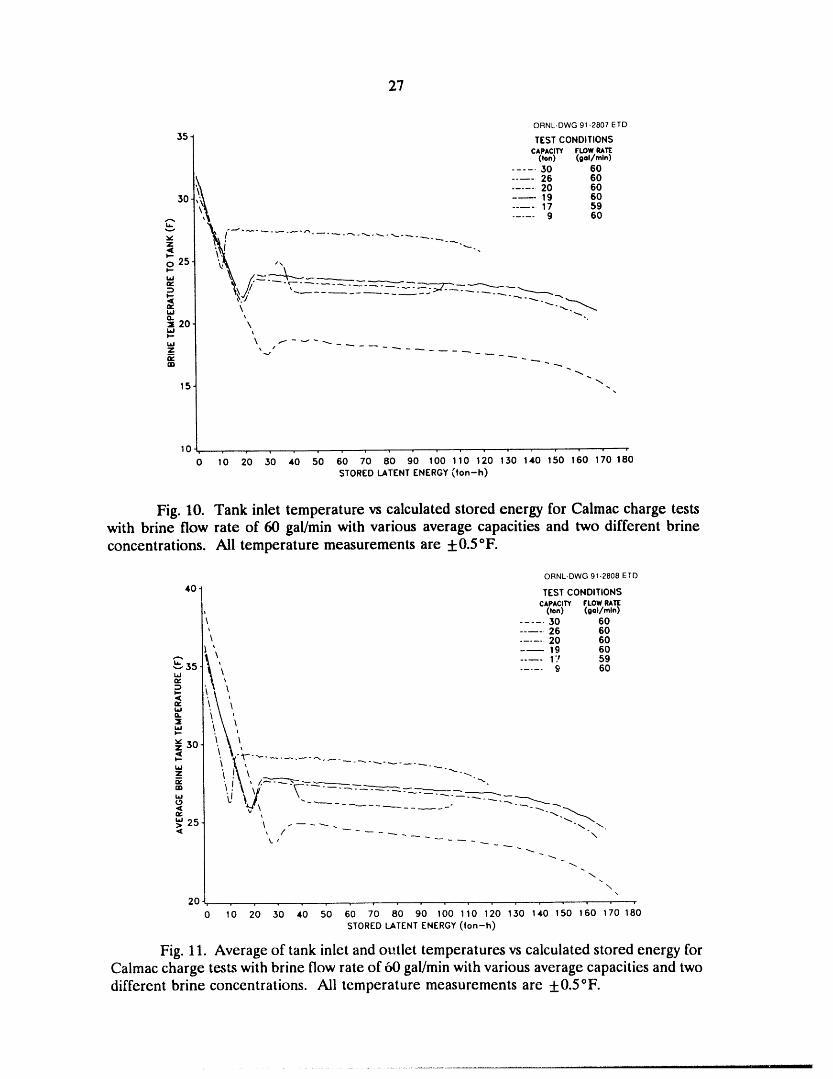
10 Tank inlet temperature vs calculated stored energy for Calmaccharge tests with brine flow rate of 60 gal/min with variousaverage capacities and two different brine concentrations .......... 27
11 Average of tank inlet and outlet temperatures vs calculatedstored energy for Calmac charge tests with brine flow rateof 60 ga!/min with various average capacities and two differentbrine concentrations ...................................... 27
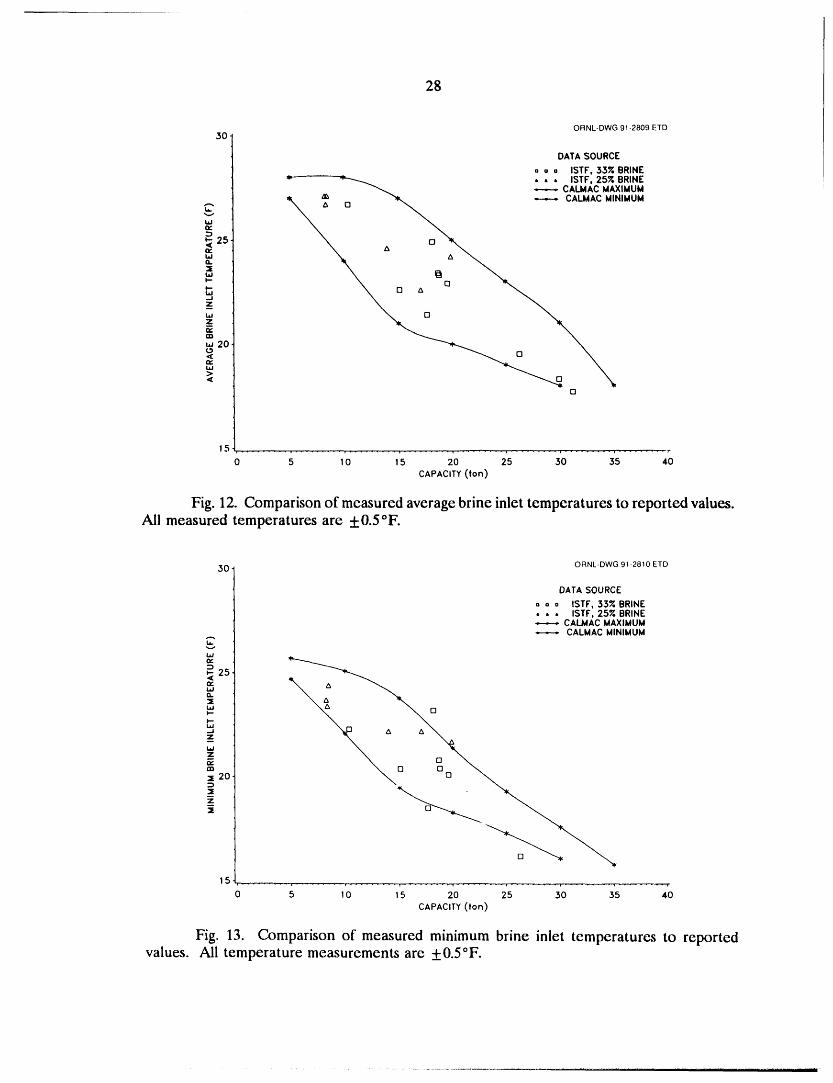
12 Comparison of measured average brine inlet temperatures toreported values ......................................... 28
I3 Comparison of measured minimum brine inlet temperatures toreported values ......................................... 28
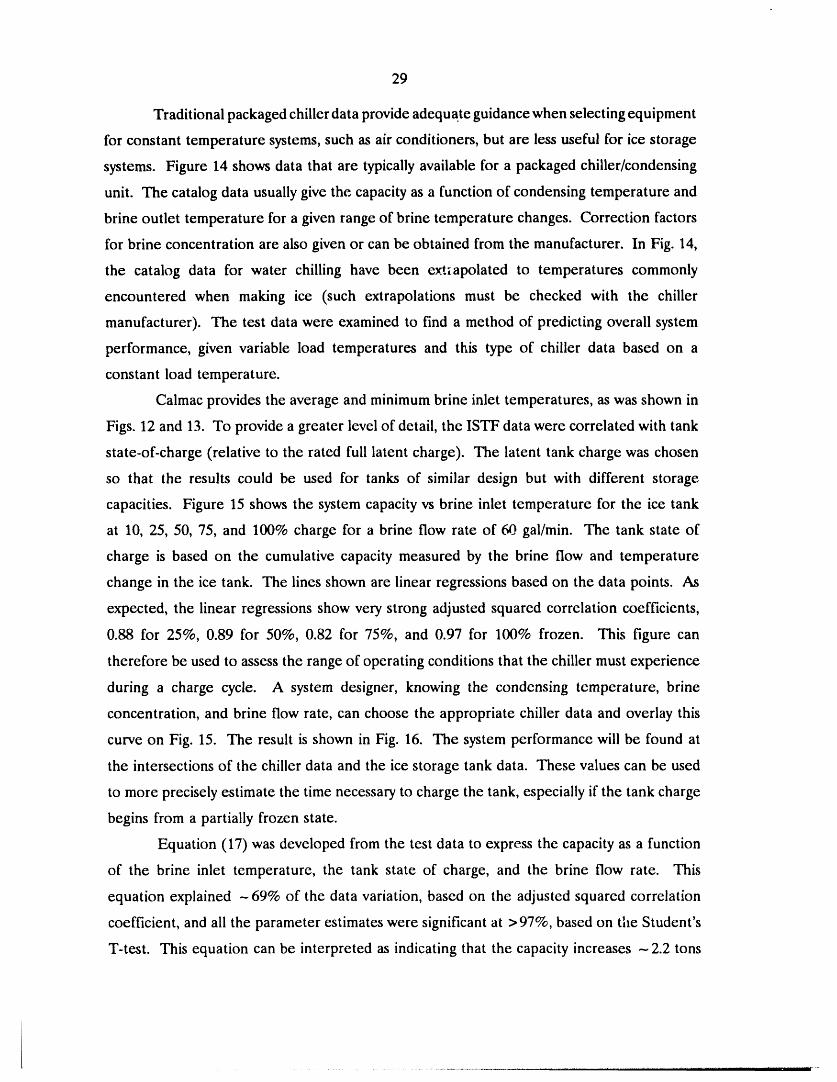
14 Example of packaged chiller capacity data for two condensingtemperatures ........................................... 30
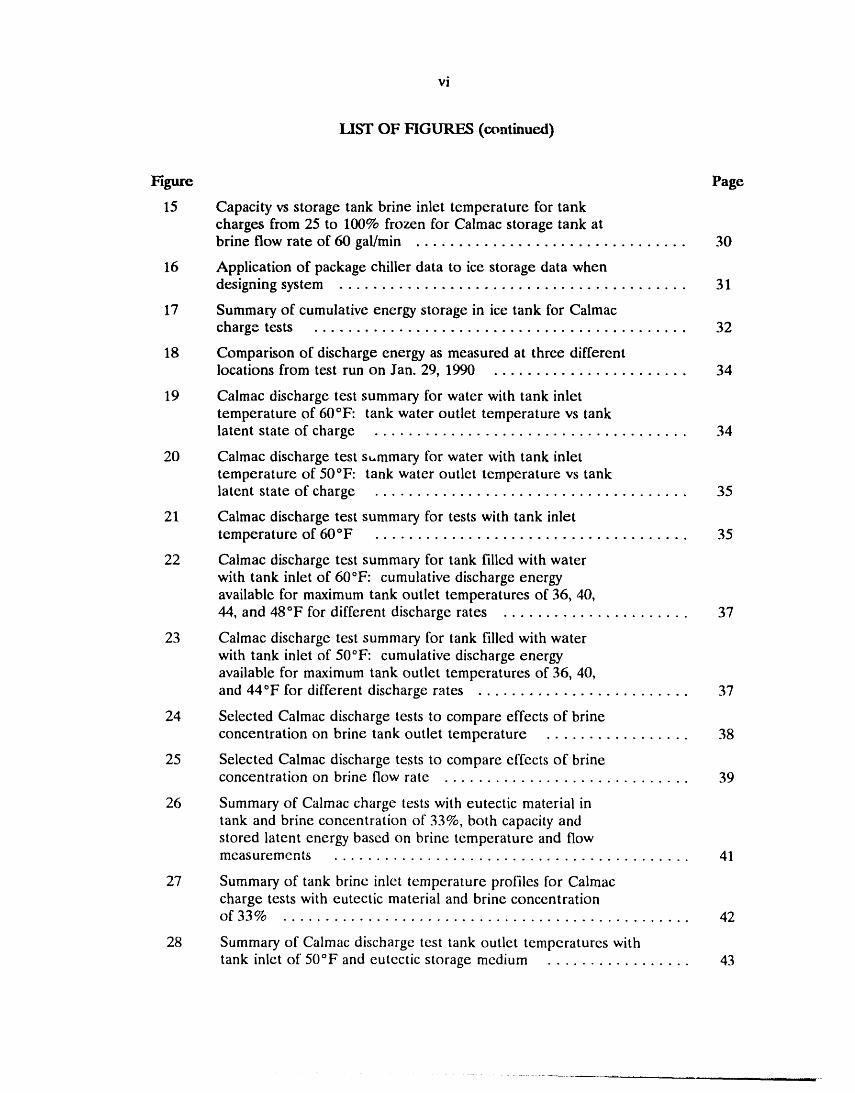
vi
LIST OF FIGURF__ (continued)
Figure Page
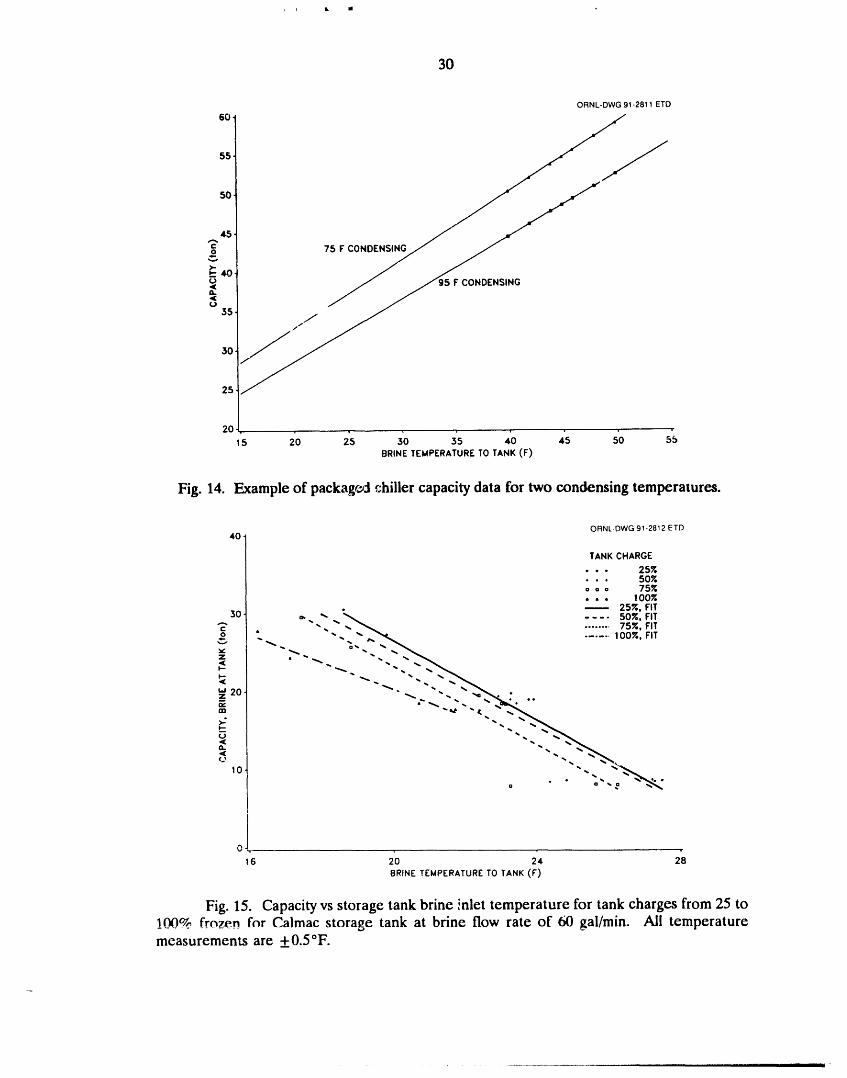
15 Capacity vs storage tank brine inlet temperature for tankcharges from 25 to 100% frozen for Calmac storage tank atbrine flow rate of 60 gal/min ................................ 30
16 Application of package chiller data to ice storage data whendesigning system ......................................... 31
17 Summary of cumulative energy storage in ice tank for Calmaccharge tests ............................................ 32
18 Comparison of discharge energy as measured at three differentlocations from test run on Jan. 29, 1990 ....................... 34
19 Calmac discharge test summary for water with tank inlettemperature of 60°F: tank water outlet temperature vs tanklatent state of charge ..................................... 34
20 Calmac discharge test s_.mmary for water with tank inlettemperature of 50°F: tank water outlet temperature vs tanklatent state of charge ..................................... 35
21 Calmac discharge test summary for tests with tank inlettemperature of 60°F ..................................... 35
22 Calmac discharge test summary for tank filled with waterwith tank inlet of 60°F: cumulative discharge energyavailable for maximum tank outlet temperatures of 36, 40,44, and 48°F for different discharge rates ...................... 37
23 Calmac discharge test summary for tank filled with water
with tank inlet of 50°F: cumulative discharge energyavailable for maximum tank outlet temperatures of 36, 40,and 44°F for different discharge rates ......................... 37
24 Selected Calmac discharge tests to compare effects of brineconcentration on brine tank outlet temperature ................. 38
25 Selected Calmac discharge tests to compare effects of brineconcentration on brine flow rate ............................. 39
26 Summary of Calmac charge tests with eutectic material intank and brine concentration of 33%, both capacity andstored latent energy based on brine temperature and flowmeasurements .......................................... 41
27 Summary of tank brine inlet temperature profiles for Calmaccharge tests with eutectic material and brine concentrationof 33% ................................................ 42
28 Summary of Calmac discharge test tank outlet temperatures withtank inlet of 50°F and eutcctic storage medium ................. 43
.... , ,, ...... --

vii
LIST OF FIGURffS (continued)
Figure Page
29 Comparison of tank outlet temperature during discharge tests witheutectic vs water as storage medium .......................... 43
30 Calmac discharge test summary for eutectic material with tankinlet temperature of 50°F: tank water outlet temperature vstank latent state of charge ................................. 45
31 Calmac discharge test summary for eutectic material with tankinlet temperature of 60°F: tank water outlet temperature vstank latent state of charge ................................. 45
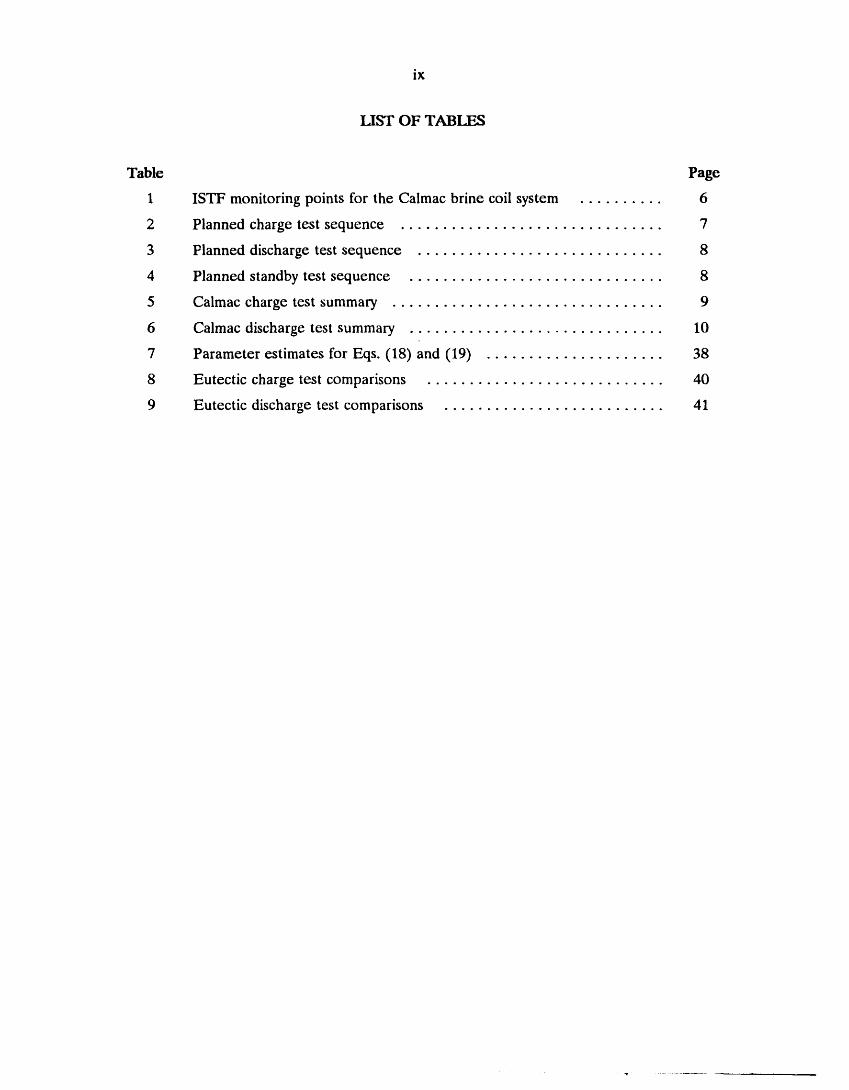
ix
LIST OF TABLES
Table Page
1 ISTF monitoring points for the Calmac brine coil system .......... 6
2 Planned charge test sequence ............................... 7
3 Planned discharge test sequence ............................. 8
4 Planned standby test sequence .............................. 8
5 Calmac charge test summary ................................ 9
6 Calmac discharge test summary .............................. 10
7 Parameter estimates for Eqs. (18) and (19) ..................... 38
8 Eutectic charge test comparisons ............................ 40
9 Eutectic discharge test comparisons .......................... 41
xi
ABBREVIATIONS AND SYMBOLS
Caph discharge capacity measured at heater
Capt discharge capacity measured at ice tank
Cp specific heat
DPDE1 difference between tank water depth and fully melted tank water depth
FE1 refrigerant mass flow to the expansion valves
FE3 brine flow to ice tank
FE4 brine flow from the evaporator
FE5 refrigerant volumetric flow to the condenser
FE6 water flow rate
HE1 refrigerant enthalpy entering the condenser
HE2 refrigerant enthalpy leaving the condenser
HE10 enthalpy corresponding to the measured suction temperature and pressure ofthe superheated refrigerant leaving the _.hiller/evaporator
ISTF Ice Storage Test Facility
PDE1 tank water depth
heat of rejection predicted by the compressor manufacturer
Qt heat rejected by the refrigerant
(_ heat absorbed by the cooling water
Re b refrigeration effect as determined by measured brine flow rate andtemperature change at ice storage tank
Re.b, capacity, normalized relative to the average capacity
Re c refrigeration capacity predicted by the capacity curves
REtch refrigeration effect as determined by measured refrigerant flow rates andthermodynamic properties
SC state of charge
SG specific gravity
T temperature
TEl 1 brine temperature entering heater
TEl2 brine temperature leaving heater
TEl5 brine temperature leaving the ice tank
TEl6 brine temperature entering the ice tank
TEl7 brine temperature leaving the chiller/evaporator
xii
TEl8 brine temperature entering the chiller/evaporator
TEl9 water temperature exiting the condenser
TE20 water temperature into the condenser
Td saturated discharge temperature
T-h ton-hour
T, saturated suction temperature
W¢ compressor power predicted by the manufacturer's data
VE1 refrigerant specific volume entering the condenser
p density
r time
XIII
ACKNOWLEDGMEN'I_
This important research has been made possible by the support of the Electric Power
Research Institute. I would like to thank the program manager, Ronald Wendland, for his
critical support and enthusiasm. Calmac Manufacturing Corporation provided the unit for
testing. John Tomlinson of Oak Ridge National Laboratory designed the Ice Storage Test
Facility, supervised its construction, and has provided valuable guidance during the testing
process. Delmar Fraysier is the chief operator of the test facility and made important
contributions to the test procedures.
CALMAC ICE STORAGE TEST REPORT"
Therese lC Stovall
ABSTRACT
The Ice Storage Test Facility (ISTF) is designed to test commercial icestorage systems. Calmac provided a storage tank equipped with coils designedfor use with a secondary fluid system. The Caimac ice storage system wastested over a wide range of operating conditions. Measured systemperformance during charging was similar to that reported by the manufacturer.Both the measured average and minimum brine temperatures were in closeagreement with Calmac's literature values, and the ability to fully charge thetank was relatively unaffected by charging rate and brine flow rate. Duringdischarge cycles, the storage tank outlet temperature was strongly affected bythe discharge rate. The discharge capacity was dependent upon both theselected discharge rate and maximum allowable tank outlet temperature.Based on these tests, storage tank selection must depend most strongly on thedischarge conditions required to serve the load.
This report describes Calmac system performance fully under bothcharging and discharging conditions. Companion reports describe ISTF testprocedures and ice-making efficiency test results that are common to many ofthe units tested.
1. INTRODUCTION
Commercial air-conditioning loads are a large component of the afternoon peak loads
served by electric utilities. Increased use of cool storage would shift this electrical load from
peak to off-peak periods. This shift would permit utilities to defer construction _f additional
generating capacity and reduce customers demand charges.
Although the number of cool storage installations in commercial buildings is growing,
it represents only a small fraction of the potential market. One major barrier to the use of
cool storage equipment has been the uncertainty associated with its performance. Uniform
testing by an independent agency has not been available. The performance data available
from manufacturers are varied in scope and detail from one type of device to another and
"Units used throughout this report are common to and exclusive in the industry.

across manufacturers as weil. Often system performance values are given for only
one operating point, making it difficult to predict performance under other operating
conditions.
Electric Power Research Institute (EPRI) therefore sponsored the development of
an Ice Storage Test Facility (ISTI_ to permit uniform testing of commercial-size cool storage
equipment of many different types. This testing serves two purposes: (1) to provide uniform
performance test results and (2) to promote system improvements based on experimental
data. Uniform test results will be useful to utilities in promoting their installation and use and
in requesting rate incentives from public utilities eommissiom (PUCs) and to building
designers in specifying appropriate equipment for their applications. The experimental data
will also be useful to equipment designers because it will describe component behavior as well
as overall system performance. The capacity of the ISTF was sized at 250 ton-h. Real-time
data acquisition and precise computer controls were included.
The ISTF can be used to test dynamic, liquid recirculation, secondary fluid, and direct
expansion (DX) ice makers. The simplest ice maker is a DX machine,. In a DX ice maker,
the refrigerant is sent as a cold liquid into coils submerged in a tank of water. As the
refrigerant passes through these coils, it absorbs heat from the water and evaporates. As the
refrigerant leaves the coils, it is completely gaseous and usually slightly superheated. The
water in the tank is thereby chilled until it becomes frozen. When the stored cooling is
needed, the ice is melted by circulating warm water from the heat load through the ice and
returning the chilled water to the heat load. This arrangement is called an exterior melt
because the ice is melted from the surface opposite from the surface where the ice is formed.
In a secondary fluid system, the cold liquid refrigerant is sent to a heat exchanger
outside the tank of water. In this heat exchanger, a secondary fluid, typically a glycol mixture,
is chilled. This secondary fluid is then sent to the tank of water where it absorbs heat from
the water, again freezing the water in the tank. The secondary fluid can also be used to
transfer the stored cooling to the heat load. This arrangement is called an internal melt. TheJ
stored cooling energy can also be transferred to the heat load by using an external melt as
described for the DX system.
A liquid recirculation system is similar to the DX system because the cold refrigerant
• is sent to coils submerged in the tank of water. However, in the liquid recirculation system,
. the amount of refrigerant circulated through the coils is typically two to three times greater
than in a DX s_tem _ that. on}y a r_rtinn of the refrigerant is evaporated and the coils
remain full of liquid throughout their length. This additional refrigerant circulation is
accomplished through the use of gravity feed or a refrigerant pump. The stored cooling
energy is transferred to the heat load using an external melt arrangement.
A dynamic ice maker freezes ice using either a DX or a liquid overfeed arrangement.
However, in a dynamic system, the ice is harvested on a periodic basis. This harvesting cycle
reduces the ice thickness on the heat transfer surface of the chiller. After the ice is
harvested, it is stored in a slush or slurry of ice and water. The water is circulated to provide
the stored cooling to the heat load.
This report describes the test results for an ice storage tank furnished by the Calmac
Manufacturing Corporation. The Calmac storage tank is both charged and discharged using
a secondary fluid or brine. The storage system and the test facility are described in Sect. 2.
Section 3 describes the tests that were performed to characterize the storage s)-_tem, and
Sect. 4 describes the analysis methods used to evaluate the performance data. The results and
recommendations are summarized in Sects. 5 and 6.
2. SYSTEM DES_ON
2.1 CALMAC STORAGE SYSTEM
The Calmac model 1190 ice tank is chilled by the flow of brine through 5/8-in.-OD
plastic tubing, spaced roughly 1 1/2 in. (center to center) apart. These tubes are submerged
in water. The brine used for these tests was a mixture of ethylene glycol and water with a
freezing point of -0°F. Caimac recommends a mixture with a slightly lower ethylene glycol
concentration, and a few tests were run at its recommended concentration. The tank can be
frozen nearly solid, leaving only a minimum amount of free water to fill the voids that occur
near the heat exchanger tubing when the ice first begins to melt. The Calmac ice tank is
discharged by circulating the brine through the tank and then through the desired heat load,
simulated by a simple heater in the test facility. The Calmac tanks are equipped with a water
depth sensor that can be used to infer the amount of ice stored during a charging cycle and
the state of charge during a discharge cycle.1
When the Calmac tanks were filled with the specified volume of 1620 gal of water,
the water level was -3 in. higher than the recommended level of 10 in. below the fill port.
During the first charge cycle, a small amount of water overflowed the tank, leaving a new
fully melted water level --0.7 in. lower than the initial level. Based on the volume vs water
level calibration for this tank, that level change amounted to - 12 gal of water. The volume
of brine in the storage system was not measured.
2.2 TF_,KFFACILITY
The test facility was designed to test a wide variety of storage systems, lt includes ali
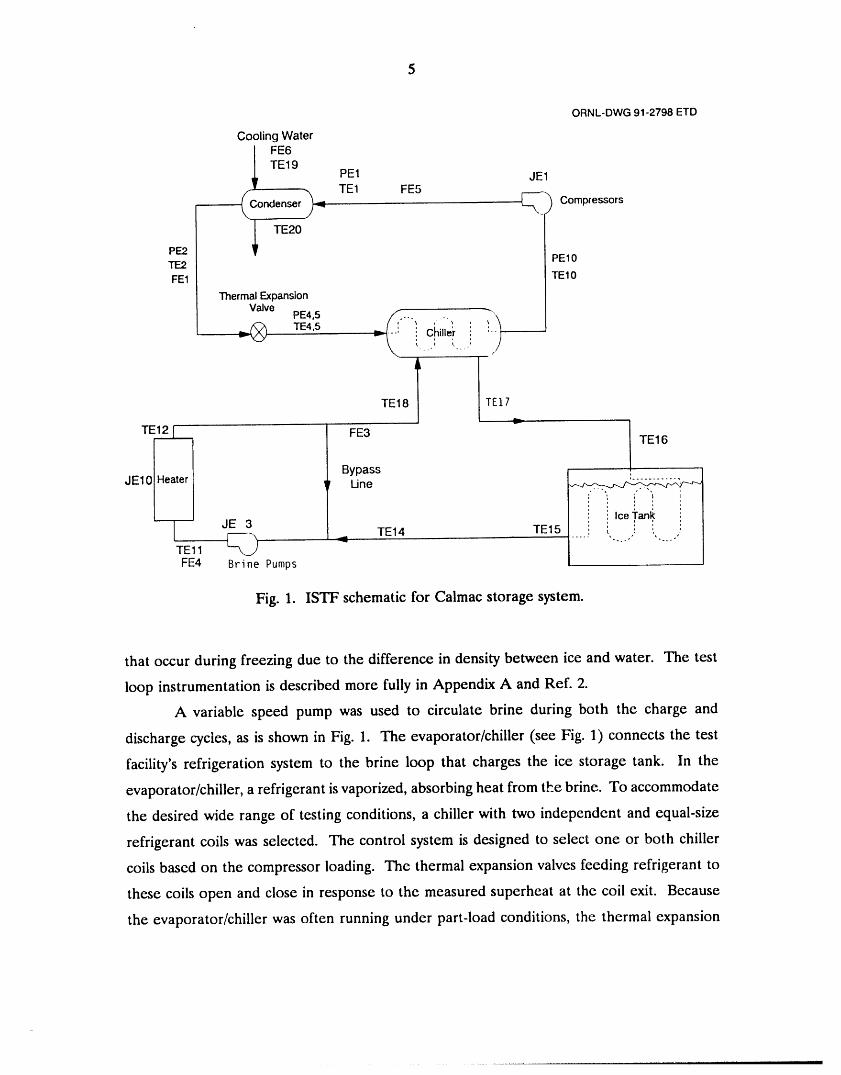
refrigeration system components necessary to charge brine systems. Figure 1 shows the test
facility configuration used to test the Calmac storage tank equipped with the brine coils. The
test facility is well-equipped with monitoring devices to measure temperature, pressure, flow,
and energy use. The monitoring points shown in Fig. 1 are listed in Table 1. A clear plastic
tube was inserted into the tank near the tank wall (where the water usually remains unfrozen)
and looped and secured outside the tank to facilitate reliable measurements of water level.
Before each level measurement was recorded, the tube inside the tank was checked to be sure
that it was free of ice. The measured water level reflects changes in the tank water depth
ORNL-DWG 91-2798 ETD
Cooling Water
FE6TEl9 PE1 JE1
(Condenser) TEl FE5 _. Compressors
PE2 1 TE20"l--h_2 PE10FE1 TEl0
Thermal Expansion
.. ' '1/
TEl8 TEl7
v
TEl2 FE3 TEl6
lH rl Bypass
JEIO e_te Une _--_:/---_-! ! ,
:: Tank:JE 3 TEl4 TEl5 _ ,
TEl 1 _--_FE4 Brine Pumps
Fig. 1. ]ST]:: schematic for Calmac storage system.
that occur during freezing due to the difference in density between ice and water. The test
loop instrumentation is described more fully in Appendix A and Ref. 2.
A variable speed pump was used to circulate brine during both the charge and
discharge cycles, as is shown in Fig. 1. The evaporator/chiller (see Fig. 1) connects the test
facility's refrigeration system to the brine loop that charges the ice storage tank. In the
evaporator/chiller, a refrigerant is vaporized, absorbing heat from tee brine. To accommodate
the desired wide range of testing conditions, a chiller with two independent and equal-size
refrigerant coils was selected. The control system is designed to select one or both chiller
coils based on the compressor loading. The thermal expansion valves feeding refrigerant to
these coils open and close in response to the measured superheat at the coil exit. Because
the evaporator/chiller was often running under part-load conditions, the thermal expansion
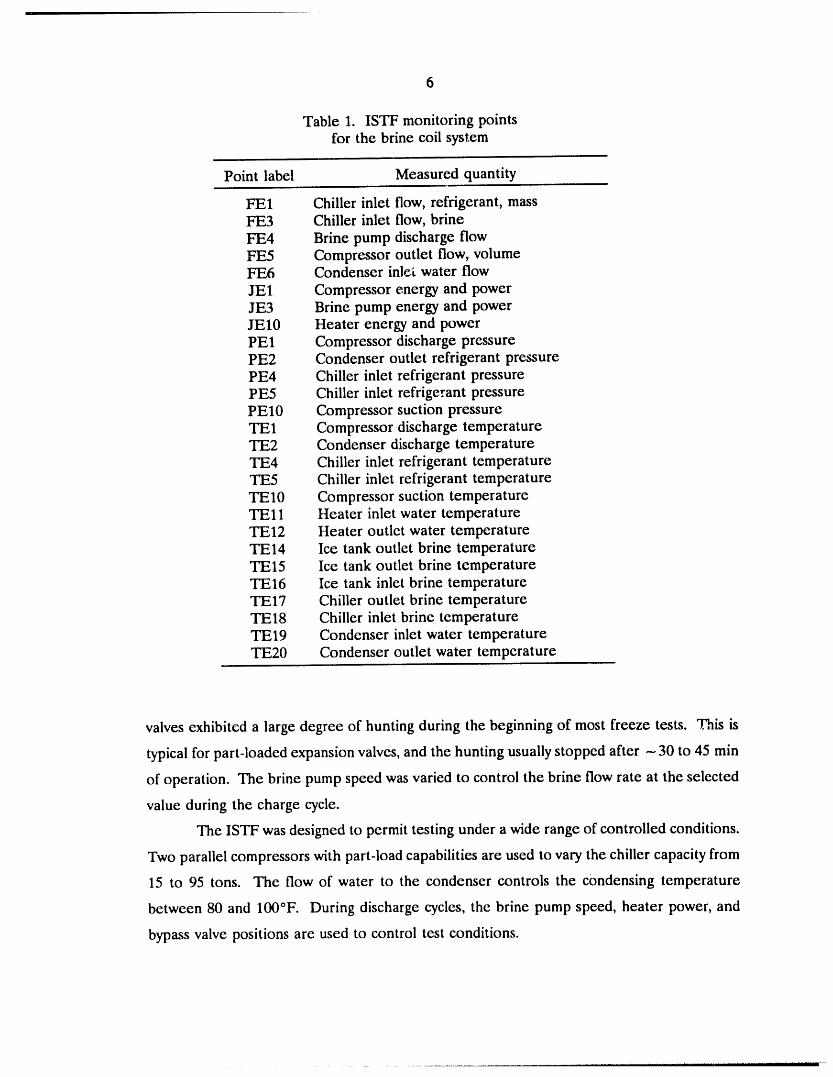
Table 1. ISTF monitoring pointsfor the brine coil system
Point label Measured quantity
FE1 Chiller inlet flow, refrigerant, massFE3 Chiller inlet flow, brineFE4 Brine pump discharge flowFE5 Compressor outlet flow, volumeFE6 Condenser inle_ water flowJE1 Compressor energy and powerJE3 Brine pump energy and powerJE10 Heater energy and powerPE1 Compressor discharge pressurePE2 Condenser outlet refrigerant pressurePE4 Chiller inlet refrigerant pressurePE5 Chiller inlet refrigerant pressurePE10 Compressor suction pressureTEl Compressor discharge temperatureTE2 Condenser discharge temperatureTE4 Chiller inlet refrigerant temperatureTE5 Chiller inlet refrigerant temperatureTEl0 Compressor suction temperatureTEll Heater inlet water temperatureTEl2 Heater outlet water temperatureTEl4 Ice tank outlet brine temperatureTEl5 Ice tank outlet brine temperatureTEl6 Ice tank inlet brine temperatureTEl7 Chiller outlet brine temperatureTEl8 Chiller inlet brine temperatureTEl9 Condenser inlet water temperatureTE20 Condenser outlet water temperature
valves exhibited a large degree of hunting during the beginning of most freeze tests. This is
typical for part-loaded expansion valves, and the hunting usually stopped after -- 30 to 45 min
of operation. The brine pump speed was varied to control the brine flow rate at the selected
value during the charge cycle.
The ISTF was designed to permit testing under a wide range of controlled conditions.
Two parallel compressors with part-load capabilities are used to vary the chiller capacity from
15 to 95 tons. The flow of water to the condenser controls the condensing temperature
between 80 and 100°F. During discharge cycles, the brine pump speed, heater power, and
bypass valve positions are used to control test conditions.
7
3. SYSTEM TE_--I'S
The test plan was structured to test the storage tank's capabilities under a wide range
of operating conditionso The compressor discharge pressure and loading and the brine flow
rate were the primary variables during the charging tests. The flow rate to the heater, heater
power, and the brine temperature exiting the heater were the control variables during the
discharge tests.
The test schedule was designed to show how the storage system would respond to
different ice-charging periods (from 8 to 16 h). The ice-discharge tests were designed to
mimic different discharge periods ranging from 6 to 12 h with varying temperature and flow
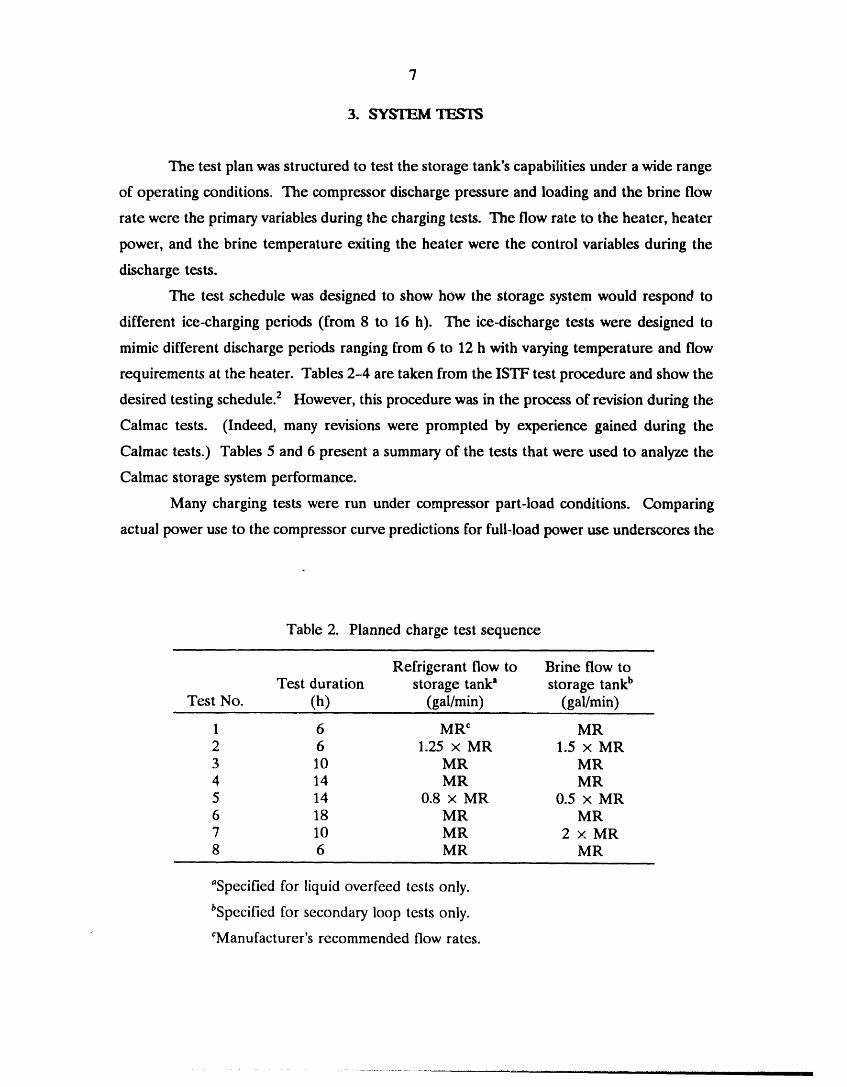
requirements at the heater. Tables 2-4 are taken from the ISTF test procedure and show the
desired testing schedule} However, this procedure was in the process of revision during the
Calmac tests. (Indeed, many revisions were prompted by experience gained during the
Calmac tests.) Tables 5 and 6 present a summary of the tests that were used to analyze the
Calmac storage system performance.
Many charging tests were run under compressor part-load conditions. Comparing
actual power use to the compressor curve predictions for full-load power use underscores the
Table 2. Planned charge test sequence
Refrigerant flow to Brine flow toTest duration storage tank" storage tank b
Test No. (h) (gal/min) (gal/min)
1 6 MR c MR2 6 1.25 x MR 1.5 x MR3 10 MR MR4 14 MR MR5 14 0.8 × MR 0.5 x MR6 18 MR MR7 10 MR 2 × MR8 6 MR MR
_Specified for liquid overfeed tests only.
bSpecified for secondary loop tests only.
CManufacturer's recommended flow rates.
...................................... i I i |al ii] ii ii II/
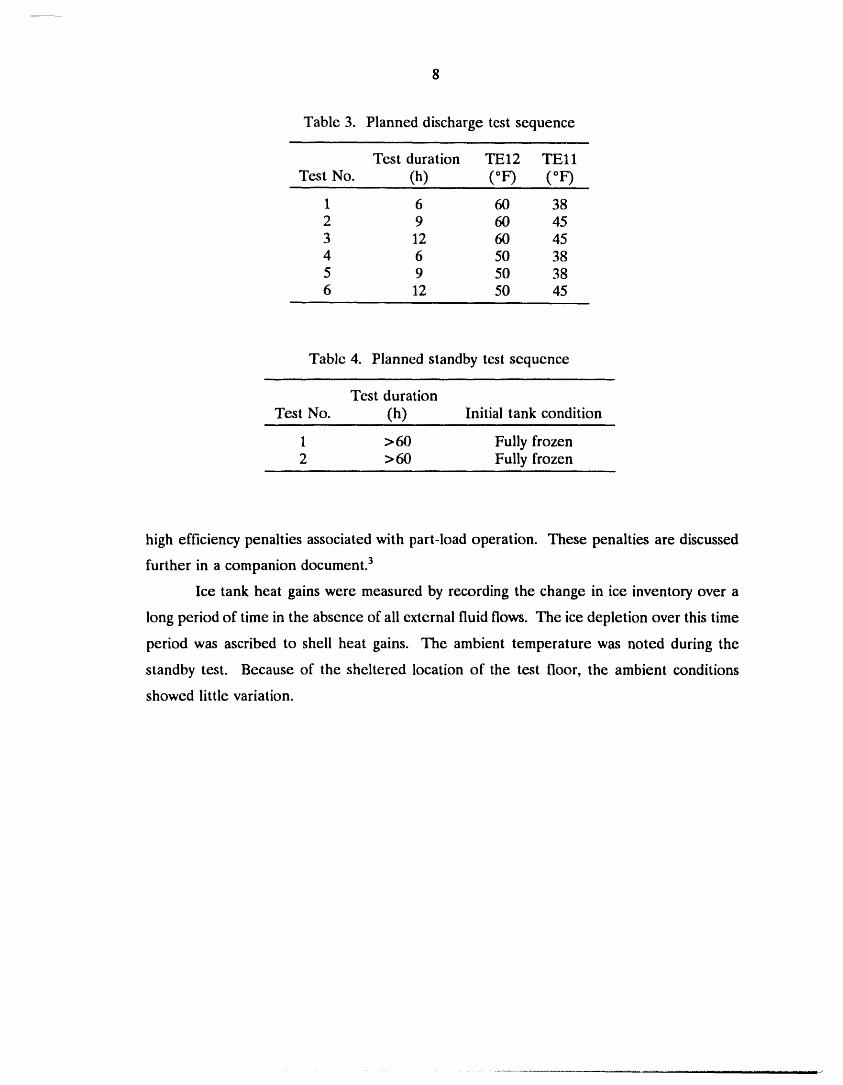
Table 3. Planned discharge test sequence
Test duration TEl2 TEl 1
Test No. (h) (°F) (°F)
1 6 60 382 9 60 453 12 60 454 6 50 385 9 50 386 12 50 45
Table 4. Planned standby test sequence
Test duration
Test No. (h) Initial tank condition
1 >60 Fully frozen2 >60 Fully frozen
high efficiency penalties associated with part-load operation. These penalties are discussed
further in a companion document. 3
Ice tank heat gains were measured by recording the change in ice inventory over a
long period of time in the absence of ali external fluid flows. The ice depletion over this time
period was ascribed to shell heat gains. The ambient temperature was noted during the
standby test. Because of the sheltered location of the test floor, the ambient conditions
showed little variation.
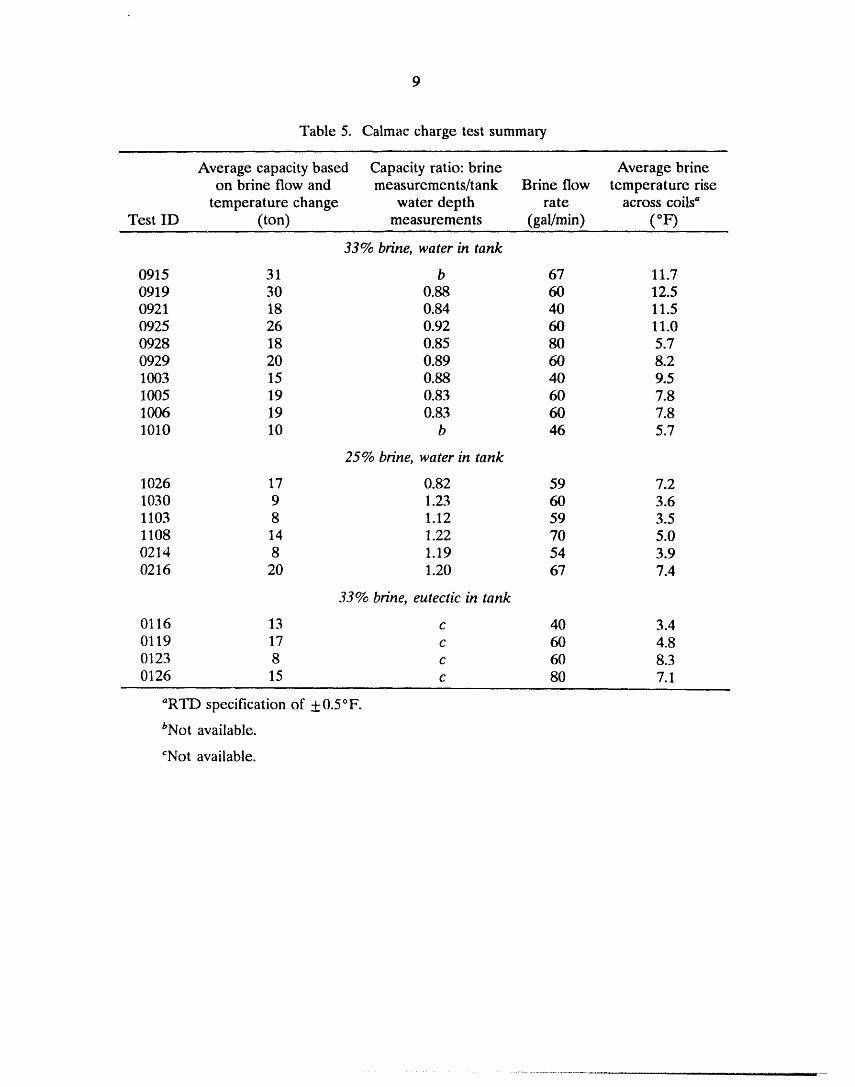
Table 5. Calmac charge test summary
Average capacity based Capacity ratio: brine Average brineon brine flow and measurements/tank Brine flow temperature rise
temperature change water depth rate across coils aTest ID (ton) measurements (gal/min) (°F)
33% brine, water in tank
0915 31 b 67 11.70919 30 0.88 60 12.50921 18 0.84 40 11.50925 26 0.92 60 11.00928 18 0.85 80 5.70929 20 0.89 60 8.21003 15 0.88 40 9.51005 19 0.83 60 7.81006 19 0.83 60 7.81010 10 b 46 5.7
25% brine, water in tank
1026 17 0.82 59 7.21030 9 1.23 60 3.61103 8 1.12 59 3.51108 14 1.22 70 5.0021,4 8 1.19 54 3.90216 20 1.20 67 7.4
33% brine, eutectic in tank
0116 13 c 40 3.40119 17 c 60 4.80123 8 c 60 8.3
0126 15 c 80 7.1
aRTD specification of +0.5°F.
bNot available.
CNot available.
10
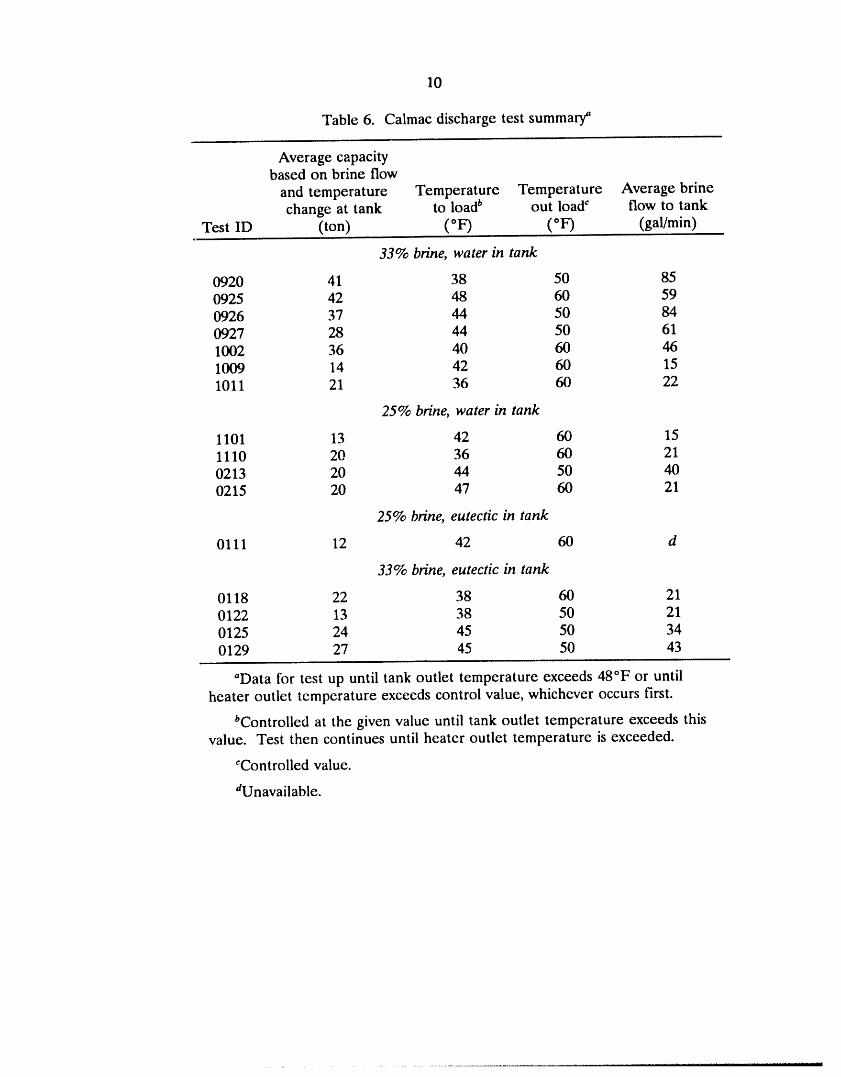
Table 6. Calmac discharge test summary_
Average capacitybased on brine flow
and temperature Temperature Temperature Average brinechange at tank to load b out load c flow to tank
Test ID (ton) (°F) (°F) (gal/min)
33% brine, water in tank
0920 41 38 50 850925 42 48 60 590926 37 44 50 840927 28 44 50 611002 36 40 60 461009 14 42 60 151011 21 36 60 22
25% brine, water in tank
1101 13 42 60 151110 20 36 60 210213 20 44 50 400215 20 47 60 21
25% brine, eutectic in tank
0111 12 42 60 d
33% brine, eutectic in tank
0118 22 38 60 210122 13 38 50 210125 24 45 50 340129 27 45 50 43
"Data for test up until tank outlet temperature exceeds 48°F or until
heater outlet temperature exceeds control value, whichever occurs first.
bControlled at the given value until tank outlet temperature exceeds thisvalue. Test then continues until heater outlet temperature is exceeded.
cControlled value.
dUnavailable.
11
4. ANALYSIS METHODOI£)GY
The primary concern of the data analysis is to produce useful information and to
present it in a meaningful fashion. Another concern is to distinguish between the
performance of the ice storage system and the performance of the refrigeration system.
While analysis of the refrigeration system performance can prove enlightening and is certainly
useful to system designers, it must be distinguished from thot of the manufacturer's storage
system. Also, the test facility is different from a commercial system because it must have the
flexibility to test a wide variety of system types. This introduces much added complexity that
a commercial system would not encounter.
4.1 DATA PR_ING
The data available for each operational test permit redundant calculations that
increase our understanding and confidence in the test results. For example, the heat rejection
at the condenser is measured on both the water and refrigerant sides of the heat exchanger.
The refrigeration effect to the ice tank is measured by both changes in the water height (a
measure of the ice inventory) and by the brine flow and temperature change. The
refrigeration effect is also measured at the chiller on both the brine and refrigerant sides.
The energy available for discharge is measured by brine flow and temperatures at the heater
and at the ice tank, as well as by the power going to the discharge heater. This duplication
of measurements also enables us to more fully separate the performance of the ice storage
system from that of the refrigeration system.
The data are collected for each monitoring point every 30 s during a charge test and
every 15 s during a discharge test. This collection frequency is dictated by system control
requirements rather than by the analysis requirements. The data are immediately summed
(for flows or energy uses) or averaged (for temperatures, pressures, power uses, and flow
rates) to represent the appropriate values on a 5-min basis.
Thermodynamic properties for R-22 are calculated from a computerized format
developed by G. T. Kartsounes and R. A. Erth and adapted for use at Oak Ridge National
Laboratory (ORNL) by C. K. Rice and S. IC Fischer. _ Brine properties, as a function of
concentration and temperature, were provided by Union Carbide Corporation, and
information for the temperature range of interest was extracted, s
12
4.2 REFRIGERATION EFFECT
4.2.1 Storage Tank
The refrigeration effect in the ice tank is directly measured by recording the depth
of the water in the tank, as was described in Sect. 3. This measurement is reliable whenever
ice is present in the tank and when the ice is submerged, usual conditions during a charging
cycle. The measured density of ice in previous local tests was 57.2 lb/ft 3, in good agreement
with the reported range of 57.2 lb/ft 3 at 0°C to 57.4 lb/ft 3 at -10°C (Ref. 6). The measured
volume change vs tank depth change in the 7 in. above the fully filled level was 21.1 gal/in.
These figures, combined with an assumed water density of 62.4 lb/ft 3 and the heat of fusion
of 144 Btu/ab, produce a latent storage capacity of 23.2 ton-h/in, change in water depth.
The heat of fusion and density of the eutectic were not experimentally measured
during the tests at the ISTF. Calmac reports that the overall tank capacity should be derated
by 15% when the 28°F eutectic is used. 7 Using this factor, the latent storage capacity was
taken to be 19.7 ton-h/in, change in eutectic depth.
The stored cooling effect is also calculated from the measured brine flow rate and
temperature gain as is shown in Eq. (1).
RE b = FE4 x cp x ,o × (TEl5 - TEl6) , (1)
where
RF_q, = refrigeration effect measured by the brine,
FE4 = brine flow from the chiller,
cp = brine specific heat,
p = brine density,
TEl5 = brine temperature leaving the ice tank,
TEl6 = brine temperature entering the ice tank.
The brine specific heat and specific gravity are provided in the form of families of curves in
Ref. 5. Interpolations from these curves for the temperature range from 20 to 60°F and a
brine concentration of 33 wt % produced the following equations for specific gravity (relative
to water at 60°F) and specific heat.
SG = (-0.0002) x T + 1.063, (2)
13
where
SG = specific gravity,
T = average brine temperature (°F).
Cp= 0.0003 x T + 0.899, (3)
where
Cp = specific heat [Btu/(lb-°F)],
T = average brine temperature (°F).
Interpolation for a brine concentration of 25 wt % produced Eqs. (4) and (5).
SG = (-0.000108) x T + 1.0482, (4)
Cp= 0..000275 x T + 0.922. (5)
The system capacity was also measured at the evaporator/chiller, on both the brine and
refrigerant sides. These measurements provide another checkpoint to guard against
instrument failure. The capacity measured at the chiller is expected to be slightly higher than
that at the ice tank due to shell heat gains at the tank and in the piping and also by the
amount of energy added by the brine pumps. The brine-side measurements are similar to
those used for the ice tank and are shown in Eq. (6). The refrigerant-side measurements are
used in Eq. (7). Shell losses from the well-insulated chiller are assumed to be negligible.
REbch = FE4 x Cp x p x (TEl8 - TEl7), (6)
where
REch = refrigeration effect at the chiller, based on brine flow and temperaturemeasurements,
FE4 = brine flow from the chiller,
Cp = brine specific heat,
p = brine density,
TEl7 = brine temperature leaving the chiller,
TEl8 = brine temperature entering the chiller.
REfch = FE1 × (HE10 - HE2), (7)
14
where
REtch = refrigeration effect at the chiller, based on refrigerant flow and propertymeasurements,
FE1 = refrigerant flow to the chiller,
HE10 = enthalpy corresponding to the measured suction temperature and pressureof the superheated refrigerant leaving the chiller,
HE2 = enthalpy corresponding to the saturated liquid refrigerant leaving thecondenser.
4.22 Refrigeration System
Another measurement of the system capacity can be taken from the compressor
curves. These curves were modeled by Eqs. (8)-(11). Equation (8) predictions match the
compressor manufacturer's table within -!-0.5 ton. Equation (10) predictions match the
manufacturer's table within +0.5 hp. The heat of rejection model, Eq. (11), has residuals
ranging from -0.005 to +0.016. Many tests were run at part-load conditions; that is, the
compressor was not operating at full capacity. The compressor capacity and heat rejection
predictions were therefore reduced in proportion to the loading on the compressor. The
manufacturer's power consumption table is good only for fully loaded conditions and cannot
accurately predict part-load power requirements.
Re c = 49.35 + 1.663 x Ts- 0.00173 x (Td) 2 (8)
- 0.00708 x Ts × Td + 0.00953 x (Ts)2 X Cs,
Cs = 1 + 0.0005 x (Td - TE2 - 15), (9)
_6/c= 44.088 - 0.508 x Ts + 0.000840 x (Td)2 (10)
+ 0.0123 x Ts x Td - 0.00592 x (Ts)2 ,
(_ = 1.090 -0.00422 x Ts + 0.00263 x Td , (11)
where
Rec = refrigeration capacity predicted by the compressor capacity curves (tons),
Ts = saturated suction temperature (°F),
Td = saturated discharge temperature (°F),
Cs = capacity correction for subcooling (table based on 15°F),
15
Wc = compressor power predicted by the manufacturer's data (bhp),
(_ = heat of rejection predicted by the compressor manufacturer (ton).
As another check on the system, the heat rejected at the condenser is measured on both the
refrigerant and water sides [see Eqs. (12) and (13)].
t_ = FE6 × (TE20 - TEl9), (12)
0t = (FE5/VE1) x (HE1 - HE2), (13)
where
= heat absorbed by the cooling water,
FE6 = water flow rate,
TE20 = water temperature into the condenser,
TEl9 = water temperature exiting the condenser,
0t = heat rejected by the refrigerant,
FE5 = refrigerant volume flow entering the condenser,
VE1 = refrigerant specific volume entering the condenser,
HE1 = refrigerant enthalpy entering the condenser, and
HE2 = refrigerant enthalpy leaving the condenser.
4.2.3 Capacity Models and Capacity Normalization
A normalized capacity is also calculated to provide a clearer picture of the change in
capacity during the charging cycle. The capacity at each point in time is divided by the
average capacity over the entire charging test period (not including the cooldown portion of
the test). The normalization is only accurate for those tests that extend from the fully melted
to the fully frozen states.
A mathematical model was also created to represent the capacity as a function of the
state of charge for each point in time during the test. Several models were tested using the
SAS Institute, Inc., system procedure entitled REG. s This procedure fits least-squares
estimates to linear regression models and reports the adjusted squared correlation coefficient
as well as the Student's T ratio and significance probability for each parameter estimate.
Based on these model evaluation points, the best model was chosen and is shown in Eq. (14).
The predicted values were plotted vs the residual values to check for unwanted trends in the
16
model output. The modeling process smooths out the irregularities present in most test data
and makes it easier to identify trends in the data. The use of this model is explained more
clearly in the results section.
R.eb,---A t + A 2 x PDE1 + A 3 x (DPDE1) 2 + A 4 x (DPDE) u2 , (14)
where
Reb, = capacity, normalized relative to the average capacity,
A_-A4 = parameter coefficients that are different for each test,
PDE1 = tank water depth,
DPDE1 = difference between the tank water depth and the fully melted tank waterdepth.
4.3 DISCHARGE ENERGY AVAILABLE
The cool storage available to meet a cooling load was measured by the brine flow
rates and temperature changes at the heater and at the ice tank [see Eqs. (15) and (16)].
The tank storage inventt_ry is not measurable during the discharge cycle because there is no
way of measuring the mixed temperature of the liquid water within the storage _ank. This
water is increasing in !emperature throughout the test. However, the initial amount of
available cool storage is calculated based on the tank water height (at 23.2 ton-h/in.) and the
initial temperature of the brine in the piping outside the tank (assuming that the brine
inventory within the tank is at 32°F). The cool storage depletion from this initial value as
measured at the tank ",rilldiffer from the cooling delivered to the load by the amount of the
pump work on the fluid aod the standby losses from the tank walls.
caF, ' = FE4 x (TEl2 - TEll) x Cp x 0, (15)
capt = FE3 x (TEl5 -TEl6) x Cp x p, (16)
" where
caph = discharge capacity measured at the heatel_
. FE4 = brine flow to heater,
TEl2 = brine temperature leaving heater,
TEll = brine 'emperature entering heater,
17
Cp = specific heat of brine,
capt = discharge capacity measured at the ice tank_
FE3 = brine flow to ice tank,
TEl5 = brine temperature leaving ice tank,
TEl6 = brine temperature to ice tank,
p = brine density.
The heater power was also measured but is not considered accurate as is discussed in
Appendix A. Corrections were also made to the calculated cumulative discharge to account
for standby losses that occurred whenever a test was stopped and then restarted the next day.
The tank was considered to be fully discharged when the tank outlet temperature reached
48°F. Some ice may remain in the tank at that time but is unavailable to meet the load.
4.4 SHELL HEAT GAINS
Shell heat gains were measured directly from changes in tank water depth over
extended periods of time when there was no external flow.
18
5. RESULTS
The tests were run at two brine concentrations, 33 and 25%, both by weight. The
higher brine concentrations were necessary to avoid freezing brine in the chiller/evaporator
during the high-capacity tests. The lower brine concentration tests were made to provide test
data at Calmac's recommended concentration.
The brine pressure drop across the Calmac coils was measured at flow rates of 20, 40,
60, 70, 80, and 90 gal/min, with the 33 wt % brine mixture. The measured pressure drop
ranged from 0.2 psi less to 0.6 psi more than the values presented by Calmac; 1 they range
from 2 psi at 20 gal/min to 15.6 psi at 90 gal/min. A friction factor correlation shows that the
pressure drop is approximately proportional to the Reynold's number raised to the
-0.25 power. 9 Based on this correlation, pressure losses at the recommended brine
concentration of 25 wt % should be --5% less than the measured values and produce
pressure drops in very close agreement to the values reported by Calmac.
Calmac also offers an insertion probe and inventory meter for use in monitoring the
ice in the tank. These work by measuring the increase in tank height that occurs when ice
(with a lower density than the surrounding water) is formed. The insertion probe is supplied
with an air pump to continuously bubble air through the line and prevent ice plugs from
forming. This strategy was successful during the testing period except when testing the
eutectic mixture with a depressed freezing point of 28°F. During these eutectic tests with
lower temperatures, ice plugs from 1 to 5 in. in length were formed. These plugs had to be
manually removed from the probe. The voltage output of the probe was found to be linearly
proportional to the tank height during both charge and discharge cycles. Therefore, although
the Calmac meter depth reading varied from 0.1 to 0.2 in. higher than that recorded by our
own instrumentation and visual readings, it was relatively stable and repeatable.
5.1 CHARGING PERFORMANCE
When designing a thermal storage system for a given application, the heat rejection
temperature, storage capacity, and time available for charging are usually known. 1° This
establishes the average capacity needed during the charging cycle. The ability of a storage
system to meet these requirements is a function of both the storage tank/coil design and of
the balance of the refrigeration system, most importantly the compressor.
19
Compressor manufacturers present their capacity as a function of saturated suction
and discharge temperatures (Sect. 4.2 described the manufacturer's data for the ISTF
compressor). When charging an ice-on-coil storage tank, the suction temperature gradually
drops as the water in the tank becomes colder and ice builds up on the coils. The reduced
suction temperature leads to a reduced refrigeration capacity. The temperature profile of the
fluid entering the tank vs the tank state of charge is therefore an important characteristic of
the storage system.
Capacity calculations were described in Sect. 4.2 and are based on an energy balance
on the ice tank. The cumulative value of this calculated refrigeration capacity (based on the
brine flow rate and temperature change in the ice tank) was compared to the change in
storage tank depth. This comparison is shown in Table 5 as the capacity ratio. This ratio
represents the cumulative capacity based on brine measurements divided by the cumulative
capacity based on the change in tank water depth. This ratio varies from a low of 0.82 to a
high of 1.23. This means that the capacity, as calculated from the brine flow and temperature
change, varied from 18% less to 23% more than the capacity as measured by the amount of
ice manufactured.
This discrepancy was investigated by examining the data, test log notes, and instrument
calibration records. The resistance temperature detectors (RTDs) were calibrated before the
first Calmac test, and three RTDs were replaced. Although this initial calibration was not
recorded, any RTD that was more than +0.5°F from the ice bath temperature would have
been changed. The RTDs were again checked in an ice bath on September 26, and the
measurement at the tank outlet was found to be 0.30F higher than the one at the tank inlet.
This was within the specified accuracy band, and no changes were made. On October 16, the
RTD at the tank inlet measured a temperature 0.10F high, and the tank outlet was 0.2°F low,
for an error in the difference of 0.3°F (negative during a charge and positive during a
discharge). For a charge test with a 12°F change across the brine coils, this 0.4°F error
would cause the capacity to be underestimated by 3%. For a test with a 3.5°F change across
the brine coils, this 0.4°F error would cause the capacity to be underestimated by 12%. (The
average brine temperature change is shown in the last column of Table 5.) On
February 6, 1990, the RTD at the coil outlet was again checked against an ice bath and found
to be within +0.1 °F. On March 2, 1990, the RTDs at both the inlet and outlet were checked
in a controlled temperature bath at 60 and 32°F. The coil inlet RTD was 0.1°F high at both
60 and 32°F. The coil outlet RTD was 0.2°F low at 60°F and 0.4°F low at 32°F. If this
20
condition was the same for the test on February 16, 1990 (test 0216), with an average
measured temperature change of 7.4°F, the capacity would have been underestimated by 7%.
However, as Table 5 shows, the brine measurements predicted 20% more ice than was
estimated using the water depth measurements.
Other possible sources of error are the brine flow measurement and the ice inventory
measurement. The flowmeters have always shown good accuracy (to within 1%) during
calibration tests. Also, there are two flowmeters in series that showed close agreement
throughout the test series.
The ice inventory measurement is based on the difference in density between water
and ice, as was discussed in Sect. 4.2. Because not ali the water in the tank is frozen during
a full charge, the expected volume change is 8%, or an increase of -- 130 gal from an initial
volume of 1620 gal. This volume change is detected by measuring the depth of the water in
the tank. This measurement was done with a very simple arrangement of a tube submerged
in the water near the top of the tank and looped outside the tank to a ruler and a differential
pressure transducer. The submerged tube was regularly checked to be sure it was clear of ice.
This measurement was accurate to within 0.1 in. During a full charge, the change in tank
depth would be -6 in., so the depth measurement would be accurate to within -2%.
Occasionally, a small amount of ice would be above the water, but this was not typical of
normal operation. However, it is possible that the configuration of this storage tank could
cause small air pockets to form and thereby elevate the water level, overstating the amount
of ice within the tank. lt is also possible that there could be some slight distortion of the side
walls or that the plastic tubing within the tank could be compressed somewhat in a tank
whose contents ar6 frozen nearly solid, thereby depressing the water level, and understating
the amount of ice within the tank. Considering, however, that the capacity based on the ice
inventory is both greater than (tests 0919-1026) and less than (tests 1030-0216) the capacity
based on the brine flow and temperature change, the presence of such air pockets or tank
distortions is not a likely cause of the noted discrepancies.
Based on these considerations, the amount of charge reflected by the change in tank
depth was judged to be more reliable than that based on the brine flow and temperature
change. The tank depth was therefore used to establish the initial charge level for ali
discharge tests.
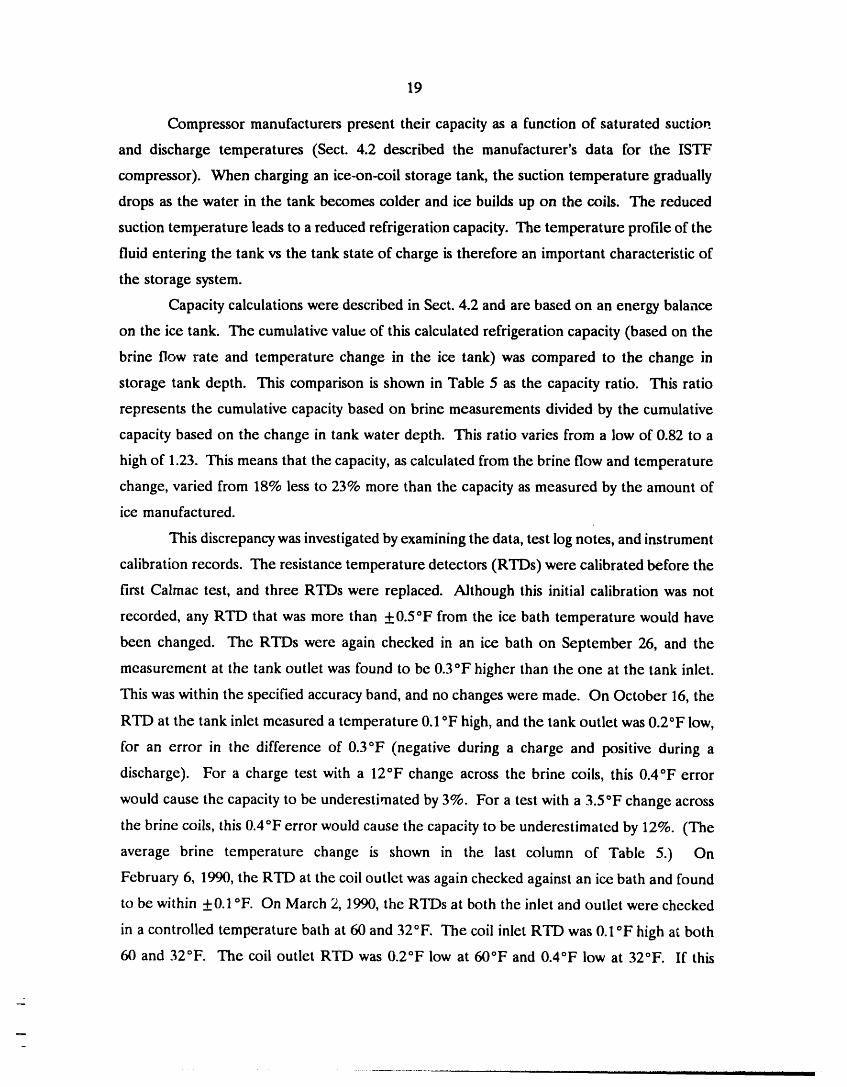
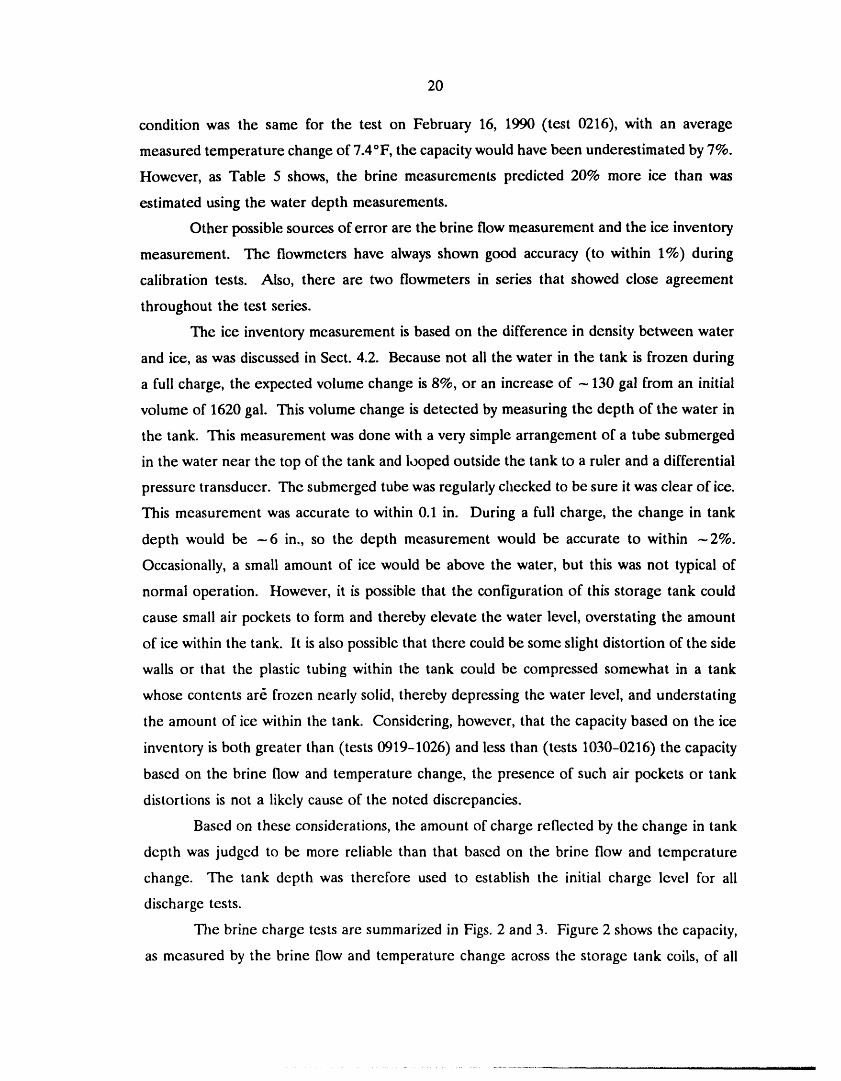
Tile brine charge tests are summarized in Figs. 2 and 3. Figure 2 shows the capacity,
as measured by the brine flow and temperature change across the storage tank coils, of ali
21
ORNL-DWG 91-2799 ETD
TEST DATE
/ _ o9/.1s, .... 09/.19/
.^/• , ...... 09/.214uI ......... 09/.25/ '. ..... 09/.28r% - ..... 09/.29
_" / ",-.. ...... lO/.O3o / '_N --- lO/.O6/
lO/10I
3o] ,, ................ . _. _
"20 ",,,_ .........
. _.____=;->--_-_7..__-__._-_.__..I /'_ _f .I .1- --'"I i ", / ' "- "'_''''-_°'_--'_-'_',- "-_-',-_-°_'--/ .... -'_--_-,.---- _---_-,U I I ., " ' _''-
eLo 2'o 20 6'0 80 ,oo Iio 1,o ,6o ,8o
STOREDLATENTENERGY(ton-h)
Fig. 2. Summary of Calmac charge tests with water in tank and brine concentrationof 33%, both capacity and stored latent energy based on brine temperature and {lowmeasurements. Adl temperature measurements are +_O.5°F.
ORNL-DWG 91-2800 ETD30.
TEST DATE
..... 10_2610/3011_0311L08
..... 02L14'\ ..... 02/16'k
o , _-_°._20 \ "_._
"N,j, IZ _ _ _ _4 _-- _
I
mE / " v "__-\ ^ .
I
I
I
oo 1o 20 30 40 50 60 70 80 90 1oo 110 120 130 140
STOREDLATENTENERGY(ton-h)
Fig. 3. Summary of Calmac charge tests with water in tank and brine concentrationof 25%, both capacity and stored latent energy based on brine temperature and flowmeasurements. Ali temperature measurements are +0.5°F.
22
tests that were made with a brine concentration of 33% (by weight). The stored latent energy
is calculated by summing the calculated capacity during the test after the brine inlet
temperature drops below 32 OF. Figure 3 gives this same data for tests that were made with
a brine concentration of 25%. The tests ranged in average capacities from 8 to 31 tons. Four
of the tests shown in Fig. 3, 1030, 1103, 1108, and 0214, appear to stop short of a full charge.
However, these tests actually did achieve a full charge as measured by the change in tank
height. The capacity appears to be relatively insensitive to tank state of charge, with only a
slight drop in capacity as the test nears completion.
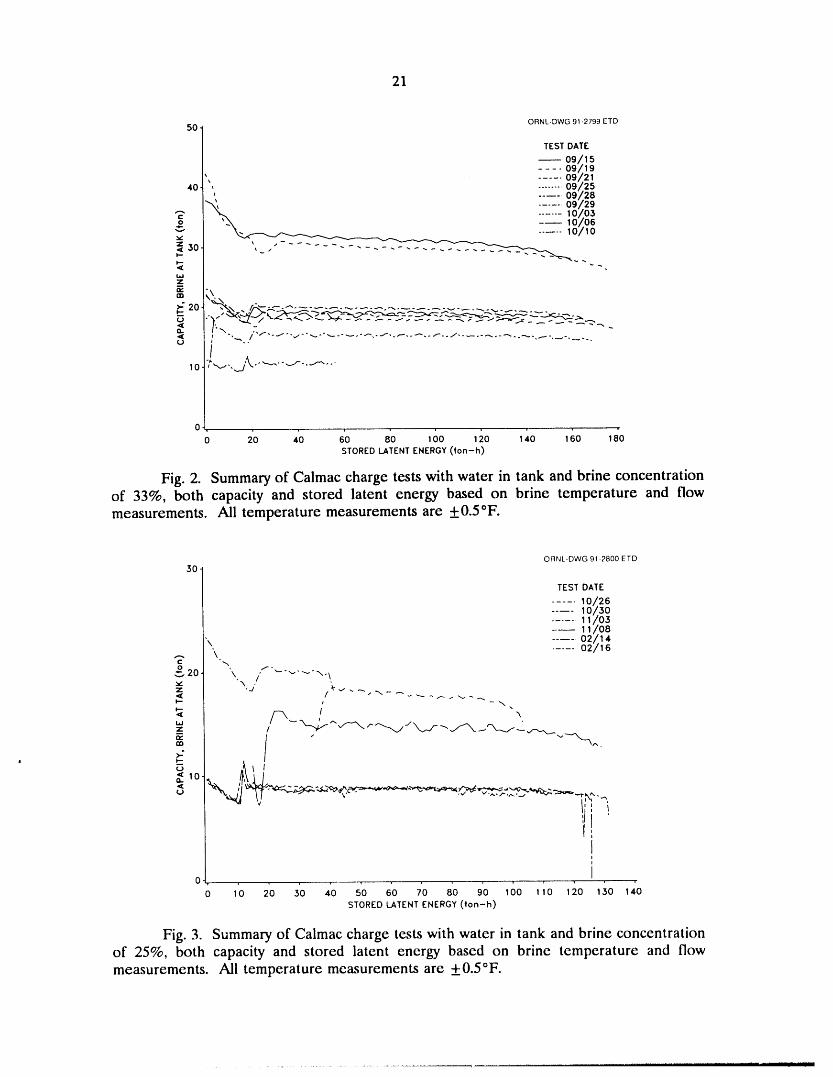
The examine this issue more closely, a normalized capacity was calculated to show the
decrease in capacity that occurs as ice builds up around the coils within the storage tank. Ali
the tests shown in Fig. 4 extended from essentially 0 to 100% charged and ranged from 15 to
30 tons. Because the roughness introduced by the capacity fluctuations makes this plot
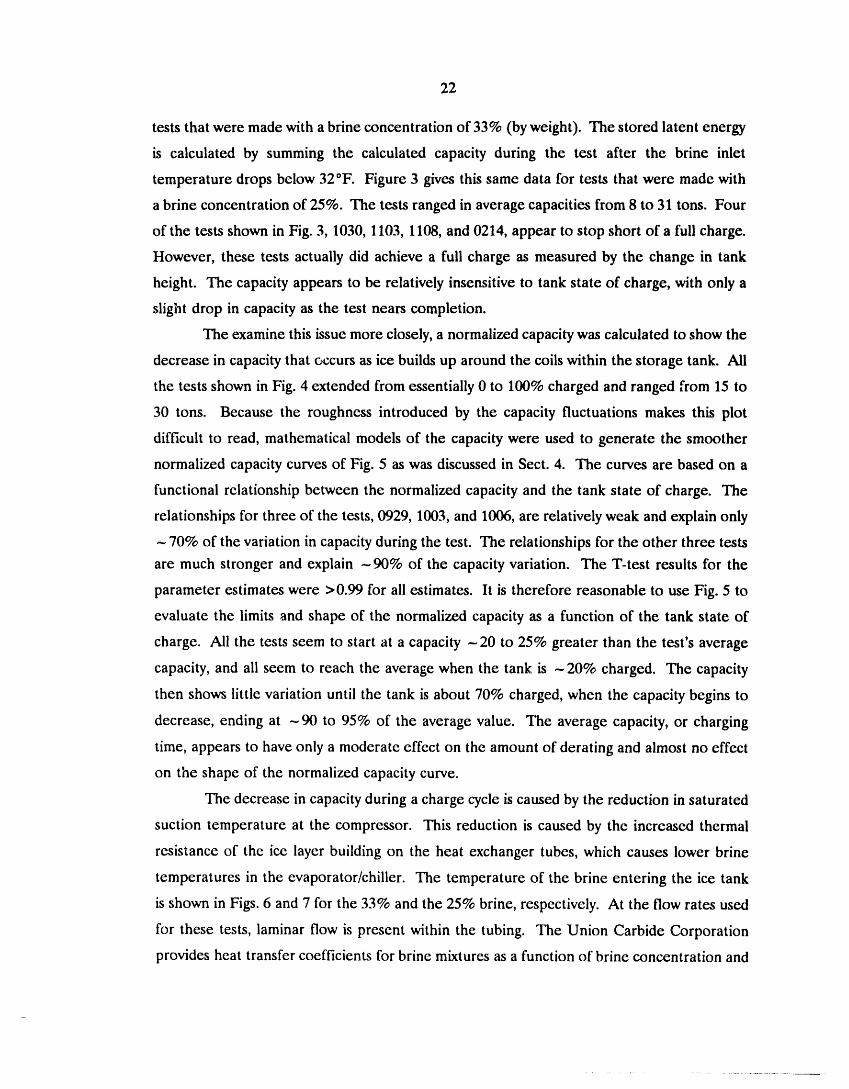
difficult to read, mathematical models of the capacity were used to generate the smoother
normalized capacity curves of Fig. 5 as was discussed in Sect. 4. The curves are based on a
functional relationship between the normalized capacity and the tank state of charge. The
relationships for three of the tests, 0929, 1003, and 1006, are relatively weak and explain only
- 70% of the variation in capacity during the test. The relationships for the other three tests
are much stronger and explain -90% of the capacity variation. The T-test results for the
parameter estimates were >0.99 for ali estimates. It is therefore reasonable to use Fig. 5 to
evaluate the limits and shape of the normalized capacity as a function of the tank state of
charge. Ali the tests seem to start at a capacity -20 to 25% greater than the test's average
capacity, and ali seem to reach the average when the tank is -20% charged. The capacity
then shows little variation until the tank is about 70% charged, when the capacity begins to
decrease, ending at --90 to 95% of the average value. The average capacity, or charging
time, appears to have only a moderate effect on the amount of derating and almost no effect
on the shape of the normalized capacity curve.
The decrease in capacity during a charge cycle is caused by the reduction in saturated
suction temperature at the compressor. This reduction is caused by the increased thermal
resistance of the ice layer building on the heat exchanger tubes, which causes lower brine
temperatures in the evaporator/chiller. The temperature of the brine entering the ice tank
is shown in Figs. 6 and 7 for the 33% and the 25% brine, respectively. At the flow rates used
for these tests, laminar flow is present within the tubing. The Union Carbide Corporation
provides heat transfer coefficients for brine mixtures as a function of brine concentration and
23
ORNL-DWG 91-2801 ETD
1.50 ]
| TEST DATE
|', ..... 09/.15
/ \ ..... 09/.19...... 09_21
/ --- 09/.25
1 25 / _, ..... 09/.28....... 09/.29:_,'_ ...... lo/.o3'. _,_, --- 0/.06
1
\\,_ ..... 1o/1o'\\ .p,
o:::3<[_E
(:3:Z
0.75 1 ;!0.50 , ,, ,
0 20 40 60 80 1O0 120 140 160 180STORED LATENT ENERGY (ton-h)
Fig. 4. Normalized capacity of Calmac charge tests with water in tank and brineconcentration of 33%, normalized relative to average for each test.
ORNL-DWG 91-2802 ETD
TEST DATE
09/15 31 tons)' .... 09/.19 30 tons)
i ', 09/.29 20 Ions)
1.2 , ...... 10/.03 15 tons)...... 10/06 19tons)
1.1 ' ,
-- 1.0
_,. _ _ ".."_-_.0Z
0.9
0.8 , , ,
0 I 0 20 30 40 50 60 70 80 90 1O0 110
LATENT TANK CHARGE (%)
Fig. 5. Normalized capacity of Calmac charge tests with water in tank and brineconcentration of 33%, generated by test-specific mathematical models of normalized capacityas function of tank charge, normalized relative to average for each test.
24
ORNL-DWG91-2803ETD
.35 TESTCONDITIONSCAPACITY FLOW RATE
(ton) (gal/mln)31 67
.... 30 60
_, ..... 18 4030 , -....... 26 60_\ ..... 18 80_ ..... 20 60......15 40
A.\\A ...,_, -.,.. ---,9 60_- II h [ .... ...... 10 46
_,/..-._..__._........_-...,,---.-_:._..__.__._,_. ,.._.-=_..,.,-_--\ _j.," _.. _ - ......._
15 ""'.
100 20 40 60 80 100 120 140 160 180
STOREDLATENTENERGY(ion-h)
Fig. 6. Summaryof tank brine inlet temperature profiles for ali Calmac chargetestswith water and brine concentrationof 33%. Ali temperature measurementsare -t-0.5°F.
ORNL-DWG 91-2804 ETD
341 TEST CONDITIONS
l CAPACITY FLOWRATE(ton) (gal/mln)
..... 17 5932 ..... 9 60...... 8 59
-_ 14 70..... 8 54..... 20 67
_3o I_. ',
_r_ iI I
o 28 _1/_ . ._ i'--. i26 , ""k._.. ,
ta _
m_ 24 \, "----_
t "/ _-__ - _ _ _._ .... _ \
22 \,/ ....
20 • ,0 10 20 30 40 50 60 70 80 90 100 110 120 130 140
STORED LATENT ENERGY (Ion-h)
Fig. 7. Summary of tank brine inlet temperature profiles for ali Calmac charge testswith water and brine concentration of 25%. Ali temperature measurements are +0.5°F.
25
Reynolds number, s For equivalent volumetric brine flow rates, the heat transfer coefficient
for the 33% brine mixture is 8% less than that for the 25% brine mixture. Therefore, at a
given capacity and flow rate, the brine temperature difference across the tank will be 8%
greater for the 33% mixture than it would have been for the recommended 25% mixture.
As expected, the tests that were run at a higher capacity show the lowest brine temperatures.
However, the brine flow rate is also an important parameter in determining the brine
temperature. Figure 8 shows the variation in brine inlet temperature for tests with the
approximate capacity of 19 tons and brine flows that vary from 40 to 80 gal/min. Figure 9
shows the average of the brine inlet and outlet temperatures at the ice tank for these same
tests. The difference between the brine inlet temperatures for the 40- and 80-gal/min tests
is -3.6°F (Fig. 8), while the difference between the average (of the brine inlet and outlet)
temperatures is only about 0.9°F (Fig. 9). Theoretically, this average brine temperature
should be strictly a function of capacity and the heat exchanger design, with the flow rate
controlling the difference between the brine inlet and outlet temperatures. The data show
this to be true for the Calmac tank.
The variation of the inlet and average brine temperatures with capacity is seen more
clearly if tests with the same brine flow rate are compared as is shown in Figs. 10 and 11.
The flow rate for ali of these tests was -60 gal/min. The two tests shown ending at a
capacity <140 ton-h were at a brine concentration of 25 wt %. The others were at a
concentration of 33 wt %. As shown on Fig. 10, the brine inlet temperature ranged from a
low of 18°F at 30 tons to a high of 27°F at 9 tons. The average brine temperatures show less
variation, ranging from 25°F at 30 tons to 29°F at 9 tons.
To aid customers in selecting the proper chiller, Calmac provides the average and
minimum brine temperatures to the ice tank during charge cycles of varying capacities and
flow rates. These are shown in Figs. 12 and 13, along with the comparable values measured
during the tests. The average brine inlet temperatures were ali within the range reported by
Calmac, within the measurement accuracy of +0.5°F. The minimum brine inlet temperatures
were also within the reported values, except for a few tests run at capacities of 26 to 31 tons.
The brine concentration for these tests was 33 wt %, which would exaggerate the difference
between the inlet and outlet temperatures by -8% as was discussed previously. This,
coupled with the measuremcnt accuracy, would easily piace the test values within the range
reported by Calmac.
26
ORNL-DWG91-2805ETD
35 1 TESTCONDITIONSCAPACnXrLOw_
(to.) (gol/_)..... 18 40..... 18 80...... 20 60
/_ -_ 19 6030
,._. ._ ,
20 \, - _\_
1,5 , , 2 '0 10 20 30 40 .50 60 70 80 90 100 110 1 0 130 140 150 160 170 180STOREDLATENTENERGY(ton-h)
Fig. 8. Tank inlet temperature vs calculated stored cncrl_ for Calmac charge testswith average capacity from 18 to 20 tons and brine flow rates of 40, 60, and 80 gal]min. Al]temperature measurements arc +0.S°F.
ORNL-DWG91-2806ETD
40 1 TEST CONDITIONS| cAPACnX FLOWPATE
• (to.) (ooO/mn.)| ...... 18 40|_ ..... 18 80/', ...... 20 60|_ _l -_ 19 60
N \\,_o \\
,., _ _[ / _-" --'-:----_--_- .-,__...
200 10 20 30 40 50 60 70 80 90 100 110 120 130 140 150 160 170 180
STOREDLATENTENERGY(ton-h)
Fig. 9. Average of tank inlet and outlct tcmpcratures vs calculatcd storcd energy forCalmac charge tests with average capacity from 18 to 20 tons and brine flow rates of 40, 60,and 80 gal/min.._dl tcrnpcraturc mcasurcmcnts arc +_0.5°F.
27
ORNL.DWG 91-2807 ETD
3sI TEST CONDITIONS
/ CAPAO_ FLOW_(ton) (gal/mln)
..... 30 60
...... 20 6019 60
30 ..... 17 59..... 9 60
= k\J,.' .............. _-:_---- .... _ _ -,.t.a
•I 20 \I,,=,1I,'-'
15
10 . -- • -- '_
0 10 20 30 40 SO 60 70 80 90 100 110 120 130 t40 iSO 160 170 180STOREDLATENTENERGY(ton-h)
Fig. 10. Tank inlet temperature vs calculated stored energy for Calmac charge testswith brine flow rate of 60 gal/min with various average capacities and two different brineconcentrations. Ali temperature measurements are +0.5°F.
ORNL-DWG 91-2808 ETD
401 TEST CONDITIONS
CAPACITY FLOW RATE(ton) (gol/mln)
'\ ..... 30 60..... 26 60
'\ ...... 20 60
_ ..... 59
35 ..... 9 60
n¢
.....
\
20 ......0 10 20 30 40 50 60 70 80 90 100 110 120 130 140 150 160 170 180
STOREDLATENTENERGY(ton-h)
Fig. 11. Average of tank inlet and outlet temperatures vs calculated stored energy forCalmac charge tests with brine flow rate of 60 gal/min with various average capacities and twodifferent brine concentrations. Ali temperature measurements are +0.5°F.
28
ORNL-DWG 91-2809 ETD30
DATA SOURCE
. o o ISTF, 33_. BRINE, , , ISTF, 25_, BRINE
CALMAC MAXIMUMCALMAC MINIMUM
E"ILl
_ 25wel
_ o ,,
mw 20o
l.Y><
D
15 , . ......... , r
o 5 ,o ,5 2o 2'5 io i5 ,oCAPACITY (fon)
Fig. 12. Comparisonof measuredaveragebrineinlet temperaturesto reportedvalues.Ali measuredtemperaturesarc +0.5°F.
30 ORNL-DWG 91-2810 ETD
DATA SOURCE
* * * ISTF, 337, BRINE• , , ISTF, 25_', BRINE
CALMAC MAXIMUM-,--,--- CALMAC MINIMUM
taJrv.
_ 2s
:el
w _ nk-
z_
m _o o°20
zi
15, • ......... , ,- ........ , ......... ,
0 5 10 15 20 25 30 35 40
CAPACITY (ton)
Fig. 13. Comparison of measured minimum brine inlet temperatures to reportedvalues. Ali temperature measurements are +0.5°F.
29
Traditional packaged chiller data provide adequate guidance when selecting equipment
for constant temperature systems, such as air conditioners, but are less useful for ice storage
systems. Figure 14 shows data that are typically available for a packaged chiller/condensing
unit. The catalog data usually give the capacity as a function of condensing temperature and
brine outlet temperature for a given range of brine temperature changes. Correction factors
for brine concentration are also given or can be obtained from the manufacturer. In Fig. 14,
the catalog data for water chilling have been ext..iapolated to temperatures commonly
encountered when making ice (such extrapolations must be checked with the chiller
manufacturer). The test data were examined to find a method of predicting overall system
performance, given variable load temperatures and this type of chiller data based on a
constant load temperature.
Calmac provides the average and minimum brine inlet temperatures, as was shown in
Figs° 12 and 13. To provide a greater level of detail, the ISTF data were correlated with tank
state-of-charge (relative to the rated full latent charge). The latent tank charge was chosen
so that the results could be used for tanks of similar design but with different storage
capacities. Figure 15 shows the system capacity vs brine inlet temperature for the ice tank
at 10, 25, 50, 75, and 100% charge for a brine flow rate of 60 gal/min. The tank state of
charge is based on the cumulative capacity measured by the brine flow and temperature
change in the ice tank. The lines shown are linear regressions based on the data points. As
expected, the linear regressions show very strong adjusted squared correlation coefficients,
0.88 for 25%, 0.89 for 50%, 0.82 for 75%, and 0.97 for 100% frozen. This figure can
therefore be used to assess the range of operating conditions that the chiller must experience
during a charge cycle. A system designer, knowing the condensing temperature, brine
concentration, and brine flow rate, can choose the appropriate chiller data and overlay this
curve on Fig. 15. The result is shown in Fig. 16. The system performance will be found at
the intersections of the chiller data and the ice storage tank data. These values can be used
to more precisely estimate the time necessary to charge the tank, especially if the tank charge
begins from a partially frozen state.
Equation (17) was developed from the test data to express the capacity as a function
of the brine inlet temperature, the tank state of charge, and the brine flow rate. This
equation explained -69% of the data variation, based on the adjusted squared correlation
coefficient, and ali the parameter estimates were significant at >97%, based on tile Student's
T-test. This equation can be interpreted as indicating that the capacity increases -2.2 tons
30
ORNL-DWG 91-2811 ETD
'°]55'
50
_'O 75 F CONDENSING
__4oo F CONDENSINGG.
(J35,
/
3O
25
20
,5 20 =5 30 is _:o .s 50 s_B.,.ETE,,PE.ATU.ETOTANK(0
Fig. 14. Example of package_:!ehiller capacity data for two condensing temperatures.
ORNL-DWG 91-2812 ETD40
TANKCHARGE• • . 25_,• • • 50_.• . , 75_,• • • 100_.
• -- 25_., FIT30 o.. "-. _ .... 50?., FIT........,s,.._,T_o • --." -_ ......,0o,...nT
10 ,. ,,
0 ._ ,T
6 20 24 28SRfNEr_'MPERArUR_"rorANK(F)
Fig. 15. Capacity vs storage tank brine inlet temperature for tank charges from 25 to!_o0_%frozen fnr Calmac storage tank at brine flow rate of 60 gal/min. Ali temperaturemeasurements are +0.5°F.
31
ORNL-DWG 91-2813 ETD50
,,,,,
40 ,,.,,.,"_
,_o ._" _v
v _"
_o .,,\ i""
E 20 " ",, • w_."
T,NKCHARGEa. • 257,• • • 507,
",,,'_ ,, o = 757.• ,, 1007.
10 o ""•_'_• q[ -- 257., FIT.... 507., FIT........ 757,, FIT...... 1007,, FIT.... CHILLER
0
5 20 25 _o 35 40 4'5 50BRINETEMPERATURE TO TANK (F)
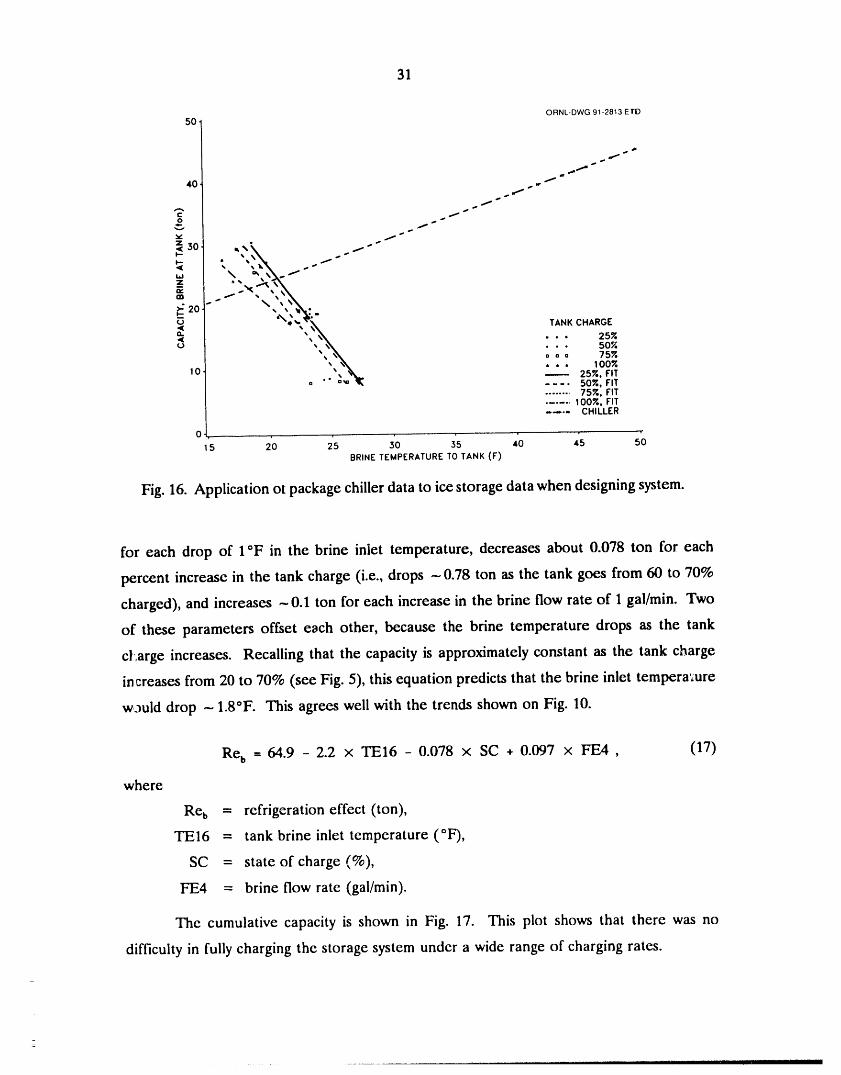
Fig. 16. Application ot package chiller data to ice storage data when designing system.
for each drop of I°F in the brine inlet temperature, decreases about 0.078 ton for each
percent increase in the tank charge (i.e., drops ---0.78 ton as the tank goes from 60 to 70%
charged), and increases -0.1 ton for each increase in the brine flow rate of I gal/min. Two
of these parameters offset each other, because the brine temperature drops as the tank
cl,arge increases. Recalling that the capacity is approximately constant as the tank charge
in greases from 20 to 70% (see Fig. 5), this equation predicts that the brine inlet tempera_;ure
w._uld drop - 1.8°F. This agrees well with the trends shown on Fig. 10.
Re b = 64.9 - 2.2 x TEl6 - 0.078 x SC + 0.097 x FE4 , (17)
where
Re b = refrigeration effect (ton),
TEl6 = tank brine inlet temperature (°F),
SC = state of charge (%),
FE4 = brine flow rate (gai/min).
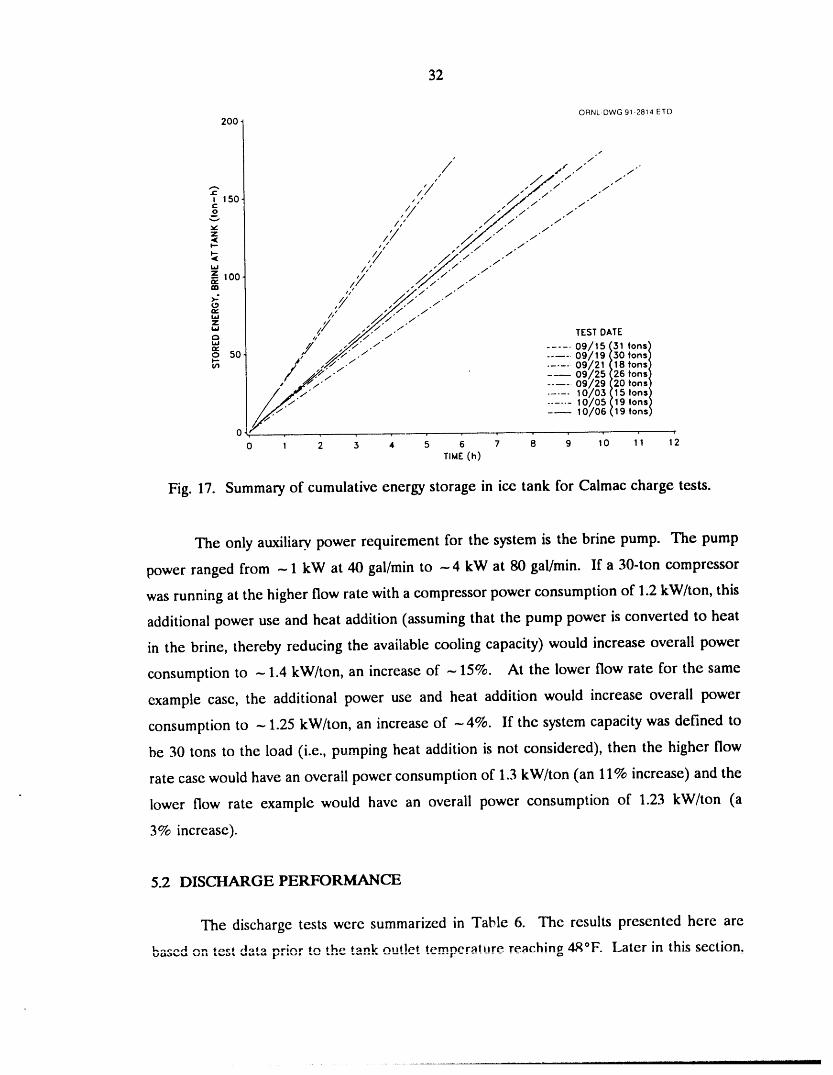
The cumulative capacity is shown in Fig. 17. This plot shows that there was no
difficulty in fully charging the storage system under a wide range of charging rates.
32
ORNL-DWG 91-2814 LTD200
/, /
,#f .7" /'"/
t ....Sf. f .7
_=15o _.V " " 7""¢:: t_ 7"
o ,V /Z./ .,._ // /"
z /y' /._.// .///i/+ ,el
Y ///_ 7 7W ,.// "
®_",oo _.7 ./.._'/ 7"7",: /' S"-"_ /
,.,- ¢ /./_7.7la.Iz t/" /
'-' ,// /Z/ .7",-, ,, //'/.7" TESTDATE
" / S;
.7 . ....
0 50 ..... 09/19 30 tons)_- t 09L21 1B tons)
/ j_7 "7 09/,25 26 tons)
'7 ..... 09/29 20 tons)
..... I0/'03 15 tons)
...... 10/05 19 tons)10/06 19tons)
0 , r
0 1 2 3 4 5 6 7 8 9 10 11 12TIME(h)
Fig. 17. Summary of cumulative energy storage in ice tank for Caimac charge tests.
The only auxiliary, power requirement for the system is the brine pump. The pump
power ranged from - 1 kW at 40 gal/min to -4 kW at 80 gal/min. If a 30-ton compressor
was running at the higher flow rate with a compressor power consumption of 1.2 kW/ton, this
additional power use and heat addition (assuming that the pump power is converted to heat
in the brine, thereby reducing the available cooling capacity) would increase overall power
consumption to -1.4 kW/ton, an increase of -15%. At the lower flow rate for the same
example case, the additional power use and heat addition would increase overall power
consumption to -- 1.25 kW/ton, an increase of -4%. If the system capacity was defined to
be 30 tons to the load (i.e., pumping heat addition is not considered), then the higher flow
rate case would have an overall power consumption of 1.3 kW/ton (an 11% increase) and the
lower flow rate example would have an overall power consumption of 1.23 kW/ton (a
3% increase).
5.2 DISCHARGE PERFORMANCE
The discharge tests were summarized in Table 6. The results presented here are1,_,-,t,nA nv,_ toet A._t_ T_,r;t_r t¢_ l'h# t_n_" httr|PI tomnerriltnre re.achinp 4R°F. Later in this section.
33
the effect of maximum acceptable outlet temperature on the total available capacity is
discussed.
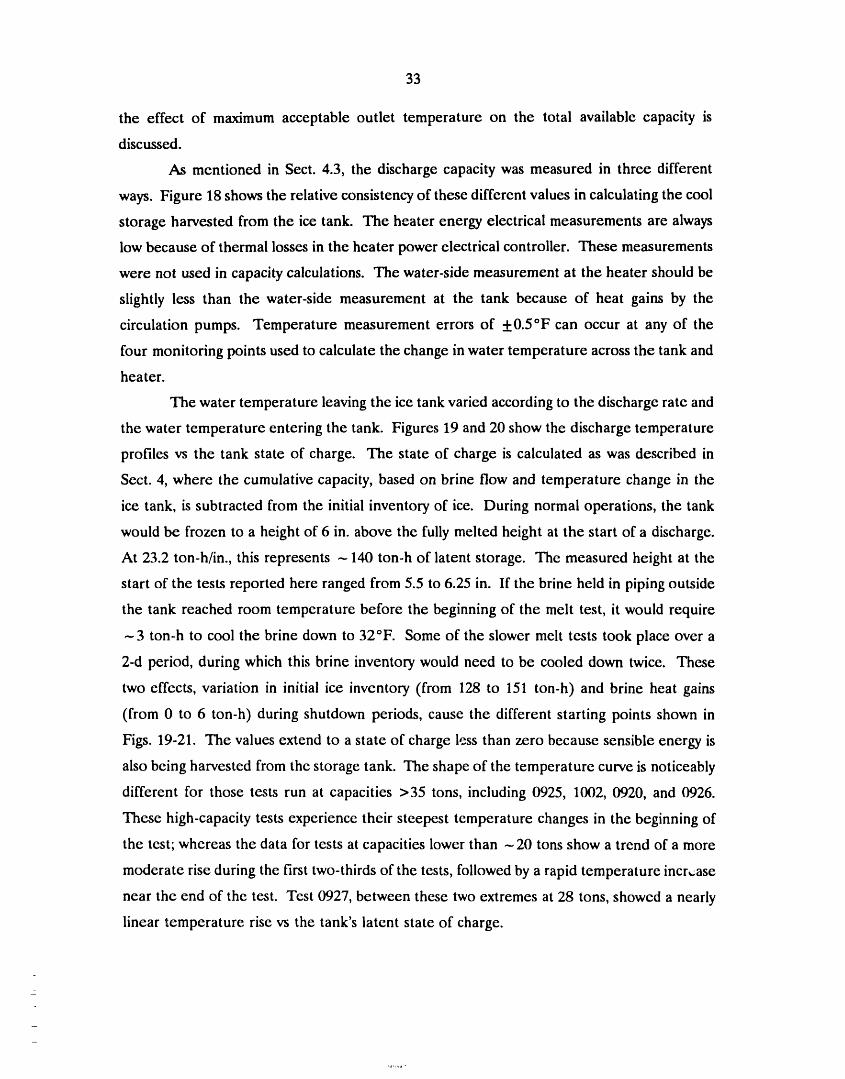
As mentioned in Sect. 4.3, the discharge capacity was measured in three different
ways. Figure 18 shows the relative consistency of these different values in calculating the cool
storage harvested from the ice tank. The heater energy electrical measurements are always
low because of thermal losses in the heater power electrical controller. These measurements
were not used in capacity calculations. The water-side measurement at the heater should be
slightly less than the water-side measurement at the tank because of heat gains by the
circulation pumps. Temperature measurement errors of +0.5°F can occur at any of the
four monitoring points used to calculate the change in water temperature across the tank and
heater.
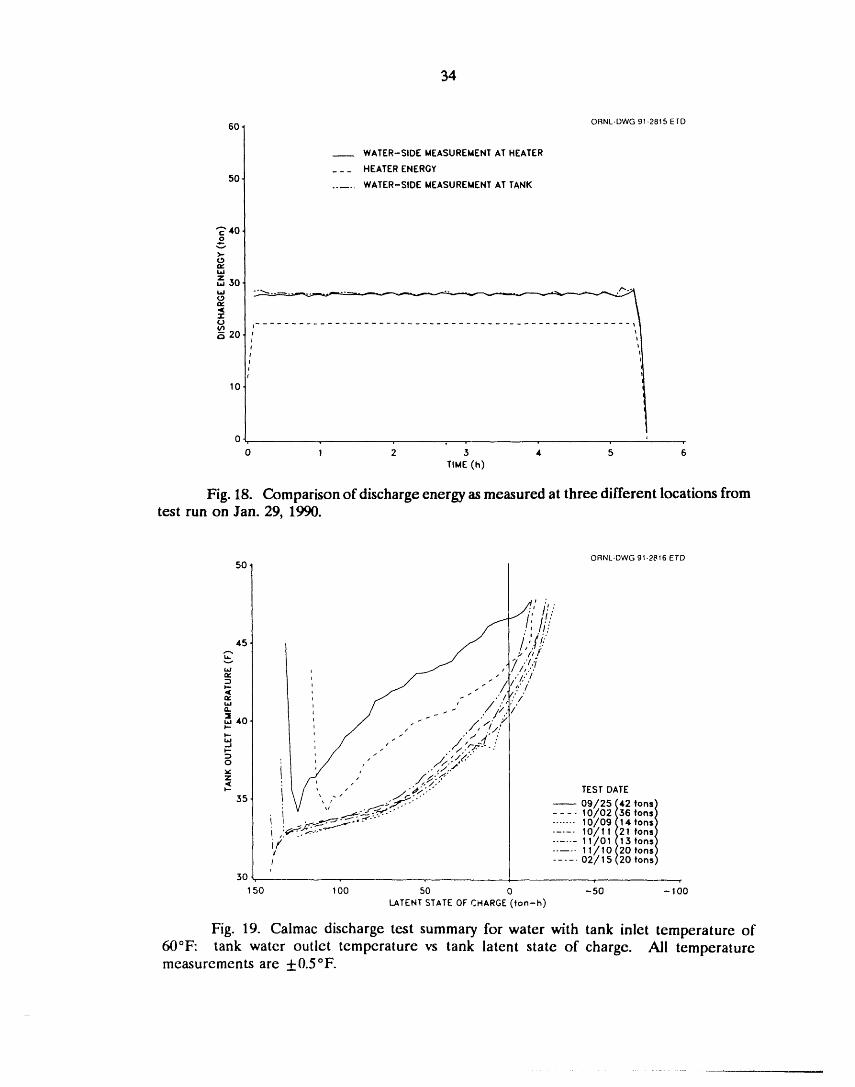
The water temperature leaving the ice tank varied according to the discharge rate and
the water temperature entering the tank. Figures 19 and 20 show the discharge temperature
profiles vs the tank state of charge. The state of charge is calculated as was described in
Sect. 4, where the cumulative capacity, based on brine flow and temperature change in the
ice tank, is subtracted from the initial inventory of ice. During normal operations, the tank
would be frozen to a height of 6 in. above the fully melted height at the start of a discharge.
At 23.2 ton-h/in., this represents ---140 ton-h of latent storage. The measured height at the
start of the tests reported here ranged from 5.5 to 6.25 in. If the brine held in piping outside
the tank reached room temperature before the beginning of the melt test, it would require
--3 ton-h to cool the brine down to 32°F. Some of the slower melt tests took place over a
2-d period, during which this brine inventory would need to be cooled down twice. These
two effects, variation in initial ice inventory (from 128 to 151 ton-h) and brine heat gains
(from 0 to 6 ton-h) during shutdown periods, cause the different starting points shown in
Figs. 19-21. The values extend to a state of charge less than zero because sensible energy is
also being harvested from the storage tank. The shape of the temperature curve is noticeably
different for those tests run at capacities >35 tons, including 0925, 1002, 0920, and 0926.
These high-capacity tests experience their steepest temperature changes in the beginning of
the test; whereas the data for tests at capacities lower than --20 tons show a trend of a more
moderate rise during the first two-thirds of the tests, followed by a rapid temperature incr,_ase
near the end of the test. Test 0927, between these two extremes at 28 tons, showed a nearly
linear temperature rise vs the tank's latent state of charge.
34
60 ORNL-DWG 91-2815 ErD
WATER-SIDE MEASUREMENTAT HEATER
___ HEATERENERGY5O
..... WATER-SIDE MEASUREMENTAT TANK
0
0 1 2 3 4 5 6
TIME (h)
Fig. 18. Comparison of discharge energy as measured at three different locations fromtest run on Jan. 29, 1990.
ORNL-OWG 91-2816 ETD
50 , :
,i _ .'
'; /I:'Ii"
• .// I.k,/,;/
'_ / _ _ _ _/_ " , ' f." ,
o :, / , /4>'
, -- , j_ ;a>.:." TEST DArE09/{25 42 tons)
.... 10X02 36 tons)
ii 10_09 14 tons):_'_.J',_-'-,'"- -.... I 0/. I I 21 tons)if ...... 11Lol IStons)
..... 11/. 10 20 tons)I ..... 02/15 20 tons)i
30
50 100 50 0 -50 - 100
LATENT STATE OF CHARGE (ton-h)
Fig. 19. Calmac discharge test summary for water with tank inlet temperature of60°F: tank water outlet temperature vs tank latent state of charge. Pdl temperaturemeasurements are _0.5°F.

35
50 ' ORNL-DWG 91-281 ? ETr)
X /
4s _ ii.°/'
_/ _ / i
/_40- . . " "" . i'I-.. . - "
_jII - - "
40 ..I -j/ .z f
,-, / : ..,...-" ....--Z
0 / ...,...-
35 ' "" '-".o.,..°
s, f,:.' l--f TEST DATE
-/,
09/20/41 tons)
.:/ 09/26 37 tons)" 09/27 28 tons)
,.'./ 02/13 20 tons)30
50 100 50 0 -50LATENTSTATEOF CHARGE(ton-h)
Fig. 20. Caimac dischargetest summary Eor water with tank inlet temperatureof 50°F: tank water outlet temperature vs tank latent state of charge. Ali temperaturemeasurements are +0.5°F.
200 ORNL-DWG 91-;)818 ETD
I 150 1, i ," ...-" /.-"" /' / ,/ "" i"o
>" /z_ / /" .._.'" i"
" / /;.:.....--::..--"wZ
"" I00-Jt-
,/ /;;" J ,..-,'1 .../....>'"..-_- ,,/ /:::.',,_.."
,7 /.7.:.:,- O,T"_ 50 '/_ . .::/ /_ ;: 4- _ 09/.25 (42 tons)o ' / ..-:',/...S':,_" - --- 10102 (36 tons)
,' / ..-.:-.;;:"," .......10109(14tons)/..'" ./::: / ..... 10111 (21 Ions).K.,/,:"/....... 111ol(is Ions)i .::// . / ..... l l/lO (20 tons)
./ i ..... 02/15 (20 tons)
0 :/" / " " " 40F
0 1 2 21 4 5 6 7 9 10 11 12TIME (h)
Fig. 21. Calmac discharge test summary for tests with tank inlet temperature of 60OF.Tests end when tank outlet temperature reaches 48°F.
36
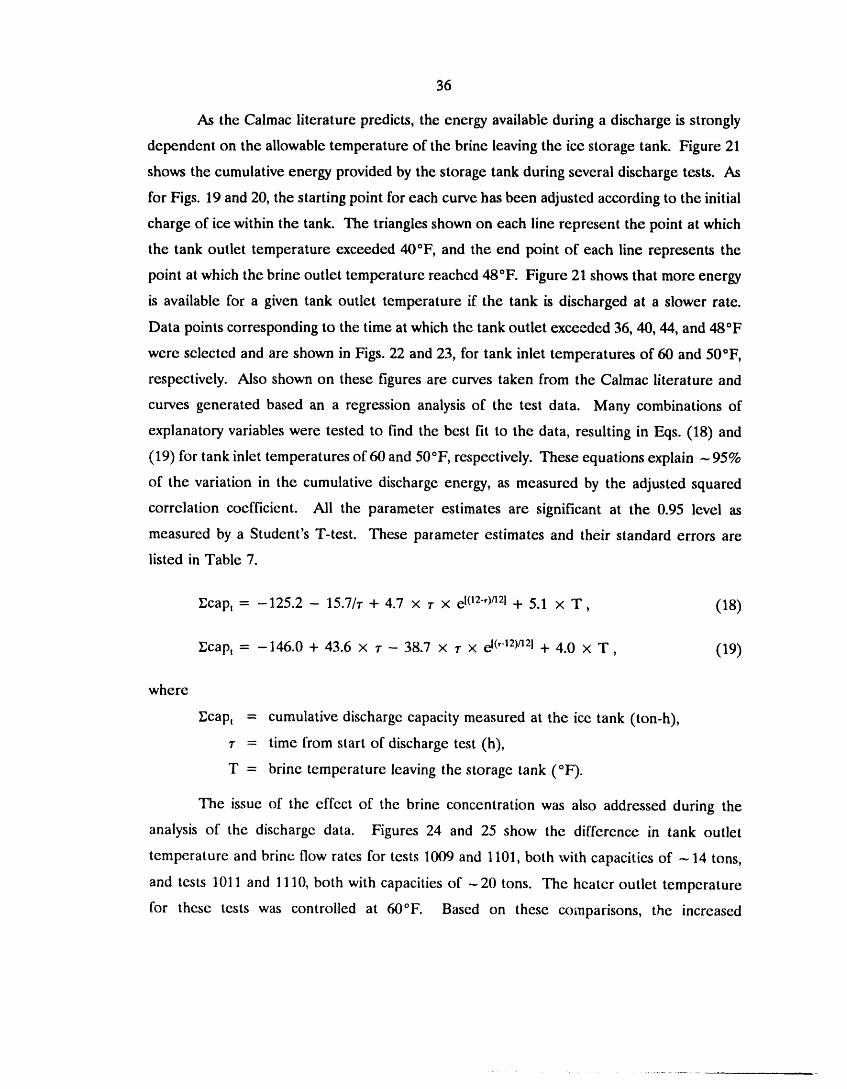
As the Calmac literature predicts, the energy available during a discharge is strongly
dependent on the allowable temperature of the brine leaving the ice storage tank. Figure 21
shows the cumulative energy provided by the storage tank during several discharge tests. As
for Figs. 19 and 20, the starting point for each curve has been adjusted according to the initial
charge of ice within the tank. The triangles shown on each line represent the point at which
the tank outlet temperature exceeded 40°F, and the end point of each line represents the
point at which the brine outlet temperature reached 48°F. Figure 21 shows that more energy
is available for a given tank outlet temperature if the tank is discharged at a slower rate.
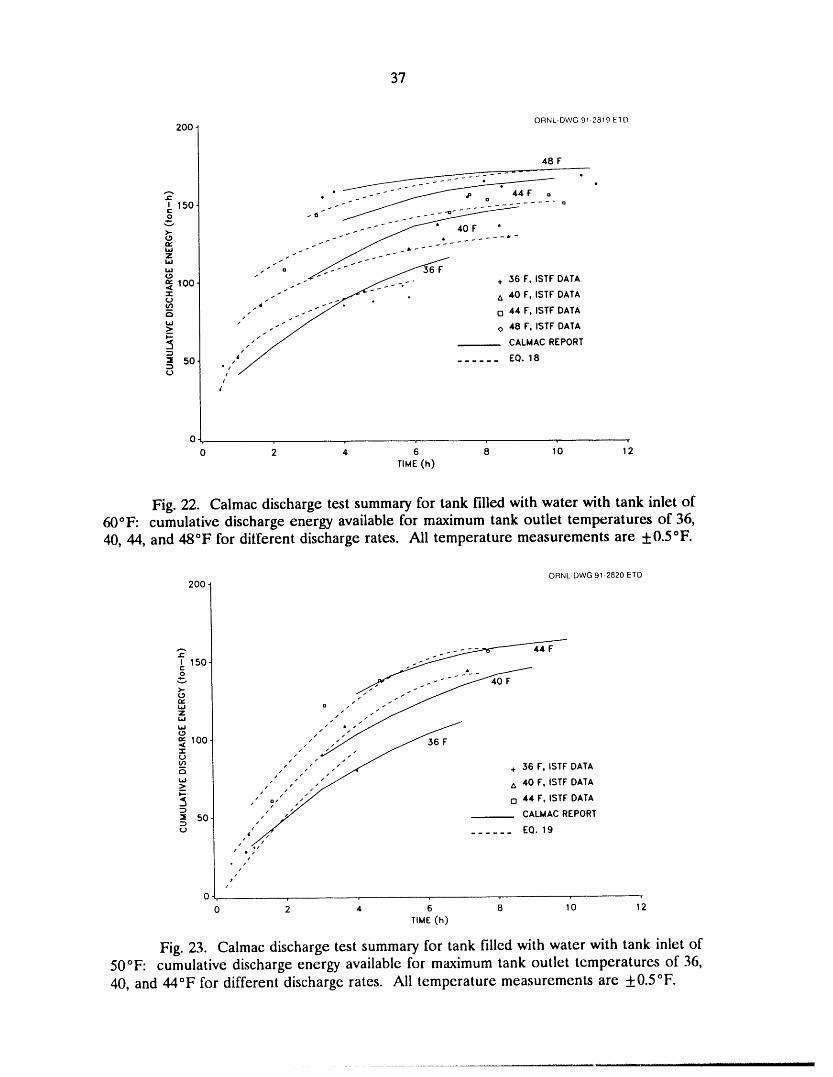
Data points corresponding to the time at which the tank outlet exceeded 36, 40, 44, and 48°F
were selected and are shown in Figs. 22 and 23, for tank inlet temperatures of 60 and 50°F,
respectively. Also shown on these figures are curves taken from the Caimac literature and
curves generated based an a regression analysis of the test data. Many combinations of
explanatory variables were tested to find the best fit to the data, resulting in Eqs. (18) and
(19) for tank inlet temperatures of 60 and 50°F, respectively. These equations explain --95%
of the variation in the cumulative discharge energy, as measured by the adjusted squared
correlation coefficient. Ali the parameter estimates are significant at the 0.95 level as
measured by a Student's T-test. These parameter estimates and their standard errors are
listed in Table 7.
I;capt = -125.2 - 15.7/r + 4.7 x r × e!(12"')/121+ 5.1 × T, (18)
_;capt = -146.0 + 43.6 x r - 38.7 x r x ei('12)n21+ 4.0 × T, (19)
where
_2capt = cumulative discharge capacity measured at the ice tank (ton-h),
r = time from start of discharge test (h),
T = brine temperature leaving the storage tank (°F).
The issue of the effect of the brine concentration was also addressed during the
analysis of the discharge data. Figures 24 and 25 show the difference in tank outlet
temperature and brine flow rates for tests 1009 and 1101, both with capacities of --14 tons,
and tests 1011 and 1110, both with capacities of -20 tons. The heater outlet temperature
for these tests was controlled at 60°F. Based on these comparisons, the increased
37
ORNL-DWG 91.2819 EID200
48 F
I 150 °g -
wZ
+ 36 F, ISTF DATAo_ 100
_ ts _(..) _ 40 F, ISTF DATA
_,tn ," __ " n 44 F, ISTF DATA
>_ o 48 F, ISTF DATA
CALMAC REPORT
• 50 ,_ ...... EO. 18
(..) °l/i
0
0 2 4 6 8 10 12
TIME (h)
Fig. 22. Calmac discharge test summary for tank filled with water with tank inlet of60°F: cumulative discharge energy available for maximum tank outlet temperatures of 36,40, 44, and 48°F for different discharge rates. Ali temperature measurements are +0.5°F.
ORNL-DWG 91.2820 ETD20O
_: 150
_ oZi.i
loo ,," ,_
,.,a_u= ,"" '" i_"- ,, " / + 36 F ISTF DATA> tx 40 F, ISTF DATA
•_ n 44 F, ISTF DATA
° ,/• 50 CALMAC REPORT
fJ 4_, . ..... EQ. 19,':
i• /
i/
/
0
0 2 4 6 8 10 12
TIME (h)
Fig. 23. Caimac discharge test summary for tank filled with water with tank inlet of50°F: cumulative discharge energy available for maximum tank outlet temperatures of 36,40, and 44°F for different discharge rates. Ali temperature measurements are +0.5°F.
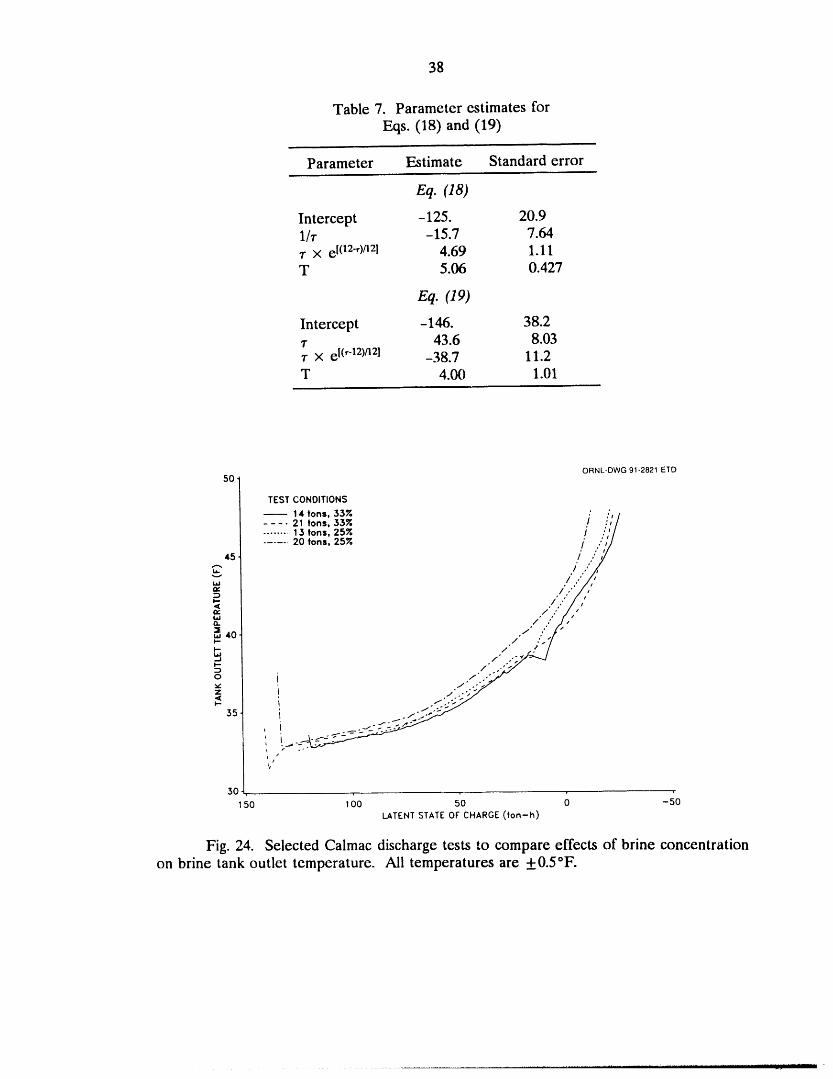
38
Table 7. Parameter estimates for
Eqs. (18) and (19)
Parameter Estimate Standard error
Eq. (18)
Intercept -125. 20.91/r -15.7 7.647 X e [(12")/121 4.69 1.11T 5.06 0.427
eq. (19)
Intercept -146. 38.2r 43.6 8.03r x e I('12)_21 -38.7 11.2T 4.00 1.01
ORNL-DWG 91-2821 ETD50"
TEST CONDITIONS
-- 14 tons, 33_ ,' ,,'_t
.... 21 tons, 53% I :,/
........ I 5 Ions, 25_. i .:.'l
...... 20 tons, 25_', i "ii/45 / ,"t
/ " t
w .i'll'i/lt ..
0.. /" ,'" /
te 40 /.-.I-- ,/_, i .,;t_
O /" ..'"vZ j" .J.'_ "
35 ./ ,-, _.-.-_" _- -_"
/t
30
50 100 50 0 -50
LATENT STATE OF CHARGE (ton-h)
Fig. 24. Selected Calmac discharge tests to compare effects of brine concentrationon brine tank outlet temperature. Ali temperatures are _+0.5°F.
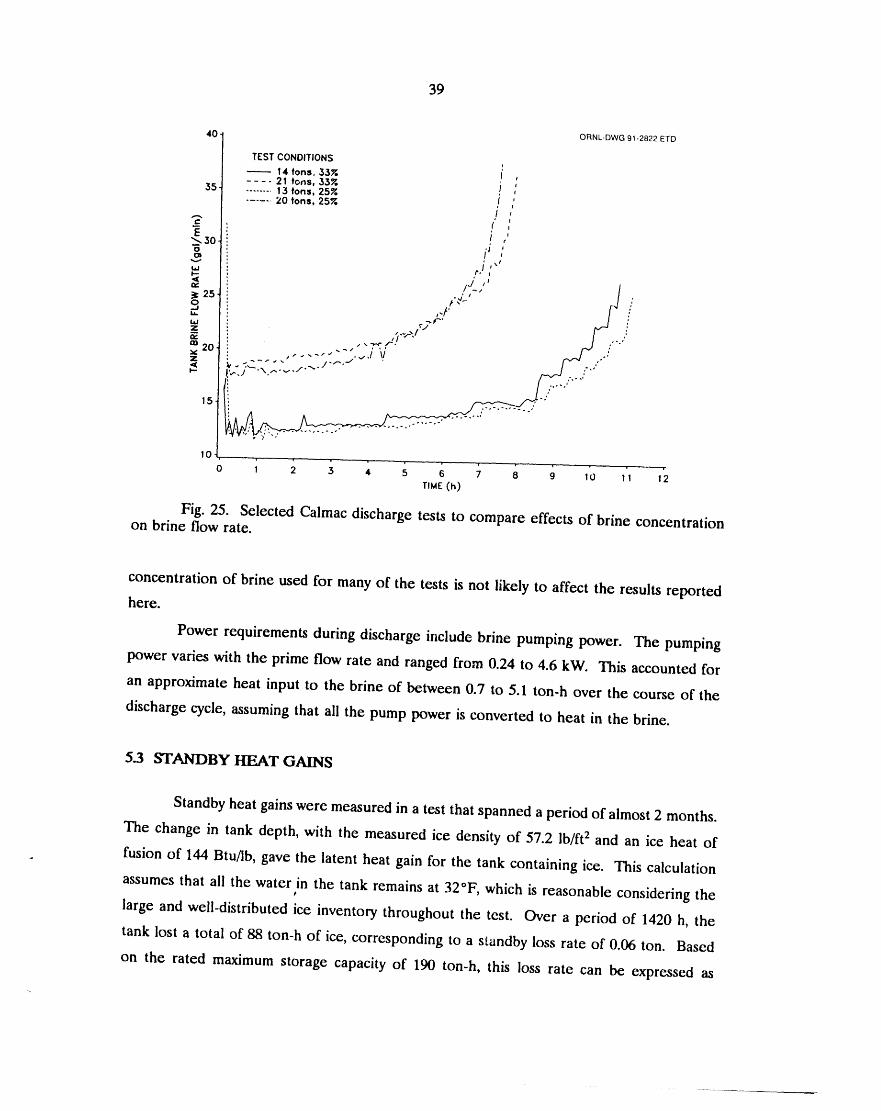
39
concentration of brine used for many of the tests is not likely to affect the results reportedhere.
Power requirements during discharge include brine pumping power. The pumping
power varies with the prime flow rate and ranged from 0.24 to 4.6 kW. This accounted for
an approximate heat input to the brine of between 0.7 to 5.1 ton-h over the course of the
discharge cycle, assuming that ali the pump power is converted to heat in the brine.
5.3 STANDBY HEAT GAINS
Standby heat gains were measured in a test that spanned a period of almost 2 months.
The change in tank depth, with the measured ice density of 57.2 lb/ft 2 and an ice heat of
. fusion of 144 Btu/lb, gave the latent heat gain for the tank containing ice. This calculation
assumes that ali the water,in the tank remains at 32°F, which is reasonable considering the
large and well-distributed ice inventory throughout the test. Over a period of 1420 h, the
tank lost a total of 88 ton-h of ice, corresponding to a s_,andby loss rate of 0.06 ton. Based
on the rated maximum storage capacity of 190 ton-h, this loss rate can be expressed as
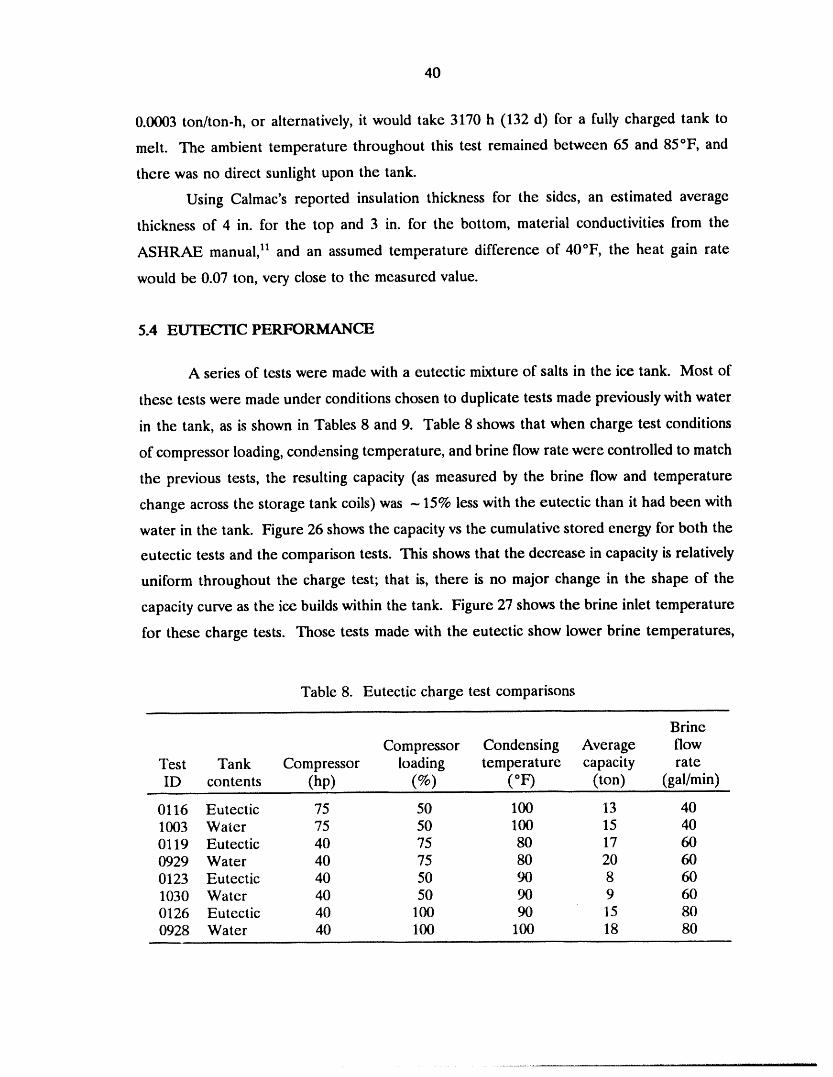
40
0.0003 ton/ton-h, or alternatively, it would take 3170 h (132 d) for a fully charged tank to
melt. The ambient temperature throughout this test remained between 65 and 85°F, and
there was no direct sunlight upon the tank.
Using Calmac's reported insulation thickness for the sides, an estimated average
thickness of 4 in. for the top and 3 in. for the bottom, material conductivities from the
ASHRAE manual, 11and an assumed temperature difference of 40°F, the heat gain rate
would be 0.07 ton, very close to the measured value.
5.4 EUTECTIC PERFORMANCE
A series of tests were made with a eutectic mixture of salts in the ice tank. Most of
these tests were made under conditions chosen to duplicate tests made previously with water
in the tank, as is shown in Tables 8 and 9. Table 8 shows that when charge test conditions
of compressor loading, condensing temperature, and brine flow rate were controlled to match
the previous tests, the resulting capacity (as measured by the brine flow and temperature
change across the storage tank coils) was - 15% less with the eutectic than it had been with
water in the tank. Figure 26 shows the capacity vs the cumulative stored energy for both the
eutectic tests and the comparison tests. This shows that the decrease in capacity is relatively
uniform throughout the charge test; that is, there is no major change in the shape of the
capacity curve as the ice builds within the tank. Figure 27 shows the brine inlet temperature
for these charge tests. Those tests made with the eutectic show lower brine temperatures,
Table 8. Eutectic charge test comparisons
Brine
Compressor Condensing Average flowTest Tank Compressor loading temperature capacity rateID contents (hp) (%) (°F) (ton) (gal/min)
0116 Eutectic 75 50 100 13 401003 Water 75 50 100 15 400119 Eutectic 40 75 80 17 600929 Water 40 75 80 20 600123 Eutectic 40 50 90 8 601030 Water 40 50 90 9 600126 Eutectic 40 100 90 15 800928 Water 40 100 100 18 80
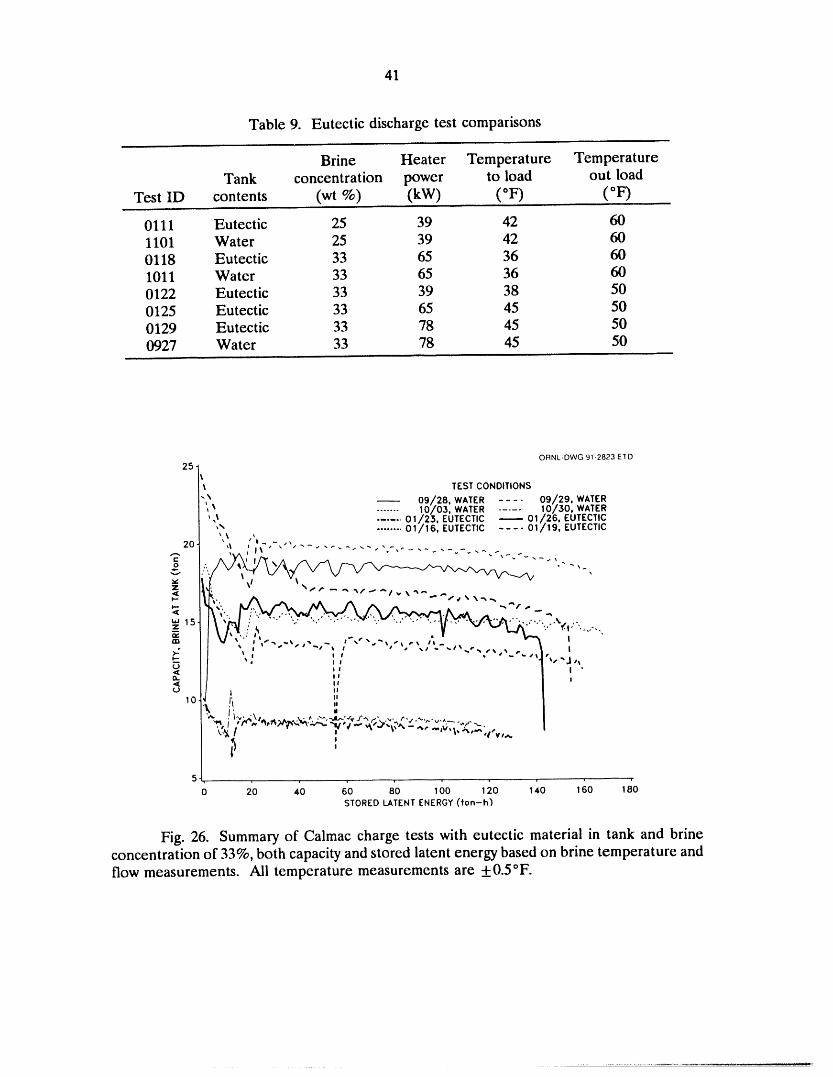
41
Table 9. Eutectic discharge test comparisons
Brine Heater Temperature TemperatureTank concentration power to load out load
Test lD contents (wt %) (kW) (°F) (°F)
0111 Eutectic 25 39 42 601101 Water 25 39 42 600118 Eutectic 33 65 36 601011 Water 33 65 36 600122 Eutectic 33 39 38 500125 Eutectic 33 65 45 500129 Eutectic 33 78 45 500927 Water 33 78 45 50
ORNL-DWG 91-2823 ETD
TEST CONDITIONS
x 09/28, WATER .... 09/29, WATER
........ 1.0/03, WATER 10/30, WATER_t, .... .. 01/23, EUTECTIC 01/26, EUTECTICt
20 _ ,1_ ' , --_._ .... .... _'-_-_-- .
15 : . '...... I: "k'-"'"'... "_v',.".- ,_ . ,.-,,'_._• ,.,.....-,.,
" ! t'_-_ _-_ i '_ _ 1_%¢_ _ s t r'_ Ii v -_ I
I I t I I # ,, e-.'_.stlt _
( IJ ',: / ,II I '
10 ¢_ i ; ', t'v' '\1 , • ,*, ,'--,,-_l_'.r_.f.._- ,'v, /'.e.._,,,.-v,^_. ,
,_, I., 1,",. ,_,,_,,t_',_,,_.. ",v',, ---_-b,._,;',, - ._....,v,. -.__..I "%! : ' " ""'".
O 20 40 60 80 1 O0 120 140 160 180
STORED LATENT ENERGY ('ton-h)
Fig. 26. Summaryof Calmaccharge testswith eutectic material in tank and brineconcentrationof 33%, both capacityandstoredlatentenergybasedon brine temperatureandflow measurements.Ali temperaturemeasurementsare +0.5°F.
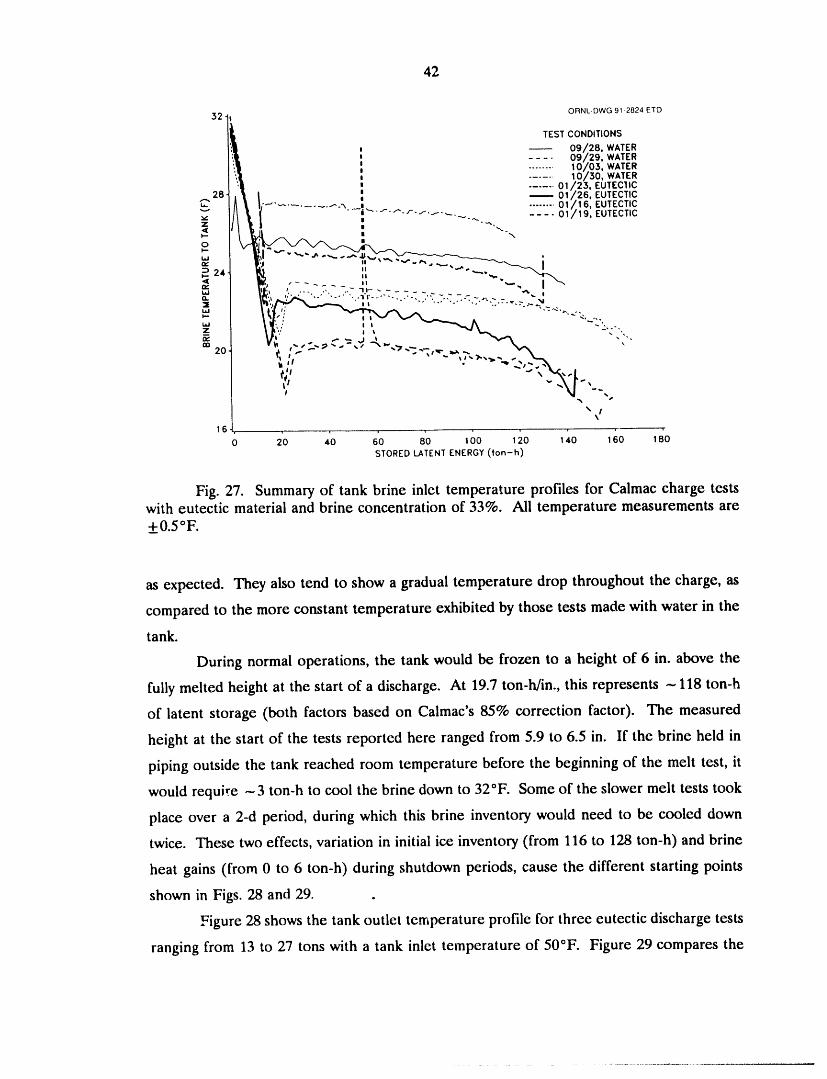
42
32' ORNL.DWG 91-2824 ETD
TEST CONDITIONS
e 09/28, WATERe .... 09/.29, WATER= 10/.03, WATERie 10/30, WATERt 01/.23, EUTECIlC
28 e 01/.26, EUTECTIC.-. e 01/.16, EUTECTIC
"'-'" _ ......... "_---_ _" ..... /-. I, ._.._. _. _ 01 / 19, EUTECTIC-.._,.
Q_ b,j
n,- |t[._ _ ..... .,- 1.1-- - - _ .... _, t
:X .... -" , • , ,..,r _,,._
E
%
16
0 20 40 60 80 too 120 140 160 180STORED LATENT ENERGY (ton-h)
Fig. 27. Summary of tank brine inlet temperature profiles for Calmac charge testswith eutectic material and brine concentration of 33%. Ali temperature measurements are+0.5°F.
as expected. They also tend to show a gradual temperature drop throughout the charge, as
compared to the more constant temperature exhibited by those tests made with water in the
tank.
During normal operations, the tank would be frozen to a height of 6 in. above the
fully melted height at the start of a discharge. At 19.7 ton-h/in., this represents ---118 ton-h
of latent storage (both factors based on Calmac's 85% correction factor). The measured
height at the start of the tests reported here ranged from 5.9 to 6.5 in. If the brine held in
piping outside the tank reached room temperature before the beginning of the melt test, it
would require -3 ton-h to cool the brine down to 32°F. Some of the slower melt tests took
piace over a 2-d period, during which this brine inventory would need to be cooled down
twice. These two effects, variation in initial ice inventory (from 116 to 128 ton-h) and brine
heat gains (from 0 to 6 ton-h) during shutdown periods, cause the different starting points
shown in Figs. 28 and 29.
Figure 28 shows the tank outlet temperature profile for three eutectic discharge tests
ranging from 13 to 27 tons with a tank inlet temperature of 50°F. Figure 29 compares the
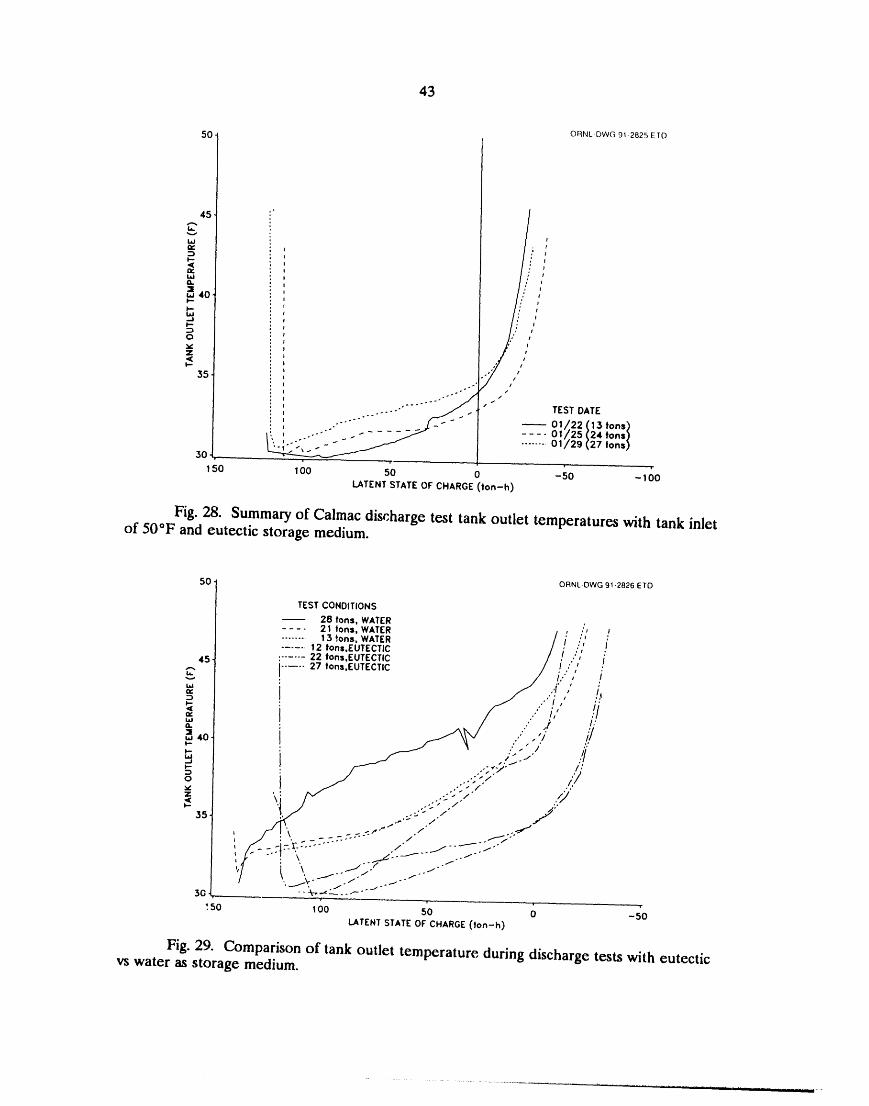
43
50 ORNL-DWG 91-2825 EfD
45, '"
v
L_r,,,
Ii,,L_O,.
¢U 40I"-
I"-
ov.7
lm
35
o.-' i
TEST DATE
01/.2213tons)01/25 24 tons)
........ 01/29 27 Ions)30.
r
150 100 50 0 -50 - 10OLATENT STATE OF CHARGE (ton-h)
Fig. 28. Summary of Calmac discharge test tank outlet temperatures with tank inletof 50°F and eutectic storage medium.
50' ORNL-DWG91.2826 ETD
TEST CONDITIONS
28 tons, WATER.... 21 tons, WATER , ,", a
........ 13 tons. WATER / i ':' "
...... 12 tons,EUTECTIC / i :'" !:...... 22 tons,EUTECTIC /; .,.',, /
45 I..... 27 tons,EUTECTIC // ,,, .:. / !..', ,
I II
n J ,"* •,.=,40 i/
: /'-- ...,_.v" /:
o I ./" ...:U>"
X . -_.;_'"""'_ -C; ./" _..._" :", f'_ ...... ./ __--_:_..",/ " ; _.... ._._--_ .--"1 I \. _.-."J_'" .... ""
\ '_. t'" t. .I"'"
3G -- -_r--.._:-- - - -."-""
SO 1oo 50 o -;oLATENT STATE OF CHARGE (ton-h)
Fig. 29. Comparison of tank outlet temperature during discharge tests with eutectic•rs water as storage medium.
'" .............. IIM,ILJ- -
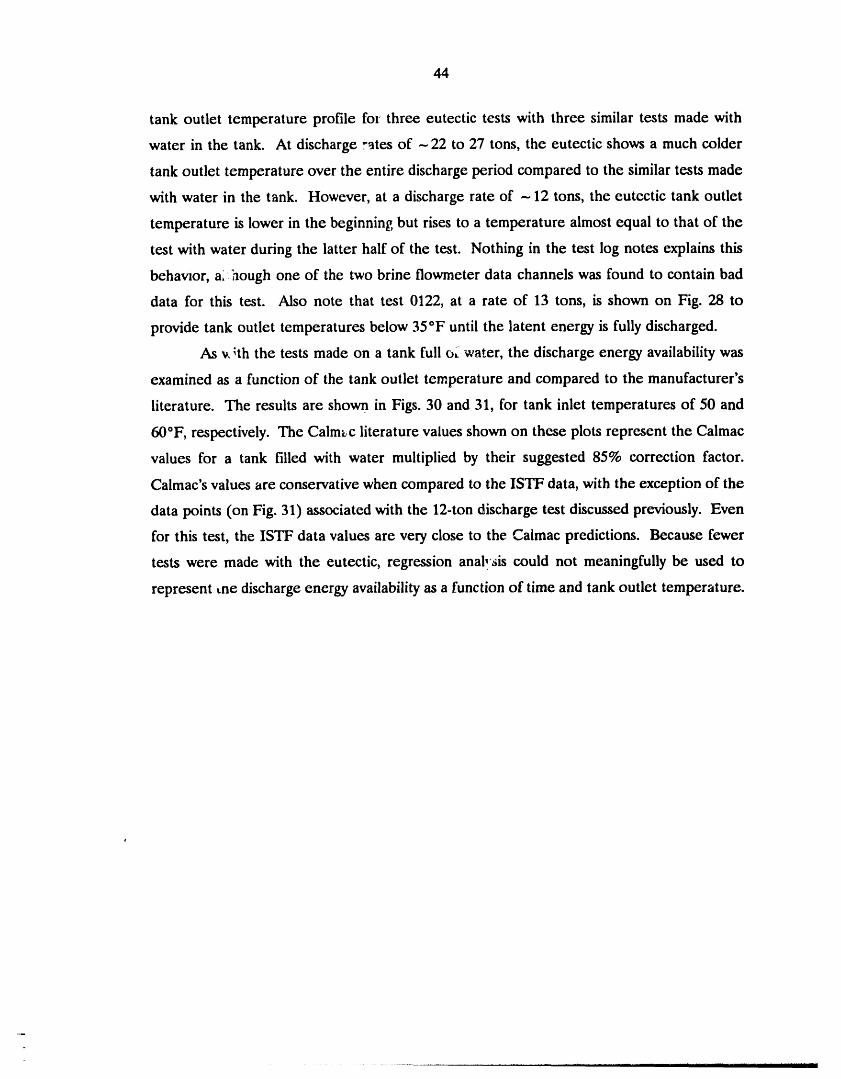
44
tank outlet temperature profile for three eutectic tests with three similar tests made with
water in the tank. At discharge rates of -22 to 27 tons, the eutectic shows a much colder
tank outlet temperature over the entire discharge period compared to the similar tests made
with water in the tank. However, at a discharge rate of -12 tons, the eutectic tank outlet
temperature is lower in the beginning but rises to a temperature almost equal to that of the
test with water during the latter half of the test. Nothing in the test log notes explains this
behavaor, although one of the two brine flowmeter data channels was found to contain bad
data for this test. Also note that test 0122, at a rate of 13 tons, is shown on Fig. 28 to
provide tank outlet temperatures below 35°F until the latent energy is fully discharged.
As _ _th the tests made on a tank full ol water, the discharge energy availability was
examined as a function of the tank outlet temperature and compared to the manufacturer's
literature. The results are shown in Figs. 30 and 31, for tank inlet temperatures of 50 and
60*F, respectively. The Calm_,c literature values shown on these plots represent the Calmac
values for a tank filled with water multiplied by their suggested 85% correction factor.
Calmac's values are conservative when compared to the ISTF data, with the exception of the
data points (on Fig. 31) associated with the 12-ton discharge test discussed previously. Even
for this test, the ISTF data values are very close to the Calmac predictions. Because fewer
tests were made with the eutectic, regression anal,sis could not meaningfully be used to
represent the discharge energy availability as a function of time and tank outlet temperature.
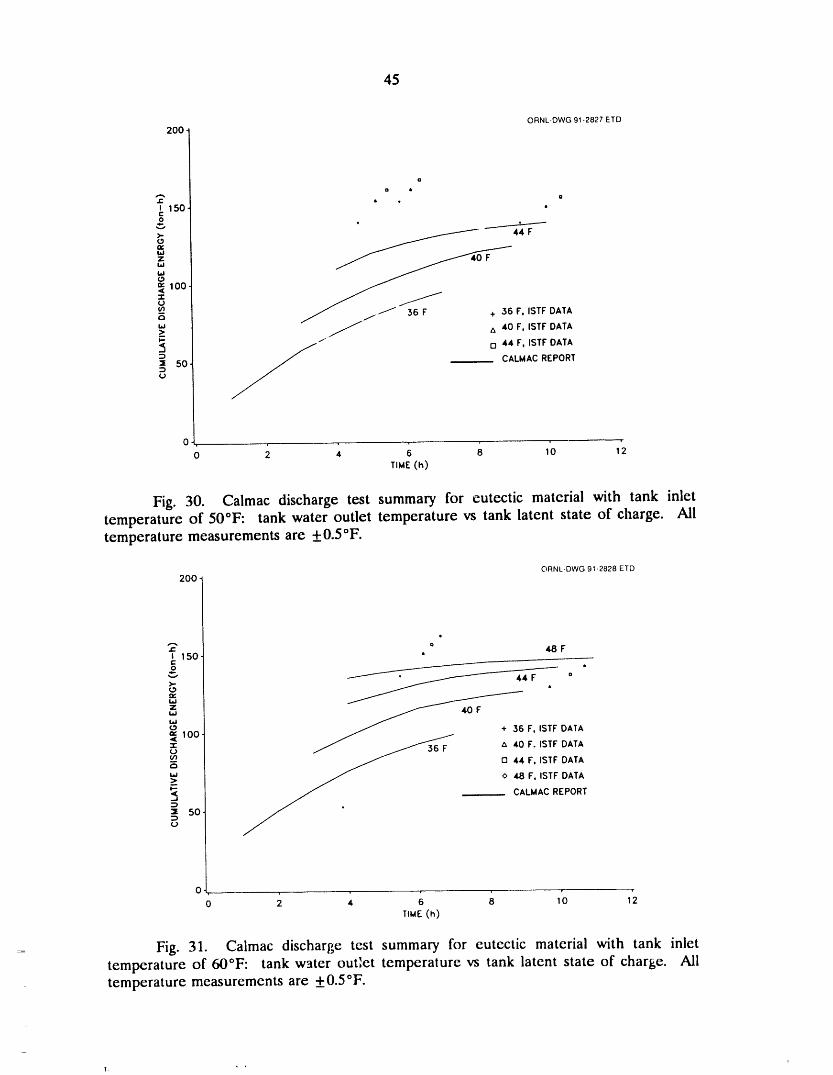
45
ORNL-DWG 91-2827 ETD20O
oo •
o
t 150c
>-
+wz
w
_ loo,-I-
,._ // 36 F + 36F, ISTF
40 F, ISTF DATA
_ 0 44 F, ISTF DATA
CALMAC REPORT"_ 5O
0 , _
0 2 4 6 8 10 12
Tree(h)
Fig. 30. Calmac discharge test summary for eutectic material with tank inlettemperature of 50°F: tank water outlet temperature vs tank latent state of charge. Alitemperature measurements are +0.5°F.
ORNL-DWG 91-2828 ETD200
_" * 48 FI 1508 •
_" _ _---_'- 44 F ,
'- J •el¢
z 40F
wla,,io + ,.36 F, ISTF DATA;oo.:z: z_ 40 F. ISTF DATA(.3
_ _. n 44 F, ISTF DATA
o 48 F, ISTF DATA
CALMAC REPORT
• 50
0
0 2 4 6 8 10 12TiME(h)
= Fig. 31. Calmac discharge test summary for eutectic material with tank inlettemperature of 60°F: tank water out_et temperature vs tank latent state of char_,e. Alitemperature measurements are +0.5°F.
46
6. CONCLUSIONS AND RECOMMENDATIONS
The Calmac ice storage system tested was conzistently able to manufacture and store
a full charge of ice. This was true for a wide range of charging rates, brine flow rates, and
for two differe._t brine concentrations. The discharge capacity is heavily dependent upon the
discharge conditions, including discharge rate and brine temperature requirements.
The amount of capacity variation during a charge cycle, best shown by the normalized
capacity plots, can have significant effects on the equipment performance and should be a
primary factor in equipment selection. For this system, the amount of capacity variation was
relatively insensitive to charging rate. Therefore, variations in operating schedules should not
affect the charging performance for a given chiller system.
The discharge performance, however, was strongly dependent upon the tank discharge
rate and tank outlet temperature. These parameters must therefore be clearly specified
before the storage tank selection is made. Changes in the discharge schedule or required
temperature after installation can alter the available discharge energy.
47
REFERENCES
1. Calmac Manufacturing Corporation, LEVLOAD Ice Bank Performance Manual,Form IB-102 (3-89), Calmac Manufacturing Corporation, Englewood, N.J., 1989.
2. T. lc Stovall and J. J. Tomlinson, Commercial Cool Storage Laboratory Test Procedure,ORNL/TM-11511, Martin Marietta Energy Systems, Inc., Oak Ridge Natl. Lab.,May 1990.
3. T. lC Stovall, 1ce-Storage Efficiency Considerations, ORNLfFM-11678, Martin MariettaEnergy Systems, Inc., Oak Ridge Natl. Lab., to be published.
4. G. T. Kartsounes and R. A. Erth, "Computer Calculaton of the ThermodynamicProperties of Refrigerants 12, 22, and 502," ASHRAE paper No. 2200, presented atASHRAE Annual Meeting, Washington D.C., August 22-25, 1971.
5. UCARTHERM Heat Transfer Fluid, Union Carbide Corporation, Industrial ChemicalsDivision, Danbury, Conn., 1986.
6. P. V. Hobbs, 1ce Physics, Clarendon Press, Oxford, 1974.
7. Calmac Manufacturing Corporation, Levload Ice Bank Technical Bulletin, "List PriceSchedule Accessories for Levload Ice Banks," Calmac Manufacturing Corporation,Englewood, N.J., June 1989.
8. SAS User's Guide: Statistics, Version 5 Edition, SAS Institute Inc., Cary, N.C., 1985.
9. F. M. White, l/'tscousFluid Flow, McGraw-Hill Book Co., New York, 1974, pp. 484-485.
10. Electric Power Research Institute, Commercial Cool Storage Design Guide, EM-3981,Palo Alto, Calif., May 1985.
11. 1985 ASHRAE Handbook, Fundamentals, American Society of Heating, Refrigeratingand Air Conditioning Engineers, Inc., Atlanta, Ga., 1985, Sect. 6.
49
Appendix A
IsrF INSTRLrMENTATION
A.1 DATA ACQUISITION AND CONTROL
A data acquisition system and computer are used to control the thermal loading rate,
the brine and refrigerant circulation pump speeds, recirculation valve positions, and the
condensation temperature and to collect the data from system instrumentation. The
computer allows short sampling times of the instrumentation to provide data for detailed
analysis and feedback during transient system operation. Direct controls, outside of the data
acquisition/computer system, are available for compressor loading, booster pump operation,
and auxiliary portions of the test facility.
A.2 TEMPERATURE MEASUREMENTS
Refrigerant temperature measurements are made by RTDs bonded to the outside of
the copper pipes. These RTDs were calibrated by the manufacturer to 0.3°F. After
installation, the recorded refrigerant temperatures were compared to the expected
thermodynamic states for the corresponding pressure measurements. Water and brine
temperature measurements are made by RTDs inserted into the PVC pipes. These RTDs
are calibrated by the manufacturer to +0.5°F and are checked against an ice bath after
installation. The RTDs were also checked against each other under conditions where an
unloaded heat exchanger, for example, would be expected to show the same inlet and outlet
temperature. The RTD calibrations are periodically rechecked, and instruments that have
drifted beyond 0.5°F are replaced.
A.3 FLOW ME.ASUREMENTS
Vortex-shedding flowmeters are used to measure the condenser cooling water flow,
the water/brine flow to the heater, the water/brine flow to the ice tank, and the gaseous
refrigerant flow to the condenser. The vortex-shedding refrigerant flowmeter imposes a
pressure drop of -0.5 psia. These flowmeters are accurate to +0.8% of the reading for
liquid flows and + 1.5% of the reading for gaseous flows. The flowmeters used to measure
50
water and brine volumetric flow were checked after installation by running water through the
lines into a 55-gal drum placed on a scale.
The Coriolis mass flowmeters used to measure liquid refrigerant mass flows to the
low-pressure receiver, the ice tank, and the thermal expansion valves were calibrated by the
manufacturer to +0.4% of full scale, which is 1000 lb/min. A sight glass is positioned to
provide a visual confirmation of single-phase flow downstream of the meter. These Coriolis
flowmeters are very difficult to calibrate after installation because of the closed nature of the
refrigerant system. However, the volumetric flow through one of the vortex-shedding
flowmeters can be compared to the mass flow through one of these Coriolis meters. Also,
energy balances on the condenser, low-pressure receiver, chiller/evaporator, and ice tank can
be used to assess the continued accuracy of these devices.
A.4 PRESSURE MEASUREMENTS
Refrigerant pressure measurements are made with pressure transducers to allow the
electronic recording of the values. The accuracy of these absolute pressure readings is rated
at +0.11% of full scale. However, the calibration certificates supplied with each transducer
show accuracies of +0.004% or better. Also, the transducer calibration was rechecked after
installation and periodically thereafter using laboratory calibration equipment. The pressure
transducers located in the high-pressure portion of the loop, that is, between the compressor
discharge and the expansion valve, are rated for 0 to 500 psia. Ali others are rated for 0 to
250 psia. During testing, the pressure measurements are periodically compared to other
measurements within the loop and to the expected refrigerant properties.
A differential pressure meter can be used to measure the change in tank water depth
during charging. The meter measures from 0 to 10 in. of water with an accuracy of +0.5%
of full range output (i.e., +0.05 in. of water).
A.5 ELECq'R/CAL MEASUREMENTS
Electrical measurements for the compressor power (rated at 40 and 75 hp), circulating
pump(s) power (from 2 to 5 hp), agitation air compressor power (1/2 hp), and heater power
(0 to 135 kW) are measured by watt/watt-hour transducers. The watt-hour measurements are
accurate to +[0.2% of the reading + 0.01% of the rated output)/(power factor)]. The
_
................................... I ......ull I I IIIII I1' .............
51
watt-hour meters for the compressors were checked by measuring the voltage and current on
each of three phases. The watt-hour meter for the heater was checked by comparison to the
heat absorbed by the water as measured by the flow and temperature change. The accuracy
of this heater's watt-hour meter is poor because of the semiconductor-controlled rectifier
(SCR), or phase-angle power controller, used to vary the heater power. Heater energy use
measurements are therefore based on the fluid flow rate and temperature change, although
the power consumption is recorded as an additional check.
A.6 COOL S'I_RED MEASUREMENT
The change in storage medium volume is used to measure the amount of expansion
due to ice formation for ice on coil systems. The amount of ice formation, along with the
sensible heat removed from the storage medium indicates the quantity of cool stored in the
tank. The differential pressure transducer described in a previous section was mounted at the
initial water level in a section of tubing that was immersed in the tank at one end and fixed
to a vertical support at the other.
53
ORNL/TM-11582
Dist. Category UC-202
Internal Distn'bution
1. T.D. Anderson 15. W.R. Mixon2. V.D. Baxter 16. M. Olszewski3. S.H. Buechler 17. A.E. Ruggles4. R.S. Carismith 18. A.C. Schaffhauser5. W.G. Craddick 19. M. Siman-Tov6. P.D. Fairchild 20-29. T. lc Stovall
7. D.J. Fraysier 30. J.J. Tomlinson8. W. Fulkerson 31. C.D. West9. R.B. Honea 32. G.L. Yoder
10. J.E. Jones Jr. 33. ORNL Patent Section
11. L. Jung 34. Central Research Library12. R.J. Kedl 35. Document Reference Section13. M.A. Kuliasha 36-37. Laboratory Records Department14. W.A. Miller 38. Laboratory Records (RC)
External Distn'bution
39. John Stephen Anderpont, Chicago Bridge & Iron Company, 800 Jorie Boulevard,Oak Brook, IL 60522-7001
40. Debra L. Catanese, P.E., Pennsylvania Electric Company, 311 Industrial Park Rd.,
Johnstown, PA 1590441. Tom Carter, Baltimore Aircoil Company, P.O. Box 7322, Baltimore, MD 21227
42. Russ Eaton, Director, Advanced Utility Concepts Division, U.S. Department of
Energy, Forrestal Building, CE-142, 1000 Independence Avenue, Washington, DC20585
43. Imre Gyuk, Office of Energy Storage and Distribution, U.S. Department of Energy,Forrestal Building, CE-32, 1000 Independence Avenue, Washington, DC 20585
44. Landis Kannberg, Battelle Pacific Northwest Laboratories, P.O. Box 999, BattelleBoulevard, Richland, WA 99352
45. Don Kemp, Turbo Refrigerating Company, 1815 Shady Oaks Drive, P.O. Box 396,Denton, TX 76202
46. lC W. Klunder, Director, Office of Energy Management, Department of Energy,
CE-14, Forrestal Building, 1000 Independence Avenue, Washington, DC 2058547. Dave Knebel, Paul Mueller Company, P.O. Box 828, Springfield, MO 65801-0828
48. David Laybourn, P.E., Director of Marketing, Reaction Thermal Systems, Inc., 840Latour Court, Suite A, Napa, CA 94558
49. George Manthey, DOE, Oak Ridge Operations, Oak Ridge, TN 3783150. Robert P. Miller, Baltimore Aircoil Company, P.O. Box 7322, Baltimore, MD
21227
51. Tony Min, Mechanical Engineering Department, North Carolina Agricultural andTechnical State University, Greensboro, NC 27411
54
52. Dave Pellish, U.S. Department of Energy, Forrestal Building, MS CE-332, Room5H-79, 100 Independence Avenue, Washington, DC 20585
53. Veronika A. Rabl, Electric Power Research Institute, 3412 Hillview Avenue, P.O.Box 10412, Palo Alto, CA 94303
54. Eberhart Reimers, Advanced Utility Concepts Division, U.S. Department of Energy,Forrestal Building, CE-142, 1000 Independence Avenue, Washington, DC 20585
55. Richard Rhodes, FAFCO, Inc., 235 Constitution Drive, Menlo Park, CA 9402556. Marwan Saliba, Energy Engineering Institute, Dept. of Mechanical Engineering,
San Diego State University, San Diego, CA 92182-019157. Brian Silvetti, Calamac Manufacturing Corporation, Box 710, 150 South Van Brunt
Street, Englewood, NJ 0763158. Robert L. San Martin, Deputy Assistant Secretary, Office of Utility Technology,
Department of Energy, CE-10, 6C-026/Forrestal Bldg., 1000 Independence Avenue,Washington, DC 20585
59. Chang W. Sohn, U.S. Army Corps of Engineers, P.O. Box 4005, Champaign, IL61824-4005
60. Laura Thomas, Marketing Manager, York International Corporation, P.O. Box1592, York, PA 17405-1592
61. Samuel G. Tornabene, Edison Electric Institute, 1111 19th Street, N.W.,Washington, DC 20036-3691
62-71. R. D. Wendland, Electric Power Research Institute, 3412 Hillview Avenue, Box,. 10412, Palo Alto, CA 94303
72. Maurice W. Wildin, Professor, The University of New Mexico, Department ofMechanical Engineering, Albuquerque, NM 87131
73. Office of Assistant Manager for Energy Research and Development, Departmentof Energy, ORO, Oak Ridge, TN 37831
74-85. Given distribution as shown in DOE/OSTI-4500-R75 under Category UC-202(Thermal Energy Storage)

k
i I I I I