Embed Size (px)
Citation preview

CCC-664ARCON96
OAK RIDGE NATIONAL LABORATORYmanaged by
UT-BATTELLE, LLCfor the
U.S. DEPARTMENT OF ENERGY
RSICC COMPUTER CODE COLLECTION
ARCON96
Code System to Calculate Atmospheric Relative
Concentrations in Building Wakes
Contributed by:
Pacific Northwest National Laboratory, Richland, Washingtonthrough the
Energy Science and Technology Software Center, Oak Ridge, Tennessee
RADIATION SAFETY INFORMATION COMPUTATIONAL CENTER

Legal Notice: This material was prepared as an account of Government sponsored work and describes a codesystem or data library which is one of a series collected by the Radiation Safety Information ComputationalCenter (RSICC). These codes/data were developed by various Government and private organizations whocontributed them to RSICC for distribution; they did not normally originate at RSICC. RSICC is informed thateach code system has been tested by the contributor, and, if practical, sample problems have been run byRSICC. Neither the United States Government, nor the Department of Energy, nor UT-BATTELLE, LLC,nor any person acting on behalf of the Department of Energy or UT-BATTELLE, LLC, makes any warranty,expressed or implied, or assumes any legal liability or responsibility for the accuracy, completeness, usefulnessor functioning of any information code/data and related material, or represents that its use would not infringeprivately owned rights. Reference herein to any specific commercial product, process, or service by trade name,trademark, manufacturer, or otherwise, does not necessarily constitute or imply its endorsement,recommendation, or favoring by the United States Government, the Department of Energy, UT-BATTELLE,LLC, nor any person acting on behalf of the Department of Energy or UT-BATTELLE, LLC.
Distribution Notice: This code/data package is a part of the collections of the Radiation Safety InformationComputational Center (RSICC) developed by various government and private organizations and contributedto RSICC for distribution. Any further distribution by any holder, unless otherwise specifically provided foris prohibited by the U.S. Department of Energy without the approval of RSICC, P.O. Box 2008, Oak Ridge,TN 37831-6362.

i
Documentation for CCC-664/ARCON96 Code Package
PAGE
RSICC Computer Code Abstract . . . . . . . . . . . . . . . . . . . . . . . . . . . . . . . . . . . . . . . . . . . . . . . . . . . iii
J. V. Ramsdell, Jr., and C. A. Simonen, “Atmospheric Relative Concentrations in Building Wakes,” NUREG/CR-6331, Rev.1; PNNL-10521, Rev. 1 (May 1997) . . . . . . . . . . . . . . 1Appendix A: Source Listing has been omitted from the document.
(May 2002)

iii
RSICC CODE PACKAGE CCC-664
1. NAME AND TITLEARCON96: Code System to Calculate Atmospheric Relative Concentrations in
Building Wakes.
2. CONTRIBUTORSPacific Northwest National Laboratory, Richland, Washington through the Energy
Science and Technology Software Center, Oak Ridge, Tennessee
3. CODING LANGUAGE AND COMPUTERFortran, VisualBasic; IBM PC (C00664IBMPC00).
4. NATURE OF PROBLEM SOLVEDARCON96 was developed to calculate relative concentrations in plumes from
nuclear power plants at control room air intakes in the vicinity of the release point.
5. METHOD OF SOLUTIONARCON96 implements a straight-line Gaussian dispersion model with dispersion
coefficients that are modified to account for low wind meander and building wake effects. Hourly, normalized concentrations (X/Q) are calculated from hourly meteorological data. The hourly values are averaged to form X/Qs for periods ranging from 2 to 720 hours induration. The calculated values for each period are used to form cumulative frequencydistributions.
6. RESTRICTIONS OR LIMITATIONSARCON96 is a single user program. If expanded output is selected by the user, the
file includes the hourly input and X/Qs and the intermediate computational results. Theoutput file may exceed a megabyte in size.
7. TYPICAL RUNNING TIMEARCON96 calculates normalized concentrations using hourly meteorological data.
Program progress is displayed during calculations. With 100+MHz computers, five yearsof hourly data can be processed in about one minute..
8. COMPUTER HARDWARE REQUIREMENTSARCON96 is designed for computers using a 80386 or higher processor, 640
kilobytes of memory with 470 kilobytes of free at run time, and a VGA color monitor.
9. COMPUTER SOFTWARE REQUIREMENTSMSDOS 5.1 or higher programs will also run in DOS window in Windows 3.1,
Windows95, and Windows98. The user interface is written in VisualBasic for DOS. Theprogram is written in FORTRAN and compiled with MicroSoft PowerStation Fortran.When using the CMD.EXD DOS window under the Windows 2000 operating system, theARCON96 program displays only a part of the ARCON screen. However the full-screencommand.com DOS window displays the entire screen and allows one to run ARCON96under Windows2000.

iv
10. REFERENCEJ. V. Ramsdell, Jr., and C. A. Simonen, “Atmospheric Relative Concentrations in
Building Wakes,” NUREG/CR-6331, Rev.1; PNNL-10521, Rev. 1 (May 1997).
11. CONTENTS OF CODE PACKAGEIncluded in the package are the referenced document and one DS/HD diskette
which contains a self-extracting, compressed DOS file. The Fortran source files,information files, a batch file to run the code, executables, and input/output files are allincluded. However, the Visual Basic source files are not included.
12. DATE OF ABSTRACTJanuary 1999, revised May 2002.
KEYWORDS: AIRBORNE; CONTROL ROOM HABITABILITY; GAUSSIANPLUME MODEL; ENVIRONMENTAL DOSE; NUCLIDETRANSPORT
NUREWCR-6331 PNNL- 10521 Rev. 1
Atmospheric Relative Concentrations in Building Wakes
Prepared by J. V. Ramsdell, Jr., C. A. Simonen
Pacific Northwest National Laboratory Operated by Battelle Memorial Institute
Prepared for U.S. Nuclear Regulatory Commission

AVAILABILITY NOTICE
Availability cf Reference Materials Cited in NRC Publications
Most documents cited in NRC publications will be available from one of the following sources:
1. The NRC Public Document Room, 2120 L Street, NW., Lower Level. Washington. DC 20555-0001
2. The Superintendent of Documents, U.S. Government Printing Office, P. 0. Box 37082. Washington, DC 20402-9328
3. The National Technical information Service, Springfield, VA 22 161-0002
Although the listing that follows represents the majority of documents cited in NRC publications, it is not in- tended to be exhaustlve.
Referenced documents available for inspection and copying for a fee from the NRC Public Document Room include NRC correspondence and internal NRC memoranda; NRC bulletins, circulars, information notices, in- spection and investigation notices: licensee event reports: vendor reports and correspondence: Commission papers: and applicant and licensee documents and correspondence.
The following documents In the NUREG series are avaiiabl& for purchase from the Government Printing Office: formal NRC staff and contractor reports, NRC-sponsored conference proceedings, international agreement reports, grantee reports, and NRC booklets and brochures. Also available are regulatory guides, NRC regula- tions In the Code of Federal Regulations, and Nuclear Regulatory Commission Issuances.
Documents avallabie from the Natlonal Technlcal Information Service include NUREG-series reports and iech- nlcai reports prepared by other Federal agencies and reports prepared by the Atomic Energy Commission, forerunner agency to the Nuclear Regulatory Commission.
Documents available from public and special technical libraries include all open literature items, such as books, journal articles, and transactions. Federal Register notices. Federal and State legislation, and congressional reports can usually be obtained from these libraries.
Documents such as theses, dissertations, foreign reports and translations. and non-NRC conference pro- ceedings are available for purchase from the organization sponsoring the publication cited.
Slngie copies of NRC draft reports are available free. to the extent of supply, upon written request to the Office of Admlnlstration, Distribution and Mail Services Section, U.S. Nuclear Regulatory Commission, Washington, DC 20555-0001.
Copies of Industry codes and standards used in a substantive manner in the NRC regulatory process are main- tained at the NRC Library, Two White Flint North, 11545 Rockville Pike, Rockviile. MD 20852-2738. for use by the public. Codes and standards are usually copyrighted and may be purchased from the originating organiia- tion or, if they are American National Standards. from the American National Standards Institute. 1430 Broad- way, New York, NY 10018-3308.
DISCLAIMER NOTICE
This report was prepared as an aooount of work sponsored by an agency of the United States Government. Neitherthe United States Government nor any agency thereof, nor any of their employees, makes any warranty, expressed or implied, or assumes any legal liability or responsibility for any third party’s use, orthe results of such use, of any information, apparatus, product, or process disclosed in this report, or represents that it8 use by such third party would not infringe privately owned rights.

NUREG/CR-633 1 PNNL- 10521 Rev. 1
Atmospheric Relative Concentrations in Building Wakes
Manuscript Completed: May 1997 Date Published: May 1997
Prepared by J. V. Ramsdell, Jr., C. A. Simonen
Pacific Northwest National Laboratory Richland, WA 99352
Prepared for Division of Reactor Program Management Office of Nuclear Reactor Regulation U.S. Nuclear Regulatory Commission Washington, DC 20555-0001 NRC Job Code 52028

DISCLAIMER NOTICE
The views expressed in this report are not necessarily those of
the U. S. Nuclear Regulatory Commission.

Abstract
This report doamats the ARCON computer code developed for the U.S. Nuclear Regulatory Commission Office of Nuclear Reactor Regulation for potential use in control room habitabiity assaments. It includes a user’s guide to the code, a description of the technical basis for the code, and a programmer ‘s guide to the code. The ARCON code uses hourly meteorological data and recently developed methods for estimating dispersion in the vicinity of buildings to calculate relative concentrations at control room air intakes that would be exceeded no more than five percent of the time. These concentrations are calculated for averaging periods ranging from one hour to 30 days in duration.
ARCON is a revised version of ARCON95, which was developed for the NRC Office of Nuclear Regulatory Research. Changes in the code permit users to simulate releases from area sources as well as point sources. The method of averaging conceatrations for periods longer than 2 hours has also been changed. The change in averaging procedures inc- relative conceatrations for these averaging periods. In gaeral, the itwmse in conceatrotons is less than a fkctor of two. The increase is greatest for relatively short avenqing periods, for example 0 to 8 hours and diminishes as the duration of the averaging period iucreases.
. . . ill NUREGKR-6331 Rev. 1

Gmtents
Contents . . .
AbetRct........................................................Ul
Acknowled@neats ................................................. ix
1 Introduction ................................................... 1
2 ARCON% User’sGuide ........................................... 3 2.1 GettingStarted .......................................... 3
2.1.1 HardwareRequirements ............................. 3 2.1.2 Installation ...................................... 4
2.2 Running ARCON% ....................................... 6 2.2.1 TheUserIuterface ................................. 6 2.2.2 Entering Data .................................... 6 2.2.3 Exiting ARCON% ................................. 7
2.3 ARCONWInput .......................... .;. ............ 8 2.3.1 InputDataFileName.. ............................. 8 2.3.2 ScenarioDescription .............................. 10 2.3.3 MeteorologicalData ............................... 13 2.3.4 Receptor Data ................................... 15 2.3.5 SourceData .................................... 17 2.3.6 Output Files .................................... 18 2.3.7 Default Data .................................... 20
2.4 ARCON% Output ....................................... 21 2.4.1 Header ....................................... 21 2.4.2 InputData ..................................... 22 2.4.3 ARCON%Results ................................ 22
2.5 Examples ............................................. 26 2.5.1 Example I- Ground-Level Release ..................... 26 2.5.2 Example2-UncappedVentRelePlse .................... 26 2.5.3 Example3-CappedVentRelease ..................... 29 2.5.4 Example4-StackRelease .......................... 29 2.5.5 Comparison of ARCON and ARCON% Results ........... 33 2.5.6 Example 5 - Multiple-Vent Release .................... 35 2.5.7 Example 6 - Diffuse Source Release .................... 38
3 ARCON% Technical Basis ......................................... 3.1 Conceptual Model ........................................ 3.2 DifhsionModel ......................... ; ..............
3.2-l Diffusion Coefficient Adjustments for Wakes and Low Wind Speeds ...........................................
3.2.2 Sector-Average Diffusion Model ....................... 3.2.3 Elevated Release Diffusion Model ...................... 3.2.5 Vent Release Diffusion Model ........................ 3.2.6 Area Source Diffusion Model .........................
3.3 CalmWinds ........................................... 3.4 Vent/Stack Flow ........................................
41 41 42
42 45 46 47 47 48 49
V NUREGICR-6331 Rev. 1

ARCON%
3.5 Exposure Window ....................................... 49 3.6 AveragingMethods ...................................... 49 3.7 Relative Concentrations for Standard Intervals ..................... 50 3.8 MissingData .......................................... 50
4 Prcpgrammer’s Guide to ARCON% ................................... 53 4.1 General Computational Approach ............................. 53 4.2 CodeLanguages ........................................ 53 4.3 Codingstandards ........................................ 53 4.4 DataInput ............................................ 54
4.4.1 Run Specification File ............................. 55 4.4.2 Meteorological Data Files ........................... 55
4.5 Model Output .......................................... 56 4.6 ProgramDescription ...................................... 57
4.6.1 ARCON .................................... 58 4.6.2 Subroutine CURVEFIX ............................ 60 4.6.3 SubroutineINlT ................................. 61 4.6.4 Function INVMOL2 .............................. 62 4.6.5 Subroutine METREAD ............................ 62 4.6.6 Subroutine NSIGMAl .............................. 62 4.6.7 Subroutine PROC ................................ 63 4.6.8 Subroutine RECORD .............................. 63 4.6.9 Subroutine SCENREAD ............................ 63 4.6.10 SubroutineSHIFT ............................... 64 4.6.11 Subroutine SUMMARY ............................ 65 4.6.12 Subroutine WAKECORR ........................... 66 4.6.13 Subroutine WINDYXOQ ........................... 66 4.6.14 Subroutine XOQCALC5 ........................... 67 4.6.15 Subroutine XOQ95 ............................... 68
4.7 Quality Assurance ....................................... 69
5 References . . . . . . . . . . . . . . . . . . . . . . . . . . . . . . . . . . . . . . . . . . . . . . . . . . . 71
Appendix A ARCON FORTRAN Computer Code ......................... 73 A.1 ARCON% ........................................... 75 A.2 BLOCK DATA ........................................ 80 A.3 CURVEFIX .......................................... 81 A.4 INIT ................................................................................ . A.5 INVMOL2
83 .:::: 86
A.6 METREAD ........................................... A.7 NSIGMAl
88
A.8 PROC ................................................................... 92
A.9 RECORD . . . . . . . . ::: 94
A.10 SCENREAD ............................................................................ . 98
A.11 SHIFT.. .:.I:: 101
............................................ A.12 SUMMARY
105 .
A.13 WAKECORR ................................................................. 107
A.14 WINDYXOQ .:: 1::: :: 111
A.15 XOQ95 ......................................... 113
......................................... A.16 XOQCALCS
..*.117 ........... . ............................ -119
NUREG1CR-6331 Rev. 1 vi

A.17 MET................................................l~ A.18 PAltAhf .......................................... ..I 26 A.19 SCENARIO.. ...................................... ..lX A.20 UNITS ........................................... ..12 8 A.21 XOq...............................................l2 9
AppendixB Glose~ry..............................................131
vii NUREGKR-6331 Rev. 1
ARCON
List of Figures
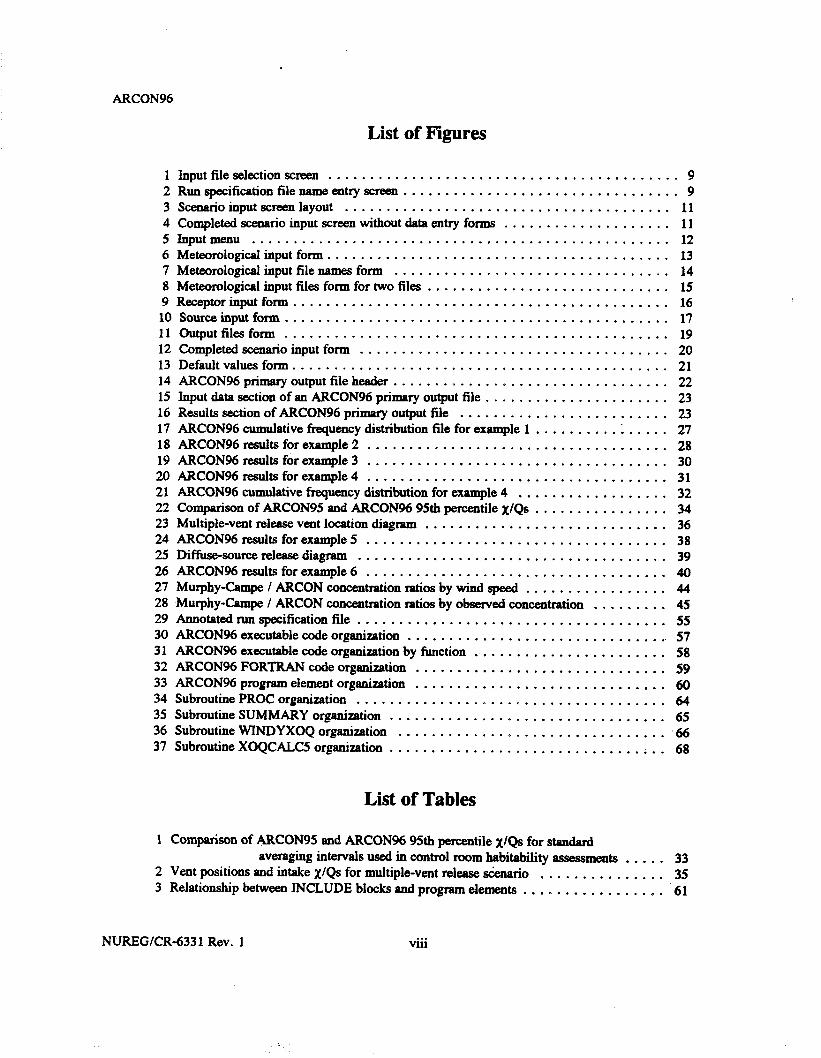
1 Input fileselection screen .......................................... 9 2 Run specification filename entry screen ................................. 9 3 Scenario input screen layout ....................................... 11 4 Completed scenario input screen without dataentry forms .................... 11 5 Inputmenu .................................................. 12 6 Meteorological input form. ........................................ 13 7 Meteorological input file names form ................................. 14 8 Meteorologicalinputfilesformforhvofiles ............................. 15 9 Receptorinputform ............................................. 16 10 sourceinputfonn .............................................. 17 11 Outputfilesform .............................................. 19 12 Completed scenario input form ...................................... 20 13 Default values form. ............................................ 21 14 ARCON primary output file header. ................................ 22 15 Input data section of an ARCON primary output file ...................... 23 16 Results section of ARCON primary output file ......................... 23 17 ARCON cumulative fkquency distribution file for example 1 .......... ; ..... 27 18 ARCON results for example 2 .................................... 28 19 ARCON results for example3 .................................... 30 20 ARCON% results for example 4 .................................... 31 21 ARCON% cumulative frequency distribution for example 4 .................. 32 22 Comparison of ARCON and ARCON% 95th percentile xIQs ................ 34 23 Multiple-vent release vent location diagram ............................. 36 24 ARCON results for example 5 .................................... 38 25 Diffuse-source releasediagram ..................................... 39 26 ARCON results for example 6 .................................... 40 27 Murphy-Campe / ARCON concentration ratios by wind speed ................. 44 28 Murphy-Campe / ARCON concentration ratios by observed concentration ......... 45 29 Annotated run specification file ..................................... 55 30 ARCON% executable code organization ................................ 57 31 ARCON executable code organization by function ....................... 58 32 ARCON FORTRAN code organization .............................. 59 33 ARCON program element organization .............................. 60 34 Subroutine PROC organization ..................................... 64 35 Subroutine SUMMARY organization ................................. 65 36 Subroutine WINDYXOQ organization ................................ 66 37 SubroutineXOQCALC5organixation .............................. ;. . 68
List of Tables
1 Comparison of ARcoN and ARCON% 95th percentile x/Qs for standard averaging intervals used in control room habitability assessments . . . . . 33
2 Vent positions and intake XIQS for multiple-vent release scenario . . . . . . . . . . . . . . . 35 3 Relationship between INCLUDE blocks and program elements . . . m . . . . . . . a . . . e . 61
NUREG/CR-6331 Rev. 1 . . . VI11
Acknowledgements
Acknowledgments
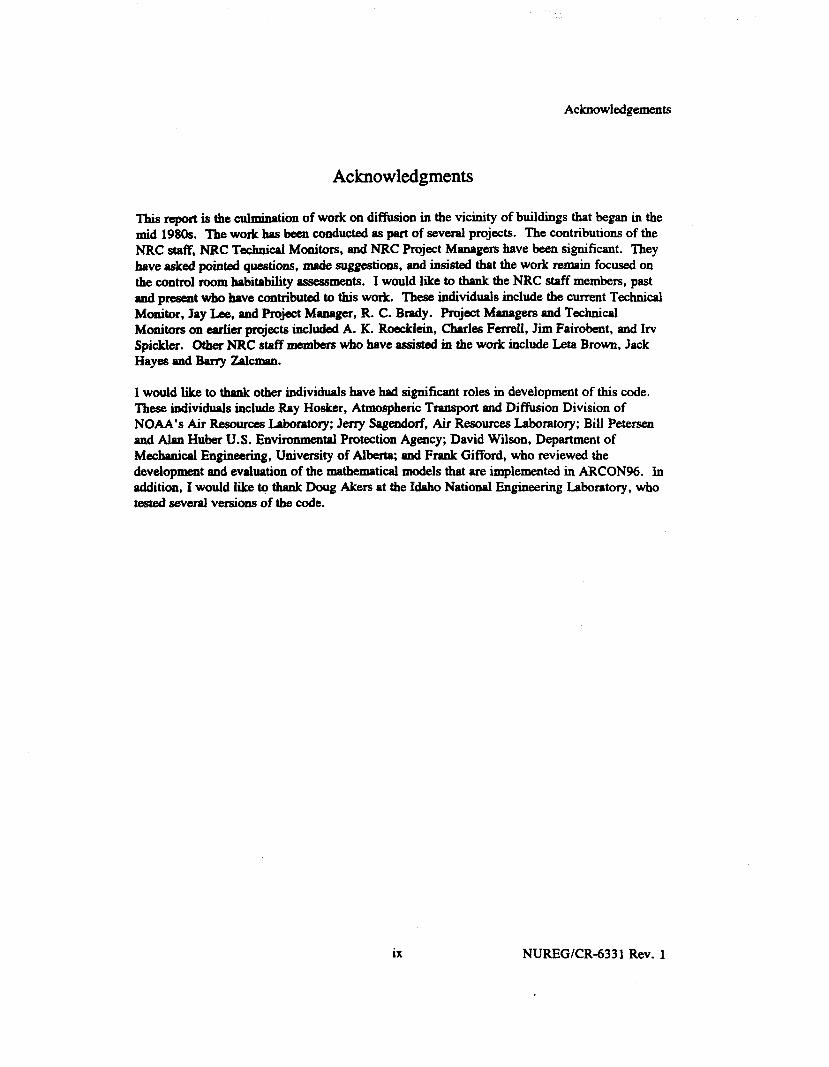
This report is the culmination of work on diffusion in the vicinity of buildings that began in the mid 1980s. The work has been conducted as part of several projects. The contributions of the NRC staff, NRC Technical Monitors, and NRC Project Managers have been significant. They have asked pointed questions, made suggestions, and insisted that the work remain focused on the control room habitability assessments. I would like to thank the NRC staff members, past and present who have contributed to this work. These individuals include the current Technical Monitor, Jay Lee, and Project Manager, R. C. Brady. Project Managers and Technical Monitors on earlier projects included A. K. Roecklein, Charles Ferrell, Jim Fairobent, and IN Spickler. Other NRC staff members who have assisted in the work include Leta Brown, Jack Hayes and Barry Zalcman.
I would like to thank other individuals have had significant roles in development of this code. These individuals include Ray Hosker, Atmospheric Transport and Diffusion Division of NOAA’s Air Resources Laboratory; Jerry Sagendorf, Air Resources Laboratory; Bill Petersen and Alan Huber U.S. Environmental Protection Agency; David Wilson, Department of Mechanical Engineering, University of Alberta, and Frank Gifford, who reviewed the development and evaluation of the mathematical models that are implemented in ARCON%. In addition, I would like to thank Doug Akers at the Idaho National Engineering Laboratory, who tested several versions of the code.
ix NUREGKR-6331 Rev. I

Introduction
1 Introduction
Guteral De&n Criterion 19 of 10 CFR 50, Appendix A sets forth the requirements for control rooms at nuclear power plants. This criterion states that “Adequate radiation pation shall be provided to permit access and occupancy of the control room under a&de& conditions without personnelrecuivingradiationexposuresinexcessof5rem....” Tbecodedescribedinthis manual, &mospheric Belative ~centrations in Building Wakes (ARCON), is a tool for poteatial use by the U.S. Nuclear Regulatory Commission (NRC) staff in their review of liaasae submittals related to control room habitability.
ARCON implemts a model for calculating concentrations in the vicinity of buildings that was developed by the Pacific Northwest National Laboratory (PNNL) under a previous contract with the NRC. A prelimiaary version of the code was tested by NRC staff and contractors. The present version of the code is called ARCON to distinguish it from the previous version of the code. ARCON95.
The differences between ARCON aad ARCON are relatively modest. ARCON allows users to enter initial diffusion coefficients that may be used to approximate dimensions of diffuse ptea sources. The method of calculating average relative concentrations for periods longer than 2 hours has also been changed. Centerline concentrations are now used for the first 8 hours in each time period longer than 8 hours duration. Sector-average concentrations are used for the remaining hours.
Following this introduction, the ARCON wde docum&ation is divided into three parts. The first part of the -tation is a user’s guide to the ARCON code. It contains the information needed to install and run the code. The user’s guide includes six example problems that illustrate application of the code and highlight some results that might not be expected. The second part describea the technical baais for the code. The technical basis information is p-ted to provide the background ma&al needed to properly interpret and apply the ARCON results. The third part is a programmer’s guide to the portion of the code that performs the data manipulations and calculations. This information is provided for use by anyone who may be called upon to modify the code.
NUREGlCR-6331 Rev. 1

User’s Guide
2 ARCON User’s Guide
This user’s guide to the ARCON% code consists of four sections. The first section provides information to assist you in getting started. It describes the hardware requirements for and installation of the code. The second section describes how to run the code. It covers the user interface and entering data. The third section describes the input required by ARCON%. It provides a description of each item and gives acceptable limits for the items. The fourth section contains six example problems and lists partial ARCON% output for each problem.
2.1 Getting Started
This section of the user’s guide covers the installation of the ARCON% code on your computer. The code is supplied on a single disk. If you have the required hardware and sufficient disk space, installation of the code will be a simple matter.
2.1.1 Hardware Requirements
ARCON is a DOS program that runs on persor& computers using the 80386 and more recent 32-bit processo r (IBM compatible) computers with a math coproceaso r. Problems running the code will be encountered if the math coprucesso r is a 16-bit coprocessor (e.g., 80287).
To ensure that the program will run correctly, the computer must have the following:
0 a high density floppy disk drive (either 3.5 or 5.25 inch disks) and a hard disk . 640 kilobytes of memoty 0 a VGA color monitor 0 amouse.
Running ARCON required more than 470 kilobytes of free memory. ARCON% has been compiled using a 32-bit compiler that is capable of addressing memory not normally accessible to DOS programs. As a result, the ARCON may run on some systems that were not able to run ARCON95.
If ARCON will not run, check to see if there is sufficient available memory. An error message will be displayed on the monitor. However, the message may flash by so rapidly that it isn’t readable. If the program creates a run specification file containing the input data but doesn’t read the meteorological data or create output files, insufficient memory is likely to be the problem.
ARCON% consists of a user interface and a computational program. The user interface program is a DOS program designed for color monitors displaying 50 lines of text. If ARCON is run on a computer with a monochrome monitor, the colors used in the input programs may make it difficult to distinguish some of the controls used in the programs.
A mouse is recommended. It ~facilitates moving through the program and selecting program options. However, ARCON can be run on computers without a mouse by using highlighted letters to select desired options. ’
3 NUREGICR6331 Rev. 1

1
ARCON
If neither a color monitor or a mouse are available, ARCON may be run by bypassing the shell programs used for data input. An ASCII text editor can be used to create the user input file that controls ARCON96. This file is called the run specification file. ARCON may then be run by typing “ARCON96F” followed by a space and then the name of the run specification file. The contents and format of the run specification file are described in Section 4.4.1.
2.1.2 Installation
The ARCON code consists of six files:
l ARCON96.BAT l ARCONVB.EXE l ARCONVB2.EXE l ARCON96F.EXE . ARCHELP.TXT . DOSXMSF.EXE.
The first 5 of these files must be placed in the subdirectory from which the program is to be run; the DOSXMSF.EXE file may be placed in the program subdirectory or any other subdirectory that is listed in the DOS PATH command. Other files used and generated by the program may be placed in other subdirectories, if desired. ARCON supports path names of up to 40 characters for meteorological data and output files. Problems in program execution may arise if the program is embedded too deeply in a directory structure.
An installation program is included with the ARCON code. This program will create an ARCON directory and copy the program files from the installation disk to the ARCON directory. To run the installation program, place the ARCON installation disk in your computer disk drive and make the drive containing the installation disk the active drive by typing the drive letter followed by a colon at the prompt.
The installation program is started by typing A96-INST followed by the path to the directory to where the program is to be installed on the command line. The installation command has the general form
A96-INST Drive Name1 Name2 Name3 Name4
where A96-INST is the name of the installation program, Drive is the destination drive, and names Name1 through Name4 define the path to the installation directory. between the command line arguments.
There must be spaces
The command line entry to install ARCON from a disk in the B: drive to directory C:\ARCON96\CODE would appear as
B:\ > A96-INST C: ARCON CODE
The Drive in the path must contain both the drive designation and the colon. The names do not require backslashes. The will be provided by the program. The installation program supports a path that includes four subdirectory levels. You must specify at least the Drive; it is not necessary to specify any subdirectory names.
NUREGKR-6331 Rev. 1 4

,
User’s Guide
When the installation program begins, it will create the directories listed on the command line, working from left to right across the command line. If a directory exists, its existence wiIl be noted and the program will move to the next level. This process will continue until the finrl subdirectory in the path is reached. The program will then copy all files on the installation d&k to the subdirectory.
Additional subdirectories may be created to hold the meteorological data files used by ARCON and to receive the output files generated by ARCON96. You will have to create these directories manually.
The ARCON installation program will not erase or overwrite ARCON files. If you wish to recover the disk space occupied by ARCON files you must delete the files manually. Be sure to make backup copies of important files prior to deleting them from your hard disk!
If you intend to run ARCON in a DOS window in Windows 3.1 or directly in DOS under a version prior to Version 7.0, no customization is required after the files have been copied to the appropriate subdirectories; the program may be run by typing “ARCON96” at the DOS prompt. However, if you normally run your computer console in a 43- or 50-line mode, you may wish to customize the ARCON96,BAT file. The mode commands in ARCON96.BAT change the console to the 50-line mode prior-to running ARCON96, and then change the console to the 25 line mode when ARCON is complete. If you normally run in the 50-line mode, both of the mode commands in ARCON96.BAT may be deleted. If you normally run in the 43-line mode, the second mode command should be changed from:
mode con lines = 25
to
mode con lines = 43.
Any text editor that produces ASCII files, for example the editor invoked by the DOS EDIT command, may be used to make this change.
If you intend to run ARCON in a DOS window in Windows95, the DOS mode.com may not be in a subdirectory in your path statement. In a standard installation of Windows95, mode.com is found in c:\windows\command. Edit the ARCON%.BAT file to include the full path to mode.com. If you try to run ARCON and do not see full data entry screens, you probably have not set the 50 line mode.
If you are a Windows95 user and copy the ARCON% files to your computer as a described above you may also set up ARCON% in the following manner. Find the icon for the ARCONVB.EXE using the Explorer in My Computer. Click once on the icon for the program. Then click on Properties on the File menu. This will you to customixe the computer settings used when ARCON is started by double clicking on the ARCONVB icon. Click on the acreen tab to gain access to screen setting options. When the options appear set the initial size to 50 lines. At this time you may set the program to run in the full screen mode.
After you have completed customization ofthe computer settings, you may also wish to create a shortcut to ARCON96. by dragging the ARCONVB.EXE icon on to the desk top and renaming
5 NUREGICR6331 Rev. 1

ARCON%
the shortcut. If you start ARCON% by double clicking on the shortcut, the program will use the custom settings.
2.2 Running ARCON
ARCON% runs from a Visual Raaic shell under the DOS opemting system. The shell provides a graphical user interface for data entry and initiates execution of the computational program. When computations are complete, the shell permits revision of input for a new set of wmputaticms. This section desctibes the procedures for running ARCON% within the Visual Rasic shell.
If you are running Windows95, have installed ARCON% according to the directions above, and have created a shortcut to ARCON%, start ARCON% by double clicking on the ARCON% icon on the desktop.
If you are not running Windows95, use the following procedure to start ARCON96. Set the default directory to the subdirectory where the ARCON% program files are installed. For example, if ARCON% is installed on the C: drive in a subdirectory named ARCON%, type cd ARCON% at the C:\> prompt. You should see
C:\ > cd ARCON%
When you press <ENTER>, the prompt will change to
C: MRCON96 >
to indicate that you are in the ARCON% directory. ARCON% may then be run by typing ARCON% and pressing <ENTER>. This will start ARCON%.
2.2.1 The User Interface
This section presents general information about interacting with the computer to run ARCON96. The Visual Rasic shell program consists of a series of screens that provide information about ARCON% and accept input required for the calculations. entry if you are using a mouse.
Online help is available during data
at the top of the screen. Help is obtained by clicking on the word Help in the menu bar
2.2.2 Entering Data
ARCON% is designed to be run with a mouse. In general, the instructions that follow will assume that you are using a mouse. However, there are keyboard substitutes for the mouse actions required to run the program. ARCON% uses several methods to obtain input. These methods are:
. commandbuttons @ text boxes l choice lists
NUREGKR-6331 Rev. 1 6

User’s Guide
Command buttons initiate some sort of action. To activate a command button, place the mouse cursor on the button and click with the left button on the mouse. If you are not using a mouse, you activate a command button by using the <TAB> key to highlight the button and then pressing <ENTER>. You can tell when a command button becomes active because its appearance will change.
Command buttons are labeled. The labels include QK, m, andwandm. These labels are self explanatory. There are five additional buttons that have meanings that are less obvious. The CANCEL button causes the program to return to the previous input screen without saving any of the data that you have entered or modified. The Eil&at& button appears when you are asked to enter the name of an input data file. If you click on tbe & &a& button when it appears you will be presented with two windows. One of the windows allows you to change directories, and the other lists names of files. Use of these windows will be described later. The m button appears on data entry forms. It is used to save the data you have entered when you are finished entering data. The last two buttons VALUES and m are found at the bottom of the main data entry screen. After all data have been entered, the w button is used to have ARCON check to see that all required data have been entered and are within range. After the values have been checked, the m button is used to initiate calculations.
Text boxes are used for entering either text or numerical information. The information is entered from the keyboard. You make a text box active by clicking on the box, or using the <TAB > key. When you move from a text box after entering data, ARCON% will check the entry to ensure that it is proper. If an improper entry is detected, a message box will appear and you will be returned to the text box where the error is.
Choice lists are used to obtain information when the number of options is small. A choice list is used to specify the wind speed units and another choice list is used to enter the release type. After you activate the choice list, you can move within the list using either the mouse or the up and down arrow keys.
There is a menu bar at the top of data input screens. You must have a mouse to use tbe menu bar. The menu bar lists three options - Input, Help, and Quit. You use the menu bar by clicking on a listed item so you can gain access to the item. The Input option provides access to data input forms after data have been entered and saved. It also provides access to several model parameters that have default values that are not likely to need changing in routine application of ARCON96. The Help option activates ARCON% Help. If you have questions about entering specific data items, you may be able to find an answer in Help without leaving the program or without having to find this manual. The final option on the menu bar is Quit. Quit is used to exit the Visual Basic shell program without running ARCON or saving any data. You leave the program by clicking on Quit.
2.2.3 Exiting ARCON%
The method used to exit ARCON depends on where you are in the program. If you are at the title or disclaimer screen, you exit the program by using the CANCEL button. Between the disclaimer screen and the scenario input screen, use the CANCEL button to return to the title screen. While you are in the scenario input screen, you exit the program by clicking on Quit in the menu bar. Finally, if you have just completed running the program, use the &IO button
7 NURBGK2R-6331 Rev. 1

ARCON%
when asked if you wish to run another scenario. When you exit ARCON% in any of these ways, your screen will return to its initial operating mode.
If you wish to exit ARCON% while the computational part of the code is running, you may use CONTROL-C to stop the code. If you use this method of exiting ARCON% nmning under DOS or Windows V3.1, your screen will be in the 50-line mode. To return your screen to the 25line mode, type.
mode con lines=25
at the DOS prompt and then press <ENTER>. If YOU are dg ARCON% under Windows95, your screen will return to its normal mode automatically.
2.3 ARCON Input
When you start ARCON the first screen you will see is a title screen. The title screen contains the program name and buttons that offer two choices: CONTINUE or m. Place the cursor on m and click the left mouse button if you wish to start the program, or click on CANCEL to exit from the code and return to the DOS command line.
NOTE: If you are not using a mouse, you may use the highlighted letters in the option buttons: CONTINUE and CANCEI,. By typing ALT-o (pressing the ALT button and letter o key at the same time), you will be doing the same thing as clicking the mouse on Continue. You may abort the program using the same method but substituting the letter n for o (i.e., ALT-n).
If you elect to continue, you will see a legal disclaimer. Again, you must decide to continue the program or abort the program. Clicking on oI( or pressing the <ENTER > key will allow the program to continue. The 1QI( button default is set to ‘continue. Clicking on Q&$& causes program execution to stop and returns you .to the DOS command line.
2.3.1 Input Data File Name
The first data input screen follows the disclaimer. ‘Ibe screen has two sets of options. The first set of options allows you to choose to recall and revise an existing input file or enter data in an entirely new file prior to running ARCON96. You select either Innut or u . . w. You make your selection by placing the cursor between the appropriate parentheses and clicking tbe left button of the mouse. The second set of options is represented by the m and CANCEL buttons. If you place the cursor on CANCEL and click with the left mouse button, you will return to the title screen. You may exit ARCON% from there. Figure 1 shows this screen. If you haven’t run ARCON% before or you are starting a new analysis, you should select v before clicking on m.
ARCON uses a fiie to transfer data entered by users to the code used for computations. This file is called the run ‘specification file. When you click on CONTINUE after selecting &R& NewData, ARCON displays the form used for entering the name of the run specification file name. This form is shown in Figure 2. It consists of a text box labeled “File Name: “. This box suggests a file name with an .RSF extension. You enter a file name by moving the cursor
NURBGKR-6331 Rev. 1 8

User’s Guide
Input Help Quit
Create the input file naeded to run ARCON or open an existing input file to change any of the parameters
Type of input File
( ) input New Data
( ) Open an Existing Input File
f
Figure1 hputfdesekcthnsaeen
Input Help Quit
Saving New Input File
( /*.RSF
C:\ARCONQSlRSF
EXAMPLEZRSF EXAMPLS3.RSF
Figure 2 Run specification file name entry screen
9 NUREGKIR-6331 Rev. 1

ARCON
to the asterisk, deleting it, and typing the name of your choice. File names are limited to eight characters. ln addition, the combined length of the file name and the path to the file must be 40 clmractefs or fewer. The boxes below the text box used for entering the run specification file name contain information about existing run specification i&s. The box on the left shows the names of files in the current directory with RSF extensions, and the right-hand box shows the path to the current directory. Use these boxes to ensure that you don’t unintentionally overwrite an existing file, or to select an existing file that has most of the input that you need. However, be warned that if you select an existing file and don’t change the path or file name, the original file will be overwritten when you save your new scenario. When you have entered the file name and the appropriate path, click on the QK button to proceed to the scenario entry screen.
If you click on the m button, ARCON% returns to the previous form where you may change your selection.
When you click on CONTINUE . . after selecting m , ARCON%
displays the form used for entering the name of a run specification file to be updated. This form appears to be identical to the form used for entering the name of a new run specification file except for the title displayed at the top of the form. However, the essential difference between the forms is in the responses to a click on the Q& button. When you elect to modify an existing file, clicking on the QK button moves you to the forms used for entering the scenario, but an additional form overlays the scenario entry forms. This form is used to enter the name of the file to be used when saving the revised run specification file. The name of the file being revised is the default name for the revised file. If you use this name the original file will be overwritten. After you enter the new file name, you continue with data entry by clicking on the QK button.
2.3.2 Scenario Description
Six forms are used for entering the data for the run specification file. However, typical users will generally only enter or change values in five of the forms. Four of the data entry forms are shown in separate boxes on the Scenario Input Screen when it first appears. These boxes are labeled:
l Meteorological Input l Receptor Input . source Input l Output Files.
Figure 3 shows the Scenario Input Screen without the detailed structure of the four data entry forms. You will note the menu bar at the top of the screen, the four data entry forms that cover the majority of the screen, and a box at the bottom of the screen that contains two buttons. You will also note that each of the four data entry forms has a DONE button. When you complete entering data in each form, click on the DONE button to save your entries for inclusion in the run specification file. If you don’t click on the m button, your entries will not be saved. After you click on the DONE button the data entry form will disappear. Figure 4 shows the screen as it will appear after all data entry is complete. At this time you should click on the w button to have ARCON check your data entries to ensure that all required data have been entered and that the data are within .the acceptable range. If all required data have not been entered a warning message will appear. When you understand the message, click on QK.
NUREGKR-6331 Rev. 1 10

.
ARCON
to the asterisk, deleting it, and typing the name of your choice. File names are limited to eight characters. In addition, the combined length of the file name and the path to the file must be 40 characters or fewer. The boxes below the text box used for entering the mu specification tile name contain information about existing nm specification files. The box on the left shows the names of files in the current directory with .RSF extensions, and the right-hand box shows the path to the current directory. Use these boxes to ensum that you don’t unintentionally overwrite an existing file, or to select an existing file that has most of the input that you need. However, be warned that if you select an existing file and don’t change the path or file name, the original file will be overwritten when you save your new scenario. When YOU have entered the file name and the appropriate path, click on the QK button to proceed to the scenario entry screen.
If you click on the CANCEL button, ARCON% returns to the previous form where you may change your selection.
When you click on m . . after selecting m , ARCON% displays the form used for entering the name of a run specification file to be updated. This form appears to be identical to the form used for entering the name of a new run specification file except for the title displayed at the top of the form. However, the essential difference between the forms is in the responses to a click on the QK button. When you elect to modify an existing file, clicking on the IQi( button moves you to the forms used for entering the scenario, but an additional form overlays the scenario entry forms. This form is used to enter the name of the file to be used when saving the revised run specification file. The name of the file being revised is the default name for the revised file. If you use this name the original file will be overwritten. After you enter the new file name, you continue with data entry by clicking on the IQI( button.
2.3.2 Scenario Description
Six forms are used for entering the data for the run specification file. However, typical users will generally only enter or change values in five of the forms. Four of the data entry forms are shown in separate boxes on the Scenario Input Screen when it first appears. These boxes are labeled:
l Meteorological Input l Receptor Input l Source Input l Output Files.
Figure 3 shows the Scenario Input Screen without the detailed structure of the four data entry forms. You will note the menu bar at the top of the screen, the four data entry forms that cover the majority of the screen, and a box at the bottom of the screen that contains two buttons. You will also note that each of the four data entry fotms has a DONE button. When you complete entering data in each form, click on the DONE button to save your entries for inclusion in the run specification file. If you don’t click on the I)oNE button, your entries will not be saved. After you click on the DONE button the data entry form will disappear. Figure 4 shows the screen as it will appear after all data entry is complete. At this time you should click on the a button to have ARCON check your data entries to ensure that all required data have been entered and that the data are within the acceptable range. If all required data have not been entered a warning message will appear. When you understand the message, click on QI(.
NUREGKR-6331 Rev. 1 10

Input Help Quit
Receptor input
I DONE
Output Files
I DONE
Figure 3 Scenario input sawn layout
User’s Guide
Input Help Quit
I vAJJts 1 I RUN I 1
Figure 4 Completed scenario input saxen without data entry forms
11 NUREGICR-6331 Rev. 1

ARCON%
If you get the waning message that indicates you must enter additional data, or if you would like to change data after clicking a DONE button, you may reopen one or more data entry forms by clicking on Input on the menu bar. Clicking on the menu bar will display a list of the six data input forms. This list is shown in Figure 5. Click on the form used for entering the data that you wish to change and the form will msppar. The Met File Name@) data entry form is used for selecting meteorological data files. It appears after you enter the number of meteorological files in the meteorological data entry form. The Default data entry form is used to change model parameters that normally don’t need to be modified. It only appears when requested from the Input menu. You should not alter the pamme&s on the Default form unless you are familiar with the technical basezr for the models used in ARCON%.
nput Help Quit
Met File Name(s)
Fiiure 5 Input menu
You may enter data in the forms in any order. However, you must enter data in every form, and the data must be within limits before ARCON% will begin its calculations. If you enter data that are not within reason, ARCON% will display an error message, and the text box where the value/letters were entered will be highlighted. You should conect the entry before continuing.
When you start with an existing data file, the nONE buttons will be enabled when you reach the scenario input screen signifying that a run may be staited with the data as they are. If you change one or more entries, you must click on the DONE button to update data in the file. If you do not click on the DONE button, the new file will retain the data from the original file.
If you are entering data for a new file, you must click on the VALUES button to ensure that all data are entered correctly before you can start the calculations. This provides another check on the validity of the values by confirming that all the input boxes have a value. After clicking on VALUES, you will be informed on the status of the data entry. If all required information is p-t and within range, the m button will be activated: You are only required to click on the VACUES button when creating a new file, but you may use it anytime to see if all required data have been entered.
NUREGKR-6331 Rev. 1 12

User’s Guidd-
After all the data are correct, ARCON% cmnputations are started by clicking on the m button.
2.3.3 Meteorological Data
The Meteorological Input form is located in the upper left of the ARCON% Scenario Input Screen. This form is shown in Figure 6. Four pieces of information are entered in this form. The first three pieces are entered in text boxes. The entry in each box should be a number. The fourth entry is made by selecting the appropriate wind speed units from an option list.
Meteorological data are input to ARCON% using meteorological data files. At least one meteorological data file is required, but the program will qt meteorological data on as many as 10 files. The meteorological data file entry form will appear after you enter the number of meteorological data files. This form is shown in Figure 7. It has a text box for entering the file name. If you are modifying an existing run specification file, the meteorological files used in the previous scenan ‘o will be used as default file names. If these files are correct, click on the DONE button. Otherwise if you know the file names you may enter the narr~ of new files in the boxes and click on the DONE button.
r Meteorological Input
Number of Met Data Files
Lower Measurement Height
Upper Measurement Height
( 1 mph WindSpeed ( ) m/s
( ) knots
Figure 6 Meteurological input form
13 NUREGKR-6331 Rev. 1

ARCON%
Quit
- Meteorological Input File Names
First Met File 1
Fw 7 Metemologiad input file names form
If you don’t know the name of the meteorological data files, click on the l?il&a& button. W&m you click on the m button, a form will appear that is similar to the form used for entering the run specification file name. This form, shown in Figure 8, is overlaid on the meteorological data file entry form. You csn select a file from the list in the left hand box by clicking on the file name and then on the 1QI( button. If the file doesn’t exist in the current directory, you can use the right-hand box to change directories.
File names should be entered so that the meteorological data are in chronological order. ARCON% assumes that the data form a continuous time series. If the data in the files are not a continuous time series, the x/Q values calculated for averaging periods that are longer than one hour will be meaningless.
If you enter names manually, the file and path name combined is limited to 40 characters. l?jlg &&I works in the same manner as the directory search described earlier for input file names. Atier you finish entering file names, click on the DONE button to return to the previous form to complete the scenario description.
You must enter a name for each meteorological file to exit from the meteorological file data entry screen in a normal manner. If you can’t find a meteorological file and wish to quit ARCON% to continue the search or create a meteorological data file, you may do so by clicking on Quit on the menu bar at the top of the screen. If you want to return to the Scenario Input Screen without quitting ARCON%, you may enter any name.
NUREGKR-6331 Rev. 1 14

User’s Guide
Quit
- Meteorological Input File Names
First Met File EXAMPLE1 MET
Second Met File I
I
Open Met File
File Name: l .MET II
C:\ARCON96\MET
B]E
Fqure 8 Me&orological input files form for two files
The meteorological data files require one record per hour. Each record must include the day of the year, the hour of the day, the stability, and the wind direction and wind speed at the lo+er messurement level. The record may also include a five&aracter location identifier, and a wind direction and speed for the upper level. Section 4.4.1 provides a complete description of the meteorological data file structure.
The second and third text boxes on the Meteorological Input form are used to enter wind speed measurement heights. Enter the heights in meters. The height of the lower-level measurement may not be greater than 100 m, and the height of the upper-level measurement may not be greater than 300 m. If wind data are available for only a single measurement height, enter the height in the text box for the lower level.
2.3.4 Receptor Data
The Receptor Input Form is used to enter data related to the receptor. In control room habitability assessments the receptor is the control room air intake. The Receptor Input form, shown in Figure 9, is located in the lower left-hand corner of the Scenario Input Screen. AR entries on this form are numerical values.
15 NUREG/CR-6331 Rev. 1

ARCON%
F Receptor Input
Distance to Receptor
Intake Height
Elevation Difference
Direction to Source
Fm 9 Receptor input form
‘The distance from the source to the receptor refers to the horizontal distance between the release point and the air intake. This distance may not exceed 10,ooO m.
The intake height is the height of the intake above grade. It may not exceed 100 m.
Elevation difference is the difference in plant grade between the positions of the intake and rehse. This difference will normally be xero. Enter Zen if the release point and intake are on the same structure or the heights of the release point and intake are measumdfromthesame reference plane. If the release point and intake are widely separated, there may be a difference in the height of the reference plane. In this case the difference in elevation should be entered. Enter the difference as a positive value if the grade elevation at the release point is higher than at the intake. If the grade elevation at the intake is higher, enter a negative value. ARCON% will
accept elevation differences from -1,000 m to + 1,000 m.
The direction from the intake to the source is the last item entered in the Receptor Input form. This direction is used to determine when the wind carries effluents from the release point to the intake. Assuming that the wind directions in the meteorological data file follow the standard convention of recordiig the direction from which the wind blows, you will enter the proper direction if you imagine that you are s,tanding at the intake facing the release point. If you are looking north, enter north (360”). If you are looking southwest, enter southwest (ZW), etc. ARCON% will transform the wind direction to the transport direction for you.
The distance from the receptor to the air intake, the height of the air intake, and the difference in grade elevation between the positions of the intake and the release point must be entered in meters. The direction to the source is entered in degrees. The data may be entered in the text boxes in any order.
NUREGKR-6331 Rev. 1 16

User’s Guide
2.3.5 Source Data
Informstion describing the relesse point is entered in the Source Input form. This form, shown in Figure IO, is located in the upper right-hand comer of the Scuuuio Input Screen. The option list at the top of the form is used to enter a general description of release. ARCON% usea this description in dete nnining if your input is sufficient and if the valuea are within acceptable limits. It also usea this description in selection of the equations used for calculating x/Q. The text boxes below the choice list are uaed to enter a more detailed description of the release.
Source Input
Release Type ( ) ground ( ) vent ( ) stack
Release Height
Building Area
Vertical Velocity
, Stack Flow / 10.0 I
Stack Radius l0.564 i
Fqure 10 Source input form
If you select a ground-level release in the choice list at the top of the Source Input form, you may enter zeros in all of the text boxes. ARCON will assume a ground-level release height and will not use the vertical velocity or stack radius, even if entered.
If you select either a ground-Ievel or vent release and wish to include wake diffusion in your calculations, you must enter a building ares. Building area controls the distance down wind that building-wake effects will be felt. The larger the area, the farther downwind they will be felt. The projected building area depends on the problem being addressed. It is not necessarily the area of the entire building. In some instances, the appropriate area may be the projected area of a portion of the building. The range of acceptable values for building area is 0 to 10,000 m’. A building area is not required. If you don’t enter an area, intake concentrations will be calculated assuming normal dispersion.
I7 NUREG/CRd331 Rev. I

ARCON%
A release height is required if you select a vent or elevated release. It can be any value between 1 and 300 m. ARCON% does not compute plume rise. Therefore, if you wish to include plume rise in your calculation, you must combine plume rise with the actusl stack height to get an effective stack height and enter the effective stack height in the text box in place of.the actual height.
The verticsl velocity is used in both vent- and elevated-release calculations. In vent release calculations, the vertical velocity of the vent exhaust is compared with the release height wind speed to determine how much of the exhaust enters the building wake. When the ratio of vertical velocity to the wind speed exceeds 5, the exhaust rises above the wake; when the ratio is less than 1, the exhaust is completely trapped in the wake, and at intermediate ratios, part of the exhaust enters the wake. In elevated-release calculations, the vertical velocity is used to determine if the stack height should be reduced to account for downwash. Downwash is included in the calculation whenever the ratio of the vertical velocity to the release height wind speed is less than 1.5. ARCON accepts vertical velocities ranging from 0 to 50 m/s. A vertical velocity of zero should be entered if the vent is capped.
The stack flow is used in model calculations whenever entered. Its function is to ensure that effluent concentrations in the atmosphere are always less than the concentration at the release point. The closer together the release point and receptor are and the larger the flow, the more important it is to include the flow in the calculations. ARCON% acq& flows ranging from 0 to 100 m3/s.
The last entry in the Source Input form is for the stack mdius. Stack radius is used only in elevated release calculations. It determines the maximum stack height reduction during downwash conditions. ARCON will accept stack radius entries from 0 to 10 m.
In reality, the stack or vent exit velocity, stack flow, and stack radius are related. However, the stack or vent exit velocity is not necessarily directed in the vertical. Vents are frequently capped or hoxixontal. Therefore, ARCON does not check to m&e sure that these three entries are consistent. You must do that.
2.3.6 Output Files
The Output Files form shown in Figure 11 is the fourth form on the scennrio Input Screen. It is located in the lower right-hand comer of the screen. This form is used to specify the names of two files to receive the normal ARCON% output.
The name of the file to receive the primary output is entered in the Output File text box. When the run is complete, this file will contain heading information related to the ARCON% code, the date and time that the code was run (if the date and time in the computer’s clock are correct), a listing of the input to the code, and the output from the code. The output from the code includes the number of hours of data pmcessed by the code, the number of hours of missing data, the range of predicted concentrations for hourly concentrations, the 95th percentile concentration estimates.
The .CFD File text box is used to enter a name for the file to receive the cumulative tiequency distributions of the concentrations calculated for ten averaging intervals. This file is designed to be imported into a spreadsheet for further data analysis and display. These distributions may be
NUREGCR-6331 Rev. 1

User’s Guide
- Output Files
Output File
CFD File Name
Expanded Output
. d
Figrve 11 Output files form
used to determine concentrations at percentiles other than the 95 percentile. You must enter a name for the primary output file, but entering the .CFD file m is optional. ARCON% will allow you to run the code if you don’t enter a .CFD file name. However, you will be required to enter a name for the file when ARCON96’s calculations are complete.
If you click in an Output File text box and then click in another area of the input form, ARCON% will enter a default name. The default file namea are Arcon%.log for the primary output file and Arcon96.cfd for the cumulative distribution file.
ARCON will not overwrite an existing primary output file or a .CFD file. If you enter the name of an existing file for either of these files, ARCON% will abort. An error message will be displayed on your screen, but it may not remain long enough to read.
The last entry in the Output Files form is a control that enables ARCON96’s expanded output option. The Expanded Output option is included primarily to give advanced modelers access to intermediate information for use in code verification. In general, you can ignore this text box and accept the default value, n. If you wish to look at the expanded output, change the n (no) to a y (yea). ARCON will only accept lower-case letters. When you request expanded output you will be asked for a file name as soon as the computational program begins. This file is referred to as the QA file.
The QA file contents include diffusion coefficients and wind speed correction factors used by the code, a copy of the meteorological data file, the centerline and sector-average x/Q values calculated for each hour, and frequency distributions of the average concentrations. Consequently when ARCON% is run with the expanded output option and a large meteorological data set, the result will be a large (several hundred kilobytes) QA file.
Figure 12 shows a Scenario Input Screen as it might appear following data entry prior to clicking on any DONE buttons.
19 NUREGKR-633.1 Rev. 1

ARCON% swnario Input s-
- Meteordogiui Input
Number of Mat Data Files 1
Lcwer Measurement Height 10.0 -
Upper Measurement Height 63.4 ;
( 1 mph WindSpeed ( ) m/s
( ) knots
- Raoaptor Input
Dirtanca to Receptor ,350 I :
Intake Haight izo.0 j
Elevation Diffarenw :o.o I
Dimction to Sow-a :245 1
IWNE]
/Some input ( ) wound
Release Typa ( ) vent ( ) stack
- Release Height / 2.0
Building Ama 11600
i verlical Valocity ;lO.O
Sladc Flow 110.0 /
Stack Radius 10.5&11
L pC-1
-Output Files
Output File iAn0n96.10g j
CFD File Name ! Arcon96.cfd 1
ExpandedOutput /n i
Fii 12 Completed scenario input form
2.3.7 Default Data
The remaining data input form is called the Default Values form. It is used to change default values for parpmeters used in the dispersion model. It is also used to modify the averaging intemtls for x/Q. It is generally not necessary to change these parameters; therefore, the form is not displayed routinely.
The Default Values form, shown in Figure 13, is awessed by clicking on Default on the Input menu. The Input menu will be displayed if you click on the word Input in the menu bar at the top of the screen. The parameters included on the form are the surface roughness length, the width of the wind direction window, the minimum wind speed, sector-averaging width constant, number of hours for each averaging interval, and the minimum number of hours for a valid average. All of these pammeters are defined and discussed in Section 3. If you aren’t comfortable with the information in Section 3, you probably shouldn’t be changing default values. ‘Ihe Default Values form is also used to enter the initial diffusion coefficients that deftne area sources. The use of initial diffusion coefficients for this purpose is demonstrated in example problems 5 and 6 in Sections 2.5.6 and 2.5.7, respectively.
NUREG/C!R-6331 Rev. 1 20

User’s Guide
- Default Values
Surface Roughness Length
Wind Direction Window (degrees)
io.10 1
190 i
Minimum Wind Speed (m/s) !o.sj
Averaging Sector Width Constant !4.0
Initial Diiusion Coefficients (m)
1 Minimum Number of Hours I
Fiiure 13 Default vales form
2.4 ARCON Output
In the Output Files form of the Scenario Input Screen you entered a name for a file to be used for the primary output from ARCON96. This section describes the primary output file.
The primary output file from ARCON96 is an ASCII text file. It may be viewed, edited, annotated, and/or printed using a text editor or word processo r. Some of the lines of text in the file exceed 80 characters in length. As a result, the best results will be obtained if you use a text editor or word processing program that allows you to control the font size and number of characters on a line. The files can be printed on 8.5 by 1 l- inch paper using 0.5~inch margins with 16.67 characters per inch.
The contents of ARCON96’s primary file are divided into three sections. The first section is a header. The second section lists the input to the code, and the third section summaries the results of the calculations. These sections are discussed below.
2.4.1 Header
The header in the ARCON primary output file provides information about the code. Figure 14 shows a file header. The first three items in the header identify the code. They are the code name, the organization sponsoring code development, and the date and time that the code was compiled. The time of code compilation establishes what version of the code was used for the calculations. The next two items list people who can be contacted about the code and gives the reference for the code documentation. The names and phone numbers listed in the header were
21 NUREGKR-6331 Rev. 1

ARCON
Progrr Title: ARCDRW.
Dedoped For: U.S. nuclear Roeul~tofy comeiufon Office of Wucleer Reactor Reguletim Division of Resctor Progrm Renegemmt
oste: Mey9, 1997 3:D0 p.m.
RRC cmtects: J. Y. Lee Pllme: (301) 415 1080 l -ril: jyllRnrc.gov
J. J. Heyes Phone: (301) 415 3167 e-ri 1: j jhRnrc.gw
L. A Brown Phone: (3011 415 1232 l -ril: lmrc.gov
Cods Developer: J. V. RamsdelL Phme: C509) 372 6316 l -wil: j-rusdclli)pnl.gov
GodeD-tetim: RUREGKR-633lRev. 1
The progrm uoe prepered for an agency of the united St&es Goverrment. neither the United Statea Goverment nor eny l gency thereof, nor eny of their rployeen, neka my wrranty, exprared or implied, or eestmes eny Legel liebility or reeponsibititiee for any third psrty’s UC, or the reeults of wch UC, of eny portion of this progrr or reprnento that its UIC by such third perty uould'not.infringe privstely omed rights.
ProgranRm 5/ 9/lW7 et 15:03:19
Figure 14 ARCON primary output file header
current when this guide was written. These items are followed by a disclaimer. The disclaimer was provided by the NRC for inclusion in software developed for the agency. The final line of the header gives the date and time that the program was run. This time may be used to identify the results of the most recent model run if ARCON is run several times with the same input and output file names.
2.4.2 Input Data
The second section of the ARCON primary output file is a listing of the user input. Figure 15 shows the Input Data section of a primary output file. This listing contains all of the information in the run specilkation file. It also shows the range of wind directions tbat are assumed to carry effluents from the release point to the intake. This range is calculated from the direction of the source from the intake and the wind direction sector width. The example shown in Figure 15 is for an ARCON run that did not include expanded output. When the expanded output option is selected, the last line of the input section contains the QA output file name.
2.4.3 ARCON Results
The final section of the primary output file contains the results of the ARCON calculations. Figure 16 shows the results section of a primary output file.
The first six limes of the results section summarixe the meteorological data. The first line shows the number of hours of data processed. A normal year has 8760 hours; leap years have 8784. The second line shows the number of hours that ARCON was unable to calculate a x/Q. Fewer than 10 percent of the hours processed should have missing data if the meteorological data have been obtained with a well-maintained system. The third line shows the number of
NUREGKR-6331 Rev. 1 22

User’s Guide
Wr of Roteorologiut Dsts ffla = 1 MeteorologicSl Deta fil. llm
eXaplO.RET
Height of lowr uind instrtnmt (=I = 10.0 ' Height of rppcr mind imtnrnt (D) = 53.4 Mind Speeds entered l S knot8
Cromd- lev*L release Release height W I .O Ruilding Area (m’2) I 1900.0 Effluent vertical velocity Ws) = Vmt or strk flow (='3/sl I 2 Vmt or stack radius Ml I A0
Dirrtim . . intake to Source (deg) = 326 Wind direction sector uidth'Wg) = 90 Wind dirrtim windou Weg) I 2s1 - 011 Distance to intake (II) s 45.0 Intake height (11 I 15.0 Terrain l levetim difference (a) = .O
mtput file - l xl-96. Log .x1-%.cfd
Riniu Uind Speed (Js) *
Surface roughms lmgth tr) s ::o Sector averaging constant I 4.0
Initial nlua of sip y I
initial value of sim t I ::
Expuded output for coda testing not selrtd
Figure 15 Input dab section of an ARCON primary output file
Tot81 mdar of h8ur8 of Qta prowssod = 0760 Newa of miuing data I 10 Rows diractim in uindw . 1529 Ilaws l levat8d plu u/ dir. in uindar = Yours of calm winds = 31; Raw-a direction not in wit&w or calm = 4W7
DtSlRtSUYtW SWIURY DATA SY AVRRACIRG tRlERVAl AVER. PER. 1 2 4 UPPER t.tM. l.ooE-02 l.OOE-02 l.OOE-02
LW LIW. l.ooR-06 l.ooE-06 1.00246 l.ooE-06 1.002-06 l.ooE-06 l.wE-06 l.caE-06 l.aE-06
MOVERANGE 0. 62: R67:: 0. 1:"'~ IN RANGE 4663. 6608. 8436: rt1:: SEELW RANGE 408;: 0. 0. 0. 0. 0.
ZEN0 TOTAL x/as 8750. 8742. g67:*
0. a605. Ed- d:
X NW ZERO 53.29 63.57 73.61 R44.61 90.67 96.66 1OO.G 100.00 lOO.Oil 100.00
95th PERCERTILE X/a VALUES l.UE-03 l-NE-03
%X X/P for 8tandm-d l vwaginn intwvals
Otothours 1.43E-03 2 to 6 bars l&E-03 6 to 24 hours SAE-04 1 to4day8 4.49E-04 4 to so da* 3.7SE-04
IKlJRLY VALUE RAXCE Kul x/a MlY x/a
CENTERLINE 2.40E-03 6&E-04 SECTOR-AVERUE 1 .SOE-03 .4.51E-04
RCUIW. PROCRW COMPLETtOl
9.61E-04 5.22GW 4.67E-04 L.wE-04 3.94E-04
Figure 16 Results section of ARCON primary output file
NUREGKR-6331 Rev. 1

ARCON%
hours with a wind direction in the window that carries &fluent from the release point to intake. The size of this number depends on the orientation of the line between the release point and the intake with respect to the prevailing wind direction. If the prevailing wind direction tends to carry material from the release point to the intake, the number of hours in tbe window can approach 50 percent of the total hours. If the wind rately blows from the release point to the intake, the number of hours in the window could be 10 percent or less. The fourth line gives the number of hours of elevated plumes during the time that the wind is calm or the wind direction is in the window. This number should be zero unless you have specified a vent release with an uncapped vmt or a stack release. The fifth line is the muuber of hours of calm winds (windspeedlessthanthe minimumwiudspeedsetintbeDefaultValuesform). Thefinallineis the number of hours for which x/Q was assmmxl to be xero because the wind direction was not in the window and the wind was not calm.
The next ten lines contain 8 summary of the intermediate result of the calculations by averaging period (in hours). ARCON calculates XIQS and creates a x/Q frequency distribution using x/Q bins. The lines labeled Upper Lim. and Lower Lim. define the range of x/Q bins use to compile the xlQ frequency distribution for each averaging period. The range should cover four orders of magnitude. Ranges for the l- and &hour averaging periods will be the same, as will the ranges for the 12- through 720-hour periods. However, the ranges for these two groups of averaging periods may not be the same.
The distribution of x&s calculated for each averaging period is summarized in the five lines following the line giving the lower limit for the x/Q bins. The first of these lines gives the number of x/Qs that were greeter than the upper limit of the bins. This number should be zero bless you have processed more than 10,000 hours of data. When you process more than 10,000 hours of data, the bin limits are set based on the first 10,090 x&s calculated. As a result, if you process more than 10,000 hours of data and the highest x/Qs don’t occur in the first 10,000, there could be a small number of x/Qs above the range of bins. The next line gives the number of xlQs within the rsnge of bins, and the following line gives the n&r of xlQs below the range. If you are running a vent- or stack-release scenario, you may find so- xIQs that are listed as below the range. These x/Qs are within an order of magnitude of the lower limit. Values that are more than au order of magnitude lower than the lower limit are counted as zero because they are not a factor in determining the 95th percentile x&&i. The Zen, line gives the number of XlQs that were more than an order of magnitude below the lower limit of the bins. The total x/Q line gives the total numbers of hours that are bases for calculating the 95th pemxntile x/Qs.
The line labeled 95th Percentile x/Q Values gives the 95th percentile values for averaging periods beginning at the start of release. Thus, the 2-hour average is for the O- to 2-hour time period. Similarly, the &hour value is for the O- to 8-hour time period, and the 96-hour value is for the O- to 96-hour time period. In general, these values should decrease as the duration of the averaging period increases. However, it is possible to have the 95th percentile value increase as the averaging interval increases. This unexpected behavior is most likely to occur with elevated or uncapped vent releases.
Thus with the default averaging periods, the x/Qs for 1,2,4, and 8 hours are centerline values. Average xIQs for periods longer than 8 hours consist of centerline XIQS for the first 8 hours and sector-average x/Qs for the remainder of the period. For example, each 24-hour average xJQ is made up of an average of 8 one-hour centerline x/Qs followed by 16 one-hour sector-average
NUREGICR-6331 Rev. 1 24

User’s Guide
x/Qs. This change makes ARCON consistent with NRC guidance on the use of centerline and sector-average x/Qs found in Regulatory Guides 1.3, 1.4, 1.111, and 1.145.
Control room habitability assessments generally involve the use of different x/Qs as the postulated accident progresses. The x/Qs for various intervals during the accident can be calculated directly from the 95th percentile values. Section 3.7 discusses the calculation of the values for time periods that don’t begin at the beginning of the release. Values for five standard averaging intervals are given following the 95th percentile values. The x/Q value for the O- to 2-hour averaging period is usually the l-hour value. However, if the 95th percentile 2-hour average x/Q is larger than the l-hour value, the 2-hour value is used.
Revision of the method for calculating average relative concentrations in ARCON hss a second benefit. In the discussion of ARCON results in the next to last paragraph of Section 2.4.3 of NUREG/CRd331, there is mention of a computational artifact related to combination of results of the centerline and sector-average models. The revised averaging procedure avoids this artifact. With the revised procedure the x/Qs for 0 to 2 hours and 2 to 8 hours are based only on centerline values. Similarly, the x/Qs for 8 to 24 hours, 1 to 4 days, and 4 to 30 days are based only on sector-average values.
If the default averaging periods are changed, the combination of centerline and sector-average x/Qs will change. As in ARCON95, ARCON% will calculate x/Qs for the standard averaging periods only if the averaging periods are defined as follows:
0 the 0 to 2 hour x/Q will be calculated and presented only if the first averaging period is 1 hour
0 the 2 to 8 hour x/Q will be calculated and presented only if the first averaging period is 1 hour and the fourth averging period is 8 hours
l the 8 to 24 hour x/Q will be calculated and presented only if the fourth averaging period is 8 hours and the sixth averging period is 24 hours
0 the 1 to 4 day x/Q will be calculated and presented only if the sixth averaging period is 24 hours and the seventh averging period is 96 hours
0 the 4 to 30 day x/Q will be calculated and presented only if the seventh averaging period is 96 hours and the tenth averaging period is 720 hours.
Calculation and presentation of the x/Qs for each of the standard averaging intervals is independent of the calculation and presentation of x/Qs for the other intervals. Thus, if the criteria are met for calculation and presentation of x/Q for a standard averaging interval, the x/Q will be calculated and presented. If the criteria are not met, the x/Q will not be presented.
The last part of the results section of the log file lists the maximum and minimum l-hour x/Q values calculated by the centerline and sector-average models. These values may be used to check the range of x/Q bins.
The line NORMAL PROGRAM COMPLETION should be the last line of the log file. If it isn’t, the program has ended in an error mode and the results should not be used.
25 NUREGICR-6331 Rev. 1

ARCON
2.5 Examples
This section cahns six example problems. The first four examples demonstrate the use of ARCdN% to assess the ccmsequ~~ccs of ground-level, capped and uncapped vent, and elevated releases. These examples were included in the ARCON documentation. The last two examples demonstrate the use of ARCON% in calculatmg x/Qs for area sources. The meteorological data for the examples are in a file d EXAMPLE.MET. This file will be used in each of the examples. However, each example ma+ a different set of assumptions about the meteorological measurement system used in collection of the data.
Each example includes a scenario description that provide all of the information required to run ARCON% and sufficient output for you to check the results of your calculations. The header sections of the log files and the lower portions of the cumulative frequency distribution files have been deleted.
2.5.1 ExampIe 1 - Ground-Level Release
The first example is a ground-level release do. The release point is at the base of a building with a cross-sectional area of 1,900 m2. The direction from the intake to the release point is 326”) and the distance between the intake and release point is 45 m. The intake is located 15 m above the ground. Use the meteorological file, with the understanding that the wind speeds are in knots (nautical miles per hour) and that the wind sensors are located at the lO- and 53.4-m levels of the meteorological tower. Name the output files exl-%.log and exl-96.cfd.
The log file for Example 1 is shown in Figures 14 through 16 in Section 2.4. Figure 17 shows a portion of the cumulative distribution file for the example. After comparing the results in your log file with those in Figure 14 through 16, look at the cumulative distribution in Figure 17. Notice that the cumulative frequency of l-hour xlQs increases from 0 to the maximum 4663 in a x/Q range of less than an order of magnitude. The range of xIQs increases as the averaging period increases up to about 96 hours (4 days). When the length of the averaging period increases beyond 4 days, the range of values decreases until it is only about a factor of 2 for a 30day average.
2.5.2 Example 2 - Uncapped Vent Release
The second example is an uncapped roof-top vent release. The direction from the air intake to the vent is 083 ‘, and the distance is 18 m. The vent has a radius of 1 m; under accident conditions it has a nominal flow of 15.7 m?s, and it is uncapped. The plant drawings indicate that the heights of the air intake and vent are 25 and 29 m above the plant reference elevation, respectively. and that the cross-sectional area of the building on which the vent is located is 1730 m2. Hourly meteorological data are available in a file named EXAMPLE.MET. The wind data were measured at 10 and 92.1 m. and the wind speeds are reported in meters per second. Name the primary ARCON output file ex2-%.log, and the cumulative frequency distribution file ex2-%.cfd. when you run the program you should get the output shown in Figure 18 in the ex2-%.log file. If you didn’t, perhaps you forgot to calculate and enter the vertical velocity. The vertical velocity is the flow divided by the vent area of 3.14 m2, assuming a round vent.
NURRGlCR-6331 Rev. 1 26

X/D CWLATIVE FREUJEYCY DISTRIRLKIOYS
User’s Guide
xoa Ah. Lb. 9.12OE-03
. . . 2.512E-03 2.29lE-03 2.069E-03 1.9D5E-03 l.KME-03 l.%E-03 .l &SE-03 l.Sl(IE-03 1.202E-03 l.O96E-03 l.oow-03 9.12oE-04 &SlI-04 7.586E-05 6.916E-04 6.3loE-04 5.754E-04 s.zw-04 4.786E-04 4.365E-04 3.9818-04 3.6311-04 3.3llE-04 3.02DE-04 2.754E-04 2.512E-01. 2.29lE-04 2A89E-D4 1.905E-04 l.TyLE-04 1.585E-04 l.U5E-04 1.318E-04 l.ZDtE-OC l.O96E-04 l.OODE-04 9.12OE-05 &318E-05 7.5&E-05 6.911-05 6.3loE-05 5.754E-05 5.24&-05 4.786E-05 4.365E-05 3.98lE-05 3.6318-05 3.3llE-05 3.02OE-05 2.754E-05 2.512E-05 2.2911-05 2.089E-05 1.9051-05 l.TyIE-05 1.58551-05 l.U5E-05 1.318E-05 l.ZOZE-05 l.D96e-05 l.DODE-05
. . . l.DODE-06
Netu. Lirn.
1 0. 0.
0.
3:: 109.
E: 421.
E: 962.
1087. 1324.
E: 4645.
Z: 4663. 4663. 4663.
2:
2:
Z:
2: 4663. 4663.
Z: 4663.
2: 4663.
Z:
2:
.Z:
E:
Z:
Z:
2:
2%
22: 4663.
Z:
Z: 4663. 4663.
4663. 0.
2
2
0.
1:: 60.
211.
ZS:
E: 897.
1123. 1309. 3946. 4026. 4082. 4194. 42n. 4352. UR. 4963. 5543. 5557. 5557. 5557. 5557. 5557. 5557. 5557. 5557. 5557. 5557. 5557. 5557. 5557. 5557.
5557. 5557. 5557. 5557. 5557. 5557. 5557. 5557. 5557. 5557. 5557. 5557. 5557. 5557. 5557. 5557. 5557. 5557. 5557. 5557. 5557. 5557. 5557. 5557.
5557. 0.
4 8 XDa 12 0. 0. Abv. Lim. 0. 0. 0. 9.120E-03 0.
24
8:
0. 0.
2::
14:: 217.
E: 59a. 758.
1005. 1259. 3232. 3397. 3542. 4303. 4467. 4505. 4711. 5020. 5451.
:zE: 5600. 5630. 5694. 5759. 6403. 6413. 6423. 6423. 6423. 6423. 6423.
2::
Z: 6423. 6423. 6423. 6423. 6423.
2::
2::
iEi: 6423.
2 6423.
2Z: 6423. 6623. 6423. 6423. 6423.
0. 0. 0.
:30: 90.
154.
iit: 497. 6n. 901.
1203. 2456. 3170. 3435. 4003. 4171. 4685. 4814. 5140. 5433. 5525. 5635. 605.1 . 6122. 62Db. 6288. 6697. 6735. 6751. 6795. 6816.
2%: 6905. 7361. RR. 7373. 7373.
FE:
E:
E:
Z:
Z:
Z:
El:
Z: 7313.
Z: 7373. 73x
2.512E-03 2.291E-03 2.089E-03 l.WSE-03 1.738E-03 1.5851-03 1.445E-03 l.318E-03 1.202E-03 l.D96E-03 l.OODE-03 9.1201-04 8.31&z-04 7.5&E-04 6.91&Z-04 6.3lDE-D4 5.754E-04 5.24&E-04 4.786E-04 4.3651-04 3.98lE-D4 3.63lE-D4 3.3111-04 3.020E-04 2.754E-04 2.5121-04 2.291E-04 2.0891-04 l.W5E-04 1.738E-04 1.5851-04 1.445E-04 1.31aE-04 1.2021-04 l.O96E-04 l.DDOE-04 P.ltOE-05 8.318E-05 7.586E-05 6.918E-05 6.310E-05 5.754E-05 5.24&Z-05 4.7%E-05 4.365E-05 3.98lE-05 3.63lE-05 3.3llE-05 3.02OE-05 2.754E-05 2.512E-05 2.29lE-05 2.089E-05 1.9058-05 l.Tu)E-05 1.585E-05 1.445E-05 1.318E-05 1.202E-05 1.0962-05 l&JOE-05
0. 0. 0. 0.
2::
C: 144.
E:
Z: 1013. 1752. 2390.
Z: 4055. 4425. cT57. 5141. 5385. 5650. 5664. 6132. 6335.
Z:
El: 7037. 7157. 7294. 7322. 7402. 7441. 74%. 7559.
Et: x78.
Rt:
E: 7918.
FE: 7922.
E: 7922. 7922.
Ef : 7922. 7922. 7922. 2922. 7922.
0.
Fl: 0. 0. 0. 0. 2.
17. 32. &.
141.
E: 590. 885.
1332. 1947.
ET: 4003. 4655. 5181.
Z: 6358. 6594. 6T16. 6988. 7125. 7289. 7428.
Z: n78.
E: 7994.
ZZ: 6110. 8127. 8160. 8184. 8i30. 8282. 8286.
Z: 6329.
:ii: 8334. 8420. 8425. 8425. 8425. 8425.
Z: 8425.
6423. n73. l.OOOE-06 7922. 8m. 0. 0. 011~. Lim. 0. 0.
0. 0. 0.
:: 0.
2
::
:: 0. 0.
3:: 1R. 419. 692.
1253.
Z: 45n. 55R. 6309.
Z: 7554. 7808. 8D34. 8174. 8243. 8318. 6371.
~30: 84417.
E: 8524. 8537. 8554. 8561. 856a. 8580.
16a 0. 0.
0. 0. 0. 0. 0.
8: 0.
::
:: 0.
:: 0.
1:: 319. RI.
1423. 2614. 4292. 5435. 6409. Rt9. 7662. 78%. 8066.
Et: 6430. IUR. 8513. 8563. a585. a5a9. 8592. 8595. 8599.
E: 86oa. 8608. 86D8.
360 0. 0.
0. 0. 0. 0. 0. 0. 0.
X: 0.
8:
ii:
::
i: 34.
iit:
:iz: 5462. 6747. TI18. 0091. 8222.
Ei: 8436.
it:: 8436. 8436. 8436.
Et: 8436. 8436.
ii:: 6436. wl6. 8436. 8436. 8436.
E: 8436.
2::
Z: 8436. 8436. 8436. 0436. 8436. 8436. 8436.
8436. 0.
Ro :: x: ii: I: 0.
5:
8: 0.
8:
8:
8: 0.
32 979.
3723.
Z: 779D.
E: 8112. 8112. 8112. 8112. 8112. 8112. 8112. 8112. 8112. 8112. 8112. 0112. 8112. 8112. 8112. 8112. 8112. 8112. 8112. 8112. all2. 8112. 8112. 8112. 8112. 8112. 8112. 8112. 8112. 8112. 6112. 8112. 8112.
8112. 0.
Figure 17 ARCON cumulative frequency distribution file for example 1
As you look at the results in Figure 18 notice that there are a number of x/Q values that are below the lower limit of the x/Q bins. These values occur during light winds when the vertical velocity of the vent release is sufficiently large that release is treated as if it were from a stack.
NUREGER-6331 Rev. 1

ARCON
Height of lowr uird hat-t (B) = 10.0 Reigkt of rpper wind int-t Ca) = 92.1 Mid SpdJ ont*rad " rtors/cccond
vane rdmse Release hcioht (=I I 29.0 Suitding Area (a-2) I 1730.0 Effluent vertical velocity (I/s) = 5.00 Vent or stack flow (11-3/s) I 15.7G Vent or stack radius (9) I 1.00
Dirctim . . intake to source Idal = 083 Yind direction sector width Cd%0 = 9G Wind direction uindac tdco) I 038 - 121) Distmm to intake (I) . 18.0 Intake height (=I I 25.0 Terrain l lwation difference CD) = .O
anprt file - 0x2-%. log .xi_W.cfd
lliniu Yind sped mm I Surface ro&nas lcnpth M) I ::D bctor l waging constant . 4.0
Initial vrluc of rim V t .oG Initial value of sip z * .W
Expudod output for code eating noOts*lut.d
Total maker of hours of &ta processad = 6760 Nouw of missing data I 10 Nourr dirrtim in virdou t IT14 Now-s l lmted plu ul dir:in window = 714 Nowl of IalB UirKb I 750 Hours direction not in uindw or calm = 6226
DISlRlBUTIOU SMRY DATA BY AVERAGING INTERVAL AVER. PRR. WFSR LIM. MOE-D: l.WE-0: l.ODE-0: l.ODE-D(:
LDU LIM. l.DDE-06 l.DOE-06 l.OOE-D6 l.OOE-06 MovERAmGE 0.
IN RANGE 1643. 202:: 266:: 362:: RELWRANDE 167.
6% 552. 610.
ZERO 6940. 5513. 43%. TDYAL X/Or 8750. 6742. 8494. X NON ZERO 20.69 27.74 49.44
MOE-:: MOE-:: MOE-~ l.WEI: l.ODE~ l.OCE~ l.OOE-06 l.DDR-06 l.WE-06 l.DOE-06 l.DDE-06 l.WE-06
42: 52: 6458. 0. 8608. 0. 8436. 0. X112. 0.
3E 2E 114.
06:.
0. 0. 0. 0. 0. 0.
8737. 8716. 9a.M
wD8. 8436. 6112. 58.17 n.10 lw.w 1w.w 1w.w
95th PERGYYILE x/a vmm 1.94E-D3 1.93E-03 1.67E-03 1.76E-03 1.52R-03 1.1~~03 6.79E-OL S.LOE-04 4.28R-OL 3.2RE-04
95X X/P for standard l veragi!!S intorwh
0 to 2 hours l.OCE-03 2 to 8 hours 1.71E-03 6 to 24 hours 7.741-04 1to4dayr 5.3~~04 4to3odsyr 2.74E-04
ICURLY VALUE RANDR K4x X/P WIN X/R
CENTERLINE 9.59E-03 2.98E-31 SECTOR-AVERAGE 6.37E-03 6.9lE-32
WoluuL PRoGlull CCUPLEfIOl
Figure 18 ARCON results for example 2
NUREGKR-6331 Rev. 1 28

User’s Guide
2.5.3 Example 3 - Capped Vent Release
Repeat the problem in Example 2, except assume that the vent is capped. What changes occur as a result of the change in assumptions. 3 How much difference do you think the change in sssumptions makes in the 95th percentile XIQs. 3 You can check yourself by comparing the input and results sections of the log file shown in Figures 19 with the comparable file shown in Figures 18.
You should have set the vertical velocity to zero to represent the cspped vent. Did you? Did you change the names of the output files before you tried to rerun the problem?
As you look at the results in the log file, compare the number of xIQs for l-hour averages in Figures 18 and 19. There are no x/Qs within an order of magnitude of the bottom of the range of bins when the vent is capped. The number of x/Qs in the range of bins in Example 3 is larger than the number in and below the range in Example 2. The differences are the result of setting the vertical velocity of the effluent to zero in Example 3. When this is done, ARCON treats the vent release as a ground-level release.
Next notice that the 95th percentile XIQS in Example 3 are about a factor of 5 larger than those in Example 2. This difference in values illustrates the importance of checking on whether a vent is capped or not. Vents on the sides of structures that have horixontal flow should be treated the same as capped vents.
2.5.4 Example 4 - Stack Release
The fourth example is a stack release. In this example, a 65-m stack is located 210 m from the intake at a bearing of 284”. The diameter of the stack exit is 2 m, and the nominal flow is 3 1.4 m3/s. The air intake is 25 m above grade. Assume that there is no change in grade between the locations of the intake and stack. Use the meteorological data file, assuming that the wind tspeeds in the file are now given in miles per hour and the wind measurement heights are 10 and 63.9 m. Name the output files ex4-96.log and ex4-96.cfd.
In addition to demonstrating that the xIQs calculated for this type of scenario are significantly lower than for ground or vent releases, this example shows one set of conditions under which the 95th percentile, 2-hour average x/Q can exceed the l-hour average. The results in Figure 20 show that the 95th percentile l-hour x/Q is 2.08 x lo” s/m3 and that the 2-hour value is 1.53 x lo” s/m3. The total x/Qs line in Figure 20 shows that 8750 XIQS were considered in calculating the 95th percentile l-hour average x/Q, and 8742 were considered in calculating the ‘t-hour value. In both cases the 95th percentile x/Q is exceeded by about 437 values.
To verify the result that the l-hour value is lower than the 2-hour value is correct, look at the cumulative frequency distributions in Figure 21 which contains an excerpt from the output file ex4-96.cfd. The maximum l-hour x/Qs exceed the maximum 2-hour values as expected. But, the tail of the distribution is long and there is a small group of values in the tail. Reducing the highest values by 50 percent gives values that are still in the upper 5th percentile of the x/Q distribution. As a result the 95th percentile 2-hour average x/Q occurs at about 2.5 x IO5 s/m3, while the corresponding l-hour average at about 2.1 x lo-‘. Thus, it is apparent that the result is correct.
29 NUREGKR-6331 Rev. 1

ARCON
Mr of RetwroloSfc~l Data Files = 1 Roteomlogis~l Data File Nm
uq1e.XEl
Reightof lowr virdintrunt (91 = 10.0 llefgkt of y*rr uind instrunt Cm) = 92.1 Yind spmds mt*rsd l rtws/ucord
Ruflding Aml (m-2) Effluent wrtial wlocitv (1/s) Vane or stack flow (.-3/i) Van or stack mdiu Cm)
Dimtion . . intake to source tdeg) Mind dimctim sector width (Deb) blind dimetim win&u (dw) Distmce to intake CD) Int&P hcisht In) Termin election differare (RJ
.
I
.
.
.
.
I
.
I
.
I
29.0 1730.0
15% 1.00
a83
038 '0128 18.0 25.0
.D
&_W.log u3-%.cfd
Miniu Uind Speed (a/s) . .5 Surfwe roughness length (II) I .lO Sutor Awmging constmt I 4.0
Initbl wlue of rip y . .oo Initial wlw of siolu z I .W
Expuded output for co& testing not selected
TotAl rubcr of hours of data processed = a760 Now* of Riuirp data . 10 Yours dimction in ufndw Yours l hwted pluse w/ dir. in uindou :
1774 0
Hours of cPla minds I Nours direction me in uindou or cPla = 6z
DISTRIWTIW SIMARY DATA BY AVERAGING INTERVAL AVER. PER. l.OOE-0: l.WE-0: 4 a 12 24 96 LIPPER LIW.
168 l.DoE-01
360 l.WE-01 l-WE-01 l.WE-01 l.WR-01 l.OOE-01
LDU LIR. l.WE-05 l.WE-O5 l-WE-01 l.DoRZ
l.WE-05 l.OOE-05 l.WE-05 l.DOE-O5 l-WE-05 AsOVERAwE
IR RANGE 252::
t.WE-05
325::
l.WE-05
40::
l.WE-05
51;: 59;: Rsi: Id:
RELDURANCE 6222
82: 84:: ld:
354:: 2l5;: 0. 0. 0. 0.
ZERO 0.
TOTAL X/as a750. 0. 0.
%D8. XNDN ZERO
642 28.85
8112. 100.00 1w.w 1w.w
95th PERCRNTILE X/O VALUES l&E-02 9.89E-03 9.29E-03 8.69R-03 7.25E-03 5.57E-03 3.&E-03 2.99E-03 2.551-03 2.07E-03
95X x/a for sttird l winging interwls
0 to 2 hours l&E-02 2 to 8 hours 8.12E-03 Sto24hours b.OOE-03 1 to4days 3.03E-03 4 to 30 tier l&E-O3
HWRLY VALUE RANGE lux x/a WIN X/P
CENTERLINE 1.6lE-02 3.99E-03 SECTW-AVERAGE l.llE-02 2.56E-03
NORMAL PRDGRAN CCUPLETIW
Figrne 19 ARCON results for example 3
Note that if the stack were much closer to the intake in this problem, all of the predicted concentrations would be orders of magnitude smaller than they are in Figures 20 and 21. While it is likely that most of the concentrations would be near mro, there is a possibility that the concentrations experienced under light wind conditions could be much higher than predicted by
NUREGICR-6331 Rev. 1
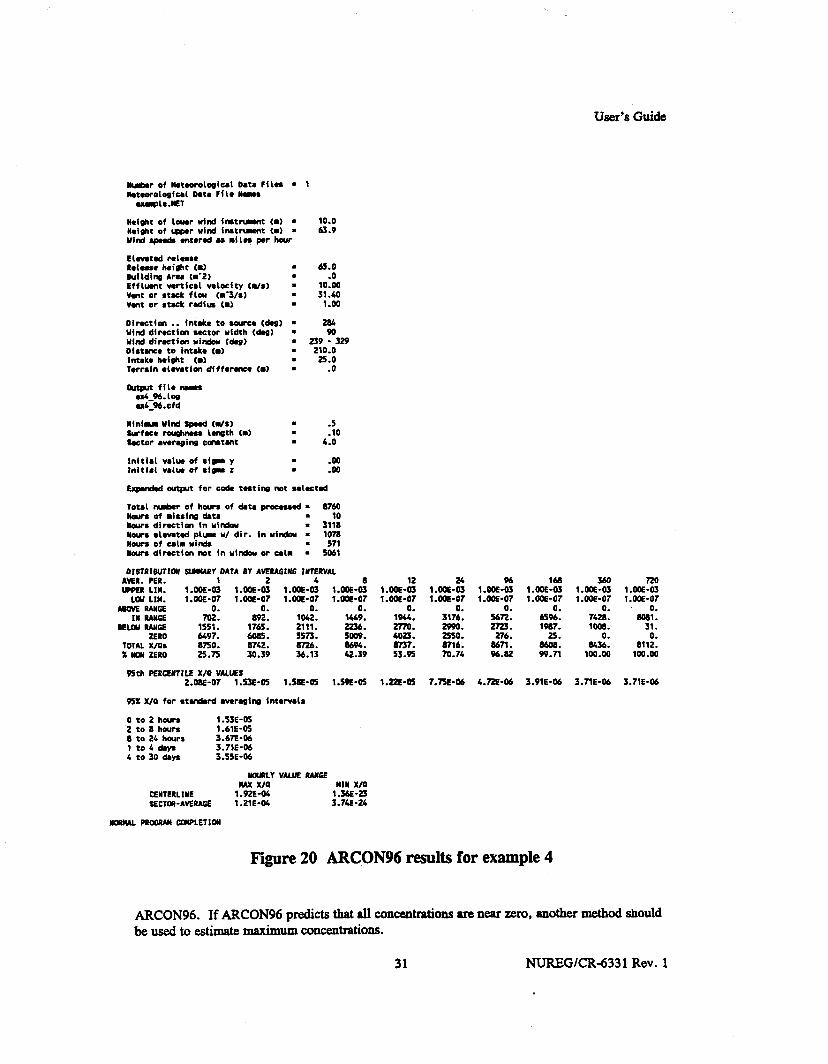
User’s Guide
Wr of Rotoomloaic~l Data Fila = 1 BW~ologiul Data File II-
uglO.)(ET
MigkCOf towrvind fnrtnmt(=) = 10.0 NeiSht of -r wind fnstmnmt (m) * 65.9 uind speed merod u kiln pr hour
Elmtad mlusa Rmlmse h8ight (W * 65.0 RUflding Ame (m-2) . .O Effluent wrtiaI WlOCity (US) = lo.w Vane or stack flw (a'3/sI . 31.40 Vent or stack rdirp CR) I 1.00
Diwtion . . ineke to wum* (des) = 2S4 Uind dirrtion sector uihh td#g) * Uird dimctiar window (MS) = 239:329 Dirtmce to Inuke (@ . 210.0 Intake h*i$%t (=) . 25.0 Termin l lmtion dfffe- W = .O
Riniu Uind Spnd (a/s) . Surfs* rolqhnu bnath (=) I ::o Sueor l wro&u eomtYIt . 4.0
Initial wlut of 8ip V . .W InitinI w1w of 8ior L t .W
-output for c&tqting rmts*kt~
Total nrbcr of hours of c*ta proc.uul = a760 Rows of 9iuinS dstr I ROWS dimction in uirdou = 3,:: Sours l lmtd plu U/ dir. in uirdon = 107S thurs of -1~ Minds . 571 Noum dimeion not in uindon or ula = 5061
DISTRIRUTIOY SUWRY DATA RY AVERAGING INTERVAL AVER. PER. 1 2 4 8 WPER LIR. l.ooE-03 l.OOE-03 l.wE-03 l.OOE-03
LW LIH. l.DOE-07 l.OOE-07 l.OOE-07 l.ooE-07 MWERANGE 0. 0.
III RNICE 702. 104:: 0.
1449. RELWRANGE 1551. 1::: 2111.
ZERO 6497. 6065. 5573. E: TOTAL X/as 8750. a742. X NDN ZERO 25.75 30.39
l.ODE-: l.DOE-07
0. 1%4.
E:
E%
l.OOE-$ l.WE-07
317::
22: R716. 70.74
l.mE-ii l.OOE-07
0.
i-2. 276:
S671. W-62
l.OORZ l-O@-07
0. 6596. 19S7.
25. 840& 94.71
l.ooEZ I.oz l.DOE-07 l.OaE-07
74;: 8Dk 1001). 31.
842: 811:: 1w.w lw.w
95th PERCRNTILE X/U VALUES 2.0&-07 1.53E-05 1.58-05 1.59E-05 I.~-05 7.7551-06 4.72R-06 3.9lE-06 3.7lE-06 3.7lE-06
95x x/a for sttird l wmglng int~rwls
OtoPhours l.S3E-D5 2toahoum 1.61E-05 8 to 24 hours 3.67E-06 1to4drys 3.7lE-W 4 to 30 dsys 3.55E-06
IWRLY VALUE RANGE w x/a RIR x/a
CENTERLINE 1.92E-04 l.%E-23 SECTDR-AVERAGE l.tlE-D4 3.74E-24
MRRAL PRWRAR CCWLETIOl
Figure 20 ARCON results for example 4
ARCON96. If ARCON predicts that all concentrations are near zero, another method should be used to estimate maximum concentrations.
31 NUREGKR-6331 Rev. 1

ARCON
R/P QWJUTIW FREWEYCI OlSTRIRUllolS ROD
Ak. Lim. . . .
2.089E-04 l.WSE-Oh l.naE-w 1.383E-04 l&SE-04 l.mE-04 1.202E-u 1.096E-04 l.OoOE-04 9.1208-05 8.318E-03 ?.3a6R-03 6.911-05 6.%OE-05 S.?S4E-OS 3.248R-OS L.?uE-03 4.36SE-OS 3.98lE-OS 3.631E-OS 3.311E-OS 3.020E-05 2.?S4E-05 2.312E-05 2.2911-05 2.089R-05 1.9OSE-03 l.R8E-03 l.S83E-05 l&SE-05 1.31RE-OS 1.202E-03 l&w-OS l.OOOE-OS 9.120~.06 8.31&-06 ?.!wE-06 6.91&-06 6.3%.06 3.?%E-06 3.248E-06 L?%E-06 4.363E-06 3.96lE-06 3.6311-06 3.3111-06 3.02OE-06 2.7SCE-96 2.312E-06 2.29lE-06 2.089E-06 1.9038-06 l.Zi&-06 1.38SE-06 1.443E-06 1.318E-06 1.202E-96 l.O96E-06 l.OOOE-06
I 0.
8: 6. 7..
1x:
:::
:;: 23. 29. 34. 33. 66.
1:;: 146. 189. 214.
2
;t : 311.
z: Z: 337. 367. 310. 378. u14. tit 410. 419. 420.
fit 427: 427. 429. 432. 432. 432. 432. 432. 432. 432. 432. 432. 432. 432. 432. b32. 432. 432.
2 0.
0.
::
:: 1. 1. 1. 1.
12. 12. 16. 22. 39. 46.
ii:
:3097: 171.
E: 262. 288.
E: 390. 413. 430.
2:
Z:
Z:
::: 332. 340.
E:
:::
:!I? 397. 600.
Z: 607.
2: 613. 613. 613. 613. 613. 613. 613.
0. 0. 0.
0": 0. 0. 0.
30: 4.
t : 11. 14.
i;: 65. 96.
116. 133. 191.
E: 300.
Z 389. 433. 461. 499. 3%. 368. 609. 637.
2:
Z: 714. 722. 13L. 738. 763.
FiTi
l%:
E
iit:: 868. 871. 874. 876.
iii: 8%.
8 ROD 12 24 0. Abv. Lb. 0. 0.
i: 0.
i: 0. 0.
::
ii: 0. 0. 0. 4. 8.
14.
E: 47. 39.
2: 138.
iii:
SE
Z: 303. 336.
E:
%:
Z: 868.
2 1040. 1067.
%: 1143. 1146. 1132. 1139. 1173. 1202. 1226. 1241. 12%. 1274. 1285. 1317. 1327. 1343.
2.on9E-04 1.9OSE-04 1.738E-04 1.38SE-94 l&SE-04 1.31&T-04 1.202E-04 1.09&z-OL l.OOOE-04 9.120~~05 8.311-05 ?.386E-03 6.91RE.05 6.31OR-05 3.7541-05 3.248E-OS 4.?86E-03 4.3631-05 3.9811-05 3.631E-03 3.3111-05 3.02OE-03 2.7541-03 2.312E-OS 2.291E-OS 2.089E-05 1.9051-95 l.?%E-03 l.S(lSE-03 1.443E-OS 1.311-05 1.202E-03 l.o96E-03 l.OwE-OS 9.12OE.W 8.318.G06 ?.386E-06 6.9l8E-06 6.3%.06 f.?%E-06 3.248E-06 c.?atz-06 CASE-06 3.981E-06 3.631E-06 3.311E-06 3.02OE-06 2.?SCE-06 2.312E-06 t.ZPlE-06 2.089E-a6 1.9oSE-06 1.73&Z-06 1.383E-06 1.445~~06 1.318.e06 1.202E-96 l.O96R-06 l.OOOE-06
:: 0.
8: 0. 0.
8:
:: 0. 0. 0. 0. 0. 0. 0.
1';:
::: 45. 37.
1::
iii:
E: 376.
2 MO. 639.
E 817. 8%.
1%: 1068. 1123. 1210. 1244. 1335. 1367. 1409. 1461. 1499. 1542. 1339. 1376. lf98. 1622. 1632. 1663.
E:
0. 0. 0. 0. 0. 0. 0. 0. 0. 0. 0. 0. 0. 0.
:: 0. 0.
8:
I:
X: 0.
::
:"I: 47. 78.
112. 163. 210. 293. 374. 4%.
2
Z: 1103. 1244. 1359. 1478. 1617. 1678. 1720. 1801. 1913. 2016. 2086. 216c. 2239. 2317. 2393. 2469.
Z: . . .
l.OOOE-07 702. 892. 1942. 1449. RClU. Lb. 1331. 1765. 2111. 2236.
l.oOaE-07 8elu. Lie.
3176. 2990.
% 0.
2 0.
t :
::
8: 0. 0. 0.
8:
::
X:
X:
z:
i: 0.
2 0. 0.
X:
8: 0.
:: 98.
:::
2 413. 331. 741.
1zli:
E: 1801. 2083.
E: 2533.
ii?:
E:
Z:
36R. 2?23.
168 360 RO 0. 0. 0.
0.
:: 0. 0.
0": 0. 0. 0.
8: 0. 0. 0.
x: 0.
8:
X: 0.
ii: 0. 0. 0. 0. 0. 0. 0. 0. 0. 0.
J:
12:
:z: 213. 303. 389. 606. 886.
1109. 1337. 1676. 2008. 2163. 2334. 2343.
iii!: 3220. 3313. 3479.
0.
8: 0.
X: 0.
8: 0. 0. 0. 0. 0. 0. 0. 0. 0. 0. 0. 0. 0. 0. 0. 0. 0. 0. 0. 0. 0. 0. 0. 0. 0. 0. 0.
8: 0. 0.
47. 183. 326. 370. 4%.
E: 1164. 1429. 1711. 2120. 2441.
Et: 3243. 3389. 3480. 3677. 3880.
0. 0. 0. 0. 0. 0. 0. 0. 0. 0. 0. 0. 0. 0. 0. 0.
i: 0. 0. 0.
0":
:: 0. 0. 0.
:: 0.
t : 0. 0. 0. 0.
X:
X: 0.
1::
Z:
1%: 1622. 1933. 2246. 2541. 2757.
3%:: 3431. 3769.
Et;:
8081. 31.
6396. 7428. WR?. 10011.
Figure 21 ARCON cumulative frequency distribution for example 4
NUREGKR-6331 Rev. 1 32

/
User’s Guide
2.5.5 Comparison of ARCON and ARCON Results
These first four examples for point sources are the same examples that were contained in NUREGKR-6331. These examples have been rerun using ARCON to show the effect that changing the averaging procedure has had on xlQ. Figure 22 compares the 95 95 x/Q for the two codes for each example. The x/Qs for the first two hours don’t change because the change in the averaging procedure only affects averaging periods longer than two hours. The maximum differences in 95 96 xIQs calculated with the two codes occur in averaging periods between two and eight hours. For intervals in this range centerline x/t& are averaged in ARCON96, whereas sector-average xIQs were averaged in ARCON95. The #Qs for longer than four days are nearly identical because the change in averaging procedure only affects a small fraction (< 10%) of the hourly x/Q values included in the average.
Table 1 shows the x/Qs for the standard averaging intervals used in NRC control room habitability assessments. Notice that the x/Qs for ARCON% for the Z-hour to &hour averaging period are about a factor of 2 higher than the corresponding values calculated using ARCON95. This result is consistent with the chsnge in averaging procedures. Also note that for averaging periods longer than 8 hours, ARCON% gives lower 95% xlQs thsn ARCON95. This result is also correct and is consistent with the change in averaging procedures.
Table 1 Comparison of ARCON and ARCON 95th percentile dQs for standard averaging intervals used in qontrol room habitability asxwnents
33 NUREG/CR-6331 Rev. I

lE-04
Y
lE-(
s
iti IE-
0)
1E
i 8
lE-02 ixamplr 2
-of. ARCONW t ARCON
Hours After Start of Release Hours After Start of Release
ixxrmplo 3 j
-EJ- ARCON95 -o- ARCON
_. ,. . .
‘-A a
b “-.Q
.A
___..__..._,..__._._..,.........,.............. . . . a&+
10 100
Hours After Start of Release
I
Y d 1004
lE-04
lE-OS
5s
s 8
1EoB
Exampla 4 i
-Dl 1
10 100
Hours After Start of Release
Figure 22 Comparison of ARCON and ARCON% 95th percentile ~Qs

User’s Guide
2.5.6 Example 5 - Multiple-Vent Release
Consider a release to the environment via a large open bay that is ve&ilakd by 12 vex&. Figure 23 shows a plan view of the roof. Note that there is air intake at the northwest comer of the roof. What is the relative atmospheric conce.ntration at the air intake if the release occurs in the bay? Assume that the meteorological data in the file a~ rep-tative of the site, that the wind ~~~9remadecltelevationsoflOand61meters,andthptthewindspeeds~meosured inmeterspersecond. Youmayalsoassume the height of the roof is 20 meters above ground level, the building area is 1500 m2. ‘he vests are 1 m above the roof, have a radius of O.Sm, andarecapped. Eachventhasaflowof5m3/s. Theintakeis3mabovetheroof. Thebearing and distance from the intake to thb 12 vmts are givex~ in Table 2.
ARCON was designed to calculate relative dispemicm u/Q) for releases from point sources. For example, there it has no problem calculating x/Qs from individual vents; x/Qs for the comer vents are included in Table 2. However, ARCON did not have an adequate method of estimating x/Q at the intake when the release occurs simultaneously from 2 or more of the vents. You might assume that the relative concentration at the intake is the average of the relative concentration for each of the v+s. However, the relative conce&ations reported by
Table 2 Vent pitiorrs and intake ~Qs for mult.ipIe-vent release scenario
H Vent 1 Bear. 1 Diat.
35 NUREG/CR-6331 Rev. 1

ARCON%
Virtual Area Source
I*
I 75 m A
I
Figure 23 Multiple-vent rekse vent location diagram
ARCON are points on concentration distributions, not actual concentrations. There is no assurance that the average of the 95th percentile individual x/Qs is the 95th pezentiie of the average x/Q.
An alternative approach to estimating x/Q at the intaJce is to assume that the release from the 12 vents acts as if the vents were an area source. ARCON% permits specification of initial diffusion coefficients. These coefficients may be used to define a virtual area source. Methods for determinin g the initial diffusion coefficients that define a virtual area source involve subjective decisions. The following discussion illustrates one way in which the initial’diffiion coefficients could be defined for this example.
NUREGICR-6331 Rev. 1 36

User’s Guide
Assume 1) the area covered by the virtual area source is equal to the PM of the rectangle formed by joining the centers of vents 1,4,9, and 12,
2) the center of the virtual ares source is at the center of the rectangle. The distance between vent centers is 15 m.
The bearing and.distance to the center of the virtual area source, Al, are given in Table 2.
To determine the characteristics of the area source we start by calculating its radius, r,. The radius of the ares source is
xr*’ = 30x45 = 1350m2
f A = 20.73m (1)
A virtual ares source with radius r, is shown in Figure 23.
Next, we estimate the initial horizontal diffusion coefficient from the radius. In a Gaussian distribution, approximately 99% of the ares under the curve is within f2.15 u of the center. On this basis, the edge of plumes have frequently been assumed to be 2.15 uY from the center, where o, is a horizontal diffusion coefficient. Therefore, we assume that the initial diffusion coefficient for the virtual area source u, is
u = r, I 2.15 ” = 9.64m
(2)
For the initial vertical diffusion coefficient, Us, we note that the vents are 1 m above the roof and capped. On this basis we assume an initial vertical diffusion coefficient of 1 m.
The 95th percentile relative concentrations for this virtual source are shown in Table 2. In addition, the input data and results sections of the ARCON primary output file for this example are shown in Figure 24. Note that a stack radius of 10 m was entered. This is the upper limit of the range of acceptable values for stack radius. However, stack radius is only used for plume downwash calculations when the vertical velocity is greater than zero. If the vents had been uncapped, the radius and vertical velocity for an individual vent would be entered.
Other choices might he made for the ares source, particularly if there is more information about the nature of the bay area and air flow within the bay. For example, if there were partitions in the bay that made it likely that the release would occur from vents 1, 2,5, and 6, we might define an ares source using these vents. The A2 row in Table 2 above gives the bearing and distance to the center of this ares and the corresponding XIQS from ARCON%.
37 NUREGlCR-6331 Rev. 1

.
ARCON
* of 6oteoro106iu1 Data fibs = 1 Uteorolwiul Dots file wm
lkight of louer uird i-t-t Cm) = 10.0 lkight of wr ulnd inst-t (rn) = 61.0 wind sped mtorod ” msters/soood
vmt roleas. Roluso height Cm) . 21.0 6uildin6 Area (m-2) I 1560.0 Efflumt nrtiul wlotity (m/8) = .w Vmt or stack flow (m’3/s) I 60.00 Vent or stwk radiu Cm> I 10.00
Dirsctim . . fntako to sowco (dD6) = 147 Yind direction netor width Cdm) I 90 -. Yind diroctian uind#r (de61 I 102 - 192 Distance to intake (ml I Intoko height (rn) . ii:: Terrain l lmtion differno (m) = .o
Mpa fib - u50_96.106 uSQ6.cfd
mini- Uid Spood (us) . .5 Sufuo rowhmss Lwth (9) = -10 sector l veroging constnt I 4.0
Initial valus of si* y I 9.64 hitie vslu of sip 7, . 1.00
Espudd output for & testing not n1octad
Total m&or of hours of dsts procossod = 6766 Maws of missin &ta I Vows direction in uindw = 2lli: Hours l lmtsd plu u/ dir. in uindw = 0 Yaws of calm uinds t Sara direction not in uindw or ulm = 52:
DIRlRlMIQl -I DATA II AVERAC1RC IYTERVM AVER. PER. WfER LIW. lAOE-0: l.O06-o: WJE-2 1.666-4 t.alE-2 lAOE-z 1666-: 106Ez! 1 fxS% 1 OOEZ
Lou LIM. l.ooE-06 1.606-66 1.m.06 l.Oa+66 lAOE-07 l.QQ-07 1:OOE-07 1:066-07 1:OOE-07 lb07 AmvERARoE
Ill MNGE 274: 342: 434: 52 66910: 75:: 82 d: R43i: Sll? N3.w RAROE 596:: 524;: 432 0. 219: *12:: 0. 0. 0. 0.
PRO 9. 0. 0. 1oYAL x/as 8742. iit xllon2ERo
3Ei 39.96 ii% 64.I; Ei
sm. 67.14
ZiJ lizi 1Ei
611:: 100.00
95th ?SXCENlILE X/P VMllES (L.IJE-04 6.25E-Y 5.59E-04 5.OOE-04 C.OlE-a 2.605-04 l.X5E-04 1.69E-04 l.%E-04 l&E-04
95X x/p for standard wormgin intorvola
oto2hwra 6.138-64 2to6hours Z.LSE-64 6 to 24 hours 1.465-04 1to4dws lAoE-04 rto3odiys l.XSE-04
CEYTERLIXE SECYOR-AVERAOE
Ram1 VALW nAwiE tax x/a ml x/a
1.03E-03 2.12E-w 6.631-64 1.33E-U
YQWAL PRWRM CQIPLETIW
Figure 24 ARCON results for example 5
2.5.7 Example 6 - Diffuse Source Release
For the final example, consider the plant design shown in Figure 2!5. Now assume that an accident sequence at the plant results in releases from many openings on the southeast face of the
NUREGKR-6331 Rev. 1 38

User’s Guide
-I- SDm 1
-3Om II nf
containment in the shaded area shown in the Fide view. Assume a building area of 2000 m2, that thebearingfromthecon tainment building wall to the intake is 240”. and that the average distance from the wall to the intake is 45 m. The m&orological data in EXAMPLEMET were obtained at a representative location using wind instruments at 10 and 62 m above ground. The wind speeds are in meters per second. What are the 95% x/Qs for aswsing control room habitability? Note that assumptions leading to estimates of the initial diffusion coefficients have been left to you.
One possible solution for this example is to make the following assumptions:
1) the source is a vertical area source (note that the previous example assumed a ho&n&d area source)
2) the release height is at the roof level
3) the initial vertical diffusion coefficient is l/2 of the height of the exposed area (5 m)
4) the effective width of the prea source is equal to the radius of the containment building (15 m) and that the initial horizontal diffusion coefficient is this width divided by 4.3
5) the intake height is 1.5 m above the roof.
39 NUREGKR-6331 Rev. 1

ARCON
With these assumptions ARCON calculates that the 95th percentile x/Q at the intake for 0 to 2 hours is l.l9e-3 s/m). The lbll input data and results sections from the primary output file for this example are shown in Figure 26.
RI&w of Motoor01ogiu1 oats ffla = 1 Iletsarolo6iul Data fit0 m
ExmfLE.MEl
Rei*t of Lowr mind int-t Cm) = 10.0 Wght of (qpr wind i-t-t (rn) = 62.0 Yird apnda sntorod 8s mtws/ncard
vmt r*l.uo Roloaao hoigkt (rn) m 20.0 6ufldinR Aror (m-2) = 2wo.o Effluent vorticsl velocity (W8) = A0 Vmt or stack flou (=-3/i) t Vmt or stwk rdiua (rn) . ::
Diroctim . . inteko to AourcR tde6) = Uind direction sector width (Deb) = Uind dirsctfon windor (de61 . Dfstmce to intake (m) I lntske height (rn) . lorrafn elevation dfffwanc~ (m) -
Y!zf z- ex6:96:ofd
sliniu Wnd Spwd (Us1 I Surfuo ramhnoss Len#h (m) . sector wor#ing comtmt I
240 90
1% - 2% 45.0 21.5
.O
50 4.0
InitiRl nlu of sigr y . InitiAL nlu of sim L I 5:;
Expondd output for code tosting not solepI
lots1 m&or of hours of datr procwod . SW Hours of missinS dsta I Noun diroctim in windon = 26: llourt l LMtd plu U/ dir. in win&m = Howr of calm vi& 1 Rouro dirsction not in uind~~ or aim I 5323
DISlRlMIW SUBWRY DATA 6Y AVXRAGIIIO WYERVAL AVRR. PER. WPER LIR.
Lw LIR. l.wE-06 l.wE-06 l.OOE-06 l.oQE-06 1.0%~06 r:OoE-06 MWERANGE 0. 0.
IN M&E 342;: 42 551:: &lo. m:: UK*. RELW RAR6E 53230: 4%;: 0. 0. 0. 0.
ZERO 3211. 2064. TQTAL x/as 6750. 6742. X yQ( ZERO 39.17 50.27 zzi
%94. E: 6?:: 76.24 63.45 92.35
95th PRRCERTILE X/O VALUES 1.1%~03 l.lR-03 1.18.63 l.IE-O3 6.7&W 6.7OE-04
95% X/R for stmdord l vw~6ing intomls
0t02houra 1.1%~03 Zto6hours 9.%E-04 6 to 24 hours 4.62E-04 1 to4dRys 3.5%~04 4to3odsys S.OSE-04
HalRLY VALUE RANGE MAX x/a WIN x/o
CEYTERLIRE 1.566-03 2.965-04 SECTOR-AVERAGE 9.79E-04 l .IE-04
MRML PRWiRAN EOrPLEllW
96 f6R 1 .wR-02 1 .ooE-02 l.wE-06 ~.ooE-06
%5;: S6li: 0. 0.
%k 0.
9934 lizi
4.3&-04 S.PlE-04 3.5OR-04 3.21E-O4
NUREGKR-6331 Rev. 1 40
Figure 26 ARCON results for example 6
l.wJE~ l.WE-06
0. s436.
0.
S42 1oo.w
moE~ l.wR-06
0. 6112.
0. 0.
6112. lw.w
Technical Basis
3 ARCON Technical Basis
The first part of this document is a User’s Guide to the ARCON% code. It provides basic information related to installation and operation of the ARCON% code. This part of the documentation covers the technical basis for the code. It provides the information needed to understand and apply the results of the ARCON% calculations. The last part of the document deals with the details of the computer code. It is intended for those who need to know about the organization of the code and the individual code module&
3.1 Conceptual Model
The basic diffusion model implemented in the ARCON% c&e is a straight-line Gaussian model that assumes the r&ase rate is constant for the entire period of release. This assumption is made to permit evaluation of potential effects of a&dental releases without having to specify a complete release sequence.
ARCON% permits evaluation of ground-level, vent, and elevated releases. Building wake effects are considered in the evaluation of relative concentrations from ground-level releases. Vent releases are treated as a mixed ground-level and elevated reiepse. The proportions of the mixture is determin ed by the ratio betwm the effluent vertical velocity and the release-height wind speed using the procedure included in the NRC XOQDOQ code (Sagendorf et al. 1982). Elevated releases are treated in the usual manner with correction for downwash and differences in terrain elevation between the stack and the control room intake.
Diffusion coefficients used in ARCON% have three components. The first component is the diffusion coefficient used in other NRC models, for example XOQDOQ (Sagendorf, et al. 1982) and PAVAN (Bander 1982). The other two components are corrections to account for enhanced dispersion under low wind speed conditions and in building wakes. Derivations of the low wind speed and building wake corrections are described by Ramsdell and Fosmire (1995).
Parameter values for the correction factors are based on analysis of diffusion data collected in various building wake diffusion experiments. The experiments were conducted under a wide range of meteorological conditions. However, a large number of experiments were conducted during low wind speeds, when wake effects are minimal. The wake correction model included in ARCON treats diffusion under these conditions much better than previous models. Thus, the diffusion coefficients in ARCON account for both low-wind speed meander and wake effects.
ARCON calculates relative concentrations using hourly meteorological data. It then combines the hourly averages to estimate concentrations for periods ranging in duration from 2 hours to 30 days. Wind direction is considered Ps the averages are formed. As a result, the averages account for persistence in both diffusion conditions and wind direction. Cumulative fiquency distributions are prepared from the average relative concentrations. Relative concentrations that are exceeded no more than five percent of the time (95th percentile relative concentrations) are determined from the cumulative frequency distributions for each averaging period. Finally, the relative concentrations for five standard averaging periods used in control room habitabjlity assessments are calculated from the 95th percentile relative concentrations.
41 NUREGICRd331 Rev. 1

ARCON%
The followiag s&ions deecribethemodel proceeses and componwts included in ARCON%. They also describe how the averagea are formed, and how missing data are M.
3.2 Diffusion Model
The ARCON% code implmts a straight-line Gaussian diffusion model. The basic model for a ground-level release is
(3)
x/Q’ = relative conceatrati~ (concentration divided by release rate) [(ci/m))/(ci/s)]
$9 0, = diffusion coefficiats (m) U = wind speed (m/s) Y = distance from the ce&er of the plume (m).
lllis equation assumes that the release is continuous, constant, aad of sufficient duration to establish a vtative mean conce&ation. It also afsumes that the material being released is nkted by the ground. Diffusion coefficients m typically determined from atmospheric stability and distance from the relesse point using empirical relationships. A diffusion coefficieat won from the NRC PAVAN (Bander 1982) and XGQDGQ (Sagendorf et al. 1982) codes is used for ur and a,.
The diffusion coefficients have the general form
0 = axb + c (4) whmxisthedistPncefromtherelessepoint,inmcters,Mda,b,oadcPre~~thPta~ h&ions of stability. The pammeWs aredefinedfor3distaaceranges-OtolOOm, lOOto 1000 m, and greater thsa 1000 m. The parame& values may be found in the listing of Subroutine NSIGMAl in Appendix A.
3.2.1 Diffusion Coeffcient Adjustments for Wakes and Low Wiid Speeds
To estimate diffusion in building wakes, composite wake diffusion coefficients, C, and C,, @ace uy and u,. The composite wake diffusion coefficients axe defined by
7. IL? Xy = (u; + Au;, + Au@)
2, = (u; + Au;, + A&In
where U, and U, are the mmnal diffusion coefficients, AU,, and Au,, are the low wind speed corrections, and Ati,, and Au, are the building wake conections. These corrections are described and evaluated in Ramsdell and Fosmire (1995). The form of the low wind speed corrections is
NUREGICR4331 Rev. 1 42

Techniutl Basis
Au;, = 9.13xlo’[l-(l+
AC& = 6.67xl@[l-(1 (6)
wherexisthedistnncefromthe~l~pointbthersoeptor,inmetefs,PndUisthewindspeed inmeterspersecwd. Itis~tousetheslsntMgedistPnceforx~~these correctionsonmpdeonly~therelePseisosmunsdtobeotgroundlevelPndthereceptoris sssumed to be on the axis of the plume. The diifusion coefficients corrections that account for enhanced diffusion in the wake have a similar form. Theee corm&ions are
Au; = 5.24~10-~U~A[l -(l +X)exp(-X)] w 1ofi
Au: = 1.17x10⁻²U2Ajl -(1 +z)exp(z)] 106 lo@
(7)
whenA is the cross-sectional area of the building.
An upper limit is placed on C, as a conser&ve measure. This limit is the standard deviation associated with a concentration uniformly distributed across a sector with width equal to the circumference of a circle with radius equal to the distance between the a source and receptor. This value is
2xx zymu=- @ 09
= 1.81x
The model described by Equations (3) through (7) is a replacement for the dispersion model in the control room habitability assessment procedure developed by Murphy and Campe (1974). Earlier building wake diffusion model studies conducted for the NRC (Ramsdell 1988, 1990) showed that the Murphy-Campe model did not predict the variations of the concentrations in the vicinity of buildings particularly well. The studies also showed that one of the primary reasons that the Murphy-Campe model did not predict concentration well was that it overpredicted concentrations during low wind speed conditions. The model described above overcomes the problems associated the Murphy-Campe model.
Figure 27 compares the relative concentration predictions of the two models as a function of wind speed for conditions that existed during diffusion experiments at seven reactor sites. The experiments are discussed in detail elsewhere (Ramsdell 1988, 1990). Figure 27 clearly shows that the primary differences in model predictions occur under low wind speed conditions. As a result, it is reasonable to assume that use of ARCON% in place of the Murphy-Campe model would have the greatest effect at reactor sites with low aventge wind speeds. At those sites the effect of changing models would be a general reduction in the relative concentrations used to evaluate control room concentrations resulting from postulated reactor accidents.
43 NUREGlCR-6331 Rev. 1

ARCON
lE+04 4 1E+03
Q x .
lE-03 1 _- .- 0 2 4 6 8 1u IL
Wiid Speed (m/s)
Figure 27 Murphy-Campe / ARCON concentration ratios by wind speed
Figure 28 compares the ratio of relative concentration predictions of the Murphy-Campe model to relative concentration predictions by the model in ARCON with relative concentrations observed in the field experiments. Ratios greater than one indicate that the Murphy-Campe model predicts higher concentrations than ARCON%, while ratios less than one indicate that ARCON predicts the higher concentrations. Data in the figure show that ARCON predicts some concentrations up to a factor of 2 higher than those predicted by the Murphy-Campe model. In contrast, there are numerous instances where ARCON% predicts concentrations that are more than a factor of 10 lower than the Murphy-Campe model predictions. The figure also shows that the tendency for ARCON to predict lower concentrations than the Murphy-Campe model is rather uniform across the full range of observed concentrations.
NUREGKR-6331 Rev. 1

Technical Basis
lEt03 0 2 . .
lE-08 1E-07 lE-06 lE-05 lE-04 lE-03 lE-02 lE-01
Observed x/Q
Figure 28 Murphy-Campe / ARCON concentration ratios by ohserved concentration
3.2.2 Sector-Average Diffusion Model
Equations (3) through (7) are appropriate for estimating relative concentrations for l-hour periods. A sector-average relative concentration model is used to estimate concentrations for periods after the initial O-8 hour period. The sector-average plume model is derived by integrating the concentration across the normal plume model to obtain a crosswind integrated concentration, CIC, which is
CIC - 1 -= s Q’ -- K~yczu
exp[-O.S(s)]dy z:
(9)
The relative concentration is then calculated by dividing CIC/Q’ by the width of the sector, W,
(10)
In most cases, the sector width is defined as the width of a 22.5” sector, which is a function of the distance downwind. This procedure works well except for small distances in unstable atmospheric conditions. In unstable atmospheric conditions the procedure gives sector average concentrations that are greater than the centerline concentration at small distances. This problem
45 NUREGKR-6331 Rev. 1

.
ARCON%
can be avoided by redefining the definition of the sector width. For the ARCON% code, the sector width is the larger of aI;., where a is a numerical constant with a value of 4, and XX/~, where x is the distance between source and receptor. The value of a is entered via the run specification file to permit use of values other than 4. The value of a is set in the Default Values form in the Visual Basic shell. Values in the range between 4 and 6 are reasonable. The default value of 4 was selected to be conservative. Approximately 95% of the material in a Gaussian plume is within f2 & of the plume axis.
To be consistent with the centerline model, and to be conservative, the sector width is limited to a maximum value. This maximum value is the circumference of a circle with a radius equal to the distance between the source and receptor, i.e.,
W *- = 2nx (11)
3.2.3 Elevated Release Diffusion Models
For elevated releases, the relative concentration is given by
x= l h -hi2
Q’ xuyu,u exp[-0.5($)2J exp[-0.5(-
u )I Y z
(U
where h. is the effect stack height and h is the height of the intake. Wake corrections are not made to diffusion coefficients used in calculating concentrations in elevated plumes. Effective stack height is determined from the actual stack height (4). the difference in terrain elevation between the stack and intake locations (t, - tJ, and stack downwash (AhJ by
he = h, + (‘, - ti) + Ah,
where the stack downwash is computed as
W
Ah, = 4rS[e U@,)
- 1.51 (14)
and r, is the radius of the stack, w, is the vertical velocity of the effluent, and U(h,) is the wind speed at stack height. A release is considered elevated if the actual stack heigbt is more than 2.5 times the height of stmctures in the immediate vicinity of the stack. Plume rise is not considered in calculating effective stack height in ARCON%. If consideration of pjume rise is desired, the plume rise must be calculated manually and added to the release height before the release height is entered;
The sector-average model is used in calculating relative concentrations for elevated releases for averaging periods longer than 8 hours. The sector-average plume model for elevated rel& may be derived in the same manner as the sector-average plume for ground-level releases. It is
II -h ‘)*I
uz (15)
Note that use of the elevated plume models may lead to unrealistically low concentrations at control room intakes. Near the bases of stacks, the highest concentrations are likely to occur
NUREGKR-6331 Rev. 1 46

Technical Basis
during low wind speed conditions when there may be reversals in the wind direction. If a control room intake is near a stack and the concentrations predicted at the control room intake are all extremely low, other models should be used to estimate potential control room intake concentrations during low wind speed conditions.
3.2.5 Vent Release Diffusion Model
ARCON% treats vent releases in addition to ground-level and elevated releases. A vent release is a release that takes place through a roof-top vent with.pn uncapped vertical opening. The treatment of these releases depends on the vertical velocity of the effluent and the wind speed at roof height. If the vertical velocity is more than 5 times the wind speed, the release is treated as an elevated release with a stack height equal to the height of the vent. If the vertical velocity is less than the wind speed, the release is treated as a ground-level release. Finally, if the vertical velocity is less than 5 times the wind speed but greater than the wind speed, the release is treated as a mixed-mode release based on the discussion in Regulatory Guide 1.111 (NRC 1977) and the implementation in XOQDOQ (Sagendorf et al. 1982).
The relative concentration for a mixed-mode release is a weighted average of the relative concentrations for elevated and ground-level releases. The weights for the mixed-mode release are determined as follows. An entrainment coefficient, E,, is determined for those hours when we/U is between one and five:
E, = 2.58 - 1.58(G) for 1 < 2s 1.5 (16)
E, = 0.3 - 0.06(G) for 1.5 C
The weight given to the concentration from the ground-level plume is E,, and the weight given to the elevated plume is 1 - E,.
3.2.6 Area Source Diffusion Model
The diffusion models incorporated in ARCON and ARCON are Gaussian models that assume that the release is from a point source. This assumption is reasonable for receptors (e.g. control room air intakes) that are “far downwind” from the release location. For area sources or a group of closely-spaced release points, “far downwind” may be defined in terms of a characteristic dimension associated with the source or combination of sources, although the selection of the characteristic dimension is subjective. For an area source the characteristic dimension could be the square root of the area. Similarly, for a group of closely-spaced release points, the characteristic dimension could be the radius of a circle that just encompasses the release points. If the distance between the source and the receptor is greater than about ten times the characteristic dimension of the source, a point source approximation is generally acceptable. If, however, the distance between the source and receptor is less than ten times the characteristic dimension, x/Qs calculated with point-source models will be too large because the models do not account for the finite dimensions of the source.
ln ARCON the only method available for treating finite sources is by specifying a release flow. A second method has been added in ARCON96. In ARCON you may specify initial
47 NUREG/CRd331 Rev. 1

.
ARCON%
horizontal and vertical diffusion coefficients that are related to the characteristic dimensions of a source. The kind of rationale used to estimate initial diffusion coefficients from the characteristic dimensions of a source is illustrated in the last two example problems. The area source adjustment is made to the point source diffusion coeKcients.
The ARCON% computer code uses the initial diffusion coefficients to determine the distance from the center of the real soutce to virtual point source located upwind of the real source. Rearranging equation (4), the distance from the virtual point soutce to the center of the area source (virtual distance, xJ is
(17)
where a, is the initial diffusion coefficient. Virtual distances are calculated for both horizontal and vertical diffusion. It is unlikely that these two distances will be the same. The distances used in calculating u, and (I, (the effective distances, u are the sums of actual distance and the virtual distances.
Initial diffusion coefficients are entered using the Default Values form. The Default Values form is accessed through the pulldown menu displayed when you click cm Input on the menu baratthetopofthescreen.
Clicking on Default on the Input menu will display the Default Values form.
The horizontal diffusion coeKcient is denoted as Sigma Y (a,), and Sigma Z (a,) is the vertical diffusion coefficient. The default value for both initial diffusion coeKcients is zero. The range of acceptable initial values for cry is 0 to 100 m, and the range of acceptable initial values for uI, is 0 to 50 m. Initial diffusion coeKcients muat be in meters.
3.3 Calm Winds
ARCON treats calm wind diffusion explicitly. The common derivation of the Gaussian plume model involves assumptions that eliminate the portion of the solution of the diffusion equation that describes diffusion when the wind speed approaches xero. An alternative, equally reasonable, derivation has been published by Frenkiel (1953). The basic assumptions in the derivation are that air motions do not cease even when the meen wind velocity approaches mro and that the diffusion coefficients are proportional to standard deviations of the wind fluctuations and the time following release. Frenkiel’s model is described by Kao (1984).
Concentrations calculated by Frenkiel’s model have a local minimum at U = 0. The concentration increases until it reaches a maximum at U = 1 m/s, and then it decreases as the U continues to increase. At high wind speeds, the concentration decreases proportional to l/U as in the usual formulation of the Gaussian plume model. The exact wind speed at which the maximum occurs is a function of distance between source and receptor. It occurs at lower speeds for small distances.
The diffusion model described by Equation (3) has approximately the same behavior at low wind speeds as the Frenkiel model when the low wind speed corrections given by Equation (6) are applied to the normal diffusion coefficients. Therefore, ARCON% uses Equation (3) with the low wind speed correction for calm wind conditions. Winds are defined aa calm when the wind
NUREG/CR-6331 Rev. 1 48

Technical Basis
speed falls below the minimum speed set in the Default Values form. This minimum speed is used for calculations when the winds speed are calm . This assumption yields concentrations that are within a few percent of the maximum for all distances.
Wind direction is not considered during calm winds. In all cases of calm winds the receptor is assumed to be directly downwind of the release point. This assumption should be conservative because it substitutes non-zero values of x/Q for values that would normally be zero if wind direction were considered.
Building wake is not a significant factor at low wind speeds.
3.4 Vent/Stack Flow
The diffusion equations presented in Sections 3.2 and 3.3 assume point sources. use of these equations to calculate concentrations at receptors nearshort stacks and vents can result in physically unreal concentration estimates. The concentrations calculated at the receptors can be higher than the concentrations in the stack or vent. ARCON% limits the concentrations at receptors by allowing the user to specify the volumetric flow through the stack. Given an initial concentration estimate calculated using the equations previously described, relative concentrations corrected for stack flow, are calculated as
(x/Q’)’ = i ’
XlQ’ +F
where (x/Q’)’ is the corrected relative concentration and F is the flow.
(18)
3.5 Exposure Window
In computing average relative concentrations at the intake, ARCON assumes that material travels directly from the release point to the intake if the wind direction is within a window specified by the user. The wind direction window is based on the direction from the intake to release point and the angular width of the window. The direction from the intake to the release point is specified as part of the normal user input. The width of the window is taken from the Default Values form. It may be changed if necessary. The default width of the window is 90” (i-45” from the line between the release point and the intake). The actual window width is lo wider than specified if the specified width is an even number and lo narrower if it is odd.
3.6 Averaging Methods
Average relative concentrations are computed as rumring mean values. Overlapping mean values are used in compiling the x/Q’ cumulative frequency distributions. For periods 8 hours or less in duration, the average is based entirely on x/Q’ calculated using the centerline model:
49 NUREG/CRB331 Rev. 1
ARCON
(19)
For longer periods, the averages include both centerline and se&or-average x/Q’s. They are calculated as:
3.7 Relative Concentrations for Standard Intervals
Standard Review Plan 6.4 (USNRC 1981) and various regulatory guides related to eatkation of ~ueaces of radionuclide releases following an accident require relative concentration e&mates for various periods following the start of release. ARCON% calculates ~~~~~trations for the following standard periods:.,0 to 2 hours, 2 to 8 hours, 8 to 24 hours, 1 to 4 days, and 4 to 30 days. These values are calculated from the 95th percentile average relative concuttmtions as follows. The larger of the l- and 2-hour average relative concentration is used for the O-to 2- hour period. Average relative concentrations for the 2- to 8-hour period are calculated as
X/Q/,(2~8hr) = 8xX/Q6,(0t08hr) - 2xX/Q~3(Oto2hr)
6lu (21)
where x/Q’&0 to 8 hr) and x/Q’&0 to 2 hr) are 95th percentile average values for 8 and 2 hours, respectively. The 6 hours in the denominator is the length of the averaging period. Relative concentrations fur the remainin gstandardpexiodsarecalcuiatedintheaamemanner.
3.8 Missing Data
ARCON uses time series of hourly meteorological data to properly account for the effects on wind direction persistence in reducing average relative concentrations for periods longer than 2 hours in duration. As a result, ARCON treats missing data by deleting hours with missing data from the calculation of the average relative concentrations used in determining the cumulative keqtency distributions. Missing data tolerance criteria are used to de&mine when the number of hours of missing data make a specific average relative concentration unacceptable. The criterion for averages of 8 hours or less is DXI missing data. For longer duration averagea, up to 10% missing data are acqted. Averages are not calculated for periods in which the number of hours of missing data exceed the tolerance criteria. The missing data tolerance criteria are set in the nm specification file. These criteria may be changed in the Default Value form.
The primary ARCON output contains a meteorological data summary and a summary of the relative concentrations by averaging intervals. These summaty tables permit calculation of the number of averages not computed because of missing data.
NUREGKR6331 Rev. 1 50

Technical Basis
Relative atmospheric concentrations (x/Qs’) that are exceeded no more than 5 5% of the time during a year are determined from complementary cumulative frequea~y distributions of the averagea for each averaging period. The basis for d e&mining these values is @he possible number of averages for the period minus the number of averages not available due to missing data. For example, assuming data for one year a~ being process& there are 8760 possible hourly x/Q’ values. The 95th percentile relative concentration is that concentration exceeded by 438 values. However, if 10% of the data were missing, the 95th percentile relative concentration would be that concentration that is exceeded by 394 values.
51 NUREGICR-6331 Rev. 1

Programmer’s Guide
4 Programmer’s Guide to ARCON
The first two parts of this document have dealt with ARCON% from the user’s perspective. They have provided the information needed to install and run the ARCON% program and to understand and apply the results for the program. This part of the document deals specifically with the ARCON computer code. It is intended for individuals who may be called upon to revise the code or place the code in a different shell.
4.1 General Computational Approach
ARCON% is implemented as a modular code. It includes three executable programs. Two of the programs are written in Visual Basic. They provide the shell program used for data input and permit ARCON to run one scenario after another without the user having to restart the program. The third program is written in FORTRAN. It performs ARCON96’s computational tasks. This part of the document deals with the FORTRAN code.
The ARCON FORTRAN code consists of a main program to control the program execution and 14 subroutines and functions to handle the data and perform the model calculations. Each program unit is coded using a structured approach.
4.2 Code Languages
The computational portion of ARCON is written in standard ANSI FORTRAN-77 programming language, with some extensions designed to enhance code maintenance and promote structured programming style. Specific extensions used include long variable names, IMPLICIT NONE, INCLUDE and SELECT CASE statements, the DO WHILE and END DO statements.
The user interface is written in Visual Basic to provide a user-friendly shell. A second Visual Basic program links the FORTRAN-77 code and the shell to reduce computer memory requirements.
4.3 Coding Standards
The following coding standards are followed in all ARCON FORTRAN program units.
The code for each program unit includes two blocks:
l definition block - the definition block includes the program unit name, history, description, and relationship to other units and include files. It may also contain references, algorithm descriptions, and variable definitions.
l code block - code and comments.
53 NUREGKR4331 Rev. 1

ARCON%
The code block in each FORTRAN program units begins with the statement IMPLICm NONE. The type and dimensions of all variables are de&d in type statements.
The primary method of passing variables between major program units is named common blocks. Common blocks contain related information, and the block name indicates the general nature of the information. The common blocks are defined in code segments contained in INCLUDE files. The INCLUDE files also contain PARAMETER statements, type definitions and dimensions associated with the variables defined in the file.
Argument lists are used to pass variables to subroutines and functions if use of a formal argument list facilitates program development, verification, and maintenance. Variables are passed to functions via argument lists. Common blocks are not used to pass information to functions.
Data statements used to define variables contained in common blocks are placed in a BLOCK DATA element. The BLOCK DATA element is included at the end of the file that contains the code for the main program.
The use of system dependent calls has been limited to two tasks. System calls in the ARCON% main program get the name of the run specification file (data input file) from the command line invoking program execution, and system subroutines are used to get the date and time of program execution from the system clock and the cpu time used for various program functions.
Structured programming techniques (IF . . . THEN, ELSE IF... THEN, DO WHILE) have been used, and the unnecessary use of statement numbers has been avoided. END DO statements have been used to decrease the number of statement numbers.
The ARCON% code aborts execution in the event that an abnormal condition is encountered during execution of the code. Traps have been provided for abnormal conditions related to file operations, data input, and data output. In general, the error messages are written to the console, to the log file, and to other output files to describe the abnormal condition causing code execution to be aborted. However, when the program is run in the Visual Basic shell, the error messages may be overwritten before they can be reed. If this happens, run ARCON% from the DOS command line by typing ARCON96F followed by the run specification file name.
4.4 Data Input
ARCON runs in a batch mode. User interactions and data input are via data files except for input of the name of the run specification file and a name for the file used for expanded output if needed. The name of the run specification file is entered as a command line argument at the time code execution is initiated. If expanded output is selected in the run specification file, a name for the file will be requested as soon as program execution begins.
The files used to enter the information required by ARCON% are described below.
NUREG1CR-6331 Rev. 1 54

Programmer’s Guide
4.4.1 Run Specification F.ile
User input to the model for the purpose of program control is via a run specification file. The information included in the run specification file includes but is not limited to:
l run identification 0 model option controls 9 input data file names
In aormal operation, the run specification fiIe is created by the Visual Basic shell. It is an ASCII text file that can be modified in the Visual &sic ahell or in a text editor.
The run specification file consists of 24 records if there is one meteorological data file. Each additional meteorological data tile adds another record. The fommt for the nm specification file is shown in Figure 29. The text on the right of the exclamation points is not part of a normal run specification file. It has been added to provide a brief explanation of the infomration being passed in the record. The format use to read the record is shown in parentheses at the end of the text.
1 ExAMPLEJET 10.0 53.4 1 1 1.0 627.0 0.0
:-ii 261 90 75. 0.0 0.0 ARCW%.LOR ARCDR%.CFD
1: 4.0 1 2 4 8 12 24 96 168360720 1 2 4 8 1122 87152324668 0.00 0.00 n
! d of Met data files (i5) ! Met data file nmtes (a40) ! louer measurement height (f10.0) ! upper measurement height (flO.0) ! wind speed units type (iSI ! release type fi5) ! release height (f10.D) ! buildirq area (flO.0) ! effluent vertical velocity ff10.0) ! sttck or vent flow (f10.0) ! steck or vtnt redius (f10.0) ! direction to source and window (2i5) ! distance from to rtceptor (f10.0) ! intakt heipht (f10.0) I grade elevation difftrence (flO.0) ! primary output file name (i&O) ! cfd file nsms (a40) ! surface roughness length (flO.O) ! minisun wind speed (calm) (f10.0) ! tverepinR sector width const (flO.0) ! hours in avereges (lOi4) ! minimun t of hours flOi4) ! initial 0 and 0 (2f10.0) ! flag for &an&J outprt (a)
Figure 29 Anndated run specification file
4.4.2 Meteorological Data Files
ARCON uses information contained in meteorological data files. The name/names of one or more meteorological data files must be passed to the program via the run specification file.
55 NUREGKR-6331 Rev. 1

The meteorological data file must have one record per hour. Each record must include the day of the year, the hour of the day, the stability, and the wind direction and wind speed at the lower measurement level. The record may also include a five-character location identifier, and a wind direction and speed for the upper level. The fotmat for the records is:
(lx, A5, 3x, 13,12,2x, 13,14, lx, 12,2x, 13,14).
The order of information in the record is location identifier, Julian day, hour of the day, lower- level wind direction, lower wind speed, stability class, upper wind direction, and upper wind speed. Julian day is the day of the year and ranges from 1 to 366. The hour is entered using a 24-hour clock with midnight being entered as hour 0.
Wind directions are entered in degrees. A north wind (wind from the north) is entered as 360”) andasouthwindisenteredas 180”. unit without the decimal.
Wind speeds are entered to the neareat tenth of a reporting A wind speed of 5.3 m/s would be entered as 53, while a speed of 5
m/s would be entered as 50.
Atmospheric stability is entered as a number from 1 through 7. A stability class of 1 represents extremely unstable conditions, and a stability class of 7 represents extremely stable conditions. Any other number will be interpretiSas missing data.
4.5 Model Output
Normal ARCON output consists of two files. The first file is a run log. documents the ARCON run and is the primary output file.
The run log It includes the program name and
version number, appropriate disclaimers, the date and time of program execution (taken from the computer clock), a listing of the data entered via the nm specification file, summary statistics related to the relative concentration calculations and the cumulative frequency distributions. ‘Ihe second file contains a heading record and the relative con~tration cumulative frequency distributions. The primary output file is described in detail and examples of the log and cumulative distribution files are shown in the User’s Guide.
When expanded output is selected in the run specification file, ARCON will create a third output file. This file contains information that may be used for code trouble-shooting and code verification. The expanded output file is called the QA-file in the program. It includea the following information:
a values for scenario-dependent parameters calculated during program initialization
0 a listing of the meteorological data read by the program
l a listing of the hourly centerline and sector-average x/Qs calculated by the program along with the meteorological data used in the calculations
l frequency distributions for each of the averaging periods.
Consequently, the size of the expanded output file can become large. It approaches one megabyte when the meteorological data file contains data for a full year.
NUREGKR-6331 Rev. 1 56

Progmmmr’s Guide
4.6 Program Description
The ARCON% code consists of three executable programs. Two of these programs, ARCONVB and ARCONVBZ are primarily used for user input and to permit users to run several scenarios in rapid succession without having to restart the program. The third executable program, ARCON%F, does the calculations. Figure 30 shows the interactions among the programs.
Figure 31 shows the same organization but emphasize the progrpm functions rather than the program names. In addition, Figure 31 shows all three of the output filea. The breaks between the programs are shown by dashed lines.
The following sections describe the ARCON% FORTRAN code in detail. The main program and each of the subroutine and functions that comprise the code are discussed. Flow charts are provided for the main program and those program elements that calculate, process, and summa&e the x/Qs. Appendix A contains a listing of the FORTRAN code, and Appendix B is a glossary of variable used in more than one ARCON% program element.
Figure 30 ARCON% executable code organization
57 NUREGICR4331 Rev. 1

ARCON%
l?iiure 31 ARCON% executable code orgaukation by function
4.6.1 ARCON%
ARCON% is the main program. It provides the general framework for the code. ARCON% CQbItStllWpItS- an initialization section, main program section, and an end section. The initialization section determines the date and time of model execution and calls program elements used to initialize the code. The main section of the code controls the flow of the program as it reads meteorological data files, calculates hourly relative concentrations, combines the hourly concentrations into averages for longer periods, and stores the results of these calculations in frequency distributions. The end section of the program summarixes the results of the calculations when all meteorological data have been processed and writes the results of the calculations to the log and cumulative fresuency distribution files. When the results have been written to these files, the end section writes a message indicating nonnsl model termination in the log file, and closes files, as appropriate.
Figure 32 shows the logical organivrtion of ARCON% FORTRAN code. The initialixatiou section of the program is shown at the top of the flow chart. The main section of the program starts with reading the meteorological data and ends when all meteorological data have been read and process&. When there are no more data to be proces4, the program enters its final phase. Here the cumulative frequency distributions and 95th percentile xlQs are calculated and written to the output files. This flow chart also shows which portions of the program write to each of the files.
NUREGKR-6331 Rev. 1 58

Programmer’s Guide
/-- / \ I \ ( Mat*12 p-
\ / I CYRmexrol --- \ -0i -
I /--
/ \ I \ 1
( Net.Msl3 p-J . 1
\ I \ -i- AvanQmMTti
ucumumnn- ---
Fii 32 ARCON% FORTRAN code organization
The organization of the program elements in tbe FORTRAN code is shown in Figure 33. Each rectangular box in the figure represents a subroutine or function. The flow of information in the code can be followed by noting the arrows. The single-headed arrows are generally associated with subroutines and functions called directly from the ARCON code. The two-headed arrows show calls to subroutines and functions that are not called directly by ARCON%.
Data transfer in ARCON is generally by named common blocks. These blocks are found in sections of code that are maintained separately in what are called “include files. ” These files are incorporated in the main program and subroutines when the program elements are compiled. Five “include files” are part of ARCON96. Each of these files contains information related to a specific area of the code. For example, the METJNC file contains the meteorological data and associated information. Similarly, the SCENARIOINC file contains information on the release point/receptor geometry, and the XOQJNC file contains information related to x/Qs. In contrast, the PARAM.INC and UNITS.INC files are directly related to the code operations.
59 NUREG/CR-6331 Rev. I

ARCON%
SCENREAD Q 4
RECORD
I-
NSlGMAl c 1
-P INIT
INVMOL2 * 1 I
1
METREAD Q rn NSlGMAl
4 7 I-
XOQCALCS - WINDYXOQ +3- CURVEFIX
“il WAKECORR
SUMMARY
SHIFT XOQ95
,
,Figure 33 ARCON% program element organization
The PARAM.INC file contams the parameters that limit the number of hours of meteorological data that can be stored within the program and the number of meteorological data files that can be processed in any nut. These pammeters are used as dimensions for arrays. The UNITSJNC file contains the variables that store file names and the logical unit assigned to each of the files. Table 3 shows the program elements and the “include files” that are incorporated in each element.
4.6.2 Subroutine CURVEF’IX
Subroutine CURVEFIX calculates low-wind speed corrections to the diffusion coefficients used in the PAVAN (Bander 1982) and XOQDOQ (Sagendorf et al. 1982) programs. These corrections, which are described in Section 3.2, are functions only of distance and wind speed. Ramsdell and Fosmire (1995) present a detailed derivation and evaluation of the equations used to calculate the correction factors.
NUREGKRd331 Rev. 1 60

Programmer’s Guide
Table 3 Relationship between INCLUDE blocks and program @lem~~W
WINDYXOQ
XOQCALCS xxx xxx xxx xxx
xoQ95 xxx xxx L
4.6.3 Subroutine INIT
Subroutine INlT calculates several model parameters that are depend only on the scenario. These parameters include the standard NRC diffusion coefficients and factors that adjust the measured wind speeds to a standard lo-meter measurement height and the release height. The standard NRC diffusion curves are functions of stability class and the distance between the release point and the intake.
The wind speed adjustment factors are based on the diabatic wind profiles (Panofsky and Dutton 1984). They are functions of the wind speed measurement heights, the stability class, and the surface roughness at the site. The surface roughness is one of the model parameters that may be changed using the Default Values form. Its default value is 0.1 meter.
61 NUREGICR-6331 Rev. 1

ARCON
If the expanded output option is selected, subroutine INIT will write the diffusion coefficients and the wind speed adjustment factors to the quality assurance file.
4.6.4 Function UWMOL2
Function INVMOL2 converts the stability class to the reciprocal of the Monin-Obukbov length that is used in the diabatic wind profiles. The conversion is based on Figure 5 in a paper by Golder (1972). This figure, which is based on analysis of experimental data, shows Monin- Obukhov length ranges as a function of stability clpss and surface roughness length. Function INVMOL2 is based on a function by the same name in the RATCHET computer code (Ramsdell et al. 1994) that includes vcertainty in the conversion process.
4.6.5 Subroutine METREAD
Subroutine METREAD reads the meteorological data file one record at a time and places tbe input data in the meteorological data vectors. The requited meteorological data format is described in Section 4.4.2.
The data are read in a loop that is terminated when either 1) there are 10,O hours of data in the vector, or the subroutine reaches the end of the last meteorological data file. If the subroutine reaches the end of a data tile before it reaches 10,000 hours, it closes the file and increments the variable NExT_MET by one. If NEXT-MET doesn’t exceed the total number of meteorological data files, the subroutine opens the next file and continues reading data. If NEXT-MET exceeds the number of data files, the subroutine sets the logical flag END-MET to -TRUE. and places the index of the last data record in the variable LAST-MET.
As the meteorological data are read, the data are checked to ensure that each value is within the appropriate range. The ranges are:
o Stability class 1 through 7 l Wind directions 001’ through 360” l Wind speed 000 through 750.
Recall that wind speeds are entered in tenths of the measurement unit. If an out-of-range value is detected, 99 is used to indicate an invaiid stability class, 999 is used to indicate an invalid wind direction, and 9999 is used indicate an invalid wind speed. If expanded output has been selected, MET-READ will write each input record to the quality assurance file. In addition, every 100 hours subroutine MET-READ writes the hour of the year to the screen.
4.6.6 Subroutine NSIGMAl
Subroutine NSIGMAl calculates the initial diffusion coefficients using the algorithms for approximating the Pasquill-Gifford diffusion coefficient curves (Gifford l%l) described by Martin and Tikvart (1968) and Tadmor and Gur (1969). These algorithms are the same as algorithms used in ,PAVAN (Bander 1982) and XOQDOQ (Sagendorf et al. 1982). Given a distance and stability class as input, the subroutine returns a horizontal diffusion coefficient (a,) and a vertical diffusion coefficient (a,).
NUREGKR-6331 Rev. 1 62
Programmer’s Guide
If initial values are entered for tbe diffusion coefficient, NSIGMAl will detetmine virtual distances associated with the initial values. The virtual distances for the horizontal and vertical diffusion coefficients may not be the same. NSIGMAl will then base its calculation of diffusion coefficients on effective distances, which are the sum of the actual and virtual distances.
4.6.7 Subroutine PROC
Subroutine PROC processes the hourly x/Q data. It is called after the meteorological data have been read and subroutine XOQCALC5 has calculated the hourly x/Q values. Subroutine PROC combines the hourly values into running mean values for averaging periods specified in the Default Values Form and accounts for the data in the x/Q frequency distributions. If, during any period there are too many missing hourly values, subroutine PROC discards the period.
Figure 34 shows the procedure followed in subroutine PROC. The first time that subroutine PROC is called it sets the range of bins for the cumulative frequency distribution. The upper limit to the range for the l-, 2-, 4-, and 8-hour average x/Qs is based on the maximum l-hour centerline x/Q encountered in the first 10,000 hours of data. The upper limit for longer period averages is based on the maximum sector-average xIQ.
The subroutine then steps through the hourly x/Q values and averaging periods. The procedure used to calculate the running mean x/Qs uses the current hourly x/Q and the oldest hourly x/Q included in the current average. If the current x/Q is good, it is added to a running sum and tbe counter associated with the sum is incremented. If there are sufficient good values in the sum, a new running mean is calculated and the value is counted in the appropriate frequency distribution bin. Next, the subroutine checks the oldest value. If it is good, the value is subtracted from the sum and the counter is decremented to prepare for processing the next hour.
4.6.8 Subroutine RECORD
Subroutine RECORD writes the information read from the run specification file by Subroutine SCENREAD to the primary output (log) file. In addition, the subroutine writes the lower and upper bounds for the wind direction window used to determine when effluent from the release point reaches the intake and the name of the expanded output file to the log file. Combined with Subroutine SCENREAD, Subroutine RECORD provides users with the opportunity to confirm that the scenario used in ARCON calculations is the intended scenario.
4.6.9 Subroutine SCENREAD
Subroutine SCENREAD reads the run specification file identified in the command line invoking the ARCON96F FORTRAN code. This file, which contains the user input to ARCON%, is described in detail in Section 4.4.1. In addition to reading the run specification file, the subroutine performs two functions. It calculates the lower and upper bounds of the wind direction window that determines when the plume reaches the intake, and it requests a file name for tbe expanded output file when expanded output is selected in the run specification file.
63 NUREGKR-6331 Rev. 1

ARCON%
Frgute 34 Subroutine PROC organization
4.6.10 Subroutine SHlFl’ Subroutine SHIFT is called when processing of available data is complete and there is more meteorological data. The subroutine determines the length in hours, n, of the longest averaging period. It then moves the stability, wind, and hourly x/Q data for the last n-l hours from the ends of the vectors containing these data to the beginning of the vectors.
After the data have been moved, the subroutine sets the variable FIRST-MET to n. FIRST:MET is the index of the meteorological data vectors where the first new meteorological data w111 be placed. FIRST-XOQ will be set to this value in subroutine XOQCALC5 after it completes calculating the hourly x/Q values.
NUREGKR4331 Rev. 1 64

Programmer’s Guide
4.6.11 Subroutine SUMMARY
Subroutine SUMMARY is the primary output routine for ARCON%. It is called after all meteorological data have been read and after all hourly x/Qs have been calculated and processed. Then, subroutine SUMMARY calculates totals and writes summary statistics to the log file. If expanded output has been selected, subroutine SUMMARY writes the x/Q frequency distributions to the quality assurance file. It calculates the cumulative frequency distributions and writes them to the cumulative frequency distribution file.
After the cumulative frequency distributions have been written, subroutine SUMMARY calls subroutine XOQ95, which calculates the x/Q for each averaging period that is exceeded no more than 5 percent of the time. These 95th percentile x/Qs are written to the log file by subroutine SUMMARY. The last section of subroutine SUMMARY calculates the 95th percentile x/Qs for standard averaging intervals, e.g., 2 to 8 hours and 8 to 24 hours.
Figure 35 shows a flow chart for subroutine SUMMARY.
I- Calculate totals I
Calculate and write CUfllUlSdV@ cumulatiie frequency -, frequency file
distribution
n”71 Call XOCi95
1 Calculate and write
XJQ for standard periods
I
Figure 35 Subroutine SUMMARY organization
65 NUREGICR-6331 Rev. 1

ARCON
4.6.12 Subroutine WAKECORR
Subroutine WAKECORR calculates the building-wake corrections to the diffusion coefficients calculated by subroutine NSIGMAl. The corrections are functions of the building cross- sectional area, wind speed, and distance from the release point to the receptor. These corrections are described in Section 3.2. Ramsdell and Fosmire (1995) present a detailed derivation of the equations used to calculate the corrections.
4.6.13 Subroutine WINDYXOQ
Subroutine WINDYXOQ is used to calculate the hourly centerline and sector-average x/Qs. When the wind is less than the minimum wind speed sot in the Default Values form, the subroutine is called with the minimum wind speed regardless of wind direction. When the wind speed is greater than the minimum speed, the subroutine is called only if the wind direction falls within the wind direction window. In this case, the lOmeter wind is used if the release is at ground level (5 10 meters) and the release-height wind is used if the release is at a height greater than 10 meters.
The argument list for subroutine WINDYXOQ includes all of the parameters that define the release point, the release point-receptor geometry, and the meteorological conditions. It also includes the release type definition supplied by the user in the Source Input form. This type of definition is specified by the value of the variable rtype. It is 1 for ground-level releases, 2 for vent releases, and 3 for stack releases.
Figure 36 shows the process followed in subroutine WINDYXOQ. If rtype is two or greater the x/Q for a stack release is calculated, and if it is two or less, the x/Q is calculated for a ground- level release.
Celculate XlQ for ebmted rekese
Celwlrte XIQ for
Combine X0 fur
Figure 36 Subroutine WINDYXOQ organization
NUREGER-6331 Rev. 1 66
Programmer’s Guide
If rtype is two, the x/Q is calculated for both an elevated release and a ground-level release. The two x/Q values are combined to get a single value using the methodology for mixed-mode releases described in Section 3.2. This methodology follows the procedure described in Regulatory Guide 1.111 (NRC 1977) and implemented in the XGQDGQ computer code (Sagendorf et al. 1982).
4.6.14 Subroutine XOQCALC5
Subroutine XGQCALCS processes the hourly meteorological data. It is called by ARCON following subroutine MET-READ. When aubrouti.ne XGQCALCS is celled, it steps through the meteorological date an hour at a time from the hour specified in the variable FIRST-MET to the hour specified in LAST-MET. The first time subroutine WINDYXGQ is called, FIRST MET will be 1, in all subsequent calls FIRST-MET will be equal to the longest avera&g period defined in the Default Values form. LAST-MET will be 10,WO until the last meteorological data file is read. Then it will have a value +z 10,000 that is the index of the end of the meteorological data mad from the last meteorological data file.
Figure 37 shows the procedure followed as subroutine XGQCALCS processes the meteorological data. First the subroutine checks the stability class. If the stability class is missing, the subroutine cannot calculate a x/Q. Consequently, the subroutine sets both the centerline and sector-average x/Qs to -1.0 to indicate missing values. Next, the subroutine checks to see if both wind speeds are missing. If they are, the x/Qs are set to -1.0. If either wind speed is present, the lo-meter and release-height wind speeds are calculated.
The subroutine then checks for calm winds. If the wind is less than the minimum wind speed set in the Default Values form, subroutine WINDYXGQ is called with the minimum speed as the wind speed. In this case the wind direction is not checked because the effluent is assumed to drift from the release point to the receptor regardless of wind direction.
Finally, if the wind is not calm, the subroutine checks the wind direction. If both wind directions are missing, the x/Qs are set to -1.0. When the wind direction entry appears valid, the direction is compared with the wind direction window that contains the wind directions assumed to carry the effluent from the release point to the receptor. If the wind direction is not in the window, the x/Qs are set to 0.0. otherwise, subroutine XGQCALCS calls subroutine WINDYXGQ to calculate the hourly x/Qs.
After all hourly x/Qs have been calculated, subroutine XGQCALC5 updates the record of maximum hourly values. These values are used to set the range of bins for the x/Q frequency distributions the first time subroutine PROC is called, and the final values are written to the log file. The last task performed by subroutine XGQCALC5 prior to returning to the main program is to set the values of FIRST-XOQ, LAST-XGQ, and TOT-XGQ.
67 NUREGICR-6331 Rev. 1

ARCON%
Figure 37 Subroutine XOQCALCS organization
4.6.15 Subroutine XOQ95
Subroutine XOQ95 calculates the 95th perceatile x/Q for each averaging period. The subroutine starts by checking the number of averages calculated for each period. If fewer than 20 averages were calculated, the subroutine sets the 95th percentile value to 0.0 and skips further calculations.
When the number of averages is sufficient to permit calculation of the 95th percentile value, the subroutine calculates the number of hours represented by five penxmt of the total number of averages. It then searches the cumulative fkquency distribution bitts to find the bin containing the 95th percentile x/Q. The 95th percentile x/Q can not he determined if this bin is the bin used to bunt the number of values above the range of the cumulative freq~y distribution. In this case, the 95th percentile x/Q is set to -99999. If the 95th prcentiIe x/Q is in the bin that is
NUREGKR-6331 Rev. 1 68
Programmer’s Guide
4.7 Quality Assurance
used to count the number of values below the range, the 95th percentile x/Q is set to the lower bound of the range. Finally, if the 95th percentile x/Q falls in a bin within the cumulative frequency distribution range, the 95th percentile x/Q is calculated by linear interpolation between the upper and lower bounds of the bin.
ARCON was developed and tested in accordance with the requirements of ANSI/ASME NQA-1, 1986 edition (ASME 1986). Quulity Assuranm Program Requirements for Nuclear Fucilitics, as interpreted by the PNNL Quality Assurance (QA) Program. PNNL QA procedures have been used to determine specific Quality Assurance requirements. In addition to the use of the prog ramming standards listed above the following measures undertaken to ensure program quality:
Individual program elements that perform calculations have been tested independently. The tests include hand checks of representative calculations. The functioning of these elements was then rechecked in conjunction with tests of other program elements when ARCON was run.
Program elements involved in data input were checked by writing input data to output files and comparing the data in the input and output files. This process also checked the storage and transfer of input data within ARCON95.
A series of test cases were run using the full ARCON code. These test cases exercised the range of program options. Input and output files for each of the test cases were examined for accuracy and consistency.
The code was placed under configuration control at the beginning of the developer’s code tests. Changes in the code during the tests are logged in the code of the program element changed.
Following completion of the ARCON code and a draft of this manual, an independent review was conducted. This review included examination of the design specification for ARCON95, the ARCON code, the records of the code tests by the developer, and this manual. No coding errors were identified during the review. This user’s guide has been revised based on the reviewer’s comments.
The ARCON code included a disclaimer during development that stated that the code had not completed quality assurance tests. This disclaimer and the date of the code version were written to the ARCON log until the quality assurance tests were completed. The disclaimer was removed from the output and the ARCON code was recompiled with a version date and time of April 1, 1995, 7:00 am.
The files distributed as part of Version 1.0 of ARCON have all been given an Aptil 1, 1995 date and a 7:00 a.m. time.
Following the code modifications leading to ARCON96, the example problems in NUREGKR- 6331 were rerun. In each case the I- and 2-hour XIQS calculated by ARCON were the same as those calculated by ARCON95. In addition, the 95th percentile 4- and R-hour average XIQS
69 NUREGKR-6331 Rev. 1

ARCON% for examples 1 and 4 calculated by ARCOM% were a factor of 1.6 larger than those calculated by ARCON95. Given equations (3) and (10) and equations (12) and (15) and the default assumptions in ARCON%, the ratios of centerline concentrations to sector-average concentrations should be 1.6. Further, the variation of the ratios between ARCON% and ARCON 95th percentile concentrations decreases to 1.0 as expected as the averaging period incneses beyond 8 hours. This behavior demonstrates that the changes in the averaging method in ARCON were implemented correctly.
The implementation of the area source algorithm was tested initially by checking the virtual distance and diffusion coefficent computations in subroutine NSIGMAl . It was further tested by checking the computation of hourly values of x/Q. The results of these checks demonstrate that the area source algorithm is correct.
ARCON% Version 1.0 has a version date and time of August 1, 1996, 12~00 pm. All files distributed as part of ARCON% Version 1.0 have this date and time.
NUREGKR-6331 Rev. 1 70

References
5 References
ASME. 1986. Quality Assurance Program Requirements for Nuclear Facilities. ANSIJASME NQAl, American Society of Mechanical Engineers.
Bander, T. J. 1982. PAVAN: An Atmospheric Dispersion Program for Evaluating Design Basis Accidental Rekases of Radioactive Materials f?om Nuckar Power Stations. NUREGICR-2858. U.S. Nuclear Regulatory Commission, Washington D.C.
Frenkiel, F. N. 1953. “Turbulent Diffusion: Mean Concentration in a Flow Field of Homogeneous Turbulence. ” Advances in Applied Mechanics 3:61-107.
Gifford. F. A. 1961. “Use of Routine Meteorological Observations for Estimating Atmospheric Dispersion. ” Nuclear Safety 17(1):68-86.
Golder, D. 1972. “Relations Among Stability Parameters in the Surface Layer. ” Boundary- Layer Meteorology 3(1):47-58.
Kao, S. K. 1984. “Theories of Atmospheric Transport and Diffusion.” In Atmospheric Science and Power Production. DOE/TIC-27601, D. Randerson, ed. U.S. Department of Energy, Washington, D.C. pp. 189-239.
Martin, D. 0. and J. A. Tikvart. 1968. “A General Atmospheric Diffusion Model for Estimating the Effects on Air Quality of One or More Source. ” Presented at 6 1st Annual Meeting of the Air Pollution Control Association for NAPCA. St. Paul, Minnesota.
Murphy, K. G. and K. M. Campe. 1974. “Nuclear Power Plant Control Room Ventilation System Design for Meeting General Criterion 19. ” In Proceedings of the 13th AEC Air Ckaning Conference, August 12-15, 1974, San Francisco, California. CONF-740807, U.S. Atomic Energy Commission, Washington, D.C.
NRC. 1972. Onsite Meteorological Programs. Regulatory Guide 1.23. U.S. Nuclear Regulatory Commission, Washington, D.C.
NRC. 1977. Methods for Estimating Atmospheric Transporr and Dispersion of Gaseous Efluents in Routine Rekasesfiom Light-Water-Cooled Reactors. Regulatory Guide 1.111, Revision 1. U.S. Nuclear Regulatory Commission, Washington, D.C.
NRC. 1981. “Standard Review Plan 6.4 Control Room Habitability System.” In Standard Review Plun for the Review of Safq Analysis Reports for Nuclear Power Plants. NUREG- 0800. (1987) U.S. Nuclear Regulatory System, Washington, D.C.
Panofsky, H. A. and J. A. Dutton. 1984. Atmospheric Turbulence. J. Wiley & Sons, New York.
Ramsdell, J. V., Jr. 1988. Atmospheric DtJusion for Control Room Air Habitability Assessments. NUREG/CR-5055, U.S. Nuclear Regulatory Commission, Washington, D.C.
Ramsdell, J. V., Jr. 1990. Diffusion in Building Wakes for Ground-Level Releases. Atmospheric Environment 24B:377-388.
71 NUREG/CR-6331 Rev. 1

ARCON96 Ramsdell, J. V., Jr. 1991. EXTRAN: A Computer Codefor Estimating Concentrations of Toxic Substances at Control Room Air In&e.s. NUREGER-5656, U.S. Nuclear Regulatory Commission, Washington, D.C.
Ramsdell, J. V. Jr. and C. J. Fosmire. 1995. Atmospheric Dispersion Estimates in the Vicinig of Buildings. PNL-10286. Pacific Northwest Laboratory, Richland, Washington.
Ramsdell, J. V., Jr., C. A. Simonen, and K. W. Burk. 1994. Regional Atmospheric Transport Codefor Hanford Emission Trurnking (RATCHET). PNWD-2224 HEDR. Battelle, Pacific Northwest Laboratories, Richland, Washington.
Sagendorf, J. F., J. T. Goll, and W. F. Sandusky. 1982. XOQDOQ: Computer Programfor the Meteorological Evaluation of Routine Rekaws at Nuclear Power Stations. NUREGICR- 2919, U.S. Nuclear Regulatory Commission, Washington, D.C.
Tadmor, J. and Y. Gur. 1969. “Analytical Expressions for Vertical and Leteral Dispersion Coefficients in Atmospheric Diffusion. ” Atmospheric Environment. 3:688489.
NUREGICR6331 Rev. 1 72
Appendix A ARCON FORTRAN Computer Code
NUREGICR4331 Rev. 1

Appendix B Glossary
NUREGKR-6331 Rev. 1

Glossary
INCLUDE VARIABLE TYPE BLOCK DEFINITION
AREA R*4
BAREA R*4
Cl(7) R*4
C2(7) R*4
C3(7) R*4
C4(7) R*4
CALM-XOQ 1*4
SCENARIO
MET
MET
MET
MET
XOQ
Building cross-sectional area (m*) in subroutine WINDYXOQ
Building cross-sectional area (m’)
Factor to adjust the lower wind speed to represent the wind at 10 meters
Factor to adjust the lower wind speed to represent the wind at the release height
Factor to adjust the upper wind speed to represent the wind at 10 meters
Factor to adjust the upper wind speed to represent the wind at the release height
Counter for the number of hours of wind is calm (less than Umin)
CFD-UNIT ical unit assigned to cumulative distribution
CLXOQ One-hour centerline X/Q (s/m’) in subroutine
ZLXOQ(MAXHOURS)
DIR1
R*4 XOQ Vector containing one-hour centerline X/Qs (s/m3)
SCENARIO Lower limit of the wind direction window (farthest counter-clockwise looking into the wind)
SCENARIO Upper limit of the wind direction window (farthest counter-clockwise looking into the wind)
JIRL(MAXHOURS) MET Vector of hourly wind directions at the lower measurement level
1IRU(MAXHOURS) 1*2 MET Vector of hourly wind directions at the upper measurement level
133 NUREGICR-6331 Rev. I

ARCON
1
1
.
1
1
1
I
I
I
I
1
Frequency distribution array prior to subroutine SUMMARY; cumulative frequency distribution
DSY
DSZ
subroutines CURVEFIX and
orrections to uz m
ELEVATED
meteorological data has been reached (no more
Counter for the number of hours that the wind
vIAXHOURS
NUREGKR-6331 Rev. 1
fdatathatcanbe

Glossary
INCLUDE VARIABLE TYPE BLOCK DEFINITION
MET FILE(MAXFILES) A*40
MET UNIT 1*1
UNlTS
UNlTS
Vector of meteorological file names and paths
Logical unit assigned to the meteorolopical files
MHTl R*4 SCENARIO Measurement height for the lower level of wind direction and wind speed (m)
MHT2 R*4 SCENARIO Measurement height for the upper level of wind direction and wind d (m)
Vector with nominal number of hours for X/Q
NSIGY(7) Vector of normal (PAVAN) u, by stability class (m)
NSIGY2(7) R*4 MET Vector of normal (PAVAN) cry2 by stability class
NSIGZ(7) R*4 MET Vector of normal (PAVAN) ur by stability class (m)
NSIGZ2(7) R*4 MET
OUT-SECT
QA-FILE
I*4
A*40
XOQ
UNITS
Vector of normal (PAVAN) uz2 by stability class (m’)
Counter for the number of hours wind is not in window, calm, or missing
Name and path for the file containing the expanded
135 NUREG/CR+5331 Rev. 1

ARCON
I 1 INCLUDE 1 VARIABLE 1 TYPE 1 BLOCK 1 DEFINITION
I 1 1 SAXOQ R*4 One-hour sector-average X/Q (s/m3) in subroutine
WINDYXOQ
SAXOQ(MAXHOURS) 1 R*4 ( XOQ I Vector comaining the one-hour, sector-average
SIGY utine NSIGMAl in subroutine
SIGZ from subroutine NSIGMAl in subroutine
SPDL(MAXHOURS) ontaining the hourly, lower-level wind
SPD-TYPE measurement umts;
SW CNST R*4 SCENARIO Sector-width averaging constant
R*4 Total number of X/Q averages considered in subroutine SUMMARY
IEST FLG L*l
TOT-MET I*4
UNITS
MET
Logical flap used to control expanded output
Total number of hours of meteorological data read by subroutine METREAD
rOT_XOQ I*4 XOQ Total number of hours considered in X/Q calculations.. . includes hours of missing data
NUREGKR-6331 Rev. 1 136

Glossary
TSIGY ustments to account for low wind speed and
ustments to accoull
UBAR
UMIN
CURVEFIX and WAKECORR
WIND-DIR ent from release point of the release point
WINDOW Nominal width of the wind direction window for
R*4 MET Normalized height in the atmospheric boundary layer
ZERO( 10) R*4 XOQ Vector containing the number of periods with X/Q = 0 for each averaginp interval
137 NUREGKR-6331 Rev. 1

yt$, FORM 335 U.S. NUCLEAR REGULATORY COMMISSION 1. REPORT NUMBER t*riord e# NRC Aa VOL. suw.. Rev..
NRCM 1102. w Aawumm Numbers. it my.1 1101.3202 BIBLIOGRAPHIC DATA SHEET
/see imrnrcrrons on IhC RI.efsl?/ NUREG/CR-6331 Rev. 1 2. TITLE AND SUBTITLE
PNNL-10521 Rev. 1
A-spheric Relative Concentrations in Building W&kes 3. DATE REPORT PUBLISHED
MONTH I
\ EAl
&Y 1997 4. FIN OR GRANT NUMBER
52028 i. AUTHOR(S) 6. TYPE OF REPORT
J.V. Ramsdell, Jr., C.A. Simonen Technical 7. PERIOD COVERED ,,n~,uure ~arcr,
Pacific Northwest National Laboratory Richland, WA 99352
Division of Reactor Program Management Office of Nuclear Reactor Regulation, U.S. Nuclear Regulatory Commission Washinston, D.C. 20555-0001
10. SUPPLEMENTARY NOTES Report supersedes original report. R.C. Brady, NRC Project Manager, J.Y. Lee, NRC Technical Monitor
Il. ABSTRACT 12Wrrordior*rrl This report documents the ARCON computer code developed .for the U.S. Nuclear Regulatory Commission Office of Nuclear Reactor Regulation for uee in control room habitability aeeeaaraents. It includes a user's guide to the code, a description of the technical basis for the code, and a programmer'6 guide to the code. The ARCON code uses hourly meteorologitcal data and recently developed methods for estimating dispersion in the vicinity of buildings to calculate relative concentrations at control room air intakes that would be exceeded no more than five percent of the time. These concentrations are calculated for averaging periods ranging from one hour to 30 days in duration.
1
I
ARCON is a revised version of ARCON95, which was developed for the NRC Office of Nuclear Regulatory Research. Changes in the code permit users to simulate releases from area sources as well as point sources. The method of averaging concentrations for periods longer than 2 hours has aleo been changed. The change in averaging procedures increases relative concentratione for these averaging periods. In general, the increase in concentratione ie leea than a factor of two. The increase ia greateet for relatively short averaging periods, for example 0 to 8 hours and diminishes as the duration of the averaging period increaae8.
2. KEY WORDSIDESCA:PTORS kbr rardr aphm thm dl mhst mwmchas hlOtMiW~fW-.I ,I. AVAILABILITY STATEMENT
Unlimited Atmospheric dispersion , relative concentrations, building wakes, (4. SECURITY CLASSIFICATION
control room habitability. frhis Pa9rl Unclassified I This RaOd
Unclassified 15. NUMBER OF PAGES
16. PRlCE