Embed Size (px)
Citation preview

OAK RtbGE NATIONA
ORNVTM-13567
Neutronics Benchmark for the Quad Cities-l (Cycle 2)
Mixed-Oxide Assembly Irradiation
Computational Physics and Engineering Division
I’
S. E. Fisher F. C. Difiiippo
MANAGED AND OPERATED BY LOCKHEEDMARllHENERGYRESEAi?CHCORPORATlON FOR THE UNITED STATES DEPARTMENT Of ENERGY

--
msreportbasbssn repoduceddifectiyfromthebestavallaMecopy.
AvaiWetoDOEandDOE -fKJ8IltheOHWaf-andT~ cal lnfomation. P-0. Box 62. Oak Kdge. TN 37631: prices avaihble from (615) 576.6401, Frs 626-6401.
Availabls to the pubiic from the Nathal -bchnW Mommtion &mice, US. Deparhnent of commerce. 5285 Port Royal Rd.. SpirigfieM. VA 22161.
Thisreporfwaspreparedasanacamtofwotksponsodbyanagencyof ths unitsd states Govemment r4sahertt-lsuniteJdstatasGavemmentnorsny amw--of*norawoftMrempwees.makesanywamvrty,exPmssor knplii,wassumss awWhWitycure~fottheacaracy.com pleteness. or useSYbressofafwinfonnabm.atus.poductorprocessdis-
~~dossd.orrepresentsthatitsusswolddnot-nfringeprivatelyownfJdligbts. Refemncehereinto8ny~specitic~prowss.pmcess.serviceby -&name,- -*orordoasnotnotconsti- tuteorimplyitsendorsement,~ crfavolinQbythl3LlIlwstates Govmmmtwanyagencythereof.Tht3iiewssnd@niansofauthofs etxpmsMhsraindonotneoessarily statsorrsflectthossoftbsunitsdstates Govwmmtoranyagencythefeof.
OFtNLiTM-13567
Computational Physics and Engineering Division
Neutronics Benchmark for the Quad Cities-l (Cycle 2) Mixed-Oxide Assembly Irradiation
S. E. Fisher F. C. Difilippo
Date Published: April 1998
Prepared by the OAK RIDGE NATIONAL LABORATORY
Oak Ridge, Tennessee 3783 1 managed by
LOCKHEED MARTIN ENERGY RESEARCH CORPORATION for the
U.S. DEPARTMENT OF ENERGY under contract DE-AC05960R22464

CONTENTS
ABSTRACT...........................................;.‘;.-..................... vii
1. INTRODUCTION . . . . . . . . . . . . . . . . . . . . . . . . . . . . . . . . . . ..~........................ 1
2. PURPOSE AND OBJECTIVES OF THIS BENCHMARK . . . . . . . . . . . . . . . . . . . . . . . . , . . 3
3. MODEL DESCRIPTION, MEASURED RESULTS, AND ORNL CALCULATED COMPARISONS .............................................................. 5 3.1 CALCULATIONAL MODEL INPUT FOR MOX ASSEMBLY GEB-161 .............. 5
3.1.1 MOX Assembly Configuration ........................................... 5 3.1.2 Mixed-Oxide Fuel Isotopics ............................................. 9 3.1.3 Adjoining Assemblies and Boundary Conditions ............................. 9 3.1.4 ControlRods ......................................................... 9 3.1.5 Power History Modeling for GEB-161 and Its Neighbors ..................... 10 3.1.6 Thermal-hydraulic Input Parameters ...................................... 10 3.1.7 Alloy Compositions for Nuclear Analyses ................................. 10
3.2 HELIOS MODEL FOR GEB-161 .............................................. 11 3.3 END-OF-CYCLE-2 MEASUREMENT INFORMATION AND HELIOS COMPARISON
RESULTS ............................................................... 12 3.3.1 Destructive Isotopic Analysis-Gadolinium Analysis in a UO, Rod (F6) .......... 12 3.3.2 Destructive Isotopic Analysis-Uranium and Transuranics ..................... 15 3.3.3 Power and Burnup Comparisons ......................................... 18
3.4 SCALE AND HELIOS COMPARISONS FOR SINGLE MOX AND UO, RODS ........ 22 3.5 OPTIONS FOR ADDITIONAL BENCHMARK CALCULATIONS .................. 25
4,CONCLUSIONS . . . . . . . . . . . . . . . . . . . . . . . . . . . . . . . . . . . . . . ..‘...................... 27
5. REFERENCES............................................................... 29
APPENDIX A. HISTORICAL ASSESSMENT OF QUAD CITIES (BWR) MOX IRRADIATION . . . . . . . . . . . . . . . . . . . . . . . . . . . . . . . . . . . . . . . . . . . . . . . . . . . . . . . . . . . . . . 31
APPENDIX B. GEB-161 SURROUNDING ASSEMBLY DATA . . . . . . . . . . . . . . . . . . . . . . . . 37
APPENDIX C. ORNL HELIOS INPUT DECK LISTING . . . . . . . . . . . . . . . . . . . . . . . . . . . . . 49
APPENDIX D. MEASURED AND CALCULATED VALUES OF ISOTOPICS, RELATXVEPINPOWER,ANDBURNUPBY PIN . . . . . . . . . . . . . . . . . . . . . . . . . . . . . . . . 57
APPENDIX E. SCALE INPUT LISTING . . . . . . . . . . . . . . . . . . . . . . . . . . . . . . . . . . . . . . . . . . . 69
. . . 111
LIST OF FIGURES
Figure F-&e-
1. 2.
3. 4. 5. 6. 7.
8.
9.
Quad Cities core loading, cycle 2 ................................................. 2 Quad Cities MOX central bundle GEB-161 [ref: EPRI NP-2307LD; rod types (i.e., numeric assignments) described in Table 3.11 ............................................. 6 Assemblies adjoining GEB-161 (at BOC2) and lattice dimensions (in.) .................. 7 HELIOS calculational model showing the calculated flux regions ..................... 13 Beginning- and end-of-cycle gadolinium-measured isotopic abundances ................ 14 Calculated-to-measured values for gadolinium in pin F6 ............................ 14 Calculated (HELIOS)-to-measured comparisons (four rod representations for MOX and UO,) for the uranium isotopes and 237Np .......... ..... ... ............. .. ...... ... ... 16 Calculated (HELIOS)-to-measured comparisons (four rod representations for MOX and UO,) for the plutonium isotopes .................................................... 17 Calculated (HELIOS)-to-measured comparisons (four rod representations for MOX and UO,) for the americium and curium isotopes .......................................... 17
10. Calculated (HELIOS)-to-measured relative isotopic ratio comparisons (four rod representations for MOX and UO,) for the americium and curium isotopes .............. 18
11. Measured and HELIOS-calculated pin powers .................................... 19 12. GEB-161 pin power and bumup comparisons ..................................... 20 13. GEB-16 1 MOX and UO, HELIOS calculated-to-measured ratios for neodymium, pin powers
andbumup .............................................................. ..2 1 14. Calculated-to-measured ratios (SCALE and HELIOS) for GEB-161 MOX pin D5 ........ 23 15. Calculated-to-measured ratios (SCALE and HELIOS) for GEB-161 UO, pin C2 ......... 24 16. GEB-162. Peripheral MOX assembly ........................................... 26
iv

LIST OF TABLES
Table
2.1. Quad Cities measurements .................................................... 4 . 2.2. Quad Cities measurements .................................................... 4
3.1. Composition of MOX bundle GEB-161 ......................................... 8 3.2. Dimensional description of MOX lattice ......................................... 8 3.3. Plutonium and uranium at. % isotopics in MOX fuel ............................... 9 3.4. Fuel types for adjacent assemblies .............................................. 9 3.5. Thermal-hydraulic parameters for 21 in. above bottom of fuel (node 4) ............... 10 3.6. Alloycompositions ........................................................ 11

ABSTRACT
Reactor physics computer programs are important tools that will be-used to estimate mixed oxide fuel (MOX) physics performance in support of weapons grade plutonium disposition in U.S. and Russian Federation reactors. Many of the computer programs used today have not undergone calculational comparisons to measured data obtained during reactor operation. Pin power, the buildup of transuranics, and depletion of gadolinium measurements were conducted (under Electric Power Research Institute sponsorship) on uranium and MOX pins irradiated in the Quad Cities-l reactor in the 1970’s. These measurements are compared to modem computational models for the HELIOS and SCALE computer codes. Good agreement on pin powers was obtained for both MOX and uranium pins. The agreement between measured and calculated values of transuranic isotopes was mixed, depending on the particular isotope.
vii

1. INTRODUCTION
A goal of the Fissile Materials Disposition Program (FMDP) is’todispose of weapons-grade plutonium in light-water reactors. Reactor physics computer programs and data are used to estimate reactor performance when mixed-oxide (MOX) fuel is substituted for low-enriched uranium (LEU) fuel. “Good engineering practice” and Nuclear Regulatory Commission (NRC) regulations require that physics codes and data be validated with applicable experimental data. Benchmarking computational methods with the measured data from the past provides confidence in the capabilities of modem calculational methods.
The U.S. program associated with the use of mixed-oxide (MOX) fuel in Boiling-Water Reactors (BWRs) started with a series of irradiations in the Vallecitos BWR. The testing proceeded with the irradiation of rods containing Dresden self-generated plutonium. Four MOX bundles containing a single MOX rod per bundle were inserted into Dresden 1 in 1967. However, the major irradiation programs involving U.S. commercial BWRs occurred in the Big Rock Point and Quad Cities-l reactors (ORNTJMD/LTR 40). A description, history, and an evaluation of potential benchmarks associated with the Quad Cities-l B WR MOX fuel are presented in Appendix A.
The Quad Cities irradiation involved the collection of detailed performance data for five MOX bundles using 80 and 90% fissile plutonium rods mixed in with conventional LEU rods. Even though these five assemblies are not all MOX, they will be referred to as MOX assemblies in this report. Note that “global” parameters are not the focus of this benchmark, since the five bundles containing MOX did not significantly affect overall core performance. With respect to physics parameters that are more global in nature (such as overall core reactivity and critical rod height predictions), the Big Rock Point Reactor irradiations are more relevant.
BWR fuel designs have changed during the last 20 years, and these changes somewhat diminish the direct applicability of the Quad Cities irradiation to the new MOX fuel designs considered in the FMDP. Nevertheless, the Quad Cities irradiation and subsequent post irradiation examination (PIE) constitute the most recent body of U.S. experimental data and remain the best domestic prototypical reactor measurements associated with the insertion of high-fissile plutonium MOX fuel in a BWR.
The term “reactor physics benchmark” generally refers to the application of methods to a pin level or few assembly calculation. Generally, these types of benchmarks are concerned with local- level phenomena, such as pin powers, assembly k-infinity, etc.. A comparison is usually made to a more exact calculation or (preferably) to an accurate physical measurement. Because the primary objective of the work described here is to compare against measured, post-irradiation data, the term benchmark is also applied. The primary intent of this benchmark is to focus on MOX pin neutronic performance in a mixed lattice of UO, and MOX pins. These parameters are compared for a single, assembly-level calculation in which approximately 20% of the pins are MOX pins surrounded by U02 pins.
Figure 1 shows a cross section of the Quad Cities-l core. This diagram indicates the location of the four central MOX bundles and the peripheral bundle that were irradiated during cycle 2. A number of measurements were conducted at the end of cycle 2. However, a review of the literature makes it clear that one of the major objectives of the Quad Cities MOX irradiations was to obtain measured data that could be used for benchmarks of power distributions.

ORNL 98-3723hfg
60 58 56 54 52 50
48
28 26 24 22 20 18 16 lA
01 030507091173151719212325272931333537394143454749515355R5~
LOCALPOWER RANGE MONITOR @ LPRM LOCATION (LlXl.ER INDICATES TIP
MACHINE)
a LPAM LOCATION (COMMON LOCATION FOR ALL TIP MACHINES)
@ INTERMEDlATE PAGE MONITOR IRM LOCATION
a SOURCE RANGE MONlTOR SAM LOCATlONS
* SOURCE LOCATIONS
a THE A DESIGNATION BECAME M AFTER ROD SWAPS AFTER THE FIRST CYCLE OF IRRADIATIONS
b CHANNEL 32572 REPLACED WITH CHANNEL 82818 AT EOC4
c BECAME “R” DESIGNATION AFTER ROD SWAPS DURING EOC5 REFUELING OUTAGE
BPC2 - EOC5
BUNDLE NUMBER MO2
A GEBl58A
A GEi3159A
A GEBl6OA
A GEB161Ma
A GEB162Ma
NUMBER
i2616
CHANNEL
32610
32463
32521
32572b
- GEBl58R’ 32616 POOL STORAGE
B GEB159RC 32610 31-32
- GEBIGOA 32463 POOL STORAGE - GEB161RC 32521 POOL STORAGE E GEBl62M 82818 5-48
(CYCLE 6)
CORE LOCATION
29-30
31-32
3130
29-32
548
Fig. 1. Quad Cities core loading, cycle 2 (ref: EPRI-NP-3568).
2

2. PURPOSE AND OBJECTIVES OF THIS BENCHMARK
Starting in the mid 1970s and lasting into the early 198Os, a number of measurements were conducted on the Quad Cities fuel. Tables 2.1 and 2.2 below (taken from ref. EPRI-NP-3568) show the full extent of the planned measurements. Insofar as cycle 2,3, and 4 measurements are concerned, the information is publicly available and was funded by the Electric Power Research Institute (EPRI). The full extent of the measurements that were actually taken is not known. It is likely that some measurements fall within the scope of EPRI funding and some were funded by General Electric (GE) and are therefore considered proprietary data. To date, the major publicly available results that have been found are the end-of-cycle (EOC) 2 PIE measurements and the gamma scanning of the MOX bundles.
The present analysis for this benchmark takes in to account only the cycle 2 measurements. It is important to remember that this benchmark was constructed from incomplete information. Specifically, the thermal-hydraulic conditions of the core, which change over the cycle, were assumed fixed and some parameters were estimated. The average of the measured bumup data was used as an input into the calculation. Because of the lack of void history data, the studies were conducted on the fuel samples taken near the bottom of the core, where there was a higher confidence level in the value for the void fraction (e.g., near 0). This area is also more applicable to the analysis of pressurized- water reactors (PWR) than the higher void fraction regions that exist higher up in the core.
This benchmark represents the first step of an approach that will be taken with respect to the construction of future benchmarks (e.g., with the availability of related measurements, the remaining cycles will be analyzed, extending to 57,000 MWd/t-the peak bumup achieved). Depending on the availability of additional core operating information, other important parameters could be benchmarked. The current understanding is that much of the benchmarlc information with respect to Quad Cities is contained in a proprietary topical report that was sent to NRC in the early 1980s (GE- CONVER). With respect to this reactor physics benchmark, based on the publicly available information, it was decided that pin power, bumups and transuranic isotopic comparisons in a MOX assembly would be examined. This comparison will be for one cycle of bumup. Options associated with other possible benchmarks are discussed in Sect. 3.5.

Irradiation history
Avg. bundle bumup GWd/t Peak pellet bumup, GWd/t Peak pellet LHGR,’ kW/ft
EOC site measurements Bundle gamma scans
Table 2.1. Quad Cities measurements’ (from EPRI NP-3568, July 1984)
Cycle 2 Cycle 3 Cycle 4 Cycle 5 Cycle Sb
9.1 15.0 23.5 31.4 39.7 16.0 23.3 34.2 45.3 57.3 15.4 11.6 11.0 10.0 9.0
Octant + 5 +d Octant + 5” Octant + 5” Rod-by-rod gamma scans Cold c&./wire activation
2 Bundles -9d 1 Bundle” 1 Bundle” Yes
Neutrography” 13 Rods 7 Rodse EOC hot-cell measurements
Heavy-element isotopic cont. 15 Rods 5 Rodsb 5 Rods’ Bumup (Nd-148) 15 Rods 5 Rodsb 5 Rodsb Radial pellet bumup/isotopics 4 Pellets 2 Pelletsb Gd isotopics 11 Pellets Neutrographyd 8 Rods/8 Pellets Fission product absorbers 8 Pelletsb ZFuel extensively precharacterized (isotopic composition, neutrography, electron microprobe, etc.) Measurements completed by GE outside the EPRI contract.
‘LHGR = Linear heat generation rate. “Source documentation and history of this measurement is not clear. ‘Measurements believed outside the EPRI contract. It is not known if these measurements were actually
performed.
Table 2.2. Quad Cities measurements (from EPRI NP-3568, July 1984)
Cycle 2 Cycle 3 Cycle 4 Cycle 5 Cycle 6 EOC site measurements
Rod profilometry 28 Rods 28 Rods 27 Rods 27 Rods 24 Rodsb
Rod visual and NDT inspection’ 28 Rods 28 Rods 27 Rods 27 Rods 24 Rodsb
Rod length 28 Rods 77 Rods 75 Rods 83 Rods 24 Rodsb Channel bulge, bow, flatness, displacement, and corrosion C 5 Channels + Peripheral +
Neutrography 13 Rods 7 Rodsb Fission-gas puncturing 1 O-24 Rodsb Fuel rod corrosion 10 Rodsb
EOC hot cell measurements Bumup gamma scans 5 Rods 5 Rodsb Fuel isotopics and bumup 15 Rods 5 Rodsb 5 Rodsb Fission gas 2 Rods 5 Rods 5 Rodsb Neutrography 8 Rods 5 Rodsb Corrosion 5 Rodsb
aNDT = nondestructive testing. bMeasurements tentatively being considered that were outside the EPRI contract at the time.
4

3. MODEL DESCRIPTION, MEASURED RESULTS, AND ORNL CALCULATED COMPARISONS
This section contains information used as input to the calculational model. The model itself and the comparison of the measured results with the calculations are provided. The measurement uncertainites, which are dependent on the type of measurement, are discussed in the comparisons. Finally, options associated with the composition of future benchmarks based on the MOX experience at Quad Cities-l are presented.
3.1 CALCULATIONAL MODEL INPUT FOR MOX ASSEMBLY GEB-161
A description of the input data for the calculational model is presented subsequently. Details provided include a description of the four central MOX fuel assemblies and the surrounding uranium fueled assemblies. Initial isotopics, the irradiation history, and a description of the lattice geometry are included. Experimental uncertainties are discussed in Sect. 3.3.2.
3.1.1 MOX Assembly Configuration
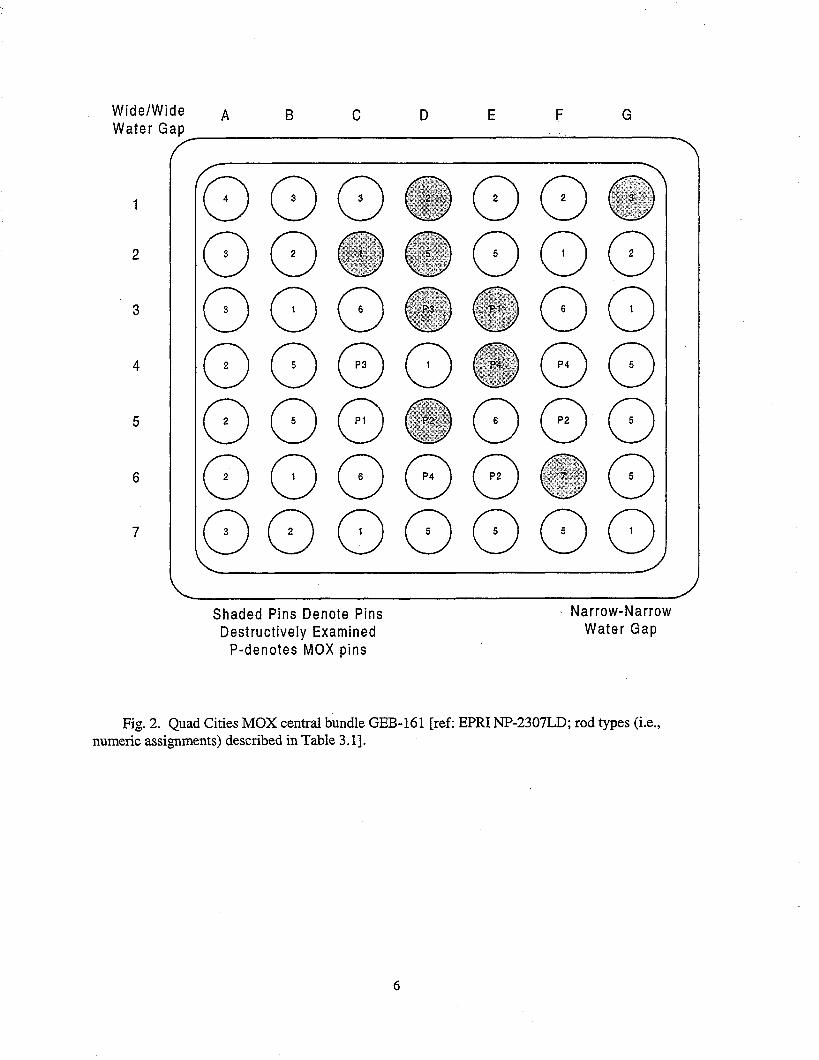
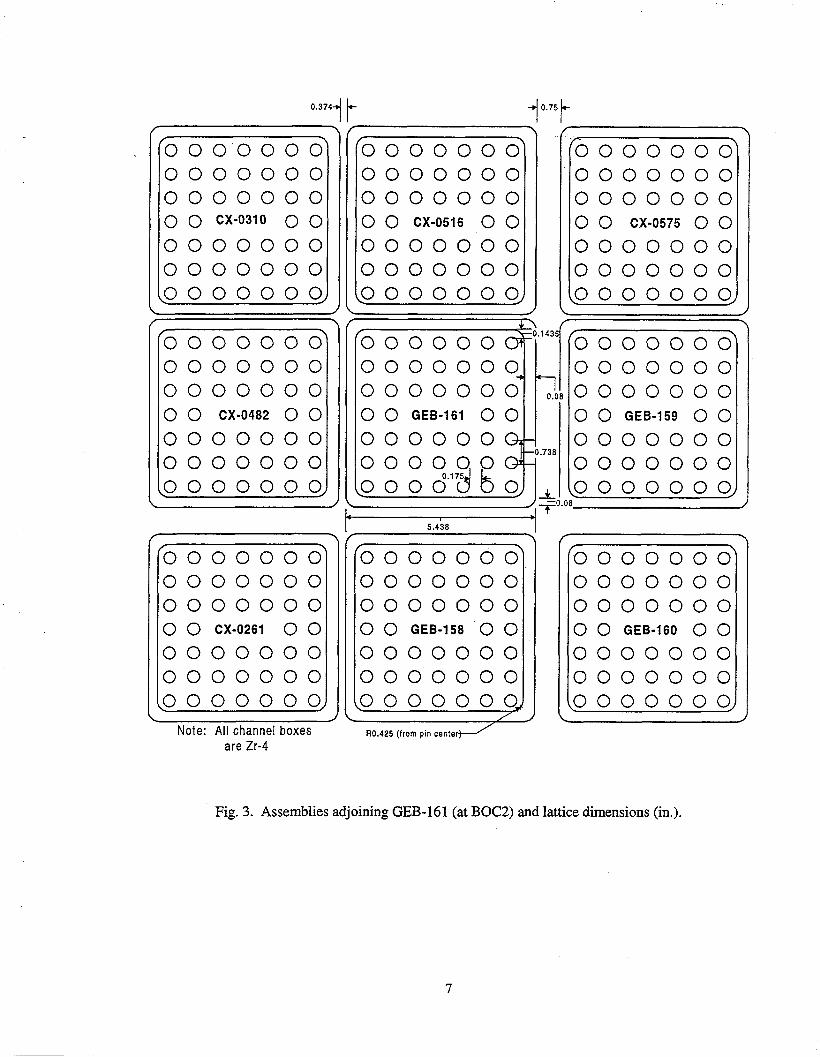
Figure 2 shows the MOX central bundle designated GEB-161. The shaded locations are the MOX, UO,, and UO,/Gd pins that were subjected to post-irradiation measurements. Table 3.1 shows the fuel pin stack arrangement for GEB-161. Assembly dimensions are provided in Table 3.2 and Fig. 3. Note that Fig. 2 should be rotated counterclockwise in order to fit the arrangement shown in Fig. 3.
Wide/Wide A Water Gac
I
Shaded Pins Denote Pins Destructively Examined
P-denotes MOX pins
Narrow-Narrow Water Gap
Fig. 2. Quad Cities MOX central bundle GEB-161 [ref: EPFU NP-2307LD; rod types (i.e., numeric assignments) described in Table 3.11.
0.374.
T 0 0 0’0 0 0 0
0000000
0000000 0 0 cx-0310 0 0
0000000
0000000
_oooooog
0000000 0000000 0000000 0 0 CX-0482 0 0
0000000
0000000
~00000~
G3oooooo
0000000
0000000
0 0 CX-0261 0 0
0000000
0000000
,ooooooq
Note: All channel boxes are Zr-4
0000 0000 0000 0 0 cx-05
0000
0000
000 000 000
16 00 000 000
_ooooooq
\ /
/ \
0000000 ooooooq 0000000 0 0 GEB-161 0 0
0000000 0 0 0 0 0 0 0 ,o 0 0 CT% b 9
\ \
/
0000000 0000000 0000000 0 0 GEB-158 0 0
0000000
0000000
~000000 /
6000000 0000000 0000000 0 0 cx-0575 0 0
0000000
0000000
0000000
\ ooooood 0000000 0000000 0 0 GEB-159 0 0
0000000
0000000
_t,p 0 0 0 0 0 0, ?=0.08
boooooo 0000000 0000000 0 0 GEB-160 0 0
0000000
0000000
poooooq
Fig, 3. Assemblies adjoining GEB-161 (at BOC2) and lattice dimensions (in.).
7

Table 3.1. Composition of MOX bundle GEB-161 (assembly type 5, reE EPRI NP-240, p. A-6)
Zirc-2 clad
stack Pellet No. of 235u
Wall Fissile Pu GW, densi O.D/ thickness
Rod type rods (wt % ofu) (wt %) (wt %) $ (g/cm ) (in.) OD (in.) (in.)
1 8 2.56 0 0 10.32 0.477 0.563 0.037
2 9 1.94 0 0 10.32 0.477 0.563 0.037
3 6 1.69 0 0 10.32 0.477 0.563 0.037
4 1 1.33 0 0 10.32 0.477 0.563 0.037
5 10 3.30 0 0 10.32 0.477 0.563 0.037
6 4 2.56 0 3.0 10.19 0.477 0.563 0.037
7 1 2.56 0 2.5 10.1g5 0.477 0.563 0.037
Pl (solid) 2 0.72 2.14’ 0 9.89’ 0.487 0.563 0.032
P2 (solid) 3 0.72 3.52’ 0 9.8ge 0.487 0.563 0.032
P3 (annul-O.15 ID) 2 0.72 2.34b 0 8.94’ 0.487 0.563 0.032
P4 (annul-O. 15 ID) 3 0.72 3.62’ 0 8.94e 0.487 0.563 0.032 ‘OD = outside diameter. ‘80% Fissile blend, see following section. Fissile Pu is weight of ~3’ Pu
Fig. 3.2, EPRI NP-2307-LD. and 241Pu divided by total heavy metal based on
‘90% Fissile blend, see following section. Fissile Pu is weight of 23g Pu Fig. 3.2, EPRI NP-2307-LD.
and 241Pu divided by total heavy metal based on
“Stack density is from Fig. 3.2, EPRI NP-2307-LD. eValue taken from EPRI NP-2307-LD, p. 3-3; conflicts with p. A-6 EPRI NP-240, which is quoted as 9.99 and 9.04 for
PUP2 and P3/P4, respectively.
Table 3.2. Dimensional description of MOX lattice Dimension English units (in.) Metric units (cm)’
Inside box comer radius (comer pin center to inside of channel box) 0.425 1.079
Box outside dimension 5.338 13.813 Channel box metal thickness 0.080 0.203 Pin pitch 0.738 1.874 Narrow/narrow gap thickness 0.374 0.950 Wide/wide gap thickness 0.750 1.905
Pin outside radius of clad 0.282 0.716 Pin inside radius of clad (UO,) 0.245 0.622 Pin inside radius of clad (MOX) 0.250 0.635 Pellet radius (UO,) 0.239 0.607 Pellet radius (MOX) 0.244 0.620
“Original measurements were given in inches, metric units are derived.

3.1.2 Mixed-Oxide Fuel Isotopics
Table 3.1 refers to two types of plutonium (80% fissile and 90% fissile). A description of the isotopic composition is contained in EPRl NP-3568 and is shown below in Table 3.3.
Table 3.3. Plutonium and uranium at. % isotopics in MOX fuel % Fissile 23Sh 239h 240pu 241h 242h 234 U 235u 2315~ 23Su
80 0.25 75.66 18.49 4.47 1.13 0.005 0.72 - 99.28
90 0.12 87.16 10.06 2.38 0.28 0.005 0.72 - 99.27
3.1.3 Adjoining Assemblies and Boundary Conditions
A map showing the adjoining neighbors (for cycle 2) of GEB-161 is shown in Fig. 3. The requisite information for the adjoining assemblies is provided in Appendix B, even though a reflective boundary condition may be chosen for the model. The lattice dimensions (in English units) are also shown in Fig. 3. Dimensions (in English and metric units) are provided in Table 3.2. Note that Fig. 2 must be rotated 180 degrees counterclockwise to correspond to the orientation shown in Fig. 3. Table 3.4 provides physical data for the surrounding assemblies. The pin descriptions for the fuel loading patterns of the surrounding assemblies are described in Appendix B.
Assembly No?
cx-03 10 CX-0482
CX-026 1 CX-05 16
cx-0575
GEB 158-161 ‘See Fig. 3.
Table 3.4. Fuel types for adjacent assemblies (ref: EPRI Np-240)
No. of Gd rods Cycle - avg U-235 enrichment Assembly (D-dished (I-initial bundle,
Fuel in pins type U-undished) R-reload in Cycle 2), 9%
uo, la 3-D I - 2.12
uo* 2a 2-D I - 2.12
w la 3-D I (shuffled) - 2.12 w 2a 2-D I - 2.12
w 2a 2-D I - 2.12 MOXAJO, 5 5-u R - 2.71
3.1.4 Control Rods .I
Control rod insertion is not modeled in any of the assemblies. With respect to GEB-161 and the cruciform rod that runs between the four MOX bundles, only a small amount of insertion was used at the very beginning of cycle 2. For most of the cycle, this rod was withdrawn and was therefore modeled as such. Three other control rods may have influenced the local power distribution. Partial insertions of these rods occurred in the reactor. However, most of these movements were in the first half of the cycle. From approximately June 1975 until the end of cycle in January 1976, all of these rods were completely withdrawn and the power history of the reactor was generally steady (EPRI NP- 240). For the purposes of this benchmark, a judgment was made that these rods would not be modeled. The approach to determining the assembly power for GEB-161 (which is affected by the overall rod pattern strategy) is discussed below.
9

3.1.5 Power History Modeling for GEB-161 and Its Neighbors
All of the neighbors for GEB-161 were inserted in the initial core and remained in place until the end of cycle 2, with the exception of CX-0261, which was shuffled from an adjoining region. All five MOX bundles were inserted at the beginning of cycle 2. The bumup of the CX assemblies (at 21 in. above the bottom of active fuel) is not currently known. Because the overall cycle 1 core average bumup was 7,239 MWd/MT (see p. A-18, EPRI NP-240), this value is suggested as the bumup for adjoining assemblies prior to insertion in cycle 2.
CX-0261 was the only assembly that was shuffled from another part of the core. Orientation changes (if they occurred) for the CX bundles are not known and were not found in the EPRI documentation.
In the analyses presented subsequently, only assembly GEB-161 was modeled with “white” boundary conditions. If one wishes to model the surrounding assemblies, then the CX bundles would need to be burned prior to insertion of the MOX bundles. Lacking data on orientations, the assembly arrangement in Fig. 3 is the recommended basis for a model.
Reference EPRI NP-2307-LD states that the bundle average exposure of the center MOX bundles was about 8300 MWd/t. For GEB-161, an estimated average bundle exposure of 11,206 MWdft was cited in EPRI NP-214 (p. 5-12) for an elevation of 21 in.. A bumup period of 531 days (from July 21, 1974, to January 2, 1976) represents the calendar time of irradiation.
For the ORNL HELIOS analysis (further discussed in Sect. 3.2) an assembly average bumup of 11,722 MWd/t (for assembly GEB-161 at 21 in.) was used to match the measurements. This resulted in an average bumup of 11,890 MWd/t for the nine destructively examined pins (see Fig. 2). This matches the average of the quoted nine-pin bumup using the values in EPRI NP-2307-LD. If the neighboring five CX assemblies are modeled for cycle 2, for lack of better information, it is suggested that the bumup iteration be performed so that the nine MOX pins achieve a bumup of 11,890 MWd/t.
3.1.6 Thermal-hydraulic Input Parameters
Table 3.5 shows the thermal-hydraulic input parameters for measurements taken at 21 in. above the bottom of active fuel (node 4). These parameters were selected based on saturation conditions for the rated pressure of 1035 pounds per square inch absolute (PSIA). The void fraction was taken to be 0.0 at this node (known as axial node 4 in the EPRI documentation).
Table 3.5. Thermal-hydraulic parameters for 21 in. above bottom of fuel (node 4) (ref: QUAD-CONVER)
Pressure Water density inside/ Fuel temp Water temp Water temp (PSIA) outside assemblv (average) inside assembly outside assemblv
1035 46.1 (lbm/ft3) 1040°F 547°F 547°F (0.7375 g/cm3) (560°C) (286°C) (286°C)
3.1.7 Alloy Compositions for Nuclear Analyses
Table 3.6 shows the weight percent alloy compositions for the Zircaloy-4 channel box material and the Zircaloy-2 clad pins. A density of 6.55 g/cc was selected for both materials.
10

Table 3.6. Alloy compositions (ref: p. A-8, EPRI NP-240)
Zircaloy -2 Zircaloy -4 - Metal (WA) (w&J)
zr 98.30 98.24 Fe 0.14 0.21 Sn 1.40 1.45 Ni 0.06 -
Cr 0.10 0.10
3.2 HELIOS MODEL FOR GEB-161
The relevant input data for the HELIOS code from Sect. 3.1 (the geometry and fuel description) was used to model GEB-16 1. The HELIOS code uses the collision probability methodology for neutron and gamma transport for two-dimensional (2-D) geometries. HELIOS is a Scandpower, Inc., proprietary code. ORNL has a license for Version 1.4 of the code and executed the code on an IBM RS/6000 Model 590. The code is used to analyze fuel assembly lattices and provides collapsed assembly cross sections as an input into other core-wide neutronics simulation codes. Thirty-eight neutron group cross-section data derived from Evaluated Nuclear Data File/B-VI supplied by Scandpower, Inc., were used in this calculation. Further information on the code is found in reference HELIOS-DOC. The HELIOS input is provided in Appendix C.
The visualization module of the HELIOS code system, ORION, produced Fig. 4 from the input data given in Appendix C. Note that all the details of the bundle are included explicitly and that bumup-dependent parameters, such as fluxes and isotopics, are calculated for each region defined between straight or curved line segments. Multiple radial zones were included for the pins with burnable poisons (Gd,O&JO, pins) for a better simulation of the gradual radial burning of gadolinium. The input value for the average bumup of the 49 pins (11,722 MWd/t obtained by iteration) yielded a value of 11,890 MWd/t for the average bumup of the nine destructively analyzed pins. This value is the average quoted bumup for the nine pins (as obtained from EPRI NP-2307 LD). The 11,722 MWd/t (average assembly bumup) HELIOS value compares well with the quoted value of 11,206 MWd/t (EPRI NP-214). Fourteen equally spaced bumup steps were computed along the 18- month irradiation period. No downtime existed between steps. The input listing in Appendix C also describes a few geometric simplifications related to the fuel with respect to the clad gap and the annular MOX fuels. These gaps were not explicitly simulated in the model, and the densities of the clad and the MOX fuel were appropriately diluted. A white reflective boundary condition was imposed at the boundaries of the model on the outside of the wide and narrow water channels. A uniform fuel temperature distribution was used.
The output of the HELIOS calculations was intentionally limited because only a comparison to the available experimental data was desired. The approach generally taken was to examine the results according to the pin type: MOX or UO,. Much more information is available from the calculational model than is presented here. The calculated-to-measured comparisons that were performed have been organized into three sections:
1. Gadolinium analysis (isotopic at. S) comparison for the single UO,/Gd,O, pin that was destructively examined. \
11

2. Isotopic comparisons that include the following measurements:
Uranium isotopics (235U, 236u, and 238U; 234U l$itonium isotopics (23gPu,
measurements taken but not -compared), 24cPu, 241Pu, and 242Pu), and neodymium isotopics (145Nd,
6Nd, and 14*Nd). The units of the measured data were the ratios of atom densities to the initial 238U atom density. Since the neodymium isotopics relate to bumup measurements, their comparisons are discussed in item 3.
Number of atoms of 237Np, 24* Am, and 242Cm per mg of initial uranium (the measurements were translated to the units quoted above).
Curium 242 and Americium 243 isotopicgercentages were reported. Two values were compared: 243Am/(241Am + 243Am) and 2 Cm/(242Cm + 243Cm + 244Cm).
3. Relative distributions of the fission product i4’Ba (within the nine analyzed pins) by using the normalized measurements of the 14!La 1.6 MeV gamma. As discussed in the next section, this distribution is sensitive to the history of the irradiation (e.g., the fission rate and thus the power distribution of the pins) during the final months of the cycle. It is acknowledged that the fission rate and power distribution are distinct entities because the power distribution includes gamma heating. In this report, however, this phenomenon is ignored and the term “pin power” is used.
The total bumup values for each of the nine pins are examined for trends even though the average bumup of the nine pins is normalized in the HELIOS calculation. Neodymium atom densities will be compared in the next section.
3.3 END-OF-CYCLE-2 MEASUREMENT INFORMATION AND HELIOS COMPARISON RESULTS
At the end of cycle 2, nine fuel rods including UO,, U02-PuO, and UO,-G&O, were removed from GEB-161 (six rods were also removed from GEB-162, which is on the periphery of the core, but are not considered here). EPRI documentation of these examinations include EPRI NP-2307-LD (destructive examinations) and EPRI NP-214 (nondestructive power measurements). The destructive examinations include isotopic determinations for the isotopes of neodymium (used to obtain measured bumup), gadolinium, americium, curium, neptunium, plutonium, and uranium. The nondestructive examinations include gamma scanning measurements of the 14!La gammas. Power distributions are derived from the gamma scan. Comparisons between the measured data and the HELIOS calculations are presented in the following sections.
3.3.1 Destructive Isotopic Analysis-Gadolinium Analysis in a UO, Rod (F6)
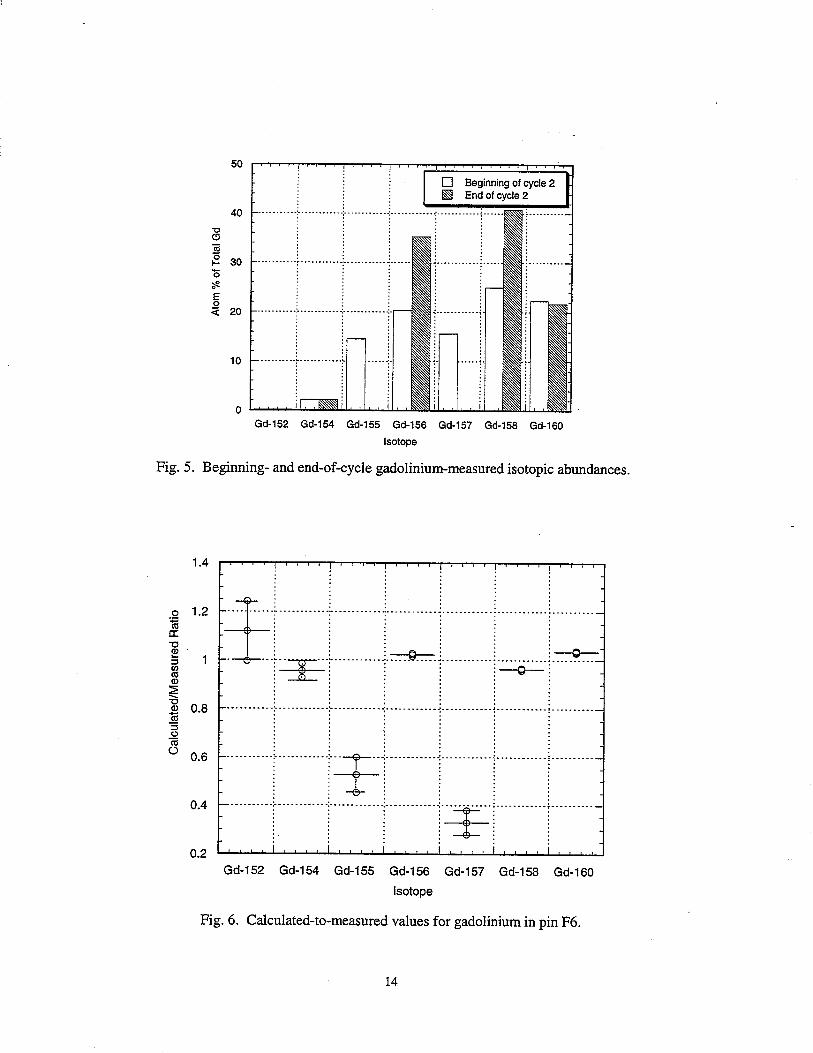
Rod F6 in GEB-161 is a UO, rod that contains 2.5 wt % gadolinia. This sample was taken at approximately 21 in. from the bottom of the active fuel. Investigation of this rod was performed so that the impact on gadolinium depletion in UO, due to the presence of nearby MOX rods could be studied. Two of the eight neighbors of rod F6 are MOX rods.
The beginning- and end-of-c{cle gadolinium measurements are shown in Fig. 5. The major burnable isotopes are ls5Gd and r 7Gd, which are mostly gone by the end of the cycle. Figure 6 shows the calculated (HELIOS)-to-measured comparisons for these atom percentage measurements. The , center marker in this figure represents the calculated-to-measured ratio. Using the quoted measure- ment error (EPRI NP-2307 LD) of one sigma for the uncertainty in measurement only, a high and low marker for each calculated-to-measured ratio is also plotted. The selected set of measurements (in
12

table form) are provided in Appendix D (Table D. 1), alon values. It is suspected that the error bars (for “‘Gd and * 4
with the calculated HELIOS comparison Gd) do not sufficiently account for the
difficulty in measuring the low amounts of these isotopes that were present in the rod. Comparisons for Gd pins surrounded entirely by UO, rods and gadolinium pins surrounded by more MOX rods would be useful in interpreting these results.
Fig. 4. HELIOS calculational model showing the calculated flux regions.
13
SO
10
Gd-152 Gd-154 Gd-155 Gd-156 Gd-157 Gd-158 Gd-160
Isotope
Fig. 5. Beginning- and end-of-cycle gadolinium-measured isotopic abundances.
0.8
0.6
_:_ 4.
A i
Gd-155 Gd-156 Gd-157
isotope
Gd-158 Gd-160
Fig. 6. Calculated-to-measured values for gadolinium in pin F6.
14

3.3.2 Destructive Isotopic Analysis-Uranium and Transuranics
Measurements for the isotopes of uranium, neptunium, plutonium,-americium, and curium were taken at 21 in. above the bottom of the active fuel. Appendix A of EPlU NP-2307-LD provides a summary of the isotopic results for both uranium- and plutonium-based fuels. Tables showing the rod calculations, measurements, and the respective measurement uncertainties for each pin are listed in the tables in Appendix D (for all nine rods and the average values). For isotope-by-isotope comparisons, the average of the four MOX rods and the average of the four UO, rods were computed. The grouping of the rods in this manner was done so that any specific MOX- and UO,- related trends might be observed. The quoted calculated-to-measured ratio (C/M ratio) refers to calculated and measured values of the atom density of the isotope divided by the initial 238U atom density (a constant).
The following box plots in this section take into account the quoted experimental uncertainty in the following manner. For the four rods (either a MOX or UO, grouping as noted on the x-axis), the top line of the box represents the highest calculated-to-measured ratio of the four rods. Above the top of the box is an error bar. This error bar is simply the “one sigma” measurement error applied to the highest (of the four) calculated-to-measured ratios. Generally near the middle of the box is a line with a circular marker, which indicates the simple arithmetic average of the four calculated-to-measured ratios (MOX or UO,) for that isotope. The lower line of the box represents the lowest of the four calculated-to-measured ratios. All four calculated-to-measured ratios fall somewhere inside the box. The lower error bar, extending from the bottom of the box, is simply the lowest of the four ratios minus the “one sigma” measurement error. This method of representation is not the standard approach for box plots. However, a glance at the box and the measurement error bars facilitates a better visual comparison of the calculated-to-measured ratios among pin types and provides an indication of the measurement error impact.
Figure 7 shows the box plot for the uranium and 237Np isotopes. Figures 8 and 9 show similar plots for the plutonium isotopes and the americium/curium isotopes. The 237Np, 241Am, and 242Cm measurements were quoted in EPRI NP-2307 LD as the number density per milligram of initial uranium. These measurements were converted to units of atom density divided by the initial 238U atom density. For the isotope 243Am, measured isotopic percentages for the americium (e.g., the split in atom percentages for 241Am and 243Am) isotopes were multiplied by the measured amounts of 241Am to obtain a measured value. The same technique was used to obtain the sum of the isotopes of 243Cm and 244Cm. For these two cases, the measured error for these isotopes was the combined measurement error of the 242Cm (or 24* Am) and the measurement error associated with the isotopic percentage measurement, resulting in an error that is the square root of the sum of the squares of the respective errors. The quoted measurement uncertainty in the americium for the UO, fuels was very high (hence the arrows on this figure), precluding the possibility of a reasonable comparison.
The agreement among the uranium isotopes and the calculations is generally quite good for both types of fuel rods. However, the 236U C/M ratios in the UO, pins are noticably low. With the possible exception of 237Np (which has a large spread in the values due to an 18% measurement error), the results show that the plutonium and uranium isotopes are generally predicted better in the MOX rods than the UO, rods. For the plutonium isotopes this could be due to the known values of these isotopes prior to the beginning of the cycle in combination with the low bumup. For these (plutonium) isotopes, the measured value is generally higher than the calculated value (e.g., C/M ratio cl), especially in the uranium fueled rods.
Even though the uncertainties are high for americium and curium (-30% and -12% for MOX rods), the measured values are consistently higher than the calculated values (e.g., C/M ratio cl). This situation is true for both MOX and UO, rods, especially for the curium isotopes. For the MOX rods, the low C/M ratio of 242Cm may be due to the low 241 Am C/M ratio. This is due to the fact that 241Am is in the transmutation path between 24*Pn and 242Cm. 243Am is in the transmutation path for
15

the production of 244Cm and 243Cm. As Fig. 9 shows for both MOX and UO, rods, the C/M ratios are about the same for 243Am as they are for the sum of 243Cm and 2’%m.
In general, if one looks at the C/M ratios of isotopes as a function of atomic-weight (uranium through curium), a trend towards lower C/M ratios is seen for the heavier isotopes. Other benchmark comparisons are needed to see if this trend is valid for higher bumups.
1.1
0.6 ‘I ’ I’* ‘I “I ( p I ‘I ( ‘I ” ’ ( I ” I t * U-236 U-235 U-236 U-236 U-238 U-238 Np-237 Np-237 MOX U02 MOX UO, MOX UO, MOX UO,
isotope/Rod Type
Fig. 7. Calculated (HELIOS)-to-measured comparisons (four rod representations for MOX and UO,) for the uranium isotopes and 237Np.
16

1
E -._ .--... . .
ii
-.__.____
-..__ _.._
-.__._._.
L - PU-239 PU-239 Pu-240 ~~-240 Pu-241 Pu-241 Pu-242 Pu-242
MOX U02 MOX uo 2
MOX U02 MOX U02
Isotope/Rod Type
-0 B C
l
0” 0.85
0.8
0.75
; .: . _
I I
Fig. 8. Calculated (HELIOS)-to-measured comparisons (four rod representations for MOX and UO,) for the plutonium isotopes.
Am-241 Am-241 Am-243 Am-243 Cm-242 Cm-242 Cm243+4 Cm243+4
MOX “OP
MOX u”2
MOX u”2
MOX “O2
Isotope/Rod Type
Fig. 9. Calculated (HELIOS)-to-measured comparisons (four rod representations for MOX and UO,) for the americium and curium isotopes.
17

Relative isotopic measurements were performed for the 242Cm and 243Am. The 242Cm atom % comparison is the 242Cm divided by the sum of 242Cm; 243Cm, and 244Cm (calculated and measured). The 43Am comparison is the 243Am divided by the sum of 241Am and 243Am (calculated and measured). 242Am was measured, but not compared, due to its short half-life and low quantities. The calculated-to-measured comparisons are shown in Fig. 10. The comparisons show that better agreement was generally attained for the UO, rods. However, the spreads in the calculated-to- measured ratios and the uncertainites in the 243 Am concentrations are quite large.
0 ‘2 F2
2.5
2
1.5
1
0.5
0
Cm-242 at.% ratio Cm-242 at.% ratio Am-243 at.% ratio Am-243 at.% ratio
MOX “O2 MOX
“O2
Isotope/Rod Type
Fig. 10. Calculated (HELIOS)-to-measured relative isotopic ratio comparisons (four rod representations for MOX and UO,) for the americium and curium isotopes.
3.3.3 Power and Burnup Comparisons
Following the end-of-cycle 2 at Quad Cities, a large number of gamma scans were conducted for the purpose of obtaining benchmark-quality, power distribution data. This procedure was done by scanning the rod or bundle for the i4’La 1.6 MeV gamma and normalizing the data to obtain relative power distributions. Whole bundles were scanned, as were the nine rods that were subjected to destructive examination. The details of the campaign and the overall program objectives are documented in EPRI NP-214.
The actual measurements consist of 14!La gamma-intensity count rates. 14?La is marginally produced as a fission product and it decays with a half-life of approximately 40 h. Its main source is through the decay of its parent, l”Ba. ‘@Ba has a 12.8d,half-life. The 14’Ba distribution in irradiated fuel is proportional to the integrated power history of the core obtained from the last several months of power operation. If one plots the atom density ratio of ‘40La/i4’Ba as a function of time after
18

shutdown, a constant value of about 0.15 is obtained at approximately 10 days after shutdown (see Fig. 6.1 of EPRI NP-214). Thus, a measurement of the 14!La at this time is an indication of the 14’Ba content. Note that measured 14!La intensities are only useful for obtaining relative or normalized power distributions covering the last couple of months of power operation.
The barium inventories in the nine rods at the end of cycle 2 were extracted from the HELIOS code and normalized. The calculated and measured values for each rod are provided in Fig. 11. Figure 12 shows the percentage difference [(C/M) - l] in the pin powers that were measured by gamma scanning and the HELIOS end of cycle calculated values for the assembly. Pin bumup percentage comparisons are also shown in this figure. The measured pin bumups are the quoted bumups from EPRI NP-2307-LD. These values are compared with the HELIOS values at the end of cycle 2.
Wide/Wide A B C D E F G Water Gap
/ \
f 4 ~0 ‘0 3
0 3
G
2
~0 2
0
2
0 3
i
0 3
0
2
0 1
G 5
G 5
0
1
G 2
Ml.022 0 Cl.031
0
6
G P3
0
Pl
0
6
G 1
M 0.966 0 c 0.915 00
G 1 M 1.046 0 Cl.056
0 P4
0 5
0 2
0 5
0 6
0 P2
0 5
0 2
0 1
0 6
G P4
0 P2
M 0.661 0 c 0.697
0 5 \ /
Pins: D5/E4 - 90% Fissile MOX M - normalized measured power Narrow-Narrow D3/E3 - 80% Fissile MOX C - normalized HELIOS power Water Gap
Other-UO, F6-lJO2 /Gd
(h)-hollow pin
Fig. 11. Measured and HELIOS-calculated pin powers.
19

Wide/Wide A B C D Water GaD
E F G
1
2
3
4
5
6
7
.
/ 0 4 0 3
0 3
0 3
G 2
0 1
0 3
P 0.9% 0 B 0.9%
0 6
0 P3
0 Pl
0 6 0 P4
P 0.0% 0 B -2.9%
P 2.6% 0 B -4.2% 0 5
P -1.3% 0 0 3.1%
P 1.0% 0 B 2.7% 0 6
G P2
0 5
\ P 3.4% 0 B -1.1%
0 6
0 P4
0 P2
P 1.6% G B 1.6%
0 5
0 5 0 5 G 5 G 1
D5/E4 - 90% Fissile MOX D3/E3 - 80% Fissile MOX
Other Gray Pins - UO, F6-UO, /Gd
(h)-hollow pin
P-Norm EOC Pin Power % B - Norm Burnup %
% =l 00 *(C-Ml/M
Narrow-Narrow Water Gap
Fig. 12. GEB-161 pin power and bumup comparisons.
20

Figure 13 shows a box plot of the neodymium isotopics, the pin powers, and the pin bumups. As was the case in the previous plots, the box values for the neodymium isotopes account for the quoted uncertainties. In all cases, the C/M ratios were slightly less than 1, but generally within the measurement uncertainty and tightly clustered. The neodymium values suggest that the bumup input into HELIOS should perhaps be higher by a couple of percent. Note that the HELIOS model was burned to the average reported “measured” bumup (which likely comes from a GE calculated curve for neodymium vs bumup). The model was not normalized to the values of neodymium in the pins. The difference is small.
The pin bumups reported in Fig. 13 represent a single average value. No uncertainty box for these two values can be derived. However, there are four different values that make up the average value.
Figure 13 shows that the average of the MOX pin powers has a C/M less than 1, and the UO, pins have a C/M greater than 1. Unity is within the uncertainty (taken as 1.7% for pin power measurements) for both sets of pin power data. The box plot does suggest that the MOX pins are operating at a higher power than the calculated values (for the last couple of months of the cycle), but not by an amount that is significantly outside the uncertainty of “one sigma” of the measurement.
1.06
1.04
0.92
0.9
c
Nd145 Nd145 Nd146 Nd146 Ndl48 Nd148 Burn Burn POW Pow MOX uo2 MOX uo2 MOX uo2 MOX uo2 MOX uo2
Isotope/Rod Type
Fig. 13. GEB-161 MOX and UO, HELIOS calculated-to-measured ratios for neodymium, pin powers and bumup.
21

3.4 SCALE AND HELIOS COMPARISONS FOR SINGLE MOX AND UO, RODS
The SCALE system provides a standard method for analyzing the isotopics in spent fuel (Reference SCALE-DOC). In the SCALE system, the SAS2H control module provides an analysis sequence for determining a number of spent fuel characteristics, including nuclide inventories. The neutronics methodology in this sequence is based on a one-dimensional (1-D) neutron transport calculation. Thus, no measured pin power comparisons between SCALE and HELIOS [which is two dimensional (2-D)] are feasible. However, since SASIL(H) has been used for fuel depletion and decay analyses, isotope comparisons can be performed between measurements, HELIOS and the SCALE calculations for single rods.
The input information in Sect. 3.1 was used as an input into the SAS2 sequence. In both cases an infinite surrounding array of like pins was modeled. A single MOX rod (pin D5, a 90% fissile rod), and a single UO, rod (pin C2,2.56% enrichment) were chosen for the comparison. Each rod was irradiated to its reported measured bumup which is 12,500 MWd/t for the MOX pin and 11,450 MWd/t for the UO, pin. Appendix E contains a listing of the SCALE (Version 4.3) input decks for both rods.
Calculated-to-measured ratios are shown for the MOX rod in Fig. 14 and the UO, rod in Fig. 15. The results show that for almost all isotopes, the SCALE method predicts higher values than the HELIOS code.
22

0.4
0.2
0 U235 U236 U236 Np237 Pu239 Pu240 Pu241 Pu242 Am241 Am243 Cm242 Cm244 Nd145 Nd146 Nd146
ISOTOPE
Fig. 14. Calculated-to-measured ratios (SCALE and HELIOS) for GEB-161 MOX pin D5.
23

1.6
1.4
S 0.8
0.4
0.2
0
Fig. 15. Calculated-to-measured ratios (SCALE and HELIOS) for GEB-161 UO, pin C2.
24

3.5 OPTIONS FOR ADDITIONAL BENCHMARK CALCULATIONS
The configuration that was used for this benchmark was selected‘based on the ease of obtaining the input data and the availability of documented MOX pin measurements. Once the 2-D model has been constructed for the assembly, other modeling opportunities readiiy present themselves.
Several options are available for future benchmarks. These options are rated below (the first option being the “most desirable”) according to a qualitative judgement level of additional effort (which includes obtaining additional data) that is estimated to be required. The option of using the SCALE system to model some individual pins is not included in this list, but would also constitute a useful benchmarking exercise.
1. Perform analysis of GEB-162 (peripheral bundle) at 21 in. above bottom of active core. The same assembly model can be used and modified to obtain comparisons with the peripheral MOX bundle. This bundle is shown below in Fig. 16. EPRI NP-2307-LD quotes a calculated exposure of 2700 MWd/t for this bundle. The same (as GEB-161) measured information is available for the six rods that were examined. In addition, approximately 40 rods were scanned, producing a large array of measured rod-to-rod planar distribution powers. Examination of the measurements shows that there is a wider variation in the pin power distribution, consistent with the presence of a core/reflector interface. This comparison would seem to be of interest due to more heterogeneity, the presence of a nearby reflector, and the fact that the nearby gadolinia pin (pin number 5 that is shaded) has not been completely depleted.
2. Perform analysis of GEB-161 and GEB-162 at upper axial locations. If a method for estimating the void fraction at higher locations is obtained, then further analysis on the upper samples can be conducted. In addition to the same comparisons (bumup, transuranics, and power distributions) that were conducted here, more information on gadolium burnout can be obtained. Gadolinium radial distributions would become available for rod F6 at nodes 6 and 8 (corresponding to 93.2 in. above bottom (5470 MWd/t) and 129.2 in. above bottom (3550 MWd/t), respectively). According to autoradiographs (and the neodymium values), however, the bumup is assymetric. This could have been due to the two nearby 90% MOX rods. This comparison would speak to any concerns about MOX spectrum changes that might result in changes in burnable poison behavior of nearby pins.
3. Perform axial and radial power bundle benchmarks of MOX bundles. If the axial void fraction history of the MOX bundles could be found or calculated, then a comparison with the end of cycle assembly’s axial power profile (normalized) and additional radial power profile comparisons could be performed. Measurements are available for the end of cycle 2 (gamma scan used in this analysis), the end of cycle 3 ( EPRI NP-2302-LD), and the end of cycle 4 (NEDC-25492). The full extent of these measurements has not been investigated. Cycle 3 is interesting in that a partial rod insertion would have to be modeled for this cycle. Cycle 4 measurements may be considered to be GE proprietary data. An axial diffusion theory code or some other multidimensional methodology would need to be employed.
4. Perform an analysis of MOX rod VP-0017 and high-burnup MOX rods. At the end of cycle 5, a significant portion of the MOX rods were removed. EPRI NP-3568 states that an average rod bumup of 35 GWd/t had been achieved by a solid, 90% fissile MOX rod (which is identified as VP-0017). Its hollow counterpart had achieved 31.03 GWd/t. This average is for a collection of five rods that were removed at the end of cycle 5. These rods were gamma scanned for power and the 137Cs distribution. They were then subjected to fission gas measurements. The total history of rod VP-0017 has not been located in the literature. However, if this information were
25

available and rod VP-0017 was found and subjected to nondestructive measurement, a high- bumup benchmark exercise could possibly be conducted. Depending on the objective, either axial comparisons or radial comparisons could potentially be performed; ,An axial diffusion code or some other multidimensional methodology would need to be employed. If total fuel performance (such as fission gas release models) measurements are to be compared (even though the rod was fabricated in the 197Os), then this rod would be of interest because fission gas measurements were taken.
REFLECTOR
7
6
2
1
0 Pl 0 6
0 1
0
2
IO 3
0 P2
0
1
0
1
G F E D C B A
Shaded Pins Denote Pins FUEL Wide/Wide - Destructively Examined Water Gap
Fig. 16. GEB-162. Peripheral MOX assembly.
26

4. CONCLUSIONS
This benchmarking effort provided valuable assembly-level comparisons for a MOX assembly (including UOZ pins) under reactor conditions. However, major conclusions concerning the neutronics performance of high-fissile MOX fuel can only be made after consideration of additional benchmark-quality data for higher bumup MOX fuel. The experience gained from this effort is summarized below.
1.
2.
3.
4.
5.
For MOX rods, HELIOS models the chains for the isotopes of uranium and plutonium (MOX fuel rods in a UO, matrix) reasonably well when compared with measured data at approximately 12,000 MWd/t. However, as isotopes are transmuted up the chain, uncertainties in the measurement and the calculational difficulty (e.g., the calculated transmutation of isotopes) probably combine to make the comparison more uncertain. Indications are that the amounts of heavier actinides are under-predicted. This factor is important when consideration is given to the curium isotopes, because these neutron sources may be an important factor in the shielding analysis for spent MOX fuel.
The nondestructive pin power measurements are in good agreement (e.g., within the measurement uncertainty) with the calculated HELIOS values. However, there are indications that the MOX pins are runnning at slightly higher pin powers than the HELIOS-calculated power. The reverse is true for the UO, pins. The sole measurement on the gadoliniaAJ0, pin revealed that the gadolinium (155 and 157 isotopes) was essentially depleted. However, the power measurement of this pin was very comparable to the calculated value (suggesting that the gadolinium bumup was modeled accurately).
The bumup measurements and HELIOS calculations are fairly consistent (within about 2%) with respect to MOX rods and UO, rods. A comparison reveals that for the MOX rods, a higher calculated total bumup (MWd/t) was found as compared with the measurement. For UO, rods, the measured bumup was higher than the calculated bumup.
The analysis presented here provides a reasonable starting point and a necessary first step towards the validation of neutronics methods for high-fissile MOX fuel. A review of the Quad Cities data suggests that more benchmark efforts (as described in Sect. 3.4) should be carried out on the reported measurements (that are available in the EPRI reports). It is expected that additional benchmarking may provide better information on the depletion of gadolinium (in UO, pins) in a MOX-influenced spectrum. More isotopic data would be obtained at different bumups. Another set of power distribution data would be obtained in these exercises, and it would be interesting to know if the findings at different bumups are similar to the findings in this effort. It is thought that the benchmarking efforts will be informative, regardless of which technology (PWR or BWR) is selected for the disposition of plutonium.
A reason for performing the benchmarking exercise on the Quad Cities irradiation is that the fissile blends are higher than reactor grade and quite close to weapons-grade plutonium isotopics. Such measurements are rare. With respect to high-bumup Quad Cities MOX fuel (which is thought not to have undergone destructive examination) which may be available, it may be prudent to first investigate results obtained from European experimental programs, given the expense associated with having to perform additional destructive examinations. If European experience is not available, the Quad Cities MOX rods (especially the 90% fissile rods) may be the only source of information to quantify differences in key neutronics parameters between high- fissile plutonium systems and the well-characterized use of reactor-grade plutonium.
27

5. REFERENCES
1. ORNL/MD/LTR 40. “Survey of Worldwide Light Water Reactor Experience with Mixed Uranium-Plutonium Oxide Fuel, Draft Letter Report,” October 11, 1995.
2. EPRI NP-3568. “Quad Cities Nuclear and Fuel Performance Measurement,” EPRI NP-3568, Electric Power Research Institute, prepared by General Electric Company (July 1984).
3. EPRI NP-240. “Core Design and Operating Data for Quad Cities 1 Cycle 2,” EPRI NP-240, Electric Power Research Institute, prepared by General Electric Company (November 1976).
4. EPRI NP-2307-LD. “Bumup and Transuranium Element Composition in Irradiated UO,, UO,-Gd,O,, and UO$?uO, Rods From the Quad Cities-l Reactor,” EPRI NP-2307-LD, Electric Power Research Institute, prepared by General Electric Company, Interim Report (March 1982).
5. EPRI NP-214. “Gamma Scan Measurements at Quad Cities Nuclear Power Station Unit 1 Following Cycle 2,” EPRI NP-214, Electric Power Research Institute, prepared by General Electric Company, Final Report (July 1976).
6. HELIOS-DOC. “HELIOS: Angularly Dependent collision Probabilities,” Eduardo A. Villarino et al., Nucl. Sci. & Eng., Volume 112, pp.16-3 1.
7. NEDC-25492. “Gamma Scan Measurements at Quad Cities 1 Following Cycle 4,” NEDC- 25492, General Electric Company, San Jose, CA (November 1981).
8. NEDO-32638. “Optimization and Implementation Study of Plutonium Disposition Using Existing GE Boiling Water Reactors,” GE Nuclear Energy, September 30, 1996.
9. GE-CONVER. Conversations with General Electric personnel, General Electric Corporation (September 1997).
10. QUAD-CONVER. Conversation with Commonwealth Edison personnel, Commonwealth Edison (October 1997).
11. SCALE-DOC. “SCALE 4.3: Modular Code System for Performing Standaradized Computer Analyses for Licensing Evaluation for Workstations and Personal Computers,” Oak Ridge National Laboratory, CCC-545 (September 1995).
29

APPENDIX A. HISTORICAL ASSESSMENT OF QUAD CITIES (BWR) MOX IRRADIATION, ~ _
1. INTRODUCTION
The early program associated with the use of MOX in BWRs started with a series of irradiations in the Vallecitos BWR. The testing proceeded with the irradiation of rods containing Dresden self- generated plutonium. Four MOX bundles containing a single MOX rod per bundle were inserted into Dresden 1 in 1967. Because of the limited scope, the small amounts of MOX that were employed, and the fact that later irradiation data from other reactors were more plentiful, no further consideration of the Dresden irradiations was undertaken. Based on these considerations, a judgment was made that this irradiation would not be specifically researched for information.
The start of an extensive series of domestic BWR irradiations in the Big Rock Point Reactor (BRP) commenced with the loading of 16 bundles (each containing 2 MOX rods) in May 1969. GE and Exxon Nuclear fabricated bundles for BRP. BRP was considered to be a test bed for MOX fuel during the mid 1970s. Plutonium concentrations ranged from 1.2 to 9.1 wt %, with bumups performed in excess of 30 GWd/t. Some BRP rods were ramp tested under power excursion conditions. The BRP irradiations provided valuable data needed to proceed with MOX utilization. A license allowing up to 50 kg of plutonium was issued. In terms of domestic irradiations, BRP has the most extensive experience with MOX fuel. According to ORNL/MD/LTR 40, Consumer’s Power loaded 18 (Exxon Nuclear) 11 by 11 bundles, each containing 24 MOX rods in 1974. Eight additional MOX (Exxon Nuclear) bundles were loaded in 1976. However, according to reference NRC-GINNA, the sequential loading of MOX rods (produced by Exxon Nuclear) consisted of 2,6, 12,8, and 14 11 by 11 bundles.
Extensive testing using the “island” design concept was also performed in the Quad Cities reactor. The “island” assembly design has MOX rods in the center of the fuel assembly surrounded by UO, rods. Initially, the Vermont Yankee reactor was scheduled to be the host reactor for these irradiations. However, because of licensing issues, the fuel was redesigned and modified for insertion into the Quad Cities-l reactor. A license to operate the MOX fuel was granted to Commonwealth Edison in June 1974, and five assemblies were inserted into Quad Cities at the beginning of cycle 2. The Quad Cities irradiation constitutes the most recent testing of MOX fuel performed in a U.S. BWR. The information that has been currently reviewed also indicates that the most comprehensive fuel testing on BWR fuel was performed on the Quad Cities fuel.
2. DESCRIPTION OF IFtRADlATIONS AND MEASUREMENTS
2.1 QUAD CITIES MOX IRRADIATION TEST PROGRAM
The loading arrangement for cycle 2 contained 660 initial 7 by 7 bundles, 23 7 by 7 reload bundles, 36 8 by 8 reload bundles and 5 MOX bundles, which were 7 by 7 bundles. The 5 bundles began operation July 21, 1974. A total of 48 MOX fuel rods were placed into the core initially. Four (GEB 158,159,160, and 16 1, each containing 10 MOX rods) of the 5 bundles were placed around the center control rod and operated there until discharge (although several reconstitutions were performed). A fifth bundle (GEB 162) containing 8 rods was located at the core periphery. This edge- loaded assembly provided information for a low-power, hard neutron flux environment for the MOX fuel. In addition, information for such effects as leakage, thermal flux gradient, and flow conditions at the reflector were provided.
The 48 rods contained 80%-90% fissile PuO, derived from recycled Dresden 1 fuel and USAEC material. (The isotopics are given on page 12-10 of EPRI NP-3568.) A total of four enrichments were
31

used: 2.34 and 3.62 wt % Pu fissile for hollow pellets, and 2.14 and 3.52 wt % Pu fissile for solid pellets. Five gadolinium oxide rods were used in the central bundles to increase the shutdown margin.
During cycle 2, the control rod was fully withdrawn in the latter part of the-cycle. Following the completion of cycle 2, nine fuel rods from GEB 161 and six rods from GEB 162 were discharged for destructive examinations. Rods were shuffled between bundles, some shuffled within bundles, and 15 fresh UO, rods were inserted to replace the discharged rods. Five rods from each of bundles GEB 158 and GEB 159 were swapped, and all of the UO, rods under surveillance from the central bundles were placed into one bundle. (EPRI-NP-3568) .
The five bundles were irradiated in cycle 3. There were some control rod effects on the MOX assemblies because the control blade was left l/3 inserted during the last 60 of the cycle, and these were reflected in the measurements. The current documentation (NP-2302-LD) indicates that two MOX bundles (GEB 159 and GEB 162) were diasassembled to perform a gamma scan on some single rods at the end of cycle 3. Some external mechanical modifications were made at many of the refueling outages which had no effect on the bundle design.
Operating information for cycles l-3 is summarized in EPRI NP-240 and EPRI NP-552 (which has been obtained). These operating data reports describe the bumup steps that were taken and cite the axial power distributions measured during the cycle using the traversing incore probes (TIPS). Operating information for cycles 4 and 5 has not been located but may be found in NEDC-25490 and NEDC-2549 1.
At the end of cycle 5, the four central bundles were discharged and a new bundle designated GEB 159 (delta) was reconstituted from rods out of GEB 158, GEB 159, and GEB 161. With respect to the FMDP and individual rod destructive test data, rod VPO017, which is a solid MOX rod, provides some valuable performance data.
The reconstituted bundle from EOC 5 was inserted into the previous GEB 159 position and irradiated during cycle 6. At the end of cycle 6, bundles GEB 159 (delta) and GEB162 (containing MOX fuel rods) were discharged from the reactor. Annular and solid MOX rods were irradiated in excess of 55,000 MWd/t, thereby providing high-bumup-fuel performance information. The EOC 6 results have not been located in the open literature.
2.2 QUAD CITIES MEASUREMENTS AND TESTS (applicable to possible reactor physics benchmarks)
An overall description of the measurements taken on all of the rods is contained in Table 2.1 and 2.2 of EPRI-NP-3568. The program was quite extensive, encompassing measurements that are valuable from both a reactor physics viewpoint and a materials performance viewpoint. The measurements taken at Quad Cities considered to be applicable (with respect to providing a possible physics-related benchmark) are described below.
Gamma Scans. Gamma scans (bundle and some individual rods) were taken following cycles 2-4. Cycle 5 and 6 measurements were also performed, but under a separate GE program. The gamma scans “look” for the IaLa, which is a daughter of ‘@Ba. The lmBa distribution in the fuel is a characteristic of the last 60 d of reactor operation. Thus, the primary objective of the scans is to provide a benchmark for the power distribution . Bundles are typically scanned at 12 different elevations and sometimes 24 elevations for greater detail. Individual rod measurements generally covered 8 locations and provide pin-to-pin power distribution benchmarks. Three topical reports cover cycles 2,3, and 4 gamma-scan measurements (the first two are EPRI reports; the fourth cycle is an NEDC document, see pp. 7-21 of EPRI-NP3568).
Following cycles 2 and 3, all five MOX bundles were scanned. From the existing documentation, it is apparent that bundle scans were performed for EOC4, but the information concerning individual rod scans is not clear. In addition, an eighth of the core was scanned to assess the gross power shape and reload bundle power sharing. Rod-to-rod planar power distributions for
32

EOC 2 and bundle GEB-162 are shown in EPRINP3568. Rod-to-rod planar power distributions for EOC 3 and bundle GEB-159 are also shown in EPRI-NP3568. It is thought that a considerable amount of data exist in the EPRI reports and NEDC documents referred to above. Even though EPRI-NP3568 cites the value of these measurements in terms of an “accurate data base against which power distribution calculations and on-line power measurement systems have been and continue to be compared,” the comparison between measurements and calculation has not been found.
More information concerning the EOC (2,3, and 4) gamma scans are provided in Sect. 12.3.5 of EPRI-NP 3568. The axial linear heat generation rate is given for one solid MOX rod and for a number of other rods (annular MOX and UO,) at EOC 2,3, and 4. The comparison of prediction and measurements is given in this section. These heat rates are important as an input into the predictions of fission gas release. Additional information is also given in NP-2302-LD for the end-of-cycle-3 measurements.
Gadolinia depletion. Gadolinia was incorporated into a number of the UO, rods. Measurements on gadolinia depletion were performed at the end of cycle 2. Currently, gadolinia depletion is not an issue for the MOX fuel. However, it is mentioned here only from the standpoint that the widespread use of MOX will change the flux spectra and thus the gadolinia burnout in standard UO, bundles might possibly be called into question.
Cold Critical Measurements (Performed at the Start of Cycle 4). The shutdown margin with the “one rod stuck condition” (cold core) is an important criterion to be met. At the start of cycle 4, two full-length flux wires were inserted and criticality was performed by two control blade withdrawals. The wires were withdrawn, and an activation analysis was performed. From these two wires a fast flux (from a nickel wire) and a thermal flux axial shape (from a copper wire) were measured. This measurement was compared with calculations and was found to be in good agreement with the calculated value (see Figs. 10.3 and 10.4, EPRI-NP3568). It was stated that these flux distributions agreed well with the calculations. The calculated eigenvalue was quoted as 1.007, which was noted to be consistent with other calculations performed (EPRI-NP-3568). This experiment was conducted because there was interest with respect to how well the diffusion theory code could predict steep flux gradients.
Isotopic determinations. At the end of cycle 2, a total of 15 fuel rods were removed (from two bundles) and isotopic determination measurements were performed on these rods (see pp. 1 l-3 and 4; EPRI-NP 3568). Nine of the rods came from central bundle GEB161 (average bumup of 9160 MWd/t). A total of eight MOX rods (four solid, four annular) were /sampled with two annular and two solid rods from each bundle. The pellet samples were taken at four different axial planes-53.3, 144.8,236.2, and 327.7 cm above the bottom of the active fuel. Battelle was responsible for sample preparation, and the GE Vallecitos hot cell facility was used to perform the measurements. Alpha spectroscopy was used to measure 237Np, 242Crn, and 24’Am. Total americium and curium concentrations were also analyzed.
Atom density ratios for 235U, 23gPu and 241Pu were measured as a function of bumup. In addition 237~ PI 241Am, and 242Cm were also measured. The results are documented in Sect. 11 of EPRI-NP- 3568. Since only one cycle of irradiation was conducted, only low-bumup-value (up to about 13,500 MWd/t) data were reported in EPRI-NP-3568.
Radial samples were also taken. The distribution of “‘Gd and 157Gd, along with 235U depletion, 23gPu and 241Pu buildup is shown (for a UO, rod). Radial power shapes are thought to be useful because these shapes influence fission-gas release rates. The detailed mass spectrometric measurements on the gadolinia isotopes are quoted to be useful for checking cross-section libraries.
Specific nuclide information for the EOC 5 measurements have not been found. Except for the information provided below, the extent of examination is not known.
Burnup Gamma Scans (Linear-Heat-Generation Rate). One of the solid MOX rods (VPO017, which was loaded with 90% fissile plutonium) was scanned for gross gamma and 137Cs gammas at the end of cycle 5. This rod had an average bumup of 35,000 MWd/t. In addition, fission
33
gas release measurements were made providing a benchmark (which found that the annular pellets released more fission gas than the solid pellet) for BWR fuel. Power and temperature history is a significant uncertainty associated with the interpretation of fission gas measurements. The linear heat generation rate based on measured gamma scans for VP-0017 is shown in Figs. 12.3-12.5 and Fig. 12.7 (EPRI-NP-3568). EPRI-NP-3568. states that fine-mesh power histories would be desirable to have, which would allow for a comparison with the measured data. In addition to gross gamma scans, data are also presented for ‘37Cs, which is a measure of bumup.
34

APPENDIX A. REFERENCES
ORNL/MD/LTR 40. “Survey of Worldwide Light Water Reactor-Experience with Mixed Uranium-Plutonium Oxide Fuel, Draft Letter Report,” draft of October 11, 1995.
EPRI NP-3568. “Quad Cities Nuclear and Fuel Performance Measurement,” EPRI NP-3568, .Electric Power Research Institute, prepared by General Electric Company (July 1984).
EPRI NP-240. “Core Design and Operating Data for Quad Cities 1 Cycle 2,” EPRI NP-240, Electric Power Research Institute, prepared by General Electric Company (November 1976).
EPRI NP-552. “Core Design and Operating Data for Quad Cities 1 Cycle 3,” EPRI NP-552, Electric Power Research Institute, prepared by General Electric Company (March 1983).
EPRI NP-2302-LD. “Gamma Scan Measurements at Quad Cities Nuclear Power Station Unit-l Following Cycle 3,” EPRI NP-2302-LD, Interim Report (March 1982).
EPRI N’P-2307-LD. “Bumup and Transuranium Element Composition in Irradiated UO,, UO,- Gd,O,, and UO,-PuO, Rods From the Quad Cities-l Reactor,” EPRI NP-2307-LD, Electric Power Research Institute, prepared by General Electric Company, Interim Report (March 1982).
EPRI NP-214. “Gamma Scan Measurements at Quad Cities Nuclear Power Station Unit 1 Following Cycle 2,” EPRI NP-214, Electric Power Research Institute, prepared by General Electric Company, Final Report (July 1976).
NRC-GINNA. “Summary of Meeting Held on November 1, 1979,” Letter from James J. Shea (NRC) to Rochester Gas & Electric Company (RG&E).
NEDO-32638. “Optimization and Implementation Study of Plutonium Disposition Using Existing GE Boiling Water Reactors,” GE Nuclear Energy, September 30, 1996.
35

APPENDIX B. GEB-161 SURROUNDING ASSEMBLY DATA
Figures B. l-B.7 show the pin cell locations associated with the fuel. type of the surrounding assemblies for cycle 2. Definitions of fuel types (numerical indices) are given in Tables B. 1, B.2, and B.3. The axial gadolinium zoning for bundles (other than GEB 158-161) is shown in B.8. This information was taken from EPRI NP-240. The top of each page represents “reactor” north; thus, the computational model can be composed with the pin cells exactly as shown, and no transposition of the locations is necessary.
Figure B.9 shows the suggested cycle 1 nine-bundle arrangement to use if adjoining bundles are to be burned prior to the cycle 2 depletion. The term suggested is used because it is acknowledged that CX-0261was not actually in the location shown in Fig. B.9 (because it was shuffled). Bundles CX-189, CX-199, CX-155, and CX-272 are Type la initial fuel and thus have same assembly design as CX-03 10 and CX-0261 shown in Fig. B.l. However, the fuel rod locations in Fig. B.l must be transposed as appropriate.
37

Wide/Wide
3d 3d 2dT 2d 2d 2dT 3d
Id 2d
1dT
4Y Id
1 1dT
1 Id
3d 2d 1dT Id 1dT Id 2d
NOTE: S = Spacer capture rod T = Tie rod d = Dished rod in a dished bundle
Narrow/Narrow
Fig. B.l. CX-0310 and CX-0261 assemblies.
38

Narrow/Narrow
1dT 1dT Id 2d
Wide/Wide
NOTE: S = Spacer Capture Rod T = Tie Rod d = Dished Rod in a Dished Bundle
Fig. B.2 CX-0482 assembly.
39

Wide/Wide
2
1
6
P4
P2
6
5 5
2
5
Pl
P4
6
P2
5 5
2
5
P3
1
P2
P4
5 5
3 3 4
1 2 3
6 1 3
P3 5 2
Pi 5 2
6 1 2
1 2 3
Narrow/Narrow
Fig. B.3. GEB-158 assembly.
40

Wide/Wide
3 3 2 2 2 2 2 2 3 3
1 1 5 5 5 5 1 1 2 2
6 6 P3 P3 Pl Pl 6 6 1 1
P3 P3 1 1 P4 P4 P4 P4 5 5
Pl Pl P2 P2 6 6 P2 P2 5 5
6 6 P4 P4 P2 P2 6 6 5 5
1 1 5 5 5 5 5 5 1 1
Narrow/Narrow
Fig. B.4. GEB-160 assembly.
41

R
P
w
W
N
h-J
nJ
w
w
m 2 lm
nJ
-0
w 2 -0
P
-0
-0
h)
6)
* -cl
P
-0
ICI

Wide/Wide
3d 1 3d 1 2dT 1 2d 1 2dT 1 2d
3d 2 2 1 1 Id
2d / 1 1 1 / 1s / 1 / 4Y
.2dT 1 1 1 1 1
Id 1 1
3d 2d 1dT Id 1dT Id
NOTE: Narrow/Nat-row
S = Spacer capture rod T = Tie Rod d = Dished rod in a dished bundle
Fig. B.6. CX-0575 assembly.
43

Wide/Wide
3d 2d 2dT 2d 2dT 3d 3d
2d Id 1 1 2 2 3d
1dT 1 1 1 1 2 2dt
Id 4Y 1 1s 1 1 2d
1dT 1 1 1 1 1 2dT
Id 1 1 4Y 1 Id 2d
2d Id 1dT Id 2d 3d
Narrow/Narrow
NOTE:
S = Spacer capture rod T = Tie rod d = Dished rod in a dished bundle
Fig. B.7. CX-0516 assembly.
44

TYPE Z
uo2
uo2 + 0.5wt% Gd203
uo2
1
4f
Top of Active Fuel
36.in
60 in
1 in
I Bottom of Active Fuel
TYPE Y
uo2
uo2 + 3.0 wt% Gd203
uo2
-t- 3 in
il
I
in
-
1
-
Fig. B.S. Gd stack types (bundles other than MOX bundles).
45

0.37
4-lt
T 0000000 0000000 0 0 0 0 0 0‘0 0 0 cx-0310 0 0
0000000
0000000
poooooq
0000000’
0000000
0000000
0 0 CX-0482 0 0
0000000
0000000
~000000,
fooooooc?
0000000
0000000
0 0 CX-0261 0 0
0000000
0000000
(poooooo,
Note: All channel boxes are Zr-4
0000000 0000000 0000000 0 0 CX-0516 0 ()
0000000
0000000
~000000~
I 0000000;
0000000~
0000000
0 0 CX-0189 0 0
000000Qi
ooooood
p 0 0 o”.‘d b 0,
5.430
\
0000000
0000000
0000000
0 0 cx-0155 0 0
0000000
0000000
~000000
/
0.75 1 t
R0.425 (from pin centert-/
/
\
r
0 0 0 0 0 0 0
odooooo
0000000
0 0 cx-0575 0 0
0000000
0000000
_ooooooq
;m
0 cx-0199 0 0 0
0000000 138
0000000
~~000000,
T -0.08 #
\ \
/ / \
\
I /
~ooooood 0000000 0000000 0 0 CX-0272 0 0
0000000
0000000
\ooooooo, \
Fig. B.9. Suggested cycle 1 bundle arrangement.
46

Rod twe No. of rods 1 16
Id 10 1s 1 2 3
2d 11 3d 5 4Y 2
Table B.l. Type la initial fuel (Contains 2.12 wt % u5U bundle average)
(ref: EPRI NP-240, combined pp. A-3 with pp. C-1) Zirc-2 clad
% G&O, Stack density OD Wall thickness (wt %) (wt %) (gh13, (in.) (in.)
2.47 0 10.34 0.563 0.032 2.47 0 9.94 0.563 0.032 2.47 0 10.34 0.563 0.032 1.70 0 10.34 0.563 0.032 1.70 0 9.94 0.563 0.032 1.20 0 9.94 0.563 0.032 2.47 3.0 10.26 0.563 0.032
Rod type 1 Id 1s 2
2d 3d 4Y
Table B.2. Type 2a initial fuel (Contains 2.12 wt % 235U bundle average)
(ref: EPRI NP-240, combined pp. A-4 with pp. C-2) Ziro2 clad
*%J Gd,O, stack density OD Wall thickness No. of rods (wt %) (wt %) (g/cm3) (in.) (in.)
17 2.47 0 10.34 0.563 0.032 10 2.47 0 9.94 0.563 0.032 1 2.47 0 10.34 0.563 0.032 3 1.70 0 10.34 0.563 0.032 11 1.70 0 9.94 0.563 0.032 5 1.20 0 9.94 0.563 0.032 2 2.47 3.0 10.26 0.563 0.032
Table B.3. Composition of MOX bundle GEB-161 (assembly type 5, ref: EPRI NP-240, p. A-6)
Zirc-2 clad Fissile Stack Pellet Wall
No. of TJ Gd,% densit OD= thickness Rod type rods (wt % of U) (WY%, (wt a) 3 Wcm (in.) OD (in.) (in.)
1 8 2.56 0 0 10.32 0.477 0.563 0.037 2 9 1.94 0 0 10.32 0.477 0.563 0.037 3 6 1.69 0 0 10.32 0.477 0.563 0.037 4 1 1.33 0 0 10.32 0.477 0.563 0.037 5 10 3.30 0 0 10.32 0.477 0.563 0.037 6 4 2.56 0 3.0 10.19 0.477 0.563 0.037 7 1 2.56 0 2.5 10.19” 0.477 0.563 0.037 Pl (solid) 2 0.72 2.14b 0 9.8ge 0.487 0.563 0.032 P2 (solid) 3 0.72 3.52’ 0 9.8ge 0.487 0.563 0.032 P3 (annul-O.15 ID) 2 0.72 2.34’ 0 8.94‘? 0.487 0.563 0.032 P4 (annul-O.15 ID) 3 0.72 3.62’ 0 8.94= 0.487 0.563 0.032
‘OD = outside diameter. b80% Fissile blend; see following section. Fissile Pu is weight of 23gPu and 241 Pu divided by total heavy metal based on
Fig. 3.2, EPRI NP-2307~LD. ‘90% Fissile blend; see following section. Fissile Pu is weight of =‘Pu and 241Pu divided by total heavy metal based on
Fig. 3.2, EPRI NP-2307-LD. “Stack density is from Fig. 3.2, EPRI NP-2307~LD. eValue taken from EPRI NP-2307~LD, p. 3-3; conflicts with p. A-6 EPRI NP-240, which is quoted as 9.99 and 9.04 for
Pl/P2 and P3/P4, respectively.
47

APPENDIX C. ORNL HELIOS INPUT DECK LISTING
+THEL . . QUADS4=CASE('library.bin'/ 'quads4.hrf'/
'Central MOX BWR 161 at 11722MWd/t, saturated water at 286C,18 months cycle ')
! ----------------------------------------------------! ! Quad City Central MOX Assembly # 161 (top-left) White Boundary Cond.
! 1 ! ! Ott 16,97 ! ! See changes in Pu pins: we input the correct number now( w%/heavies) ! ! Nov 5, 97! ! See two types of pins UO, and MOX ! ! Nov 7,97 ! ! 5 regions in Gd pins ! ! Dee 10, 97 ! ! See right density of hollow MOX pin: 8.94 !
! ----------------------------------------------------!
!34567890123456789012345678901234567890123456789012345678901234567890123456 789 !
! !
$rcli $rclo Src2i Src20 $pitch SP2 ssp2
&m $box $bid Swide $nar $bod
;:P $sinl5 $sin30 $sin45 $sin60 $sin75
1 2 3 4 5 6 7
! ------------------------------------------------.---- ! ! data/parameters !
! ----------------------------------------------------! : = PAR("O.6058") ! UOz pin!
= PAR("O.715") = PAR("O.6185") ! MO2 pin! = PAR("O.715") = PAR("1.874") = ~AR("$pitch/2") = PAR("$pitch/%") = PAR("$rclo/2**0.5") = PAR("O.144") ! water film thickness !
! box wall thickness ! ! box inside width ! ! wide gap ! ! narrow gap ! ! box outside width !
! box comer inner radius ! ! box corner outer radius !
= PAR = PAR = PAR = PAR = PAR = PAR = PAR = PAR = PAR = PAR = PAR = PAR
$clnodes = PAR
"0.203") "13.406") "0.953") 110.475") "$bid+2*$box") "$p2+$film") "$R+$box") "0.258819") " 0 . 5 " ) Uo.707107") "0.866025") "0.965926") ("-$sin75*$R","$sin15*$RN) ("-$sin60X$R","$sin30*$R') ("-$sin45*$RW,"$sin45*SR") ("-$sin3O*$R','$sin6O"SR")
! inner box corner
(I'-$sin15*$RW,"$sin75*$R")) !-----------------------------------I
Sbclnodes = PAR(("-$sin15*$Rn,"$sin75*$R') ! above nodes,but backwards I
("-$sin30*$R","$sin6O*$R") (I'-$sin45*$R","$sin45*$RN) ("-$sin60*$R","$sin30*$RN) ("-$sin75*$R","$sinl5*$R"))
49

$c2nodes! ----------------------------------------------------!
= PAR(("-$sin75*$RP","$sin15*$RP1') ! outer box corner !
("-$sin60*$RP","$sin30*$RPV) ("-$sin45*$RP","$sin45*$RPW) (I'-$sin30*$RP",'$sin60*$RP0') ("-$sin15*$RPW,"$sin75*$RP")) !-----------------------------------!
Sbc2nodes = PAR(("-$sin15*$RPW,"$sin75*$RP") ! above nodes, but backwards !
('I-$sin30*$RP","$sin60*$RPB') (I'-$sin45*$RP","$sin45*$RPH) (I'-$sin60*$RP","$sin30*$RPS') ('I-$sin75*$RP","$sin15*$RPB'))
! ----------------------------------------------------! !Material!
! ----------------------------------------------------! ' zr-2 ' = MAT(6.55/40002,100) ! 100 % Zr2 for box ! 'zr-21' = MAT(5.704/40002,100) ! 87.1 % Zr2 for dilution gap UOz .! ' zr-22 ' = MAT(5.581/40002,100) ! 85.2 % Zr2 for dilution gap MO2 !
1 channel moderator ! 'h2o-1'=MAT(0.73749/1001,11.19;8016,88.81)!saturated water at 286 C (1033 psia) ! ! U pellets ! 'U02-l'=MAT(10.32 /92235,2.56 ;92238,97.44 ;8001,0) ! 2.56 % enr ! 'UO,-2'=MAT 'IJO,-3'=MAT 'UO,-4'=MAT 'UO,-5'=MAT ! 'UO,-6'=MAT ( !
10.32 /92235,1.94 ;92238,98.06 )8001;0) ! 1.94 % enr ! 10.32 /92235,1.69 ;92238,98.31 ;8001,0) ! 1.62 % enr ! 10.32 /92235,1.33 ;92238,98.67 ;8001,0) ! 1.33 % enr ! 10.32 /92235,3.30 ;92238,96.70 ;8001,0) ! 3.30 % enr !
U pellets w/Gd203 3.0 % ! 10.190/92235,2.189;92238,83.317;8001,11.891;64000,2.603)
U pellets w/Gd203 2.5 % ! 'U0,-7'=MAT(10.190/92235,2.200;92238,83.747;8001,11.883;64000,2.169)
!Pu-1 pellets solid 2.14% Pu fissile 80% fissile Pu nominal (80.13% real)!
'Pu-l'=MAT( 9.890/92235,0.6177;92238,85.1804;8001,11.845~;
94238,0.0059;94239,1.7832;94240,0.4358;94241,0.1053;94242,0.0266
!Pu-2 pellets solid 3.52% Pu fissile 90% fissile Pu nominal (89
'Pu-2'=MAT( 9.890/92235,0.6099;92238,84.1011;8001,11.8446;
)
.54% real)
!Pu-3 pellets hollow 2.34% PU fissile 80% fissile Pu nominal (80.13% real)! ! Dilute density !
'Pu-3'=MAT( 8.940/92235,0.6163;92238,84.9791;8001,11~8449;
94238,0.0064;94239,1.9367;94240,0.4733;94241,0.1144;94242,0.02~g)
!Pu-4 pellets hollow 3.62% Pu fissile 90% fissile Pu nominal (89.54% real)! ! Dilute density !
'Pu-4'=MAT( 8.940/92235,0.6092;92238,84.0073;8001,11.8445;
94238,0.0042;94239,3.0845;94240,0.3560;94241,0.0842;94242,0.0099) !
50

Geometry ! ! ----------------------------------------------------!
!Geometry! ! -------------------------------------------~,--------
pin1 = CCS($rcli,$rclo//fuel,cladl) ! UO, pin ! pin2 = CCS($rc2i,$rc2o//fuel,clad2) ! MO2 pin !
! Gd Pin 6 radial regions: # 1,2 10% area # 3,4,5 and 6 20% area ! Gpin
white $celll
stdcell
$ce112
stdcell2
$cellG
stdcellG
= CCS("0.316225*$rcli","0.447214"Srcli", "0.632455*$rcli","0.774597*$rcliW, "0.894427*$rcli",$rcli,$rclo// fuel,fuel,fuel,fuel,fuel,fuel,cladl)
= AL,B(l/l/l) = PAR(("-$p2", "-SP2") ("-SP2",SP2) (SP2,SP2) (SP2,"-SP2")
(“-$P2”,0) (O,SP2) (SP2,O) (o,“-sP2”) ("-$rclo",O) (O,$rclo) ($rclo,O) (O,"-Srclo") ('1-$alu,$al) ($al,$al) (Sal,"-$alw) ('1-$aln,"-Sal") /4,cool/pinl(O,O)/ 1,16,12,8,coo1;1,5,9,16,coo1;5,2,13,9,coo1;2,6,10,13,coo1; 6,3,14,10,coo1;3,7,11,14,coo1;7,4,15,11,coo1)
= STR($celll) ! MO2 cell !
= PAR(("-$p2", “-SP2”) (“-SP2”,SP2) (SP2tSP2) (SP2, “-SP2”) (‘I-SP2” IO) (0, SP2) (SP2,O) (0, “-SP2”) (m-$rclo",O) (O,$rclo) ($rclo,O) (O,"-Srclo") (u-$al",$al) ($al,$al) ($al,n-Sal") (w-$alu,n-$alm) /4,cool/pin2(0,0)/ 1,16,12,8,coo1;1,5,9,16,coo1;5,2,13,9,coo1;2,6,10,13,coo1; 6,3,14,10,coo1;3,7,11,14,coo1;7,4,15,11,coo1)
= STR(Scell2) ! Gd cell !
= PzAR(("-$p2", “-SP2”) (‘I-SP2”,$P2) (SP2,SP2) (SP2, "-SP2") (‘I-SP2”,0) (O,SP2) (SP2,O) (o,“-sP2”) ("-$rclo",O) (O,$rclo) ($rclo,O) (O,"-Srclo") ('1-$al",$al) ($al,$al) ($al,N-$al") ('1-$a,,,,,,-$alm) /B,cool/Gpin(O,O)/ 1,16,12,8,coo1;1,5,9,16,coo1;5,2,13,9,coo1;2,6,10,13,coo1; 6,3,14,10,coo1;3,7,11,14,coo1;7,4,15,11,coo1)
= STR($cellG)
!34567890123456789012345678901234567890123456789012345678901234567890123456 789 !
! ----------------------------------------------------! I corner cell !
! ----------------------------------------------------! ccell = STR(("-SR', "-$p2") ("-$R",O) Sclnodes (O,$R) ($p2,$R) ($pZ,'-$p2")
! above nodes define periphery ! (0, W-$P2W) (SP2,O) ! 11-12 ! ('1-$rclo",O) (O,$rclo) ($rclo,O) (0, 1'-$rclo") (n-$all,$al) ($al,$al) (Sal,"-$alv) ("-$all','l-Sal";
13-16 ! ! 17-20 !
/lO,cool/pinl(O,O)/ 1,20,16,11,coo1; 1,2,13,2O,cool; 2,3,4,5,17,13,coo1;5,6,7,8,14,17,coo1;8,9,18,14,coo1; 9,12,15,18,coo1;12,10,19,15,coo1)
! ----------------------------------------------------l I box corner !
! ----------------------------------------------------! boxcar = STR(("-$RP",O) $c%nodes (O,$RP) (O,$R) Sbclnodes ("-$R",O)
/14,zrbox/ / 1,2,3,4,11,12,13,14,zrbox) ! ----------------------------------------------------!
! corner water ! ! ----------------------------------------------------!
51

watcor = STR(("-$RP",O) ("-$RP",$RP) (O,$RP) $bc2nodes /8,cool/ / 1,2,6,7,8,cool)
! ----------------------------------------------------, _ . ! comer = boxcar + watcor !
----------------------------------------------------, corner = CNX(boxcor,watcor/(l,l,2)3(2,1,8))
! -______---___--------------------------------------- ! ! box side !
! _____________--------------------------------------- boxside = STR((O,O) (0,"12*$p2") (Sbox, "12*$p2")($box,O) (O,$p2) (b,"2*$p2")
(0,"3*$p2') (0,"4*$p2') (0,"5*$p2") (0,'6*$p2") (0,"7*$p2') (0,"8*$p2") (0,"9*$p2') (O,"lO*$sp2") (O,"ll*$sp2") ($box,"ll*$sp2") ($box,"lO*$sp2") ($box,"9*$p2") ($box,'8*$p2") ($box,"7*$p2') ($box,"6*$p2") ($box,"S*$p2") ($box,"4*$pZ') ($box,"3*$p2") ($box,"2*$p2") ($box,$p2) /Q,zrbox/ / 1,5,26,4,zrbox; 5,6,25,26,zrbox; 6,7,24,25,zrbox; 7,8,23,24,zrbox; 8,9,22,23,zrbox; 9,10,21,22,zrbox; 10,11,20,21,zrbox; 11,12,19,20,zrbox; 12,13,18,19,zrbox; 13,14,17,18,zrbox; 14,15,16,17,zrbox)
! ________-___----------------------------------------
! water film for edge cell 1 ! _____________--------------------------------------- !
cellfilm = STR((O,O) (O,$film) ($pitch,$film) ($pitch,O) ($p2,0) ($p2,$film) /4, cool/ /1,2,6,5,cool)
! -___________---------------------------------------- ! wide corner 1
! ______________-------------------------------------- ! WWC = STR((O,O) (O,$wide) ($wide,$wide) ($wide,O)
/ 4,cool/ / 1,2,4,cool) ----------------------------------------------------l
! narrow comer ! ! ______________-------------------------------------- !
IlllC = STR((O,O) (O,$nar) ($nar,$nar) ($nar,O) / 4,cool/ / 1,2,4,cool)
! _-___________--------------------------------------- ! ! narrow/wide and wide/narrow corners !
! --______-_-__--------------------------------------- ! nwc = STR((O, 0) (O,$nar) ($wide,$nar) ($wide,O)
/ Q,cool// 1,2,3,cool) W-I-C = STR( (0,O) (O,$wide) ($nar,$wide) ($nar,O)
/ 4,cool// 1,2,3,cool) ! ----------------------------------------------------!
! wide gap Nodes ! ---------------------------------------------------- !
wgw = STR(( "-7*$p2-$film-$box",O) ("-7*$p2-Sfilm-$box",$wide) !l 2 !
("7*$p2+$film+$box",$wide) (n7*$p2+$film+$box",0) ! 3 4 ! ("-6*$p2",0) ( "-6*$p2",$wide) !5 6! ("-5*$p2",0) ('I-5*$p2",$wide) !7 8! (I'-4*$p2",0) ("-4*$p2",$wide) ! 9 10 ! (I'-3*$p2",0) ("-3*$p2",$wide) !ll 12 ! (W-2"$P2", 0) ("-2*$p2",$wide) ! 13 14 ! ('I-$p2",0) ("-$p2",$wide) ! 15 16 ! (0,O) (O,$wide) ! 17 18 ! ("SP2", 0) ("$p2",$wide) ! 19 20 ! ("2*$p2",0) ("2*$p2",$wide) ! 21 22 ! ("3*$p2",0) ("3*$p2",$wide) ! 23 24 ! ("4*$p2",0) ("4*$p2",$wide) ! 25 26 ! ("5*$p2",0) ("5*$p2",$wide) ! 27 28 !
52

("6*$p2',0) ("6*$p2",$wide) ! 29 30 ! / 4,cool/ /1,2,6,5,cool; 5,6,8,7,cool; 7,8,10,9,cool;
9,10,12,11,coo1;11,12,14,13,coo1;13,14,16,15,coo1; 15,16,18,17,coo1;17,18,20,19,coo1;19,2-0-,22,21,coo1; 21,22,24,23,coo1;23,24,26,25,cool; 25,26,28,27,coo1;27,28,30,29,cool)
! ---------------------------------------------------- ! I narrow gap !
! _--------------------------------------------------- ! w-w = STR(("-7*$p2-$film-$box", 0) ("-7*$p2-$film-$box",$nar)
("7*$p2+$film+$box",$nar) ("7*$p2+$film+$box",O) ('I-6*$p2",0) ('I-6*$p2",$nar) ('I-5*$p2",0) ('I-5*$p2",$nar) ("-4*$p2",0) ( "-4*$p2",$nar) ("-3*$p2",0) ("-3*$p2",$nar) (a'-2*$p2",0) ("-2*$p2",$nar) ("-$pZ", 0) (*I-$p2",$nar) (O,O) (0, Snarl ("$p2",0) ("$p2",$nar) ("2*$p2",0) ("2*$p2",$nar) ("3*$p2",0) ("3*$p2",$nar) ("4*$p2",0) ("4*$p2",$nar) ("5*$p2",0) ("5*$p2",$nar) ("6*$p2",0) ("6*$p2",$nar) / 4,cool/ /1,2,6,5,cool; 5,6,8,7,cool; 7,8,10,9,cool;
9,10,12,11,coo1;11,12,14,13,coo1;13,14,16,15,coo1; 15,16,18,17,coo1;17,18,20,19,coo1;19,20,22,21,coo1; 21,22,24,23,coo1;23,24,26,25,cool; 25,26,28,27,coo1;27,28,30,29,cool)
----------------------------------------------------! ! edge cell !
! ----------------------------------------------------! edgecell = CNX(stdcell,cellfilm/ (1,2,3)3(2,1,4))
! ----------------------------------------------------! ! putting it all together 1 ! stdcell is UO, stdcelli! is MO2 1
_________-_----------------------------------------- ! row1 = CNX(ccell,edgecell,edgecell,edgecell,edgecell,edgecell,ccell/
(1,12,10)3(~-1,5,1)/(2-1,3,4)3(3-1,2,1)/(3-1,3,4)3(4-1,2,1)/ (4-1,3,4)3(5-1,2,1)/(5-1,3,4)3(6-1,2,1)/(6-1,7,4)3(7,11,10))
row2 CNX(edgec~ll,stdcellG,stdcell2,stdcell2,stdcellG,stdcell,edgecel~~
(1-1,4,1)3(2,2,1)/(2,3,4)3(3,2,1)/(3,3,4)3(4,2,1)/ (4,3,4)3(5,2,1)/(5,3,4)3(6,2,1)/(6,3,4)3(7-1,1,4))
row3 CNX(edgec~ll,stdcell2,stdcellG,stdcell2,stdcell2,stdcell,edgecell/
(1-1,4,1)3(2,2,1)/(2,3,4)3(3,2,1)/(3,3,4)3(4,2,1)/ (4,3,4)3(5,2,1)/(5,3,4)3(6,2,1)/(6,3,4)3(7-1,1,4))
row4 c~(edgec~ll,stdcell2,stdcell2,stdcell,stdcell2,stdcell,edgecell/
(1-1,4,1)3(2,2,1)/(2,3,4)3(3,2,1)/(3,3,4)3(4,2,1)/ (4,3,4)3(5,2,1)/(5,3,4)3(6,2,1)/(6,3,4)3(7-1,1,4))
row5 c~(edgec~ll,stdcellG,stdcell2,stdcell2,stdcellG,stdcell,edgecell~
(1-1,4,1)3(2,2,1)/(2,3,4)3(3,2,1)/(3,3,4)3(4,2,1)/ (4,3,4)3(5,2,1)/(5,3,4)3(6,2,1)/(6,?,4)3(7-1,1,4))
row6 = CNX(edgecell,stdcell,stdcell,stdcell,stdcell,stdcell,edgecell/ (1-1,4,1)3(2,2,1)/(2,3,4)3(3,2,1)/(3,3,4)3(4,2,1)/ (4,3,4)3(5,2,1)/(5,3,4)3(6,2,1)/(6,3,4)3(7-1,1,4))
row7 = CNX(ccell,edgecell,edgecell,edgecell,edgecell,edgecell,ccell/ (1,10,11)3(2-1,4,7)/(2-1,1,2)3(3-1,4,3)/(3-1,1,2)3(4-1,4,3)/
53

(4-1,1,2)3(5-1,4,3)/(5-1,1,2)3~6-1,4,3)/(6-1,1,5)3(7,10,12)) assm = CNX(rowl,row2,row3,row4,row5,row6,row7/ (l-2-1,4,1)3(2-2,3,2)/
(2-2,4,1)3(3-2,3,2)/(3-2,4,1)3(4-2,3,2)/(4-2,.?,_1)3(5-2,3,2)/ (5-2,4,1)3(6-2,3,2)/(6-2,4,1)3(7-2-1,1,4))
square = CNX(corner,boxside,corner,boxside,corner,boxside,corner,boxside/ (1-1,7,8)3(2,1,4)/(2,2,3)3(3-1,1,14)/(3-1,7-,8)3(4,1,4)/ (4,2,3)3(5-1,1,14)/(5-1,7,8)3(6,1,4)/(6,2,3)3(7-1,1,14)/ (7-1,7,8)3 (8,1,4) 1
! __----____------------------------------------------ ! ! outside moderator !
! ----------------------------------------------------! outmod = CNX(nnc,ngap,nwc,wgap,wwc,wgap,wgap,c,ngap/(l,3,4)3(2,2,1)/
(2,3,4)3(3,2,1)/(3,4,1)3(4,4,3)/(4,1,2)3(5,3,2)/ (5,1,2)3(6,2,1)/(6,3,4)3(7,4,3)/(7,2,3)3(8,2,1))
system = CNX(outmod,square,assm/(l-2,5,1)3(2-l-2,3,2)/ (2-2,26,4)3(3-l-1,9,8))
system = BDRY((l-1,2,2)3(white)) ! ----------------------------------------------------l
! overlays ! _____________--------------------------------------- !
allmat = OVLM('h2o-1' /*-*-**/ '.zr-2' /*-*-0-zrbox/ 'zr-21' /*-*-*-cladl/ 'zr-22' /*-*-*-clad2/ 'UO,-1'/3-l-l-pinl-fuel,3-l-5-l-pinl-fuel,3-2-6-pinl-fuel,
3-4-4-pinl-fue1,3-5-l-l-pinl-fuel,3-5-6-pinl-fuel, 3-6-2-pinl-fue1,3-6-5-pinl-fuel/
'UO,-2'/3-1-6-1-pinl-fuel,3-2-7-l-pinl-fuel,3-3-7-l-pinl- fuel,
3-4-7-l-pinl-fue1,3-6-1-1-pinl-fuel,3-6-6-pinl- fuel,
3-7-2-1-pinl-fue1,3-7-3-l-pinl-fuel,3-7-4-l-pinl- fuel/
'UO,-3'/3-1-7-pinl-fuel,3-5-7-l-pinl-fuel,3-6-7-l-pinl-fuel, 3-7-l-pinl-fue1,3-7-5-1-pinl-fuel,3-7-6-l-pinl-
fuel/ 'IJO,-4'/3-7-7-pinl-fuel/ 'UO,-5'/3-1-2-1-pinl-fuel,3-l-3-l-pinl-fuel,3-l-4-l-pinl-fuel,
3-2-l-l-pinl-fue1,3-3-1-1-pinl-fuel, 3-3-6-pinl-fue1,3-4-l-l-pinl-fuel,3-4-6-pinl-fuel, 3-6-3-pinl-fue1,3-6-4-pinl-fuel/
! Gd Pins ! 'UO,-6'/3-2-5-Gpin-fuel,3-3-3-Gpin-fuel,3-5-2-Gpin-fuel,
3-5-5-Gpin-fuel/ 'UO,-7'/3-2-2-Gpin-fuel/
! Pu Pins ! 'Pu-1'/3-3-5-pin2-fuel,3-5-3-pin2-fuel/ 'Pu-2'/3-2-3-pin2-fuel,3-3-2-fue1,3-3-4-pin2-fuel/ 'Pu-3'/3-4-5-pin2-fuel,3-5-4-pin2-fuel/ 'Pu-4'/3-2-4-pin2-fuel,3-4-2-pin2-fuel,3-4-3-pin2-fuel)
! Nov 3,97 T-water=286 c=559 K, Tfuel=560 C= 833 K, Tcladl=Average of two ! allT = OVLT(559/*-*-**/696/*-*-*-cladl/696/*-*-*-clad2/833/*-*-*-fuel) allD = OVLD(1.0 /*-*-**) mos = OVSM(allmat) dos = OVSD(allD) tos = OVST(allT)
__________-__--------------------------------------- ! ----------------------------------------------------,
! Cycle 2 Burnup: July 21,1974 to Jan 2,1976: 531 days' ! st = STAT(mos,dos,tos,22.07) ! 22.07 Mw/tOn initial ! Path = PATH(/ (St), 11722/12) ! 11722/22.07=531 days
54
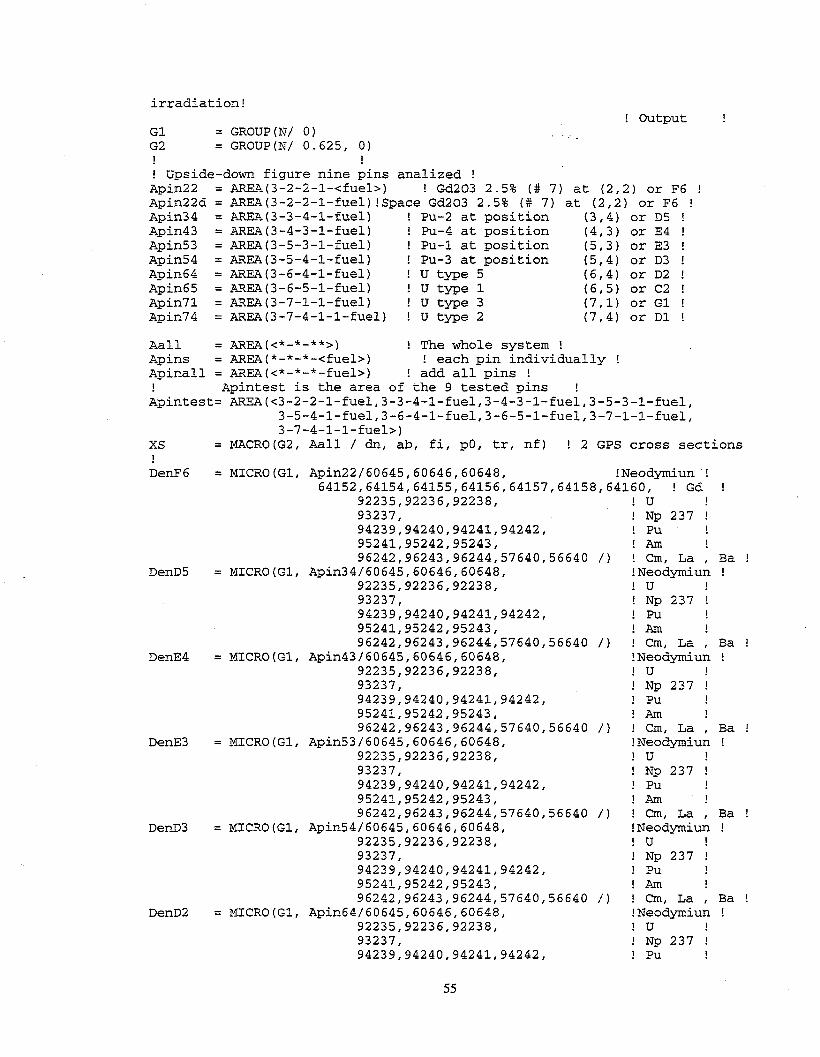
irradiation! ! output !
Gl = GROUP(N/ 0) G2 = GROUP(N/ 0.625, 0) ! I ! Upside-down figure nine pins analized ! Apin = AREA(3-2-2-1-<fuel>) ! Gd203 2.5% (# 7) at (2,2) or F6 ! Apin22d = AREA(3-2-2-l-fuel)!Space Gd203 2.5% (# 7) at (2,2) or F6 ! Apin = AREA(3-3-4-l-fuel) ! Pu-2 at position (3,4) or D5 ! Apin = AREA(3-4-3-l-fuel) ! Pu-4 at position (4,3) or E4 ! Apin = AREA(3-5-3-l-fuel) ! Pu-1 at position (5,3) or E3 ! Apin = AREA(3-5-4-l-fuel) ! Pu-3 at position (5,4) or D3 ! Apin64 =AREA Apin = AREA Apin = AREA Apin = AREA
Aall =AREA Apins = AREA
3-6-4-l-fuel) ! Utype 5- (6,4) or D2 ! 3-6-5-l-fuel) ! Utypel (6,5) or C2 ! 3-7-l-l-fuel) ! Utype 3 (7,l) or Gl ! 3-7-4-l-l-fuel) ! Utype 2 (7,4) or Dl !
<X-*-f*>) ! The whole system ! *-*-*-<fuel>) ! each pin individually !
Apinall = AREA(<*-*-*-fuel>) ! add all pins ! ! Apintest is the area of the 9 tested pins ! Apintest= AREA(~3-2-2-1-fue1,3-3-4-l-fuel,3-4-3-1-fuel,3-5-3-l-fuel,
xs ! DenF6
DenD5
DenE4
DenE3
DenD3
DenD2
3-5-4-1-fue1,3-6-4-1-fuel,3-6-5-l-fuel,3-7-l-l-fuel, 3-7-4-l-l-fuel>)
= MACRO(G2, Aall / dn, ab, fi, p0, tr, nf) ! 2 GPS cross sections
= MICRO(G1, Apin22/60645,60646,60648, !Neodymiun ! 64152,64154,64155,64156,64157,64158,64160, ! Gd !
92235,92236,92238, ! u ! 93237, ! Np 237 ! 94239,94240,94241,94242, ! Pu I 95241,95242,95243, !Am ! 96242,96243,96244,57640,56640 /) ! Cm, La , Ba !
= MICRO(G1, Apin34/60645,60646,60648, !Neodymiun ! 92235,92236,92238, ! u ! 93237, ! Np 237 ! 94239,94240,94241,94242, ! Pu ! 95241,95242,95243, !AIIl ! 96242,96243,96244,57640,56640 /) ! Cm, La , Ba !
= MICRO(G1, Apin43/60645,60646,60648, !Neodymiun ! 92235,92236,92238, ! u ! 93237, ! Np 237 ! 94239,94240,94241,94242, ! Pu ! 95241,95242,95243, !AITl ! 96242,96243,96244,57640,56640 /) ! Cm, La , Ba !
= MICRO(G1, Apin53/60645,60646,60648, !Neodymiun ! 92235,92236,92238, ! u I 93237, ! Np 237 ! 94239,94240,94241,94242, ! Pu ! 95241,95242,95243, !AIIl ! 96242,96243,96244,57640,56640 /) ! Cm, La , Ba !
= MICRO(G1, Apin54/60645,60646,60648, !Neodymiun ! 92235,92236,92238, ! u ! 93237, ! Np 237 ! 94239,94240,94241,94242, ! Pu ! 95241,95242,95243, !Alll ! 96242,96243,96244,57640,56640 /) ! Cm, La , Ba !
= MICRO(G1, Apin64/60645,60646,60648, !Neodymiun ! 92235,92236,92238, ! u I 93237, ! Np 237 ! 94239,94240,94241,94242, ! Pu !
55

95241,95242,95243, 96242,96243,96244,57640,56640 /)
DenC2 = MICRO(G1, Apin65/60645,60646,60648, 92235,92236,92238, 93237, 94239,94240,94241,94242,
. 95241,95242,95243, 96242,96243,96244,57640,56640 /)
DenGl = MICRO(G1, Apin71/60645,60646,60648, 92235,92236,92238, 93237, 94239,94240,94241,94242, 95241,95242,95243, 96242,96243,96244,57640,56640 /)
DenDl = MICRO(G1, Apin74/60645,60646,60648, 92235,92236,92238, 93237, 94239,94240,94241,94242, 95241,95242,95243, 96242,96243,96244,57640,56640 /)
! Gd pin details densities in radial direction ! DenF6d = MICRO(G1, Apin22d/60645,60646,60648,
64152,64154,64155,64156,64157,64158,64160, 92235,92236,92238, 93237, 94239,94240,94241,94242, 95241,95242,95243, 96242,96243,96244,57640,56640 /)
Buppin = MACRO(G1, Apins/bu) ! burnup for each pin ! Buppinall = MACRO(G1, Apinall/bu) ! burnup for all pins!
!ARl ! ! Cm, La , Ba ! !Neodymiun !
‘! u ! ! Np 237 ! ! Pu ! !AlTl ! ! Cm, La , Ba ! !Neodymiun ! ! u ! ! Np 237 ! ! Pu ! !AIll ! ! Cm, La , Ba ! !Neodymiun ! ! u ! ! Np 237 ! ! Pu ! !AItl ! ! Cm, La , Ba !
!Neodymiun ! ! Gd ! ! u I ! Np ! ! Pu ! !AIIl ! ! Cm, La, Ba !
Buppintest= MACRO(G1, Apintest/bu) ! burnup for 9 pins tested! BuppinGd = MACRO(Gl, Apin22d/bu) ! details burnup for Gd pin F6 !
BuppinF6 = MACRO(G1, Apin22/bu) ! BuppinD5 = MACRO(G1, Apin34/bu) ! BuppinE4 = MACRO(G1, Apin43/bu) ! BuppinE3 = MACRO(G1, Apin53/bu) ! BuppinD3 = MACRO(G1, Apin54/bu) ! BuppinD2 = MACRO(G1, Apin64lbu) ! BuppinC2 = MACRO(G1, Apin65/bu) ! BuppinGl = MACRO(G1, Apin7l/bu) ! BuppinDl = MACRO(G1, Apin74/bu) ! QUADS4=RUN()
burnup for Gd pin F6 ! burnup for pin D5 ! bumup for pin E4 ! burnup for pin E3 ! bumup for pin D3 ! burnup for pin D2 ! burnup for pin C2 ! burnup for pin Gl ! burnup for pin Dl !
56

APPENDIX D. MEASURED AND CALCULATED VALUES OF ISOTOPICS, RELATIVE PIN POWER, AND BURNUP BY PIN
Table D.l. Gadolinium isotopic distributions at end of cycle 2a
Pin burnup = 7179 MWd/t Measured Measurement Calculated atom density Calculated
Isotope at. % error % Wbarwcm) relative at. % C/M “*Gd 0.1700 11.00 1.3532E-06 0.19036 1.1200
ls4Gd 2.1100 3.00 1.4353B05 2.01912 0.9560 ls5Gd 0.0225 14.00 8.4258B08 0.01185 0.5267 156Gd 35.2800 0.60 2.566OE-04 36.09747 1.0230 ls7Gd 0.0281 15.00 6.5990B08 0.00928 0.3300
“*Gd 40.7100 0.50 2,7872E-04 39.20922 0.9630
16’Gd 21.7000 0.50 1.5976E-04 22.47440 1.0350 Total 100 - 7.1085304 100.00000 -
aCentral assembly GEB-16. Pin F6 characteristics: UOz type 7, enrichment 2.56 wt %, 2.5 wt % Gd,O,.
57

Table D.2. Pin D3 of GEB-161: Isotopic comparison [Pin description: Pu type P3, hollow, Pu isotopics 80% fissile, Pu enrichment 2.34 wt % (heavy metals)]
Measured Nuclide value’
Measurement Calculated atom deyity C&uhted error % (atomshamcm) normalized value C/M ratio
235~ 5.386B03 0.80 l.O17E-04 5.29 lE-03 0.982
YJ 3.91 lE-04 2.00 7.288B06 3.792E-04 0.969 238~ 9.938E-01 0.05 1.91OE-02 9.934E-01 1 .oOo
237Np 5.534E-05 18.00 8.1 lOE-07 4.219E-05 0,762
ugPu 1.331B02 0.10 2.538B04 1.32OE-02 0.992
2%.l 7.625B03 0.20 1.461B04 7.602E-03 0.997
%‘Pu 2.601B03 0.50 4.970E-05 2.585E-03 0.994
242Pu 7.221B04 1.00 1.321E-05 6.87OE-04 0.95 1
“‘Am 2.588B04 30.00 2.085E-06 l.O85E-04 0.419
“3Am 8.278B05 30.00 1.609B06 8.373E-05 1.011
242Cm 7.246E-05 12.00 2.516E-07 1.309E-05 0.181
243Cm + 244Cm 1.494B05 14.00 2.392E-07 1.245E-05 0.833
145Nd 4.415E-04 2.20 8.135E-06 4.232E-04 0.959
‘46Nd 3.876E-04 2.00 7.108E-06 3.698E-04 0.954
14’Nd 2.438E-04 0.70 4.5 18E-06 2.351B04 0.964
=atom density ratio to initial “‘U atom density. ‘atom density ratio to calculated initial 238U atom density (1.922E-02).
Table D.3. Pin D3 of GEB-161: Pin power comparison
Calculated Measured normalized
Measurement Calculated 14’Ba normalized pin
pin power power C/M (avg. of 9 rods = 1) error % (atoms/barn-cm) (avg. of 9 rods = 1) ratio (C/M-l)*lOO
0.968 1.7 4.874B07 0.915 0.945 -5.6
Table D.4. Pin D3 of GEB-161: Burnup comparison
Measured pin Calculated pin burnup MWdk burnuu MWd/t C/M ratio KYM-l)*lOO
13100 13089 0.999 -0.1
58

Table D.5. Pin D5 of GEB-161: Isotopic comparison IPin description: Pu type P2, solid, Pu isotopics 90% fissile, Pu enrichment 3.52 wt % (heavy metals)]
Measured Measurement Calculated atom density Calculated Nuclide value’ error % (atoms/barn*cmY normalized value C/M ratio
z35u 5.772E-03 0.80 1.227E-04 5.828E-03 1.010 236~ 3.025B04 2.00 6.448E-06 3.064E-04 1.013
=*U 9.940E-01 0.05 2.092B02 9.938E-01 1 .ooo
237Np 5.334B05 18.00 8.791E-07 4.177E-05 0.783
23gPu 2.425B02 0.10 5.087E-04 2.417E-02 0.997
24%J 7.425E-03 0.20 1.556E-04 7.392E-03 0.996
%rPu 2.303E-03 0.50 4.86OE-05 2.309E-03 1.003
242Pu 3.374E-04 1 .oo 6.620B06 3.146E-04 0.932
241Am 2.269B04 30.00 2.OOOE-06 9.502E-05 0.419
243Am 3.728E-05 30.00 7.662B07 3.641B05 0.977
‘“Cm 4.26OE-05 12.00 1.72OE-07 8.173E-06 0.192
243Cm + 244Cm 5.589B06 14.00 l.O2OE-07 4.846E-06 0.867
145Nd 4.187E-04 2.20 8.729B06 4.148B04 0.991
‘46Nd 3.695E-04 2.00 7.58OE-06 3.602E-04 0.975
‘&Nd 2.332E-04 0.70 4.848B06 2.303E-04 10.988
‘atom density ratio to initial =‘U atom density. ‘atom density ratio to calculated initial 238U atom density (2.104E-02).
Table D-6. Pin D5 of GEB-161: Pin power comparison Calculated
Measured normalized normalized pin pin power Measurement Calculated 14’Ba power
(ave. of 9 rods = 1) error % (atoms/barn-cm) (ave. of 9 rods = 1) C/M ratio (C/M-1klOO
1.046 1.7 5.628B07 1.056 1.010 1.0
Table D.7. Pin D5 of GEB-161: Burnup comparison
Measured pin Calculated pin burnup MWd./t burnup MWdk C/M ratio KYM-1klOO
12500 12831 1.027 2.7
59

Table D.8. Pin E3 of GEB-161: Isotopic comparison [Pin description: Pu type Pl, solid, Pu isotopics 80% fissile, Pu enrichment 2.14 wt % (heavy metals)]
Measured Measurement Calculated atom density C&&ted Nuclide value’ error % (atoms/barn-cm) normalized value C/M ratio
235U 5.3 1 lE-03 0.80 l.l42E-04 5.356E-03 1.008
=?I 3.481B04 2.00 7.895E-06 3.704E-04 1.064
u8U 9.941E-01 0.05 2.118E-02 9.935E-01 0.999
u7Np NA 18.00 8.876B07 4.164E-05 NA
23gPu 1.306E-02 0.10 2.706E-04 1.27OE-02 0.972
240pU 6.955B03 0.20 1.481B04 6.948B03 0.999 24’Pu 2.371E-03 0.50 5.077B05 2.382E-03 1.005
242Pu 6.392E-04 1 .oo 1.3 1 lE-05 6.152E-04 0.962
24’Am 3.025E-04 30.00 2.141E-06 l.O04E-04 0.332
243Am 8.468E-05 30.00 1.620E-06 7.601E-05 0.898
242Cm 7.325E-05 12.00 2.505B07 l.l75E-05 0.160
243Cm + 244Cm 1.489B05 14.00 2.414E-07 1.133B05 0.761
‘“Nd 3.865E-04 2.20 8.252E-06 3.872E-04 1.002
‘46Nd 3.442E-04 2.00 7.201E-06 3.378E-04 0.982
14’Nd 2.16OE-04 0.70 4.57OE-06 2.144E-04 0.993
‘atom density ratio to initial =‘U atom density. ‘atom density ratio to calculated initial 238U atom density (2.13 lE-02).
Table D.9. Pin E3 of GEB-161: Pin power comparison
Calculated Measured normalized normalized pin
pin power Measurement Calculated 14’Ba power (avg. of 9 rods = 1) error % (atoms/barn-cm) (avg. of 9 rods = 1) C/M ratio (C/M-1)*100
0.954 1.7 5.019E-07 0.942 0.987 -1.3
Table D.lO. Pin E3 of GEB-161: Bumup comparison
Measured pin Calculated pin bumup MWd/t bumuu MWdft c/M ratio K/M-1~~100
11600 11958 1.031 3.1
60
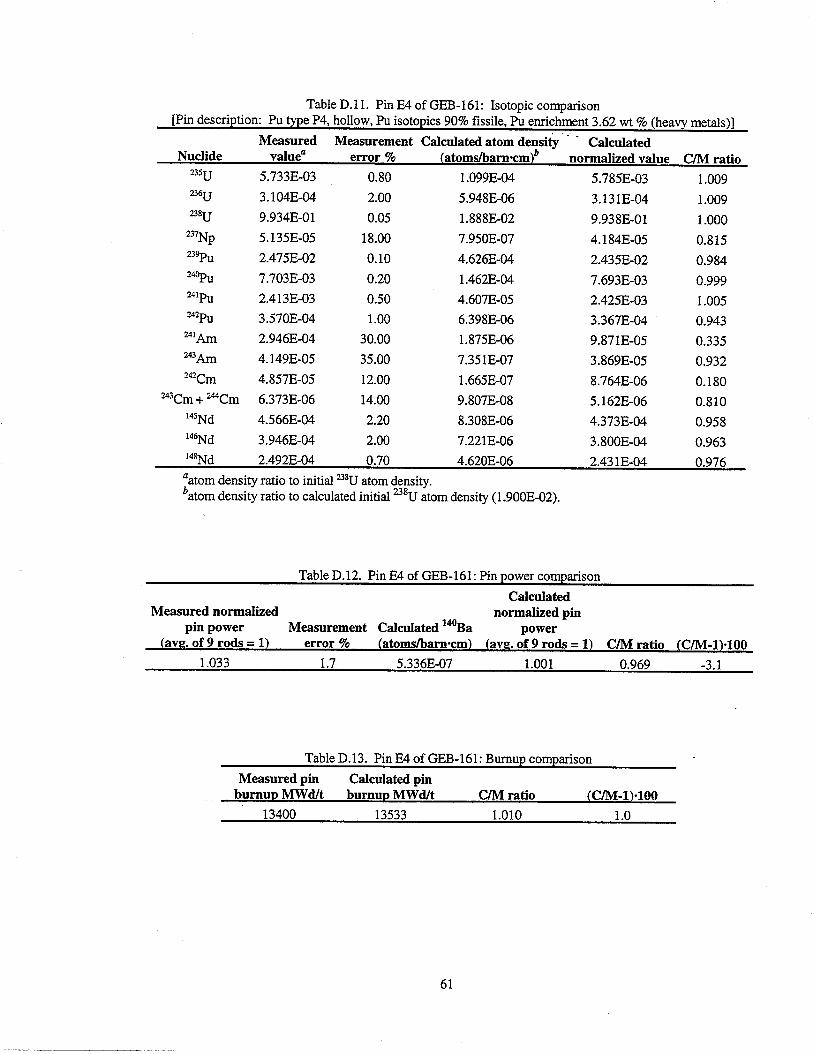
Table D.11. Pin E4 of GEB-161: Isotopic comparison [Pin description: Pu type P4, hollow, Pu isotopics 90% fissile, Pu enrichment 3.62 wt % (heavy metals)]
Measured Measurement Calculated atom dens& - Calculated Nuclide valuea error % (atoms/barn-cm))) normalized value C/M ratio
235~ 5.733E-03 0.80 l.O99E-04 5.785B03 1.009 YJ 3.104E-04 2.00 5.948B06 3.131E-04 1.009 238U 9.934E-01 0.05 1.888E-02 9.938B01 1 .ooo 237Np 5.135E-05 18.00 7.95OE-07 4.184E-05 0.815 23%1 2.475E-02 0.10 4.626E-04 2.435B02 0.984 2‘FPU 7.703E-03 0.20 1.462E-04 7.693B03 0.999 241Pu 2.413B03 0.50 4.607B05 2.425B03 1.005 242Pu 3.57OE-04 1 .oo 6.398E-06 3.367E-04 0.943 241Am 2.946E-04 30.00 1.875B06 9.871B05 0.335 243Am 4.149B05 35.00 7.351B07 3.869E-05 0.932 242Cm 4.857E-05 12.00 1.665E-07 8.764E-06 0.180
243Cm + mCm 6.373E-06 14.00 9.807B08 5.162E-06 0.810 ‘45Nd 4.566E-04 2.20 8.308B06 4.373E-04 0.958 ‘46Nd 3.946B04 2.00 7.221E-06 3.8OOE-04 0.963 14’Nd 2.492E-04 0.70 4.620E-06 2.43 lE-04 0.976 ‘atom density ratio to initial 238U atom density. ‘atom density ratio to calculated initial 238U atom density (1.9OOE-02).
Table D.12. Pin E4 of GEB-161: Pin power comparison
Calculated Measured normalized normalized pin
pin power Measurement Calculated 14’Ba power (avg. of 9 rods = 1) error % (atoms/barn-cm) (avg. of 9 rods = 1) C/M ratio (C/M-1)-100
1.033 1.7 5.336E-07 1.001 0.969 -3.1
Table D.13. Pin E4 of GEB-161: Burnup comparison
Measured pin Calculated pin burnup MWd/t burnuv MWdJt C/M ratio KYM-1klOO
13400 13533 1.010 1.0
61

Table D.14. Pin C2 of GEB-161: Isotopic comparison (Pin description: UO, type 1, enrichment 2.56 wt %)
Measured Measurement Calculated atom density Cheated Nuclide value’ error 70 (atoms/barn-cmjb normalized value C/M ratio
235~ 1.527B02 0.80 3.433E-04 1.531B02 1.002 236~ 2.083B03 2.00 4.220E-05 1.882B03 0.903 u8U 9.923E-01 0.05 2.227E-02 9.927B01. 1 .ooo
u7Np 8.274E-05 18.00 1.63OE-06 7.269B05 0.879
ugPu 3.328E-03 0.10 7.018E-05 3.129E-03 0.940
24PU 8.066E-04 0.30 1.735E-05 7.737E-04 0.959 241Pu 2.828E-04 0.50 5.363E-06 2.39 lE-04 0.846
242Pu 3.874E-05 1.40 6.850B07 3.054E-05 0.788 241Am 8.923B06 -’ l.O03E-07 4.470E-06 0.501. 243Am 2.51OE-06 -’ 3.748E-08 1.671E-06 0.666
242Cm 8.802E-07 12.00 1.257E-08 5.605E-07 0.637
243Cm + 244Cm 2.091E-07 1.40 2.789E-09 1.244E-07 0.595
145Nd 4.41 lE-04 2.20 1 .OOlE-05 4.465E-04 1.012
‘46Nd 3.74OE-04 2.00 8.447E-06 3.766E-04 1.007
14’Nd 2.107E-04 0.70 4.747B06 2.117E-04 1.005
‘atom density ratio to initial z8U atom density. batom density ratio to calculated initial 238U atom density (2.243E-02). ‘Quoted measurement error so high that measurement judged to have little value.
Table D.15. Pin C2 of GEB-161: Pin power comparison
Calculated Measured normalized normalized pin
pin power Measurement Calculated 14’Ba power (avg. of 9 rods = 1) error % (atoms/barn-cm) (avg. of 9 rods = 1) C/M ratio (C/M-1)-100
1.022 1.7 5.496E-07 1.031 1.009 0.9
Table D.16. Pin C2 of GEB-161: Bumup comparison
Measured pin Calculated pin bumur, Mwd/t bumup MWd/t C/M ratio 0M-1)~100
11450 11556 1.009 0.9
62

Table D. 17. Pin D 1 of GEB-161: Isotopic comparison (Pin description: UO, type 2, enrichment 1.94 wt %)
Measured Measurement Calculated atom dens& Calculated Nuclide value’ error % (atoms/baru-cm)b normalized value C/M ratio
235U 9.808E-03 0.80 2.159E-04 9.563E-03 0.975 “V 1.867E-03 2.00 3.793B05 1.681E-03 0.900 u8U 9.908E-01 0.05 2.239B02 9.918B01 1.001 237Np 9.229B05 18.00 1.585B06 7.022E-05 0.761
23gPu 3.276E-03 0.10 6.82OE-05 3.022E-03 0.922
24%1 9.999B04 0.30 2.171B05 9.620E-04 0.962 241Pu 3.563E-04 0.50 6.829E-06 3.026E-04 0.849 242Pu 6.64OE-05 1.40 1.204E-06 5.333B05 0.803
241b 3.023E-06 -= 1.278E-07 5.66OE-06 1.872
243Am 3.748E-06 -’ 7.224B08 3.2OOE-06 0.854
242Cm l.l16E-06 12.00 2.05 lE-08 9.087E-07 0.814
243Cm+2dACm 3.525B07 14.00 6.053B09 2.682E-07 0.761
‘45Nd 4.453E-04 2.20 9.946B06 4.407B04 0.990
146Nd 3.97 lE-04 2.00 8.55OE-06 3.788E-04 0.954
14’Nd 2.213E-04 0.70 4.834B06 2.141B04 0.968
‘atom density ratio to initial 238U atom density, batom density ratio to calculated initial 238U atom density (2.257E-02). ‘Quoted measurement error so high that measurement judged to have little value.
Table D.18. Pin Dl of GEB-161: Pin power comparison Calculated
Measured normalized normaliied pin pin power Measurement Calculated 14’Ba power
(avg. of 9 rods = 1) error % (atomsharmcm) (avg. of 9 rods = 1) C/M ratio K/M-1)*100
0.995 1.7 5.303E-07 0.9951 1 .oOO 0.0
Table D.19. Pin Dl of GEB-161: Bumup comparison
Measured pin Calculated pin bumup Mwd/t burnup MWd/t c/M ratio KVM-1)~lOO
12100 11754 0.971 -2.9
63

Table D-20. Pin D2 of GEB-161: Isotopic comparison (Pin description: UO, type 5, enrichment 3.30 wt %)
Measured Measurement Calculated atom density C&&ted Nuclide value’ error % (atoms/barnsmjb normalized value C/M ratio
u5U 2.151E-02 0.60 4.754E-04 2.136B02 0.993 YJ 2.325E-03 2.00 4.994B05 2.244E-03 0.965 238~ 9.915E-01 0.05 2.21OE-02 9.929E-01 1.001 237Np l.O79E-04 18.00 1.795B06 8.062E-05 0.747 23gPu 3.452E-03 0.10 7.206E-05 3.237E-03 0.938
240pU 7.219B04 0.30 1.561E-05 7.013B04 0.971
241Pu 2.581B04 0.50 4.865B06 2.186E-04 0.847 242Pu 2.958E-05 1.40 5.289E-07 2.376E-05 0.803 241Am 2.534E-06 -= 9.068B08 4.074B06 1.608 243Am 1.506E-06 -’ 2.823E-08 1.268B06 0.842
242Cm 5.926E-07 12.00 1 .Ol lE-08 4.542E-07 0.766 243Cm+244Cm 1.248E-07 14.00 2.021E-09 9.079B08 0.727
*45Nd 5.125E-04 2.20 l.lllE-05 4.989E-04 0.974
‘%Nd 4.447B04 2.00 9.293B06 4.175B04 0.939
14’Nd 2.418E-04 0.70 5.193B06 2.333E-04 0.965 ‘atom density ratio to initial 238U atom density. batom density ratio to calculated initial 238U atom density (2.226E-02). ‘Quoted measurement error so high that measurement judged to have little value.
Table D.21. Pin D2 of GEB-161: Pin power comparison
Calculated Measured normalized
pin power Measurement Calculated 14’Ba nomp$zf pin (avp. of 9 rods = 1) error % (atoms/barn-cm) (avg. of 9 rods = 1) C/M ratio WM-1PlOO
1.110 1.7 6.072E-07 1.1394 1.027 2.7
Table D.22. Pin D2 of GEB-161: Bumup comparison Measured pin Calculated pin bumup Mwd/t bumup MWd/t c/M ratio K/M-l)*lOO
13200 12647 0.958 -4.2
64

Table D-23. Pin F6 of GEB-161: Isotopic comparison (Pin description: UO, type 7, enrichment 2.56 wt %, 2.5% *03Gd)
Measured Measurement Calculated atom density - Calculated Nuclide value’ error % (atoms/barn-cm)b normalized value C/M ratio
235U 1.91OE-02 0.60 4.252E-04 1.969E-02 1.031 W 1.352E-03 2.00 2.846E-05 1.318E-03 0.975 u8U 9.942E-0 1 0.05 2.145B02 9.936E-01 0.999 237Np NA l.llOE-06 5.139B05 NA 23?PU 3.418E-03 0.10 7.282E-05 3.372E-03 0.987 24opU 5.297E-04 0.40 l.l92E-05 5.522E-04 1.043 241Pu 1.788B04 0.50 3.76OE-06 1.741E-04 0.974 242Pu 1.473E-05 1.40 2.944E-07 1.364E-05 0.926 xlAm NA 6.280E-08 2.908E-06 NA 243Am NA 1.341E-08 6.21 lE-07 NA 242Cm NA 5.852E-09 2.710E-07 NA
243Cm + 244Cm NA 8.54OE-10 3.955E-08 NA ‘“Nd 2.815E-04 2.20 6.095B06 2.823E-04 1.003 ‘&Nd 2.343E-04 2.00 5.048B06 2.338B04 0.998 14’Nd 1.3 13E-04 0.70 2.878E-06 1.333E-04 1.015
‘atom density ratio to initial =‘U atom density. batom density ratio to calculated initial 238U atom density (2.159E-02).
Table D.24. Pin F6 of GEB-161: Pin power comparison
Calculated Measured normalized normalized pin
pin power Measurement Calculated 14’Ba power (avg. of 9 rods = 1) error % (atoms/barn-cm) (avg. of 9 rods = 1) C/M ratio (C/M-1)-100
0.881 1.7 4.78OE-07 0.897 1.018 1.8
Table D.25. Pin F6 of GEB-161: Bumup comparison
Measured pin Calculated piu bumup MWd/t bumup MWd/t C/M ratio (c/M-1)~100
7161 7279 1.016 1.6
65
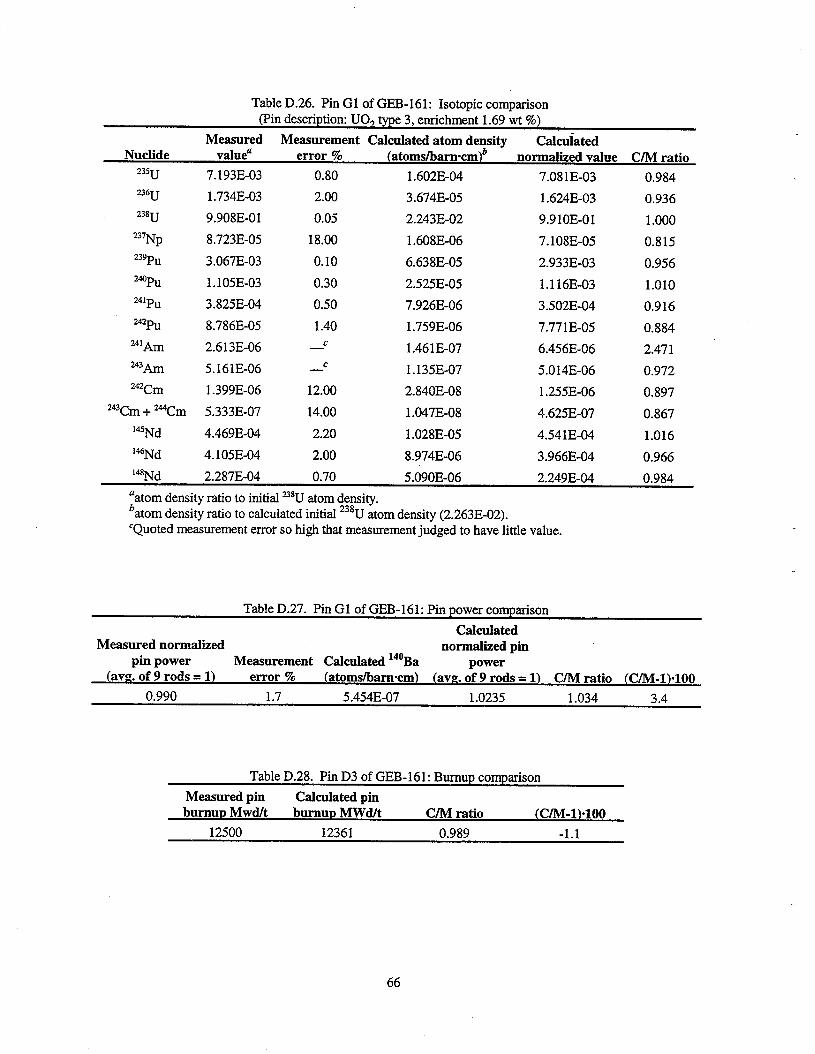
Table D.26. Pin Gl of GEB-161: Isotopic comparison (Pin description: UO, type 3, enrichment 1.69 wt %)
Measured Nuclide value’
Measurement Calculated atom deyity Calculated error % (atoms/barn-cm) normalized value C/M ratio
235~ 7.193E-03 0.80 1.602E-04 7.081E-03 0.984 23.5~ 1.734E-03 2.00 3.674E-05 1.624E-03 0.936 238~ 9.908E-01 0.05 2.243E-02 9.91OE-01 1 .ooo
237Np 8.723B05 18.00 1.608E-06 7.108E-05 0.815
23gPu 3.067E-03 0.10 6.638B05 2.933E-03 0.956
240pU l.l05E-03 0.30 2.525E-05 l.l16E-03 1.010
24’Pu 3.825E-04 0.50 7.926E-06 3.502E-04 0.916
x2Pu 8.786B05 1.40 1.759E-06 7.771E-05 0.884
241Am 2.613E-06 - 1.461B07 6.456E-06 2.471 ’
243Am 5.161E-06 -’ l.l35E-07 5.014E-06 0.972
242Cm 1.399E-06 12.00 284OE-08 1.255B06 0.897
243Cm + 244Cm 5.333E-07 14.00 l.O47E-08 4.625E-07 0.867
145Nd 4.469E-04 2.20 1.028B05 4.541E-04 1.016
‘&Nd 4.105E-04 2.00 8.974E-06 3.966E-04 0.966
14’Nd 2.287E-04 0.70 5.09OE-06 2.249B04 0.984
‘atom density ratio to initial =‘U atom density. batom density ratio to calculated initial 238U atom density (2.263E-02). ‘Quoted measurement error so high that measurement judged to have little value.
Table D.27. Pin Gl of GEB-161: Pin power comparison Calculated
Measured normalized normalized pin pin power Measurement Calculated 14’Ba power
(avg. of 9 rods = 1) error % (atomshamcm) (avg. of 9 rods = 1) C/M ratio (C/M-1)-100 0.990 1.7 5.454E-07 1.0235 1.034 3.4
Table D.28. Pin D3 of GEB-161: Burnup comparison
Measured pin Calculated pin burnup Mwdft bumup MWd/t c/M ratio W./M-l)*100
12500 12361 0.989 -1.1
66

Table D.29. Average C/E for the isotope densities, relative power distribution and bumup of MOX and UO, pins of central assembly GEB-161
Measurement Isotope
C/M of UO, pins error (%I C/M of MOX pins (excludes Gd pin F6)
235~ 0.80 1.0022 0.9885
236~ 2.00 1.0137 0.9260
238~ 0.05 0.9998 1.0005
237Np 18.00 0.7867 0.8005
23% 0.10 0.9862 0.9472
240pU 0.30 0.9977 0.9755 241Pu 0.50 1.0017 0.8645 242Pu 1.40 0.9470 0.8195 241Am 30 MOX , UO,” 0.3762 1.6130 243Am 30 MOX , UO,a 0.9545 0.8335 242Cm 12.00 0.1782 0.7785
243Cm + 244Cm 14.00 0.8177 0.7375 ‘45Nd 2.20 0.9775 0.9980 ‘&Nd 2.00 0.9685 0.9665 14’Nd 0.70 0.9802 0.9805
Pin power 1.7 0.9777 1.0175 Bumup NA 1.0167 0.9817 ‘Quoted measurement error so high that measurement was judged to have little value.
Table D.30. 242Cm and 243Am isotopics fractions for central assembly GEB-161
Cm ratio” Am ratiob MeasurementC (%) Calculations ( %) Measuremen ( % ) Calculations ( %)
D3 (MOX pin) 82.9 51.2 24.2 43.6
D5 (MOX pin) 88.4 62.8 14.1 27.7
E3 (MOX pin) 83.1 50.9 21.9 43.1
E4 (MOX pin) 88.4 62.9 12.3 28.1
C2 (UO, pin) 80.8 81.8 21.9 27.2
D 1 (UO, pin) 76.0 77.2 55.3 36.1
D2 (UO, pin) 82.6 83.3 37.3 23.7
F6 (Gd pins) WA) 87.3 WA) 17.6
Gl (UO, pin) 72.4 73.1 66.4 43.7 a242Cm/(242Cm + 243Cm + “Ym) b243Am/(x1Am + 243Am) CError is 1.2%. ‘Error is 2.8% for MOX pins and 68% for UO, pins.
67
APPENDIX E. SCALE INPUT LISTING
=sas2h parm=(oldsas2,skipshipdata) . .
sas2 sample case 1: UOZ pin C2, 2.56% UO, pin, infinite lattice ,CELL WEIGHTED 44groupndf5 latticecell
' this part of input: mixtures of fuel-pin-unit-cell
uo2 1 den=10.320 1.0 833 92235 2.560 92238 97.440 end
i . . . . above method uses wt %'s of u/pu isotopes,add additional xsecs for following u-234 1 0 l.OOe-20 u-236 1 0 l.OOe-20 u-237 1 0 l.OOe-20 np-237 1 0 l.OOe-20 np-238 1 0 l.OOe-20 pu-238 1 0 l.OOe-20 pu-242 1 0 l.OOe-20 am-241 1 0 l.OOe-20 am-242 1 0 l.OOe-20 am-242m 1 0 l.OOe-20 am-243 1 0 l.OOe-20 cm-242 1 0 l.OOe-20 cm-243 1 0 l.OOe-20 cm-244 1 0 l.OOe-20 cm-245 1 0 l.OOe-20 ' fission products kr-83 1 0 l.OOe-20 sr-90 1 0 l.OOe-20 zr-93 1 0 l.OOe-20 zr-95 1 0 l.OOe-20 zr-96 1 0 l.OOe-20 nb-95 1 0 l.OOe-20 mo-95 1 0 l.OOe-20 mo-97 1 0 l.OOe-20 mo-98 1 0 l.OOe-20 mo-100 1 0 l.OOe-20 tc-99 1 0 l.OOe-20 ru-100 1 0 l.OOe-20 ru-101 1 0 l.OOe-20 ru-102 1 0 l.OOe-20 ru-103 1 0 l.OOe-20 ru-104 1 0 l.OOe-20 ru-106 1 0 l.OOe-20 rh-103 1 0 l.OOe-20 rh-105 1 0 l.OOe-20 pd-104 1 0 l.OOe-20 pd-105 1 0 l.OOe-20 pd-106 1 0 l.OOe-20 pd-107 1 0 l.OOe-20 pd-108 1 0 l.OOe-20 ag-109 1 0 l.OOe-20 cd-110 1 0 l.OOe-20
833 end 833 end 833 end 833 end 833 end 833 end 833 end 833 end 833 end 833 end 833 end 833 end 833 end 833 end 833 end
833 end 833 end 833 end 833 end 833 end 833 end 833 end 833 end 833 end 833 end 833 end 833 end 833 end 833 end 833 end 833 end 833 end 833 end 833 end 833 end 833 end 833 end 833 end 833 end 833 end 833 end
69

cd-111 cd-113 in-115 sb-125 te-127m te-129m
i-127 i-129 i-131 i-135
xe-131 xe-133 xe-134 xe-135 cs-133 cs-134 cs-135 la-139 ce-141 ce-144 pr-141 pr-143 nd-142 nd-143 nd-144 nd-145 nd-146 nd-147 nd-148 nd-150 pm-147 pm-148 pm-148m pm-149 sm-147 sm-148 sm-149 sm-150 sm-151 sm-152 sm-153 eu-153 eu-154 eu-155 eu-156 gd-155 gd-156 gd-157
1 0 l.OOe-20 1 0 l.OOe-20 1 0 l.OOe-20 1 0 l.OOe-20 1 0 l.OOe-20 1 0 l.OOe-20 1 0 l.OOe-20 1 0 l.OOe-20 1 0 l.OOe-20 1 0 l.OOe-20 1 0 l.OOe-20 1 0 l.OOe-20 1 0 l.OOe-20 1 0 l.OOe-20 1 0 l.OOe-20 1 0 l.OOe-20 1 0 l.OOe-20 1 0 l.OOe-20 1 0 l.OOe-20 1 0 l.OOe-20 1 0 l.OOe-20 1 0 l.OOe-20 1 0 l.OOe-20 1 0 l.OOe-20 1 0 l.OOe-20 1 0 l.OOe-20 1 0 l.OOe-20 1 0 l.OOe-20 1 0 l.OOe-20 1 0 l.OOe-20 1 0 l.OOe-20 1 0 l.OOe-20 1 0 l.OOe-20 1 0 l.OOe-20 1 0 l.OOe-20 1 0 l.OOe-20 1 0 l.OOe-20 1 0 l.OOe-20 1 0 l.OOe-20 1 0 l.OOe-20 1 0 l.OOe-20 1 0 l.OOe-20 1 0 l.OOe-20 1 0 l.OOe-20 1 0 l.OOe-20 1 0 l.OOe-20 1 0 l.OOe-20 1 0 l.OOe-20
' fission products for lumps br-81 1 0 l.OOe-20 kr-84 1 0 l.OOe-20 rb-85 1 0 l.OOe-20 rb-87 1 0 l.OOe-20 y-89 1 0 l.OOe-20 zr-91 1 0 l.OOe-20 zr-94 1 0 l.OOe-20 pd-110 1 0 l.OOe-20 cd-112 1 0 l.OOe-20 cd-114 1 0 l.OOe-20 sb-121 1 0 l.OOe-20 sb-123 1 0 l.OOe-20
833 end 833 end 833 end 833 end 833 end 833 end 833 end 833 end 833 end 833 end 833 end 833 end 833 end 833 end 833 end 833 end 833 end 833 end 833 end 833 end 833 end 833 end 833 end 833 end 833 end 833 end 833 end 833 end 833 end 833 end 833 end 833 end 833 end 833 end 833 end 833 end 833 end 833 end 833 end 833 end 833 end 833 end 833 end 833 end 833 end 833 end 833 end 833 end
833 end 833 end 833 end 833 end 833 end 833 end 833 end 833 end 833 end 833 end 833 end 833 end
70

te-128 1 0 l.OOe-20 833 end te-130 1 0 l.OOe-20 a33 end xe-13 0 1 0 l.OOe-20 833 end xe-132 1 0 l.OOe-20 833 end xe-13 6 1 0 l.OOe-20 833 end cs-137 1 0 l.OOe-20 833 end ba-137 1 0 l.OOe-20 833 end ba-138 1 0 l.OOe-20 833 end ce-140 1 0 l.OOe-20 833 end ce-142 1 0 l.OOe-20 833 end sm-154 1 0 l.OOe-20 833 end gd-158 1 0 l.OOe-20 833 end tb-159 1 0 l.OOe-20 833 end dy-161 1 0 l.OOe-20 833 end dy-162 1 0 l.OOe-20 833 end dy-164 1 0 l.OOe-20 a33 end I zircalloy 2 den=6.55 1 559 end
zr sn fe h2o
2 den=6.55 0.9830 559 end 2 den=6.55 0.0140 559 end 2 den=6.44 0.0014 559 end 3 den=0.7375 1 559 end
end camp
I--------------- --- ------------- -
' fuel-pin-cell geometry:
squarepitch 1.874 1.21 1 3 1.432 2 1.244 0 end
I _-__-----------------------------------------------------
more data szf=l.2 end
' assembly and cycle parameters:
' using stack dens, figure out assy fuel length to get 1 MT
npin/assm=49 fuelngth=1952.4, ncycles=l nlib/cyc=3
lightel=O, printlevel=9, inplevel=O
I---------------- __-------------
'USING measd bu of 11,450 Mwd/t and 531 day cycle->23.5405 MW assy pow power=21.5630 burn=531.0 down=0 end end MOX PIN LISTING FOLLOWS-------
71

=sas2h parm=(oldsas2,skipshipdata)
sas2 sample case 1: MOX pin D5, 90% solid pin, infinite lattice ,CELL WEIGHTED 44groupndf5 latticecell
I -_--------------------- - - - - - - - - -
' this part of input: mixtures of fuel-pin-unit-cell
w 1 den=9.890 0.9607 833 92234 0.005 92235 0.722 92238 99.273 end
puoa 1 den=9.890 0.0393 833 94238 0.12 94239 87.16 94240 10.06 94241 2.38 94242 0.28 end
I . - . . above method uses wt %'s of u/pu isotopes,add additional xsecs for following u-234 1 0 l.OOe-20 u-236 1 0 l.OOe-20 u-237 1 0 l.OOe-20 np-237 1 0 l.OOe-20 np-238 1 0 l.OOe-20 pu-238 1 0 l.OOe-20 pu-242 1 0 l.OOe-20 am-241 1 0 l.OOe-20 am-242 1 0 l.OOe-20 am-242m 1 0 l.OOe-20 am-243 1 0 l.OOe-20 cm-242 1 0 l.OOe-20 cm-243 1 0 l.OOe-20 cm-244 1 0 l.OOe-20 cm-245 1 0 l.OOe-20 ' fission products kr-83 1 0 l.OOe-20 sr-90 1 0 l.OOe-20 zr-93 1 0 l.OOe-20 zr-95 1 0 l.OOe-20 zr-96 1 0 l.OOe-20 nb-95 1 0 l.OOe-20 mo-95 1 0 l.OOe-20 mo-97 1 0 l.OOe-20 mo-98 1 0 l.OOe-20 mo-100 1 0 l.OOe-20 tc-99 1 0 l.OOe-20 ru-100 1 0 l.OOe-20 ru-101 1 0 l.OOe-20 ru-102 1 0 l.OOe-20 ru-103 1 0 l.OOe-20 ru-104 1 0 l.OOe-20 ru-106 1 0 l.OOe-20 rh-103 1 0 l.OOe-20 rh-105 1 0 l.OOe-20 pd-104 1 0 l.OOe-20 pd-105 1 0 l.OOe-20 pd-106 1 0 l.OOe-20 pd-107 1 0 l.OOe-20
833 end 833 end 833 end 833 end 833 end 833 end 833 end 833 end 833 end 833 end a33 end 833 end 833 end 833 end 833 end
833 end 833 end 833 end 833 end 833 end 833 end 833 end 833 end 833 end 833 end 833 end 833 end 833 end 833 end 833 end 833 end 833 end 833 end 833 end 833 end 833 end 833 end 833 end
72

pd-108 ag-109 cd-110 cd-111 cd-113 in-115 sb-125 te-127m te-129m
i-127 i-129 i-131 i-135
xe-131 xe-133 xe-134 xe-135 cs-133 cs-134 cs-135 la-139 ce-141 ce-144 pr-141 pr-143 nd-142 nd-143 nd-144 nd-145 nd-146 nd-147 nd-148 nd-150 pm-147 pm-148 pm-148m pm-149 sm-147 sm-148 sm-149 sm-150 sm-151 sm-152 sm-153 eu-153 eu-154 eu-155 eu-156 gd-155 gd-156 gd-157
1 0 l.OOe-20 1 0 l.OOe-20 1 0 l.OOe-20 1 0 l.OOe-20 1 0 l.OOe-20 1 0 l.OOe-20 1 0 l.OOe-20 1 0 l.OOe-20 1 0 l.OOe-20 1 0 l.OOe-20 1 0 l.OOe-20 1 0 l.OOe-20 1 0 l.OOe-20 1 0 l.OOe-20 1 0 l.OOe-20 1 0 l.OOe-20 1 0 l.OOe-20 1 0 l.OOe-20 1 0 l.OOe-20 1 0 l.OOe-20 1 0 l.OOe-20 1 0 l.OOe-20 1 0 l.OOe-20 1 0 l.OOe-20 1 0 l.OOe-20 1 0 l.OOe-20 1 0 l.OOe-20 1 0 l.OOe-20 1 0 l.OOe-20 1 0 l.OOe-20 1 0 l.OOe-20 1 0 l.OOe-20 1 0 l.OOe-20 1 0 l.OOe-20 1 0 l.OOe-20 1 0 l.OOe-20 1 0 l.OOe-20 1 0 l.OOe-20 1 0 l.OOe-20 1 0 l.OOe-20 1 0 l.OOe-20 1 0 l.OOe-20 1 0 l.OOe-20 1 0 l.OOe-20 1 0 l.OOe-20 1 0 l.OOe-20 1 0 l.OOe-20 1 0 l.OOe-20 1 0 l.OOe-20 1 0 l.OOe-20 1 0 l.OOe-20
' fission products for lumps br-81 1 0 l.OOe-20 kr-84 1 0 l.OOe-20 rb-85 1 0 l.OOe-20 rb-87 1 0 l.OOe-20 y-89 1 0 l.OOe-20 zr-91 1 0 l.OOe-20 zr-94 1 0 l.OOe-20 pd-110 1 0 l.OOe-20 cd-112 1 0 l.OOe-20
a33 end 833 end 833 end 833 end 833 end a33 end 833 end 833 end 833 end 833 end 833 end 833 end 833 end a33 end 833 end 833 end a33 end 833 end 833 end 833 end 833 end 833 end 833 end 833 end 833 end 833 end 833 end a33 end 833 end 833 end 833 end 833 end 833 end a33 end 833 end 833 end 833 end a33 end 833 end 833 end 833 end 833 end 833 end 833 end 833 end 833 end 833 end 833 end 833 end 833 end 833 end
833 end 833 end 833 end 833 end 833 end 833 end 833 end 833 end 833 end
73

cd-114 1 0 l.OOe-20 833 end sb-121 1 0 l.OOe-20 833 end sb-123 1 0 l.OOe-20 833 end
'te-128 1 0 l.OOe-20 833 end te-130 1 0 l.OOe-20 833 end xe-13 0 1 0 l.OOe-20 833 end xe-13.2 1 0 l.OOe-20 833 end xe-13 6 1 0 l.OOe-20 833 end cs-137 1 0 l.OOe-20 833 end ba-137 1 0 l.OOe-20 833 end ba-138 1 0 l.OOe-20 833 end ce-140 1 0 l.OOe-20 833 end ce-142 1 0 l.OOe-20 833 end sm-154 1 0 l.OOe-20 833 end gd-158 1 0 l.OOe-20 833 end tb-159 1 0 l.OOe-20 833 end dy-161 1 0 l.OOe-20 833 end dy-162 1 0 l.OOe-20 833 end dy-164 1 0 l.OOe-20 833 end I zircalloy 2 den=6.55 1 559 end
zr sn fe h2o
2 den=6.55 0.9830 559 2 den=6.55 0.0140 559 2 den=6.44 0.0014 559 3 den=0.7375 1 559 end
end end end
end camp
I _-------------------------------
' fuel-pin-cell geometry: 4 squarepitch 1.874 1.24000 1 3 1.432 2 1.27 0 end
I ____-----------------------------------------------------
more data szf=1.2 end
I---------------- ----------------
' assembly and cycle parameters: ' using stack dens, figure out assy fuel length to get 1 MT
npin/assm=49 fuelngth=1937.46, ncycles=l nlib/cyc=3
lightel=O, printlevel=9, inplevel=O
I - -------- - --- - - - ---------------
'USING measd bu of 12,500 MWd/t and 531 day cycle->23.5405 MW assy pow power=23.5405 burn=531.0 down=0 end end
74

ACKNOWLEDGEMENTS
This work was sponsored by the U.S. Department of Energy’s Fissile Materials Disposition Program in order to partially fulfill milestone 98-9 of the Joint United States/Russian Federation program in plutonium disposition. Milestone 98-9 identifies a task to evaluate past U.S. mixed oxide irradiations for use as reactor physics benchmarks. The authors would like to thank Ted Shannon of Commonwealth Edison for his consultation and thoughts. The authors would also like to acknowledge Ruth Lawson for her assistance with the preparation of the report. Brian Murphy is acknowledged for supplying an initial HELIOS model that helped to accelerate model development.
75
ORNIJTM-13567
+ INTERNAL DISTRTBUTION .
1. B. B. Bevard 2. S.M.Bowman 3. B. L. Broadhead 4. B. S. Cowell 5. W. G. Craddick 6. M. D. DeHart 7. F. C. Difilippo
8-12. S. E. Fisher 13. E. C. Fox 14. J. C. Gehin 15. S. R. Greene 16. 0. W. Hermann 17. S. A. Hodge 18. D. T. Ingersoll 19. M. A. Kuliasha 20. L. C. Leal
21. G. E. Michaels 22. D. L. Moses 23. B. D. Murphy 24. D. G. O’Connor 25. C. V. Parks
26-30. R. T. Primm, III 3 1. R. W. Roussin 32. J. C.Ryman 33. D. J. Spelhnan 34. R. M. Westfall 35. B. A. Worley 36. R. Q. Wright
37-38. Laboratory Records (for submission to OSTI) 39. Laboratory Records-RC 40. Central Research Library 41. ORNL Patent Section
EXTERNAL DISTRIBUTION
42. M. L. Adams, Dept. of Nuclear Engineering, Texas A&M University, Zachry 129, College Station, TX 77843
43. D. Alberstein, Los Alamos National Laboratory, P.O. Box 1663, MSK575, Los Alamos, NM 87545 44. J. F. Baker, Office of Fissile Materials Disposition, Dept. of Energy, MD-l, 1000 Independence Avenue
SW, Forrestal Bldg., 6G-050, Washington, DC 20585 45. J. Buksa, Los Alamos National Laboratory, P.O. Box 1663, Los Alamos, NM 87545 46. H. R. Canter, Office of Fissile Materials Disposition, Dept. of Energy, MD-l/2, 1000 Independence
Avenue SW, Building 3FO43, Washington, DC 20585 47. G. S. Chang, INEEL, P.O. Box 1625, MS-3885, Idaho Falls, ID 83415-3885 48. Ron Chinn, Commonwealth Edison Company, 1400 Opus Place, Suite 400, Downers Grove, Illinois
60515 49. T. Cremers, Los Alamos National Laboratory, P.O. Box 1663, Los Alamos, NM 87545 50. A. I. Cygelman, Department of Energy, 1000 Independence Ave. SW, Forrestal Building 3FO43,
Washington, DC 20585 5 1. George A. Davis, ABB-Combustion Engineering, 2000 Day Hill, MC-93 10-0422, Windsor, Connecticut
06095 52. Ed Ehrlich, General Electric, 175 Curtner Avenue, San Jose, California 95125 53. L. Groves, Sandia National Laboratories, P.O. Box 969, Livermore, CA 94551 54. D. Harrison, Department of Energy, 101 Convention Center Drive, Suite P200, Las Vegas, NV 89109 55. C. Jaeger, Sandia National Laboratories, P.O. Box 5800, Albuquerque, NM 87185-0759 56. J. D. N&on, Office of Fissile Materials Disposition, Dept. of Energy, MD-4, 1000 Independence
Avenue SW, Washington, DC 20585 57. Odelli Ozer, Electric Power Research Institute, 3412 Hillview Avenue, Palo Alto, California 94304 58. S. L. Passman, Sandia National Laboratories, 1401 Wilson Blvd., Suite 1050, Arlington, VA 22209 59. D. Peko, Department of Energy, 1000 Independence Ave. SW, Forrestal Building 3FO42, Washington,
DC 20585 60. K. K. S. Pillay, Los Alarnos National Laboratory, Los Alamos, NM 87545 61. P. T. Rhoads, Office of Fissile Materials Disposition, Dept. of Energy, MD-4, 1000 Independence
Avenue SW, Forrestal Building 3FO43, Washington, DC 20585 62. J. M. Ryskamp, INEEL, P.O. Box 1625, MS-3885, Idaho Falls, ID 83415-3885 63. S. S. Sareen, Sandia National Laboratories, 2650 Park Tower Drive, Suite 800, Vienna, VA 22180
77

64. Theodore Shannon, Commonwealth Edison Company, 1400 Opus Place, Suite 400, Downers Grove, Illinois 605 15
65. J. H. Thompson, Office of Fissile Materials Disposition, Dept. of Energy; MD-4, 1000 Independence Avenue SW, Washington, DC 20585
66. Michael L. Travis, Westinghouse Electric Corporation, P.O. Box 355, Pittsburgh, Pennsylvania 15230 67. R. Zurn, Sandia National Laboratories, P.O. Box 969, Livermore, CA 94551 68. Rosa Yang, Electric Power Research Institute, 3412 Hillview Avenue, Palo Alto, California 94304
69-70. Office of Scientific and Technical Information, U.S. Department of Energy, P.O. Box 62, Oak Ridge, TN 37831
78