Embed Size (px)
Citation preview
Overview of student achievement results in Eugene School District 4J September 10, 2014
OAKS State Assessment

What do the data show?

Overview of data trends 4J students outperformed the state average in all grades & subjects
Overall passing rate held steady
Some changes from last year in grade level results
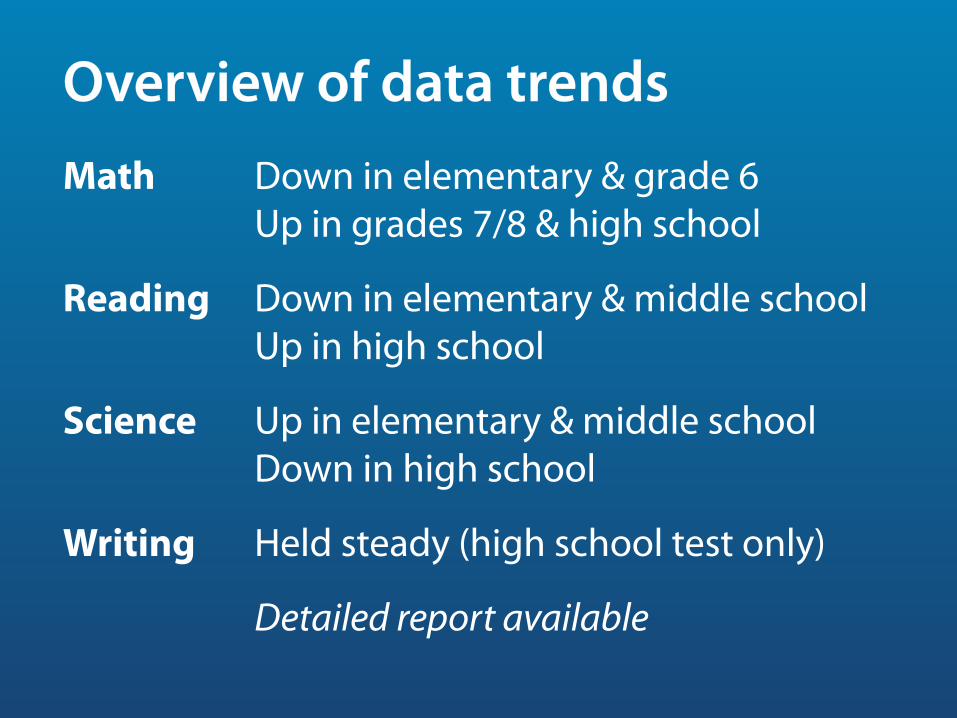
Overview of data trends Math Down in elementary & grade 6
Up in grades 7/8 & high school
Reading Down in elementary & middle school Up in high school
Science Up in elementary & middle school Down in high school
Writing Held steady (high school test only)
Detailed report available

What are we seeing?
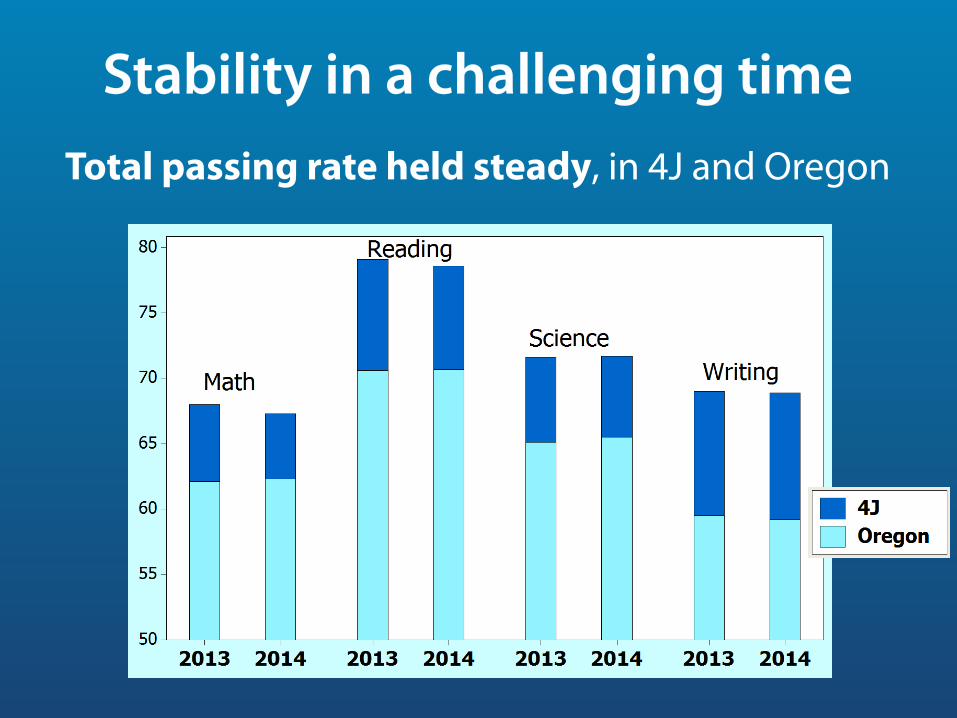
Stability in a challenging time Total passing rate held steady, in 4J and Oregon

Stability in a challenging time 4J students beat the state average:
✓every grade ✓ every subject ✓ every subgroup
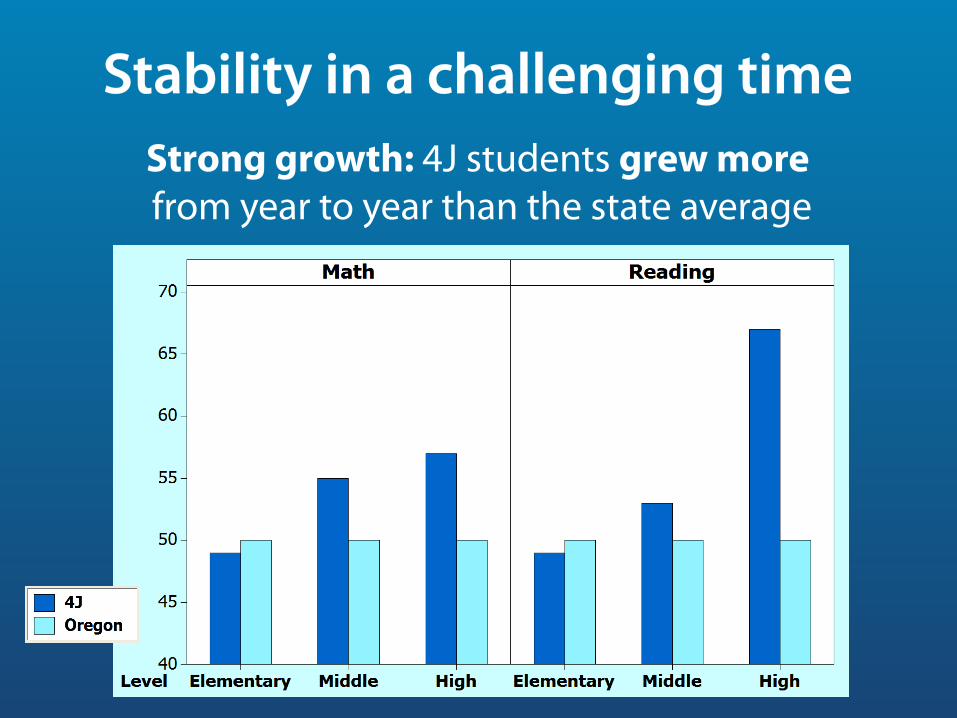
Stability in a challenging time Strong growth: 4J students grew more from year to year than the state average

Significant gains in high school
Up from last year More 4J high school students met standards in 2013–14 than the year before.
Strong in every subject More 4J high school students met standards than in our neighboring districts or the state.
Big gains in math and reading 4J high school math and reading results improved more than in neighboring districts or the state.

Significant gains in high school Especially distinct in math

Persistent achievement gaps 4J students in all groups beat state averages Every group of 4J students outperforms similar groups statewide in every group & subject; however,
Gaps between groups persist We continue to have large achievement gaps between groups of students in 4J, Oregon & U.S.
Largest achievement gaps are seen for ü students with disabilities ü students with limited English proficiency ü African American students

What does it mean?
The big picture In an extremely challenging year
Maintained relative stability across district
High school investments are paying off

We maintained relative stability in a very challenging year
2013–14 featured:
Large class sizes, including some of the largest elementary class sizes in decades
Shortest school year ever
Fewer resources for intervention
Several significant systemic changes

Our investments in high schools are beginning to pay off
Providing a full schedule for more students & all 9th graders
Changing to a more efficient common schedule
Better aligning math curriculum across levels & to standards
Embedding AVID teaching & learning strategies
Increasing STEM learning opportunities
Better targeting resources to our neediest schools

We’re not there yet
We have a lot more to do. Some key steps:
Reducing class sizes
Restoring school days and instructional time
Providing professional development to enhance the capacity and currency of our teaching staff
Updating curriculum and science equipment using voter-approved bond funds
Investing in interventions at all school levels
The road ahead This year’s high school results
bode well for the future
but
This is the year everything changes
New learning standards and assessments: Common Core • Smarter Balanced

The road ahead Higher standards for all students, better aligned to college and career readiness
New standards and tests raise the bar
Passing rates likely will go down initially
But students and parents will have much better information about how well they are
being prepared for college and careers

Questions?