Embed Size (px)
Citation preview
November 7, 2012
Obama 71%; Romney 27%
Latino Voters in the 2012 Election
Mark Hugo Lopez, Associate Director
Paul Taylor, Director
FOR FURTHER INFORMATION CONTACT:
1615 L St, N.W., Suite 700
Washington, D.C. 20036
Tel (202) 419-3600
Fax (202) 419-3608
www.pewhispanic.org
Copyright © 2012
1
Latino Voters in the 2012 Election
Pew Hispanic Center | www.pewhispanic.org
About the Pew Hispanic Center
The Pew Hispanic Center is a nonpartisan research organization that seeks to improve public
understanding of the diverse Hispanic population in the United States and to chronicle
Latinos' growing impact on the nation. It does not take positions on policy issues. The Center is
part of the Pew Research Center, a nonpartisan "fact tank" based in Washington, D.C., and it is
funded by The Pew Charitable Trusts, a Philadelphia-based public charity. All of the Center’s
reports are available at www.pewhispanic.org.
The staff of the Pew Hispanic Center is:
Paul Taylor, Director
Rakesh Kochhar, Associate Director for Research
Richard Fry, Senior Research Associate
Gretchen Livingston, Senior Researcher
Seth Motel, Research Assistant
Mary Seaborn, Administrative Manager
Mark Hugo Lopez, Associate Director
Jeffrey S. Passel, Senior Demographer
Ana Gonzalez-Barrera, Research Associate
Eileen Patten, Research Assistant
2
Latino Voters in the 2012 Election
Pew Hispanic Center | www.pewhispanic.org
About this Report
Exit poll results for this report were obtained from CNN’s Election 2012 website and are based
on National Election Pool national and state exit poll surveys of voters as reported on
November 6, 2012. In addition to an analysis of the national Latino vote, 12 states were
examined. These states are Arizona, California, Colorado, Florida, Illinois, Nevada, New
Mexico, North Carolina, Ohio, Pennsylvania, Virginia and Wisconsin.
Acknowledgements
The authors thank Eileen Patten for excellent research assistance. Seth Motel checked
numbers in the report.
A Note on Terminology
The terms “Latino” and “Hispanic” are used interchangeably in this report.
3
Latino Voters in the 2012 Election
Pew Hispanic Center | www.pewhispanic.org
Table of Contents
About the Pew Hispanic Center 1
About this Report 2
A Note on Terminology 2
Overview 4
Appendix A: National and Selected State Results 8
References 19
4
Latino Voters in the 2012 Election
Pew Hispanic Center | www.pewhispanic.org
0
20
40
60
80
1980 1984 1988 1992 1996 2000 2004 2008 2012
Democratic candidate
Republican candidate
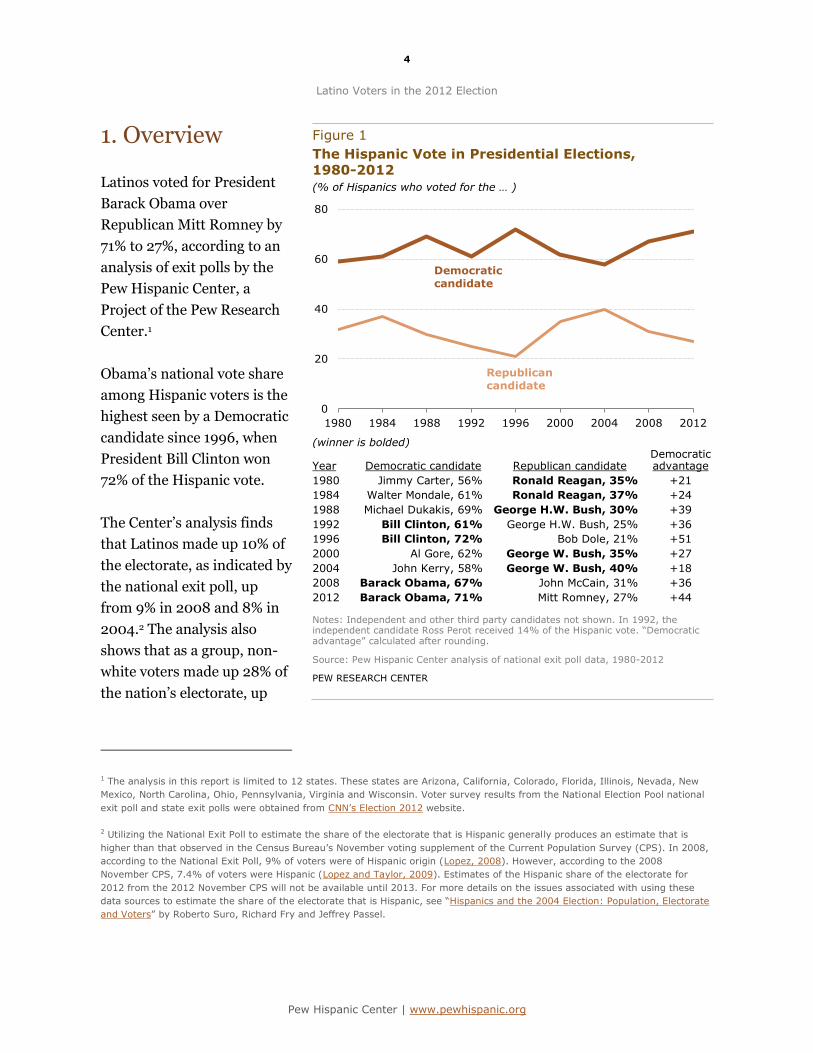
1. Overview
Latinos voted for President
Barack Obama over
Republican Mitt Romney by
71% to 27%, according to an
analysis of exit polls by the
Pew Hispanic Center, a
Project of the Pew Research
Center.1
Obama’s national vote share
among Hispanic voters is the
highest seen by a Democratic
candidate since 1996, when
President Bill Clinton won
72% of the Hispanic vote.
The Center’s analysis finds
that Latinos made up 10% of
the electorate, as indicated by
the national exit poll, up
from 9% in 2008 and 8% in
2004.2 The analysis also
shows that as a group, non-
white voters made up 28% of
the nation’s electorate, up
1 The analysis in this report is limited to 12 states. These states are Arizona, California, Colorado, Florida, Illinois, Nevada, New
Mexico, North Carolina, Ohio, Pennsylvania, Virginia and Wisconsin. Voter survey results from the National Election Pool national
exit poll and state exit polls were obtained from CNN’s Election 2012 website.
2 Utilizing the National Exit Poll to estimate the share of the electorate that is Hispanic generally produces an estimate that is
higher than that observed in the Census Bureau’s November voting supplement of the Current Population Survey (CPS). In 2008,
according to the National Exit Poll, 9% of voters were of Hispanic origin (Lopez, 2008). However, according to the 2008
November CPS, 7.4% of voters were Hispanic (Lopez and Taylor, 2009). Estimates of the Hispanic share of the electorate for
2012 from the 2012 November CPS will not be available until 2013. For more details on the issues associated with using these
data sources to estimate the share of the electorate that is Hispanic, see “Hispanics and the 2004 Election: Population, Electorate
and Voters” by Roberto Suro, Richard Fry and Jeffrey Passel.
Figure 1
The Hispanic Vote in Presidential Elections, 1980-2012
(% of Hispanics who voted for the … )
(winner is bolded)
Year Democratic candidate Republican candidate Democratic advantage
1980 Jimmy Carter, 56% Ronald Reagan, 35% +21
1984 Walter Mondale, 61% Ronald Reagan, 37% +24
1988 Michael Dukakis, 69% George H.W. Bush, 30% +39
1992 Bill Clinton, 61% George H.W. Bush, 25% +36
1996 Bill Clinton, 72% Bob Dole, 21% +51
2000 Al Gore, 62% George W. Bush, 35% +27
2004 John Kerry, 58% George W. Bush, 40% +18
2008 Barack Obama, 67% John McCain, 31% +36
2012 Barack Obama, 71% Mitt Romney, 27% +44
Notes: Independent and other third party candidates not shown. In 1992, the independent candidate Ross Perot received 14% of the Hispanic vote. “Democratic advantage” calculated after rounding.
Source: Pew Hispanic Center analysis of national exit poll data, 1980-2012
PEW RESEARCH CENTER
5
Latino Voters in the 2012 Election
Pew Hispanic Center | www.pewhispanic.org
37
18
18
17
14
10
5
4
4
3
41
16
15
14
13
9
5
3
3
4
32
12
10
15
8
8
3
1
2
3
New Mexico
Arizona
Nevada
Florida
Colorado
Total U.S.
Virginia
North Carolina
Wisconsin
Ohio
2012 2008 2004
Total U.S.
from 26% in 2008.3
Battleground States
Hispanics made up a growing share of voters in
three of the key battleground states in
yesterday’s election—Florida, Nevada and
Colorado.
Obama carried Florida’s Hispanic vote 60% to
39%, an improvement over his 57% to 42%
showing in 2008. Also, Hispanics made up 17%
of the Florida electorate this year, up from 14%
in 2008.
The state’s growing non-Cuban population—
especially growth in the Puerto Rican
population in central Florida—contributed to
the President’s improved showing among
Hispanic voters. This year, according to the
Florida exit poll, 34% of Hispanic voters were
Cuban while 57% were non-Cuban. Among
Cuban voters, the vote was split—49%
supported Obama while 47% supported
Romney. Among the state’s non-Cuban voters,
Obama won 66% versus 34% for Romney.
In Colorado, Obama carried the Latino vote by
a wide margin—75% to 23%. The president’s
performance among Latino voters in Colorado
was better than in 2008, when Obama won the
Latino vote 61% to 38%. Hispanics made up
3 While Latino voters were a larger share of the electorate in 2012 than in 2008, the number of Latinos who cast a vote in
yesterday’s election will not be known until sometime in the spring of 2013, when data from the U.S. Census Bureau’s Current
Population Survey becomes available. In this year’s election, according to Pew Hispanic Center estimates, 23.7 million Latinos
were eligible to vote, up from 19.5 million in 2008 (Lopez, Motel and Patten, 2012). Latinos also represent a growing share of all
eligible voters and growing shares of eligible voters in many states. Nationally, 11.0% of all eligible voters in the U.S. are
Hispanic, up from 9.5% in 2008.
Figure 2
Hispanic Share of Voters in Presidential Elections, 2004-2012
(% of voters who are Hispanic)
Source: Pew Hispanic Center analysis of 2012, 2008 and 2004 National Election Pool national exit poll and state exit poll results
PEW RESEARCH CENTER
6
Latino Voters in the 2012 Election
Pew Hispanic Center | www.pewhispanic.org
14% of Colorado voters this year, up from 13% in 2008.
In Nevada, Obama won the Hispanic vote 70% to 25%. However, the president’s Hispanic vote
was down from the 76% share he won in 2008. Among voters in Nevada, the Hispanic share
was 18%, up from 15% in 2008.
In other states, the President also carried large shares of the Hispanic vote. Among other
battlegrounds, Obama won 68% of the Hispanic vote in North Carolina, 65% in Wisconsin,
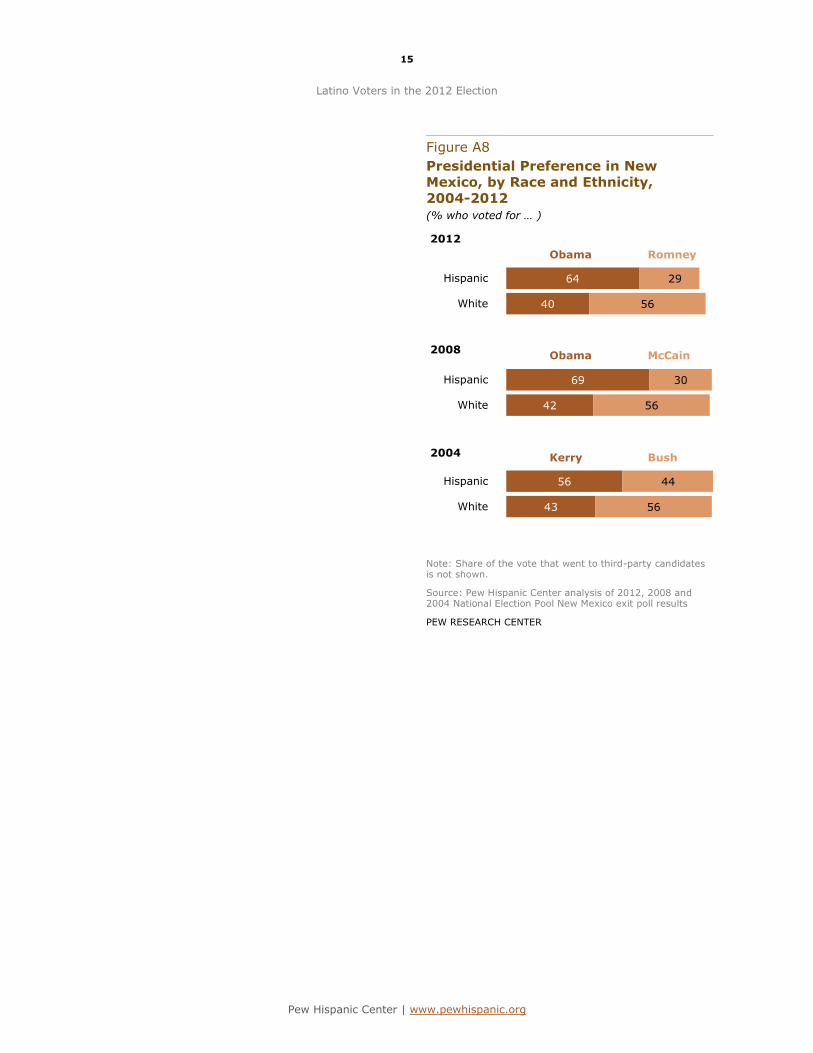
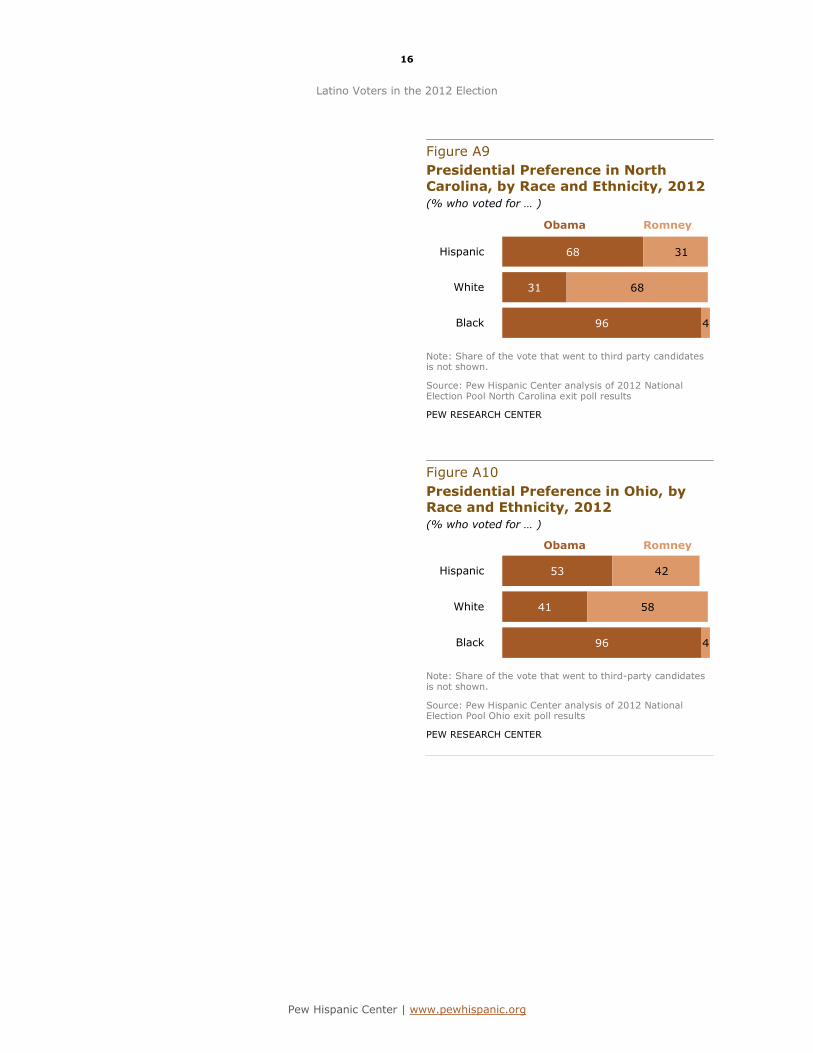
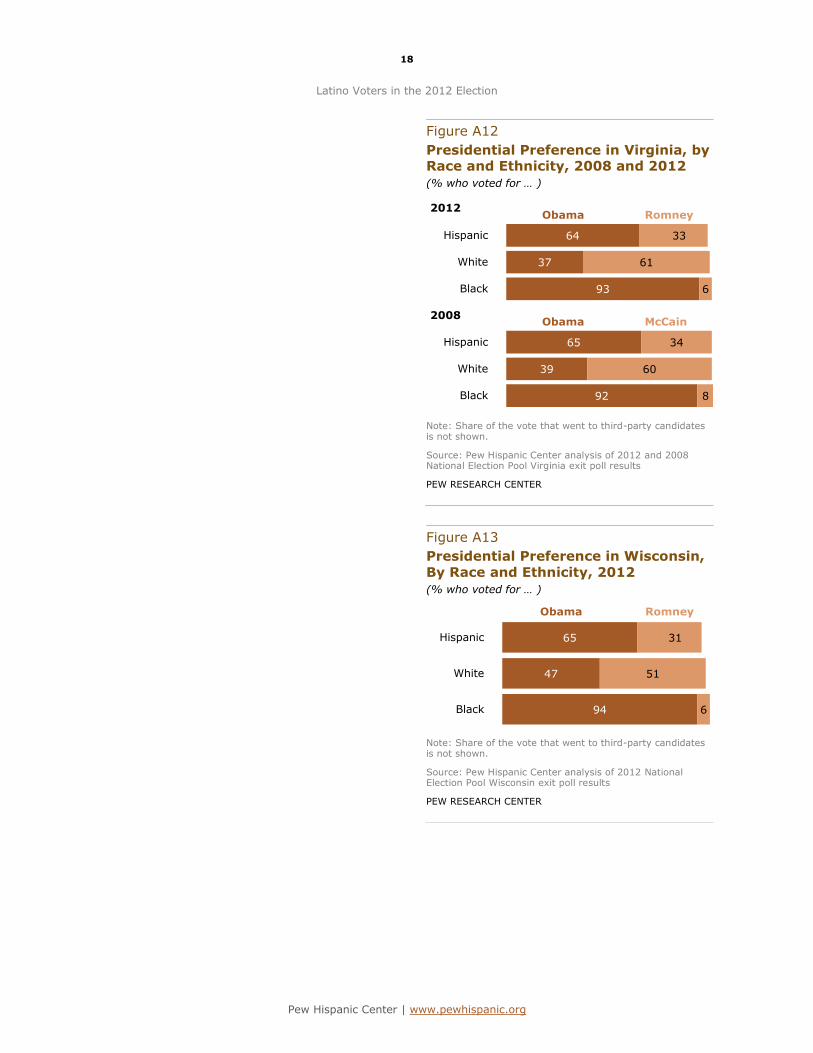
64% in Virginia and 53% in Ohio.
Top Issues for Hispanic Voters in 2012
For Hispanic voters, according to the national exit poll, 60% identified the economy as the
most important issue (of four listed) facing the country today, virtually the same as the share
(59%) of the general electorate that identified the economy as the nation’s most important
issue. On the other three issues asked about, for Hispanic voters, the economy was followed by
health care (18%), the federal budget deficit (11%) and foreign policy (6%).
Throughout this election cycle, the issue of immigration has been an important issue for
Hispanics. In the national exit poll, voters were asked about what should happen to
unauthorized immigrants working in the U.S. According to the national exit poll, 77% of
Hispanic voters said these immigrants should be offered a chance to apply for legal status
while 18% said these immigrants should be deported. Among all voters, fewer than two-thirds
(65%) said these immigrants should be offered a chance to apply for legal status while 28% say
they should be deported.
7
Latino Voters in the 2012 Election
Pew Hispanic Center | www.pewhispanic.org
71
65
76
74
71
68
65
62
75
82
59
27
33
23
23
28
31
35
35
24
17
39
Romney Obama
Income less than $50,000
Income $50,000 or more
All Hispanics
Men
Women
18-29
30-44
45-64
65 and older
College grad
No college degree
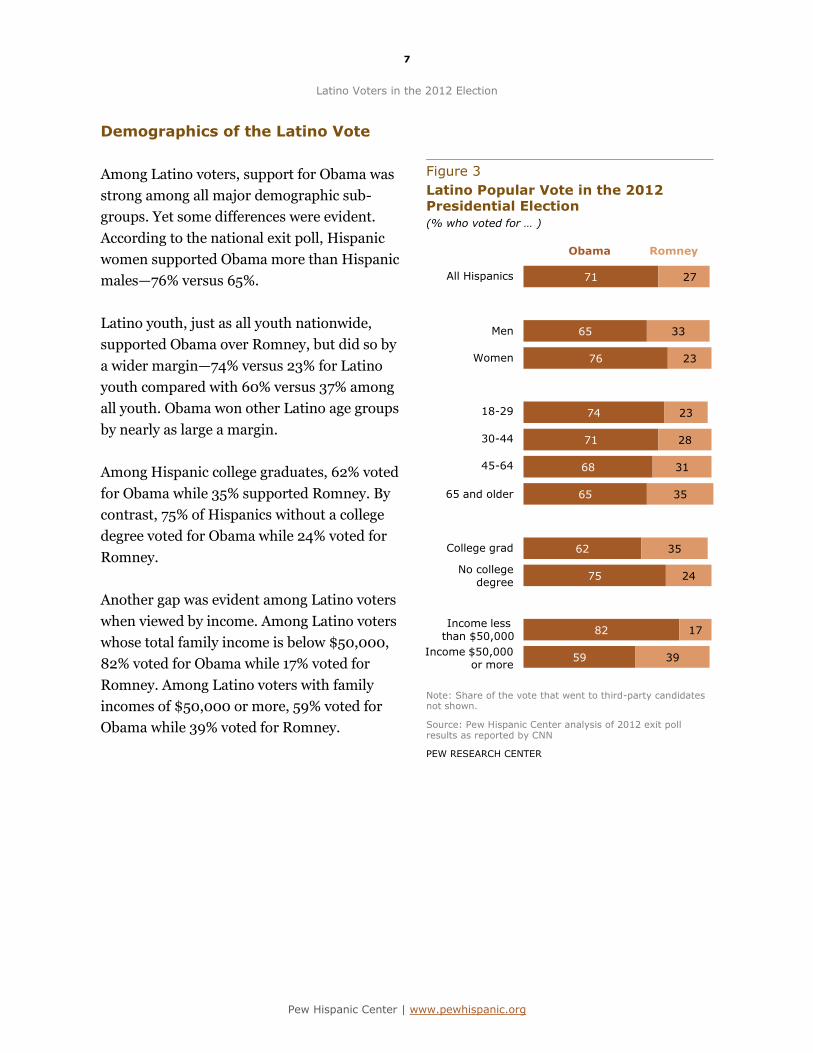
Demographics of the Latino Vote
Among Latino voters, support for Obama was
strong among all major demographic sub-
groups. Yet some differences were evident.
According to the national exit poll, Hispanic
women supported Obama more than Hispanic
males—76% versus 65%.
Latino youth, just as all youth nationwide,
supported Obama over Romney, but did so by
a wider margin—74% versus 23% for Latino
youth compared with 60% versus 37% among
all youth. Obama won other Latino age groups
by nearly as large a margin.
Among Hispanic college graduates, 62% voted
for Obama while 35% supported Romney. By
contrast, 75% of Hispanics without a college
degree voted for Obama while 24% voted for
Romney.
Another gap was evident among Latino voters
when viewed by income. Among Latino voters
whose total family income is below $50,000,
82% voted for Obama while 17% voted for
Romney. Among Latino voters with family
incomes of $50,000 or more, 59% voted for
Obama while 39% voted for Romney.
Figure 3
Latino Popular Vote in the 2012 Presidential Election
(% who voted for … )
Note: Share of the vote that went to third-party candidates not shown.
Source: Pew Hispanic Center analysis of 2012 exit poll results as reported by CNN
PEW RESEARCH CENTER
8
Latino Voters in the 2012 Election
Pew Hispanic Center | www.pewhispanic.org
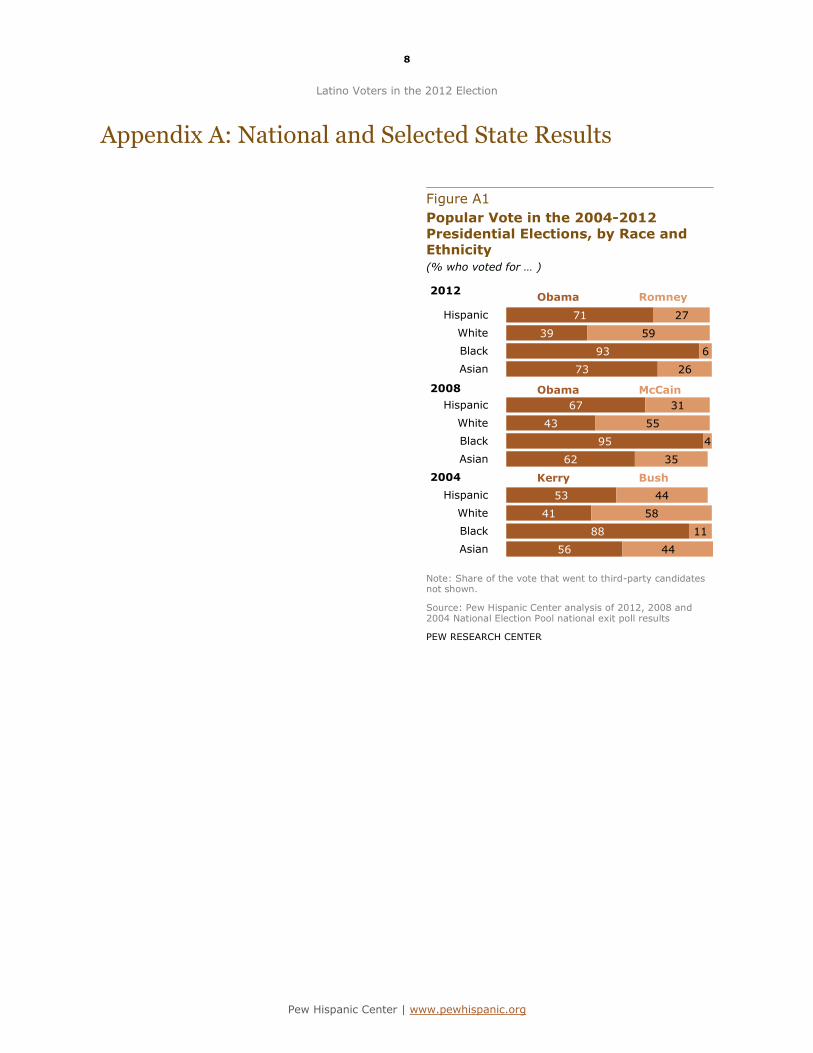
71
39
93
73
67
43
95
62
53
41
88
56
27
59
6
26
31
55
4
35
44
58
11
44
Hispanic
White
Black
Asian
Hispanic
White
Black
Asian
Hispanic
White
Black
Asian
Romney 2012
McCain
Bush
Obama
Kerry
2004
2008 Obama
Appendix A: National and Selected State Results
Figure A1
Popular Vote in the 2004-2012
Presidential Elections, by Race and Ethnicity
(% who voted for … )
Note: Share of the vote that went to third-party candidates not shown.
Source: Pew Hispanic Center analysis of 2012, 2008 and 2004 National Election Pool national exit poll results
PEW RESEARCH CENTER
9
Latino Voters in the 2012 Election
Pew Hispanic Center | www.pewhispanic.org
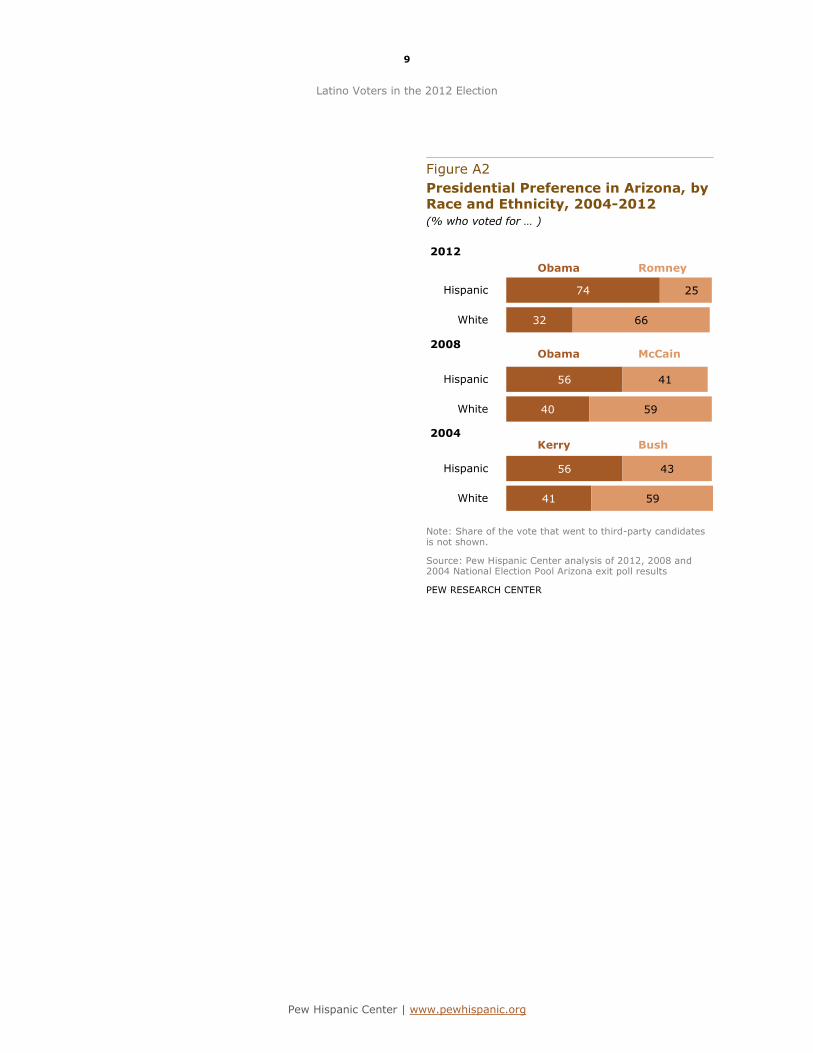
74
32
56
40
56
41
25
66
41
59
43
59
Hispanic
White
Hispanic
White
Hispanic
White
Romney
2012
McCain
Bush
Obama
Kerry
2004
2008 Obama
Figure A2
Presidential Preference in Arizona, by Race and Ethnicity, 2004-2012
(% who voted for … )
Note: Share of the vote that went to third-party candidates is not shown.
Source: Pew Hispanic Center analysis of 2012, 2008 and 2004 National Election Pool Arizona exit poll results
PEW RESEARCH CENTER
10
Latino Voters in the 2012 Election
Pew Hispanic Center | www.pewhispanic.org
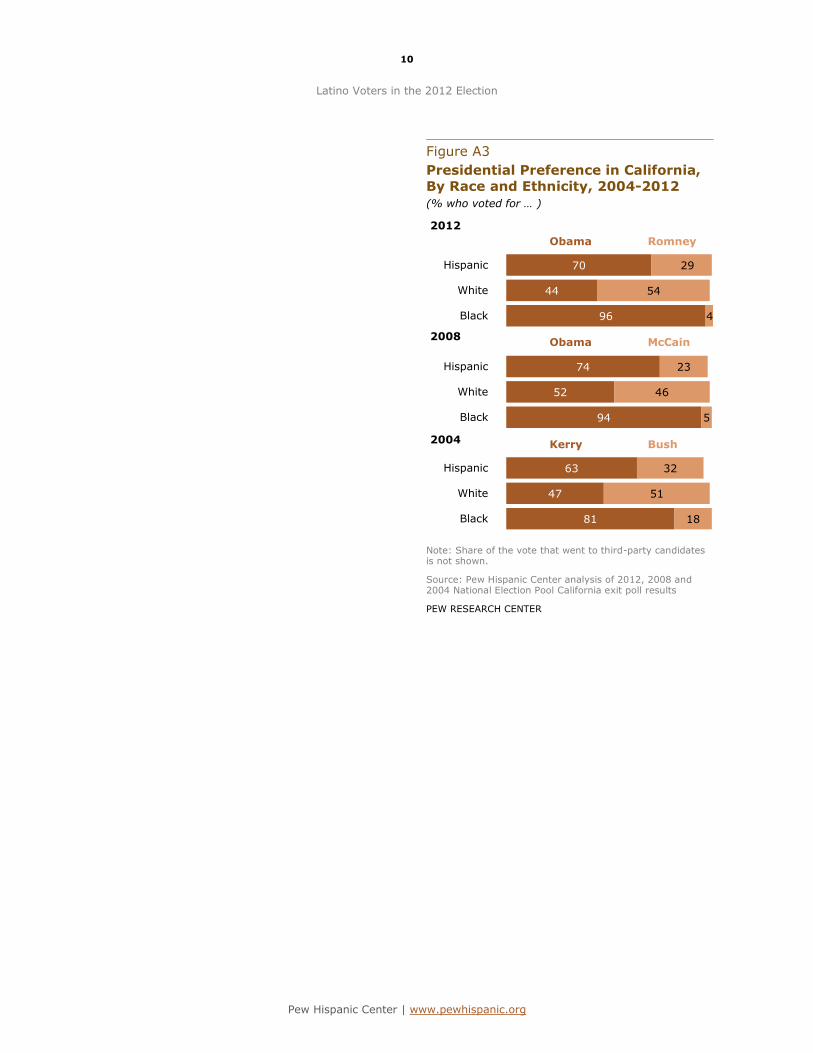
70
44
96
74
52
94
63
47
81
29
54
4
23
46
5
32
51
18
Hispanic
White
Black
Hispanic
White
Black
Hispanic
White
Black
Romney
2012
McCain
Bush
Obama
Kerry
2004
2008 Obama
Figure A3
Presidential Preference in California,
By Race and Ethnicity, 2004-2012
(% who voted for … )
Note: Share of the vote that went to third-party candidates is not shown.
Source: Pew Hispanic Center analysis of 2012, 2008 and 2004 National Election Pool California exit poll results
PEW RESEARCH CENTER

11
Latino Voters in the 2012 Election
Pew Hispanic Center | www.pewhispanic.org
75
44
61
50
68
42
23
54
38
48
30
57
Hispanic
White
Hispanic
White
Hispanic
White
Romney
2012
McCain
Bush
Obama
Kerry
2004
2008 Obama
Figure A4
Presidential Preference in Colorado,
By Race and Ethnicity, 2004-2012
(% who voted for … )
Note: Share of the vote that went to third-party candidates is not shown.
Source: Pew Hispanic Center analysis of 2012, 2008 and 2004 National Election Pool Colorado exit poll results
PEW RESEARCH CENTER

12
Latino Voters in the 2012 Election
Pew Hispanic Center | www.pewhispanic.org
60
37
95
57
42
96
44
42
86
39
61
4
42
56
4
56
57
13
Hispanic
White
Black
Hispanic
White
Black
Hispanic
White
Black
Romney
2012
McCain
Bush
Obama
Kerry
2004
2008 Obama
Figure A5
Presidential Preference in Florida, by
Race and Ethnicity, 2004-2012
(% who voted for … )
Note: Share of the vote that went to third-party candidates is not shown.
Source: Pew Hispanic Center analysis of 2012, 2008 and 2004 National Election Pool Florida exit poll results
PEW RESEARCH CENTER
13
Latino Voters in the 2012 Election
Pew Hispanic Center | www.pewhispanic.org
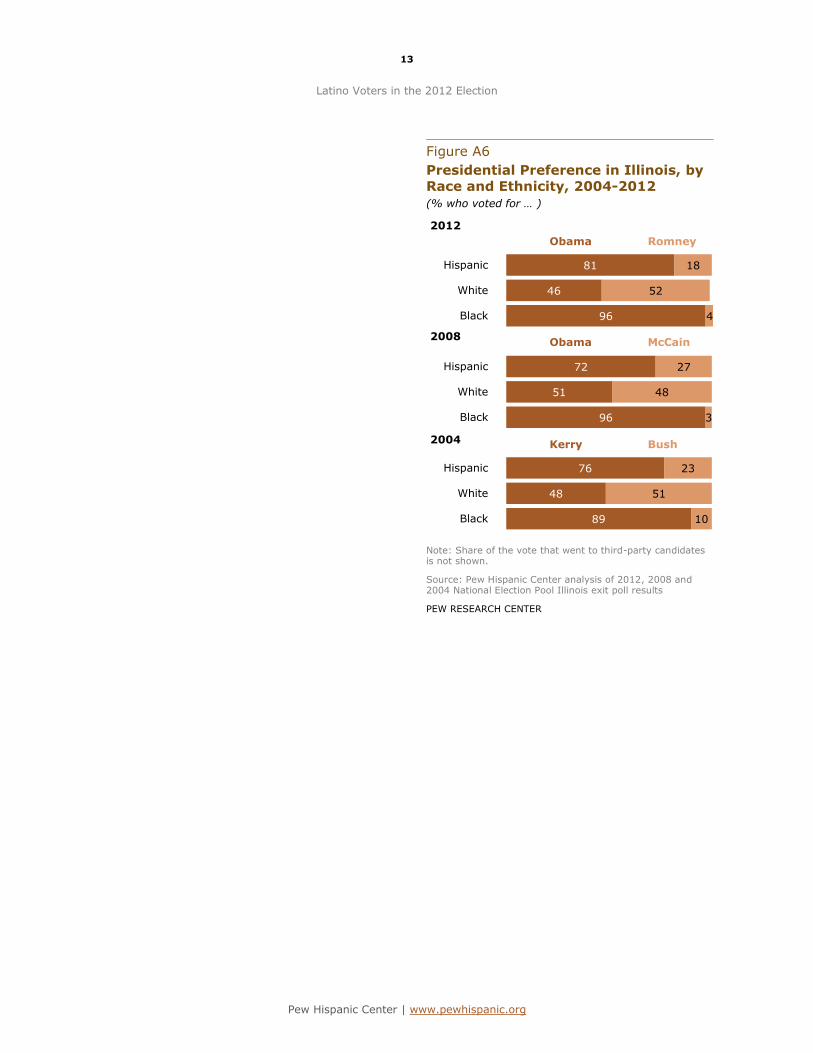
81
46
96
72
51
96
76
48
89
18
52
4
27
48
3
23
51
10
Hispanic
White
Black
Hispanic
White
Black
Hispanic
White
Black
Romney
2012
McCain
Bush
Obama
Kerry
2004
2008 Obama
Figure A6
Presidential Preference in Illinois, by
Race and Ethnicity, 2004-2012
(% who voted for … )
Note: Share of the vote that went to third-party candidates is not shown.
Source: Pew Hispanic Center analysis of 2012, 2008 and 2004 National Election Pool Illinois exit poll results
PEW RESEARCH CENTER

14
Latino Voters in the 2012 Election
Pew Hispanic Center | www.pewhispanic.org
70
41
91
76
45
94
60
43
86
25
57
6
22
53
5
39
55
13
Hispanic
White
Black
Hispanic
White
Black
Hispanic
White
Black
Romney
2012
McCain
Bush
Obama
Kerry
2004
2008 Obama
Figure A7
Presidential Preference in Nevada, by
Race and Ethnicity, 2004-2012
(% who voted for … )
Note: Share of the vote that went to third-party candidates is not shown.
Source: Pew Hispanic Center analysis of 2012, 2008 and 2004 National Election Pool Nevada exit poll results
PEW RESEARCH CENTER
15
Latino Voters in the 2012 Election
Pew Hispanic Center | www.pewhispanic.org
64
40
0
69
42
56
43
29
56
30
56
44
56
Hispanic
White
Hispanic
White
Hispanic
White
Romney
2012
McCain
Bush
Obama
Kerry
2004
2008 Obama
Figure A8
Presidential Preference in New
Mexico, by Race and Ethnicity,
2004-2012
(% who voted for … )
Note: Share of the vote that went to third-party candidates is not shown.
Source: Pew Hispanic Center analysis of 2012, 2008 and 2004 National Election Pool New Mexico exit poll results
PEW RESEARCH CENTER
16
Latino Voters in the 2012 Election
Pew Hispanic Center | www.pewhispanic.org
68
31
96
31
68
4
Hispanic
White
Black
Romney Obama
53
41
96
42
58
4
Hispanic
White
Black
Romney Obama
Figure A9
Presidential Preference in North
Carolina, by Race and Ethnicity, 2012
(% who voted for … )
Note: Share of the vote that went to third party candidates is not shown.
Source: Pew Hispanic Center analysis of 2012 National Election Pool North Carolina exit poll results
PEW RESEARCH CENTER
Figure A10
Presidential Preference in Ohio, by Race and Ethnicity, 2012
(% who voted for … )
Note: Share of the vote that went to third-party candidates is not shown.
Source: Pew Hispanic Center analysis of 2012 National Election Pool Ohio exit poll results
PEW RESEARCH CENTER
17
Latino Voters in the 2012 Election
Pew Hispanic Center | www.pewhispanic.org
80
42
93
72
48
95
72
84
45
18
57
6
28
51
5
28
16
54
Hispanic
White
Black
Hispanic
White
Black
Hispanic
White
Black
Romney
2012
McCain
Bush
Obama
Kerry
2004
2008 Obama
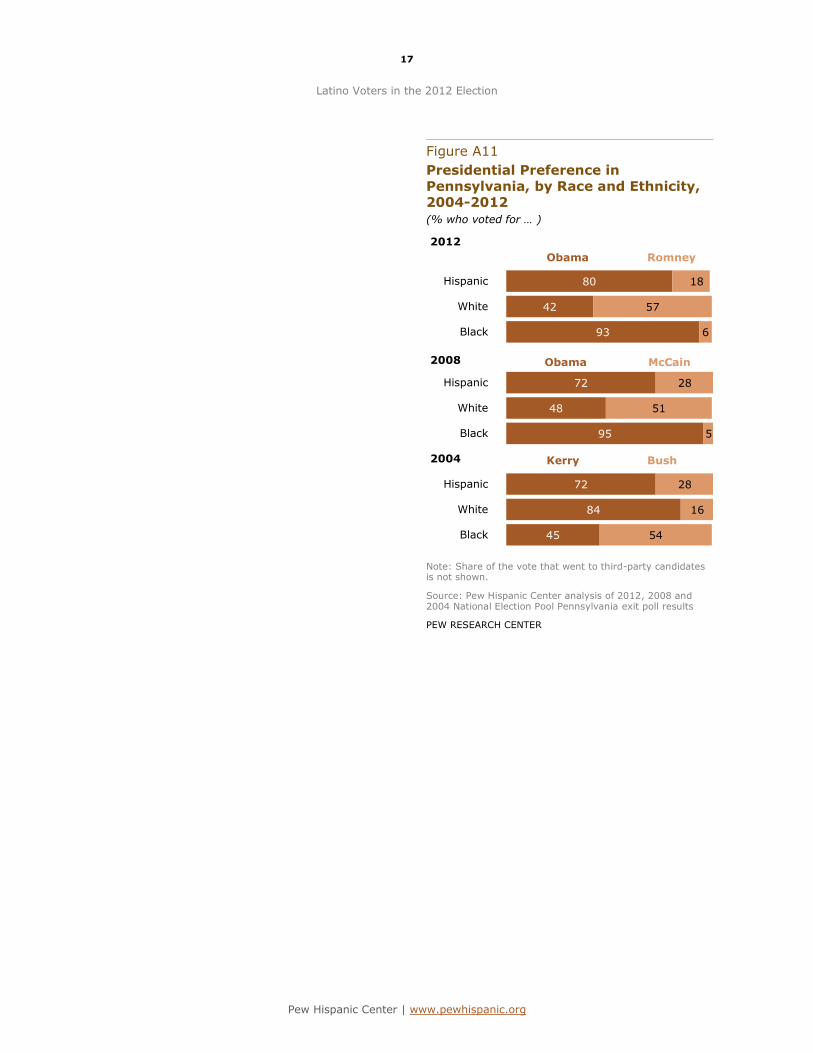
Figure A11
Presidential Preference in
Pennsylvania, by Race and Ethnicity, 2004-2012
(% who voted for … )
Note: Share of the vote that went to third-party candidates is not shown.
Source: Pew Hispanic Center analysis of 2012, 2008 and 2004 National Election Pool Pennsylvania exit poll results
PEW RESEARCH CENTER
18
Latino Voters in the 2012 Election
Pew Hispanic Center | www.pewhispanic.org
65
47
94
31
51
6
Hispanic
White
Black
Romney Obama
64
37
93
65
39
92
33
61
6
34
60
8
Hispanic
White
Black
Hispanic
White
Black
Romney 2012
McCain
Obama
2008 Obama
Figure A12
Presidential Preference in Virginia, by Race and Ethnicity, 2008 and 2012
(% who voted for … )
Note: Share of the vote that went to third-party candidates is not shown.
Source: Pew Hispanic Center analysis of 2012 and 2008 National Election Pool Virginia exit poll results
PEW RESEARCH CENTER
Figure A13
Presidential Preference in Wisconsin,
By Race and Ethnicity, 2012
(% who voted for … )
Note: Share of the vote that went to third-party candidates is not shown.
Source: Pew Hispanic Center analysis of 2012 National Election Pool Wisconsin exit poll results
PEW RESEARCH CENTER
19
Latino Voters in the 2012 Election
Pew Hispanic Center | www.pewhispanic.org
References
Lopez, Mark Hugo. 2010. “Latinos and the 2010 Elections: Strong Support for Democrats;
Weak Voter Motivation.” Washington, DC: Pew Hispanic Center, October.
http://www.pewhispanic.org/2010/10/05/latinos-and-the-2010-elections-strong-
support-for-democrats-weak-voter-motivation/
Lopez, Mark Hugo. 2008. “The Hispanic Vote in the 2008 Election.” Washington, DC: Pew
Hispanic Center, November. http://www.pewhispanic.org/2008/11/05/the-hispanic-
vote-in-the-2008-election/
Lopez, Mark Hugo, Seth Motel, and Eileen Patten. 2012. “A Record 24 Million Latinos Are
Eligible to Vote, But Turnout Rate Has Lagged That of Whites, Blacks.” Washington,
DC: Pew Hispanic Center, October. http://www.pewhispanic.org/2012/10/01/a-
record-24-million-latinos-are-eligible-to-vote/
Lopez, Mark Hugo and Paul Taylor. 2009. “Dissecting the 2008 Electorate: Most Diverse in
U.S. History.” Washington, DC: Pew Hispanic Center, April.
http://www.pewhispanic.org/2009/04/30/dissecting-the-2008-electorate-most-
diverse-in-us-history/
Suro, Roberto, Richard Fry and Jeffrey Passel. 2005. “Hispanics and the 2004 Election:
Population, Electorate and Voters.” Washington, DC: Pew Hispanic Center, June.
http://www.pewhispanic.org/2005/06/27/hispanics-and-the-2004-election/