Embed Size (px)
Citation preview
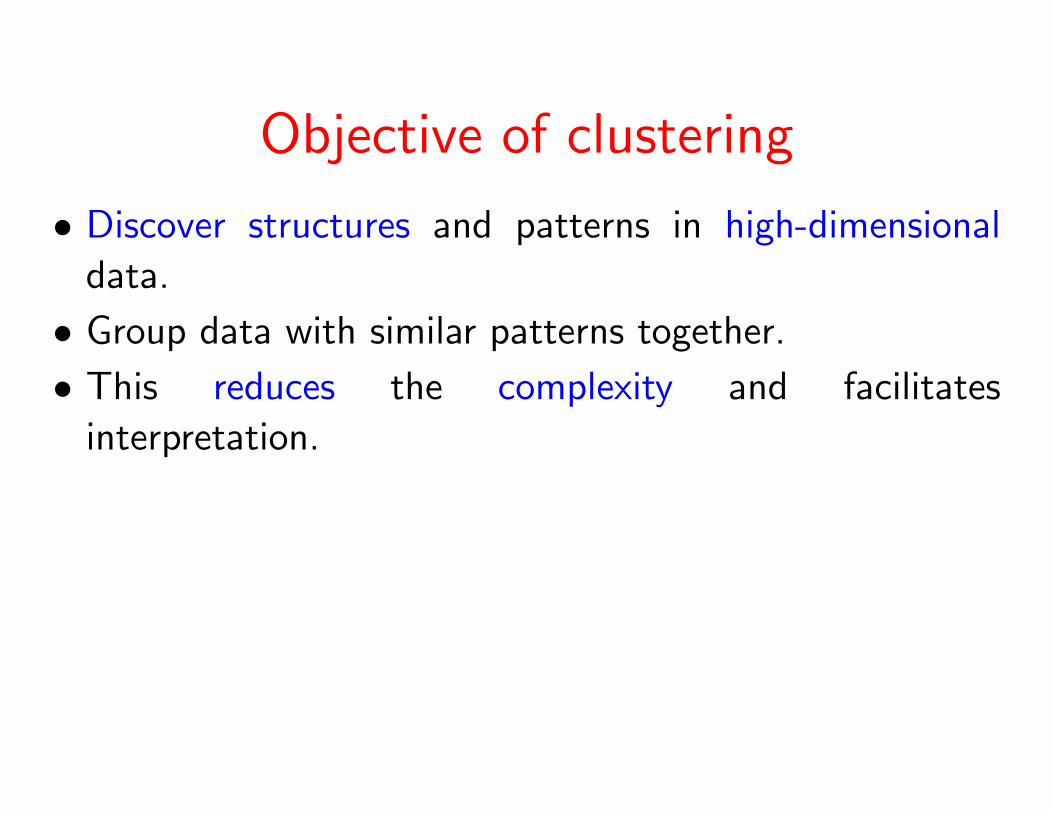
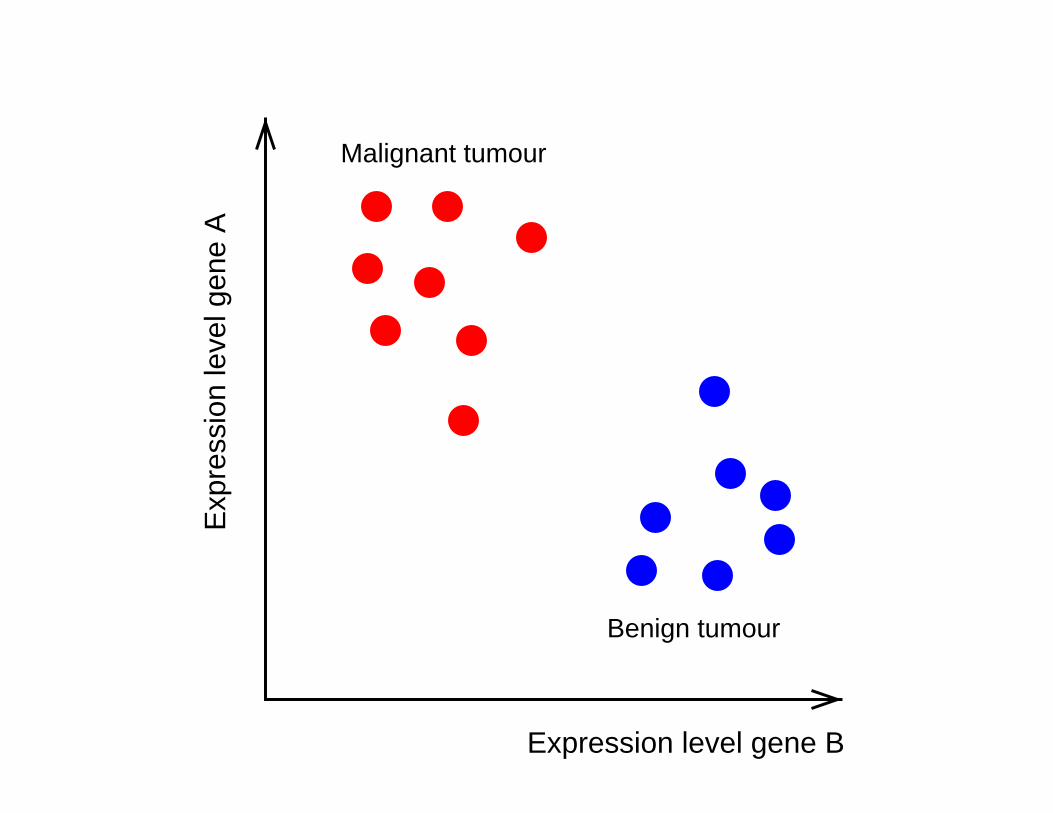
Objective of clustering
• Discover structures and patterns in high-dimensional
data.
• Group data with similar patterns together.
• This reduces the complexity and facilitates
interpretation.
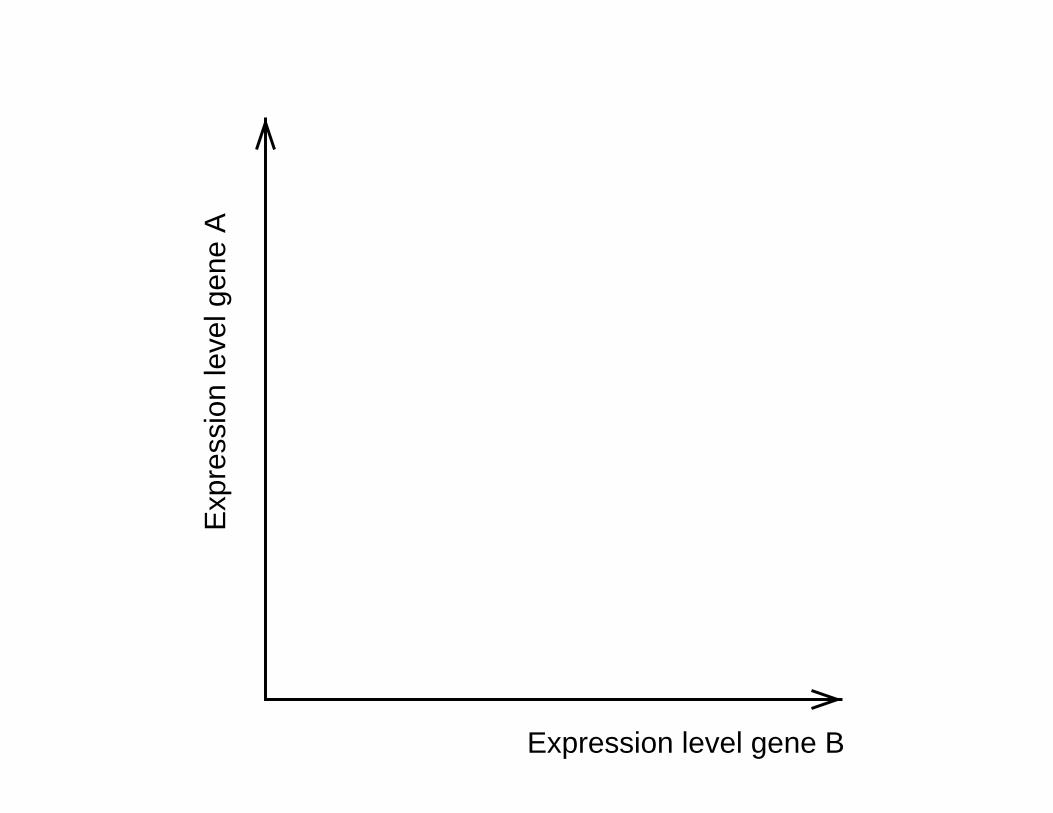
Expression level gene B
Exp
ress
ion
leve
l gen
e A
Expression level gene B
Exp
ress
ion
leve
l gen
e A
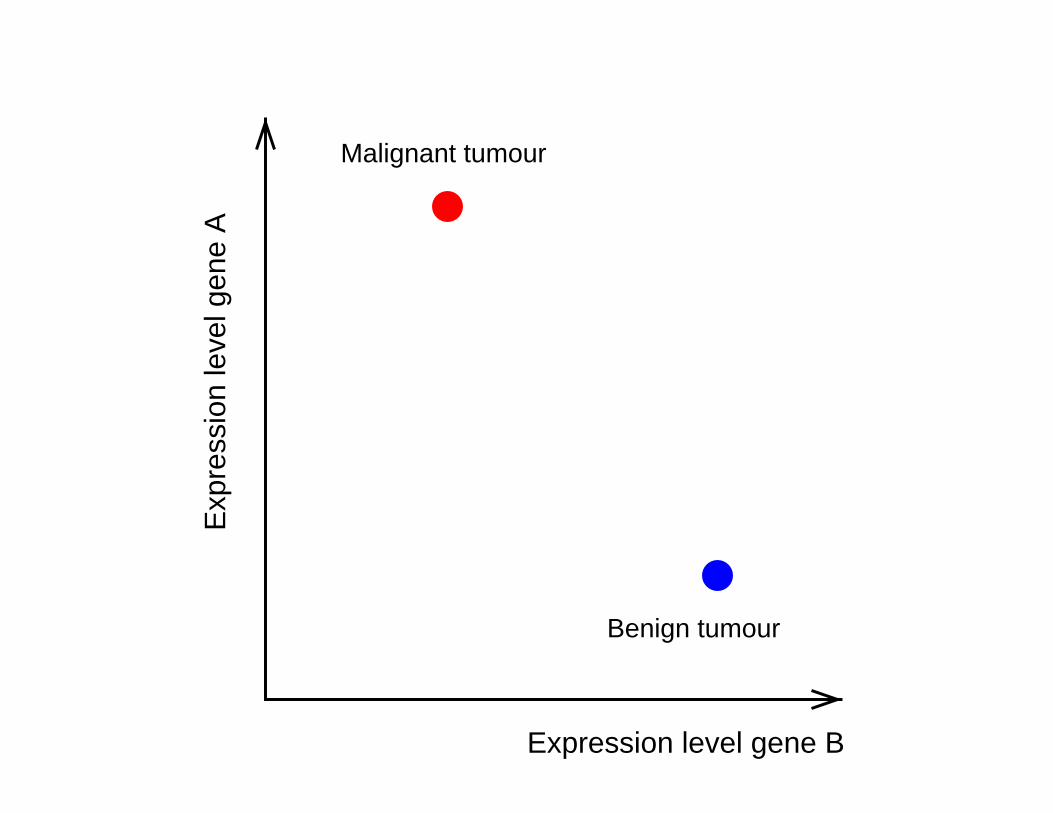
Malignant tumour
Benign tumour
Expression level gene B
Exp
ress
ion
leve
l gen
e A
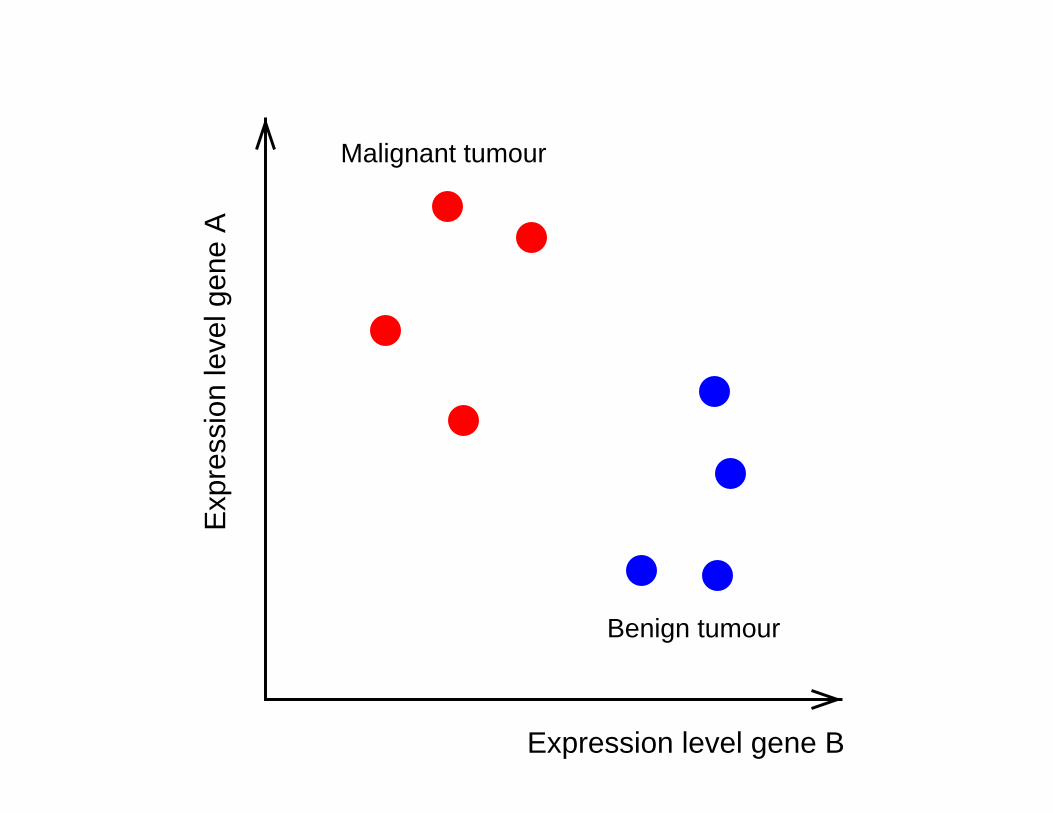
Malignant tumour
Benign tumour
Benign tumour
Malignant tumour
Exp
ress
ion
leve
l gen
e A
Expression level gene B
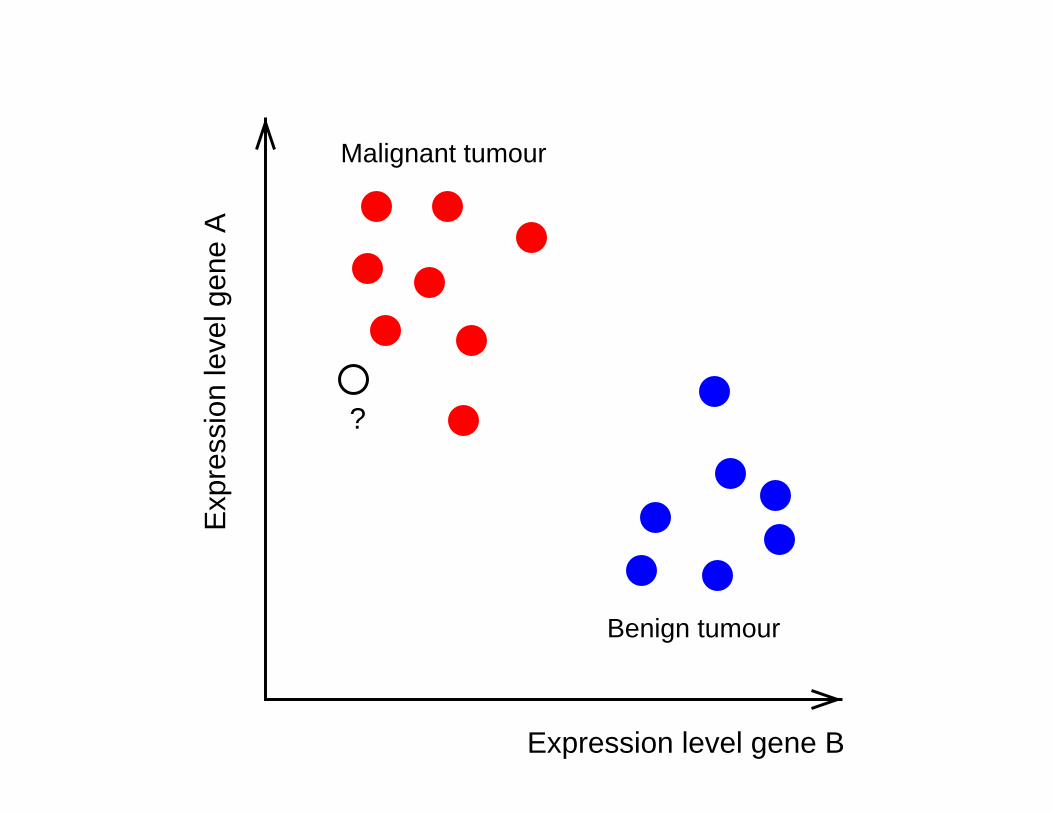
Benign tumour
Malignant tumour
?
Exp
ress
ion
leve
l gen
e A
Expression level gene B
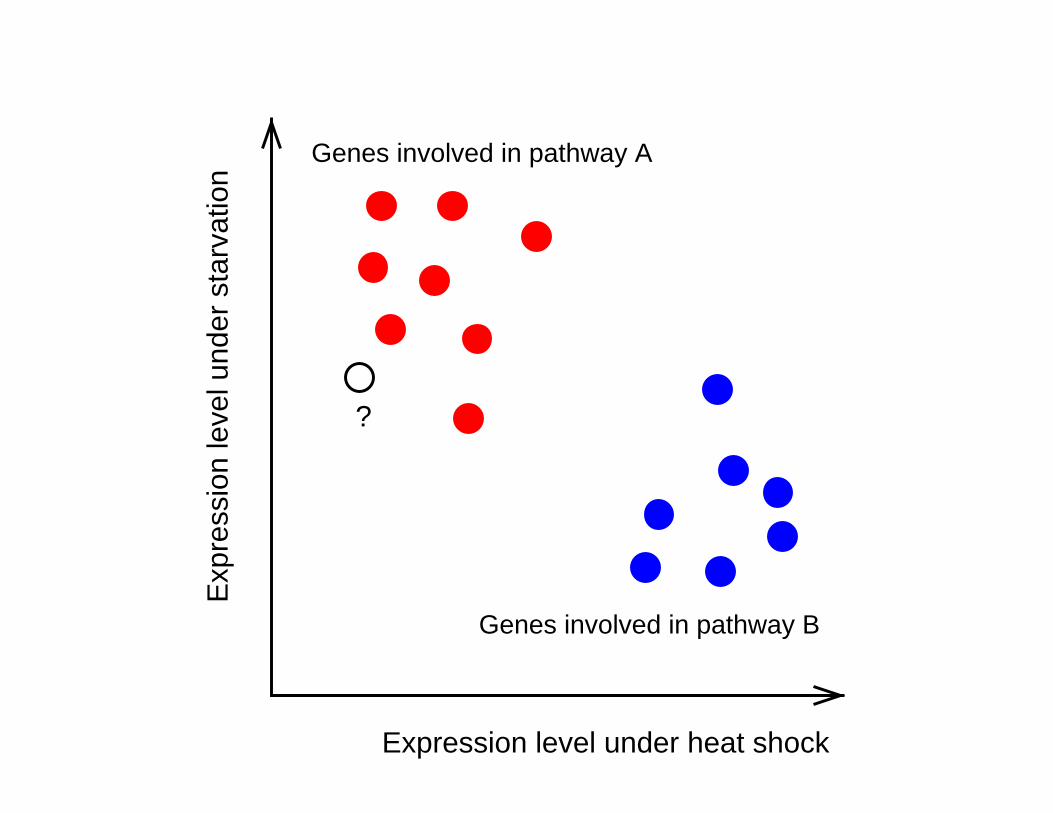
Genes involved in pathway B
Genes involved in pathway A
Exp
ress
ion
leve
l und
er s
tarv
atio
n
Expression level under heat shock
?
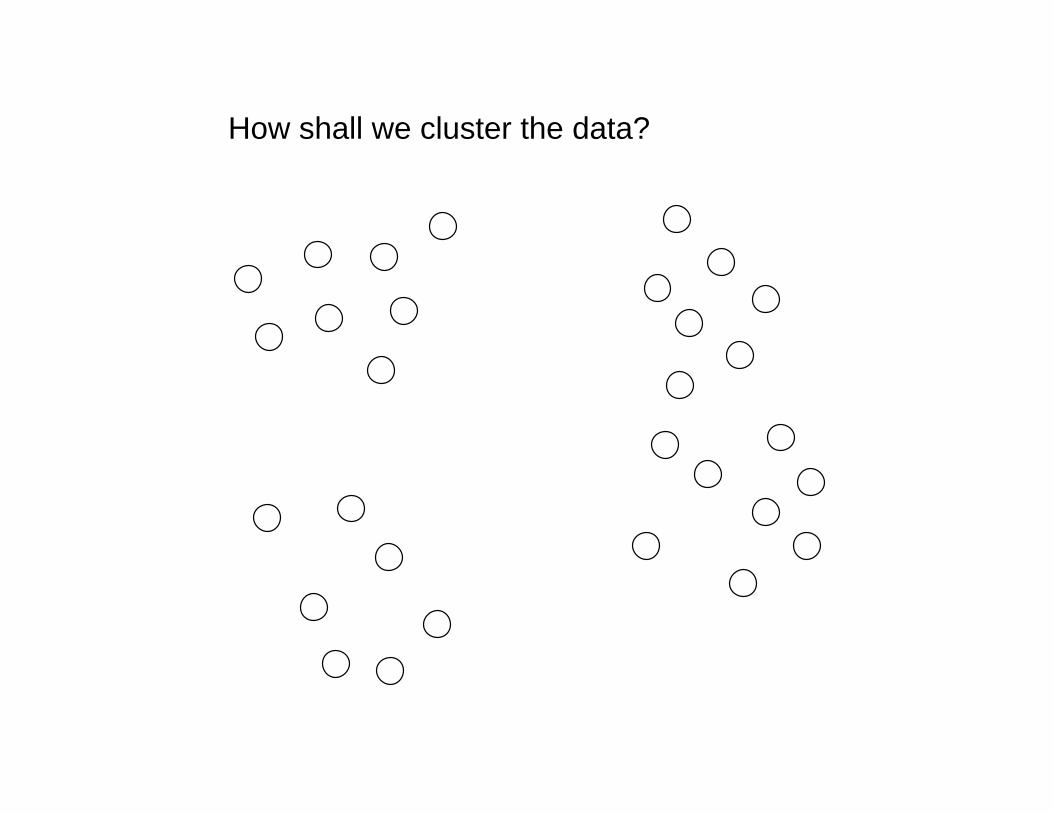
How shall we cluster the data?
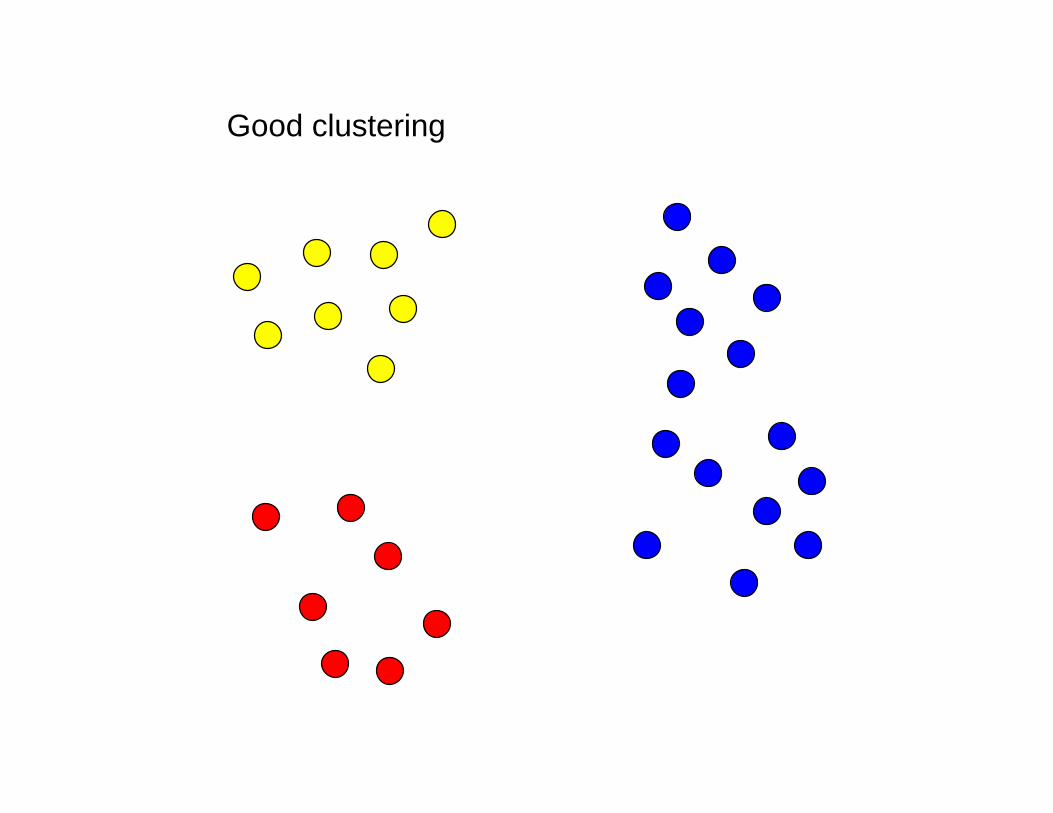
Good clustering
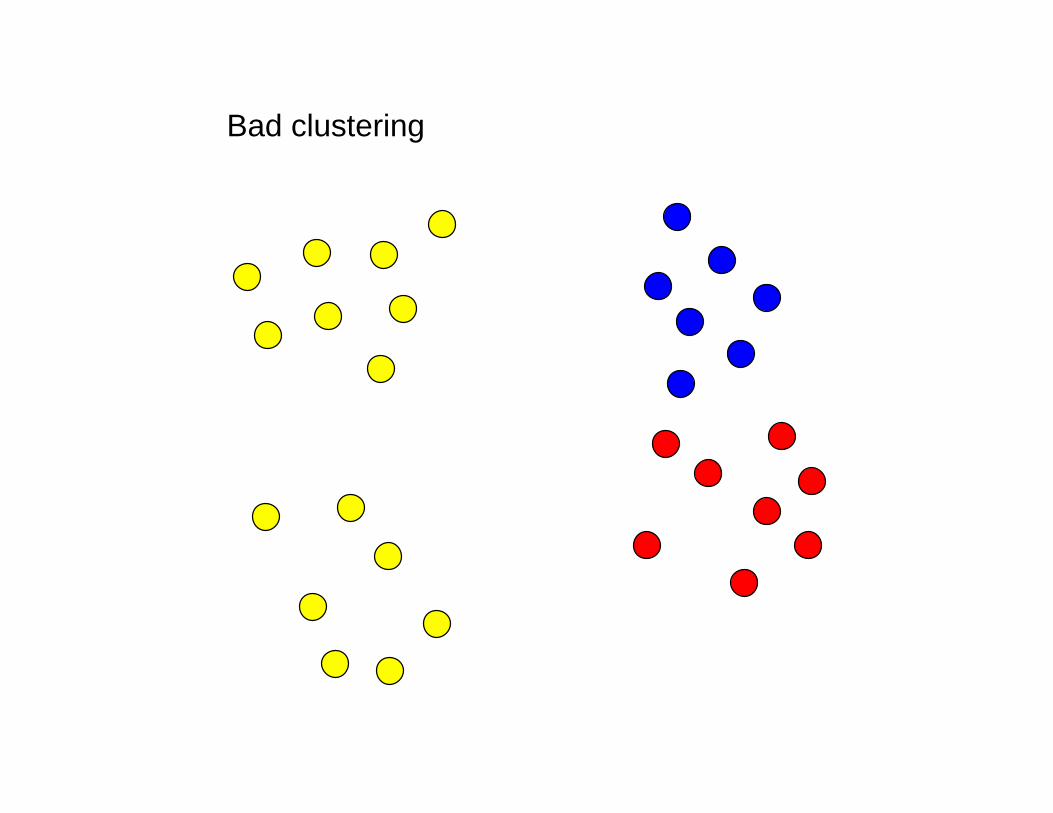
Bad clustering
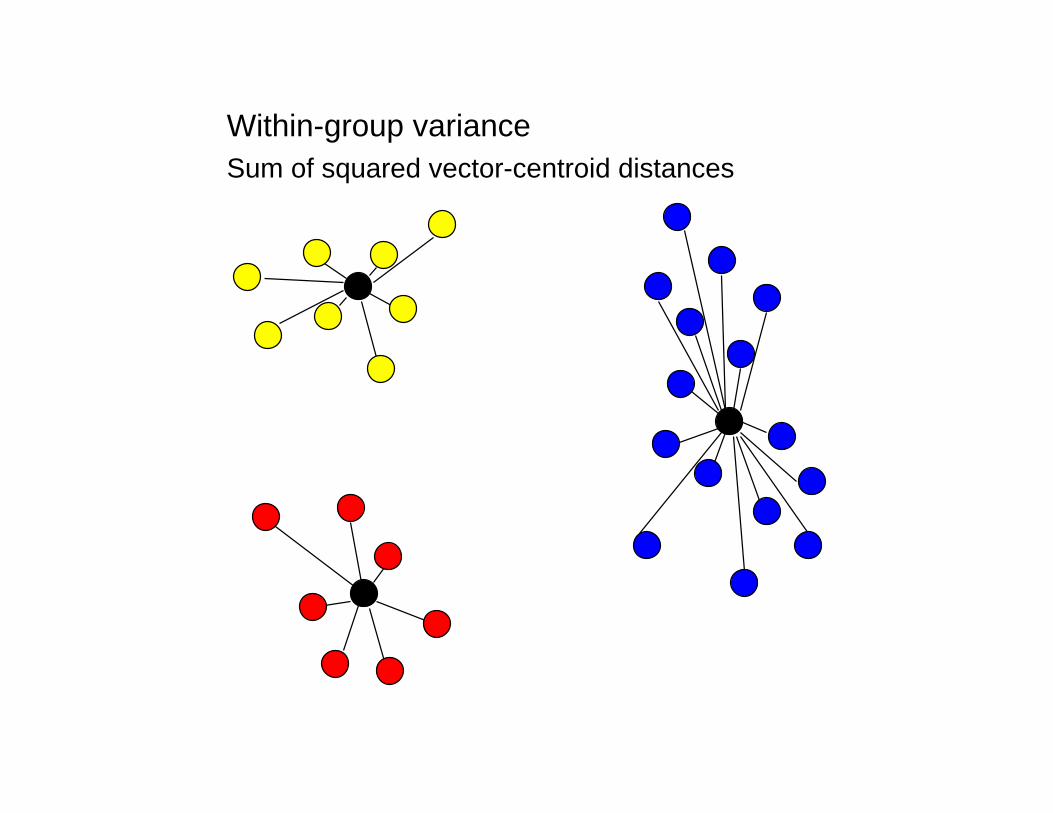
Sum of squared vector-centroid distances
Within-group variance
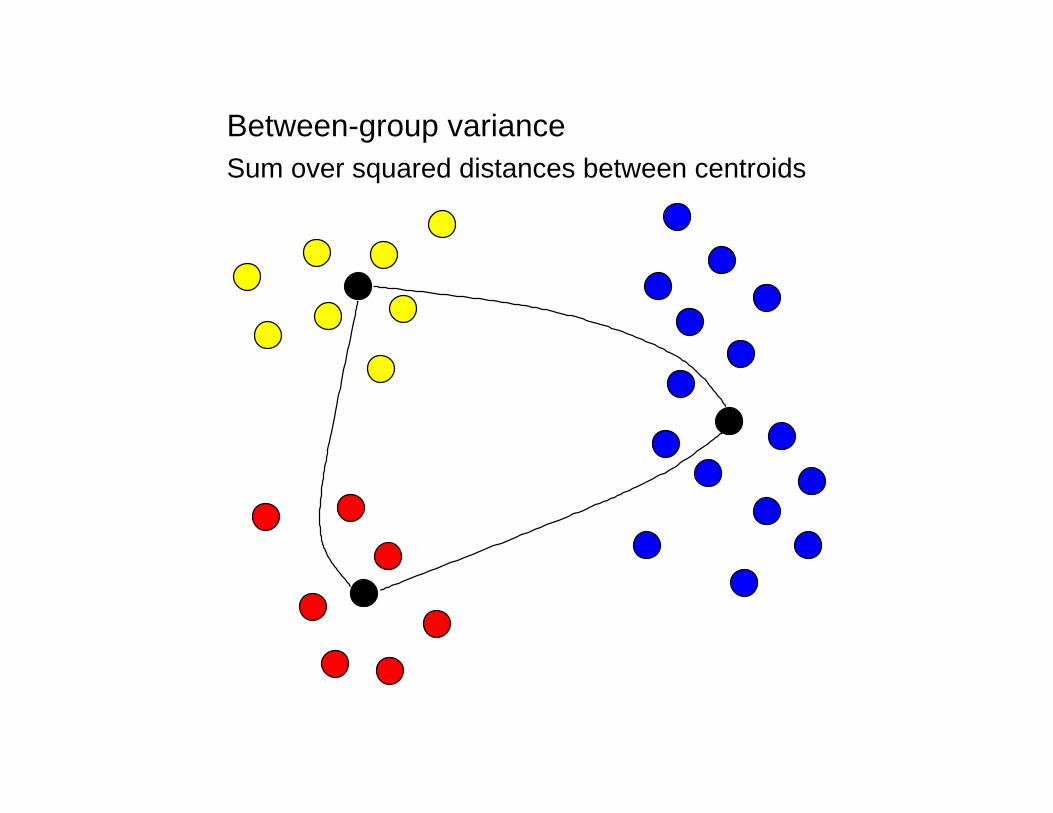
Between-group variance Sum over squared distances between centroids
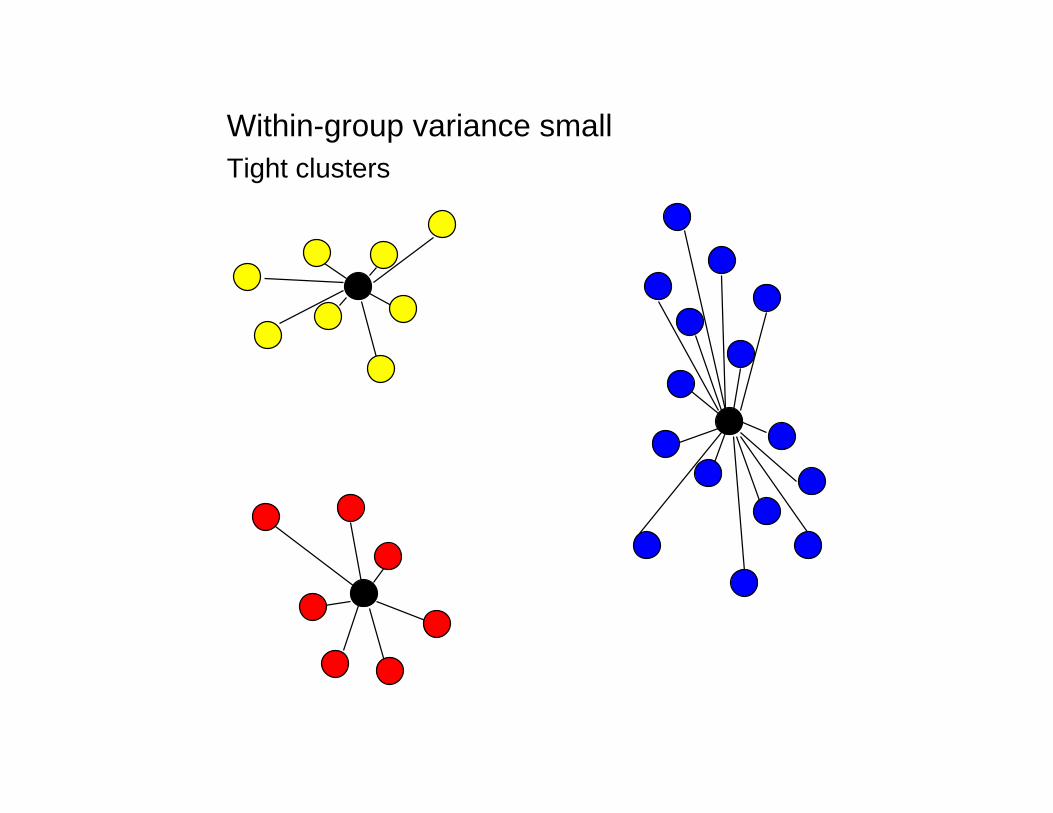
Tight clusters
Within-group variance small
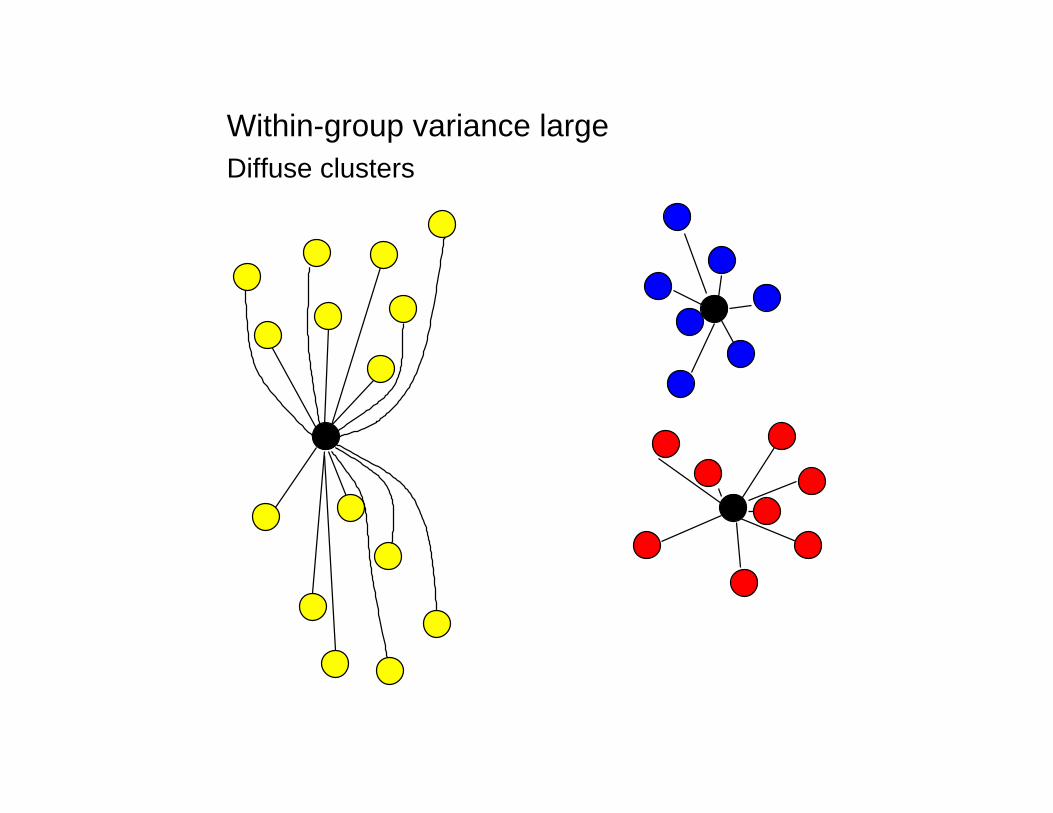
Diffuse clusters
Within-group variance large
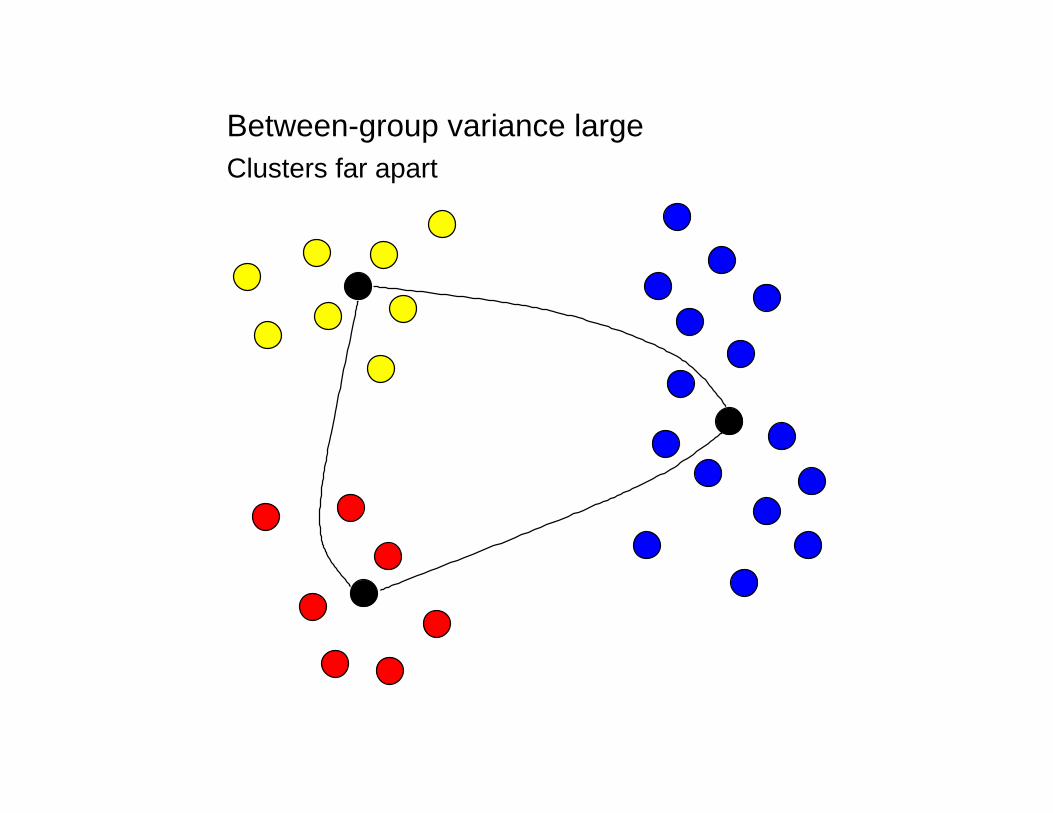
Between-group variance largeClusters far apart
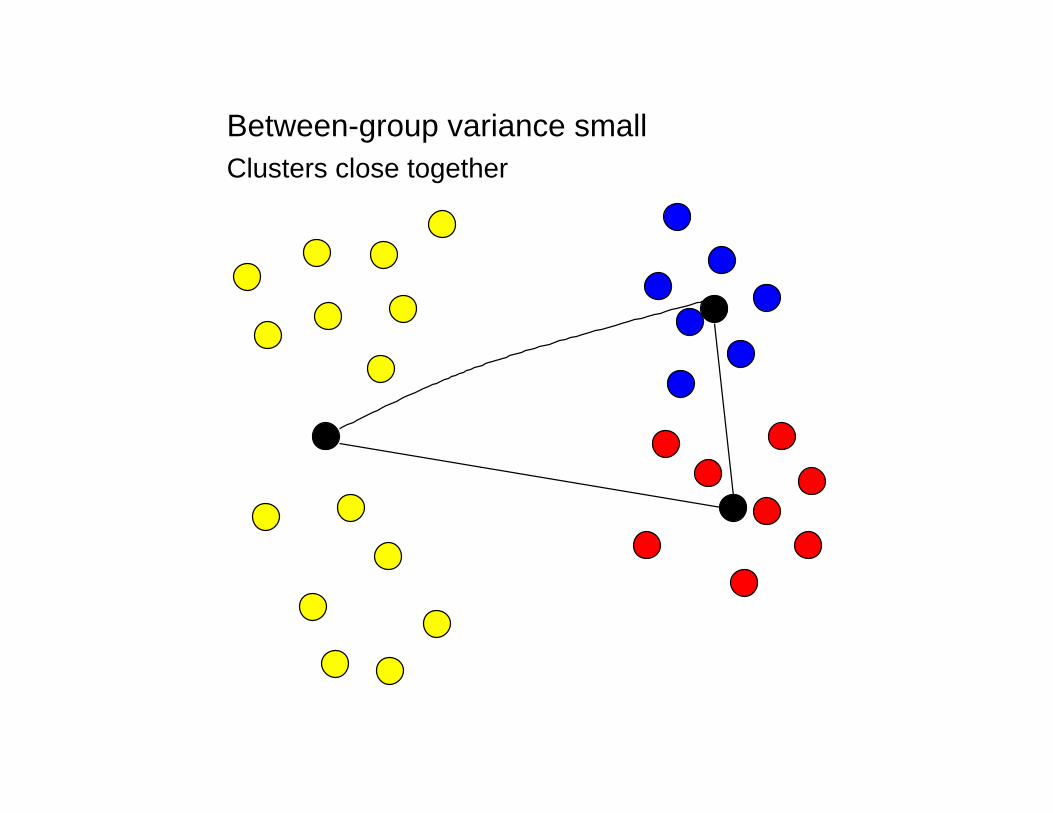
Between-group variance smallClusters close together
How to cluster the data
How to cluster the data
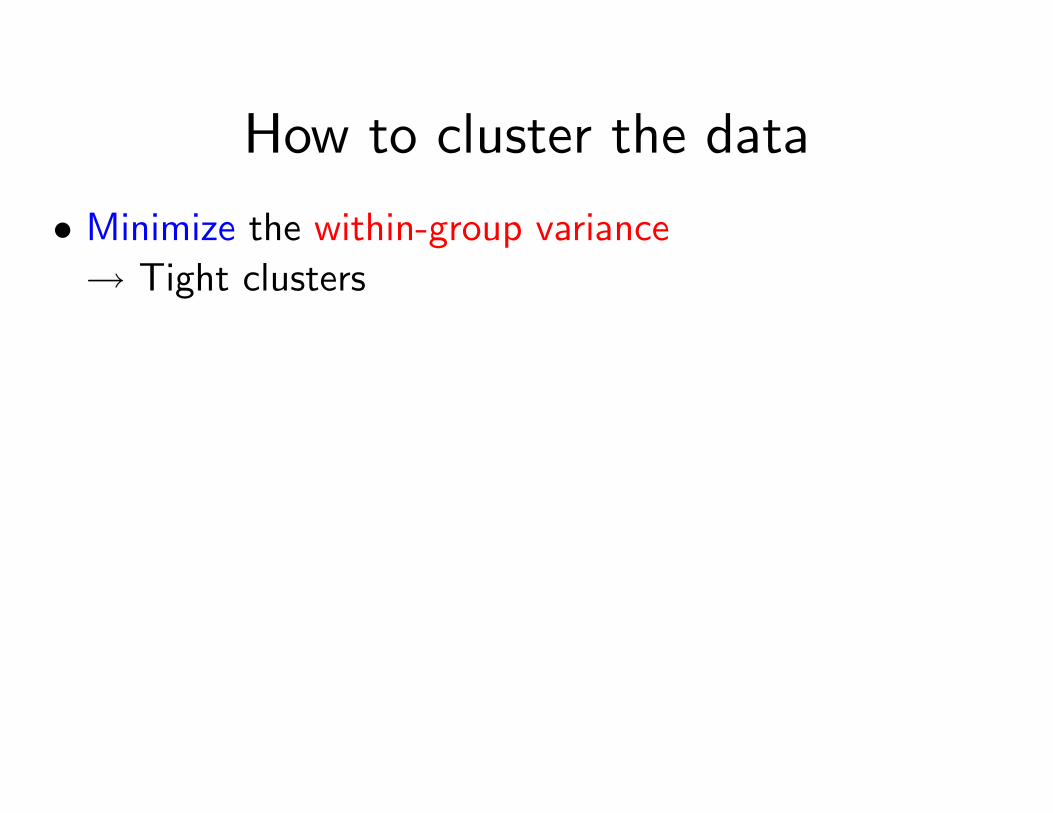
• Minimize the within-group variance
→ Tight clusters
How to cluster the data
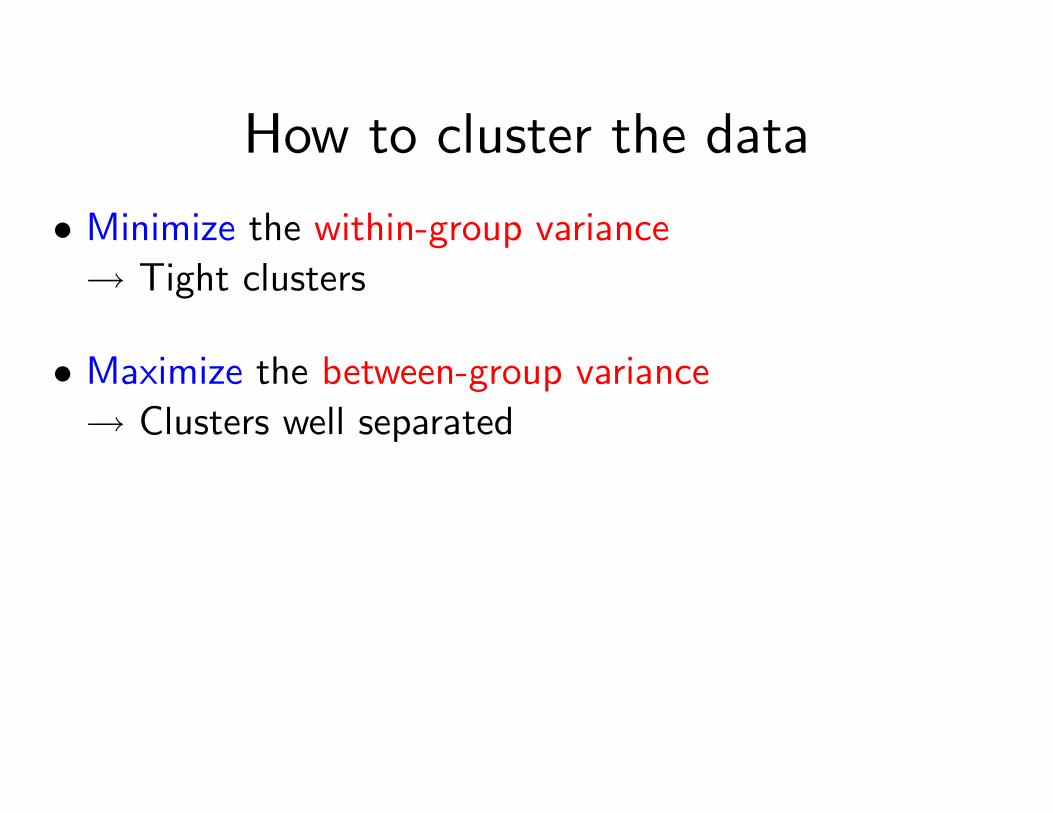
• Minimize the within-group variance
→ Tight clusters
• Maximize the between-group variance
→ Clusters well separated
How to cluster the data
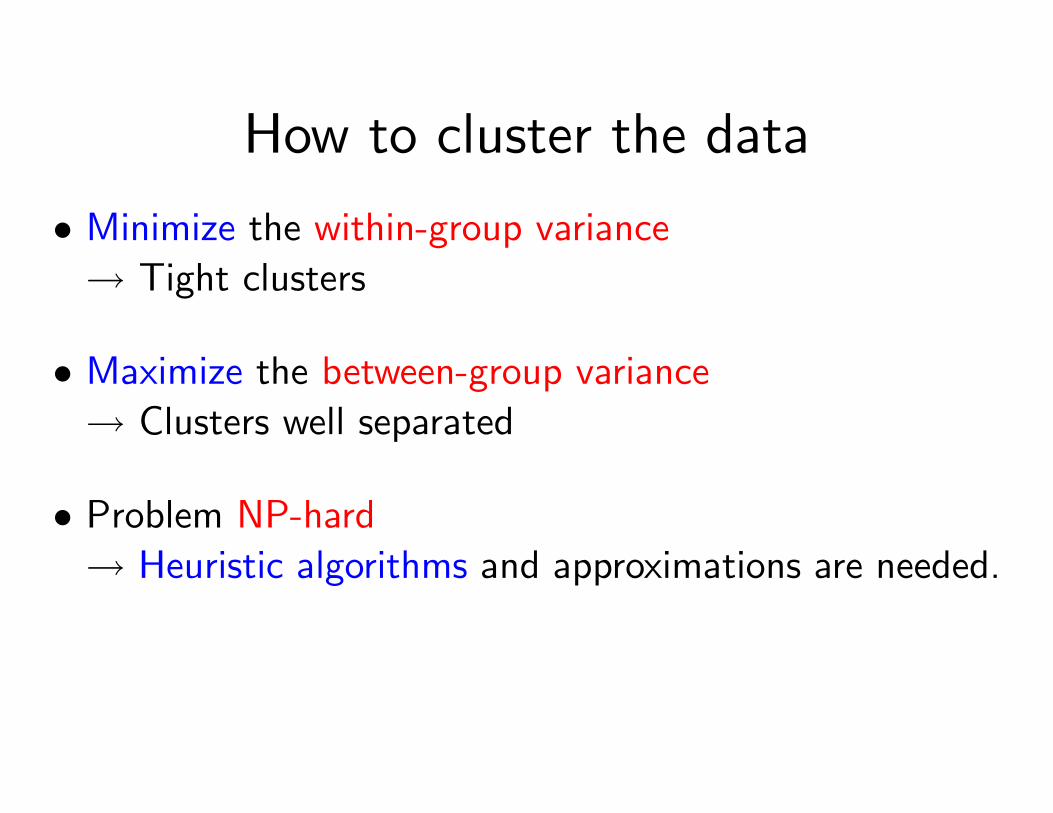
• Minimize the within-group variance
→ Tight clusters
• Maximize the between-group variance
→ Clusters well separated
• Problem NP-hard
→ Heuristic algorithms and approximations are needed.
K-means clustering
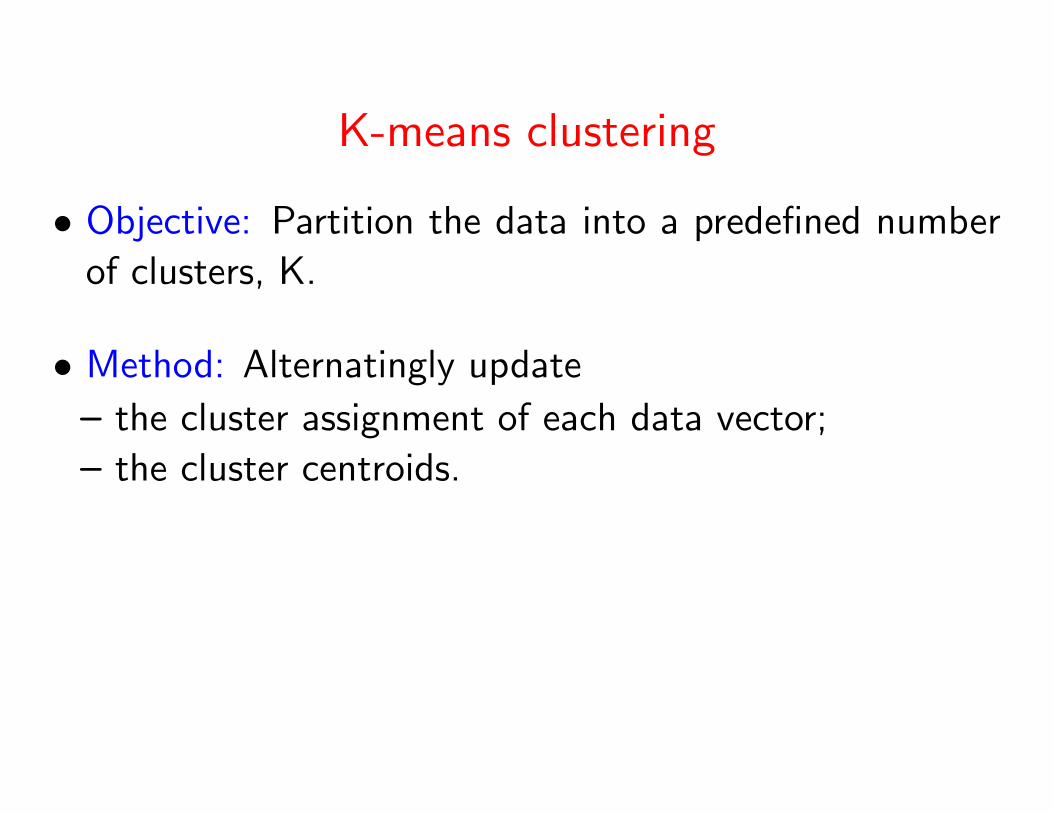
K-means clustering
• Objective: Partition the data into a predefined number
of clusters, K.
• Method: Alternatingly update
– the cluster assignment of each data vector;
– the cluster centroids.
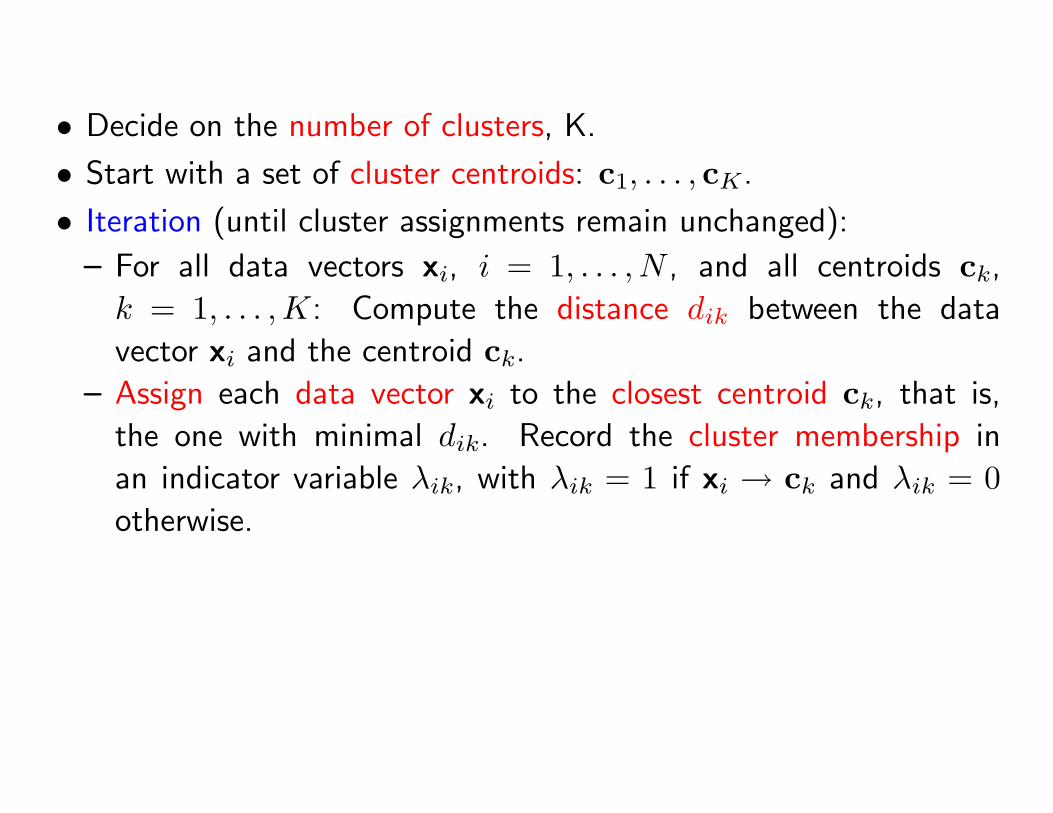
• Decide on the number of clusters, K.
• Decide on the number of clusters, K.
• Start with a set of cluster centroids: c1, . . . , cK.

• Decide on the number of clusters, K.
• Start with a set of cluster centroids: c1, . . . , cK.
• Iteration (until cluster assignments remain unchanged):
– For all data vectors xi, i = 1, . . . , N , and all centroids ck,
k = 1, . . . ,K: Compute the distance dik between the data
vector xi and the centroid ck.
– Assign each data vector xi to the closest centroid ck, that is,
the one with minimal dik. Record the cluster membership in
an indicator variable λik, with λik = 1 if xi → ck and λik = 0otherwise.
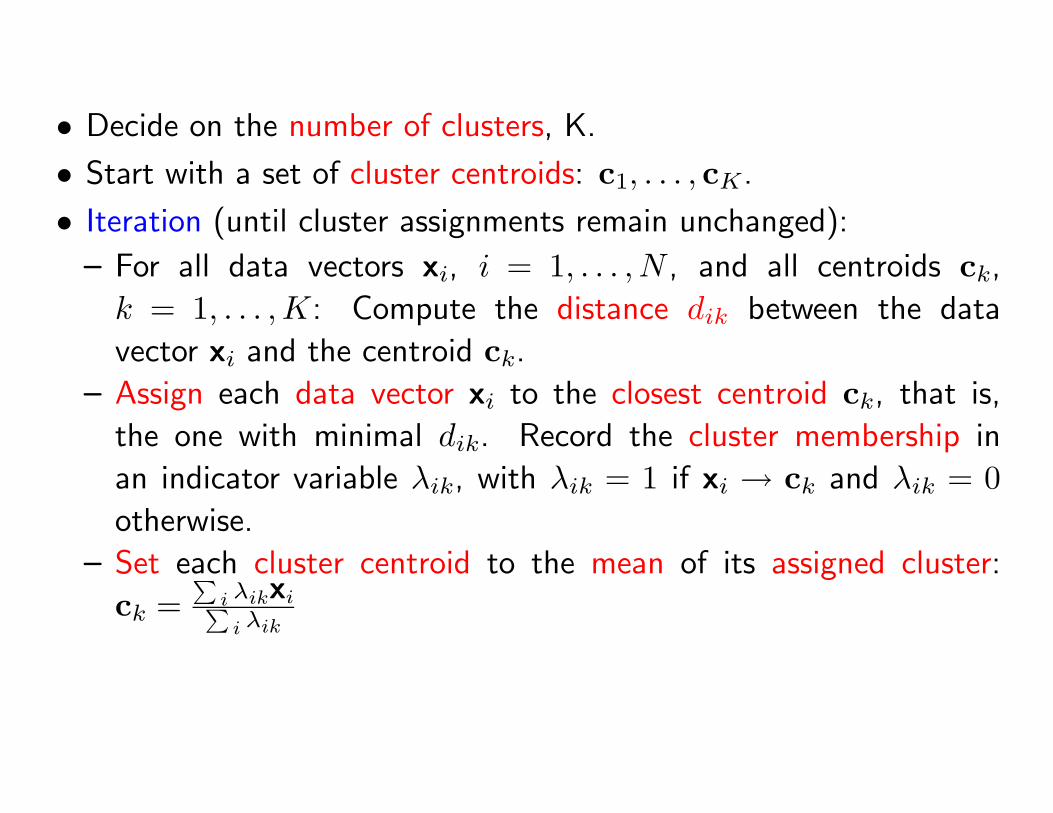
– Set each cluster centroid to the mean of its assigned cluster:
ck =∑i λikxi∑i λik
A good example of K-means clustering
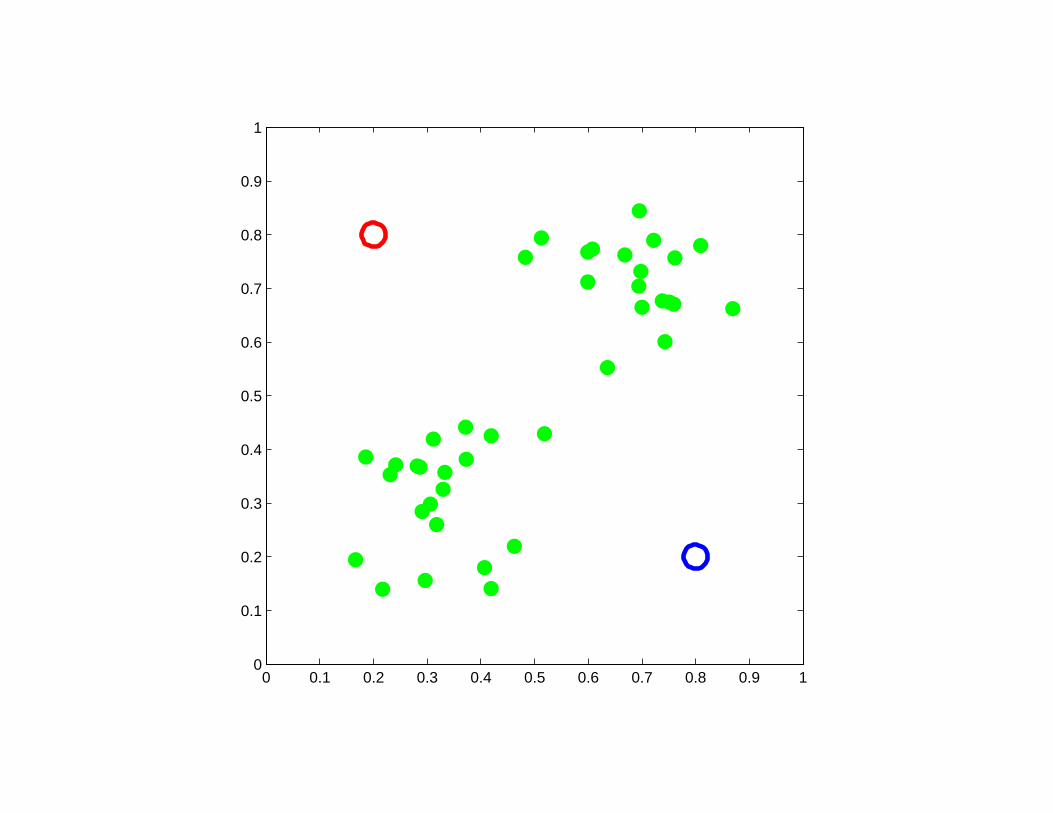
0 0.1 0.2 0.3 0.4 0.5 0.6 0.7 0.8 0.9 10
0.1
0.2
0.3
0.4
0.5
0.6
0.7
0.8
0.9
1
0 0.1 0.2 0.3 0.4 0.5 0.6 0.7 0.8 0.9 10
0.1
0.2
0.3
0.4
0.5
0.6
0.7
0.8
0.9
1
0 0.1 0.2 0.3 0.4 0.5 0.6 0.7 0.8 0.9 10
0.1
0.2
0.3
0.4
0.5
0.6
0.7
0.8
0.9
1
0 0.1 0.2 0.3 0.4 0.5 0.6 0.7 0.8 0.9 10
0.1
0.2
0.3
0.4
0.5
0.6
0.7
0.8
0.9
1
0 0.1 0.2 0.3 0.4 0.5 0.6 0.7 0.8 0.9 10
0.1
0.2
0.3
0.4
0.5
0.6
0.7
0.8
0.9
1
0 0.1 0.2 0.3 0.4 0.5 0.6 0.7 0.8 0.9 10
0.1
0.2
0.3
0.4
0.5
0.6
0.7
0.8
0.9
1

0 0.1 0.2 0.3 0.4 0.5 0.6 0.7 0.8 0.9 10
0.1
0.2
0.3
0.4
0.5
0.6
0.7
0.8
0.9
1

A bad example of K-means clustering
0 0.1 0.2 0.3 0.4 0.5 0.6 0.7 0.8 0.9 10
0.1
0.2
0.3
0.4
0.5
0.6
0.7
0.8
0.9
1
0 0.1 0.2 0.3 0.4 0.5 0.6 0.7 0.8 0.9 10
0.1
0.2
0.3
0.4
0.5
0.6
0.7
0.8
0.9
1
0 0.1 0.2 0.3 0.4 0.5 0.6 0.7 0.8 0.9 10
0.1
0.2
0.3
0.4
0.5
0.6
0.7
0.8
0.9
1
Shortcoming of K-means clustering
• The algorithm can easily get stuck insuboptimal cluster formations.
• Use fuzzy or soft K-means.
Fuzzy and soft K-means clustering
Fuzzy and soft K-means clustering
• Objective: Soft or fuzzy partition of the data into a
predefined number of clusters, K.
– Each data vector may belong to more than one cluster,
according to its degree of membership.
– This is in contrast to K-means, where a data vector
either wholly belongs to a cluster or not.
• Method: Alternatingly update
– the membership grade for each data vector;
– the cluster centroids.

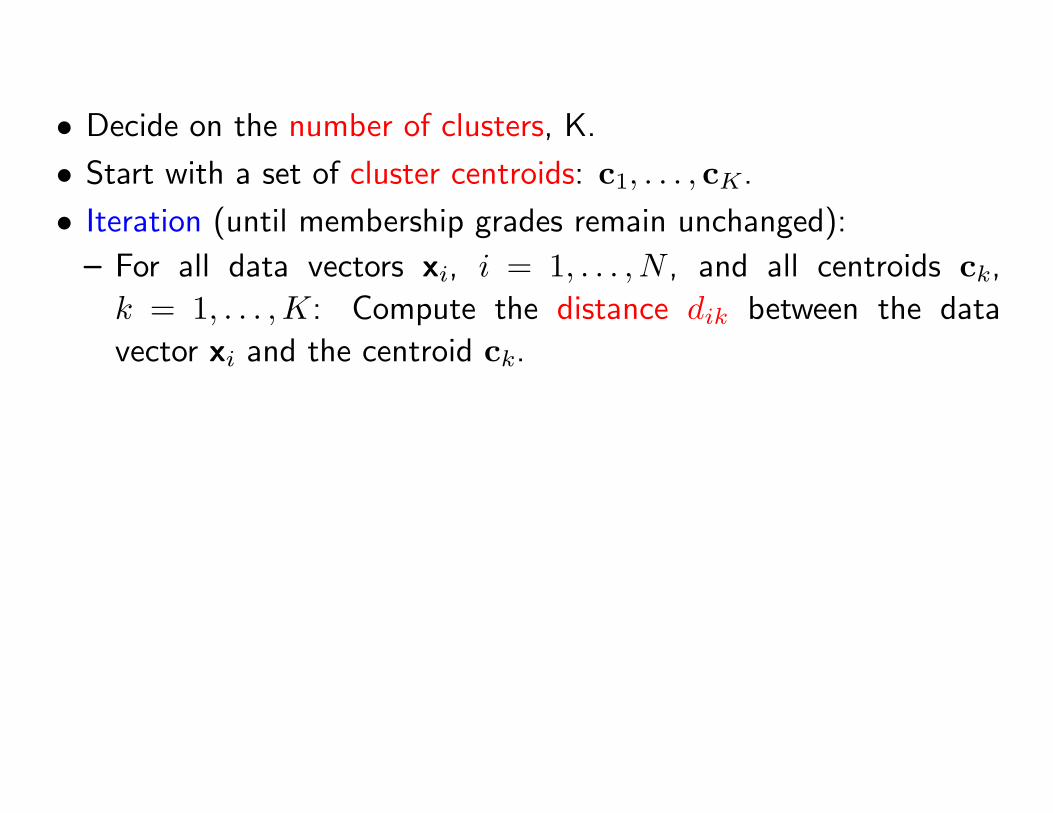
• Decide on the number of clusters, K.
• Start with a set of cluster centroids: c1, . . . , cK.
• Decide on the number of clusters, K.
• Start with a set of cluster centroids: c1, . . . , cK.
• Iteration (until membership grades remain unchanged):
– For all data vectors xi, i = 1, . . . , N , and all centroids ck,
k = 1, . . . ,K: Compute the distance dik between the data
vector xi and the centroid ck.
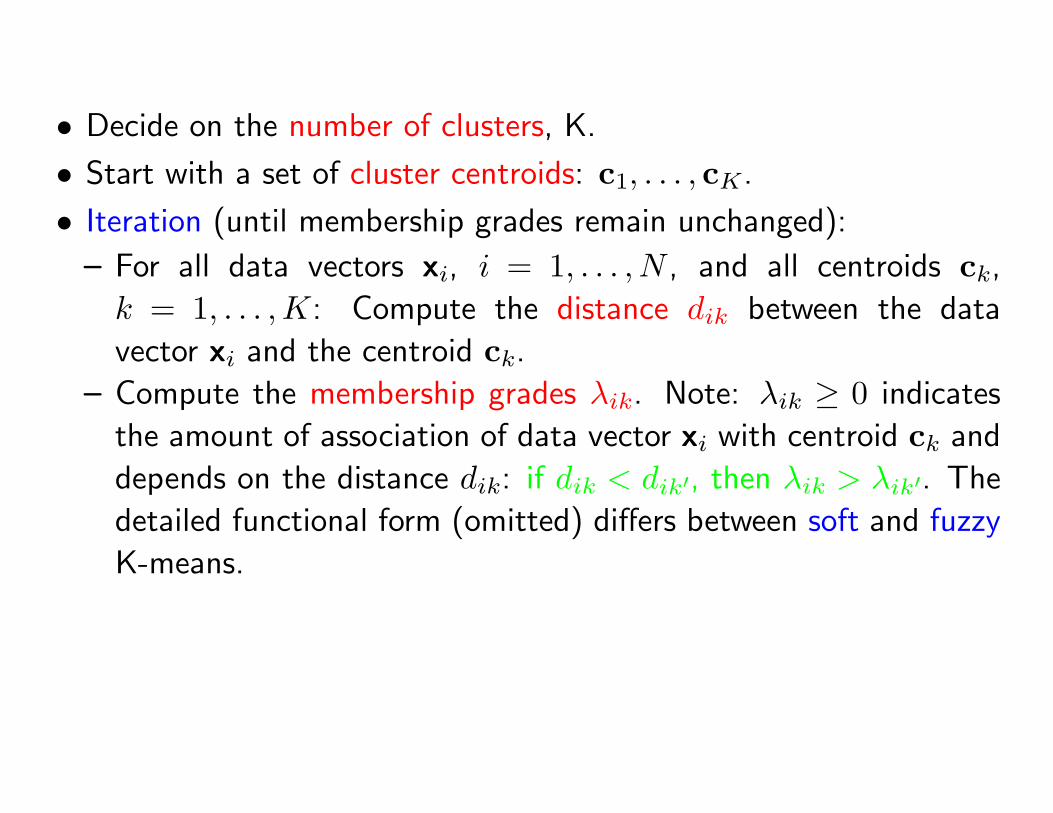
– Compute the membership grades λik. Note: λik ≥ 0 indicates
the amount of association of data vector xi with centroid ck and
depends on the distance dik: if dik < dik′, then λik > λik′. The
detailed functional form (omitted) differs between soft and fuzzy
K-means.
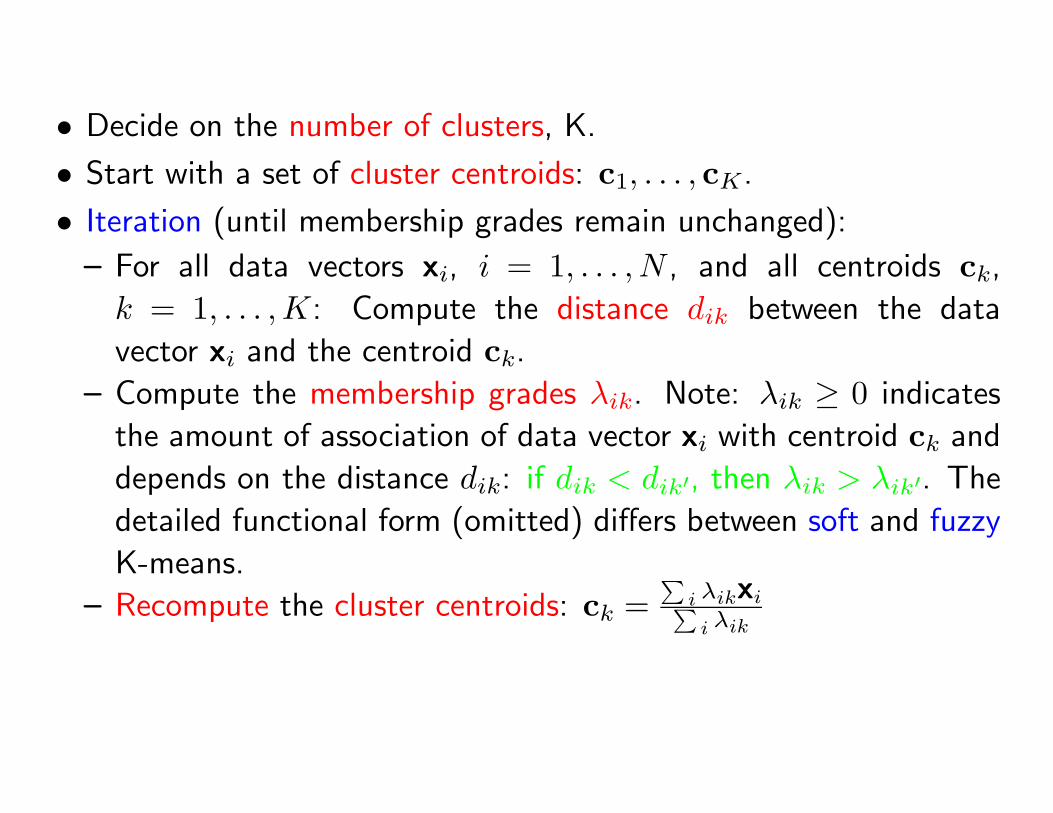
– Recompute the cluster centroids: ck =∑i λikxi∑i λik
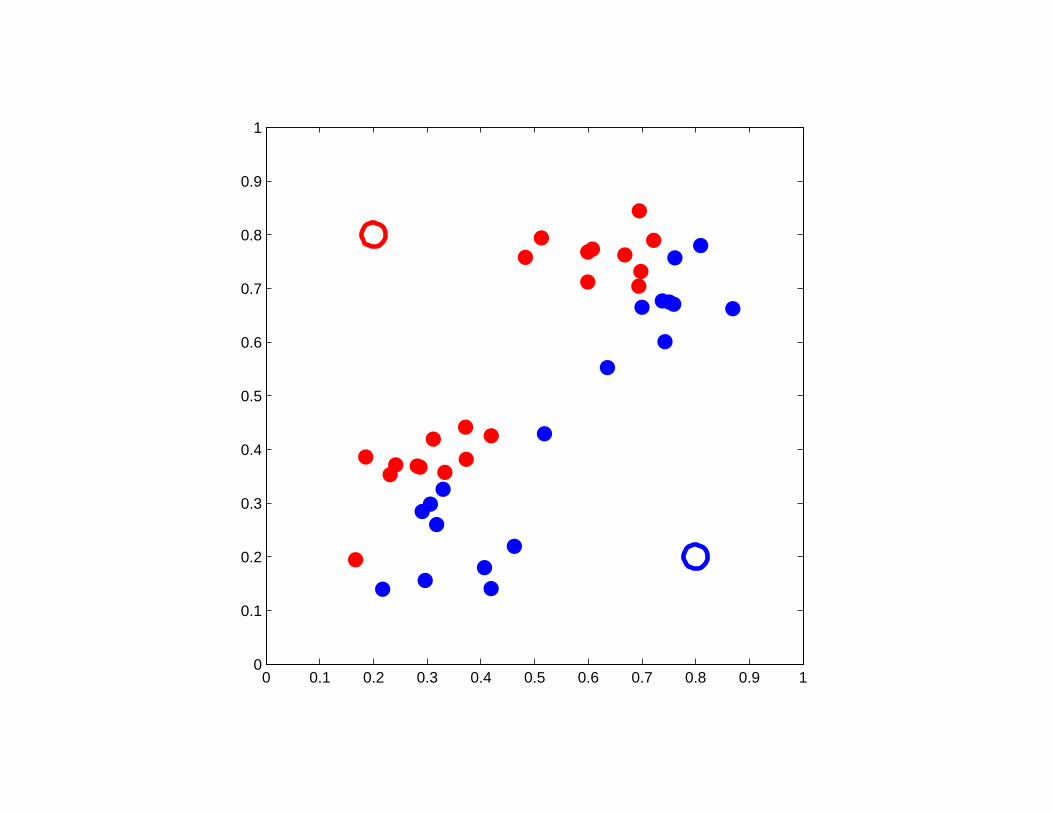
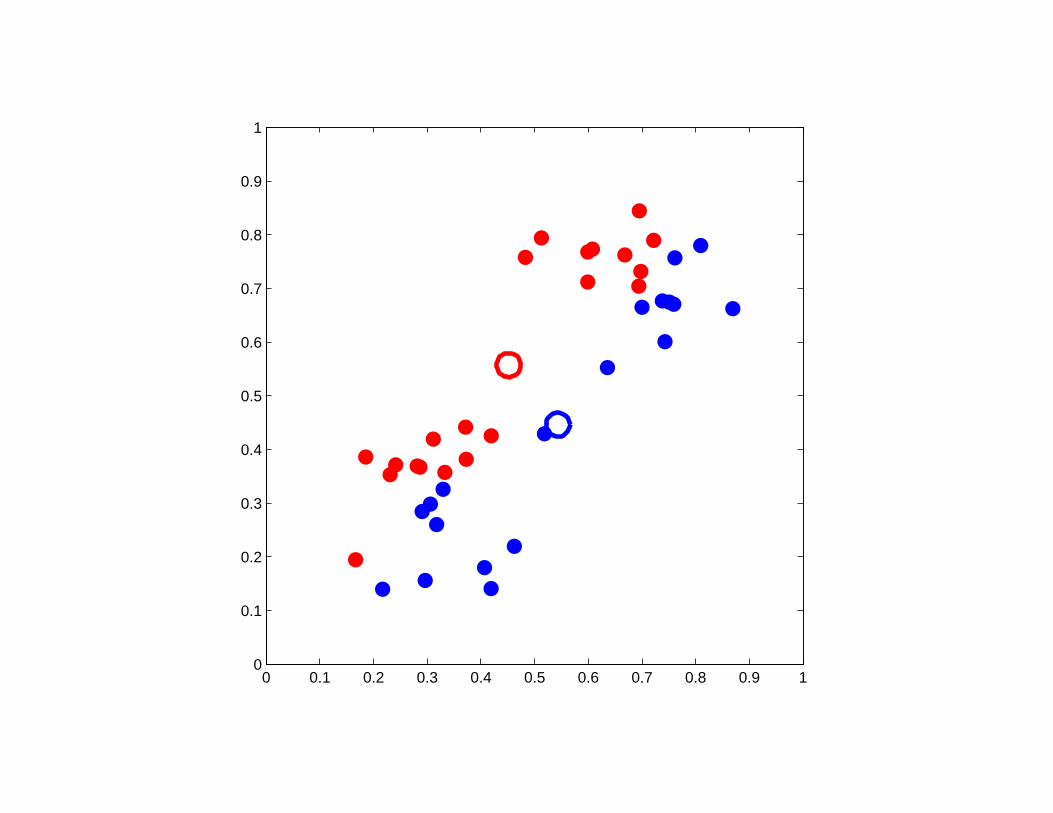
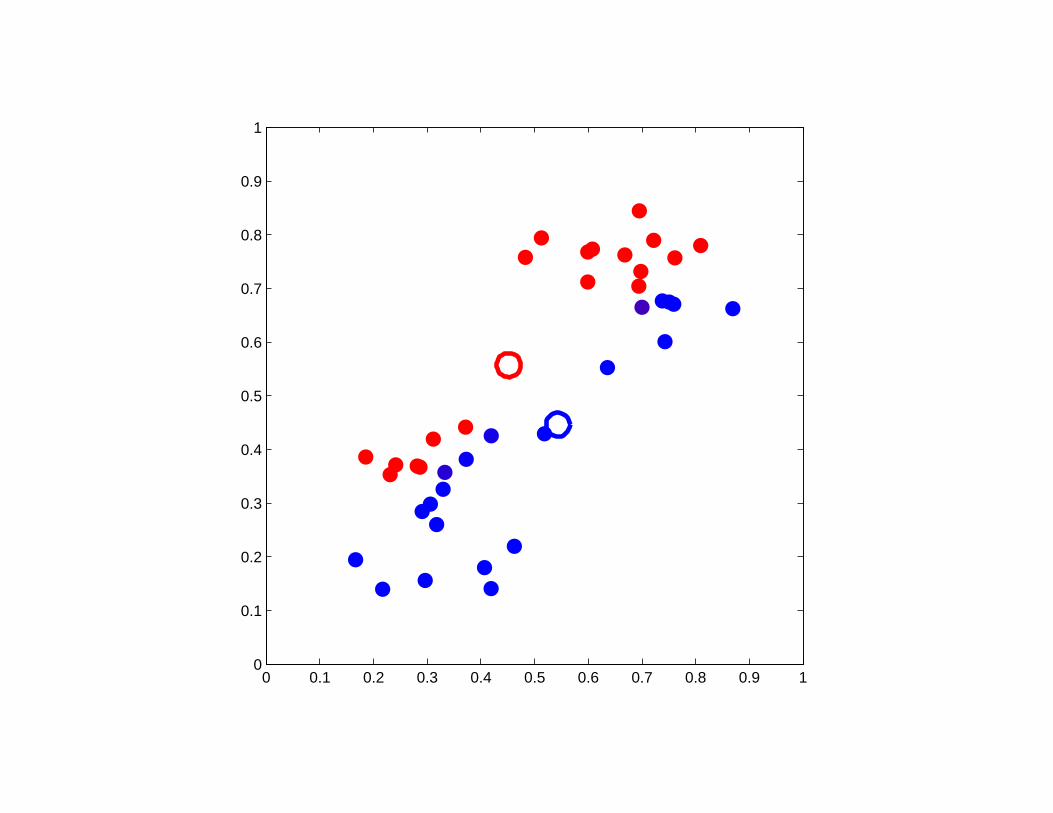
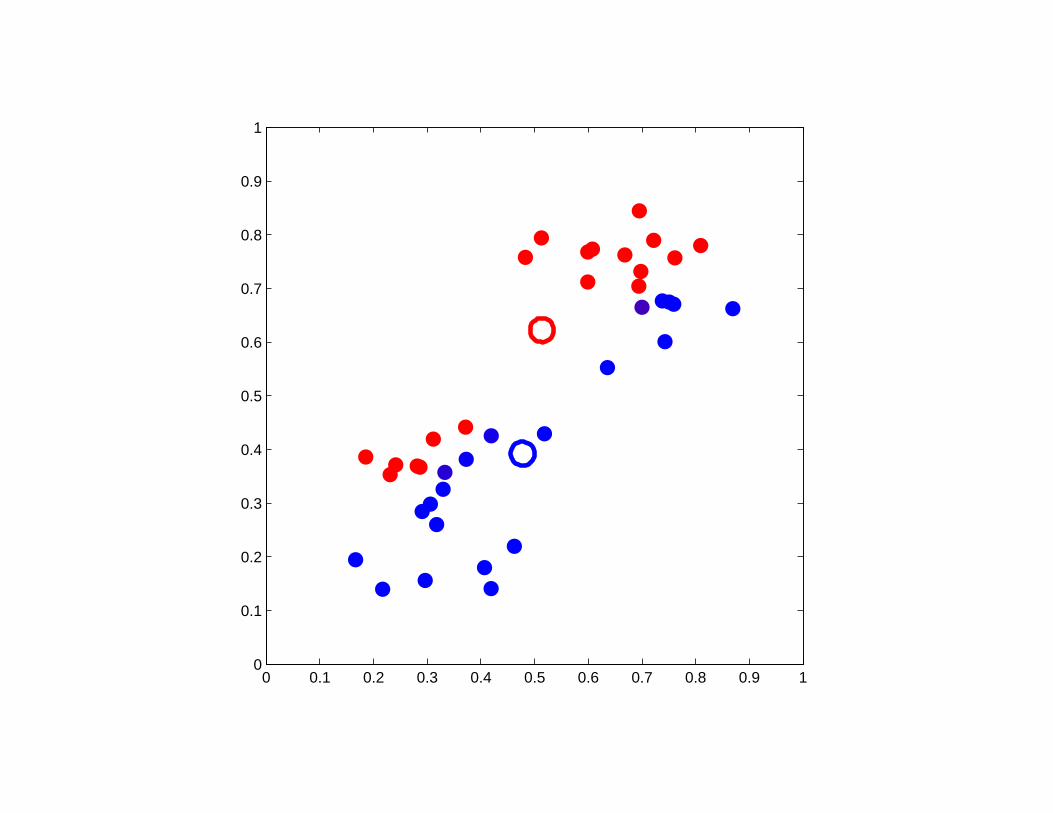
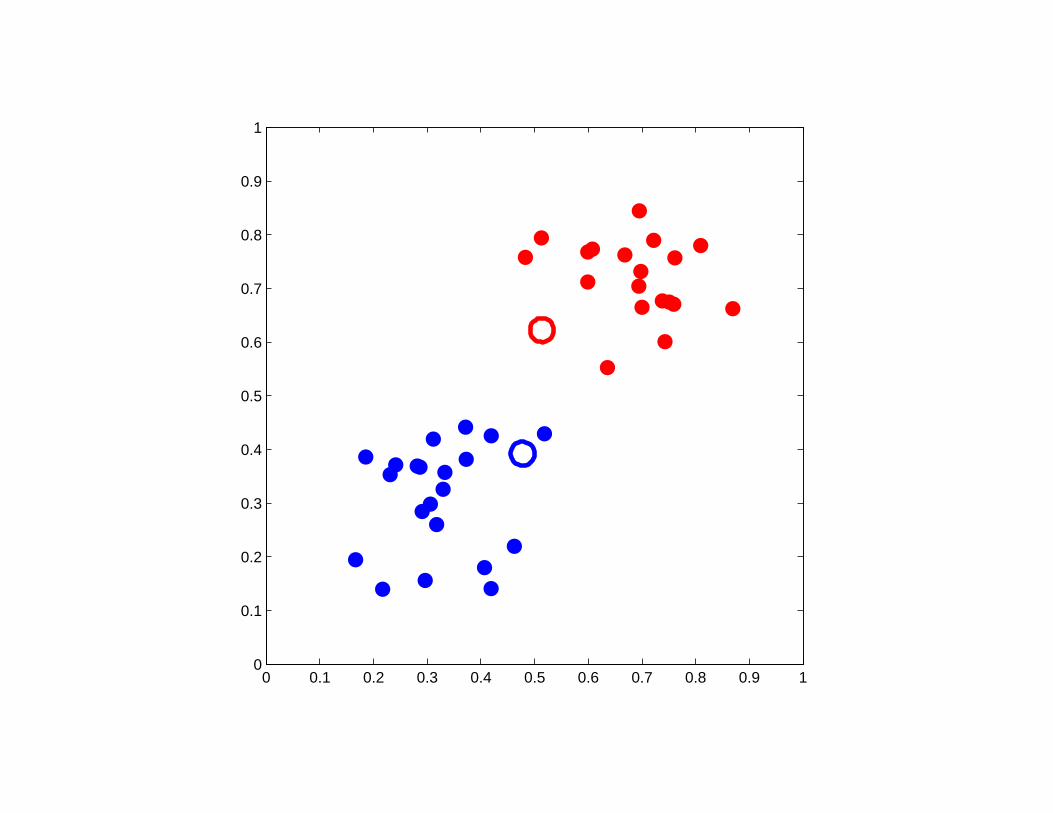
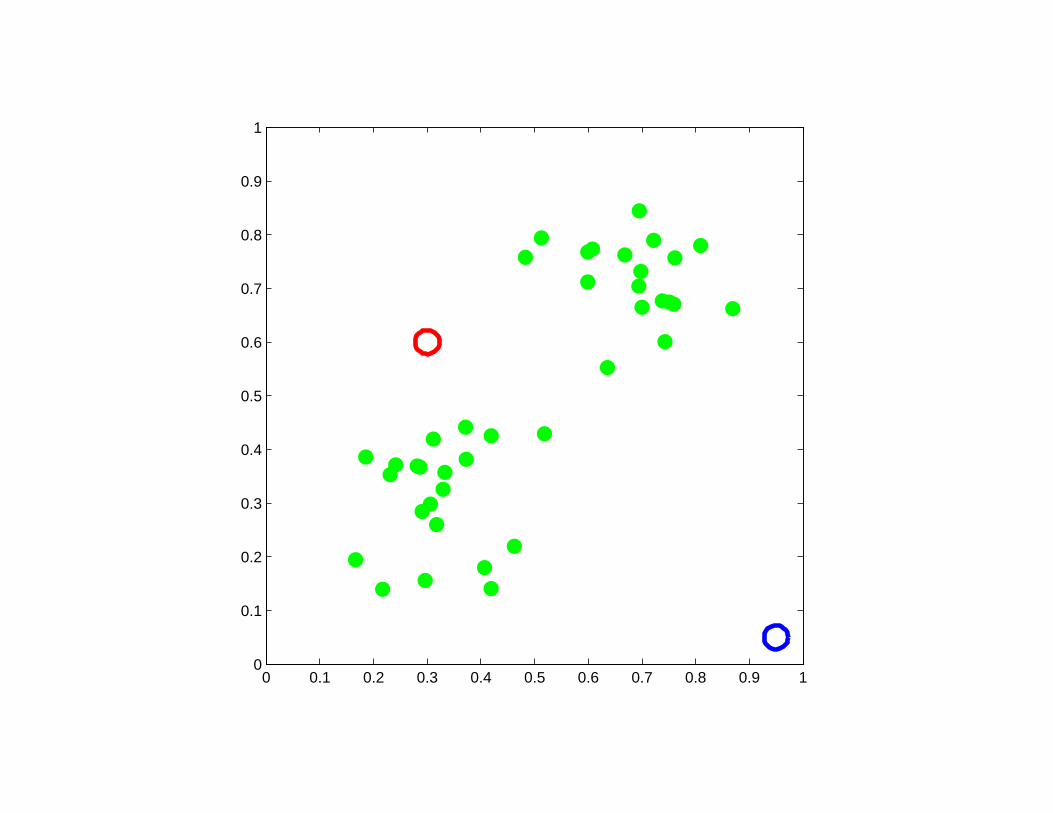
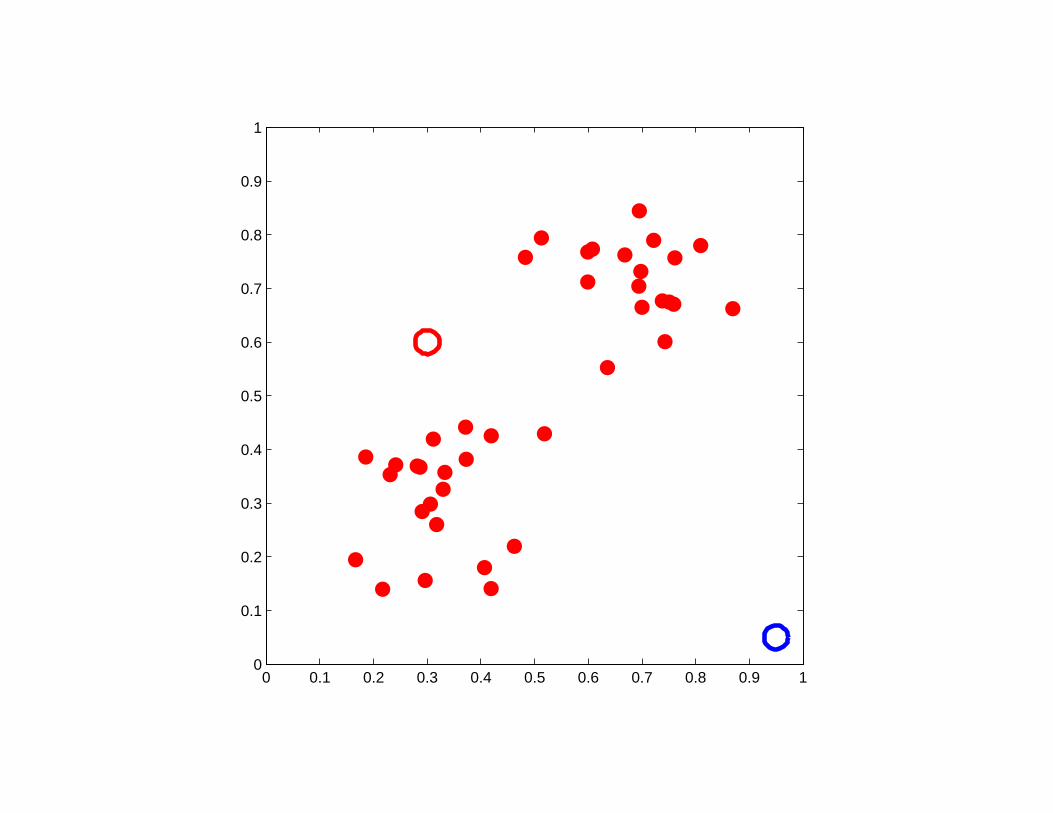
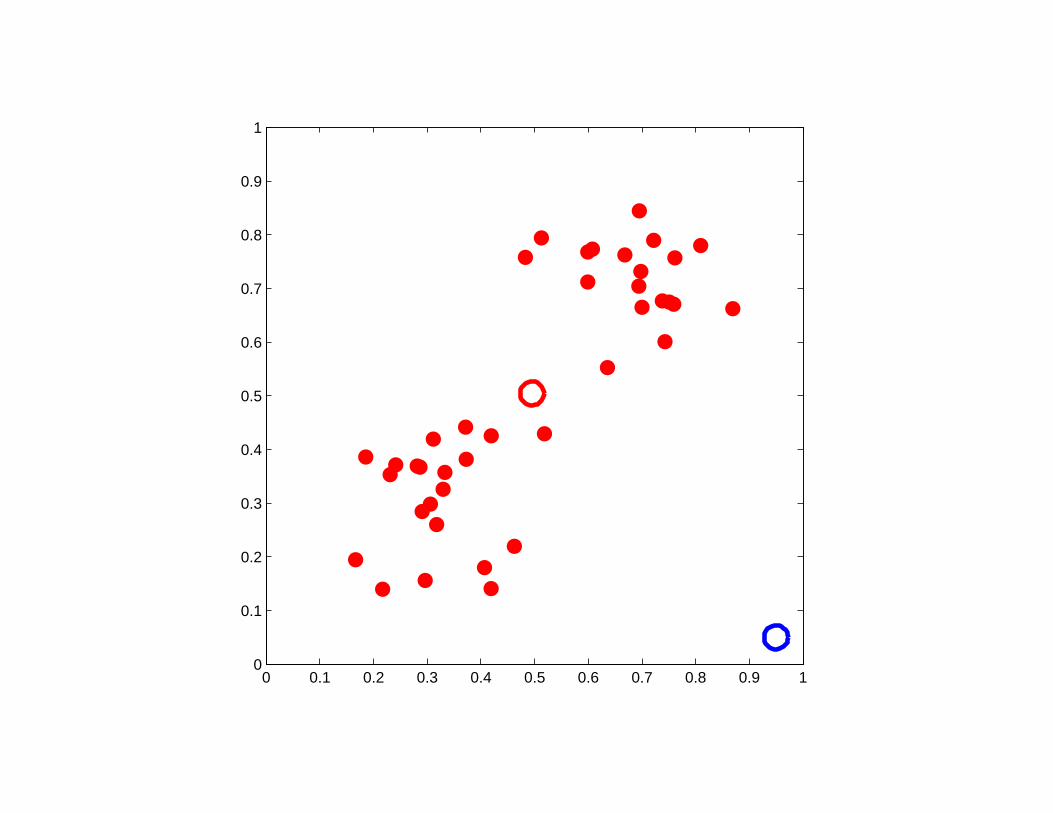
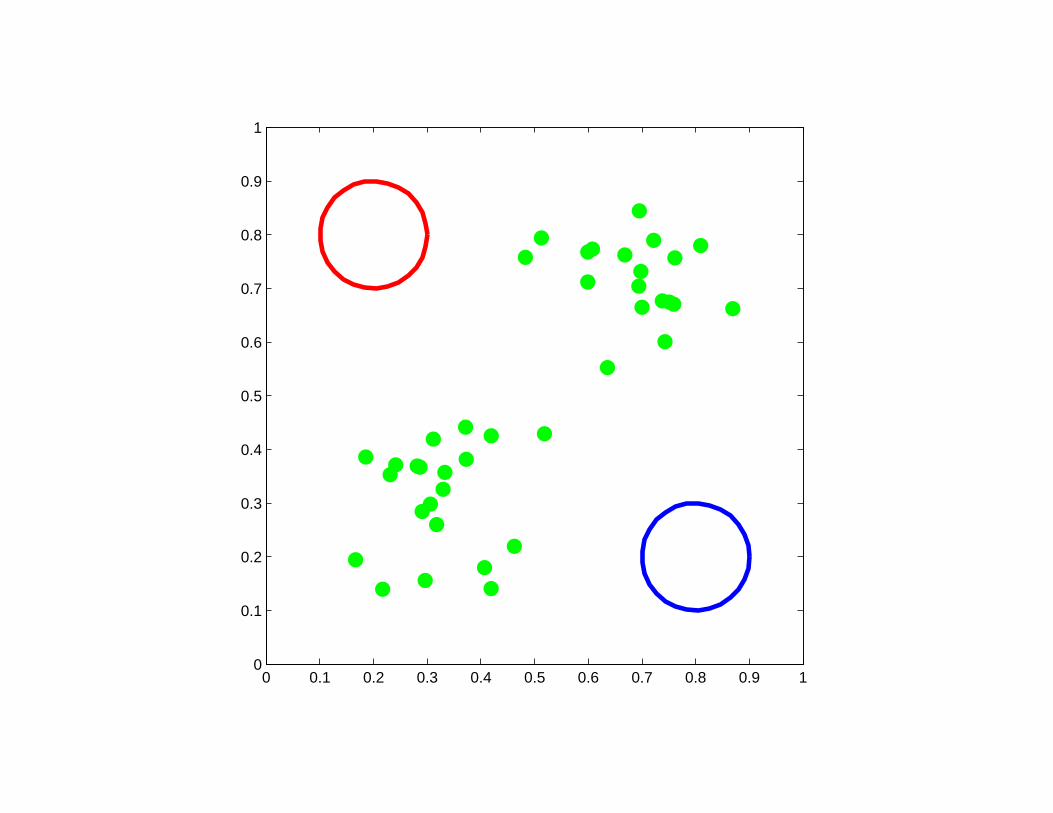
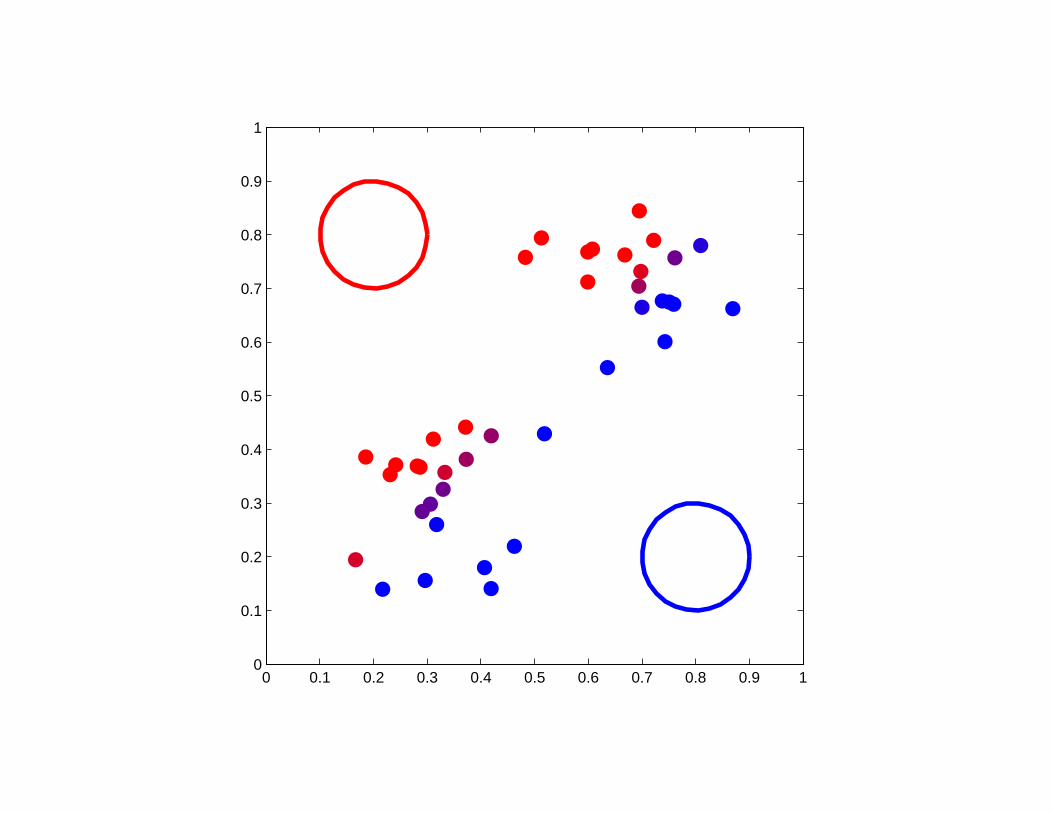
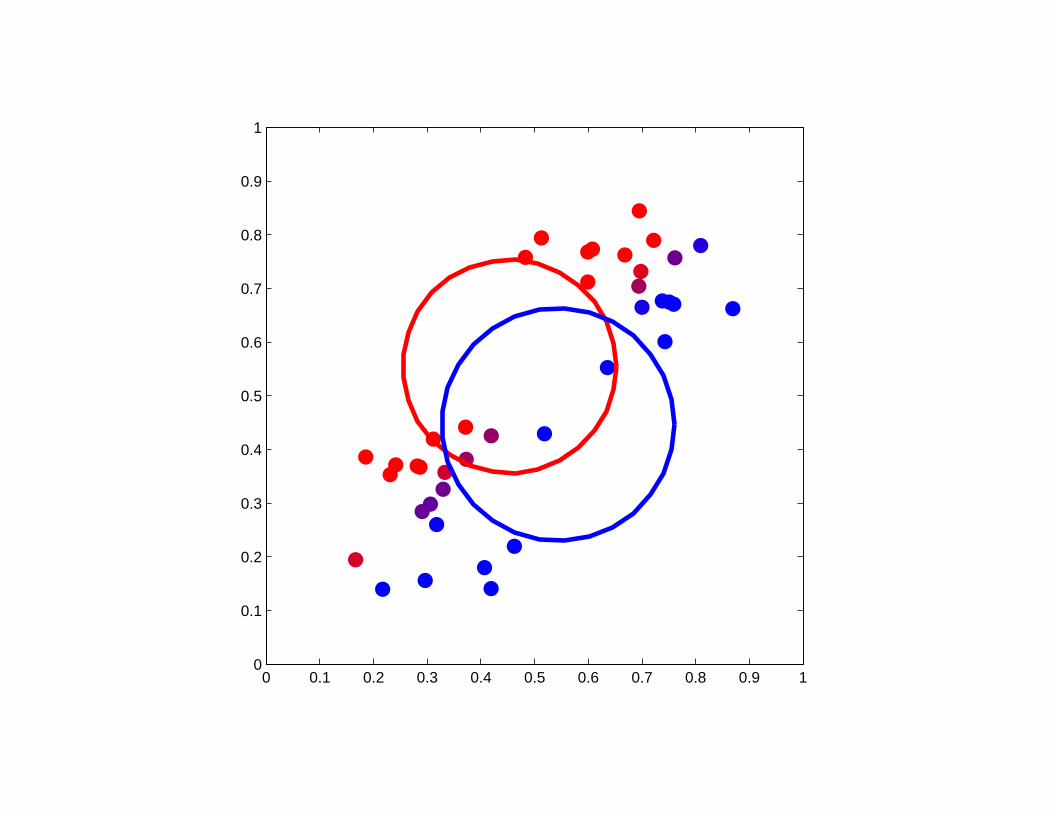
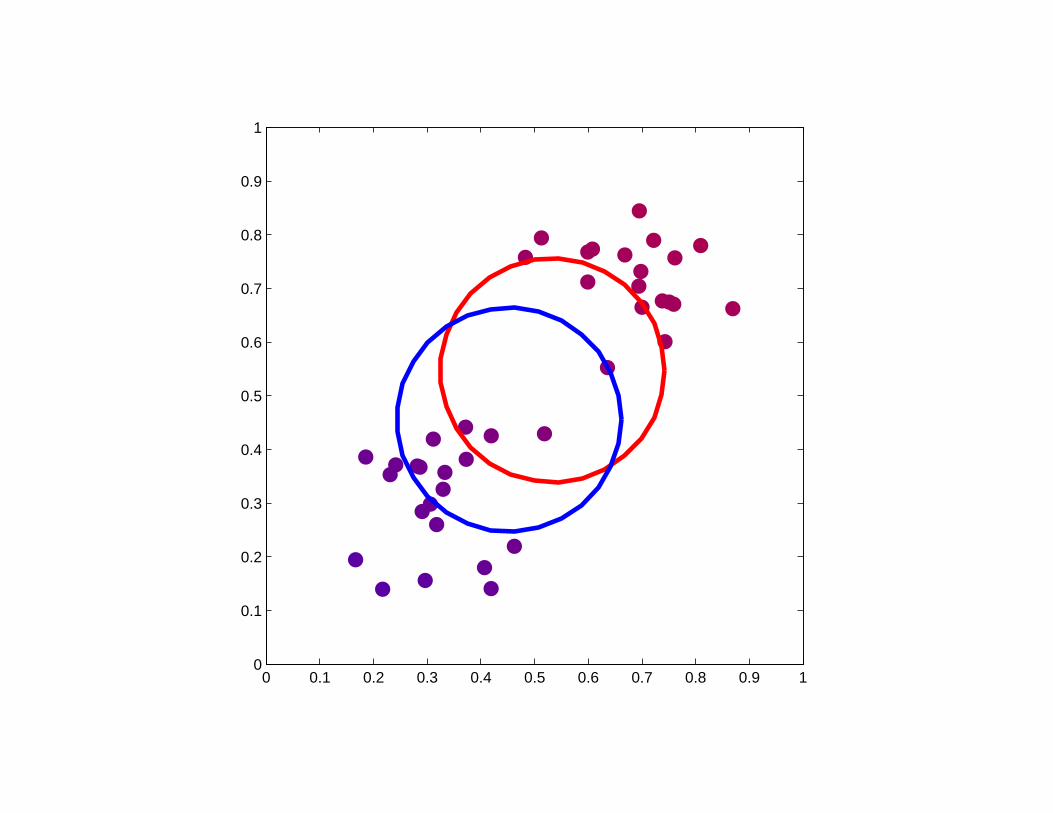
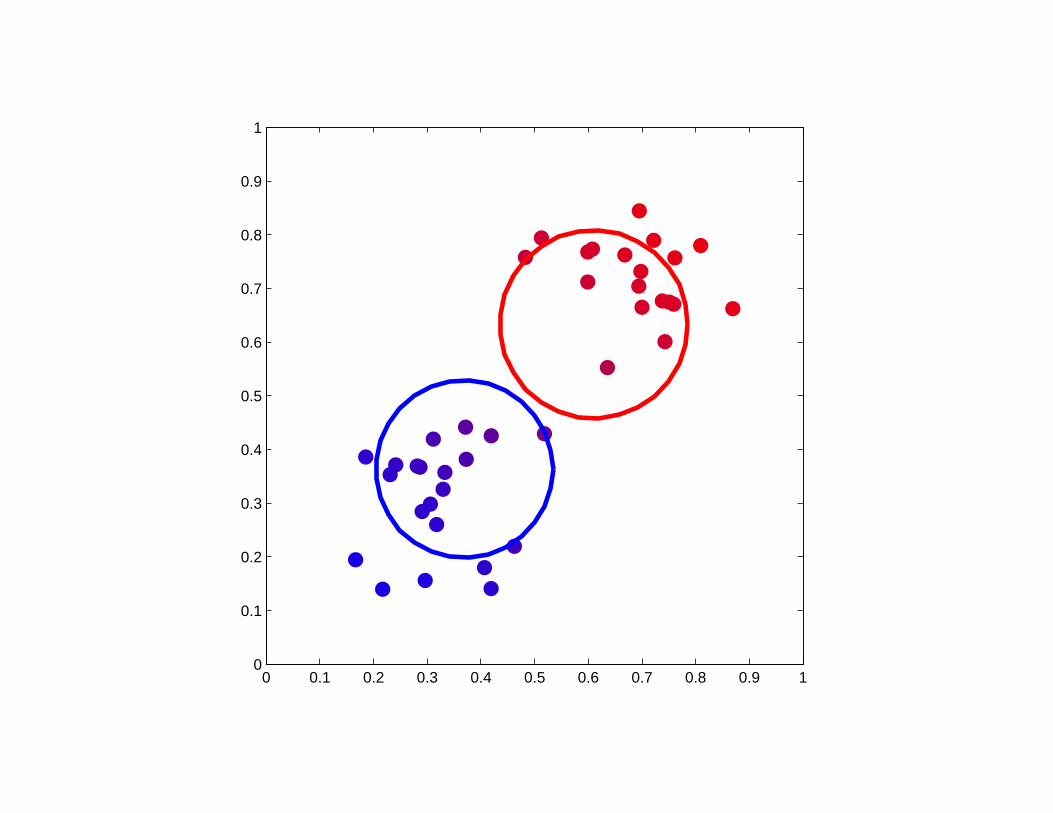
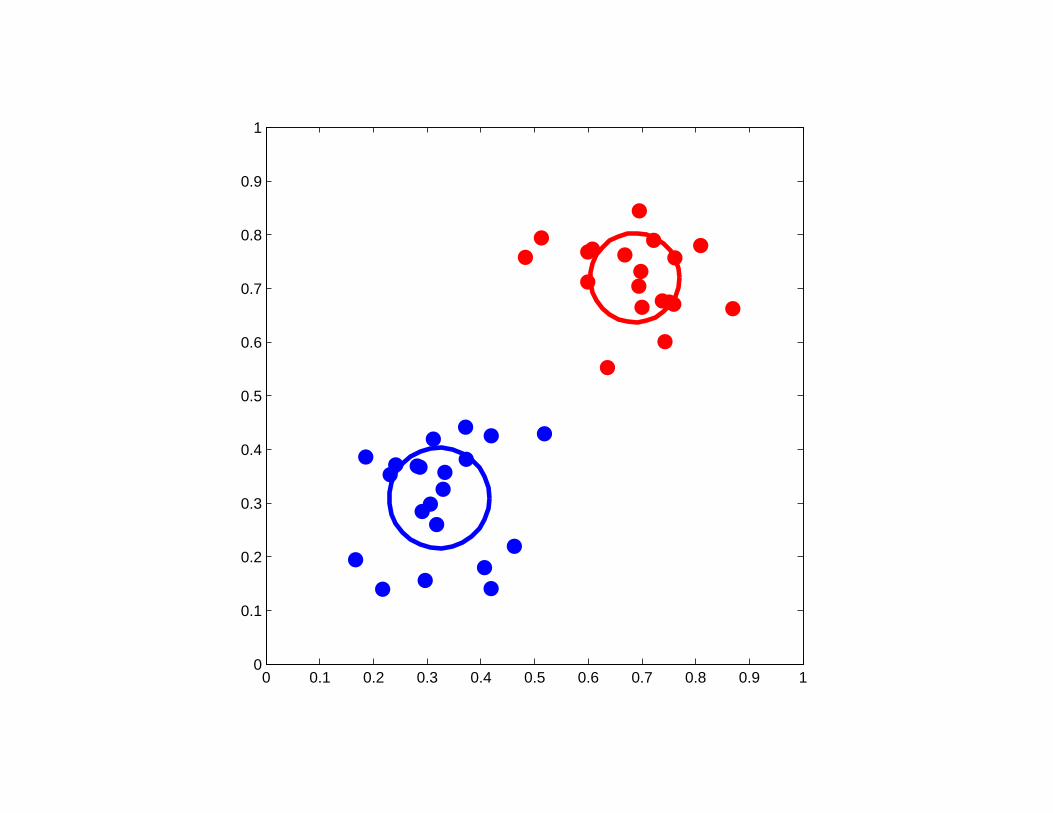
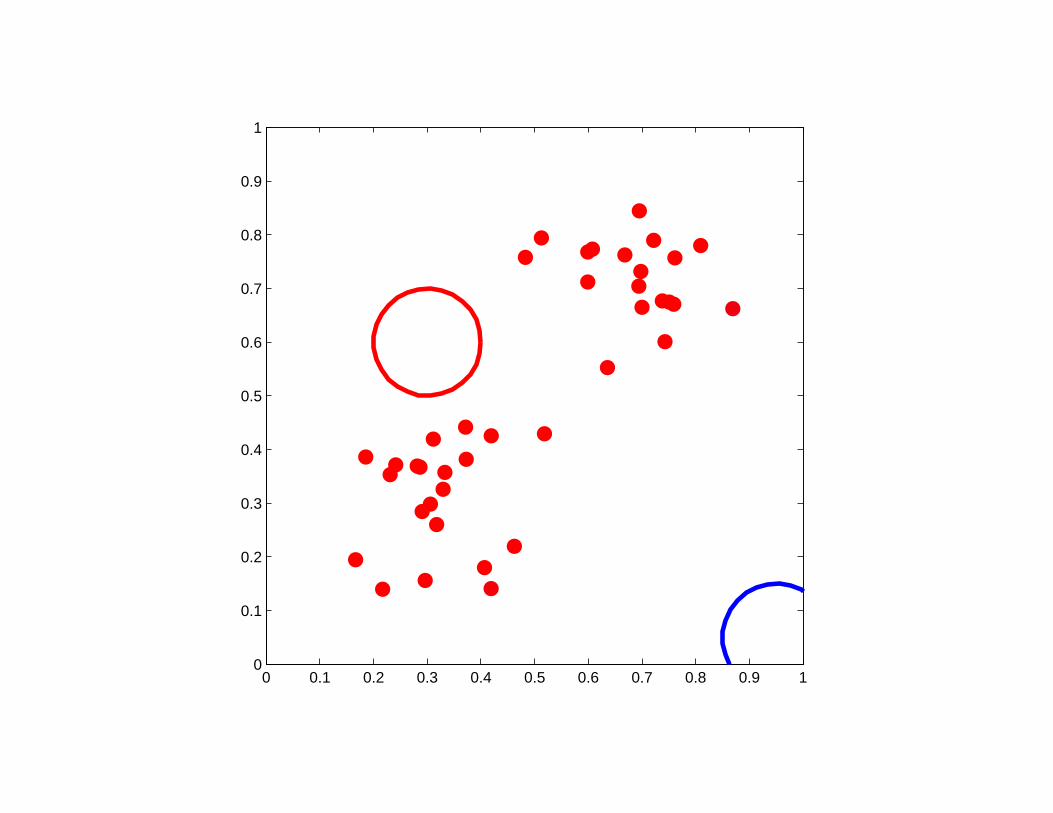
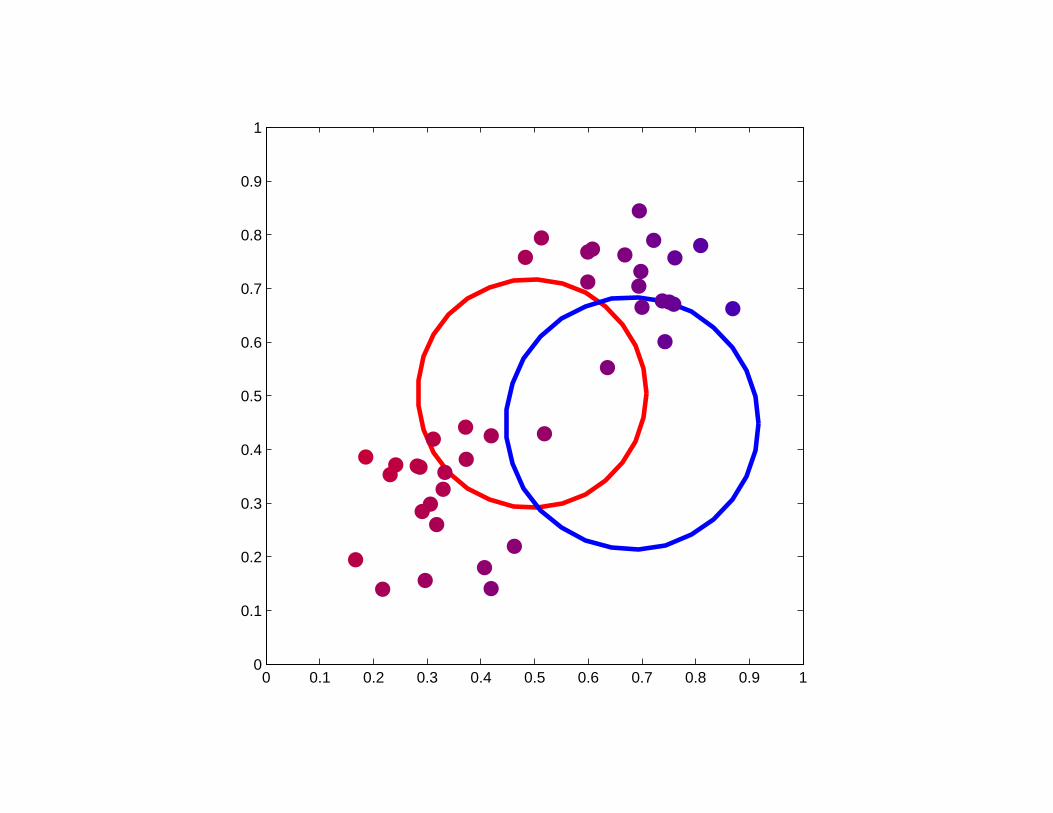
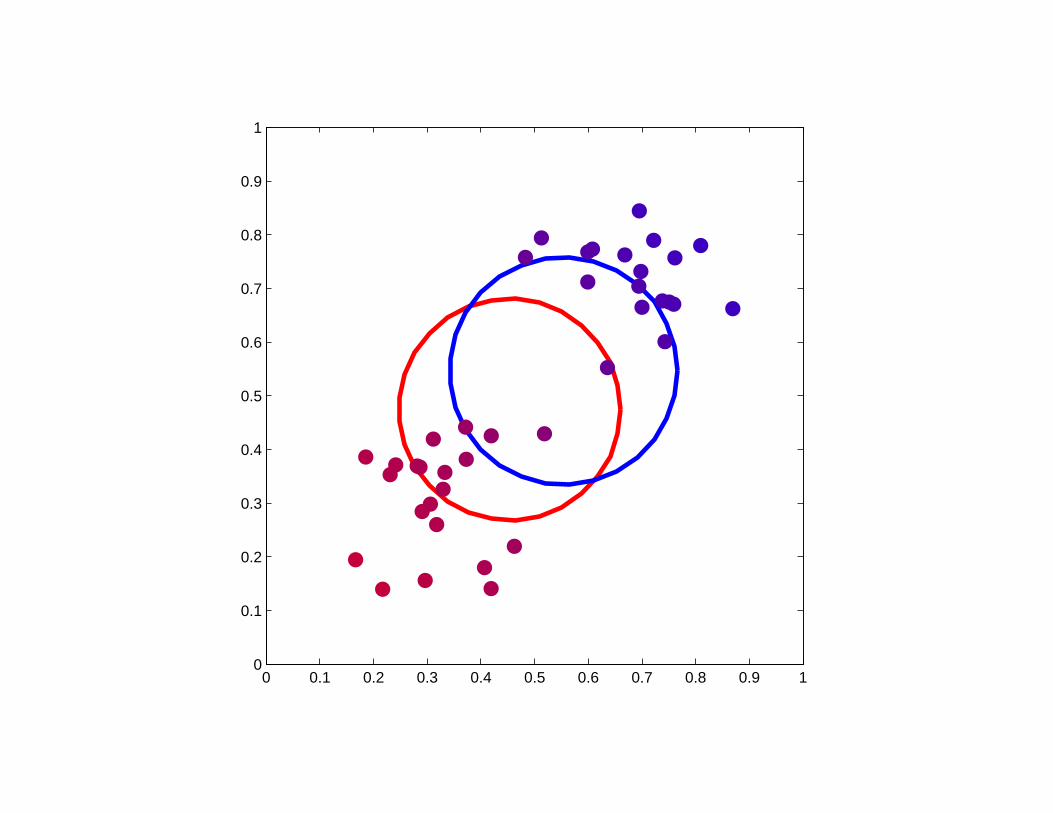
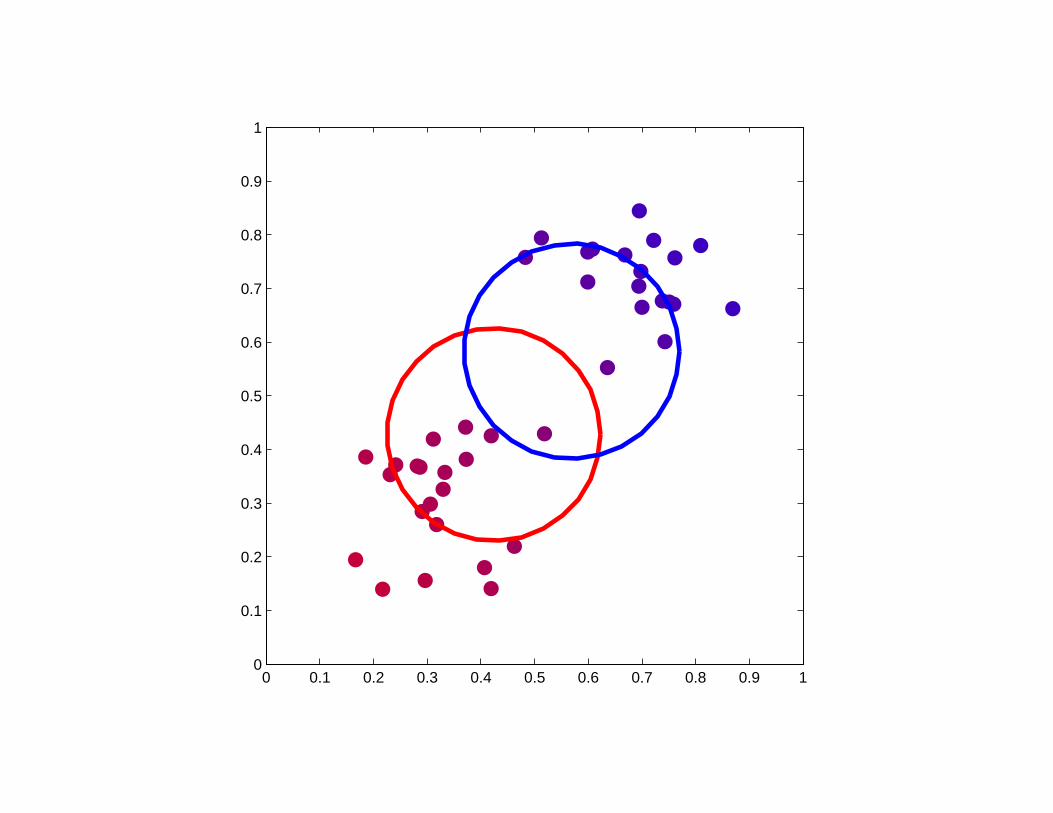
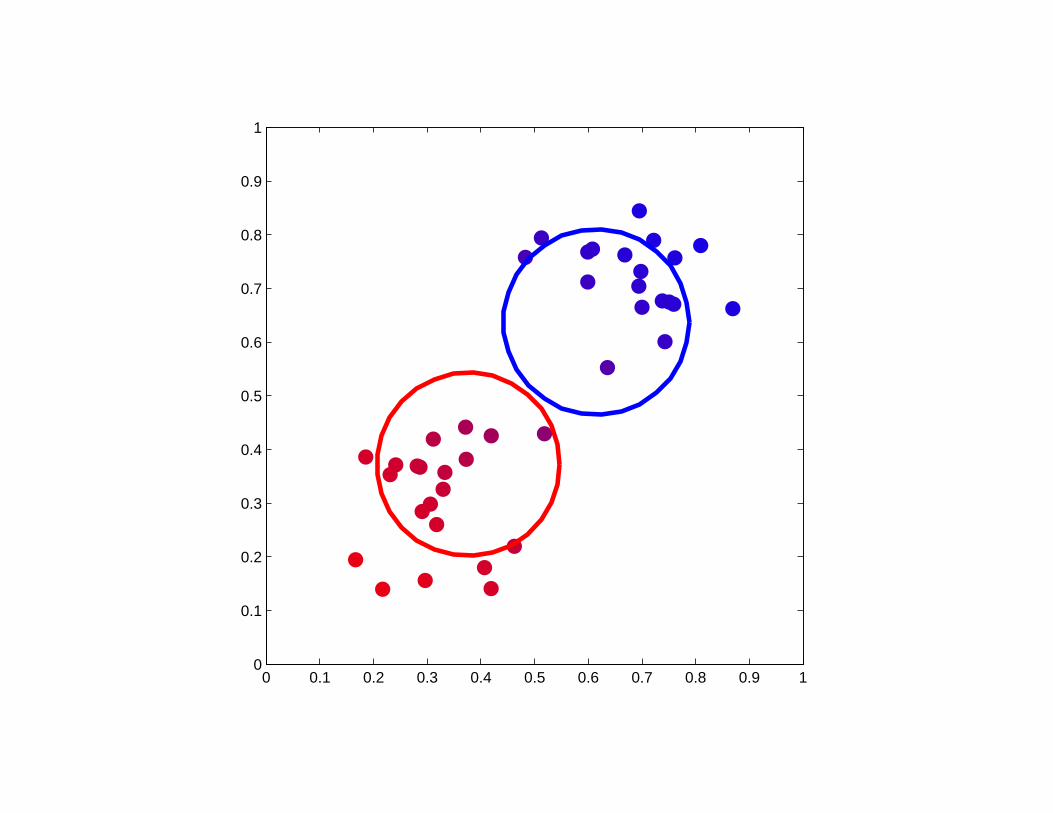
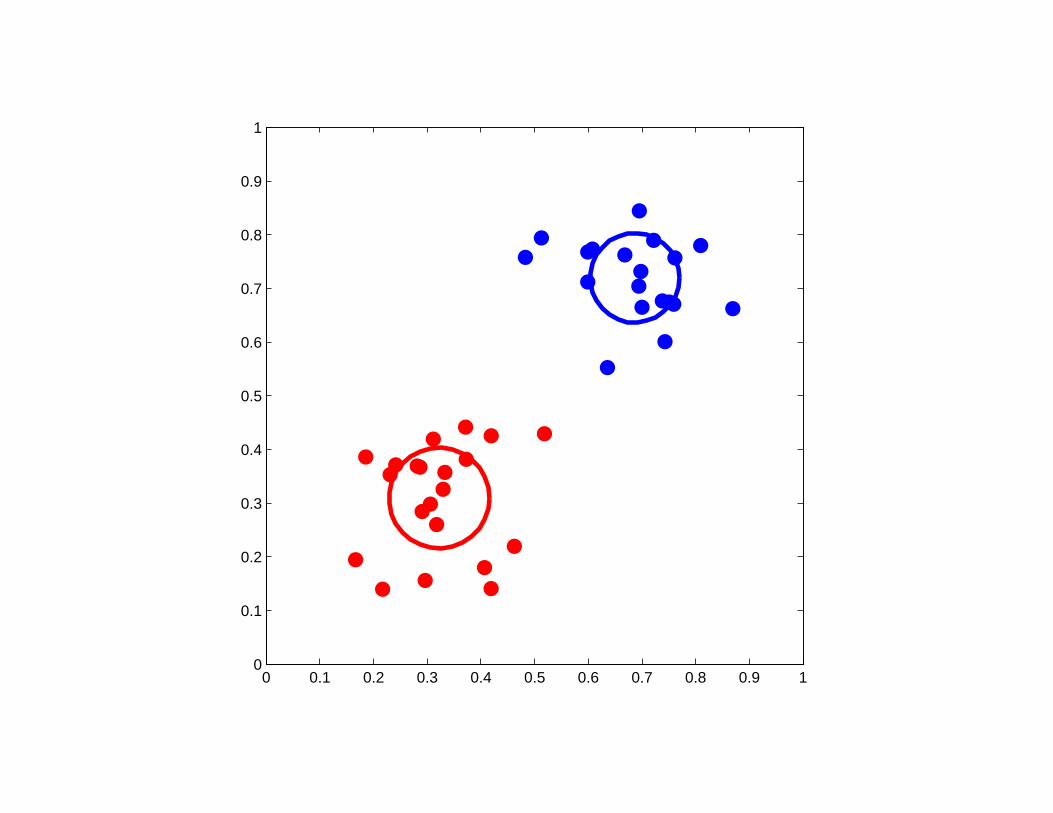
Two examples of soft K-means clustering
The posterior probability for a given data point is indicated by a colour
scale ranging from pure red (corresponding to a posterior probability
of 1.0 for the red component and 0.0 for the blue component) through
to pure blue.
0 0.1 0.2 0.3 0.4 0.5 0.6 0.7 0.8 0.9 10
0.1
0.2
0.3
0.4
0.5
0.6
0.7
0.8
0.9
1
0 0.1 0.2 0.3 0.4 0.5 0.6 0.7 0.8 0.9 10
0.1
0.2
0.3
0.4
0.5
0.6
0.7
0.8
0.9
1
0 0.1 0.2 0.3 0.4 0.5 0.6 0.7 0.8 0.9 10
0.1
0.2
0.3
0.4
0.5
0.6
0.7
0.8
0.9
1
0 0.1 0.2 0.3 0.4 0.5 0.6 0.7 0.8 0.9 10
0.1
0.2
0.3
0.4
0.5
0.6
0.7
0.8
0.9
1
0 0.1 0.2 0.3 0.4 0.5 0.6 0.7 0.8 0.9 10
0.1
0.2
0.3
0.4
0.5
0.6
0.7
0.8
0.9
1
0 0.1 0.2 0.3 0.4 0.5 0.6 0.7 0.8 0.9 10
0.1
0.2
0.3
0.4
0.5
0.6
0.7
0.8
0.9
1
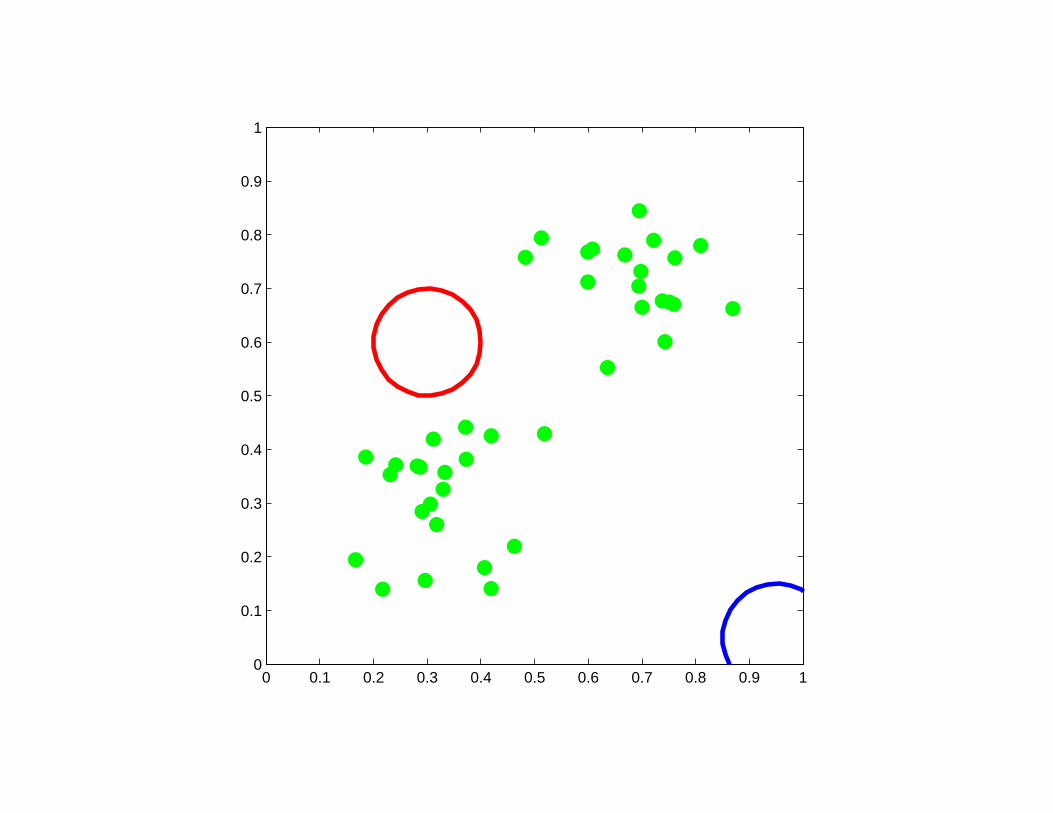
Initialization for which K-means failed
0 0.1 0.2 0.3 0.4 0.5 0.6 0.7 0.8 0.9 10
0.1
0.2
0.3
0.4
0.5
0.6
0.7
0.8
0.9
1
0 0.1 0.2 0.3 0.4 0.5 0.6 0.7 0.8 0.9 10
0.1
0.2
0.3
0.4
0.5
0.6
0.7
0.8
0.9
1
0 0.1 0.2 0.3 0.4 0.5 0.6 0.7 0.8 0.9 10
0.1
0.2
0.3
0.4
0.5
0.6
0.7
0.8
0.9
1
0 0.1 0.2 0.3 0.4 0.5 0.6 0.7 0.8 0.9 10
0.1
0.2
0.3
0.4
0.5
0.6
0.7
0.8
0.9
1
0 0.1 0.2 0.3 0.4 0.5 0.6 0.7 0.8 0.9 10
0.1
0.2
0.3
0.4
0.5
0.6
0.7
0.8
0.9
1
0 0.1 0.2 0.3 0.4 0.5 0.6 0.7 0.8 0.9 10
0.1
0.2
0.3
0.4
0.5
0.6
0.7
0.8
0.9
1
0 0.1 0.2 0.3 0.4 0.5 0.6 0.7 0.8 0.9 10
0.1
0.2
0.3
0.4
0.5
0.6
0.7
0.8
0.9
1
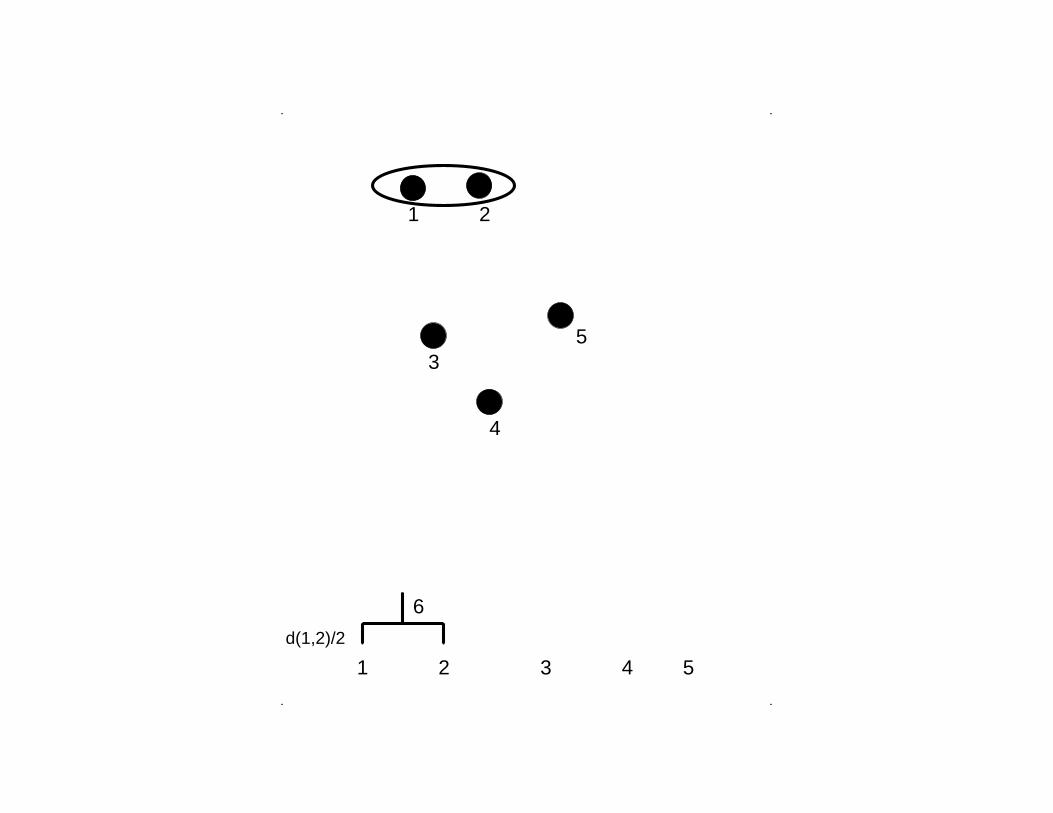
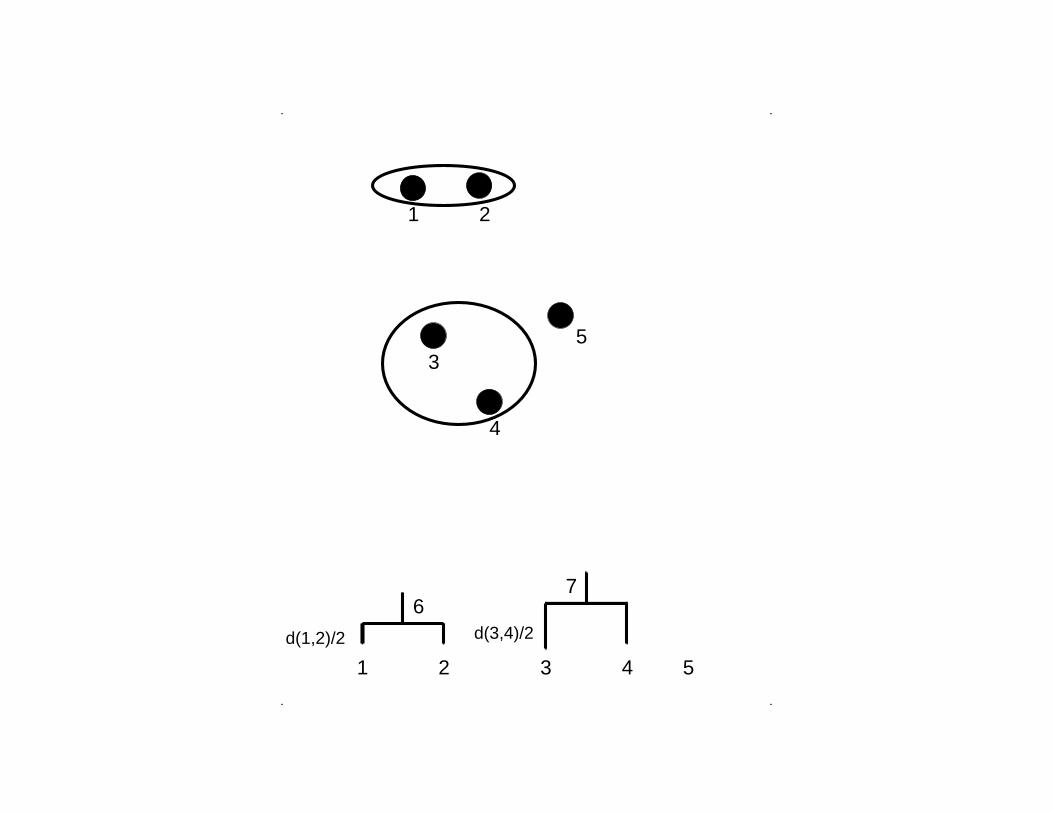
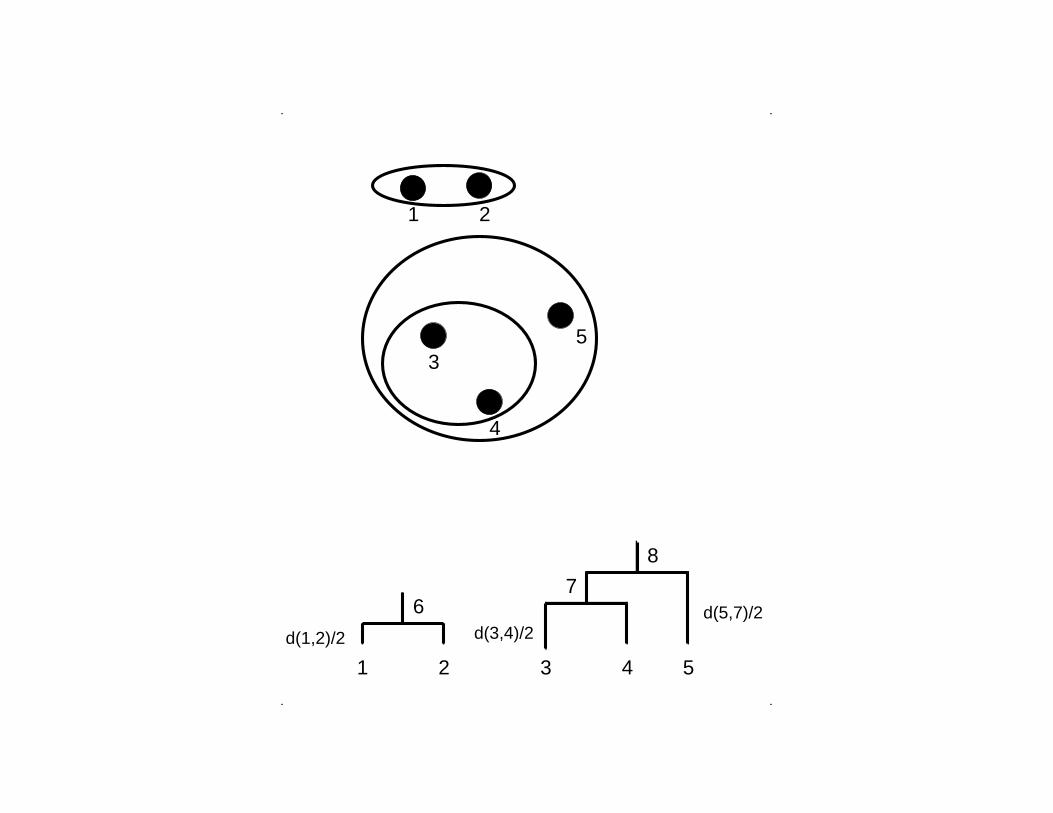
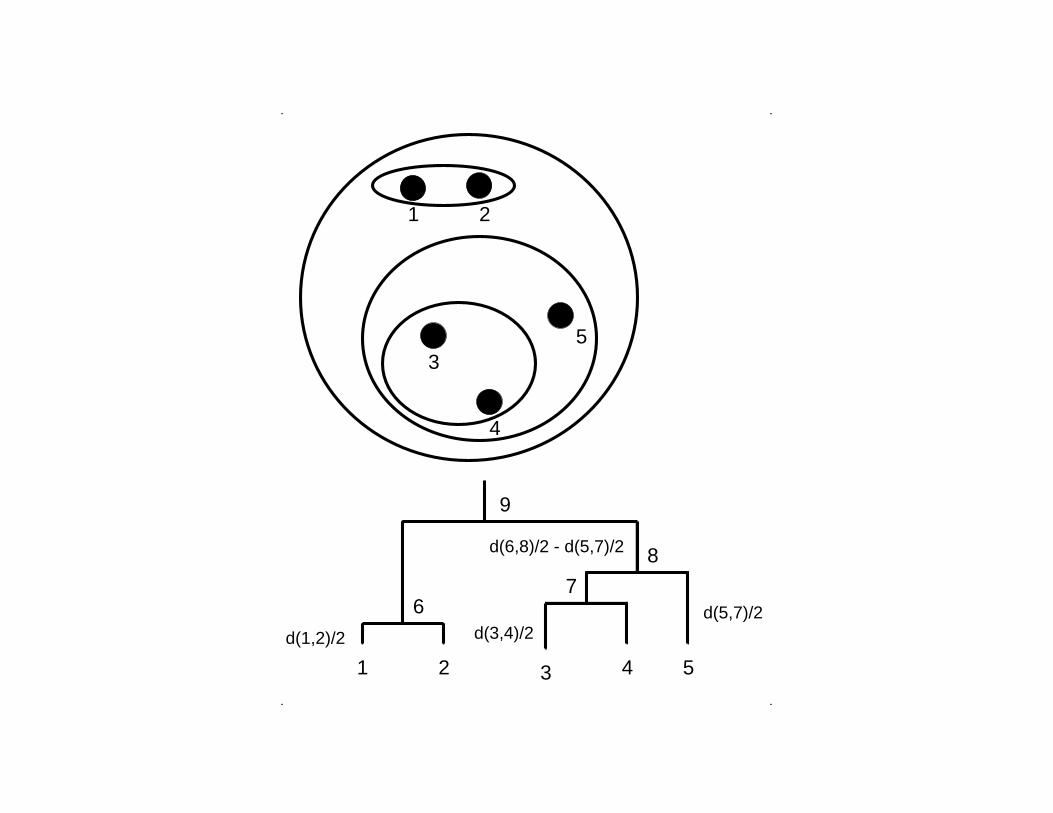
Agglomerative hierarchical clustering:UPGMA
(hierarchical average linkage clustering)
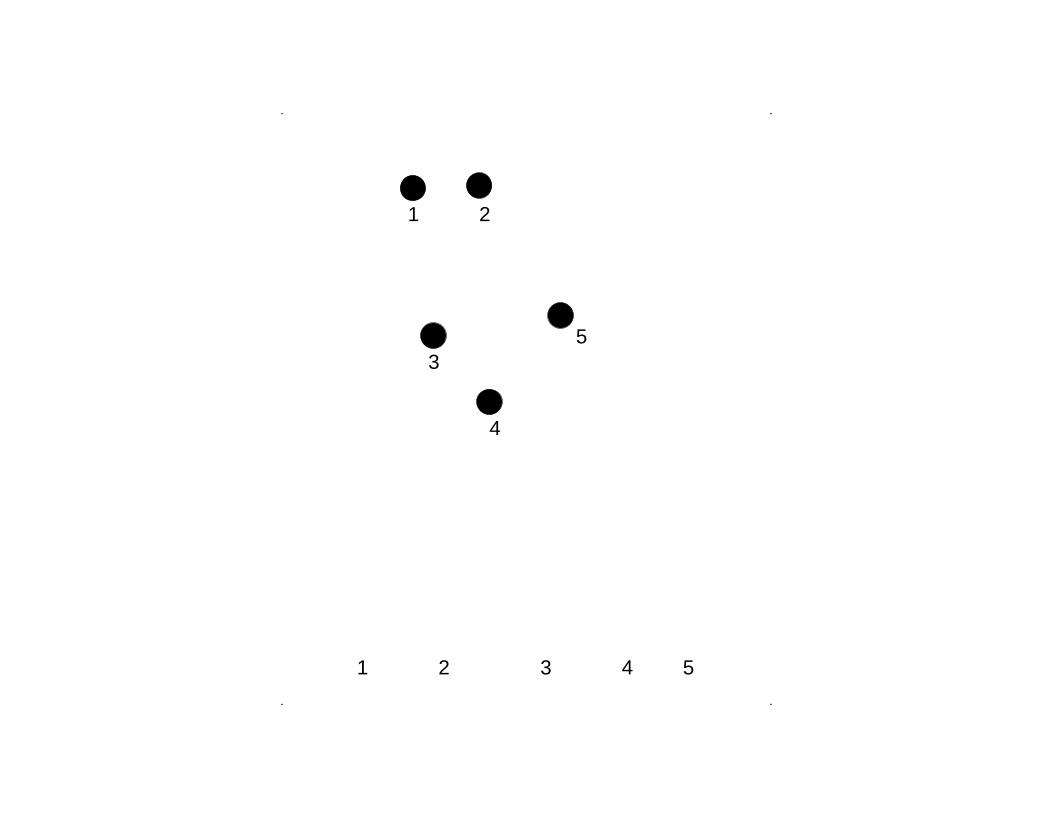
. .
..
5
4
3
3 5421
1 2
. .
..
5
4
3
3
d(1,2)/2
6
541
1 2
2

. .
..
1 2 4 5
67
d(3,4)/2d(1,2)/2
3
3
4
5
21
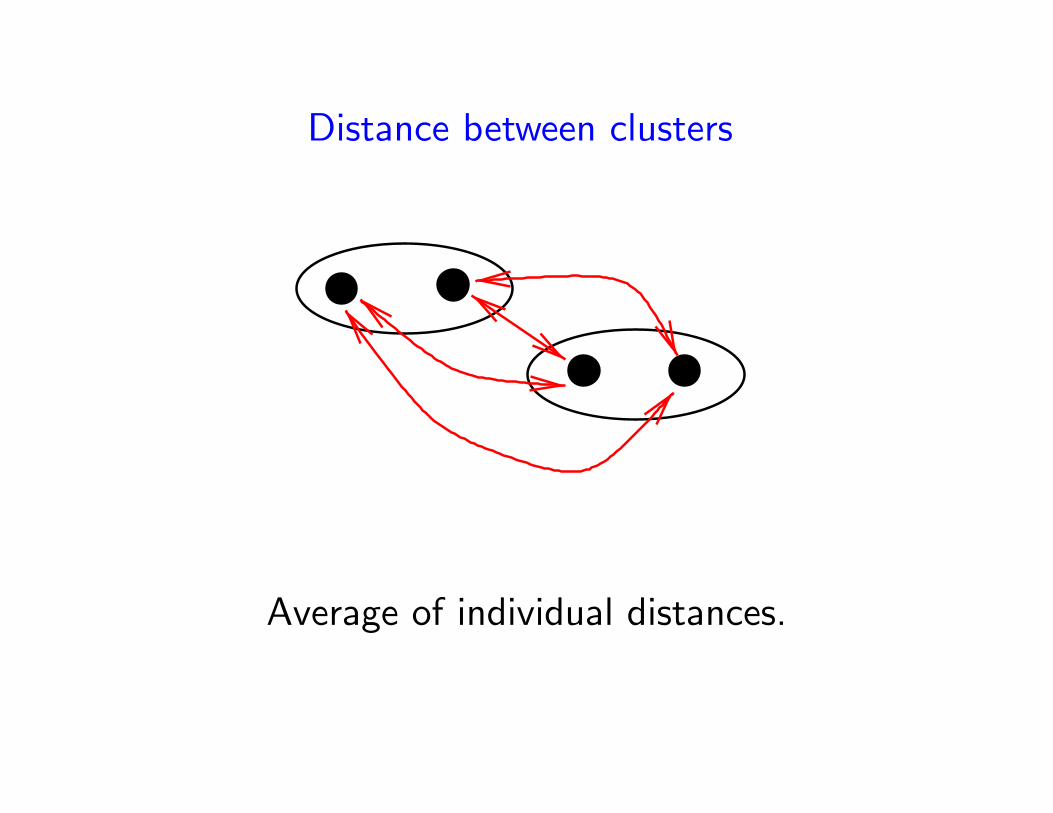
Distance between clusters
Average of individual distances.
. .
..
1 2 4 5
67
d(3,4)/2d(1,2)/2
3
3
4
5
21
. .
..
1 2 4 5
67
d(1,2)/2
8
d(5,7)/2d(3,4)/2
3
3
4
5
21

. .
..
1 2 3 4 5
67
d(5,7)/2
8
9
d(1,2)/2 d(3,4)/2
3
4
5
d(6,8)/2 - d(5,7)/2
21
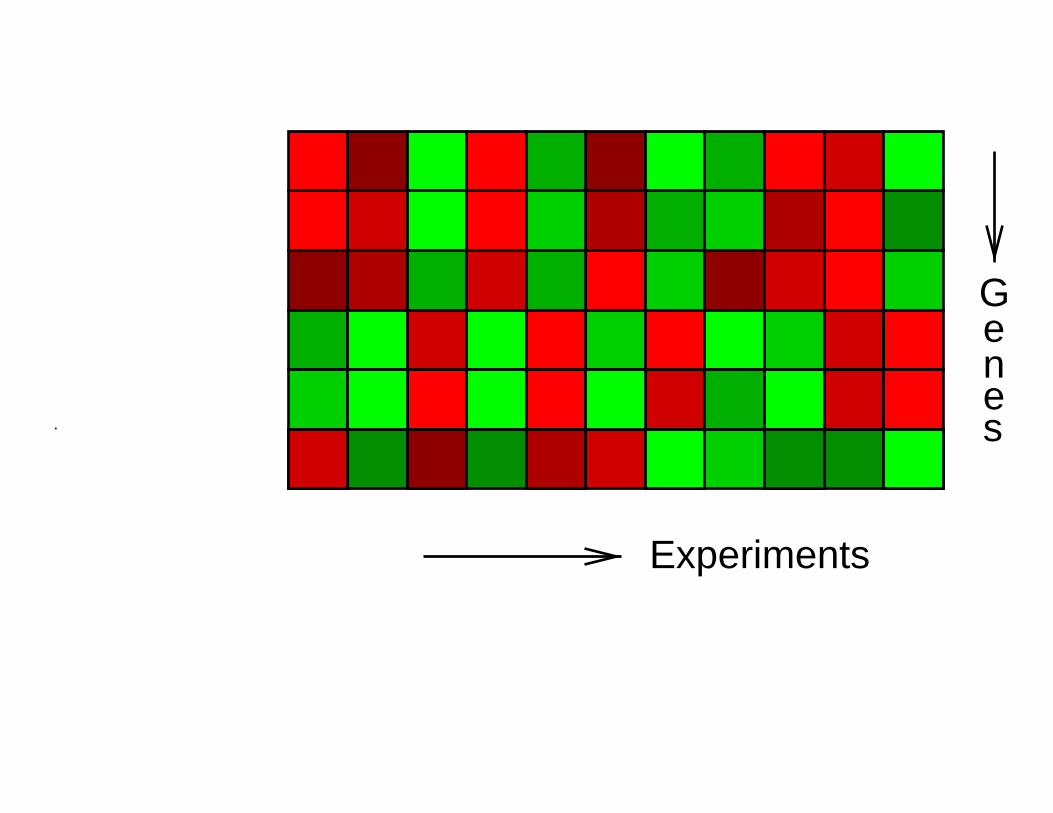
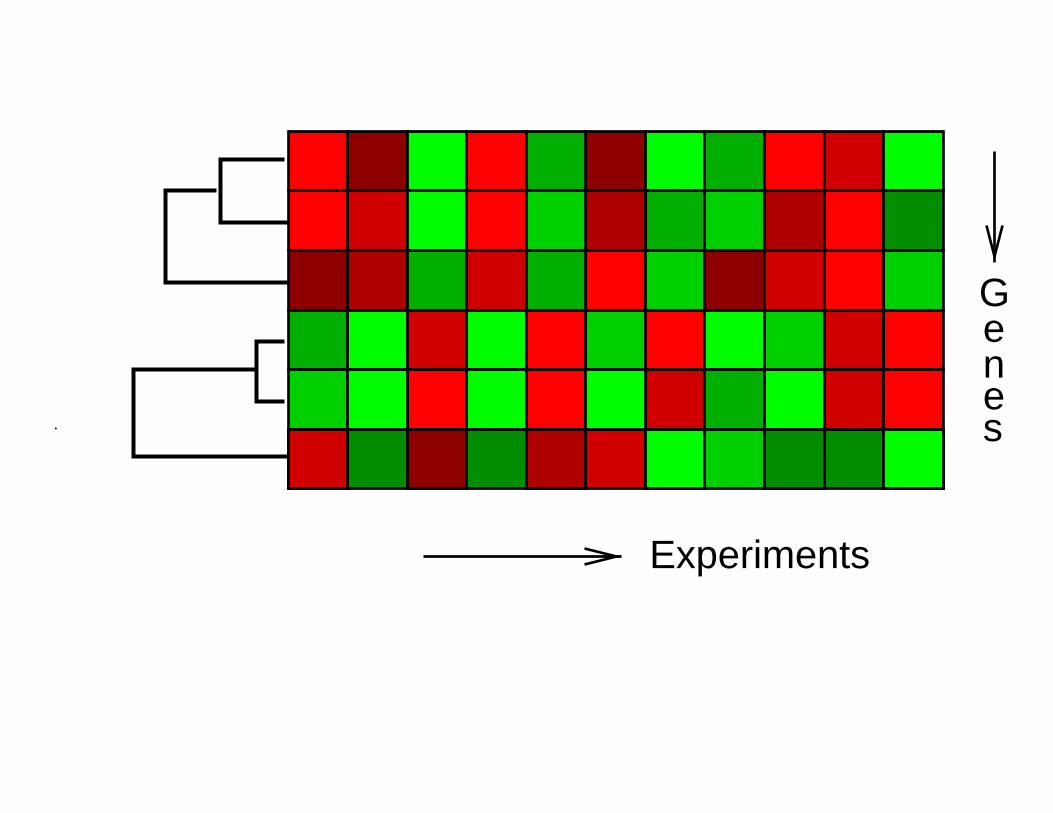
Experiments
Genes.
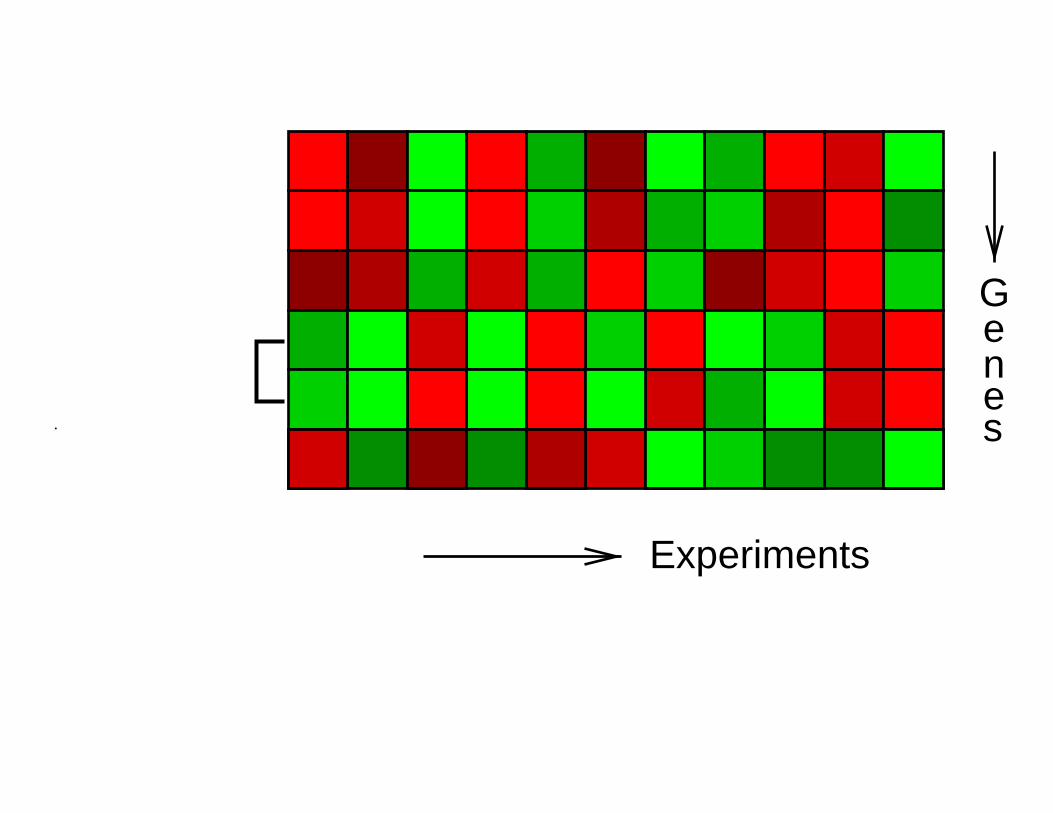
Experiments
Genes.
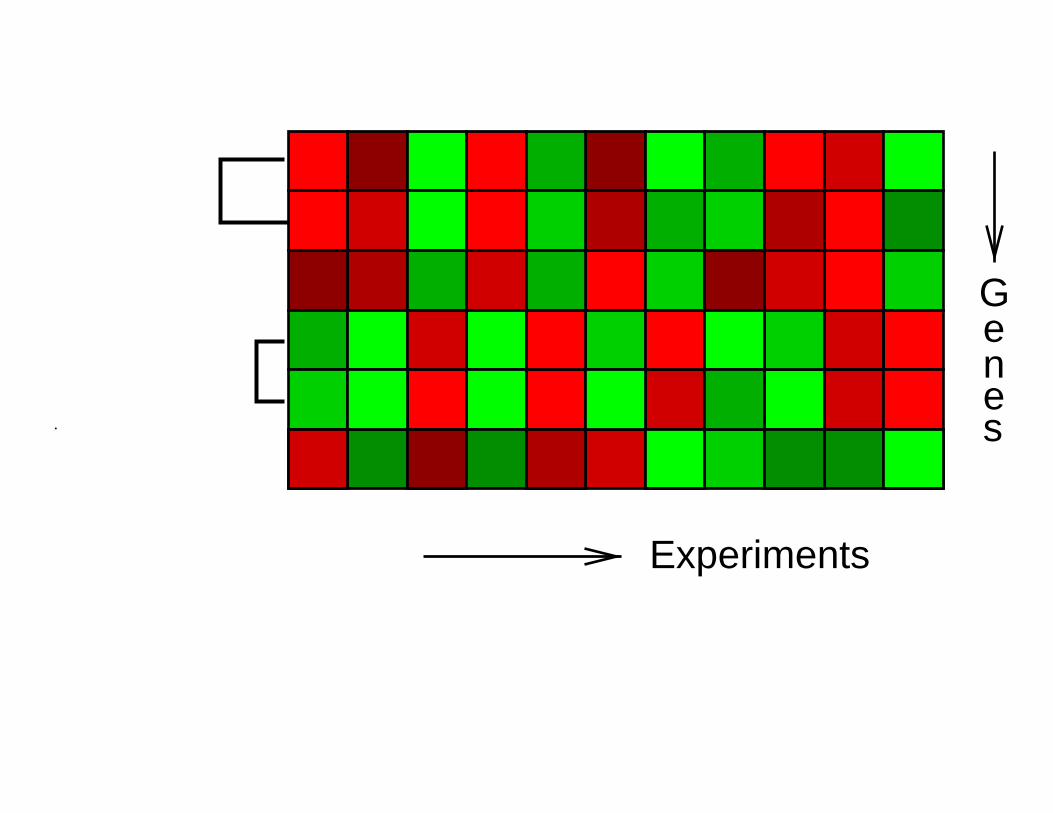
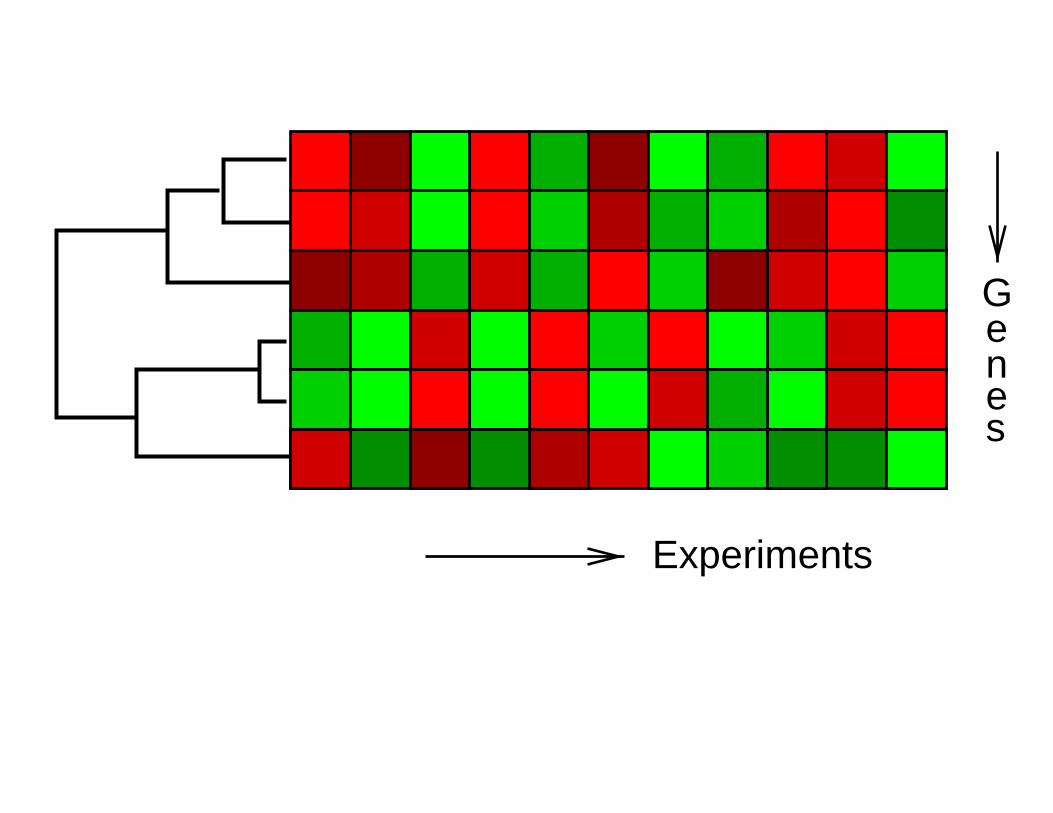
Experiments
Genes.
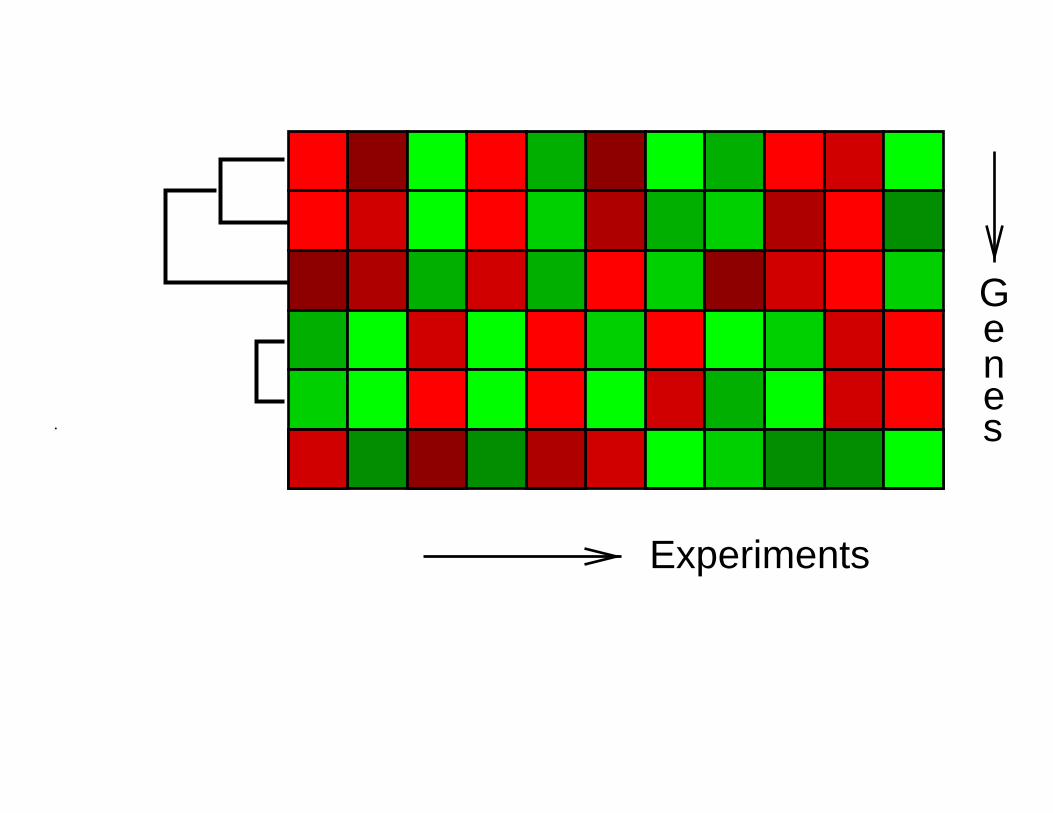
Experiments
Genes.
Experiments
Genes.
Experiments
Genes
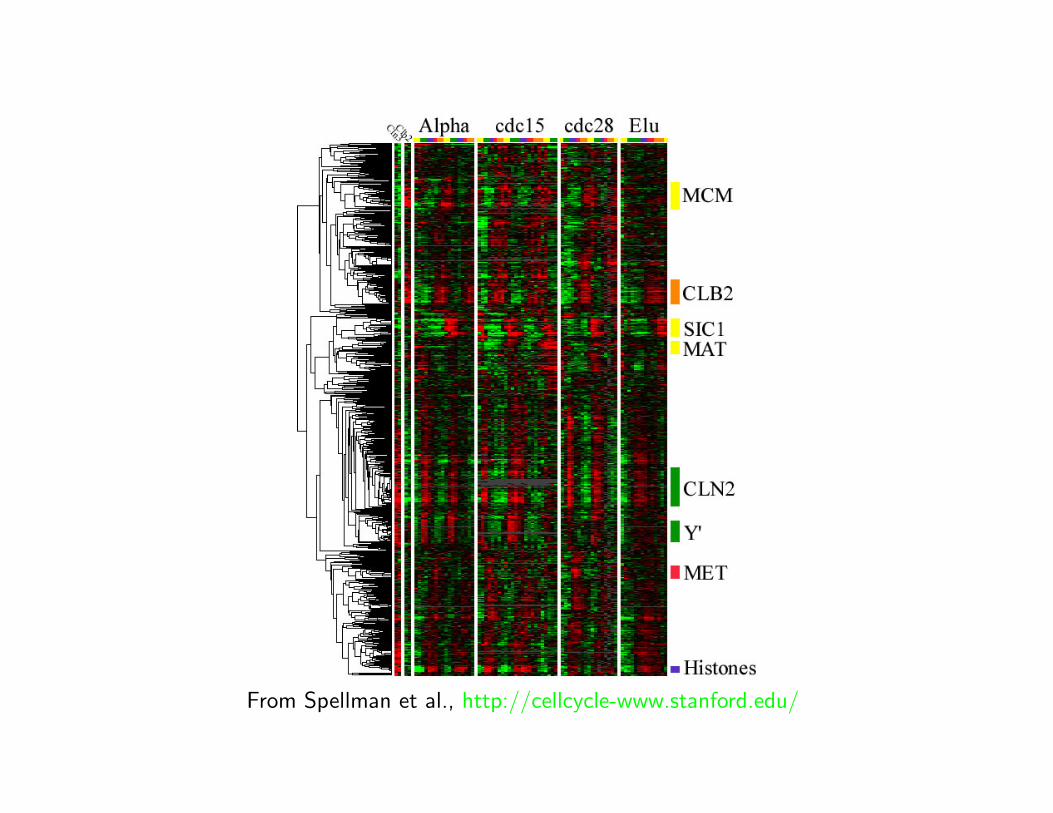
From Spellman et al., http://cellcycle-www.stanford.edu/
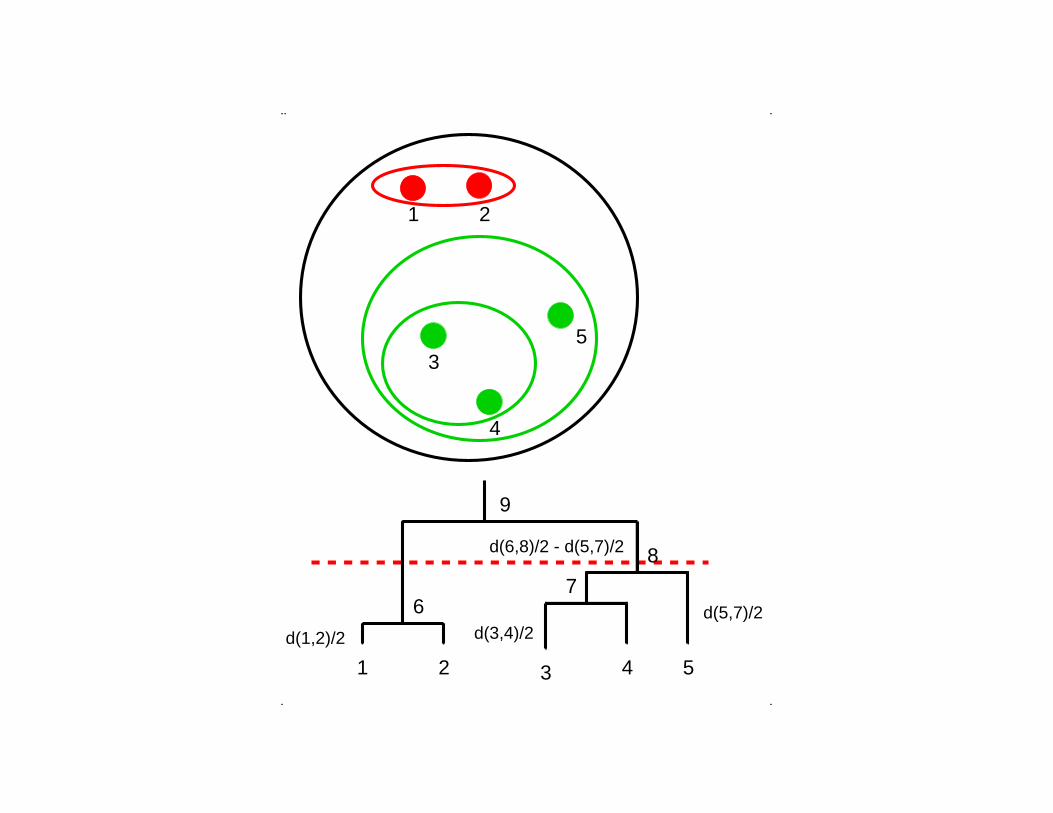
• Hierarchical clustering methods produce a tree or
dendrogram → Allows the biologist to visualize and
interpret the data.
• No need to specify how many clusters are appropriate
−→ partition of the data for each number of clusters
K.
• Partitions are obtained from cutting the tree at different
levels.
. .
..
1 2 3 4 5
67
d(5,7)/2
8
9
d(1,2)/2 d(3,4)/2
3
4
5
d(6,8)/2 - d(5,7)/2
21
. .
...
4 5
67
8
9
d(5,7)/2
d(1,2)/2 d(3,4)/2
3
4
5
d(6,8)/2 - d(5,7)/2
1 2
31 2
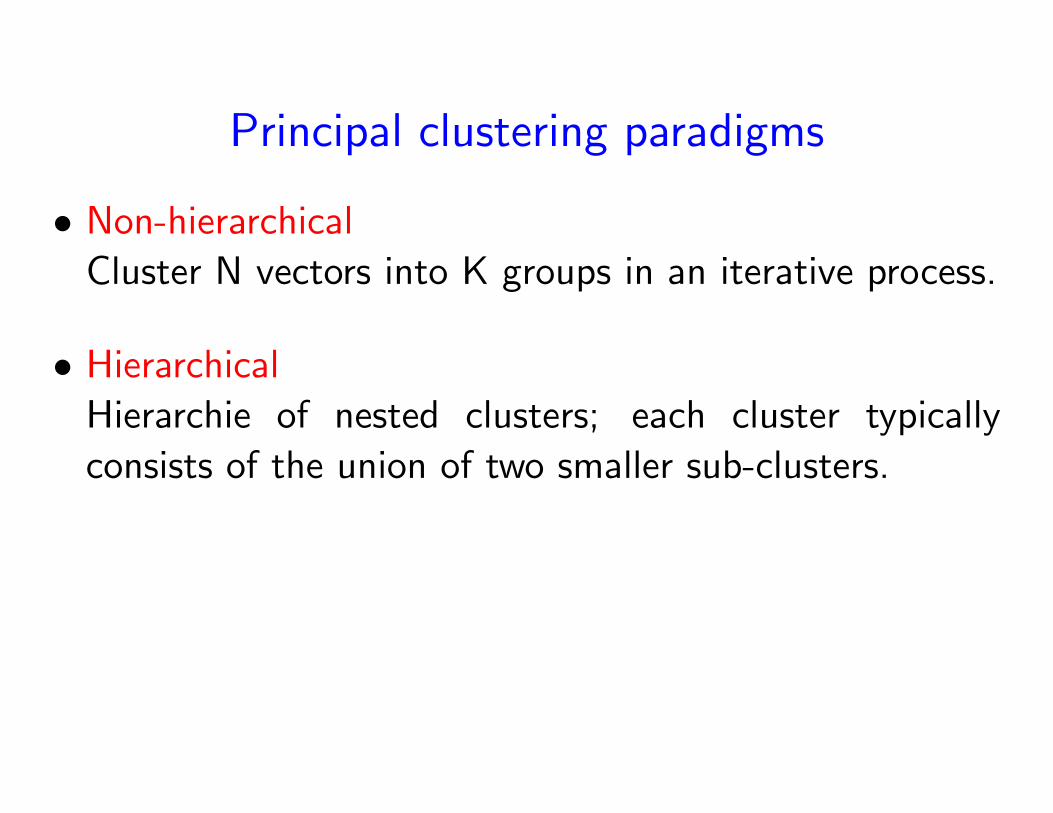
Principal clustering paradigms
• Non-hierarchical
Cluster N vectors into K groups in an iterative process.
• Hierarchical
Hierarchie of nested clusters; each cluster typically
consists of the union of two smaller sub-clusters.
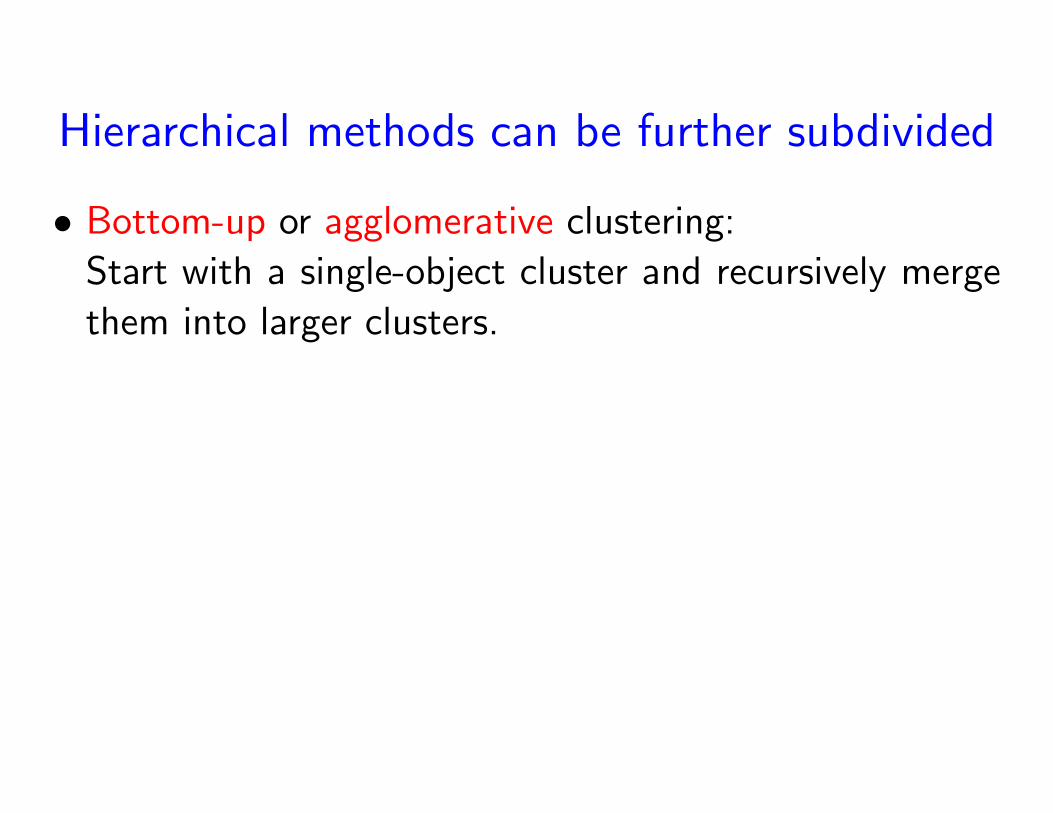
Hierarchical methods can be further subdivided
Hierarchical methods can be further subdivided
• Bottom-up or agglomerative clustering:
Start with a single-object cluster and recursively merge
them into larger clusters.
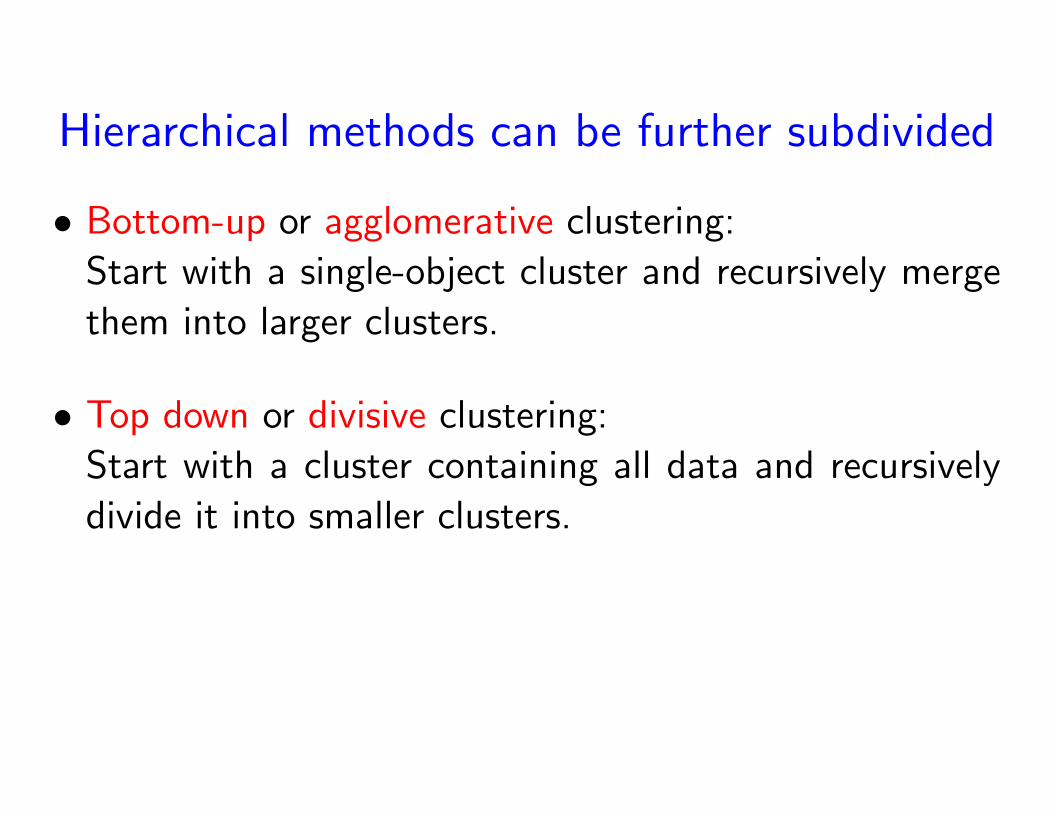
Hierarchical methods can be further subdivided
• Bottom-up or agglomerative clustering:
Start with a single-object cluster and recursively merge
them into larger clusters.
• Top down or divisive clustering:
Start with a cluster containing all data and recursively
divide it into smaller clusters.
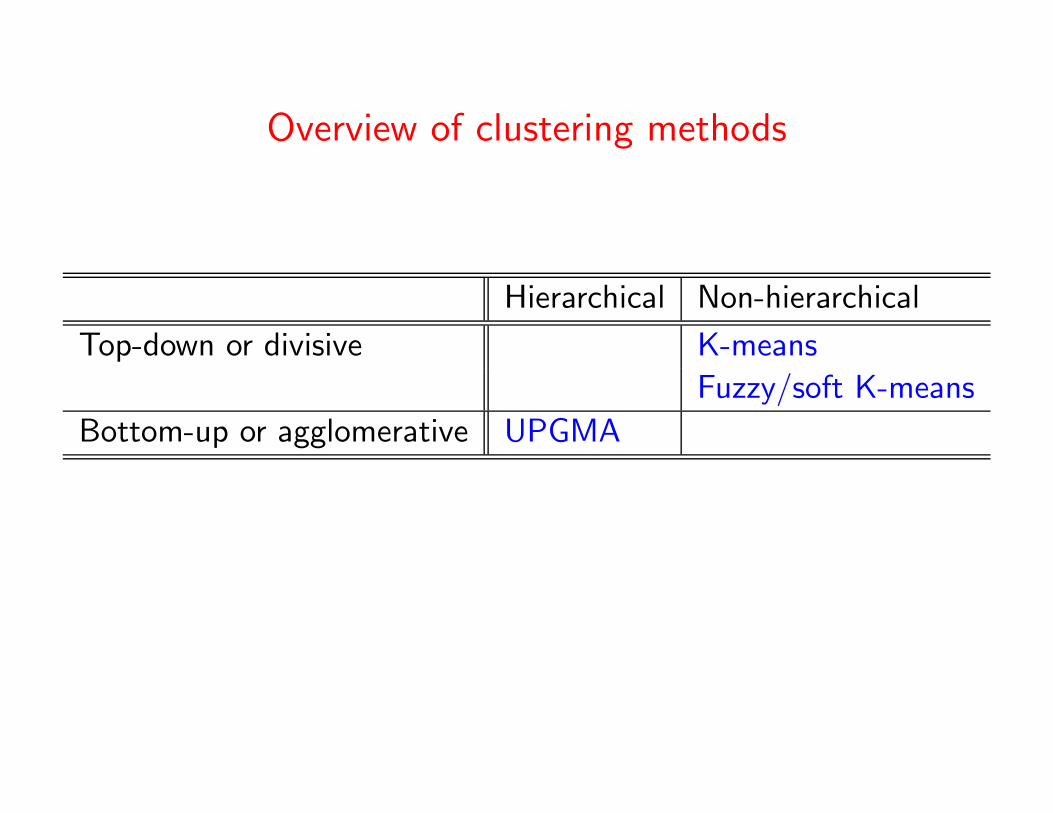
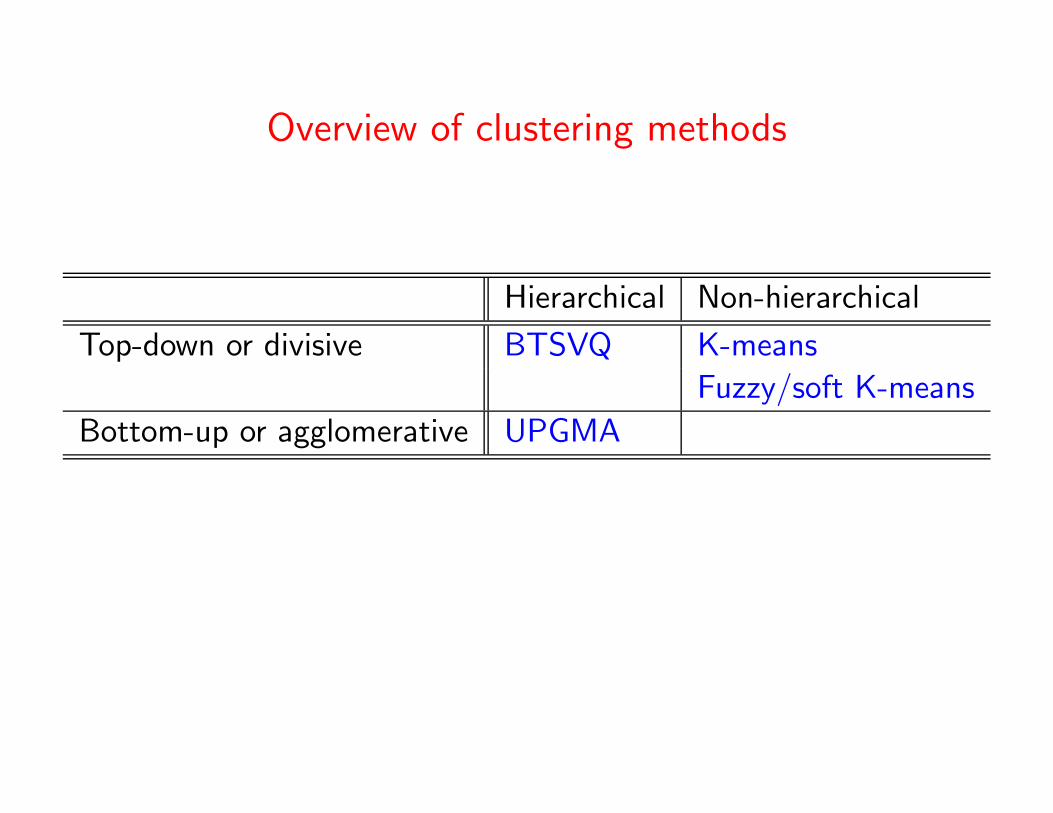
Overview of clustering methods
Hierarchical Non-hierarchical
Top-down or divisive K-means
Fuzzy/soft K-means
Bottom-up or agglomerative UPGMA
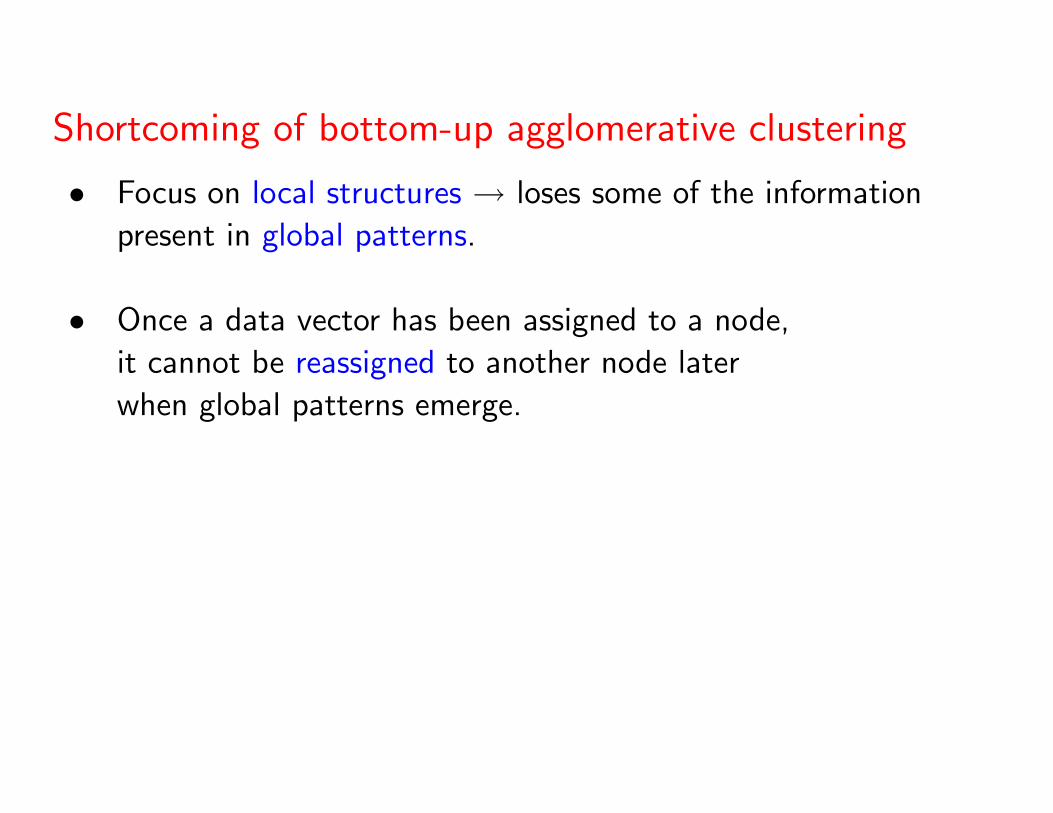
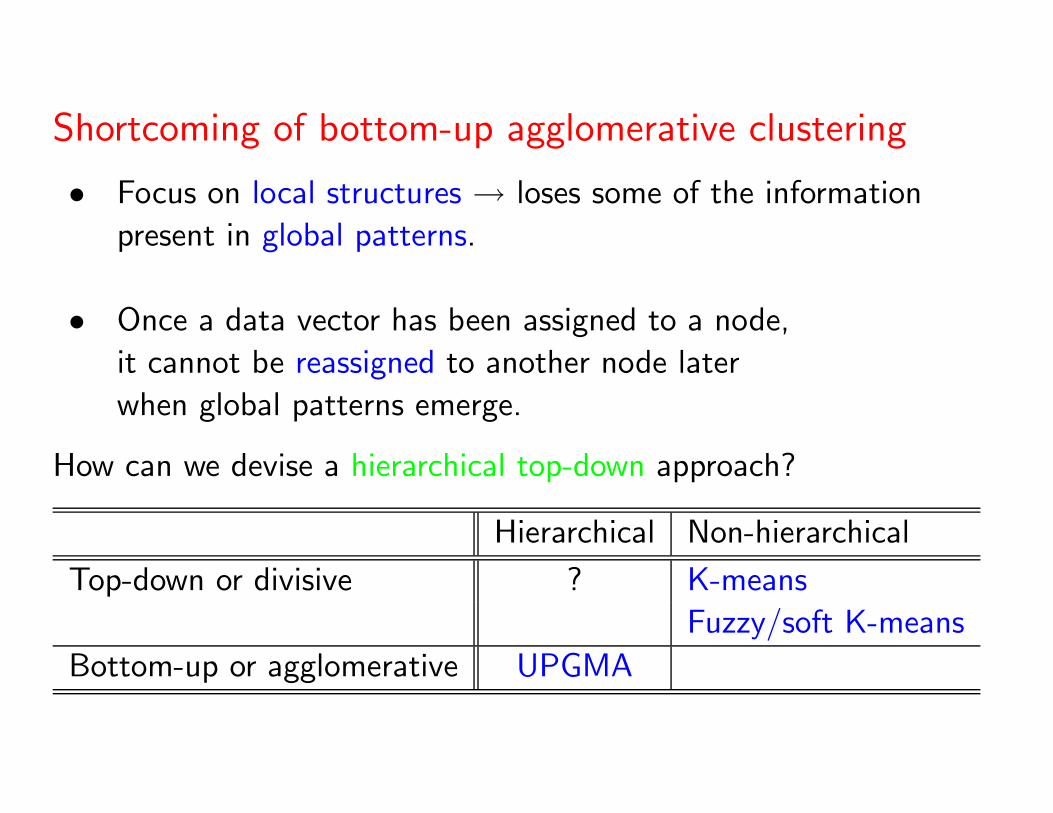
Shortcoming of bottom-up agglomerative clustering
• Focus on local structures → loses some of the information
present in global patterns.
• Once a data vector has been assigned to a node,
it cannot be reassigned to another node later
when global patterns emerge.
Shortcoming of bottom-up agglomerative clustering
• Focus on local structures → loses some of the information
present in global patterns.
• Once a data vector has been assigned to a node,
it cannot be reassigned to another node later
when global patterns emerge.
How can we devise a hierarchical top-down approach?
Hierarchical Non-hierarchical
Top-down or divisive ? K-means
Fuzzy/soft K-means
Bottom-up or agglomerative UPGMA
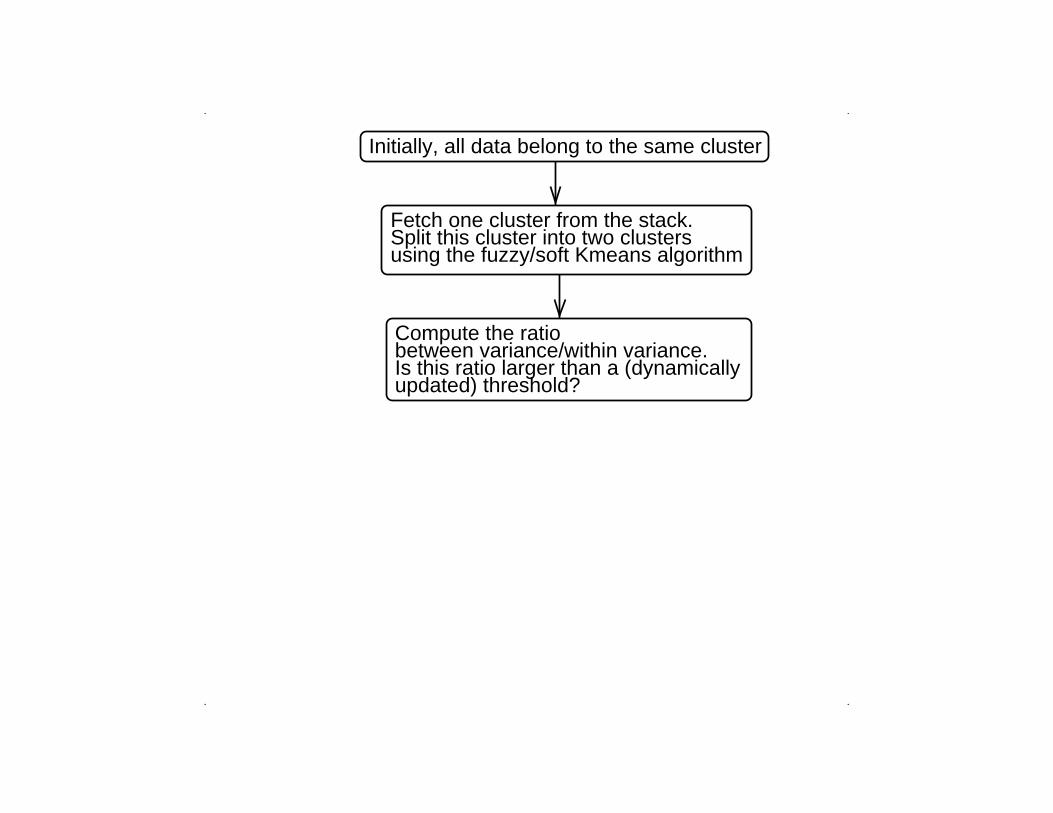
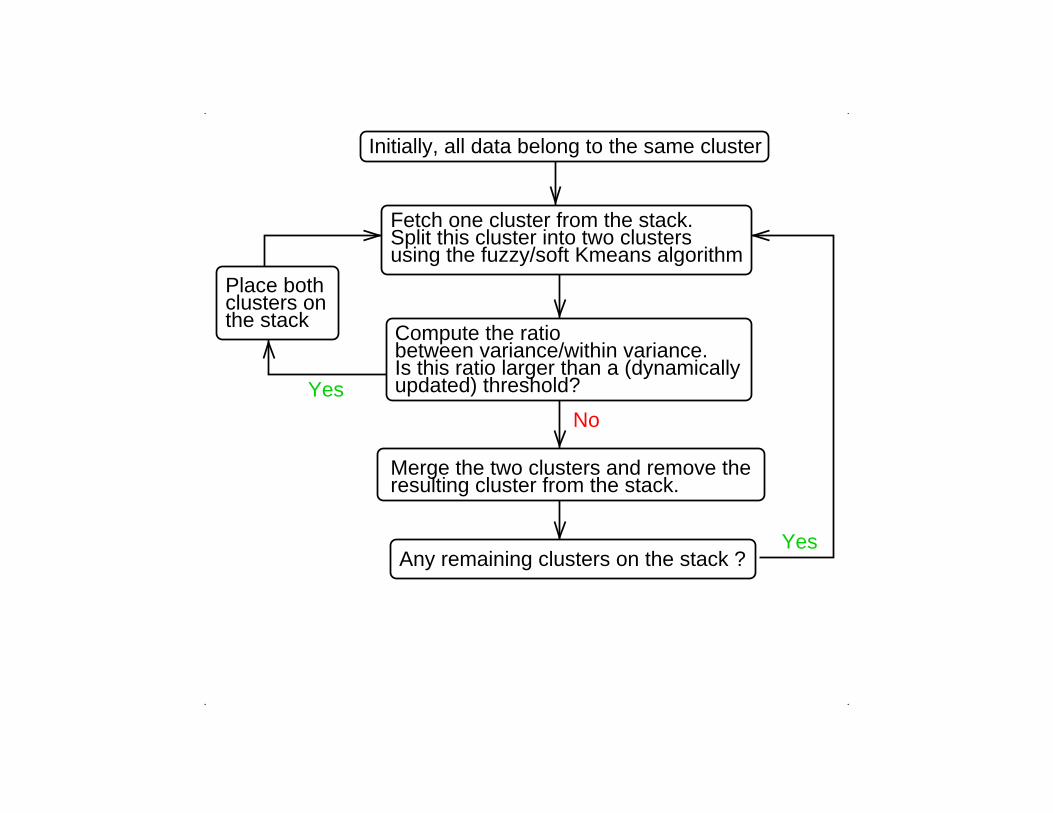
Divisive (top-down) hierarchical clustering:Binary tree-structured vector quantization
(BTSVQ)
Initially, all data belong to the same cluster
. .
..
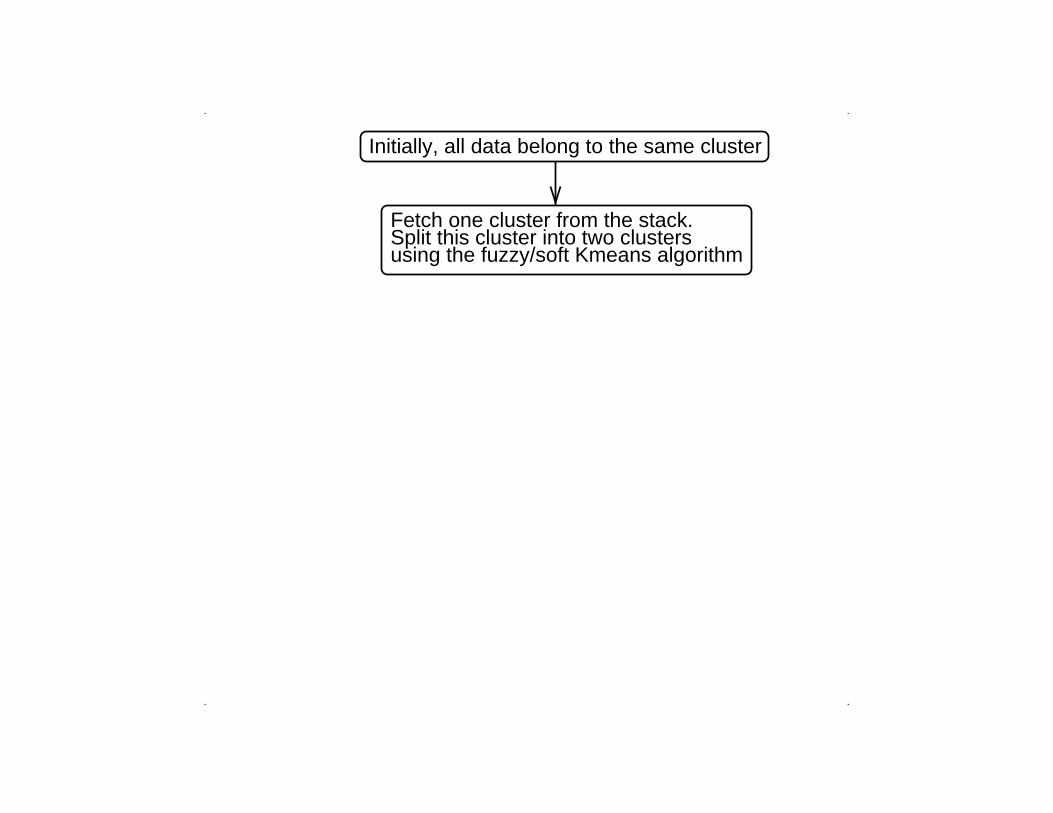
Fetch one cluster from the stack.Split this cluster into two clustersusing the fuzzy/soft Kmeans algorithm
Initially, all data belong to the same cluster
. .
..
. .
..
Initially, all data belong to the same cluster
updated) threshold?Is this ratio larger than a (dynamicallybetween variance/within variance.Compute the ratio
using the fuzzy/soft Kmeans algorithmSplit this cluster into two clustersFetch one cluster from the stack.
. .
..
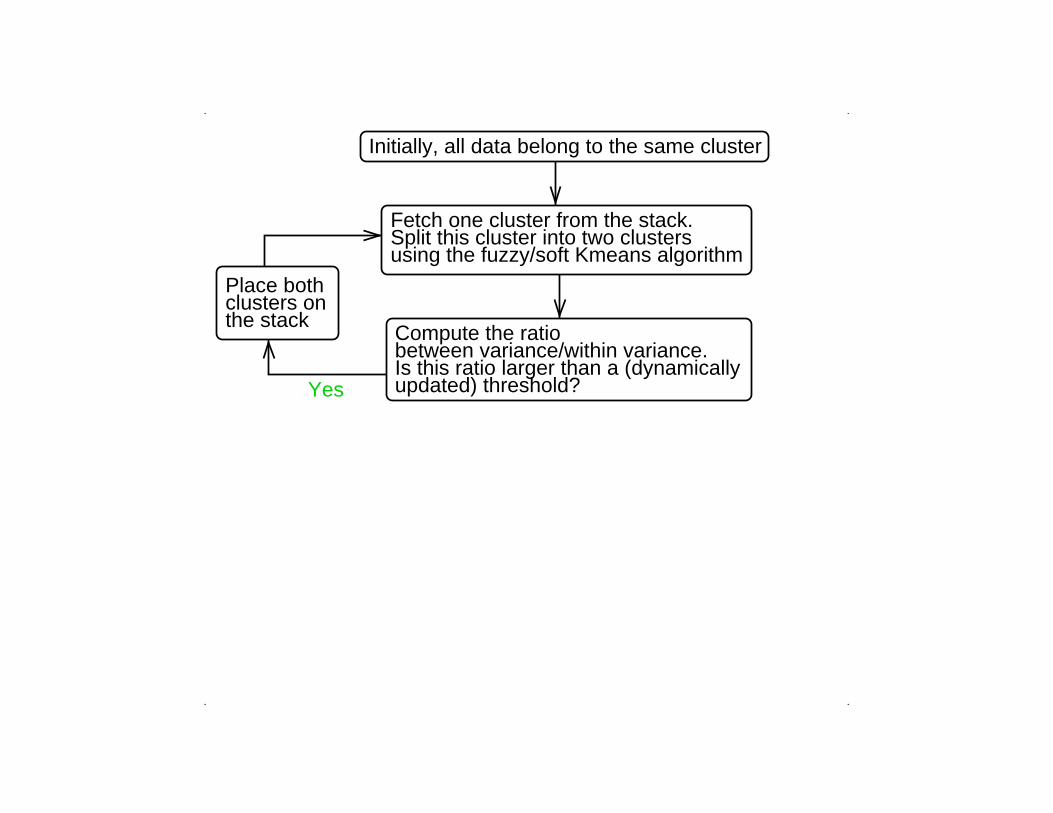
Initially, all data belong to the same cluster
Yes updated) threshold?Is this ratio larger than a (dynamicallybetween variance/within variance.Compute the ratio
the stackclusters onPlace both
using the fuzzy/soft Kmeans algorithmSplit this cluster into two clustersFetch one cluster from the stack.
Compute the ratiobetween variance/within variance.Is this ratio larger than a (dynamicallyupdated) threshold?Yes
No
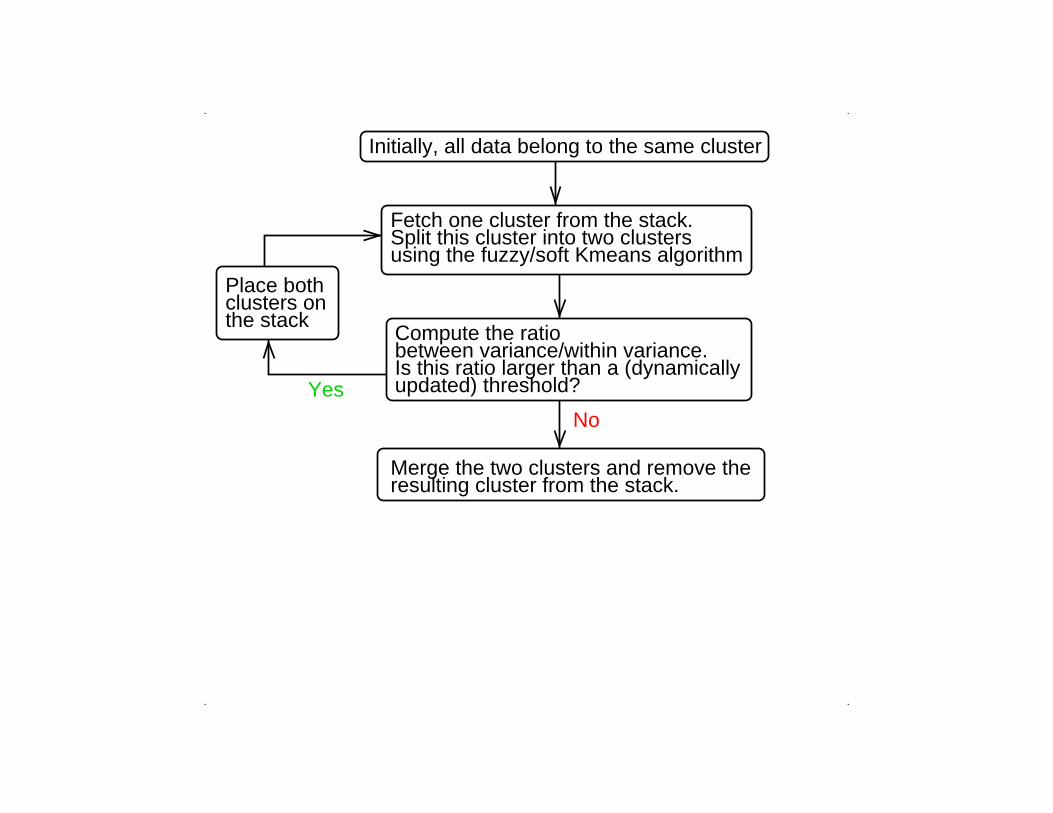
Initially, all data belong to the same cluster
. .
..
Fetch one cluster from the stack.Split this cluster into two clustersusing the fuzzy/soft Kmeans algorithm
Merge the two clusters and remove theresulting cluster from the stack.
Place bothclusters onthe stack
Compute the ratiobetween variance/within variance.Is this ratio larger than a (dynamicallyupdated) threshold?Yes
No
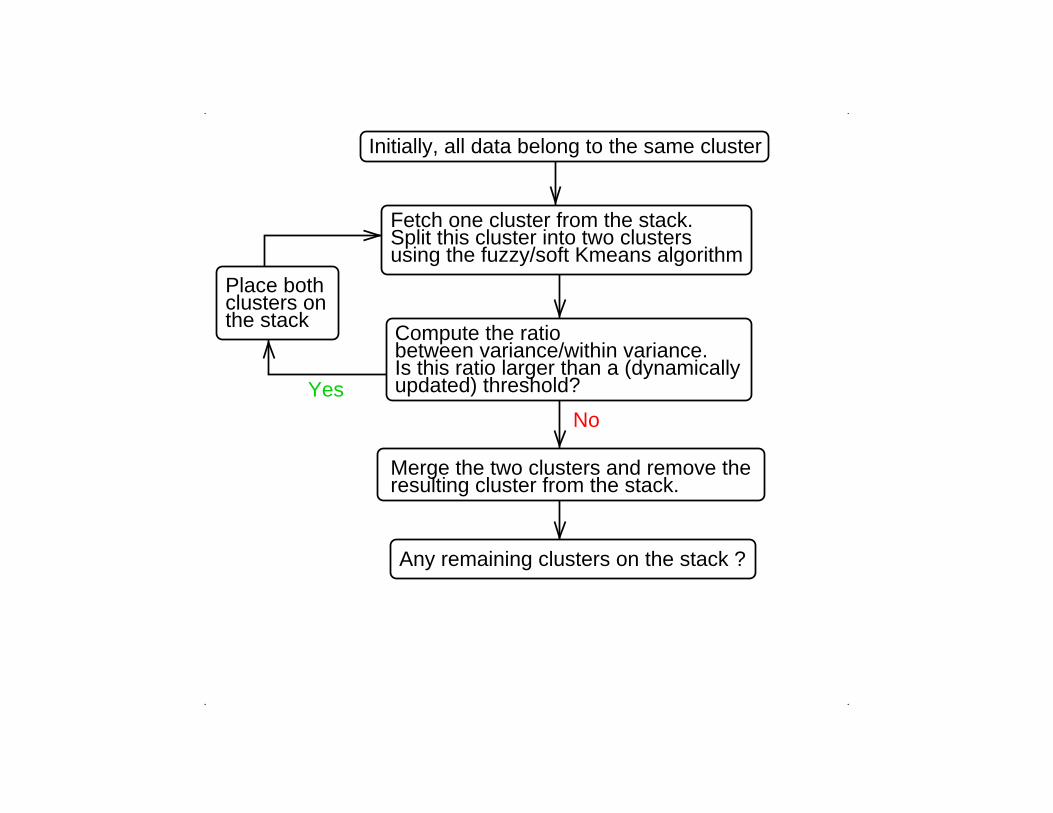
Initially, all data belong to the same cluster
. .
..
Fetch one cluster from the stack.Split this cluster into two clustersusing the fuzzy/soft Kmeans algorithm
Merge the two clusters and remove theresulting cluster from the stack.
Any remaining clusters on the stack ?
Place bothclusters onthe stack
Compute the ratiobetween variance/within variance.Is this ratio larger than a (dynamicallyupdated) threshold?
Yes
Yes
No
Initially, all data belong to the same cluster
. .
..
Fetch one cluster from the stack.Split this cluster into two clustersusing the fuzzy/soft Kmeans algorithm
Merge the two clusters and remove theresulting cluster from the stack.
Any remaining clusters on the stack ?
Place bothclusters onthe stack
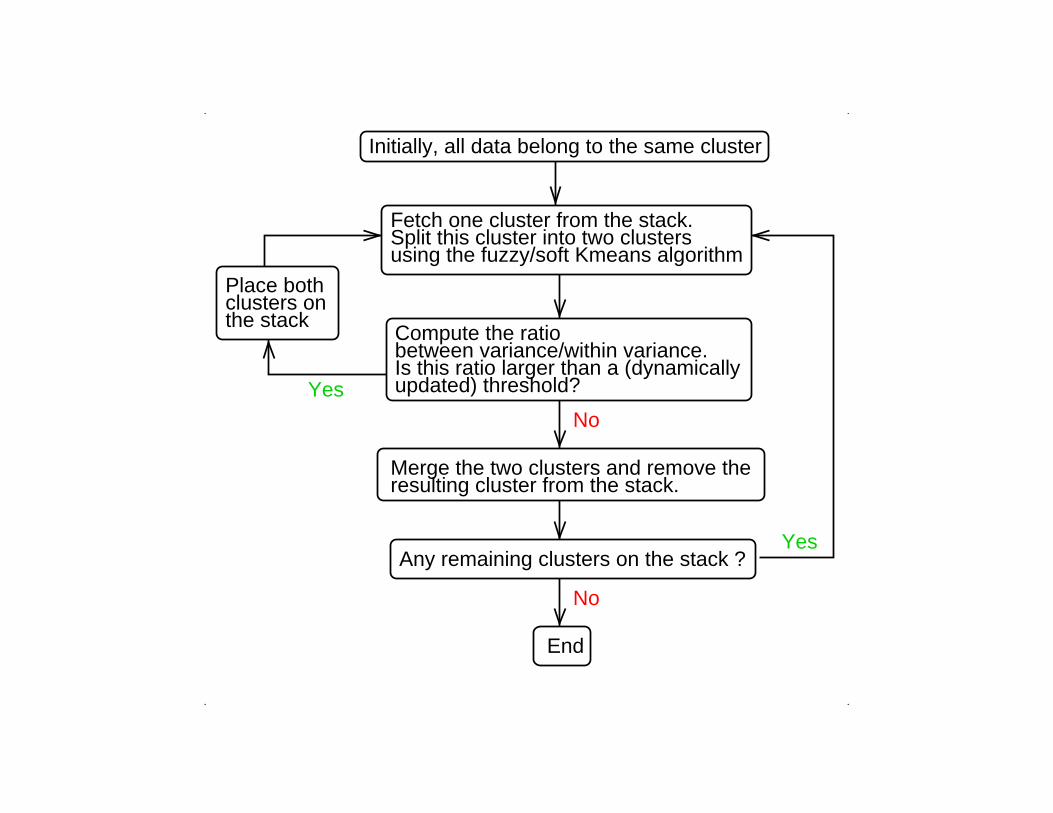
Compute the ratiobetween variance/within variance.Is this ratio larger than a (dynamicallyupdated) threshold?
Yes
Yes
No
Initially, all data belong to the same cluster
No
. .
..
Fetch one cluster from the stack.Split this cluster into two clustersusing the fuzzy/soft Kmeans algorithm
Merge the two clusters and remove theresulting cluster from the stack.
Any remaining clusters on the stack ?
Place bothclusters onthe stack
End
Compute the ratiobetween variance/within variance.Is this ratio larger than a (dynamicallyupdated) threshold?
Yes
Yes
No
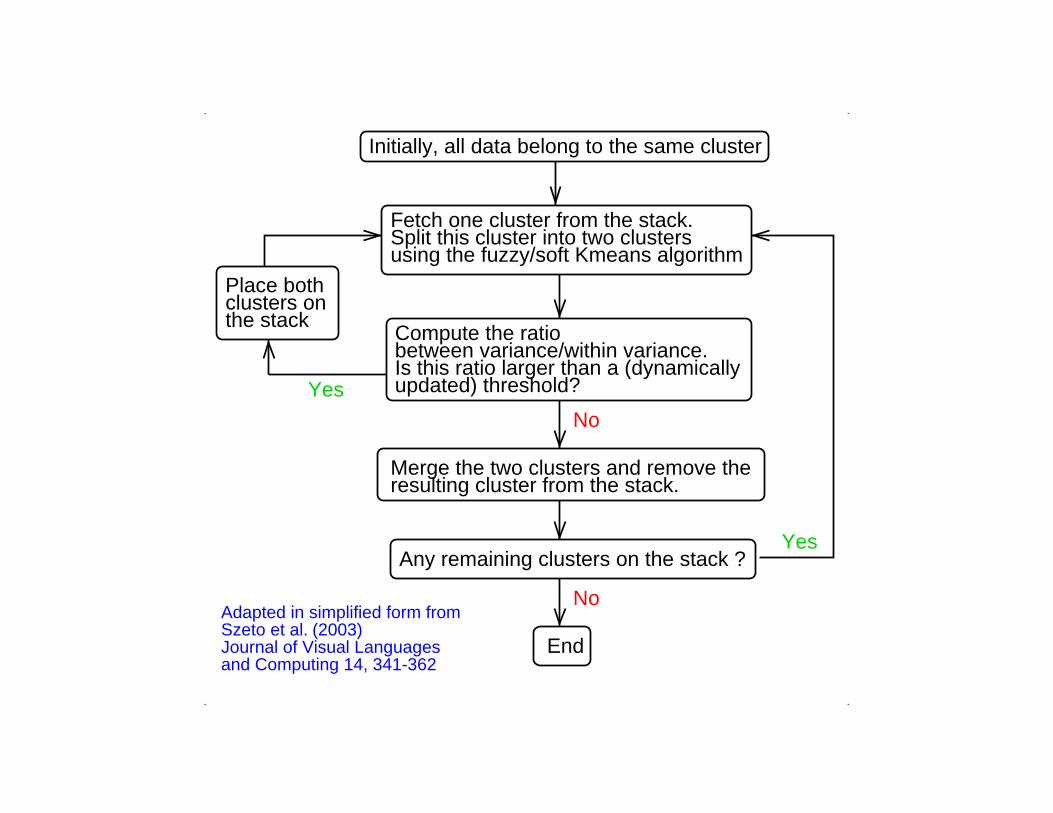
Initially, all data belong to the same cluster
NoAdapted in simplified form fromSzeto et al.Journal of Visual Languagesand Computing 14, 341-362
(2003)
. .
..
Fetch one cluster from the stack.Split this cluster into two clustersusing the fuzzy/soft Kmeans algorithm
Merge the two clusters and remove theresulting cluster from the stack.
Any remaining clusters on the stack ?
Place bothclusters onthe stack
End
Overview of clustering methods
Hierarchical Non-hierarchical
Top-down or divisive BTSVQ K-means
Fuzzy/soft K-means
Bottom-up or agglomerative UPGMA
Pitfalls of clustering
Pitfalls of clustering
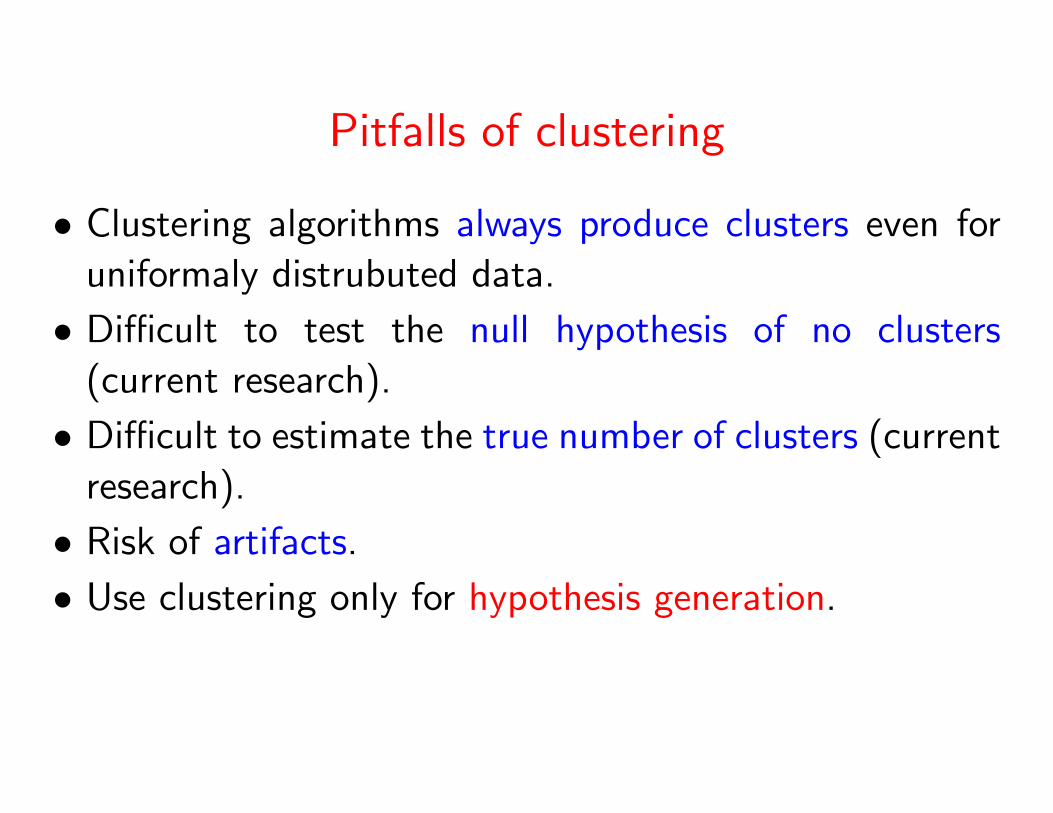
• Clustering algorithms always produce clusters even for
uniformaly distrubuted data.
Pitfalls of clustering
• Clustering algorithms always produce clusters even for
uniformaly distrubuted data.
• Difficult to test the null hypothesis of no clusters
(current research).
Pitfalls of clustering
• Clustering algorithms always produce clusters even for
uniformaly distrubuted data.
• Difficult to test the null hypothesis of no clusters
(current research).
• Difficult to estimate the true number of clusters (current
research).
Pitfalls of clustering
• Clustering algorithms always produce clusters even for
uniformaly distrubuted data.
• Difficult to test the null hypothesis of no clusters
(current research).
• Difficult to estimate the true number of clusters (current
research).
• Risk of artifacts.
• Use clustering only for hypothesis generation.
Pitfalls of clustering
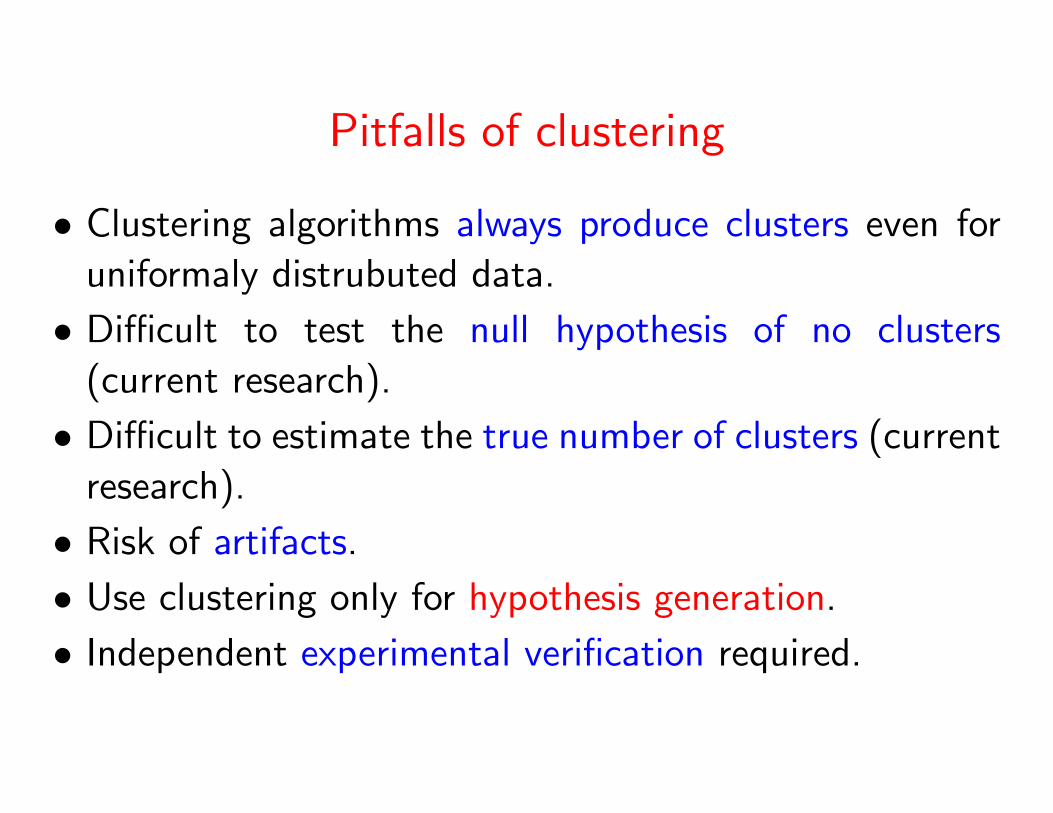
• Clustering algorithms always produce clusters even for
uniformaly distrubuted data.
• Difficult to test the null hypothesis of no clusters
(current research).
• Difficult to estimate the true number of clusters (current
research).
• Risk of artifacts.
• Use clustering only for hypothesis generation.
• Independent experimental verification required.
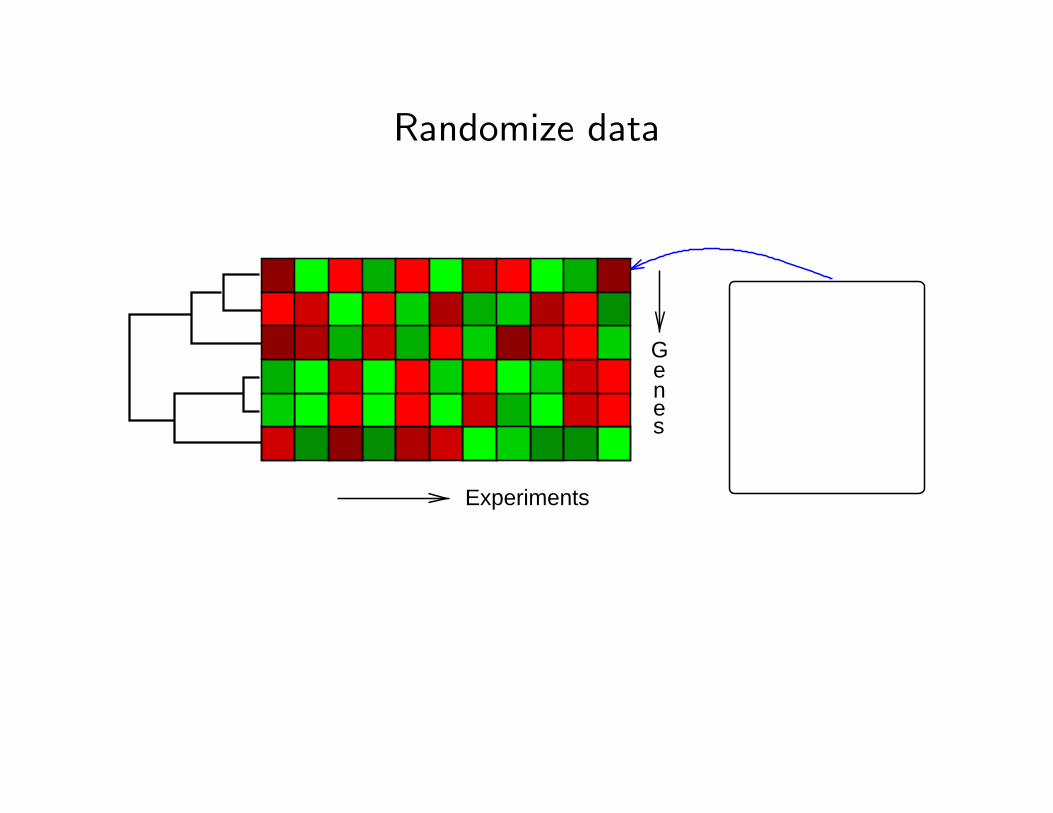
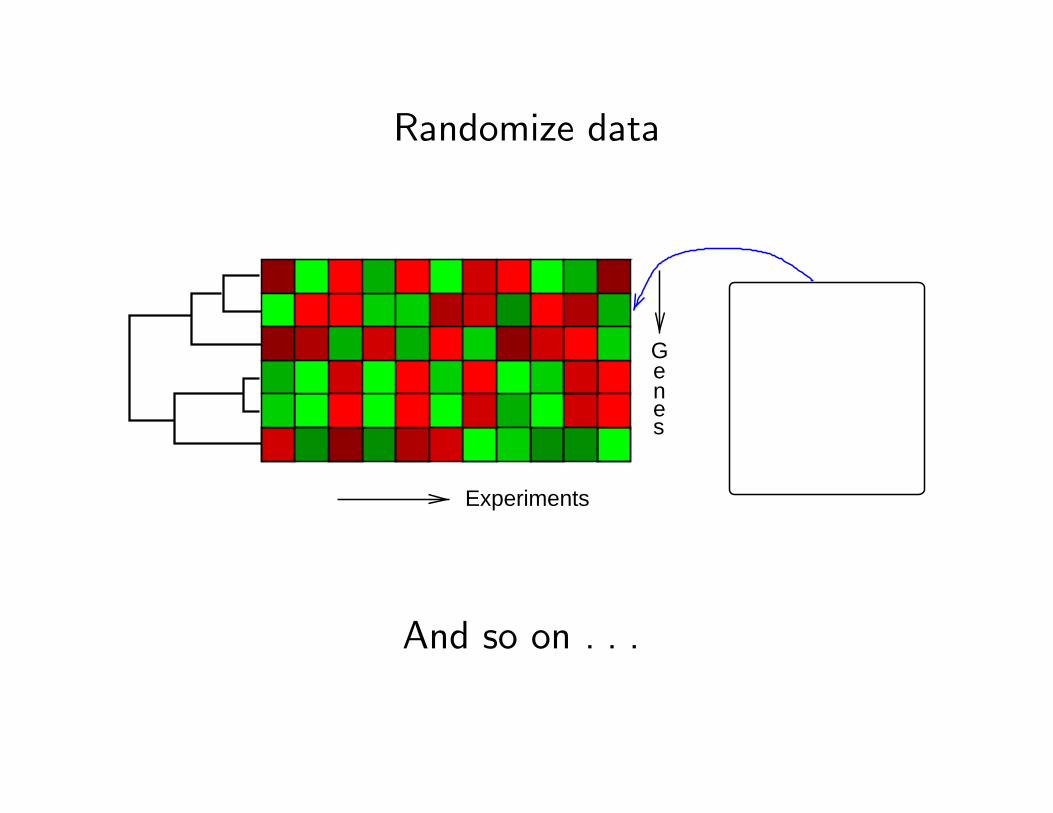
Deciding on the number of clusters:Gap statistic
Tibshirani, Walther, Hastie (2001), J. Royal Statistical Society B
Idea:
• Compute EK for randomized data.
• Compare this with EK from real data.

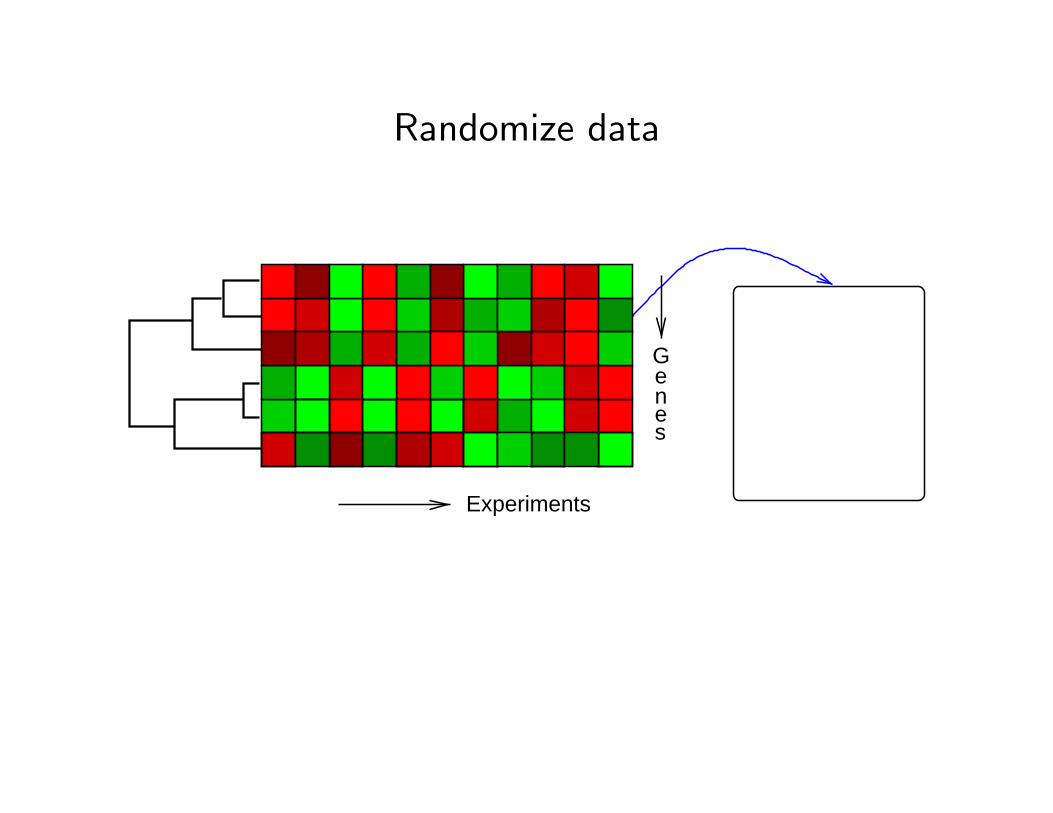
Randomize data
seneG
Experiments
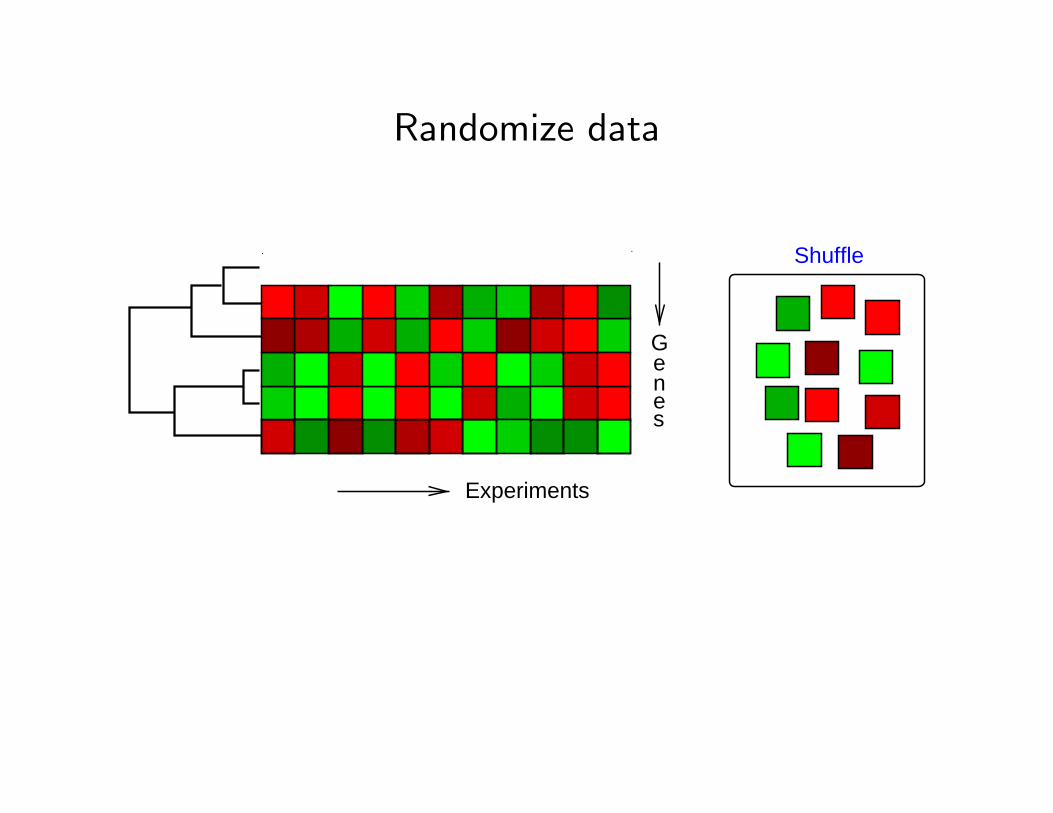
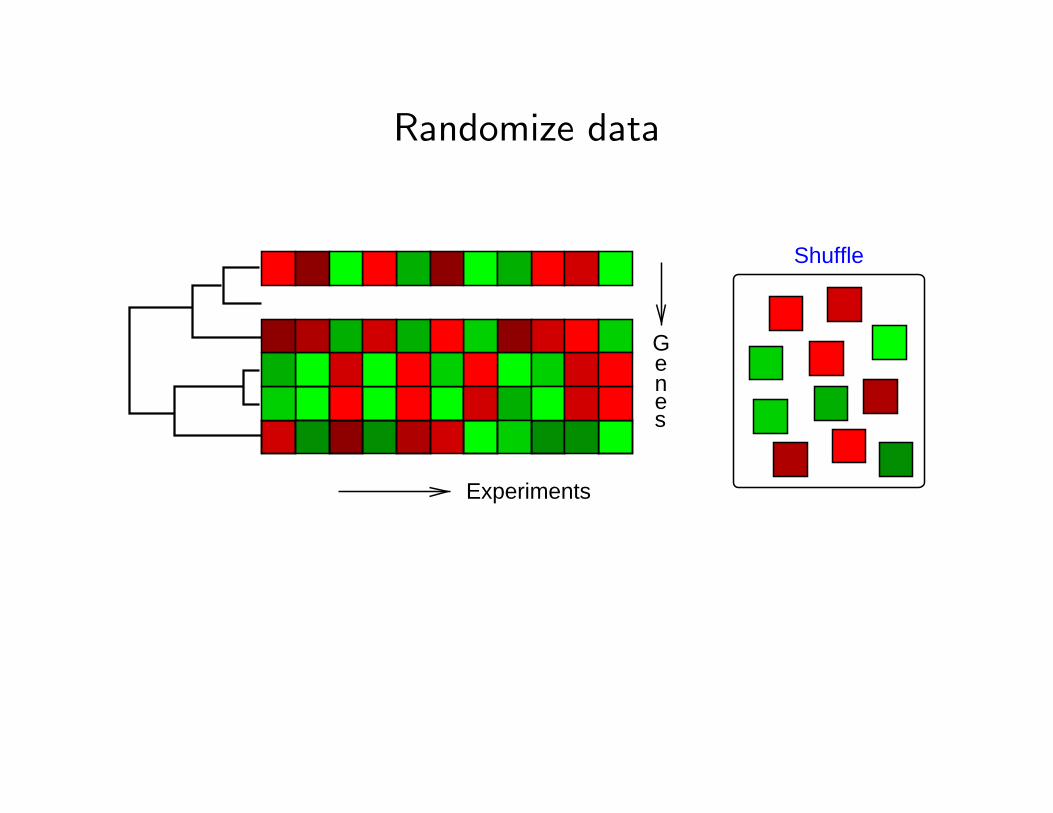
Randomize data
Shuffle. .
seneG
Experiments
Randomize data
. .
seneG
Experiments
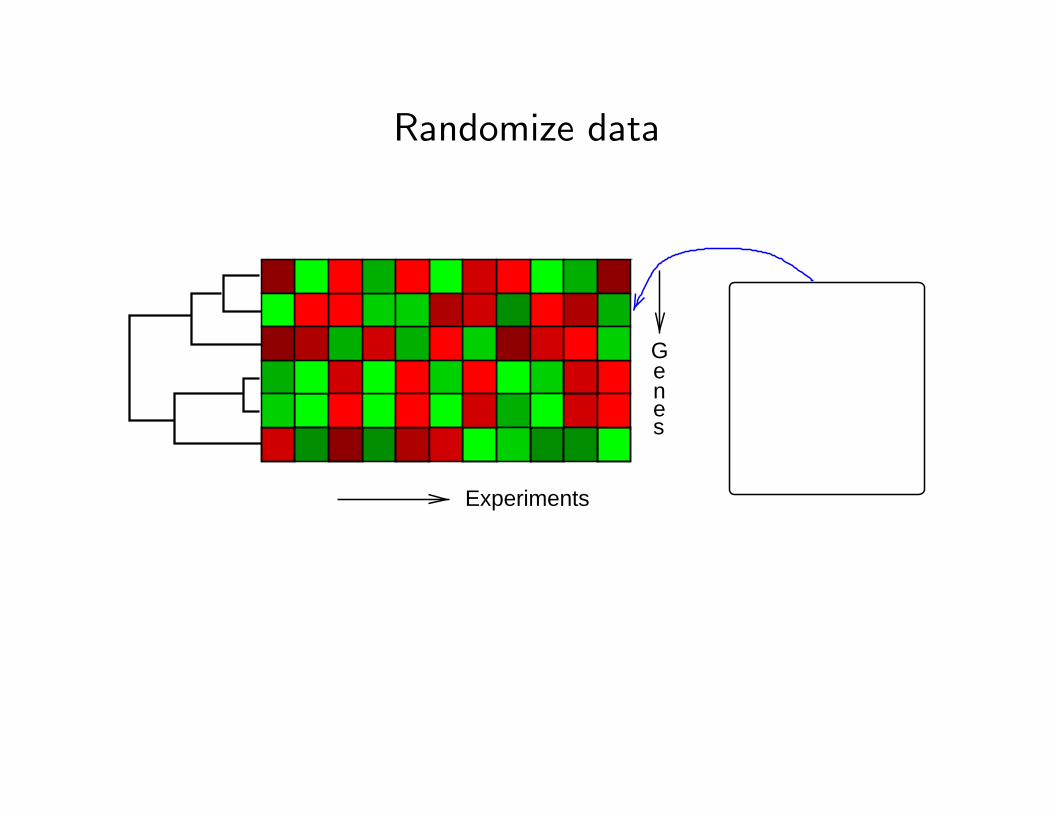
Randomize data
seneG
Experiments
Randomize data
Shuffle
seneG
Experiments
Randomize data
. .
seneG
Experiments
Randomize data
. .
seneG
Experiments
And so on . . .
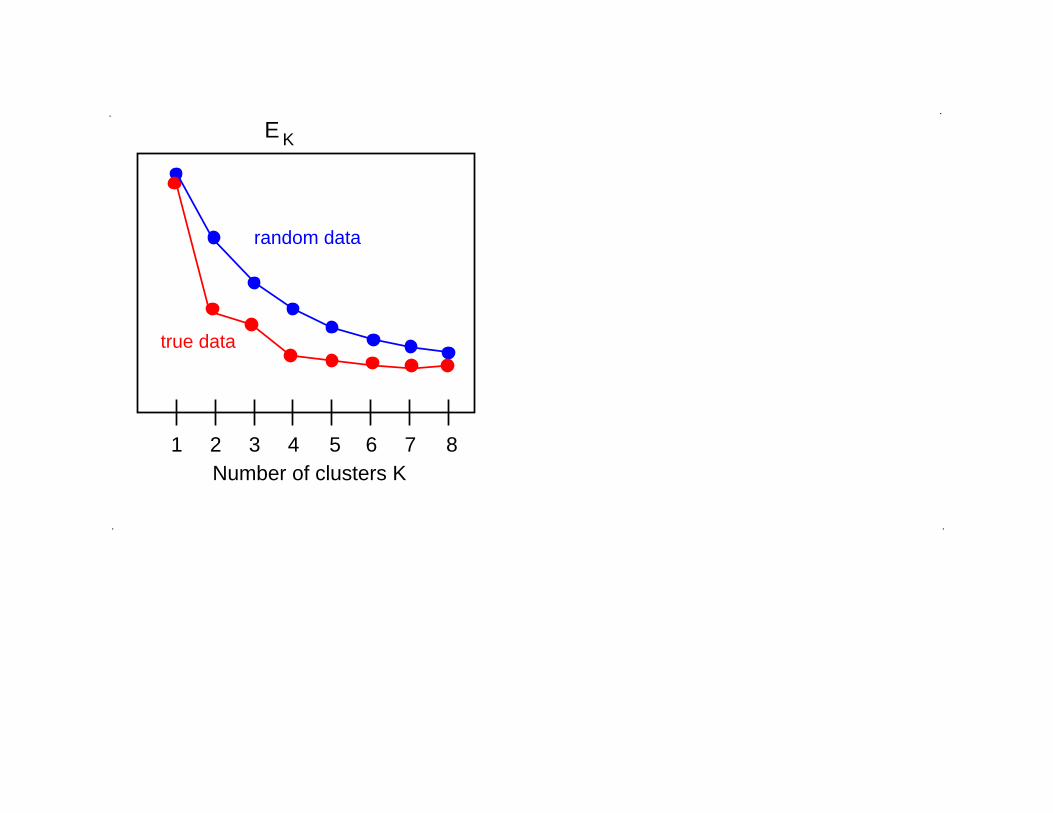
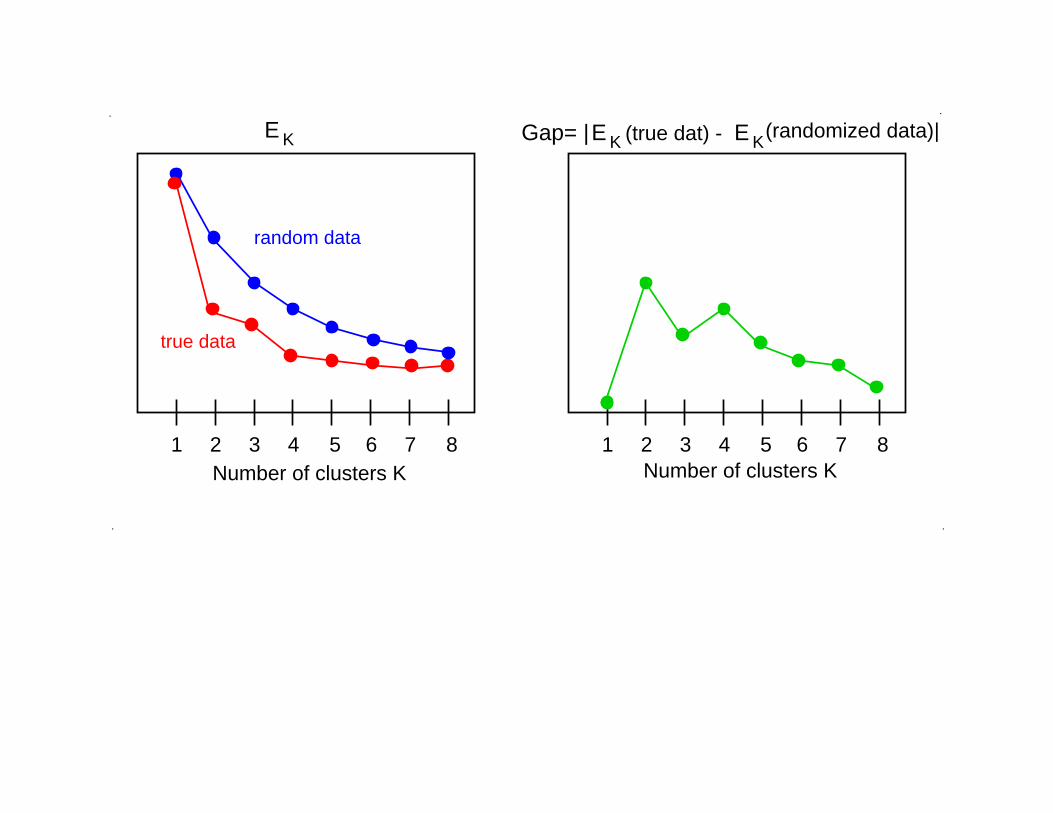
5 81 2 3 4 6 7Number of clusters K
random data
true data
.
. .
.
E K
764321 85 5
.
..
.
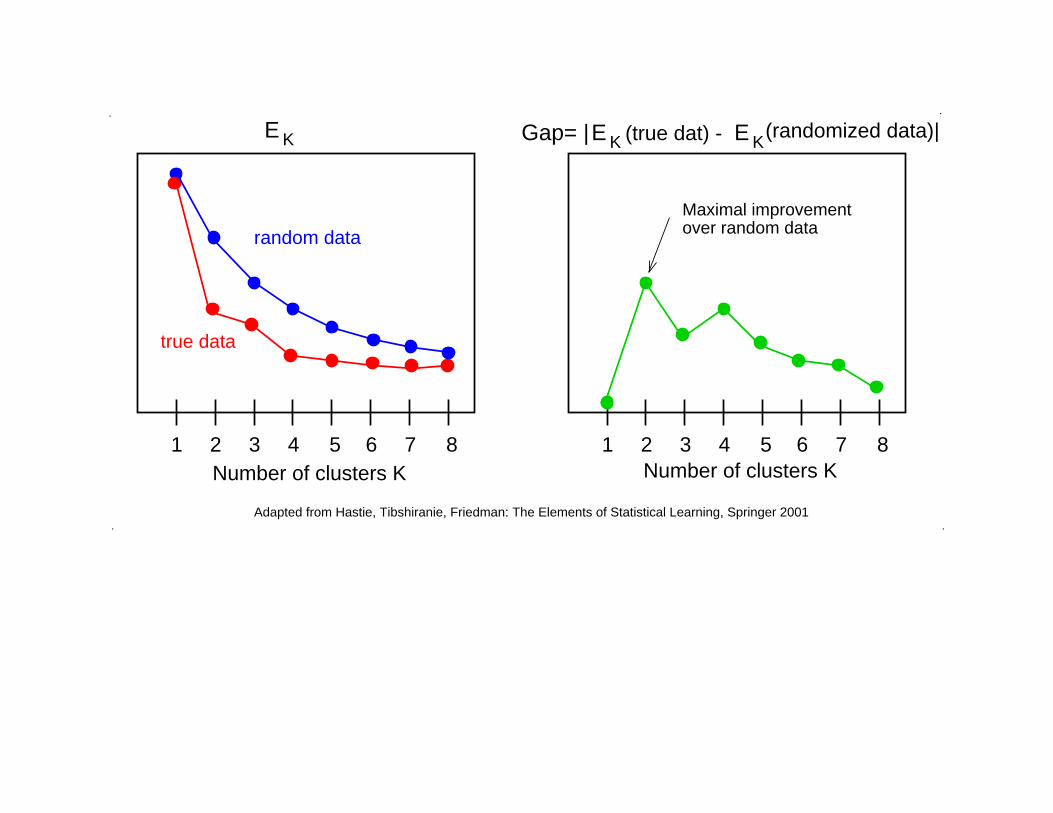
Gap= | |(randomized data)(true dat) -
true data
random data
Number of clusters K Number of clusters K764321 8
KE KEKE
85764321 85 1
.
..
.
Adapted from Hastie, Tibshiranie, Friedman: The Elements of Statistical Learning, Springer 2001
over random dataMaximal improvement
Gap= | |(randomized data)(true dat) -
true data
random data
Number of clusters K Number of clusters K76432
KE KEKE


![Clustering gene expression patterns - HP Labs · hes to clustering gene expression patterns ([Bro wn's Lab, NHGRI , W en et al 98]) utilize hierarc hi-cal metho ds (constructing ph](https://img.pdfslide.net/doc/110x75/5e7a404f8251c460fb5f451d/clustering-gene-expression-patterns-hp-hes-to-clustering-gene-expression-patterns.jpg)