Embed Size (px)
Citation preview
1
Objective Performance Metrics for Improved
Space Telerobotics Training
by
Rachel Emily Forman
B.A. in Mathematics Dartmouth College, 2009
Submitted to the Department of Aeronautics and Astronautics
in partial fulfillment of the requirements for the degree of
Master of Science in Aeronautics and Astronautics
at the Massachusetts Institute of Technology
September 2011
© Massachusetts Institute of Technology 2011. All rights reserved
Signature of Author _______________________________________________________________________
Department of Aeronautics and Astronautics August 18, 2011
Certified by ___________________________________________________________________
Charles M. Oman Senior Lecturer, Department of Aeronautics and Astronautics
Thesis Supervisor Accepted by ___________________________________________________________________
Eytan H. Modiano Professor of Aeronautics and Astronautics
Chair, Graduate Program Committee

2

3
Objective Performance Metrics for Improved
Space Telerobotics Training
by
Rachel Forman
Submitted to the Department of Aeronautics and Astronautics on August 18, 2011 in partial fulfillment of the requirements for the degree of
Master of Science in Aeronautics and Astronautics
Abstract
NASA astronauts undergo many hours of formal training and self-study to gain proficiency in space teleoperation tasks. After each lesson, instructors score an astronaut’s performance in several broad skill categories, including ‘General Situational Awareness’, ‘Maneuvers/Task Performance’, and ‘Hand-Controller Techniques’. A plus, check, or minus indicates that the student is ahead of, at, or behind the expected skill level. The scoring of the final evaluation for a robotics training course is also largely subjective, with the instructor designating an integer score for the student between 1 (Unsatisfactory) and 5 (Strong) in the same skill categories. This thesis research project was designed to: (1) consider the variety of quantitative metrics that could be embedded into a space robotics training simulation, and (2) investigate at what point and by what means it is most constructive for performance assessment to be revealed to an operator-in-training. We reviewed the current largely qualitative space robotics performance metrics, as well as new quantitative kinematic metrics of manual control skills—including those explored thus far only in laboratory experiments—and additional measures of executive function and supervisory control performance. Kinematic metrics include quantitative measures such as rate of change of linear and rotational acceleration. Potential measures of executive function and supervisory control include camera selection and clearance monitoring. To instantiate our ideas, we chose a specific “fly-to” space telerobotics task taught in the early phases of NASA Generic Robotics Training (GRT) and developed a pilot training experiment (n=16) using our virtual robotics training workstation. Our goal was to evaluate potential performance metrics designed to encourage use of multi-axis control, and to compare real-time (“live”) performance feedback alternatives (live visual vs. live aural vs. none). Movement time decreased and multi-axis and bimanual control use gradually increased across trials. All subjects had the opportunity to view post-trial performance feedback including these metrics. Although our subjects overwhelmingly preferred the live, visual feedback condition, no reliable additional effects of live feedback condition were found, except perhaps among the more experienced subjects. However, the experiment demonstrated that embedded performance metrics potentially could quantify and improve some important aspects of GRT evaluations. This research was supported by the National Space Biomedical Research Institute through NASA Contract NCC9-58. Thesis Supervisor: Charles M. Oman Title: Senior Lecturer of Aeronautics and Astronautics

4
Acknowledgements Thanks to Dr. Charles Oman for welcoming me to the MVL and for all of your support and guidance. I am extremely grateful to have had the opportunity to work on such an interesting project and with such a great group of people. Thanks to Dr. Andrew Liu for your willingness to listen and respond to a broad range of questions throughout this process. Your advice and expertise has been invaluable. Thanks to Dr. Alan Natapoff for all of the fascinating stories, patient explanations, editing, advice and, of course, the trail-mix bars. Thanks to Teresa Pontillo, Caroline Lowenthal, and Raquel Galvan, fantastic office-mates and friends. As it says on our door sticker, “BEST OFFICE EVER”! Thanks to Liz Zotos for always being there to help with whatever I needed. You are an integral part of this lab, and I really appreciate all of your assistance. Thanks to the entire MVL for making the past two years so enjoyable. I am lucky to have been part of a lab where the students are so active outside of the office; I hope that we can continue to adventure together in the future. Thanks to all of my subjects for taking an interest in and participating in my work. I could not have done this without you. Thanks to Zakiya Tomlinson for setting such a positive example as a student here and for your continued support from JSC; your insights guided this project. Thanks to all other members of the JSC robotics training team for your patience and instruction. Thanks to all of the friends I made throughout my time at MIT; it was great to have people with whom to camp, climb, hike, cook, sail, windsurf, skydive, and spend time with outside of lab—you made my time here unforgettable. A special thank you to Monte for constantly supporting me in all that I do. You always make me smile, and I love you. Last but not least, thank you to my family. Your love and support has shaped me and I would not be here were it not for you. Thank you for always encouraging me to follow my dreams.
5
Table of Contents
List of Figures ......................................................................................................................................... 7 List of Tables .......................................................................................................................................... 7 1 Introduction ........................................................................................................................................ 8 2 Background ...................................................................................................................................... 10 2.1 Space Telerobotics Operations .................................................................................................. 10 2.2 Space Telerobotics Training ...................................................................................................... 11 2.3 Metrics Review ......................................................................................................................... 13 2.3.1 NASA GRT Performance Assessment ............................................................................... 14 2.3.2 External Studies Involving Telerobotics Performance ........................................................ 16 2.3.3 MVL Telerobotics Research .............................................................................................. 18 2.4 Effects of Feedback on Learning ............................................................................................... 20 2.5 Learning Complex Skills ........................................................................................................... 20 2.6 Feedback Modalities ................................................................................................................. 21 3 Objective and Hypotheses ................................................................................................................. 23 3.1 Objective .................................................................................................................................. 23 3.2 Motivation/Focus ...................................................................................................................... 23 3.3 Hypotheses ............................................................................................................................... 24 4 Methods ........................................................................................................................................... 25 4.1 Virtual Environment ................................................................................................................. 25 4.2 Task .......................................................................................................................................... 26 4.3 Display Conditions.................................................................................................................... 26 4.4 Performance Metrics ................................................................................................................. 28 4.5 Subjects .................................................................................................................................... 29 4.6 Procedure .................................................................................................................................. 30 5 Results ............................................................................................................................................. 31 5.1 Qualitative and Quantitative Performance Evaluation ................................................................ 31 5.1.1 Evaluation of Movement Time ......................................................................................... 31 5.1.2 Evaluation of Multi-axis Movement Percentage ................................................................. 32 5.1.3 Evaluation of Smoothness ................................................................................................. 32 5.2 Learning Effects ........................................................................................................................ 33 5.2.1 Movement Time ................................................................................................................ 33 5.2.2 Multi-axis Movement Percentage ...................................................................................... 34 5.2.3 Bimanual Movement Percentage ....................................................................................... 35 5.2.4 Smoothness ....................................................................................................................... 36 5.3 The Influence of Feedback ........................................................................................................ 37 5.4 Spatial Ability, Gender, and Robotics Performance ................................................................... 40
6
6 Discussion ........................................................................................................................................ 42 6.1 Quantitative Metrics .................................................................................................................. 42 6.2 The Effect of Experience Level ................................................................................................. 42 6.3 The Effect of Display Type ....................................................................................................... 43 6.4 The Effects of Spatial Ability Category and Gender .................................................................. 44 6.5 Limitations and Suggestions for Improvement ........................................................................... 44 6.5.1 Alternative Task Types ...................................................................................................... 44 6.5.2 Alternative Displays .......................................................................................................... 44 6.5.3 Alternative Metrics ............................................................................................................ 45 6.5.4 A More Flexible Model ..................................................................................................... 45 7 Conclusions ...................................................................................................................................... 46 References ............................................................................................................................................. 47 Appendices ........................................................................................................................................... 51

7
List of Figures Figure 1: Astronaut Leroy Chiao (left) Operating the SSRMS (right) ....................................................... 8 Figure 2: Space Station Remote Manipulator System [10] ...................................................................... 10 Figure 3: Robotic Workstation (RWS) ................................................................................................... 11
Figure 4: BORIS Environment............................................................................................................... 12
Figure 5: Multi-Use Remote Manipulator Development Facility ............................................................ 13 Figure 6: MVL Robotics Simulator ........................................................................................................ 18
Figure 7: Virtual Mockup of the ISS ...................................................................................................... 25
Figure 8: THC and Corresponding Environment Axes ........................................................................... 25 Figure 10: Fly-to Goal ........................................................................................................................... 26
Figure 9: RHC and Corresponding Environment Axes ........................................................................... 26 Figure 11: Quantitative and Qualitative Evaluation of Movement Time ................................................. 31 Figure 12: Quantitative and Qualitative Evaluation of Multi-axis Movement Percentage ........................ 32 Figure 13: Quantitative and Qualitative Evaluation of Smoothness ........................................................ 32 Figure 14: Movement Time by Experience Level and Trial Number ...................................................... 33 Figure 15: Multi-axis Movement Percentage by Experience Level and Trial Number ............................. 34 Figure 16: Bimanual Movement Percentage by Gender and by Experience Level ................................... 35 Figure 17: Smoothness by Experience Level, Trial Number, and Trial Repetition .................................. 36 Figure 18: Multi-axis Movement Percentage by Display-Type ............................................................... 38 Figure 19: Multi-axis Movement Percentage by Display-Type, Grouped by Level ................................. 38 Figure 20: Multi-axis Movement Percentage by Display-Type, Grouped by Gender ............................... 39 Figure 21: Histogram of Subject MRT Scores ........................................................................................ 41
Figure 22: MRT Score by Gender .......................................................................................................... 41
List of Tables Table 1: Current Scoring Scale for GRT ................................................................................................ 14
Table 2: GRT Skill Categories, Weighting Factors, and Sub-skills ......................................................... 14 Table 3: MVL Telerobotics Performance Metrics .................................................................................. 19 Table 4: Multi-Axis Display Condition Descriptions .............................................................................. 27 Table 5: Measures of Performance ......................................................................................................... 28
Table 6: Subject Demographics ............................................................................................................. 30
Table 7: The Effect of Experience Level and Trial Number on Movement Time .................................... 34 Table 8: The Effect of Experience Level, Gender & Trial Number on Multi-axis Movement % .............. 35
Table 9: The Effect of Experience Level, Gender, Trial Rep. & Trial Num. on Bimanual Movement % . 36
Table 10: The Effect of Experience Level, Trial Repetition and Trial Number on Input Smoothness ...... 37
Table 11: Investigating the Effect of Display-Type on Multi-axis Movement Percentage ....................... 39 Table 12: Investigating the Effect of Feedback on Multi-axis Movement Percentage .............................. 40 Table 13: MRT Score Descriptive Statistics ........................................................................................... 40

8
1 Introduction
Despite continuing advances in technology, in some engineering systems, it is impractical to fully automate certain tasks given their extreme complexity, uncertainty, and cost. The inclusion of a human-in-the-loop allows for rapid adaptation to situations that may develop unexpectedly [1], when it is neither feasible nor desirable to rely on automation alone. Thus, humans remain directly engaged in a wide range of technologically-rich systems, such as security screening [2], air-traffic control [3], robot-assisted surgery [4, 5], and space telerobotics. The desire to exploit human strengths as well as the need to compensate for human weaknesses guides the selection of tasks to automate [3]. In the case of the Space Station Remote Manipulator System (SSRMS) of the International Space Station, when the robotic arm is in motion, a human operator is always at the controls (Figure 1).
Figure 1: Astronaut Leroy Chiao1 (left) Operating the SSRMS2 (right)
The SSRMS is used for a variety of critical tasks [6], including construction, maintenance, inspection, and payload deployment and retrieval. Mission success often depends on the experience and expertise of trained teleoperators; as such, it is vital that astronauts receive optimal preparation and instruction. In a 1995 study, Zak and Das first noted that feedback during the lesson modules and practice sessions of NASA Generic Robotics Training (GRT), the first step in an astronaut’s telerobotics training, was based entirely on subjective observations made by robotics instructors [7]. A current instructor in the program tells us that fifteen years later, little has changed— there are still no quantitative metrics in the training simulation, and human instructors continue to make all assessments [8]. Without objective measures, there is a potential lack of consistency in performance assessment. Additionally, it is impossible for an astronaut to receive detailed feedback unless an instructor is present; consequently, no constructive evaluation is available during self-study, when astronauts may inadvertently develop improper strategy and technique. As argued by Fry et al., NASA’s GRT program would benefit greatly from the introduction of quantitative performance metrics that could be obtained directly from a robotics simulator. These objective measures would provide timely feedback and would allow for a more accurate and meaningful assessment of operator proficiency than that produced by current GRT evaluation [9]. Given the
1 Photo credit: http://spaceflight.nasa.gov/gallery/images/station/crew-9/html/iss009e29106.html 2 Photo credit: http://www.nasa.gov/mission_pages/station/multimedia/iss011e09878.html

9
potentially critical nature of an error by an SSRMS operator, it is essential that there exist a consistent, precise means of skill assessment in order to identify strengths, weaknesses, and to ensure that the most qualified operator is recognized. Quantitative metrics might enhance rate of learning, and also provide a useful performance criterion for recurrent training. Despite the sophistication and responsiveness of the physical components of the SSRMS, the system cannot afford an ill-trained human at the controls. This thesis research project was designed to: (1) consider the variety of quantitative metrics that could be embedded into a space robotics training simulation, and (2) conduct a pilot experiment to investigate at what point and by what means it is most constructive for performance assessment to be revealed to an operator-in-training. We reviewed metrics and evaluation techniques used in a variety of real-world and experimental teleoperation settings, aiming to identify and implement those which would most improve NASA robotics training. We chose a specific training scenario designed to challenge the trainee to use multi-axis control and conducted an experiment to test alternative real-time visual and aural presentation of the number of axes actively in use. All subjects were offered additional quantitative feedback at the end of each scenario. We hoped this pilot experiment would demonstrate how embedded quantitative live and post-trial performance feedback could be used by the trainee and instructor as an adjunct to NASA telerobotics training, helping to improve the efficiency and effectiveness of the GRT training program.

10
2 Background
2.1 Space Telerobotics Operations3
Telerobotics is the area of robotics concerned with control of a mechanical device from a distance. In the case of space telerobotics, astronauts monitor and control mechanical devices in environments that may be perilous to humans, such as on extra-terrestrial surfaces or outside of pressurized vehicles. Robotics operations have been a critical feature of spaceflight since the beginning of the Shuttle Program, allowing for the accomplishment of diverse tasks including deployment of satellites, maintenance of payloads, inspection and repair of the Space Shuttle, and construction of the International Space Station (ISS). Despite the approaching retirement of the Shuttle and completion of ISS, robotics will remain integral to space operations; ISS crewmembers will continue to control the onboard Space Station Remote Manipulator System (SSRMS, Figure 2) for station maintenance, science, and resupply4. Further in the future, telerobotics will likely play a crucial role in the building of extraterrestrial outposts and in space and surface exploration. Including a human-in-the-loop allows for adaptation to situations that may develop unexpectedly, capitalizing on the cognitive abilities of the human operator to perform unplanned but critical tasks.
Figure 2: Space Station Remote Manipulator System [10]
3 This section was adapted from the 2008 Research Proposal “Validation of assessment tests and countermeasures for detecting and mitigating changes in cognitive function during robotics operations”, C.M. Oman, et al., [1] with the permission of the author. 4 Resupply is a track-and-capture operation in which the crew uses the SSRMS to grapple and berth the free-flying Japanese H-II Transfer Vehicle.

11
Robotic operators on ISS generally use the two, three-axis hand controllers of the Robotic Workstation (RWS, Figure 3) to control the translation and rotation of the SSRMS end effector. In addition to the fixed hand controllers, the RWS consists of at least three video monitors and a display and control panel, providing an interface by which an operator can manipulate and receive data from the SSRMS [11].
Figure 3: Robotic Workstation (RWS)
The robotic systems have multiple control modes which can be selected for specific tasks, but this adds cognitive complexity, mental workload and mode awareness challenges that can complicate operations. Mode awareness errors can result in arm motion in unanticipated, and possibly dangerous, directions. The SSRMS is operated mainly in manual mode, and feedback on arm motion and clearance to surrounding structure is almost entirely visual, provided by multiple cameras positioned around the workspace and mounted on the arm itself. The human relies on a limited number of 2-dimensional camera views to construct the 3-dimensional operating environment [12]. Maintaining spatial situation awareness is perhaps the most critical aspect of SSRMS operations, as sufficient clearance must be maintained between the arm (and attached payload) and surrounding structures and Extravehicular Activity (EVA) astronauts. The consequences of a significant collision resulting from incorrect judgment or control error could threaten mission success or even human safety. Operators must have the cognitive abilities to visually scan displays and to correctly interpret and integrate the information needed to maintain proper control.
2.2 Space Telerobotics Training
Given the potentially critical nature of an error by an SSRMS operator, the Generic Robotics Training (GRT) required to qualify an astronaut for telerobotics is significant, consisting of at least 13 lesson modules, with review and refresh lessons as needed. GRT teaches students basic robotic skills such as how to correctly predict end effector motion as a result of hand controller input and how to select and control cameras for optimal viewing. These skills are utilized during the majority of robotic arm operations. (A more complete list of GRT skills and standards may be found in Appendices A and B.)

12
The stated objective of GRT is that students be able to “demonstrate the knowledge, skills, and attitudes to safely operate a robotic arm to perform a generic task” [13]. Lessons are typically one-on-one with a NASA robotics instructor, and many hours of additional self-study time may be scheduled. Before flight, generic training is supplemented with task-specific scenarios based on robotic events scheduled to occur during the astronaut’s time in orbit. As Currie points out, these one-g simulations can be essential training aids, but they can never fully stand-in for on-orbit experience [14]. Tasks to be performed often require considerable skill from the astronaut, who must be able to accomplish a variety of jobs precisely and remotely. It is the goal of GRT to provide students with a strong skill base, to best prepare astronauts for telerobotics in space. GRT training takes place at NASA’s Johnson Space Center (JSC), in Houston, Texas, where astronauts spend many months learning and exercising fundamental skills. Most individual robotic training occurs on the Dynamic Skills Trainers (DSTs) [15] using the Basic Operational Robotic Instructional System (BORIS). Whereas the physical DSTs mimic the operational setup that astronauts will see on ISS, BORIS is a simple virtual environment in which students can develop operational skills and techniques (Figure 4, [13]). The camera views available loosely mimic those of the Shuttle payload bay. The program provides a 6 degrees-of-freedom (DOF) robotic arm, similar to the Shuttle Remote Manipulator System (SRMS), and the instructor can specify rigid or flexible links according to lesson level [16].
Figure 4: BORIS Environment
BORIS is the primary instructional aid in GRT and has been an effective way to introduce generic robotics concepts to astronauts in training. During an important second step in robotics training, the crew spends an extended period of time at the Canadian Space Agency headquarters, in Saint Hubert, Quebec

13
[17], to learn specific details of SSRMS operation. Finally, before moving on to flight-specific training, astronauts complete “Specialist Skills”, or the “Spec Skill flow”, 8 additional lessons (about 20 hours nominally). Another training instrument that has seen significant use is a robotic arm in the Multi-Use Remote Manipulator Development Facility (MRMDF), also located at JSC. With the exception of the operating environment, this physical 7-DOF arm (Figure 5) is controlled similarly and performs much like the SSRMS [18]. Until recent years, the MRMDF was an important aspect of robotics training, with 3 of the 13 GRT lesson modules taking place on the arm. Due to lack of funding, use of the MRMDF arm halted in October, 2009, and, with the exception of the first module5, all GRT lessons are now accomplished in DSTs [8].
Figure 5: Multi-Use Remote Manipulator Development Facility
2.3 Metrics Review
According to Zak and Das, there is a clear lack of agreement in the teleoperation community as to the definition of ‘good’ teleoperation performance [7]. Lumelsky agrees, noting that individuals in related fields may find some performance measures more meaningful than others [19]; e.g., an engineer may judge performance by the average of forces and torques, while a physician may define performance based on accuracy. Given the variety and complexity of teleoperation tasks, it is standard practice to analyze operator performance through the use of multiple measures. Draper et al. discuss the consequences of depending on only a single criterion [20]. There is a trade-off between speed and accuracy even in tasks as simple as pointing; an inverse relationship often exists between potential performance measures, with a focus on one having a negative effect on another [21]. Thus, it is critical that multiple measures of performance are considered when assessing teleoperators. This section reviews performance metrics and evaluation techniques used in a variety of real-world and experimental teleoperation settings.
5 The first GRT lesson, “KINE OV” (Kinematics Overview), is a classroom lesson.

14
2.3.1 NASA GRT Performance Assessment
As astronauts progress through GRT, their skill acquisition is appraised by ‘expert’ observers [9]. These robotics instructors evaluate astronauts individually after each lesson module, and additional instructor astronauts make assessments during the final evaluation. A system of +, chk, - and a numerical 1-5 scale is used, with meanings as listed in Table 1. Instructors provide supplementary written feedback after certain lesson modules to give students a more detailed picture of their strengths and weaknesses [22].
Table 1: Current Scoring Scale for GRT
Application Score Interpretation
All lessons,
excluding the
practice and final
evaluation
+ Ahead of where the student is expected to be at current point in training
Chk Where the student is expected to be at current point in training
- Behind where the student is expected to be at current point in training
N/A Not evaluated in this lesson
Practice and final
evaluation
5 Excellent, strong, does all tasks easily
4 Good, does most tasks easily (a typical proficient operator overall score)
3 Acceptable, completes all tasks but has some difficulty, additional GRT training
may be recommended
2 Weak, less than acceptable, some additional GRT training required
1 Not qualified, unsatisfactory, significant additional GRT training required
A passing score for the final evaluation requires that an astronaut receive no lower than a 2 in any category and at least a score of 3 overall. Assessment occurs in nine broad skill categories, each of which encompasses many sub-skills, detailed in Table 2. The total score is determined as a weighted sum of the score assigned by the instructor for each skill category [23].
Table 2: GRT Skill Categories, Weighting Factors, and Sub-skills
Skill Category Wt Sub-skills
General Situational
Awareness 4
Scan pattern; Camera selection/adjustment (zoom, focus, position(pan/tilt), multiplex)
for overall task/joints; Recognition of unexpected arm motion; Reach/joint limits and
singularities; Self-collisions
Clearance 3 Structural/Berthing guide/EE-pin contact; Clearance verbalization; Camera
selection/adjustment for clearance monitoring; Real time camera tracking
Maneuvers/ Task
Performance 3
Overall strategy (mode selection/trajectory); Accuracy (visualization/achievement of
end position and orientation); Timeline control/efficiency
Hand Controller
Techniques 2
Grip; Command ramping; Multi-axis inputs; Motion control/steadiness; Correct
command inputs
Single Joint
Technique 2 Joint strategy/motion prediction; Joint selection/direction
Target and Overlay
Usage 1
Time of installation/selection of EE camera/overlay; Camera adjustment (zoom, focus)
for overlay; Target error interpretation
Resource
Management 2 Coordination/communication with evaluators; Attitude
Systems
Management 2
CFRMJ use; System configuration; Command and display frames; H/W and S/W
systems knowledge
Operations
Technique 1 Flight rules (rates, clearance, brakes)
15
It can be difficult to interpret a score by the current assessment method, as multiple sub-skills are grouped into each skill category. If an astronaut receives a score of 4 out of 5 in hand controller technique, for example, there is no clear indication of which component of hand controller technique the astronaut need improve, and the overall score is even less indicative. Another arguable weakness of current GRT performance assessment is its reliance on human evaluators. When an astronaut is practicing during self-study, he or she may inadvertently develop improper strategy and technique because there is no one present to provide constructive feedback. GRT attempts to address this issue by the inclusion of self-study binders in each DST that define specific robotics tasks as well as criteria for success. After a task, a student may refer to the binder for questions to consider, such as “Which frame did you use”, “Why is this frame better than the other”, and “Did you notice the clearance to object X”. These questions are similar to those asked by robotics instructors during GRT lessons [24]. Although the binders do not give specific performance feedback, they do raise awareness in case a student is unable to complete a self-study task, or is near perfection, but fails to notice performance features that an instructor would normally indicate. Other feedback systems also exist to allow for review following self-study. Assuming a student can recognize the difference between smooth and sharp inputs, he or she can assess an aspect of hand controller technique after track-and-capture tasks through plots of hand controller input. A video playback function which records data and replays scenarios is also available. During GRT lessons, recorded scenarios may be used to debrief previous self-study sessions; instructors can point out errors and achievements after the fact [24]. An additional concern regarding human evaluators pertains to inter-rater reliability. Despite the detailed guidelines (Appendix A) by which instructors grade performance, it is impossible to guarantee complete consistency in scoring. Current GRT performance assessment is based mainly on qualitative observations. It has been argued that inter-rater reliability is not applicable to qualitative research [25]; however, in the case of GRT, it is essential that instructors evaluate in a consistent manner so that operator weaknesses can be identified and rectified. When asked how consistent instructors are in their scoring, the Robotics Branch lead at NASA JSC responded with the following:
Historically we have been pretty good (or perhaps lucky) with consistency at the [final] evaluation level. What helps is we limit our evaluation cadre to only the most senior folks (and maintain a very small number to actually perform the eval.). We also balance this by having a second evaluator in the scored lessons (usually an Astronaut from the Robotics branch called an Instructor Astronaut or IA). We periodically average the scores for each instructor to see where there is deviation. At most we are usually 1/10 out for the group (meaning I may score someone 4.3, someone else may be 4.4 while a third is 4.2).
We will be the first to admit there is subjectivity in our evaluating. We balance that by having the second person, minimizing the instructor core and have the robotics board decide final qual. level (as opposed to the eval. score being final say). New instructors do evaluate at an individual class level. Part of [their] certification is to determine how they evaluate. Our lesson plans detail the expectation of success (or defines failure) for that lesson. New instructors can use this to gauge where a student falls... To become a [final] eval. instructor is yet another certification flow (observations, dry-runs, example evals.) and some seniority [24].
16
By including a second evaluator for the stages of GRT in which score determines success or failure, NASA attempts to lessen the subjectivity of assessment. The use of more than one analyst can improve the consistency and reliability of analyses [26].
2.3.2 External Studies Involving Telerobotics Performance
A variety of experiments have been conducted in which telerobotics performance is the dependent variable, though there has been little to no study of what feedback is most valuable for a teleoperator in training [7]. How is it best to evaluate performance? We reviewed metrics6 used in a selection of external studies, the first half of which predominately concern control of a UAV or a surgical telerobot:
� In an experiment involving the teleoperation of a miniature rotorcraft, Mettler et al. defined performance by (1) accuracy, (2) speed, and (3) smoothness. Mettler et al. also considered the level of effort required by the operator, measuring workload using the attention functional7 [27].
� In a second study of miniature rotorcraft published the same year, Andersh et al. similarly divided their metrics into the categories of task performance and operator workload. They considered two task performance metrics, (1) accuracy and (2) time to task completion, and measured operator workload using the attention functional and subjective assessments [28].
� Zhai and Senders investigated coordination in multiple DOF control, analyzing time-on-target in a 6-DOF tracking task. They selected time-on-target as the main measure of performance due to ease of computation and high face validity [29].
� The following year, Zhai and Milgram expanded the indices of coordination among multiple
DOF, considering simultaneity and efficiency, in addition to time-on-target, as performance metrics for a tracking task. They believed that speed and accuracy alone were insufficient measures to represent the whole of performance [30].
� In an experiment involving moving a pointer on the end of a 6-DOF robot from one target to another, Dejong et al. used task time to assess performance. Subjects were instructed to complete each task as quickly as possible [31].
Although the majority of telerobotics work has been in fields other than aerospace, a handful of studies have addressed telerobotics performance during robotic arm simulations such as those used for astronaut training, often involving bimanual control and multiple camera views:
� Zak and Das performed an experiment in which subjects attempted loaded fly-tos8. They defined ‘good’ teleoperation performance as that which minimized: (1) task completion time, (2) the
6 A summary list of metrics used and their definitions, as well as task type, may be found in Appendix C. 7 The attention functional is roughly proportional to the magnitude and frequency of control adjustments [28]. 8 A fly-to is a robotics operation in which the operator moves the arm from one location to another. In the case of a loaded fly-to, a payload is attached to the arm’s end-effector.

17
average of forces and torques, and (3) the number of task aborts, rationalizing that minimization of those metrics would result in the most efficient, economical and safest use of the arm [7].
� Fry et al. addressed NASA robotics training performance evaluation directly, aiming to provide a
reliable assessment of proficiency. Subjects performed unloaded fly-tos and data was extracted from the simulation, allowing for direct evaluation of the use of smooth inputs and multi-axis commands. These metrics were selected because smooth inputs reduce the oscillation of the arm, while multi-axis commands lead to efficient movements for skilled operators [9].
� Bray et al. conducted a study using the BORIS simulation and a fly-to task. Translational (X, Y, Z) and rotational (pitch, yaw, roll) accuracies were used to evaluate performance [32].
� Lumelsky created a simulation in which subjects were asked to move an arm manipulator from its starting position to a target position while avoiding obstacles in the arm environment. Lumelsky acknowledged the importance of indentifying the most meaningful performance metrics, but found it too difficult an issue to address at the time. He emphasized qualitative analysis of raw experimental data instead [19].
� Lamb and Owen developed a more complex simulated task. Subjects in their experiment performed fly-tos, grappled payloads, and performed loaded fly-tos using a head-mounted simulation of the SRMS. Lamb and Owen defined performance metrics by what they deemed the requirements of a typical real-world SRMS task: (1) the minimization of time to task completion, (2) the maximization of path efficiency, (3) the minimization of manipulation errors, and (4) the minimization of control effort. Thus, evaluation was based on (1) total time elapsed from the first control action until either task completion or failure criteria, (2) root mean squared (RMS) distance between the point-of-resolution (POR) on the manipulator and the target throughout the maneuver, (3) the number of collisions or singularities9, and (4) the RMS value of control excursion in all axes throughout the maneuver [33].
� Akagi et al. conducted a valuable study in 2004, examining 15 metrics of arm maneuvering and hand controller performance for subjects who performed 3-DOF translation tasks. After reducing explainable codependencies, Akagi et al. concluded that a subset of 6 metrics was sufficient to categorize performance: (1) task completion time, (2) correction time, (3) distance traveled, (4) degree of inverse motion, (5) maximum component velocity, and (6) percentage of multi-axis input [34]. This is perhaps the most comprehensive approach taken thus far toward the determination of essential performance metrics for teleoperation, though it is limited in its application to GRT due to DOF-restriction and the use of only a single video monitor.
With the exception of Lumelsky’s qualitative analysis [19], the external studies differ from GRT assessment in their use of objective metrics to evaluate teleoperator performance. Whereas GRT relies on subjective observations, the external studies extract quantitative performance metrics from raw simulation data.
9 A singularity is a kinematic limitation of the arm. When the arm is in a singularity configuration, some directions of motion are not possible.

18
2.3.3 MVL Telerobotics Research
Study of telerobotics performance in the Man Vehicle Laboratory (MVL) at MIT began in 2007, with Menchaca-Brandan’s experiment concerning the influence of spatial orientation and visualization on space telerobotics performance [35]. Tomlinson followed shortly thereafter with a study of the influence of spatial abilities on performance [18]. Most recently, Pontillo conducted two experiments, one investigating spatial ability as a predictor of teleoperation performance and the other considering the effects of handedness on performance [36]. Current MVL work concerns the validation of assessment tests and countermeasures for identifying and moderating changes in cognitive function during robotics operations [37]. The telerobotics laboratory setup at MIT mimics that of a DST, particularly in its use of multiple monitors and dual hand controllers (Figure 6). The virtual simulation most often used is modeled after the BORIS program of GRT, though a representation of what astronauts view when operating the SSRMS from the ISS is also available. Programmed task types include fly-tos, track-and-capture10, and autosequence11 scenarios. The simulation was created using AC3D v6.2, a 3-D modeling program (Inivis Limited, Ely, UK) and Vizard v3 VR Toolkit (WorldViz, Santa Barbara, CA) [36].
Figure 6: MVL Robotics Simulator12
Unlike GRT assessment, in which subjective determinations are made by evaluators, operator performance in the MVL scientific studies has been judged solely by objective measures extracted after experiment completion. Table 3 lists the metrics that have been used thus far in the MVL to evaluate telerobotics performance [18, 35-37]. The majority of the metrics concern arm operation, though the final three relate specifically to camera selection. 10 Track-and-capture is used when a robotics operator aboard the ISS must grapple a free-flying payload which may be drifting or spinning in relation to the ISS. 11 Autosequence is used to move the arm across long distances to prevent physical fatigue for the operator. The operator selects a movement file or inputs predetermined joint angles as directed by ground control. 12 Photo credit: Raquel Galvan

19
Table 3: MVL Telerobotics Performance Metrics
Metric Type Description
Trial Time Arm Operation Total elapsed time for trial
Movement Time Arm Operation Total time during which control inputs are commanded
AvgMovement Arm Operation Average duration of a continuous movement
ContMoves Arm Operation # of continuous (discrete) movements
TransMA Time Arm Operation Time spent translating along 2+ axes
BiMan Time Arm Operation Time spent rotating about 2+ axes
Moves Arm Operation Time spent translating & rotating
TMAMvs Arm Operation # of direction changes made
RMAMvs Arm Operation # of translation direction changes in 2+ axes
BiMvs Arm Operation # of rotational direction changes in 2+ axes
AngL Arm Operation # of times warned for angular hardstop
HStop Arm Operation # of times hardstop reached
Singularity Arm Operation # of singularities reached
Clearance Arm Operation # of clearance violations
Collisions Arm Operation # of collisions
PathErr Arm Operation Average squared distance between end effector tip and shortest path
Resets Arm Operation # of times subject manually reset the trail
Vernier Arm Operation Did subject engage vernier mode? (y/n)
Moving % Arm Operation % of time spent moving
Trans MA % Arm Operation % of time translating in 2+ axes
Rot MA % Arm Operation % of time rotating in 2+ axes
Bimanual % Arm Operation % of time translating & rotating
Align X, Y, Z Arm Operation Error along X, Y, Z axes from ideal final position
Align D Arm Operation Total distance error from ideal final position
Align P, Y, R Arm Operation Error in pitch, yaw, and roll from ideal final orientation
T_obs Arm Operation Time elapsed before first hand controller input
T_conf Arm Operation Time between final hand controller input and end of trial
T_coll Arm Operation Total time in collision state
DIMx,y,z Arm Operation Distance traveled away from target on each axis
DOFax Arm Operation Average number of axial DOF's used simultaneously
DOFang Arm Operation Average number of angular DOF's used simultaneously
Ax_Offs Arm Operation Radial distance between axes of docking ports
Ang_Offs Arm Operation Angular separation between axes of docking ports
Prep Time Cam. Selection Time elapsed before camera view selection
View Changes Cam. Selection # of changes made to each monitor
Cam Select Score Cam. Selection # of correct camera views at the end of trial
In addition to the measures above, researchers at MIT have the capability to investigate many other quantitative metrics. Extensive modification of the MVL DST simulation over time has allowed for the relatively easy extraction of a large number of variables from the program. Thus, it is a reasonably simple matter to select from and compare a wide range of performance metrics.

20
2.4 Effects of Feedback on Learning
Performance is best after a task is well-learned, and one of the most important factors influencing learning, other than practice itself, is feedback. Feedback here refers to “the transmission of evaluative or corrective information about an action, event, or process to the original or controlling source; also, the information so transmitted”13. For space telerobotics training, the process in question is the exercise of robotics skills; the controlling source is the human operator. In an experiment conducted using a computer simulation of the SRMS, Johnson et al. categorized two types of feedback: (1) performance-oriented and (2) learning-oriented. Performance-oriented feedback is feedback referring to task outcomes (success or failure), but lacking descriptive information addressing how to progress. Learning-oriented feedback is more informative, revealing outcomes and also recommending strategies for improvement [38]. It has been suggested that learning-oriented feedback leads to improved performance on complex tasks [39]. Given the complex nature of telerobotics, it is unsurprising that Johnson et al. found subjects’ performances best when learning-oriented feedback was provided. It must be noted, however, that performance was only improved in the dimensions that the feedback addressed [38]. Thus, it is crucial to consider what metrics it is most appropriate to reveal through feedback, as the operator will likely focus on those presented. In a study of the frequency of feedback affecting motor skill learning, Winstein and Schmidt considered a subset of feedback known as knowledge of results (KR) [40]. KR is information about task success, much like Johnson et al.’s performance-oriented feedback [38]; it is often revealed at the completion of a practice trial and serves as a foundation for adjustment in future trials. According to Winstein and Schmidt, the use of KR during a trial, instead of solely at its completion, may have both beneficial and detrimental effects. The beneficial effects concern KR as a basis for error correction, while the detrimental effects include a dependence the learner may develop with respect to the feedback [40]; performance may suffer when the feedback is removed or changed. Nicholson and Schmidt expanded on the negative aspects of too-frequent KR, noting that the attention-demanding aspects of feedback could prevent a learner from developing the capability to detect his or her own mistakes [41]. On the other hand, if no feedback is provided and a learner performs poorly, he or she may fail to identify the fact and practice improper technique. A balance is necessary with respect to both the type and the timing of feedback in order to maximize the positive effects of feedback on learning.
2.5 Learning Complex Skills
Over the past four decades, there has been a significant amount of research focused on acquiring new skills. Wulf and Shea authored a comprehensive review of research in motor learning, noting that most often the tasks used to examine the effects of interesting variables (such as the timing, type, and frequency of feedback) are simple, with the task restricted to one DOF, relatively little practice required
13 The term “feedback” originally was coined in the early days of radio electronics, and later formalized in information terms by Norbert Wiener. This definition is from the online Merriam-Webster Dictionary: http://www.merriam-webster.com/dictionary/feedback
21
to reach performance asymptotes, and relatively small demands made on each subject’s attention, memory, and processing capacity [42]. Of greater practical interest is the learning of complex skills, those which are “difficult to separate, analyze, or solve” and “composed of two or more parts” 13. In a book devoted to the subject of training, Van Merriënboer further developed the definition of “complex”, noting that not all of the constituent skills, or sub-skills, that make up a complex cognitive skill are performed in the same manner. Specifically, some sub-skills are executed as rule-based behaviors, more-or-less automatically, while others are carried out as controlled, schema-based behaviors [43]. The acquisition of complex skills, motor or cognitive, rule-based or schema-based, is almost always a lengthy, effortful process that requires the discovery of strategies and typically does not follow a classic exponential learning curve. High cognitive load is a key characteristic of complex tasks and often the limiting factor when it comes to rate of learning. As a result, many instructional methods that are effective for simple tasks are not effective for complex tasks, particularly concerning guidance and feedback [44]. A comparison of Schmidt’s 1991 study of physical guidance in a simple motor task [45] with Wulf et al.’s 1998 examination of physical guidance for complex movements in sports [46] suggests that the more complex the task, the more effective extensive physical guidance is as a learning tool. Regarding feedback, a 1996 study by Guadagnoli et al. indicated that the ideal number of trials before KR is presented is inversely related to task complexity; delayed feedback is most effective for simple tasks and immediate feedback is most effective for complex tasks. The optimal timing for feedback also varies with task experience, as a complex task requires less cognitive effort after it has been practiced and learned [47].
2.6 Feedback Modalities
There are numerous means by which information may be presented in addition to the written and verbal feedback of current GRT assessment. The vast majority of displays are visual or auditory, such as the billboards and television advertisements that are a part of everyday life. Tactual displays exist which convey information to the blind and are a useful tool when information must be gathered by feel. Olfactory and taste displays are less common [48]. A 2004 study by Bodnar et al. investigated the use of an olfactory display as a source of message notification. Smell proved to be less disruptive to user focus on the primary task, but was not as successful a notification mechanism as either the visual or auditory modalities [49]. The most effective display is one that communicates intended information in a clear and unambiguous manner. As a means for presenting metrics, a display should transmit only that which is most important so as to avoid overwhelming the user. For example, consider a driver sitting behind the wheel of a typical car. According to a 1981 patent, motor car dashboards are compact and only display measures corresponding to the most common fields of use [50]. Despite advances in vehicle and display technologies, 30 years later, car dashboards remain mainly limited to that which is deemed essential. Readings of speed and fuel are continuous, but the driver is not subjected to regular display of metrics such as tire pressure, the weight of the vehicle, wiper fluid volume, etc. It is important to avoid overburdening the individual at the controls in order to enable safe and efficient vehicle operation.

22
Dashboards also appear in many business applications; the term is commonly applied to advanced forms of the Executive Information System (EIS) first developed in the 1980s. An EIS is a simple interface displaying a small number of relevant financial measures to business executives [51]. The more current form, a “performance dashboard”, is an information system that ideally communicates objectives, metrics, and tasks to all individuals in a company, focusing workers with timely and relevant information in order to best advance strategies and goals [52]. As argued by Harbour, the ability to quantitatively measure and display aspects of performance is critical to achieving desired performance objectives [53]. A poorly designed implementation, however, may be worse than having no dashboard at all. Schiff emphasizes that a performance dashboard is nothing more than a tool; it is the content that is measured and displayed that is most important [54]. On the contrary, if conveyed in a complicated manner, even with the most critical metrics identified, performance may suffer. Thus, as Few concludes: the most effective dashboard is a product of informed design- “more science than art, more simplicity than dazzle” [51]. The key to the perfect dashboard is to measure and display the most essential metrics in the most clear and simple manner.

23
3 Objective and Hypotheses
3.1 Objective
This thesis research project was designed to: (1) consider the variety of quantitative metrics that could be embedded into a space robotics training simulation, and (2) investigate at what point and by what means it is most constructive for performance assessment to be revealed to an operator-in-training. We reviewed metrics and evaluation techniques used in a variety of real-world and experimental teleoperation settings, aiming to identify and implement several which would most improve NASA robotics training. To instantiate our ideas, we chose a specific “fly-to” space telerobotics task taught in the early phases of NASA GRT, when trainees are taught to maneuver the arm using more than one degree of freedom simultaneously so as to reduce task completion time. We developed a simple measure of multi-axis utilization and then conducted a pilot experiment to test when and by what modality it is most valuable for skill assessment to be presented in training.
3.2 Motivation/Focus
After considering the current evaluation means of NASA GRT, we identified certain weaknesses, including reliance on human instructors and scoring subjectivity, which we addressed by introducing quantitative metrics into the robotics simulation. We did not believe it practical to replace human evaluators, who are able to adapt to and relate to students, but we intended to enhance the system by embedding quantitative metrics to improve the efficiency and effectiveness of training and grading. GRT is complex, with numerous modules and skill emphases. For this experiment, we selected a specific task and particular metrics relevant to telerobotics training and operation. Subjects completed fly-tos (detailed in Section 4.2), moving a simulated robotic arm from an initial location to a final location near to and aligned with a target. After discussion with a robotics trainer at JSC, we selected multi-axis movement percentage as the main performance metric to manipulate with feedback. Multi-axis input, resulting in simultaneous motion in 2 or more of the 6 possible axes (translation: up/down, starboard/port, forward/after; rotation: pitch, yaw, roll), is often encouraged during GRT. There is no specific time when it is most desired—that depends both on the task and the student—but multi-axis input, used properly, ultimately results in more efficient robotic arm operation [8]. Our embedded quantitative metrics allowed us to objectively evaluate more than just multi-axis movement percentage. Although the live performance feedback (detailed in Section 4.3) addressed solely that metric, we also evaluated performance based on average movement time and overall smoothness, with significant penalties applied for flight-rule violations14. These measures are also emphasized and monitored during GRT. We created feedback displays to communicate multi-axis movement information unambiguously. Given the complexity of the telerobotics task, we hoped to convey feedback without distracting the operator, so
14 Flight-rule violations included clearance violations, collisions, hard-stops, singularities, and arm resets.

24
we explored alternative visual and aural feedback modalities. We chose to present performance-oriented feedback rather than learning-oriented feedback, as strategies for improvement were unnecessary when the feedback conveyed just a single metric. Made aware of the arm moving in only one axis, subjects could introduce motion in another axis if they deemed such motion desirable in achieving the task goal. Future experiments may be designed to investigate other relevant performance metrics and feedback displays, further discussed in Section 6.5.
3.3 Hypotheses
We hypothesized that: � The performance of all subjects would improve over the course of the experiment in each
parameter addressed by live and post-trial feedback15. � Less experienced subjects would show greater improvement with trial number and trial repetition
than more experienced subjects in all parameters fed-back. � Greater performance with respect to presented metrics would occur during trials with live
feedback than during trials when feedback was only revealed at trial completion. � Subjects would prefer visual feedback over aural feedback, but would perform best with aural
feedback—likely due to the excessively visually demanding nature of the robotics task. � Responsiveness to live feedback would differ with subject experience level, with more
experienced subjects having greater spare capacity and thus greater ability to adjust multi-axis performance based on real-time feedback.
� Subjective ratings of performance (reflecting the process by which astronauts are evaluated during GRT) would be correlated with rankings of performance created from the objectively measured quantities.
15 Performance was defined by several metrics including movement time to complete a task, percentage of multi-axis movement, input smoothness, and occurrence of flight rule violations (including clearance violations, collisions, joint angle limits and singularities). Live feedback addressed multi-axis movement; post-trial feedback reflected trial time, planning time, percentage of multi-axis movement, and flight rule violations.

25
4 Methods
4.1 Virtual Environment
For this experiment, we modified a simulation used in previous MVL studies [18, 35-37], originally based on the BORIS environment of GRT. The ultimate simulation was a virtual mockup of the ISS (Figure 7) with a 17-meter long, 6-DOF robotic arm representing the SSRMS. Two fixed cameras provided a top-down and side-view of the ISS truss, modules, robotic arm, and a target, floating in space. A third camera, mounted on the end-effector, provided a task-view.
Figure 7: Virtual Mockup of the ISS
Subjects controlled the robotic arm using the two, 3-axis joysticks of the MVL Robotics Workstation, pictured and described in section 2.3.3. The translational hand controller (THC) was manipulated with the left hand and could be moved up/down, right/left and forward/backward, causing the end-effector to respectively move up/down, starboard/port and forward/aft in the ISS environment (Figure 8). The rotational hand controller (RHC) was manipulated with the right hand; movement along the 3 axes, right/left, forward/backward and twist respectively caused roll, pitch and yaw of the arm about the tip of the end-effector (Figure 9). Inverse kinematics were calculated using the RRG Kinematix v.4 plug-in from the Robotics Research Group at the University of Texas.
Figure 8: THC and Corresponding Environment Axes

26
4.2 Task
During each trial, subjects were asked to perform a “fly-to” maneuver, repositioning the end-effector from an initial configuration to a final placement, 1.5-2.5 meters from a target box and within 10 degrees of proper orientation. Subjects were made aware of the length of the end-effector (1 meter) and were thus able to reasonably approximate distances. When correctly aligned, the end-effector was roughly 2 meters away from and perpendicular to the top surface of the target, as in Figure 10. Each trial concluded automatically upon either the end-effector reaching this goal position or after 5 minutes had elapsed.
Figure 10: Fly-to Goal Subjects were trained to make smooth controller inputs while flying, minimizing task duration by initiating multi-axis movements whenever possible. Subjects were instructed to maintain awareness of flight rules, monitor clearance16 from structure and from targets, and to avoid collisions, joint angle limits (hard-stops), and singularities. Subjects were given the ability to reset the arm to its initial configuration, but they were instructed that to do so would hurt their performance score. Throughout the experiment, camera views remained consistent, with a top-down view, a side view, and the end-effector view presented on the three monitors of the Robotics Workstation. Trials varied only in the location of the target box and in the initial configuration of the arm. There were 6 different trials repeated 4 times throughout the experiment, once with each assigned feedback display condition.
4.3 Display Conditions
Four unique display conditions were assigned to every subject: (1) live, visual feedback; (2) live, aural feedback; (3) no live feedback; and (4) either a combination of live visual and aural feedback, or a small
16 A clearance limit of 0.6 meters was used in this experiment, as during GRT.
Figure 9: RHC and Corresponding Environment Axes

27
visual dashboard in the upper left corner of the leftmost monitor. After the completion of every trial, all subjects received additional feedback in the form of an on-screen dialogue box reflecting trial time, planning time, percentage of multi-axis movement, and flight rule violations. Each display condition was paired with each of the fly-to tasks one time, resulting in 24 total trials. For the purpose of this experiment, as explained in Section 3.2, we selected percentage of multi-axis movement as the metric to manipulate through the use of feedback displays. The following table (Table 4) details the manner by which each display condition reflected multi-axis movement. Display conditions were created to communicate feedback in a clear, unambiguous manner.
Display Condition Description
Live, visual feedback
The robotic arm changed color according to the degree of control input; the arm was white with no input, yellow with single-axis input, and green (desirable state) with multi-axis input.
Live, aural feedback
A constant tone sounded if input was made in only a single axis at a given time. The noise stopped when either motion ceased or motion was added in at least one additional axis.
No live feedback
No additional display was presented reflecting live, multi-axis movement.
Combined live visual and aural feedback
The robotic arm changed color according to the degree of control input and a constant tone sounded if input was made in only a single axis at a given time, as in the cases of live, visual feedback and live, aural feedback above.
Live, visual dashboard
A multi-axis indicator as pictured below appeared in the upper left corner of the left-most monitor. The bars were filled either 0, 1/3, 2/3, or 3/3 based on how many of the 3 axes of rotation and translation were in use at any time. The bars were green during multi-axis input and yellow during single-axis input.
In the illustrated case, the subject was inputting translation in 2 axes and rotation in none.
Table 4: Multi-Axis Display Condition Descriptions

28
4.4 Performance Metrics
Throughout each trial, data files were created charting the position of the end-effector, the value of the joint angles, and all controller inputs. Additionally, flight-rule violations including clearance violations, collisions, hard-stops, singularities, and arm resets were recorded. After each trial, variables characterizing the subject’s performance were calculated, summarized and saved for analysis (Table 5).
Metric Description Recorded Calculated
Trial Time Total time (sec) from trial loading to trial completion X
Planning Time Total time (sec) from trial loading until brake initially released
X
Movement Time Total time (sec) during which the arm was moving X
Collisions Number of time the arm hit itself, a target, or ISS structure X
Clearance Number of time that a part of the arm was within 0.6m of a target or ISS structure
X
Hardstops Number of times the subject reached a hardstop X
Singularities Number of times the subject reached a singularity X
Resets Number of times the subject pressed the button to reset the arm to its initial configuration
X
Violations Used to indicate whether any flight-rule violations occurred (1 if yes, 0 if no)
X
Full Bimanual % Percentage of moving time throughout the entire trial during which the arm was translating and rotating
X
Full Multi-axis % Percentage of moving time throughout the entire trial during which the arm was moving or rotating about at least 2 axes
X
Bimanual % Percentage of moving time throughout the first ¾ of the trial during which the arm was translating and rotating
X
Multi-axis % 17 Percentage of moving time throughout the first ¾ of the trial during which the arm was moving or rotating about at least 2 axes
X
RotJerk Count Number of times input on the rotational controller exceeded the rotational smoothness limit (described on following page)
X
TransJerk Count Number of times input on the translational controller exceeded the translational smoothness limit
X
RotJerk Ratio (RotJerk Count) / (Movement Time) X
TransJerkRatio (TransJerk Count) / (Movement Time) X
17 Multi-axis movement percentage herein mentioned refers to this “Multi-axis %” performance metric. We omitted the final quarter of the trial from analysis in order to eliminate the alignment period of the task during which multi-axis movement is often not required. Similarly, bimanual movement percentage herein mentioned refers to the “Bimanual %” performance metric above.
Table 5: Measures of Performance

29
A smoothness limit was set for both rotation and translation, defining the maximum acceptable rate of change of controller input. Jerky motion of a real robotic arm can induce oscillations, and is thus discouraged. To determine the rate of change of controller input, we wrote a function in Vizard that tracked the position of both hand controllers. The average of the last three controller inputs (for each pitch, yaw, roll and x, y, z) was compared to the average of the three immediately preceding corresponding controller inputs. A difference in excess of the smoothness limit led to an increase in the appropriate count, RotJerk Count or TransJerk Count above. Subjects were incentivized in order to encourage full effort on each trial—a $15 bonus was given to the subject with the overall best performance. “Best performance” was defined as a function of average movement time, average multi-axis movement percentage, and overall smoothness, with significant penalties applied for flight-rule violations. Objective measures of smoothness were determined by the “TransJerkRatio” of Table 5; the smaller the TransJerkRation, the more smooth the translational control input during a trial. Subjects were awarded points based on their individual rankings within each of these evaluated parameters, and the subject with the greatest overall point total received the monetary reward. These metrics were selected for evaluation due both to their relevance to ISS robotic arm operation and emphasis during GRT. In addition to the objective metrics recorded, subjective evaluation of each participant was made by the trainer immediately following the experimental session. The trainer was blind to post-trial objective scores and assigned participants either a plus, check or minus based solely on observation of performance in the categories of movement time, multi-axis movement percentage, and smoothness.
4.5 Subjects
We tested a total of 18 participants (9 male, 9 female), 16 of whom completed the full protocol. We discarded the data from the one male and one female subject who were unable to finish the entire experiment. All subjects were affiliated with the Aeronautics and Astronautics Department at MIT—one subject a research scientist (age 46), and the remainder graduate students (ages 23-27). Subjects were grouped according to experience level: 7 subjects were naïve, having never before flown a robotic arm simulator, 5 subjects had previously participated in MVL robotics experiments, and 4 subjects had previously received abbreviated GRT training at Johnson Space Center (Experience Level 0, 1, 2 respectively). Table 6 outlines the demographics of the participants. Subjects with a “” instead of a numerical MRT Score were overly familiar with the answers to the MRT, having graded the spatial abilities test too many times to be able to take the test objectively themselves.

30
Subject # Gender Age Experience Level
MRT Score 0 1 2
0 M 25 x 33
1 F 23 x 15
2 F 23 x
3 F 23 x
4 F 25 x 22
5 M 27 x 33
6 F 24 x 25
7 M 24 x 19
8 M 23 x 38
9 M 26 x 20
10 M 27 x 26
11 F 24 x
12 F 23 x 14
13 M 26 x 36
14 M 46 x 32
15 F 26 x 16
4.6 Procedure
The experimental protocol was reviewed and approved by MIT’s Committee on the Use of Humans as Experimental Subjects (COUHES). The study consisted of 1 laboratory session of no more than 3.5 hours duration, with the following timing approximations:
• 10 minutes- The subject took a spatial ability test, the Vandenberg Mental Rotation Test (MRT) (Appendix D).
• 45 minutes- The subject completed training consisting of a PowerPoint tutorial (Appendix E) and brief practice fly-to tasks, using the two joysticks and three monitors of the Robotics Workstation.
• 5 minutes- A short break was given between the training and the experiment trials.
• 120 minutes- The subject completed the experiment, performing fly-to tasks in a virtual ISS environment either with or without real-time feedback displayed. Periodic breaks were given between trials.
Subjects were paid $10 per hour or part thereof, with an additional $15 bonus for the subject with the overall best performance.
Table 6: Subject Demographics
31
5 Results
5.1 Qualitative and Quantitative Performance Evaluation
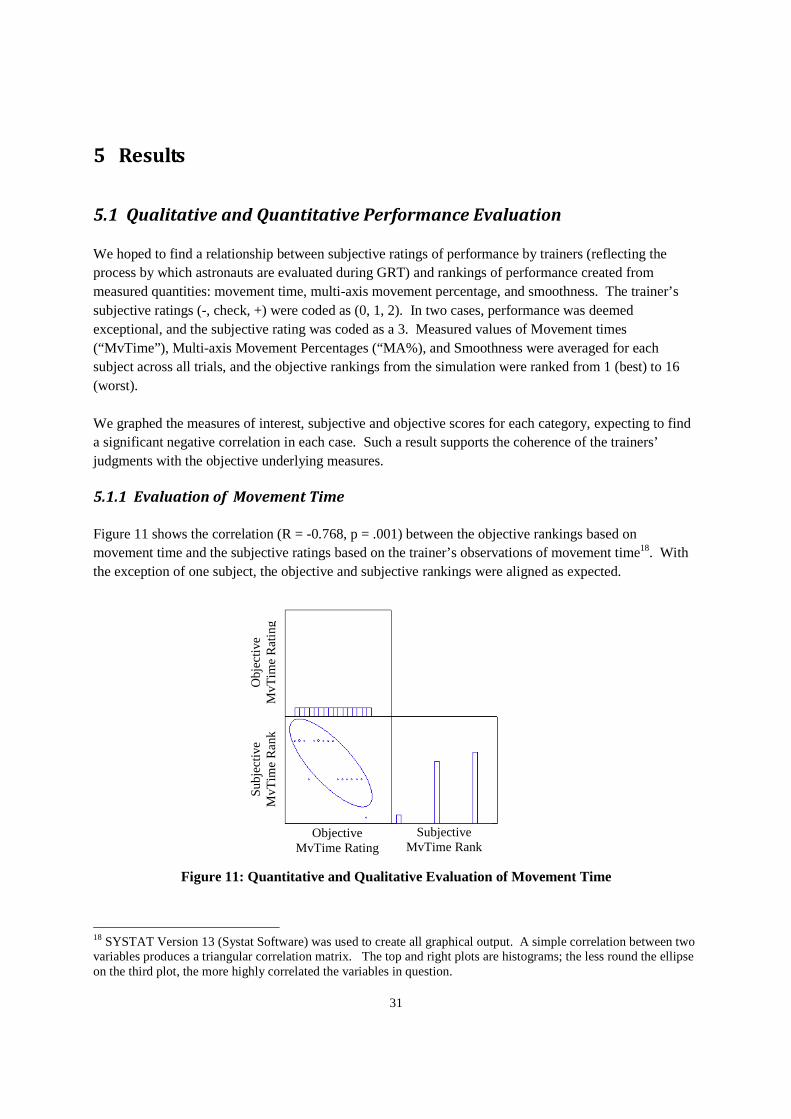
We hoped to find a relationship between subjective ratings of performance by trainers (reflecting the process by which astronauts are evaluated during GRT) and rankings of performance created from measured quantities: movement time, multi-axis movement percentage, and smoothness. The trainer’s subjective ratings (-, check, +) were coded as (0, 1, 2). In two cases, performance was deemed exceptional, and the subjective rating was coded as a 3. Measured values of Movement times (“MvTime”), Multi-axis Movement Percentages (“MA%), and Smoothness were averaged for each subject across all trials, and the objective rankings from the simulation were ranked from 1 (best) to 16 (worst). We graphed the measures of interest, subjective and objective scores for each category, expecting to find a significant negative correlation in each case. Such a result supports the coherence of the trainers’ judgments with the objective underlying measures.
5.1.1 Evaluation of Movement Time Figure 11 shows the correlation (R = -0.768, p = .001) between the objective rankings based on movement time and the subjective ratings based on the trainer’s observations of movement time18. With the exception of one subject, the objective and subjective rankings were aligned as expected.
Figure 11: Quantitative and Qualitative Evaluation of Movement Time
18 SYSTAT Version 13 (Systat Software) was used to create all graphical output. A simple correlation between two variables produces a triangular correlation matrix. The top and right plots are histograms; the less round the ellipse on the third plot, the more highly correlated the variables in question.
Subjective
MvTime Rank
Su
bjec
tive
M
vTim
e R
ank
O
bjec
tive
M
vTim
e R
atin
g
Objective MvTime Rating

32
5.1.2 Evaluation of Multi-axis Movement Percentage
The analysis performed on Movement Time was repeated on Multi-axis Movement Percentage (MA%), with the results shown in Figure 12. A significant correlation was found between the objective rankings based on multi-axis movement and the subjective ratings based on the trainer’s observations of multi-axis movement (R = -0.574, p = .020).
Figure 12: Quantitative and Qualitative Evaluation of Multi-axis Movement Percentage
5.1.3 Evaluation of Smoothness
The same test performed on input Smoothness found a highly significant correlation between the objective rankings based on smoothness and the subjective ratings based on the trainer’s observations of input smoothness (R = -0.877, p < .0005).
Figure 13: Quantitative and Qualitative Evaluation of Smoothness
No significant correlations were found between any other objective or subjective pairs of rankings.
Subjective
MA% Rank
Su
bjec
tive
M
A%
Ra
nk
Obj
ectiv
e
MA
% R
atin
g
Objective MA% Rating
Subjective Smoothness Rank
Obj
ectiv
e
Sm
oot
hne
ss
Rat
ing
Objective Smoothness
Rating
Su
bjec
tive
S
mo
oth
ness
Ra
nk

33
5.2 Learning Effects
The effects that follow were—unless otherwise stated—analyzed by hierarchical linear regressions (with Subject as a random effect) performed on the measured variables with a variety of linear models for Movement Time, Multi-axis Movement Percentage, Bimanual Movement Percentage, and Input Smoothness. Before analysis, these variables were transformed either to their log (e.g., Movement Time), or by an arcsine transformation y’ = (1/2)(arcsin(√y)) for the variables whose range is (0,1) (e.g., Multi-axis Movement Percentage and Bimanual Movement Percentage). These models incorporate Experience Level, Gender, Display Condition, Trial Number and Trial Repetition. In each case, residuals from the fit were tested for normality by Kolmogorov Smirnov (KS) 1-sample test19 and for stable variance by Levene’s Test, with 3 slices. All tests were carried out using SYSTAT Version 13 (Systat Software). We expected the performance of all subjects to improve over the course of the experiment, but we expected less-experienced subjects to show greater improvement (steeper slope against Trial Number and Trial Repetition) than more experienced subjects. Subjects were divided by level of prior experience with telerobotics: (None [“New”], Previous participation in an MVL telerobotics study [“MIT-trained”], and (shortened) Generic Robotics Training (GRT) at JSC [“JSC-trained”].) Each subject completed 24 trials (Trial Number)—six distinct fly-tos, four times each (Trial Repetition).
5.2.1 Movement Time
Figure 14: Movement Time by Experience Level and Trial Number A mixed hierarchical regression was performed on the dependent variable Movement Time. Experience Level, Gender, and Display Condition were treated as fixed categorical effects, having a zero-sum over
19 W.J. Conover, Practical Nonparametric Statistics, Third Edition, p.428. Wiley, New York, 1999
0 1 2
LEVEL
0
50
100
150
MV
TIM
E
210
LEVEL
0 8 16 24
TRIALNUM
0
50
100
150
MV
TIM
E
0: New 1: MIT-trained 2: JSC-trained
0 8 16 24
TRIALNUM
0
50
100
150
MV
TIM
E

34
their (3, 2, 3) levels respectively20. The effect of a level that is listed in the tables provided below is the excess of its mean above the mean of all levels. By contrast, the effect of a continuous variable, x, is given as the slope found by the analysis for the measured dependent variable, y, against that x. For example, Trial Repetition (TrialRep) with 4 levels and Trial Number (TrialNum) with 24 levels are treated as continuous (not categorical) variables.
Variable: X_Movement_Time Estimate Standard ErrorZ p-ValueINTERCEPT 3.846 0.086 44.619 0.000 Experience Level: New 0.301 0.105 2.860 0.004 Experience Level: MIT-trained -0.113 0.114 -0.991 0.322 Experience Level: JSC-trained -0.188 0.120 -1.561 0.118 TRIALNUM -0.012 0.003 -4.197 0.000
Table 7: The Effect of Experience Level and Trial Number on Movement Time
• Experience level had a significant effect on movement time; the least experienced subjects had
significantly longer movement times—shown above—than the mean (p = .004), but there was no significant difference between the (shorter-than-average) movement times of the other two experience groups.
• The effect of Trial Number on Movement Time was highly significant (p < .0005) and negative: the movement time decreased approximately 0.5 seconds on the average per Trial Number.
• We expected the effect of Trial Number to be different on subjects of different Experience Level, but that cross-effect of Experience Level and Trial Number was not significant.
5.2.2 Multi-axis Movement Percentage
Figure 15: Multi-axis Movement Percentage by Experience Level and Trial Number
20 The 3 levels of Display Condition treated in this analysis (“No live feedback”, “Live, visual feedback”, and “Live, aural feedback”) are discussed further in Section 5.3. Neither the combination of live visual and aural feedback nor the live, visual dashboard condition significantly affected any aspect of performance.
0 1
GENDER
30
40
50
60
70
80
90
100
110
MA
_PE
RC
EN
T
210
LEVEL
0 8 16 24
TRIALNUM
30
40
50
60
70
80
90
100
110
MA
_PE
RC
EN
T
0: New 1: MIT-trained 2: JSC-trained
GENDER
0: Female 1: Male
0 8 16 24
TRIALNUM
30
40
50
60
70
80
90
100
110
MA
_PE
RC
EN
T

35
A corresponding mixed hierarchical regression of Multi-axis Movement Percentage was performed against fixed effects of Experience Level, Gender, and Trial Number. In presenting fixed effects of variables (e.g., Gender) with two levels, only the effect of one level is shown (e.g., Female, below). The effect of the other level (e.g., Male) is inferred by subtraction21.
Variable: X_Multi-axis_Movement_Percentage EstimateStandard ErrorZ p-ValueINTERCEPT 0.561 0.012 45.8750.000 Experience level: New -0.036 0.013 -2.772 0.006 Experience level: MIT-trained -0.031 0.016 -1.956 0.050 Experience level: JSC-trained 0.067 0.016 4.252 0.000 GENDER (Female) -0.039 0.011 -3.596 0.000 TRIALNUM 0.003 0.001 3.810 0.000
Table 8: The Effect of Experience Level, Gender and Trial Number on Multi-axis Movement
Percentage
• The least experienced subjects used significantly less multi-axis movement than the average (p = .006), and the most experienced used significantly more (p < .0005).
• There was a strong effect of Gender on Multi-axis Movement Percentage; women used significantly less multi-axis movement than the average (p < .0005).
• Trial Number showed a significant average increase of Multi-axis Movement Percentage with fly-to trial (p < .0005).
• Neither the cross-effect of Experience Level and Trial Number nor the cross-effect of Gender and Trial Number on Multi-axis Movement Percentage was significant.
5.2.3 Bimanual Movement Percentage
Figure 16: Bimanual Movement Percentage by Gender and by Experience Level
21 All fixed effects have 0-sum over the levels of the underlying categorical variable.
0 1 2
LEVEL
0
10
20
30
40
50
60
70
80
90
100
BI_
PE
RC
EN
T
0 1
GENDER
0
10
20
30
40
50
60
70
80
90
100
BI_
PE
RC
EN
T
LEVEL
0: New 1: MIT-trained 2: JSC-trained
GENDER
0: Female 1: Male

36
A corresponding mixed hierarchical regression of Bimanual Movement Percentage was performed against fixed effects of Experience Level, Gender, Trial Number, and Trial Repetition.
Variable: X_Bimanual_Movement_Percentage Estimate Standard ErrorZ p-ValueINTERCEPT 0.377 0.021 18.291 0.000 Experience level: New -0.024 0.026 -0.931 0.352 Experience level: MIT-trained -0.067 0.031 -2.182 0.029 Experience level: JSC-trained 0.091 0.031 2.927 0.003 GENDER (Female) -0.056 0.021 -2.628 0.009 TRIALREP 0.012 0.005 2.563 0.010
Table 9: The Effect of Experience Level, Gender, Trial Repetition and Trial Number on Bimanual Movement Percentage
• The most experienced subjects, those JSC-trained, had a significantly higher percentage of
bimanual movement than the mean (p = .003), while those who were previously MIT-trained had a significantly lower percentage (p = .029). New subjects gave average results.
• There was a significant effect of Gender on Bimanual Movement Percentage (p = .009); females showed lower values, males higher.
• Trial Repetition had a significant effect on Bimanual Movement Percentage: there was a significant average increase of Bimanual Movement Percentage with trial repetition (p = 0.010).
• The direct effect of Trial Number alone (in a separate analysis that did not include Trial Repetition) also showed its effect to be a significant average increase (p = 0.012).
• None of the cross-effects of Experience Level or Gender and Trial Repetition or Trial Number were significant on Bimanual Movement Percentage.
5.2.4 Smoothness
Figure 17: Smoothness by Experience Level, Trial Number, and Trial Repetition
0 1 2
LEVEL
0
1
2
3
4
5
6
7
8
9
TJ_
RA
TIO
0 8 16 24
TRIALNUM
0
1
2
3
4
5
6
7
8
9
TJ_
RA
TIO
210
LEVEL
0 1 2 3
TRIALREP
0
1
2
3
4
5
6
7
8
9
TJ_
RA
TIO
0: New 1: MIT-trained 2: JSC-trained
Most smooth
Least smooth
0 8 16 24
TRIALNUM
0
1
2
3
4
5
6
7
8
9
TJ_
RA
TIO
0 1 2 3
TRIALREP
0
1
2
3
4
5
6
7
8
9
TJ_
RA
TIO
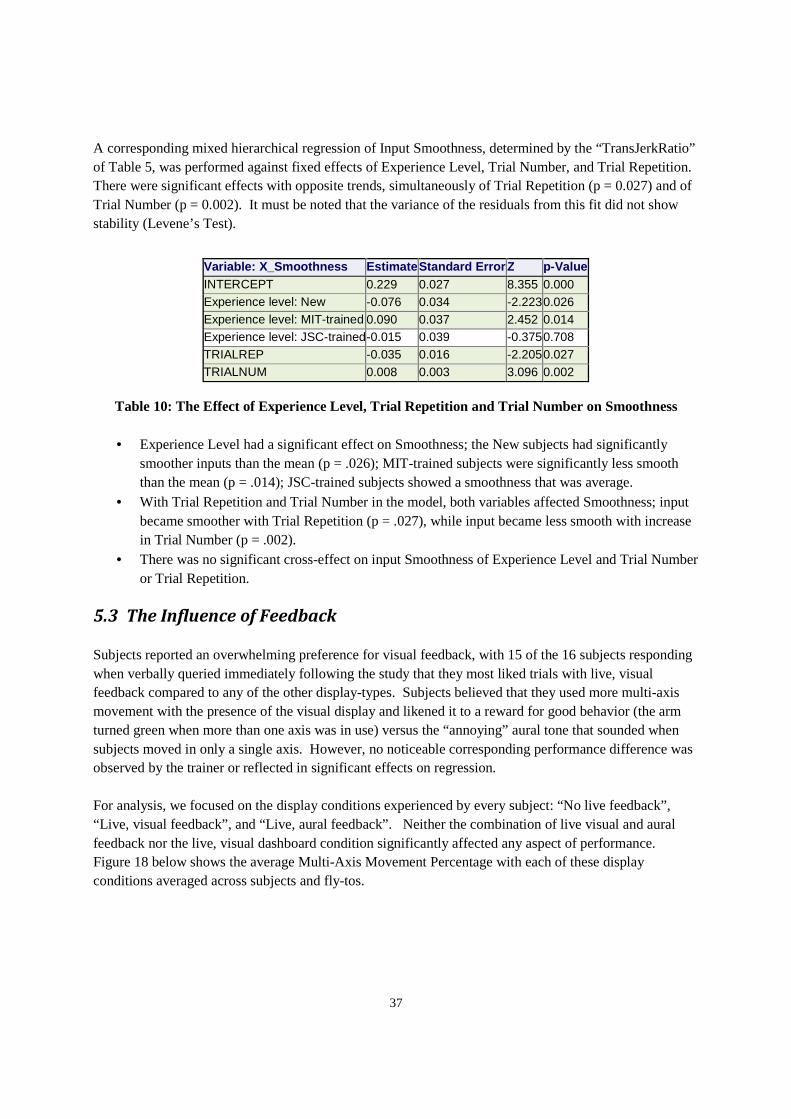
37
A corresponding mixed hierarchical regression of Input Smoothness, determined by the “TransJerkRatio” of Table 5, was performed against fixed effects of Experience Level, Trial Number, and Trial Repetition. There were significant effects with opposite trends, simultaneously of Trial Repetition (p = 0.027) and of Trial Number (p = 0.002). It must be noted that the variance of the residuals from this fit did not show stability (Levene’s Test).
Variable: X_Smoothness EstimateStandard ErrorZ p-Value INTERCEPT 0.229 0.027 8.355 0.000 Experience level: New -0.076 0.034 -2.2230.026 Experience level: MIT-trained 0.090 0.037 2.452 0.014 Experience level: JSC-trained-0.015 0.039 -0.3750.708 TRIALREP -0.035 0.016 -2.2050.027 TRIALNUM 0.008 0.003 3.096 0.002
Table 10: The Effect of Experience Level, Trial Repetition and Trial Number on Smoothness
• Experience Level had a significant effect on Smoothness; the New subjects had significantly smoother inputs than the mean (p = .026); MIT-trained subjects were significantly less smooth than the mean (p = .014); JSC-trained subjects showed a smoothness that was average.
• With Trial Repetition and Trial Number in the model, both variables affected Smoothness; input became smoother with Trial Repetition (p = .027), while input became less smooth with increase in Trial Number (p = .002).
• There was no significant cross-effect on input Smoothness of Experience Level and Trial Number or Trial Repetition.
5.3 The Influence of Feedback
Subjects reported an overwhelming preference for visual feedback, with 15 of the 16 subjects responding when verbally queried immediately following the study that they most liked trials with live, visual feedback compared to any of the other display-types. Subjects believed that they used more multi-axis movement with the presence of the visual display and likened it to a reward for good behavior (the arm turned green when more than one axis was in use) versus the “annoying” aural tone that sounded when subjects moved in only a single axis. However, no noticeable corresponding performance difference was observed by the trainer or reflected in significant effects on regression. For analysis, we focused on the display conditions experienced by every subject: “No live feedback”, “Live, visual feedback”, and “Live, aural feedback”. Neither the combination of live visual and aural feedback nor the live, visual dashboard condition significantly affected any aspect of performance. Figure 18 below shows the average Multi-Axis Movement Percentage with each of these display conditions averaged across subjects and fly-tos.

38
Figure 18: Multi-axis Movement Percentage by Display-Type
Although Display-Type had no significant effect on performance across all subjects on the average, response to feedback did seem to differ by Experience-Level: No significant effect of Display-Type was seen with New subjects, but MIT- and JSC-trained subjects appear to have had a higher percentage of Multi-axis Movement with live feedback (Figure 19).
Figure 19: Multi-axis Movement Percentage by Display-Type, Grouped by Level
An effect of Gender on response to Display-Type was also apparent graphically: women were little affected by Display-Type, but men appear to have had a higher percentage of Multi-axis Movement when live feedback was present (Figure 20).
Display-Type Key 0 – No live feedback 1 – Live, visual feedback 2 – Live, aural feedback
Display-Type
30
40
50
60
70
80
90
100
110
MA
_PE
RC
EN
T
0 1 2
Mul
ti-A
xis
Mo
vem
ent
Per
cent
age
210
LEVEL
70
75
80
85
90
95
ME
1MA
_PE
RC
EN
T
Display-Type Key 0 – No live feedback 1 – Live, visual feedback 2 – Live, aural feedback Level-Type Key New, no previous training previously MIT-trained previously JSC-trained
Display-Type 0 1 2
Mul
ti-A
xis
Mo
vem
ent
Per
cent
age

39
Figure 20: Multi-axis Movement Percentage by Display-Type, Grouped by Gender
A mixed hierarchical regression (Subject is treated as a random effect) was used to test cross-effects of Display Type and Experience Level and Display Type and Gender on Multi-axis Movement Percentage. Experience Level, Trial Number and Gender are treated as fixed effects.
Variable: X_Multi-axis_Movement_Percentage Estimate Standard Error Z p-Value INTERCEPT 0.562 0.012 46.107 0.000 Experience level: New -0.036 0.013 -2.766 0.006 Experience level: MIT-trained -0.031 0.016 -1.962 0.050 Experience level: JSC-trained 0.067 0.016 4.251 0.000 TRIALNUM 0.002 0.001 3.694 0.000 GENDER (Female) -0.039 0.011 -3.600 0.000 Display x gender: none, women 0.010 0.007 1.300 0.194 Display x gender: visual, women -0.012 0.007 -1.596 0.111 Display x gender: aural, women 0.002 0.007 0.296 0.767 Display x level: none, new 0.013 0.009 1.497 0.134 Display x level: none, MIT-trained -0.009 0.011 -0.813 0.416 Display x level: none, JSC-trained -0.004 0.010 -0.385 0.700 Display x level: visual, new -0.011 0.009 -1.310 0.190 Display x level: visual, MIT-trained 0.002 0.011 0.225 0.822 Display x level: visual, JSC-trained 0.009 0.010 0.841 0.400 Display x level: aural, new -0.002 0.009 -0.187 0.852 Display x level: aural, MIT-trained 0.006 0.011 0.589 0.556 Display x level: aural, JSC-trained -0.005 0.010 -0.456 0.649
Table 11: Investigating the Effect of Display-Type on Multi-axis Movement Percentage
Certain cross-effects were close to significant at the p < 0 .1 level, but not at the p < 0.05 level. These are effects that might be found significant in another, larger study: Men with a visual display showed more multi-axis movement than the mean, women less; Subjects with no previous training showed greater percentage of multi-axis movement than the mean when no feedback display was present.
Mul
ti-A
xis
Mov
emen
t P
erce
ntag
e
0 1 2
Display-Type
- Female - Male 1
0
GENDER
-0.5 0.1 0.7 1.3 1.9 2.575
80
85
90
ME
1MA
_PE
RC
EN
T
Display-Type Key 0 – No live feedback 1 – Live, visual feedback 2 – Live, aural feedback

40
Multi-axis Movement Percentage—especially for males and for subjects previously trained at either MIT or JSC— was similar with visual and aural feedback (Figure 19, 20). The variable (Feedback) was created to indicate the presence of either form of live feedback, visual or aural, regardless of Display-Type. A mixed hierarchical regression (Subject treated as a random effect) with fixed effects of Experience Level, Trial Number, Gender, and Feedback showed no significant effect of Feedback alone on Multi-axis Movement Percentage (p = .168). The cross-effect of Feedback and Gender also was not significant on Multi-axis Movement Percentage (p = .169). The complete model is shown in Table 12.
Variable: Multi-axis Movement Percent EstimateStandard ErrorZ p-ValueINTERCEPT 0.562 0.012 46.0220.000 Experience level: New -0.032 0.013 -2.461 0.014 Experience level: MIT-trained -0.035 0.016 -2.185 0.029 Experience level: JSC-trained 0.067 0.016 4.224 0.000 TRIALNUM 0.002 0.001 3.682 0.000 GENDER -0.039 0.011 -3.599 0.000 Feedback x level: none, New 0.011 0.006 1.661 0.097 Feedback x level: none, MIT-trained -0.012 0.007 -1.639 0.101 Feedback x level: none, JSC-trained 0.001 0.007 0.144 0.886
The cross-effect of Feedback and Experience Level (New) was significant at the p < 0 .1 level: New subjects had significantly higher Multi-axis Movement Percentage than the mean when no feedback was present and significantly lower when live feedback was present (p = .097). The cross-effect of Feedback and Experience Level (MIT-trained) was close to significant at the p < 0 .1 level: MIT-trained subjects had lower Multi-axis Movement Percentage than the mean without feedback and inputted more multi-axis movement when feedback was present. Subjects previously trained at JSC showed no significant effect of live feedback.
5.4 Spatial Ability, Gender, and Robotics Performance
The MRT scores for the experimental subjects are shown in Table 13, along with those for the NASA astronauts (n = 40) tested by Liu et al in a previous study [55]. We omitted three subjects who, by having graded the test several times, were atypical of the subject sample.
N Median Mean SD Max Min Test Population 13 25 25.31 8.05 38 14 Astronaut Group 40 17.28 8.74
Table 13: MRT Score Descriptive Statistics
Our test population had significantly higher MRT scores than the astronauts (t = 2.74, p < .01), by a two-sample t-test. We separated the 13 experimental subjects for which we had MRT scores into Low (MRT < 30) and High (MRT ≥ 30) categories by the natural gap in the distribution (indicated by the dashed line
Table 12: Investigating the Effect of Feedback on Multi-axis Movement Percentage

41
in Figure 21). These ‘Low’ spatial abilities scores are low only within this small sample, not necessarily as compared to the general population, or to any other pool.
Figure 21: Histogram of Subject MRT Scores
We expected subjects in the High spatial ability category to have lower movement time, higher multi-axis movement percentage, and higher bimanual movement percentage than subjects in the Low category. We did not predict any effect on input smoothness. We performed mixed hierarchical regressions on dependent variables: Movement Time, Multi-axis Movement Percentage, Bimanual Movement Percentage, and Smoothness. Spatial Ability Category showed no significant effect on transformations of those measured quantities, but we did find significant effects of Gender on Multi-axis Movement Percentage and on Bimanual Movement Percentage (as detailed in Sections 5.2.2, 5.2.3, and 5.3 above). By the nonparametric Kruskal-Wallis Test, the men and women in this study had significantly different MRT score levels (p = .0005), and thus were categorized into significantly different spatial abilities groups (Figure 22).
Figure 22: MRT Score by Gender
10 16 22 28 34 40
MRT_SCORE
0.0
0.1
0.2
0.3
Proportion per B
ar
0
1
2
3
4
Cou
nt
0 1
GENDER
10
20
30
40
MR
T_S
CO
RE
Gender Key 0 – Female 1 – Male

42
6 Discussion
6.1 Quantitative Metrics
Quantitative metrics allowed us to objectively chart changes in performance and could be used similarly in NASA telerobotics training. The significant correlations between subjective rankings of performance made by the trainer and the corresponding objective rankings produced from quantitative metrics suggest that evaluation at least as accurate as that made by human instructors can be obtained directly from a robotics training simulation. It is important to note, however, that there was only one trainer (the author) for all subjects in this experiment. While the author did receive shortened GRT training at JSC and had numerous communications with NASA robotics trainers, as well as experience training robotics subjects for a similar MVL study, the subjective evaluations made during this experiment are only an approximation of those that would be made by instructors at NASA. Evaluation based on quantitative metrics is consistent, reliable, and would allow for the tracking of progress regardless of instructor presence. With the use of embedded measures, scoring subjectivity is avoided, and constructive evaluation may occur even during self-study, making embedded, quantitative metrics an attractive addition to GRT. From the quantitative data collected during our experiment, we found significant effects of Trial Number on Movement Time (negative), Multi-axis Movement Percentage (positive), Bimanual Movement Percentage (positive), and Smoothness (negative). Trial Repetition, another approximate measure of time, showed significant effects on Bimanual Movement Percentage (positive) and Smoothness (positive). The absence of significant cross-effects is reassuring as it shows that the significant effects above are not attributable to cross-effects that are singularities in the distribution. The evidence supports our hypothesis of a learning effect over time, with improvements in nearly all aspects of performance. Movement Time decreased as subjects became more comfortable with fly-tos and telerobotics, using greater percentages of Multi-axis Movement and Bimanual Movement. This parallels the efficiency developed as astronauts learn to move the arm in multiple axes (both translation and rotation) during GRT. Smoothness was a unique case, with Trial Number and Trial Repetition simultaneously showing significant effects with opposite trends; control input became less smooth with increase in Trial Number and more smooth with increase in Trial Repetition. The decrease in Smoothness with increase in Trial Number was likely due to subjects growing more eager to finish tasks quickly as the experiment progressed—in an attempt to cause rapid motion of the robotic arm, subjects were less smooth with their control inputs. The opposite trend from Trial Repetition was likely a result of subjects growing more practiced and confident—fewer changes of direction due to inappropriate input initialization were required with each repetition of trial.
6.2 The Effect of Experience Level
Although we expected less experienced subjects to show greater improvement with Trial Number and Trial Repetition than more experienced subjects, we found no such trend in the data. Experience Level did, however, show significant effects on numerous aspects of performance:

43
• The least experienced subjects (New) had, on average, higher movement times, a lower percentage of multi-axis movement and smoother inputs than the mean.
• MIT-trained subjects had, on average, a lower percentage of bimanual movement and less smooth inputs than the mean.
• The most experienced subjects (JSC-trained) had, on average, a higher percentage of multi-axis movement and a higher percentage of bimanual movement than the mean.
These results suggest that the type of training and the emphases made in training affect performance much more than just the level of prior experience. If it were the amount of previous practice alone leading to best performance, then for each metric we could expect the New subjects to be least skilled and the JSC-trained subjects to be most skilled. While this is the case for Multi-axis Movement, for Smoothness we actually see the New subjects having the best performance. Only one of the extremes is satisfied for each Movement Time (New subjects least skilled) and Bimanual Movment (JSC-trained most skilled). Given the emphasis on input smoothness made during the training for this experiment, it is not surprising that New subjects learned to make the smoothest control inputs. The more experienced subjects already had an input style and thus were less likely to make smoothness their top priority. Those who were JSC-trained did demonstrate superior skill with respect to bimanual movement, a technique emphasized during GRT but not a focus during the training for this experiment. The MIT-trained subjects were, on average, least smooth with their inputs, likely due to the lack of emphasis on smoothness during their prior training. The subjects previously MIT-trained were all MVL students aware that many of their lab-mates were also participating in the experiment. Highly competitive as a whole, they sought to achieve the lowest task-times with little thought given to input smoothness. The MIT-trained subjects flew as they did in the previous MVL studies, moving the arm as quickly as possible with little consideration for hand controller technique. Equivalent results might not found for a subject pool with individuals unaware of the identity of other subjects and lacking the competitive spirit of the MIT group; it could be valuable to treat Experience Level as a random rather than fixed effect in the future.
6.3 The Effect of Display Type
We hoped to see differences in performance due to feedback modality, with performance feedback during a training session instead of at completion resulting in improvement with respect to presented metrics, and with aural feedback having a greater effect on performance than visual feedback. Although data from the pilot subject supported our hypotheses, we did not find significant effects of Display-Type on average across subjects; no significant effects of Display-Type on Multi-axis Movement Percentage (or any other performance metric) were found by regression. Although subjects reported an overwhelming preference for visual feedback, there was little to no difference in performance despite the information the color change revealed. It is possible that the task we chose was not the right one to elicit an effect of Display-Type. We also may have benefitted from selecting alternative feedback modalities or presenting different metrics to our subjects (these limitations are further addressed in Section 6.5). Another possibility is that the effect of

44
feedback might take place over a longer period of time; given the complexity of the task and high workload, subjects may not have been able to immediately change their movement strategy based on feedback, regardless of display-type.
6.4 The Effects of Spatial Ability Category and Gender
Our analysis revealed no effects of Spatial Ability Category on performance, perhaps due to the above-average abilities of our subjects overall. Many individuals with ‘Low’ spatial ability in this experiment were low only within this small sample and not necessarily as compared to the general population. Additionally, our spatial ability categorizations were made only on the basis of MRT scores, representing just one aspect of spatial skill. All women who participated in this experiment fell below the natural gap in the MRT score distribution and thus were categorized into the ‘Low’ Spatial Ability Category. While we did not determine any effects of Spatial Ability Category on performance, we did find significant effects of Gender on Multi-axis Movement Percentage and on Bimanual Movement Percentage. As Gender and Spatial Ability Category were highly correlated in this experiment, perhaps we would find effects of Spatial Ability Category on performance in an experiment with a larger subject pool. Based on our results, we would expect subjects with low spatial ability to use less multi-axis movement and less bimanual movement than subjects with high spatial ability skills.
6.5 Limitations and Suggestions for Improvement
6.5.1 Alternative Task Types
We selected the basic fly-to for this experiment, but it is possible that other task-types would elicit a greater effect of Display-Type on performance. As we did not design the fly-to task to include clearance concerns or other conditions that would limit directions of motion, all subjects were able to obtain high Multi-axis Movement Percentage on each trial. A task in which subjects had to clear the truss with the arm or were required to keep a certain object in view might induce more variation in Multi-axis Movement Percentage; as a result, we would possibly see greater effect due to Display-Type. It would also be interesting to investigate the effects of Display-Type given a different robotics task, such as a loaded fly-to or track-and-capture. We chose the basic fly-to for simplicity and face-validity, but it would be worthwhile to also experiment with other tasks.
6.5.2 Alternative Displays
The feedback displays we created, visual and aural, were designed in an attempt to convey information to the arm operator clearly and without distracting to the point of hindering performance. We believe we were successful with the former objective, as none of our subjects expressed confusion regarding the meaning of the displays, and we are confident we were successful with the latter: performance did not suffer with the presence of live feedback. Nor, however, did performance improve with the presence of live feedback, and this could be in part due to our selection of displays.

45
An infinite number of displays may be created, in a variety of modalities. For this experiment, we investigated only simple visual and aural displays, none of which gave significant results. New displays may be designed, not just limited to the senses of sight and sound, which could have a greater effect. For example, it is possible that a tactile display, such as vibration of a hand controller, could be an effective tool for shaping robotics performance.
6.5.3 Alternative Metrics
Despite its relevance to SSRMS operation and emphasis during GRT, it is possible that percentage of multi-axis movement was not the best choice for the live feedback parameter. Constantly reporting a metric that it is not always constructive to use may have caused subjects to ignore the feedback when flying. Although it is a complicated problem to define the best trajectory, it would be ideal if feedback could reflect when the operator is moving the arm in directions counter to the shortest workable path. With this sort of feedback shaping behavior, we would expect completion of robotics task to be efficient and straightforward. Another important metric that may be used as a feedback parameter in future studies is Smoothness. Multi-axis movement is not always required, but smooth inputs are at all times essential for safe robotic arm operation. If smoothness data were conveyed live, we would expect subjects to show great improvement overall in their hand controller technique. Hopefully the good habits would continue even with the subsequent removal of smoothness feedback.
6.5.4 A More Flexible Model
Given the variability between our experience groups/ subjects and the levels and individual differences of those who might be sampled from a larger population, a future treatment of experimental data might define Experience Level as a random effect rather than a fixed effect. This broader interpretation would allow us to better generalize our results to all experience levels that might have been selected.
46
7 Conclusions
We effectively addressed weaknesses of NASA GRT, namely reliance on human instructors and scoring subjectivity, by introducing quantitative metrics into the robotics training simulation. Embedded quantitative metrics can be used to accurately and consistently chart changes in performance during space telerobotics training. With quantitative metrics, there is no risk of scoring subjectivity, and constructive evaluation may occur even when a human instructor is not present. In summary, the results of this work showed:
1. Performance as defined by movement time, percentage of multi-axis movement, and percentage of bimanual movement improved with trial repetition and cumulative practice. A learning trend is clear early in telerobotics training.
2. Experience Level showed significant effects on numerous aspects of performance, but not always with the best performance belonging to the group with the greatest amount of previous training. This suggests that type of training and emphases in training affect performance much more than just level of prior experience.
3. Although subjects overwhelmingly preferred live, visual feedback, no significant effects of Display-Type were found by regression. It is possible that significant results could be obtained by experimenting with alternative task types, display modalities or feedback parameters.
While we do not argue for the embedded system to replace human instructors, we are confident that the use of objective measures as a performance analysis tool would be a positive supplement to the current NASA telerobotics training system. Further studies should be conducted to discover the types of feedback that can be produced directly from the training simulation and have an overall positive effect on operator performance.
47
References
[1] C.M. Oman, et al. (2008) “Validation of assessment tests and countermeasures for detecting and mitigating changes in cognitive function during robotics operations”. Research Proposal: 08-NSBRIStep2-0011. [2] Cranor, Lorrie. (2008) A framework for reasoning about the human in the loop, In Proceedings of the 1st Conference on Usability, Psychology, and Security, San Francisco, California. [3] Wickens, C.D., Mavor, A.S., Parasuraman, R., and J.P. McGee, editors. (1998) “The Future of Air Traffic Control: Human Operators and Automation”, National Academy Press. [4] Camarillo, D., T. Krummel, et al. (2004). "Robotic technology in surgery: past, present, and future." (abstract) The American Journal of Surgery 188: 2-15. [5] Bargar, W. (2007). "Robots in orthopaedic surgery: past, present, and future." (abstract) Clinical Orthopaedics and Related Research 463: 31. [6] Lapointe, J., Dupuis, E., Hartman, L. and R. Gillett. (2002). “An Analysis of Low-Earth Orbit Space Operations”. In Proceedings of the Joint Association of Canadian Ergonomists/Applied Ergonomics Conference, Banff, Alberta, Canada. [7] Zak, H. and H. Das (1995). “Towards a training methodology for skilled teleoperation”. IEEE Transactions on Systems, Man and Cybernetics 25(2): 313-327. [8] Tomlinson, Zakiya. NASA Robotics Instructor. "RE: GRT Questions." Message to the author. 10 Jan. 2011. E-mail. [9] Fry, T.L., Schlegel, R.E., Shehab, R.L., and K. Gilliland. (2003). Developing metrics to evaluate NASA RMS training performance. In Proceedings of the IIE Annual Conference, Portland, OR.
[10] National Aeronautics and Space Administration. (2004). Educational Brief: Humans and Robots. EB-2001-04-004-JSC. [11] National Aeronautics and Space Administration. (2004). International Space Station Robotic Overview Training Manual (supersedes TD0102). Houston, TX: Mission Operations Directorate Space Flight Training Division. [12] Canadian Space Agency. (2000). SSRMS Coordinate Frames Definitions and Examples (CSA-SS-MAN-0034). Canada: Space Station Program. [13] National Aeronautics and Space Administration. (2006). Generic Robotics Training (GRT) Student Handbook. EVA, Robotics & Crew Systems Operations and Mechanical and Robotic Systems Divisions. [14] Currie, N. and B. Peacock (2002). “International Space Station Robotic Systems Operations- A Human Factors Perspective”, Human Factors and Ergonomics Society. [15] Smith, H.R. (2009) “Hand in Hand.” 22 Dec, 2010. NASA Educational Technology Services. <http://www.nasa.gov/audience/foreducators/robotics/home/Hand_In_Hand.html> [16] Piedboeuf, J. and É. Dupuis (2001). “Recent Canadian activities in space automation and robotics–an overview”. 6th International Symposium on Artificial Intelligence and Robotics & Automation in Space, Quebec, Canada, Canadian Space Agency.

48
[17] Dupuis, J. (2010). "The International Space Station: Canada’s Involvement." Library of Parliament, Ottawa, Canada. [18] Tomlinson, Z.A. “Influence of Spatial Abilities on Primary and Secondary Space Telerobotics Operator Performance”. Thesis, Massachusetts Institute of Technology, 2009. [19] Lumelsky, V. (1991). "On Human Performance in Telerobotics." IEEE Transactions on Systems, Man and Cybernetics 21(5): 971-982. [20] Draper, J., Wrisberg, C., Blair, L., and E. Omori (1988). “Measuring operator skill and teleoperator performance”, Oak Ridge National Lab., TN (USA). [21] Fitts, P.M. (1954) “The information capacity of human motor system in controlling the amplitude of movement”, Journal of Experimental Psychology 47: 381-391. [22] National Aeronautics and Space Administration (2010). Generic Robotics Training Evaluation. NASA. [23] National Aeronautics and Space Administration (2006). Generic Robotics Training Qualification, Version 15. NASA. [24] Williamson, Paul. NASA Robotics Instructor. "RE: Training Questions." Message to the author. 20 Jan. 2011. E-mail. [25] Armstrong, D., A. Gosling, et al. (1997). "The place of inter-rater reliability in qualitative research: an empirical study." (abstract) Sociology 31(3): 597. [26] Pope, C., S. Ziebland, et al. (2000). "Qualitative research in health care: analysing qualitative data." British Medical Journal 320(7227): 114. [27] Editors Khatib, Oussama, Kumar, Vijay and George J. Pappas. Experimental Robotics: the Eleventh International Symposium. Berlin: Springer, 2009. Google Books. Web. 3 Jan. 2011. Excerpt from Article: A First Investigation into the Teleoperation of a Miniature Rotorcraft- by Bernard Mettler, Jon Andersh, and Nikolaos Papanikolopoulos, 195-196. [28] Andersh, J., B. Mettler, et al. (2009). Experimental investigation of teleoperation performance for miniature rotorcraft. Joint 48th IEEE Conference on Decision and Control and 28th Chinese Control Conference, Shanghai, P.R. China, IEEE. [29] Zhai, S. and J. Senders (1997). Investigating coordination in multidegree of freedom control I: Time-on-target analysis of 6 DOF tracking. [30] Zhai, S. and P. Milgram (1998). Quantifying coordination in multiple DOF movement and its application to evaluating 6 DOF input devices, ACM Press/Addison-Wesley Publishing Co. [31] DeJong, B., J. Colgate, et al. (2004). Improving teleoperation: Reducing mental rotations and translations, IEEE. [32] Bray, T.M., Shehab, R.L., Schlegel, R.E., Civan, A., and Walker, D.E. (2003). Effectiveness of 2-D views for 6-D robotics simulation maneuvers. In Proceedings of the Human Factors and Ergonomics Society 47th Annual Meeting (CD-ROM). Santa Monica, CA: Human Factors and Ergonomics Society. [33] Lamb, P. and D. Owen (2005). Human performance in space telerobotic manipulation, ACM. [34] Akagi, T.M., Schlegel, R.E., Shehab, R.L., Gilliland, K., Fry, T.L. and Hughes, Q., Towards the Construction of an Efficient Set of Robot Arm Operator Performance Metrics. In Human Factors and Ergonomics Society 48th Annual Meeting, (New Orleans, LA2004), 1194-1198.

49
[35] Menchaca-Brandan, M. A. Influence of Spatial Orientation and Spatial Visualization on Space Teleoperation Performance. Thesis, Massachusetts Institute of Technology, 2007. [36] Pontillo, T.M. Spatial Ability and Handedness as Potential Predictors of Space Teleoperation Performance. Thesis, Massachusetts Institute of Technology, 2010. [37] Oman CM, Liu AM, Rueger M, Evans E, Natapoff A, Czeisler CA, Barger LK, Lockley SW. Validation of assessment tests and countermeasures for detecting and mitigating changes in cognitive function during robotics operations (abstract). 2010 NASA Human Research Program Investigators Workshop, Houston TX, February 3-5, 2010., 02/2010. [38] Johnson, D., R. Perlow, et al. (1993). "Differences in Task Performance as a Function of Type of Feedback: Learning-Oriented Versus Performance-Oriented Feedback1." Journal of Applied Social Psychology 23(4): 303-320. [39] Jacoby, J., D. Mazursky, et al. (1984). "When feedback is ignored: Disutility of outcome feedback." Journal of Applied Psychology 69(3): 531-545. [40] Winstein, C. and R. Schmidt (1990). "Reduced frequency of knowledge of results enhances motor skill learning." Learning, Memory 16(4): 677-691. [41] Nicholson, D. and R. Schmidt (1991). Scheduling information feedback to enhance training effectiveness, Human Factors and Ergonomics Society. [42] Wulf, G. and C. Shea (2002). "Principles derived from the study of simple skills do not generalize to complex skill learning." Psychonomic Bulletin & Review 9(2): 185. [43] Van Merrienboer, J. (1997). Training complex cognitive skills: A four-component instructional design model for technical training, Educational Technology Publications. [44] Van Merriënboer, J., L. Kester, et al. (2006). "Teaching complex rather than simple tasks: Balancing intrinsic and germane load to enhance transfer of learning." Applied Cognitive Psychology 20(3): 343-352. [45] Schmidt, R. A. (1991). Motor control and learning: A behavioral emphasis ( 2nd ed.). Champaign, IL: Human Kinetics. [46] Wulf, G., Shea, C. H., & Whitacre, C. A. (1998). Physical guidance benefits in learning a complex motor skill. Journal of Motor Behavior, 30: 367–380. [47] Guadagnoli, M., L. Dornier, et al. (1996). "Optimal length for summary knowledge of results: the influence of task-related experience and complexity." Research Quarterly for Exercise and Sport 67(2): 239 [48] Proctor, Robert W., and Trisha Van Zandt. Human Factors in Simple and Complex Systems. Boca Raton, FL: CRC Press, 2008. Print. [49] Bodnar, A., R. Corbett, et al. (2004). AROMA: ambient awareness through olfaction in a messaging application, ACM. [50] Bertoloni, L., E. Rogora, et al. (1981). Motorcar dashboard, Google Patents. 4293843. [51] Few, Stephen. "Clarifying the Vision." Information Dashboard Design: The Effective Visual Communication of Data. London: O'Reilly, 2006. Web. 4 Jan. 2011. <http://www.oreilly.de/catalog/infodashboard/chapter/ch01.pdf>.

50
[52] Eckerson, Wayne W. "What Are Performance Dashboards." Performance Dashboards: Measuring, Monitoring, and Managing Your Business. Hoboken, NJ: J. Wiley, 2006. Web. 3 Jan. 2011. [53] Harbour, Jerry L. "Performance Measurement." The Basics of Performance Measurement. Boca Raton: CRC, 2009. Google Books. Web. 3 Jan. 2011.
[54] Schiff, C. (2004) “Metrics Development: Taking It From the Top.” 2 Jan, 2011. InformationWeek. < http://www.informationweek.com/news/software/bi/showArticle.jhtml?articleID=51201364>. [55] Liu, A.M., C.M. Oman, and A. Natapoff. Efficient Individualized Teleoperation Training via Spatial Ability Assessment. NSBRI Final Report. 2008.
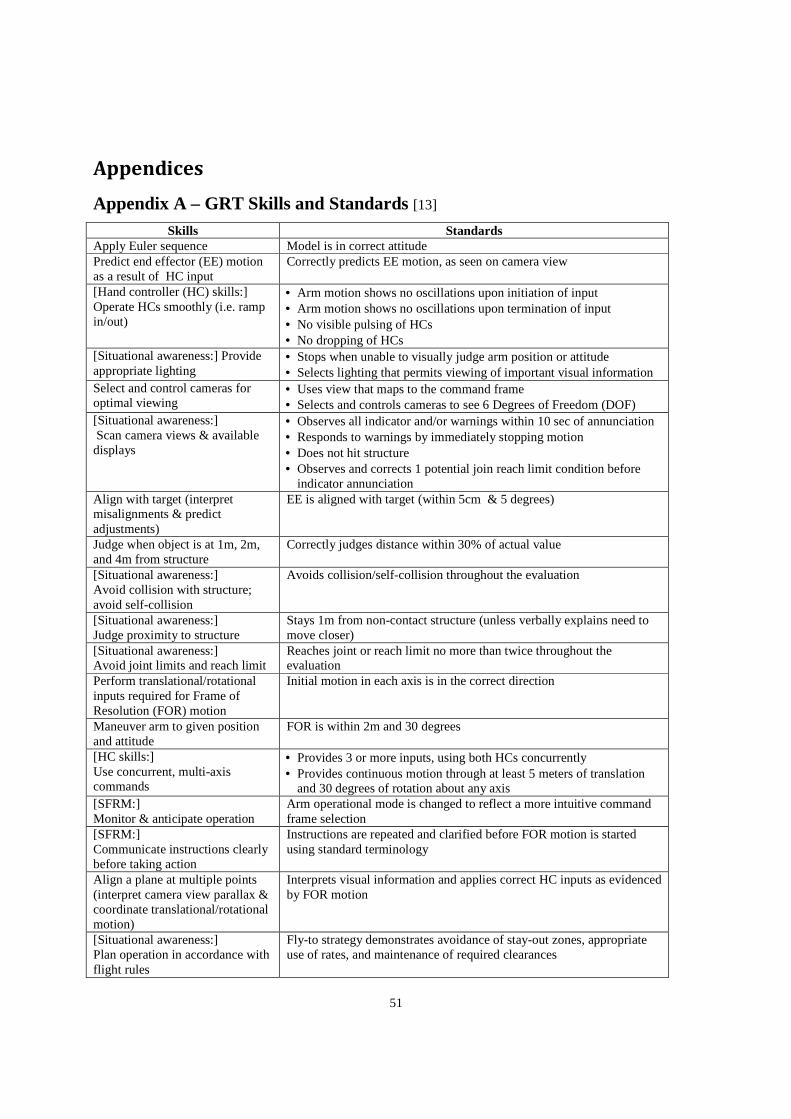
51
Appendices
Appendix A – GRT Skills and Standards [13]
Skills Standards Apply Euler sequence Model is in correct attitude Predict end effector (EE) motion as a result of HC input
Correctly predicts EE motion, as seen on camera view
[Hand controller (HC) skills:] Operate HCs smoothly (i.e. ramp in/out)
• Arm motion shows no oscillations upon initiation of input • Arm motion shows no oscillations upon termination of input • No visible pulsing of HCs • No dropping of HCs
[Situational awareness:] Provide appropriate lighting
• Stops when unable to visually judge arm position or attitude • Selects lighting that permits viewing of important visual information
Select and control cameras for optimal viewing
• Uses view that maps to the command frame • Selects and controls cameras to see 6 Degrees of Freedom (DOF)
[Situational awareness:] Scan camera views & available displays
• Observes all indicator and/or warnings within 10 sec of annunciation • Responds to warnings by immediately stopping motion • Does not hit structure • Observes and corrects 1 potential join reach limit condition before
indicator annunciation Align with target (interpret misalignments & predict adjustments)
EE is aligned with target (within 5cm & 5 degrees)
Judge when object is at 1m, 2m, and 4m from structure
Correctly judges distance within 30% of actual value
[Situational awareness:] Avoid collision with structure; avoid self-collision
Avoids collision/self-collision throughout the evaluation
[Situational awareness:] Judge proximity to structure
Stays 1m from non-contact structure (unless verbally explains need to move closer)
[Situational awareness:] Avoid joint limits and reach limit
Reaches joint or reach limit no more than twice throughout the evaluation
Perform translational/rotational inputs required for Frame of Resolution (FOR) motion
Initial motion in each axis is in the correct direction
Maneuver arm to given position and attitude
FOR is within 2m and 30 degrees
[HC skills:] Use concurrent, multi-axis commands
• Provides 3 or more inputs, using both HCs concurrently • Provides continuous motion through at least 5 meters of translation
and 30 degrees of rotation about any axis [SFRM:] Monitor & anticipate operation
Arm operational mode is changed to reflect a more intuitive command frame selection
[SFRM:] Communicate instructions clearly before taking action
Instructions are repeated and clarified before FOR motion is started using standard terminology
Align a plane at multiple points (interpret camera view parallax & coordinate translational/rotational motion)
Interprets visual information and applies correct HC inputs as evidenced by FOR motion
[Situational awareness:] Plan operation in accordance with flight rules
Fly-to strategy demonstrates avoidance of stay-out zones, appropriate use of rates, and maintenance of required clearances
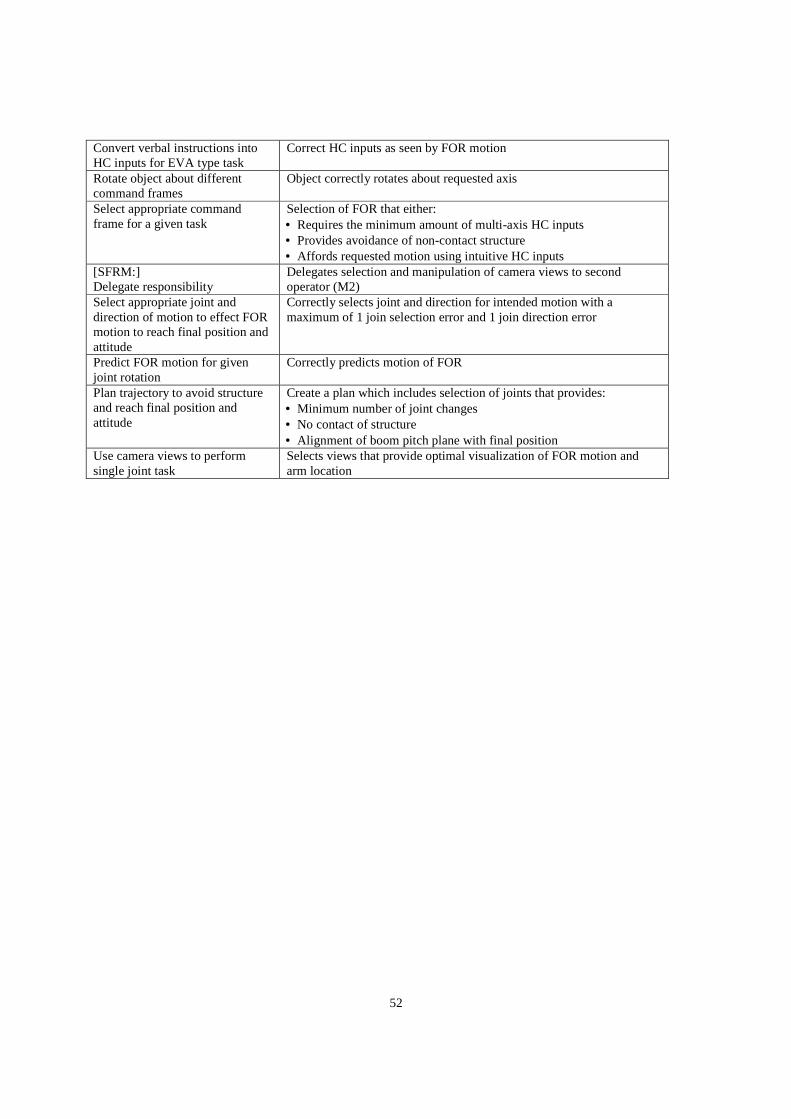
52
Convert verbal instructions into HC inputs for EVA type task
Correct HC inputs as seen by FOR motion
Rotate object about different command frames
Object correctly rotates about requested axis
Select appropriate command frame for a given task
Selection of FOR that either: • Requires the minimum amount of multi-axis HC inputs • Provides avoidance of non-contact structure • Affords requested motion using intuitive HC inputs
[SFRM:] Delegate responsibility
Delegates selection and manipulation of camera views to second operator (M2)
Select appropriate joint and direction of motion to effect FOR motion to reach final position and attitude
Correctly selects joint and direction for intended motion with a maximum of 1 join selection error and 1 join direction error
Predict FOR motion for given joint rotation
Correctly predicts motion of FOR
Plan trajectory to avoid structure and reach final position and attitude
Create a plan which includes selection of joints that provides: • Minimum number of joint changes • No contact of structure • Alignment of boom pitch plane with final position
Use camera views to perform single joint task
Selects views that provide optimal visualization of FOR motion and arm location
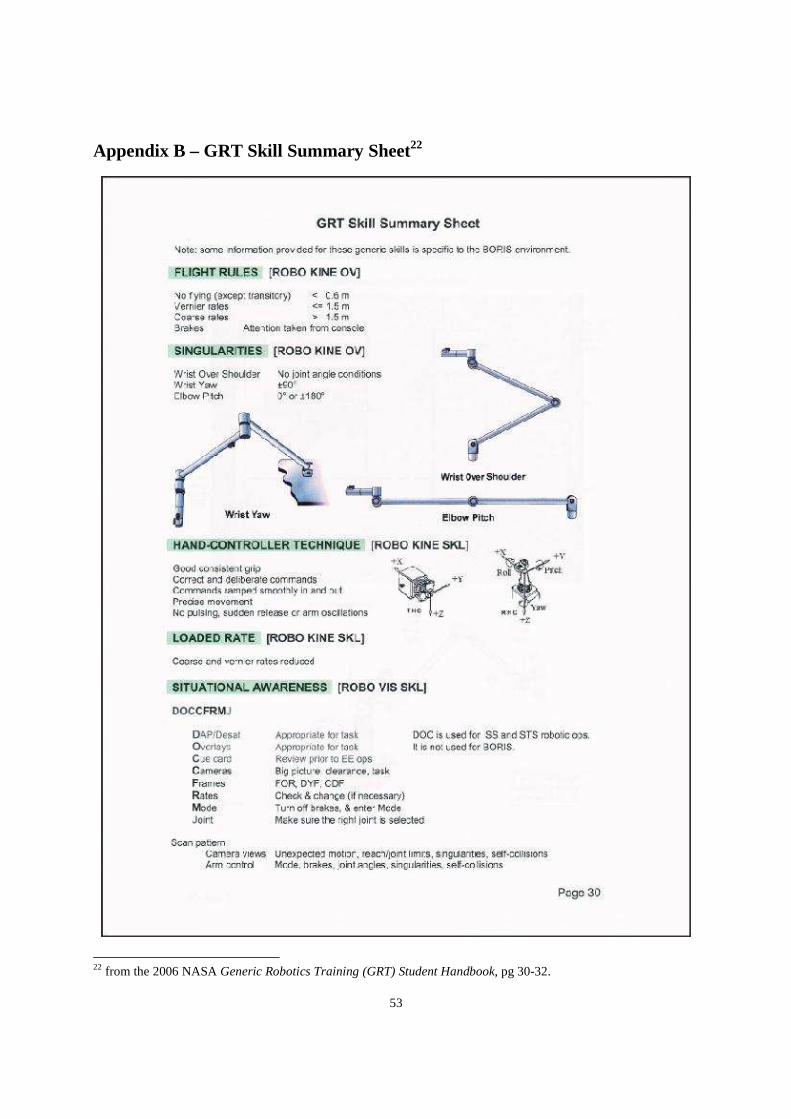
53
Appendix B – GRT Skill Summary Sheet22
22 from the 2006 NASA Generic Robotics Training (GRT) Student Handbook, pg 30-32.

54

55
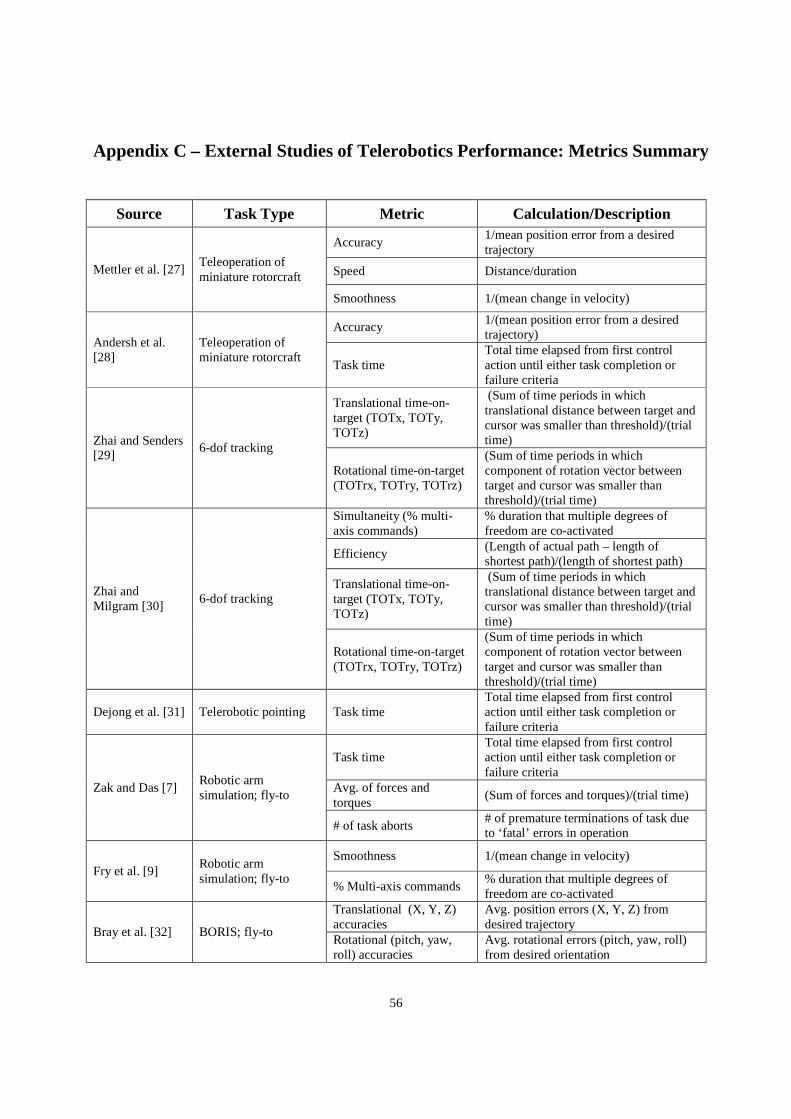
56
Appendix C – External Studies of Telerobotics Performance: Metrics Summary
Source Task Type Metric Calculation/Description
Mettler et al. [27] Teleoperation of miniature rotorcraft
Accuracy 1/mean position error from a desired trajectory
Speed Distance/duration
Smoothness 1/(mean change in velocity)
Andersh et al. [28]
Teleoperation of miniature rotorcraft
Accuracy 1/(mean position error from a desired trajectory)
Task time Total time elapsed from first control action until either task completion or failure criteria
Zhai and Senders [29]
6-dof tracking
Translational time-on-target (TOTx, TOTy, TOTz)
(Sum of time periods in which translational distance between target and cursor was smaller than threshold)/(trial time)
Rotational time-on-target (TOTrx, TOTry, TOTrz)
(Sum of time periods in which component of rotation vector between target and cursor was smaller than threshold)/(trial time)
Zhai and Milgram [30]
6-dof tracking
Simultaneity (% multi-axis commands)
% duration that multiple degrees of freedom are co-activated
Efficiency (Length of actual path – length of shortest path)/(length of shortest path)
Translational time-on-target (TOTx, TOTy, TOTz)
(Sum of time periods in which translational distance between target and cursor was smaller than threshold)/(trial time)
Rotational time-on-target (TOTrx, TOTry, TOTrz)
(Sum of time periods in which component of rotation vector between target and cursor was smaller than threshold)/(trial time)
Dejong et al. [31] Telerobotic pointing Task time Total time elapsed from first control action until either task completion or failure criteria
Zak and Das [7] Robotic arm simulation; fly-to
Task time Total time elapsed from first control action until either task completion or failure criteria
Avg. of forces and torques
(Sum of forces and torques)/(trial time)
# of task aborts # of premature terminations of task due to ‘fatal’ errors in operation
Fry et al. [9] Robotic arm simulation; fly-to
Smoothness 1/(mean change in velocity)
% Multi-axis commands % duration that multiple degrees of freedom are co-activated
Bray et al. [32] BORIS; fly-to
Translational (X, Y, Z) accuracies
Avg. position errors (X, Y, Z) from desired trajectory
Rotational (pitch, yaw, roll) accuracies
Avg. rotational errors (pitch, yaw, roll) from desired orientation

57
Lamb and Owen [33]
SRMS simulation; fly-to, grapple, loaded fly-to
Task time Total time elapsed from first control action until either task completion or failure criteria
Efficiency of path
RMS distance between POR on manipulator and target throughout maneuver, multiplied by duration of maneuver
# of manipulation errors # of collisions or singularities
Control effort RMS value of control excursion in all axes through maneuver, multiplied by duration of maneuver
Akagi et al. [34] 3-dof fly-to
Task time Total time elapsed from first control action until either task completion or failure criteria
Correction time
Time to task completion from the moment each of the 3 axis inputs has been reduced to 0 commanded velocity at least once
Distance traveled Length of the path followed by the end effector during the task
Degree of inverse motion Sum of the distances traveled along all axes in a direction contrary to that called for by a specific task
Max. component velocity The maximum single-axis commanded velocity observed
% Multi-axis input % of time during which more than one axis is commanded simultaneously

58
Appendix D – Vandenberg Mental Rotation Test (MRT)

59

60

61
Appendix E – Training PowerPoint

62

63

64

65

66

67

68

69
Substitute slides for subjects with the live, visual dashboard instead of the combined live visual and aural feedback display: