Embed Size (px)
Citation preview
Objective: To test claims about inferences for two proportions, under specific conditions
TWO-PROPORTION INFERENCE TESTS
Chapter 22
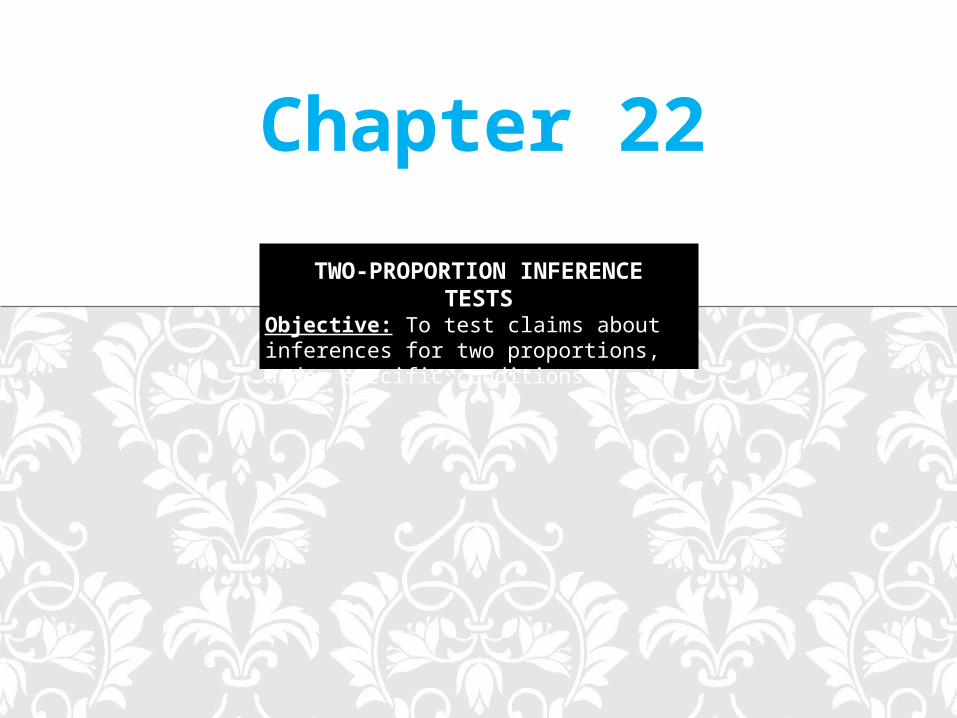
• Proportions observed in independent random samples are independent. Thus, we can add their variances. So…
• The standard deviation of the difference between two sample proportions is
• Thus, the standard error is
THE STANDARD DEVIATION OF THE DIFFERENCE BETWEEN TWO
PROPORTIONS
1 1 2 21 2
1 2
ˆ ˆp q p q
SD p pn n
1 1 2 21 2
1 2
ˆ ˆ ˆ ˆˆ ˆ
p q p qSE p p
n n
Remember it’s always a +

• Independence Assumptions:
• Randomization Condition: The data in each group should be drawn independently and at random from a homogeneous population or generated by a randomized comparative experiment.
• The 10% Condition: If the data are sampled without replacement, the sample should not exceed 10% of the population.
• Independent Groups Assumption: The two groups we’re comparing must be independent of each other.
ASSUMPTIONS & CONDITIONS
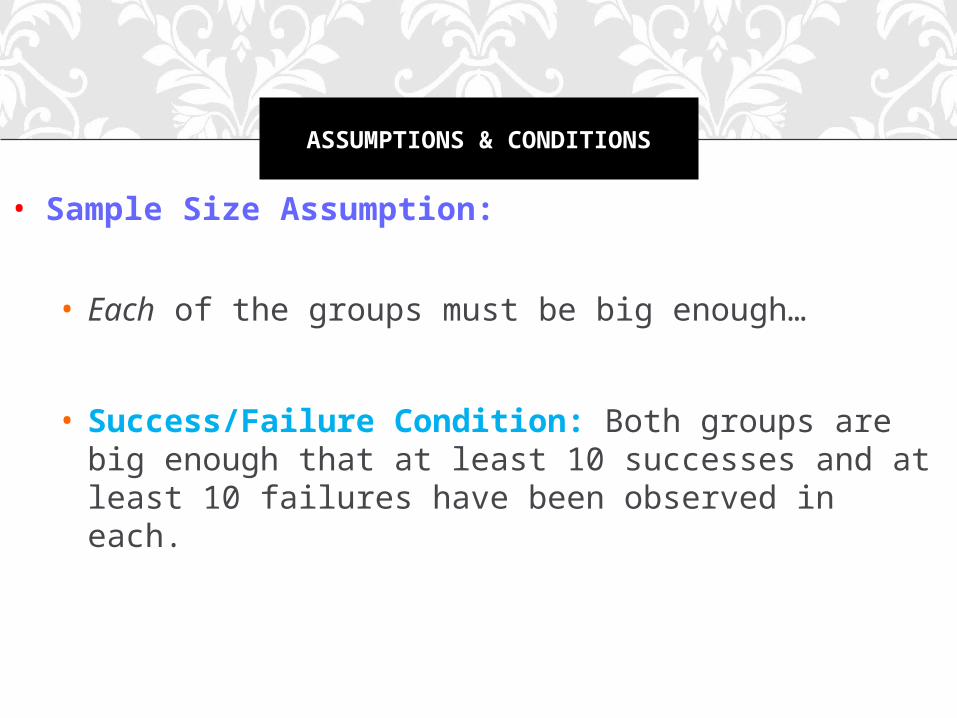
• Sample Size Assumption:
• Each of the groups must be big enough…
• Success/Failure Condition: Both groups are big enough that at least 10 successes and at least 10 failures have been observed in each.
ASSUMPTIONS & CONDITIONS
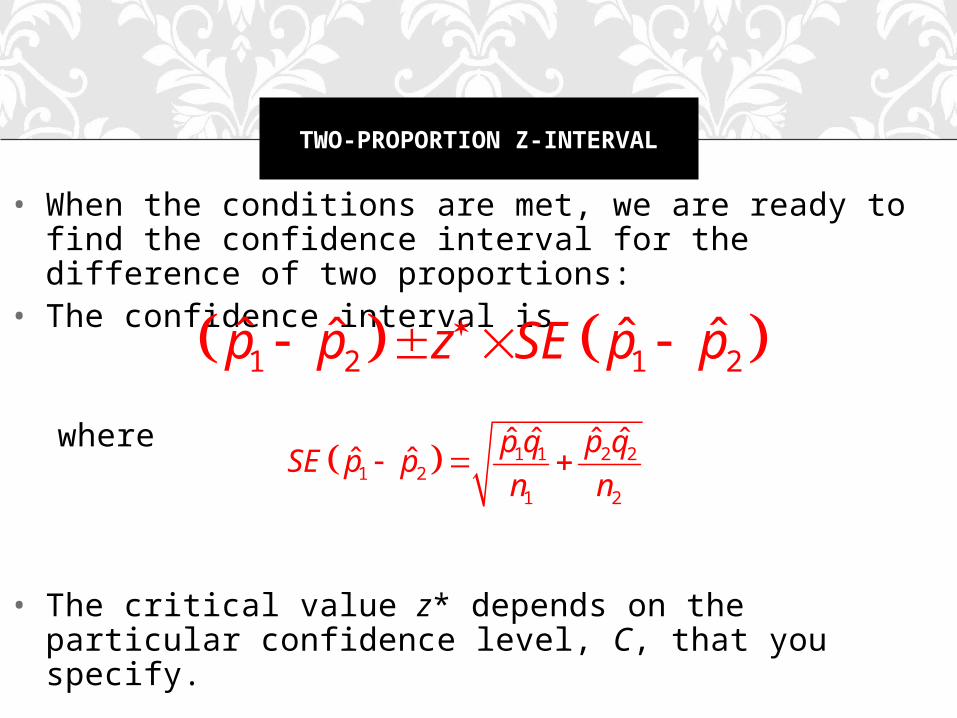
• When the conditions are met, we are ready to find the confidence interval for the difference of two proportions:
• The confidence interval is
where
• The critical value z* depends on the particular confidence level, C, that you specify.
TWO-PROPORTION Z-INTERVAL
1 2 1 2ˆ ˆ ˆ ˆp p z SE p p
1 1 2 21 2
1 2
ˆ ˆ ˆ ˆˆ ˆ
p q p qSE p p
n n
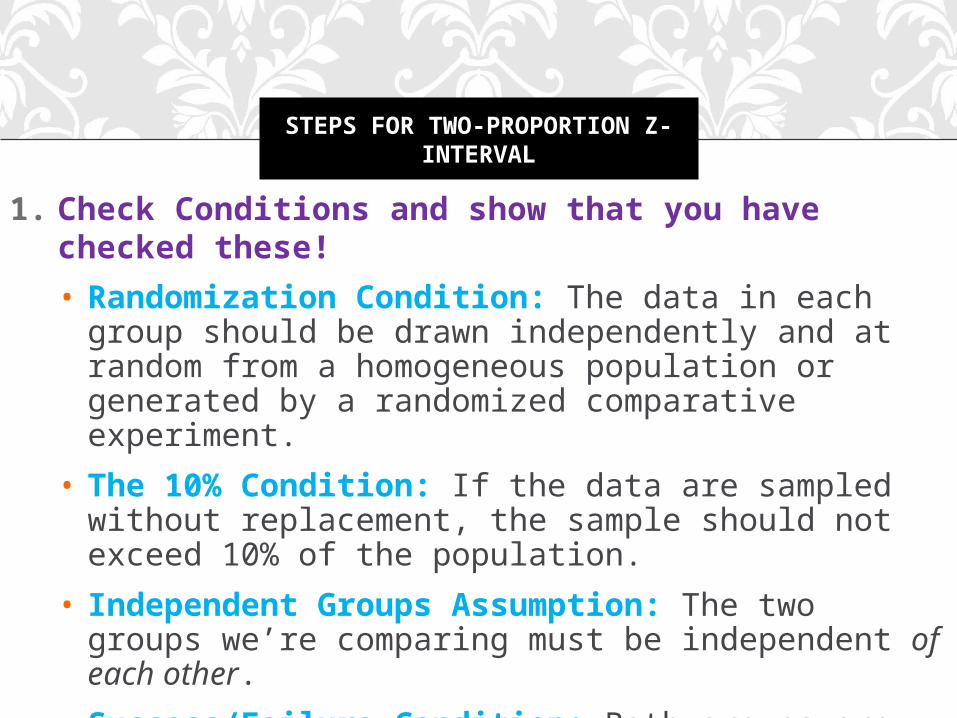
1. Check Conditions and show that you have checked these!
• Randomization Condition: The data in each group should be drawn independently and at random from a homogeneous population or generated by a randomized comparative experiment.
• The 10% Condition: If the data are sampled without replacement, the sample should not exceed 10% of the population.
• Independent Groups Assumption: The two groups we’re comparing must be independent of each other.
• Success/Failure Condition: Both groups are big enough that at least 10 successes and at least 10 failures have been observed in each.
STEPS FOR TWO-PROPORTION Z-INTERVAL
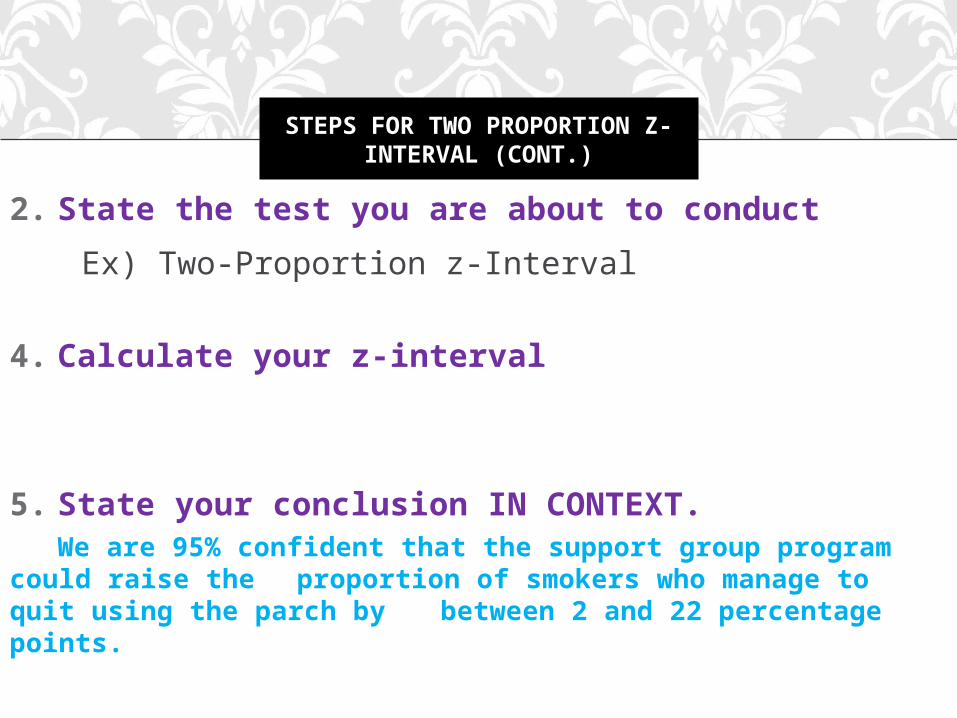
2. State the test you are about to conduct
Ex) Two-Proportion z-Interval
4. Calculate your z-interval
5. State your conclusion IN CONTEXT.We are 95% confident that the support group
program could raise the proportion of smokers who manage to quit using the parch by between 2 and 22 percentage points.
STEPS FOR TWO PROPORTION Z-INTERVAL
(CONT.)

The table below describes the effect of preschool on later use of social services:
Set up a 95% confidences interval. Interpret your results.
TWO-PROPORTION Z-INTERVAL EXAMPLE

TWO-PROPORTION Z-INTERVAL EXAMPLE (CONT.)
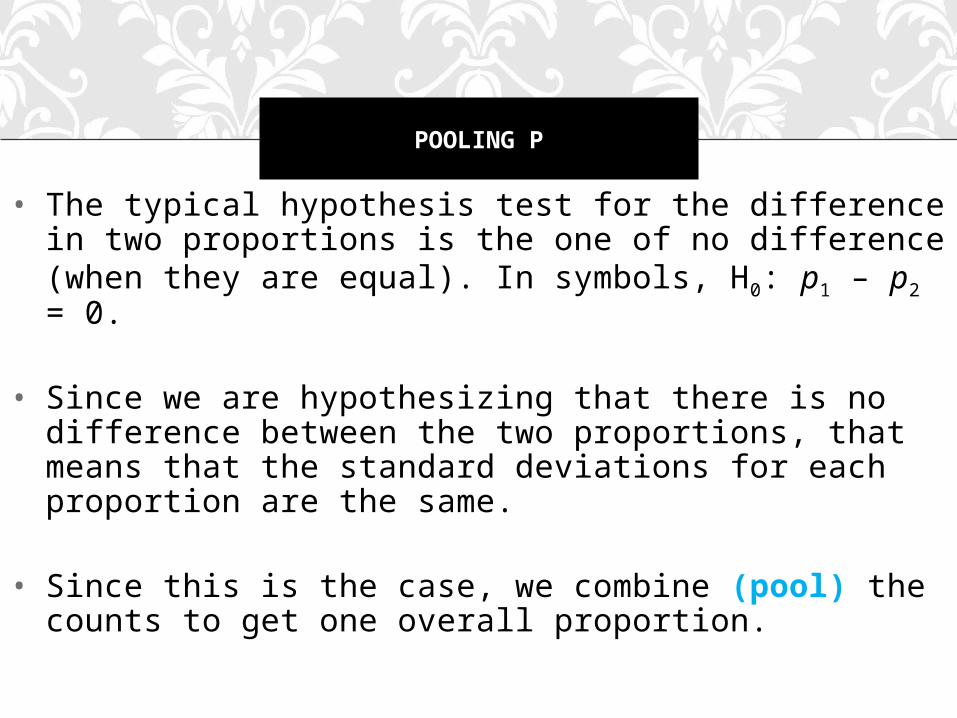
• The typical hypothesis test for the difference in two proportions is the one of no difference (when they are equal). In symbols, H0: p1 – p2 = 0.
• Since we are hypothesizing that there is no difference between the two proportions, that means that the standard deviations for each proportion are the same.
• Since this is the case, we combine (pool) the counts to get one overall proportion.
POOLING P

• The pooled proportion is
• where and
• If the numbers of successes are not whole numbers, round them first. (This is the only time you should round values in the middle of a calculation.)
POOLING P (CONT.)
1 2
1 2
ˆ pooledSuccess Success
pn n
1 1 1ˆSuccess n p 2 2 2ˆSuccess n p

• We then put this pooled value into the formula, substituting it for both sample proportions in the standard error formula:
• We’ll reject our null hypothesis if we see a large enough difference in the two proportions.
• How can we decide whether the difference we see is large?
• Just compare it with its standard deviation.
• Unlike previous hypothesis testing situations, the null hypothesis doesn’t provide a standard deviation, so we’ll use a standard error (here, pooled).
POOLING P (CONT.)
1 21 2
ˆ ˆ ˆ ˆˆ ˆ pooled pooled pooled pooled
pooled
p q p qSE p p
n n
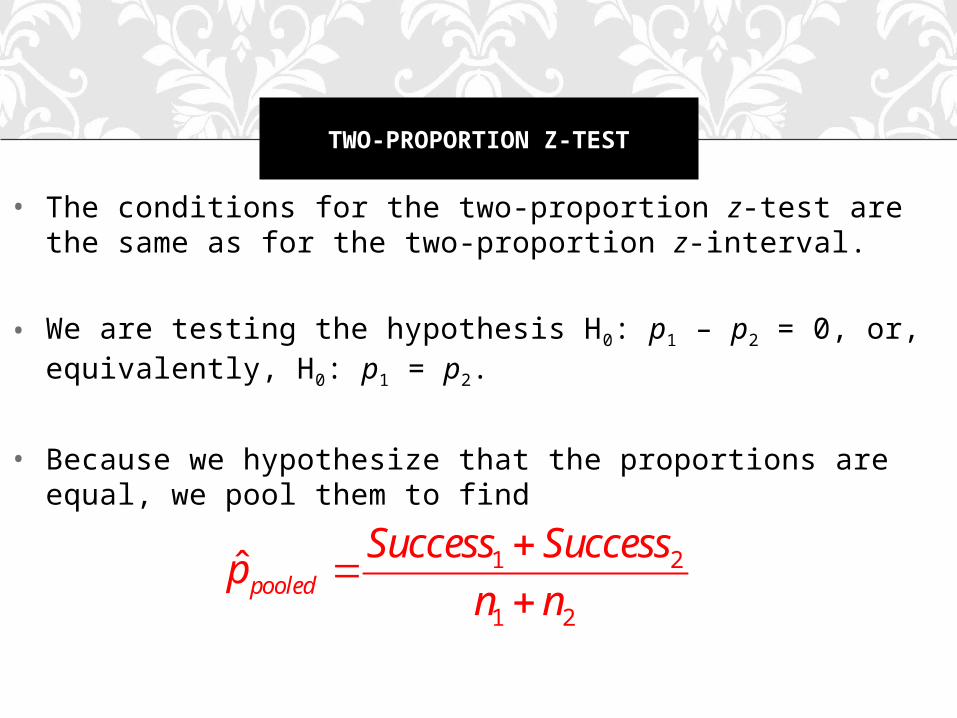
• The conditions for the two-proportion z-test are the same as for the two-proportion z-interval.
• We are testing the hypothesis H0: p1 – p2 = 0, or, equivalently, H0: p1 = p2.
• Because we hypothesize that the proportions are equal, we pool them to find
TWO-PROPORTION Z-TEST
1 2
1 2
ˆ pooledSuccess Success
pn n
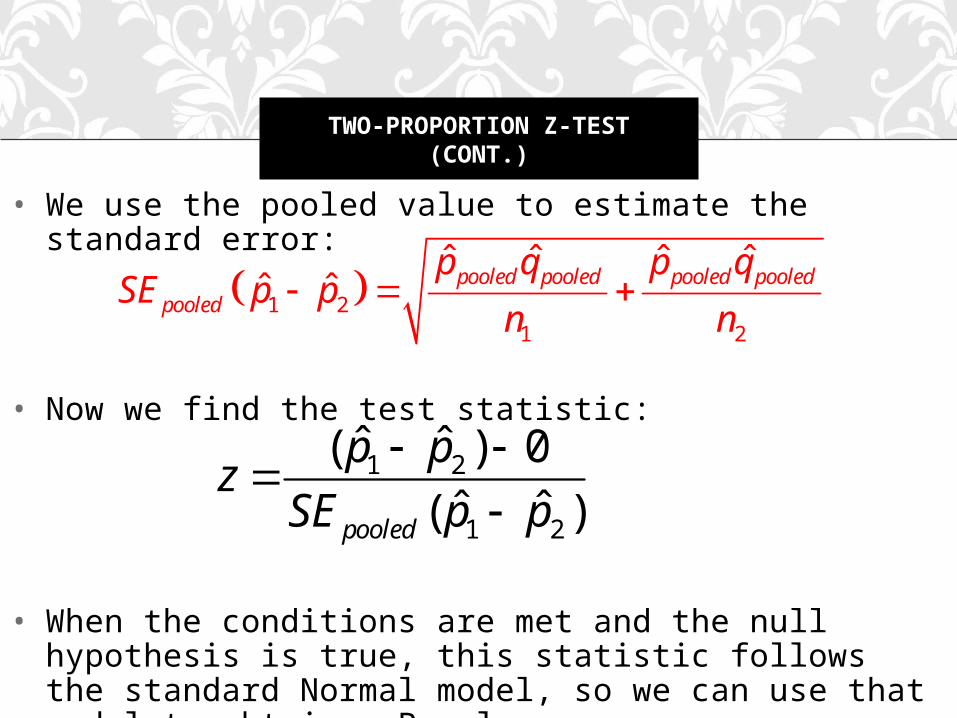
• We use the pooled value to estimate the standard error:
• Now we find the test statistic:
• When the conditions are met and the null hypothesis is true, this statistic follows the standard Normal model, so we can use that model to obtain a P-value.
TWO-PROPORTION Z-TEST (CONT.)
1 21 2
ˆ ˆ ˆ ˆˆ ˆ pooled pooled pooled pooled
pooled
p q p qSE p p
n n
1 2
1 2
ˆ ˆ( ) 0ˆ ˆ( )pooled
p pzSE p p

1. Check Conditions and show that you have checked these!
• Randomization Condition: The data in each group should be drawn independently and at random from a homogeneous population or generated by a randomized comparative experiment.
• The 10% Condition: If the data are sampled without replacement, the sample should not exceed 10% of the population.
• Independent Groups Assumption: The two groups we’re comparing must be independent of each other.
• Success/Failure Condition: Both groups are big enough that at least 10 successes and at least 10 failures have been observed in each.
STEPS FOR TWO-PROPORTION Z-TESTS

2. State the test you are about to conduct
Ex) Two-proportion z-test3. Set up your hypotheses
H0:
HA:
4. Calculate your test statistic
5. Draw a picture of your desired area under the Normal model, and calculate your P-value.
STEPS FOR TWO-PROPORTION Z-TESTS
(CONT.)
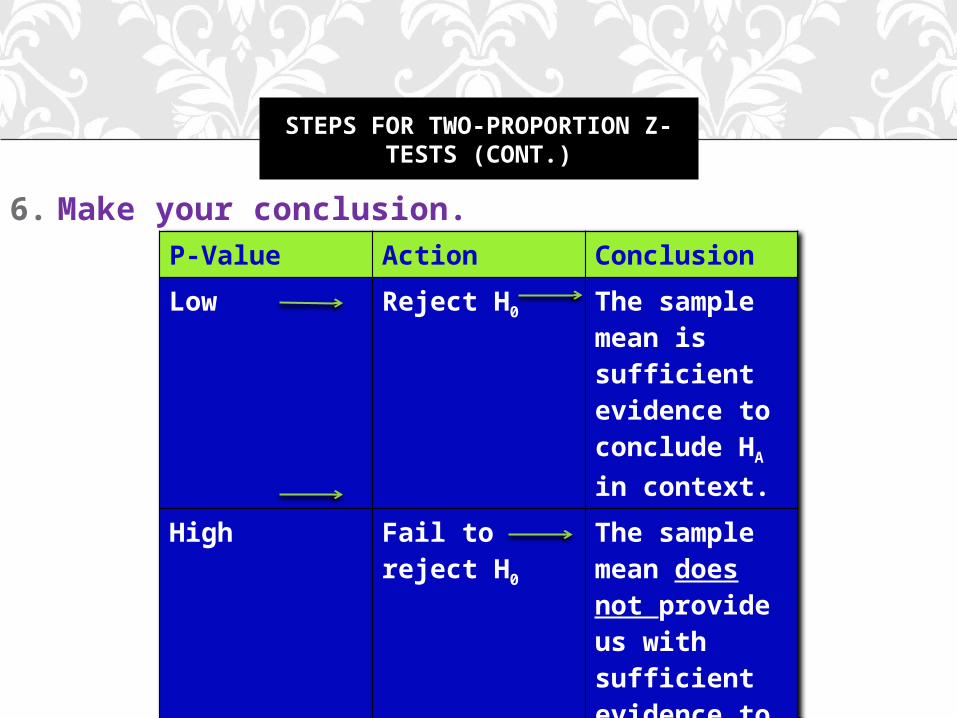
6. Make your conclusion.
STEPS FOR TWO-PROPORTION Z-TESTS
(CONT.)
P-Value Action Conclusion
Low Reject H0 The sample mean is sufficient evidence to conclude HA in context.
High Fail to reject H0
The sample mean does not provide us with sufficient evidence to conclude HA in context.
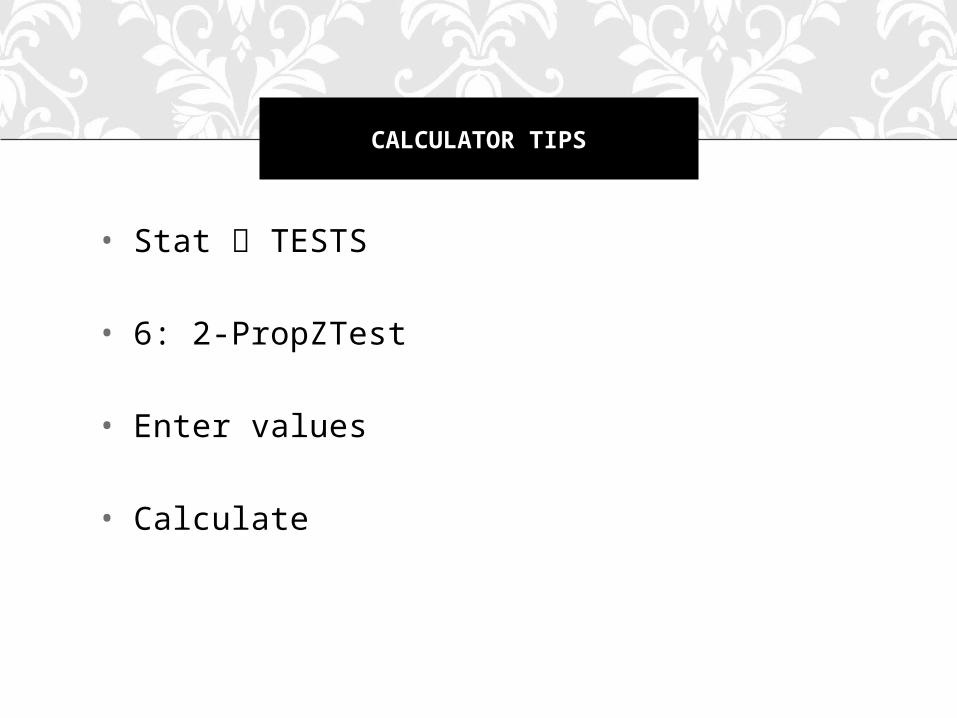
• Stat TESTS
• 6: 2-PropZTest
• Enter values
• Calculate
CALCULATOR TIPS
High levels of cholesterol in the blood are associated with higher risk of heart attacks. Will using a drug to lower blood cholesterol reduce heart attacks? The Helsinki Heart Study looked at this question. Middle-aged men were assigned at random to one of two treatments: 2051 men took the drug gemfibrozil to reduce their cholesterol levels, and a control group of 2030 men took a placebo. During the next five years, 56 men in the gemfibrozil group and 84 men in the placebo group had heart attacks. What are the proportions and is the benefit of the drug statistically significant?
TWO-PROPORTION Z-TEST EXAMPLE
TWO-PROPORTION Z-TEST EXAMPLE (CONT.)
• Day 1: pp. 519-522 # 1, 7, 9, 18
• Day 2: pp. 519-522 # 3, 10, 20, 22
ASSIGNMENTS