Embed Size (px)
Citation preview
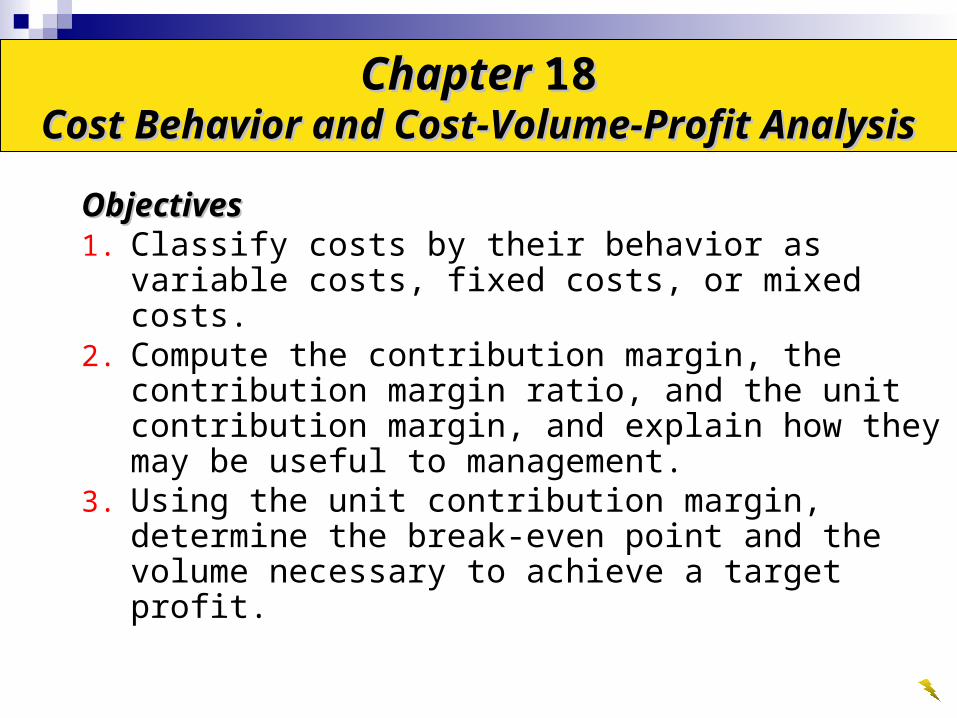
ObjectivesObjectives1. Classify costs by their behavior as variable
costs, fixed costs, or mixed costs.2. Compute the contribution margin, the
contribution margin ratio, and the unit contribution margin, and explain how they may be useful to management.
3. Using the unit contribution margin, determine the break-even point and the volume necessary to achieve a target profit.
Chapter Chapter 1818Cost Behavior and Cost-Volume-Profit AnalysisCost Behavior and Cost-Volume-Profit Analysis

4. Using a cost-volume profit chart and a profit-volume chart, determine the break-even point and the volume necessary to achieve a target profit.
ObjectivesObjectivesObjectivesObjectives
5. Calculate the break-even point for a business selling more than one product.
6. Compute the margin of safety and the operating leverage, and explain how managers use this concept.
7. List the assumptions underlying cost-volume-profit analysis.

Jason Inc. produces stereo sound systems under the brand name of J-Sound. The parts for the stereo are purchased from an outside supplier for $10 per unit (a variable cost).
Variable CostVariable CostVariable CostVariable Cost
Cost BehaviorCost BehaviorCost BehaviorCost Behavior

Total Variable Cost Graph
Tot
al C
osts
$300,000$250,000$200,000$150,000$100,000 $50,000
10 20 300Units Produced (in thousands)
Variable CostVariable CostVariable CostVariable Cost
Unit Variable Cost Graph
$20
$15
$10
$5
0C
ost
per
Un
it10 20 30
Units Produced (000)

Tot
al C
osts
Tot
al C
osts
$300,000$250,000$200,000$150,000$100,000 $50,000
10 20 300
$20$15$10
$5
0
Cos
t per
Uni
t
10 20 30
Number ofUnits
Produced
Units Produced (000)
Units Produced (000)
Direct Materials
Cost per Unit
Total Direct Materials
Cost
5,000 units $10 $ 50,00010,000 10 l00,00015,000 10 150,00020,000 10 200,00025,000 10 250,00030,000 10 300,000
Variable CostVariable CostVariable CostVariable Cost

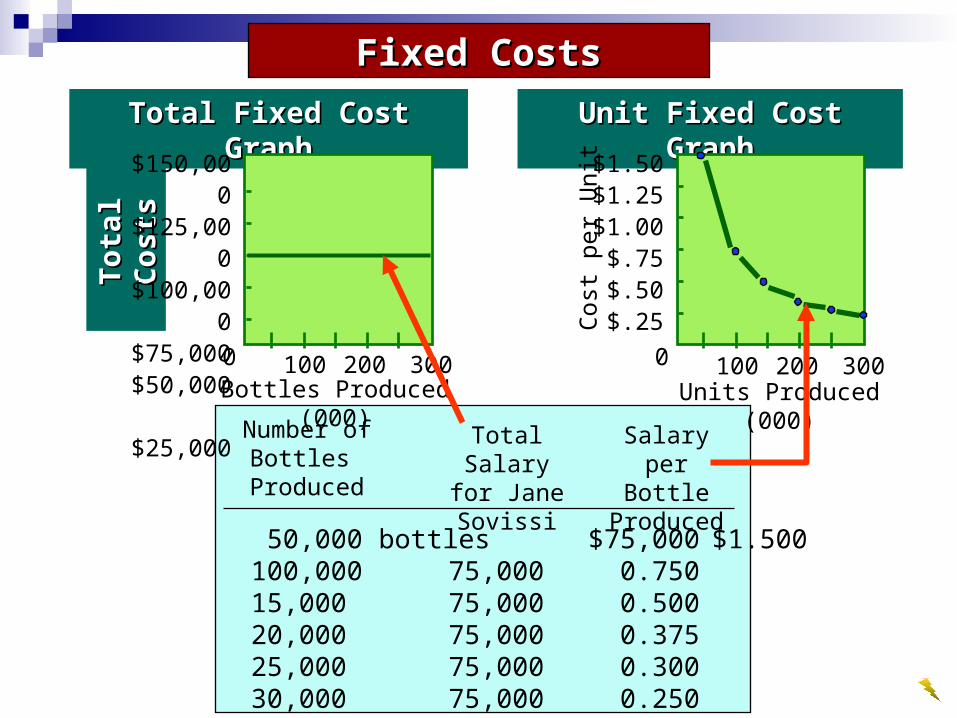
The production supervisor for Minton
Inc.’s Los Angeles plant is Jane Sovissi. She is paid $75,000 per year.
The plant produces from 50,000 to 300,000 bottles of perfume.
La Fleur
Fixed CostsFixed CostsFixed CostsFixed Costs

Number ofBottles
Produced
Total Salary for Jane Sovissi
50,000 bottles $75,000 $1.500100,000 75,000 0.750150,000 75,000 0.500200,000 75,000 0.375250,000 75,000 0.300300,000 75,000 0.250
Salary per Bottle
Produced
Fixed CostsFixed CostsFixed CostsFixed Costs
Fixed CostsFixed Costs
Total Fixed Cost GraphTotal Fixed Cost GraphT
otal
Cos
tsT
otal
Cos
ts
$150,000$125,000$100,000$75,000$50,000
$25,000
100 200 3000
Unit Fixed Cost GraphUnit Fixed Cost Graph
Bottles Produced (000)
Number ofBottles
Produced
Cos
t per
Uni
t $1.50$1.25$1.00
$.75$.50
$.25
100 200 3000
Units Produced (000)
Total Salary for Jane Sovissi
50,000 bottles $75,000 $1.500100,000 75,000 0.75015,000 75,000 0.50020,000 75,000 0.37525,000 75,000 0.30030,000 75,000 0.250
Salary per Bottle
Produced

Simpson Inc. manufactures sails using rented equipment.
The rental charges are $15,000 per year, plus $1 for each machine hour used over
10,000 hours.
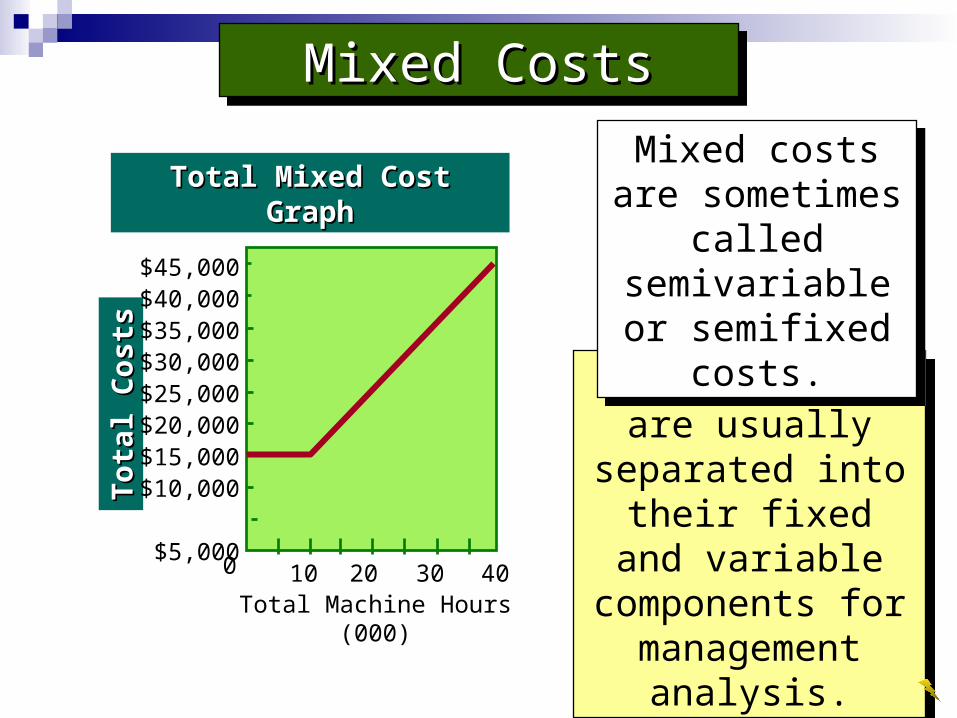
Mixed CostsMixed CostsMixed CostsMixed Costs
Total Mixed Cost GraphTotal Mixed Cost Graph
Tot
al C
osts
Tot
al C
osts
0
Total Machine Hours (000)
$45,000$40,000 $35,000$30,000$25,000$20,000$15,000$10,000 $5,000
10 20 30 40
Mixed costs are usually separated into
their fixed and variable components
for management analysis.
Mixed costs are usually separated into
their fixed and variable components
for management analysis.
Mixed costs are sometimes called semivariable or semifixed costs.
Mixed costs are sometimes called semivariable or semifixed costs.

The high-low method is a simple way to separate mixed costs into their fixed and variable components.
Mixed CostsMixed CostsMixed CostsMixed Costs
Low
High

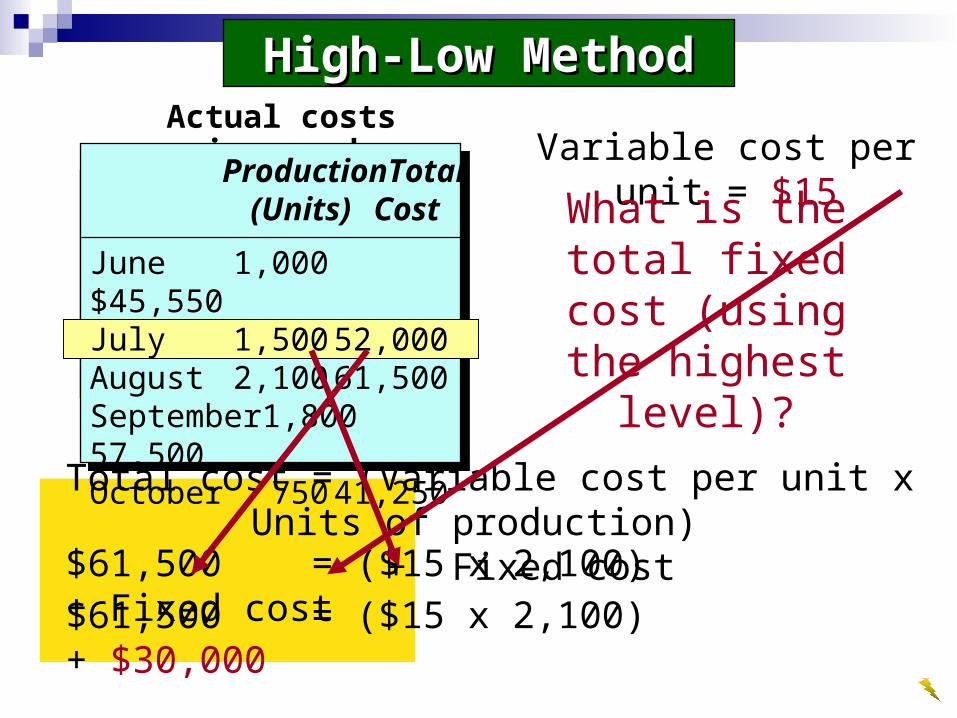
Actual costs incurred
ProductionTotal(Units) Cost $
High-Low MethodHigh-Low Method
Variable cost per unit =
Highest level of activity ($) minus lowest level of activity ($)
Highest level of activity (units) minus lowest level of activity (units)
Activity relates to units of production
June 1,000 $45,550July 1,500 52,000August 2,100 61,500September 1,800 57,500October 750 41,250

$61,500 – $41,250
2,100 – 750
Actual costs incurred
ProductionTotal(Units) Cost
Variable cost per unit =
High-Low MethodHigh-Low Method
June 1,000 $45,550July 1,500 52,000August 2,100 61,500September 1,800 57,500October 750 41,250
= $15
$20,250
1,350=
Actual costs incurred
ProductionTotal(Units) Cost
Variable cost per unit = $15
What is the total fixed cost (using the
highest level)?
Total cost = (Variable cost per unit x Units of production) + Fixed cost
June 1,000 $45,550July 1,500 52,000August 2,100 61,500September 1,800 57,500October 750 41,250
$61,500 = ($15 x 2,100) + Fixed cost
$61,500 = ($15 x 2,100) + $30,000
High-Low MethodHigh-Low Method
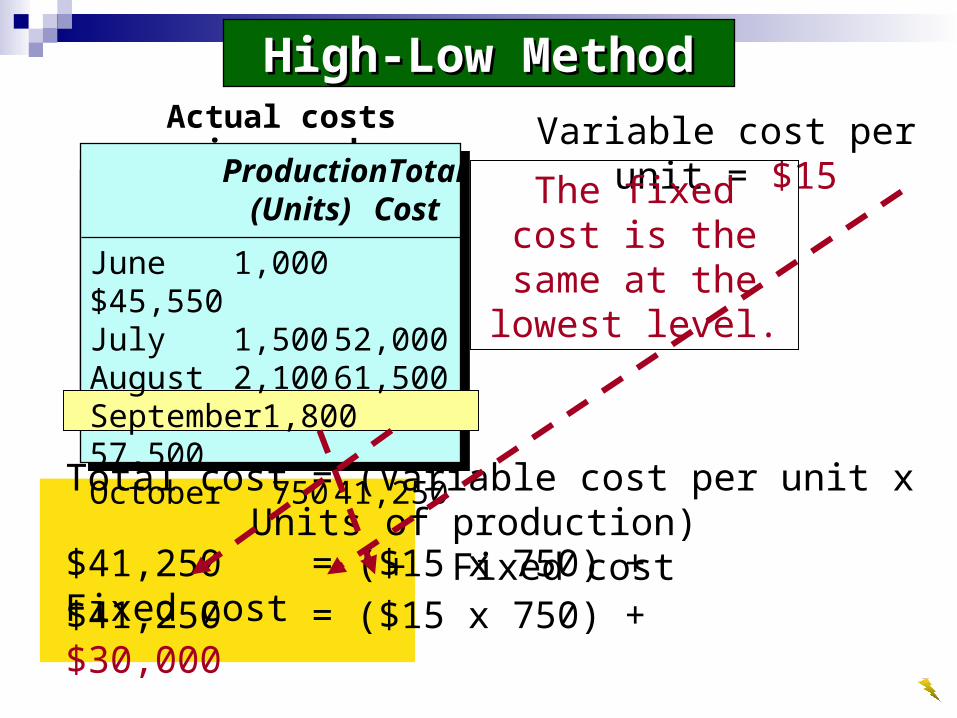
Actual costs incurred
ProductionTotal(Units) Cost
Variable cost per unit = $15
The fixed cost is the same at the lowest
level.
Total cost = (Variable cost per unit x Units of production) + Fixed cost
June 1,000 $45,550July 1,500 52,000August 2,100 61,500September 1,800 57,500October 750 41,250
$41,250 = ($15 x 750) + Fixed cost
$41,250 = ($15 x 750) + $30,000
High-Low MethodHigh-Low Method

Variable CostsVariable Costs
Total Fixed Costs
Total Units Produced
Tot
al C
osts
Total Units Produced
Per
Uni
t Cos
t
Total Variable Costs
Total Units Produced
Unit Variable Costs
Total Units Produced
Tot
al C
osts
Per
Uni
t Cos
t
Fixed CostsFixed Costs
ReviewReviewUnit Fixed CostsUnit costs remain the same regardless of
activity.
Total costs increase and decreases with
activity level.Total costs increase and
decreases proportionately with activity level.
Unit costs remain the same per unit regardless
of activity.

Contribution Margin Income StatementContribution Margin Income Statement
Sales (50,000 units) $1,000,000Variable costs 600,000Contribution margin $ 400,000 Fixed costs 300,000Income from operations $ 100,000
The contribution margin is
available to cover the fixed costs
and income from operations.
The contribution margin is
available to cover the fixed costs
and income from operations.
FIXED FIXED COSTSCOSTS
Contribution margin
Income from Operations

Contribution Margin Income StatementContribution Margin Income Statement
Sales Sales VariableVariablecosts costs
ContributionContributionmarginmargin
– =
Sales (50,000 units) $1,000,000Variable costs 600,000Contribution margin $ 400,000 Fixed costs 300,000Income from operations $ 100,000

Contribution Margin RatioContribution Margin Ratio
100% 60%
40% 30%
10%
Contribution margin ratio =Sales – Variable costs
Sales
Contribution margin ratio =$1,000,000 – $600,000
$1,000,000
Contribution margin ratio = 40%
Sales (50,000 units) $1,000,000Variable costs 600,000Contribution margin $ 400,000 Fixed costs 300,000Income from operations $ 100,000

100% 60%
40% 30%
10%
The contribution margin can be expressed three ways:1. Total contribution margin in dollars.3. Contribution margin ratio (percentage).3. Unit contribution margin (dollars per unit).
The contribution margin can be expressed three ways:1. Total contribution margin in dollars.3. Contribution margin ratio (percentage).3. Unit contribution margin (dollars per unit).
$20 12$ 8
Sales (50,000 units) $1,000,000Variable costs 600,000Contribution margin $ 400,000 Fixed costs 300,000Income from operations $ 100,000
Contribution Margin RatioContribution Margin Ratio

What is the break-even
point?
What is the break-even
point?
Revenues Costs=
Break-even

Calculating the Break-Even PointCalculating the Break-Even PointCalculating the Break-Even PointCalculating the Break-Even Point
At the break-even point, fixed costs and the contribution
margin are equal.
At the break-even point, fixed costs and the contribution
margin are equal.
Sales (? units) $ ?Variable costs ?Contribution margin $ 90,000 Fixed costs 90,000Income from operations $ 0
$25 15$10

9,000 units
Sales ($25 x ? units) $ ?Variable costs ($15 x ? units) ?Contribution margin $ 90,000 Fixed costs 90,000Income from operations $ 0
$25 15$10
Break-even sales (units) =Unit contribution margin
Fixed costs
$90,000
$10
Sales ($25 x 9,000) $225,000Variable costs ($15 x 9,000) 135,000Contribution margin $ 90,000Fixed costs 90,000Income from operations $ 0
Calculating the Break-Even PointCalculating the Break-Even PointCalculating the Break-Even PointCalculating the Break-Even PointIn UnitsIn Units
=
=

Sales ($250 x ? units) $ ?Variable costs ($145 x ? units) ?Contribution margin $ ? Fixed costs 840,000Income from operations $ 0
$250 145$105
Break-even sales (units) =Unit contribution margin
Fixed costs$840,000
$1058,000 units
Calculating the Break-Even PointCalculating the Break-Even PointCalculating the Break-Even PointCalculating the Break-Even PointIn UnitsIn Units
The unit selling price is $250 and unit variable cost is $145. Fixed costs are $840,000.

Sales ($25 x ? units) $ ?Variable costs ($15 x ? units) ?Contribution margin $ ? Fixed costs 840,000Income from operations $ 0
$250 145$105
Break-even sales (units) =Unit contribution margin
Fixed costs$840,000
$1008,400 units
$250 150$100
Next, assume Next, assume variable costs is variable costs is increased by $5.increased by $5.
Next, assume Next, assume variable costs is variable costs is increased by $5.increased by $5.
Calculating the Break-Even PointCalculating the Break-Even PointCalculating the Break-Even PointCalculating the Break-Even PointIn UnitsIn Units
The unit selling price is $250 and unit variable cost is $145. Fixed costs are $840,000.

Sales $ ?Variable costs ?Contribution margin $ ? Fixed costs $600,000Income from operations $ 0
Break-even sales (units) =Unit contribution margin
Fixed costs$600,000
$2030,000 units
$50 30
$20
Calculating the Break-Even PointCalculating the Break-Even PointCalculating the Break-Even PointCalculating the Break-Even PointIn UnitsIn Units
A firm currently sells their product at $50 per unit and it has a related unit variable cost of
$30. The fixed costs are $600,000.

Sales $ ?Variable costs ?Contribution margin $ ? Fixed costs $600,000Income from operations $ 0
Break-even sales (units) =Unit contribution margin
Fixed costs$600,000
$3020,000 units
$50 30
$20
$60 30$30
Calculating the Break-Even PointCalculating the Break-Even PointCalculating the Break-Even PointCalculating the Break-Even PointIn UnitsIn Units
Management increases Management increases the selling price from the selling price from
$50 to $60.$50 to $60.
Management increases Management increases the selling price from the selling price from
$50 to $60.$50 to $60.

Summary of Effects of Changes on Summary of Effects of Changes on Break-Even PointBreak-Even Point
Summary of Effects of Changes on Summary of Effects of Changes on Break-Even PointBreak-Even Point

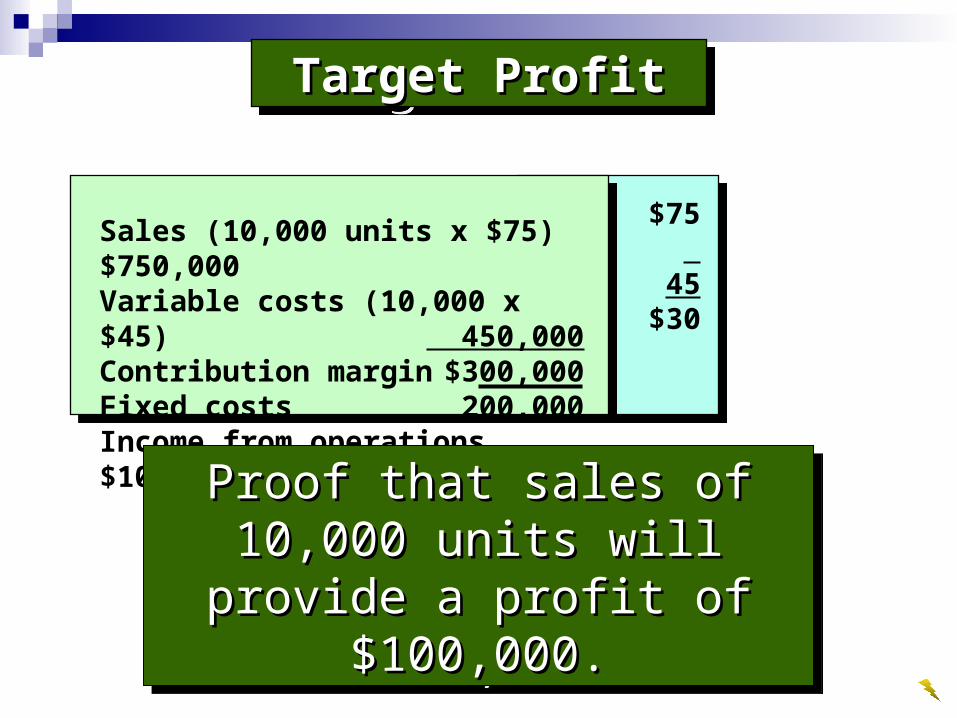
Target ProfitTarget ProfitTarget ProfitTarget Profit
Fixed costs are estimated at $200,000, and the desired profit is $100,000. The unit selling
price is $75 and the unit variable cost is $45. The firm wishes to make a $100,000 profit.
Sales (? units) $ ?Variable costs ?Contribution margin $ ? Fixed costs 200,000Income from operations $ 0
$75 45$35
In Units
In Units

Sales (? units) $ ?Variable costs ?Contribution margin $ ? Fixed costs 200,000Income from operations $ 0
Sales (units) =Unit contribution margin
Fixed costs + target profit$200,000 + $100,000
$3010,000 units
Target ProfitTarget ProfitTarget ProfitTarget Profit In Units
In Units
$75 45$30
$75 45$30
Sales (10,000 units x $75) $750,000Variable costs (10,000 x $45) 450,000Contribution margin $300,000Fixed costs 200,000Income from operations $100,000
Proof that sales of 10,000 units Proof that sales of 10,000 units will provide a profit of $100,000.will provide a profit of $100,000.Proof that sales of 10,000 units Proof that sales of 10,000 units
will provide a profit of $100,000.will provide a profit of $100,000.
Target ProfitTarget ProfitTarget ProfitTarget Profit

Graphic Approach to Cost-Volume-Profit
Analysis
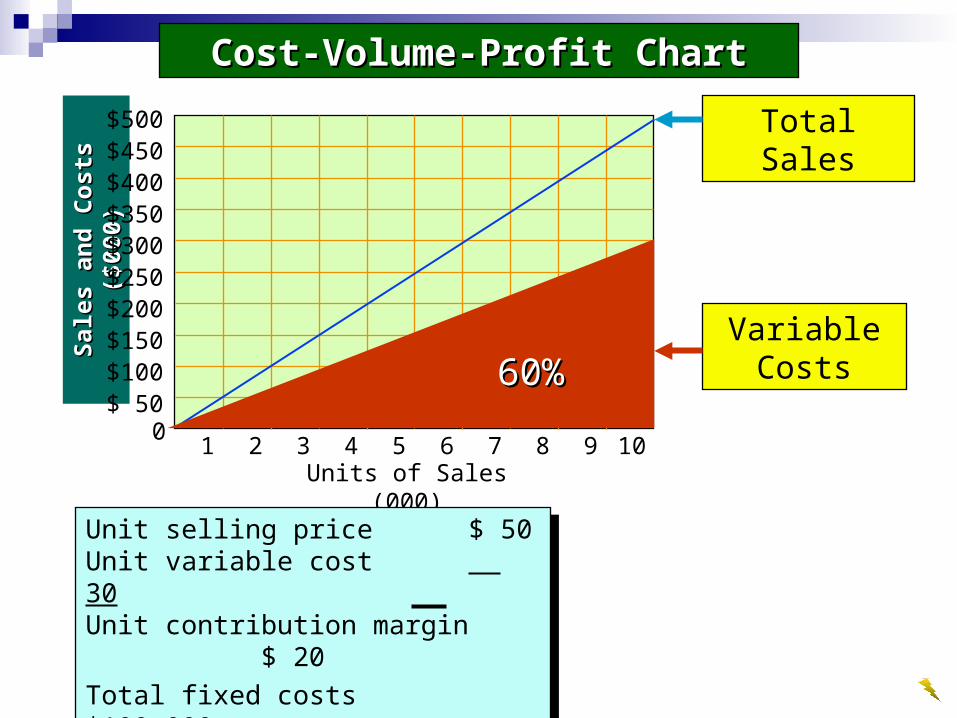
Cost-Volume-Profit ChartCost-Volume-Profit ChartSa
les
and
Cos
ts (
$000
)Sa
les
and
Cos
ts (
$000
)
0
Units of Sales (000)
$500$450$400$350$300$250$200$150$100$ 50
Unit selling price $ 50Unit variable cost 30Unit contribution margin $ 20
Total fixed costs $100,000
Unit selling price $ 50Unit variable cost 30Unit contribution margin $ 20
Total fixed costs $100,000
60%60%
Total Sales
Variable Costs
1 2 3 4 5 6 7 8 9 10
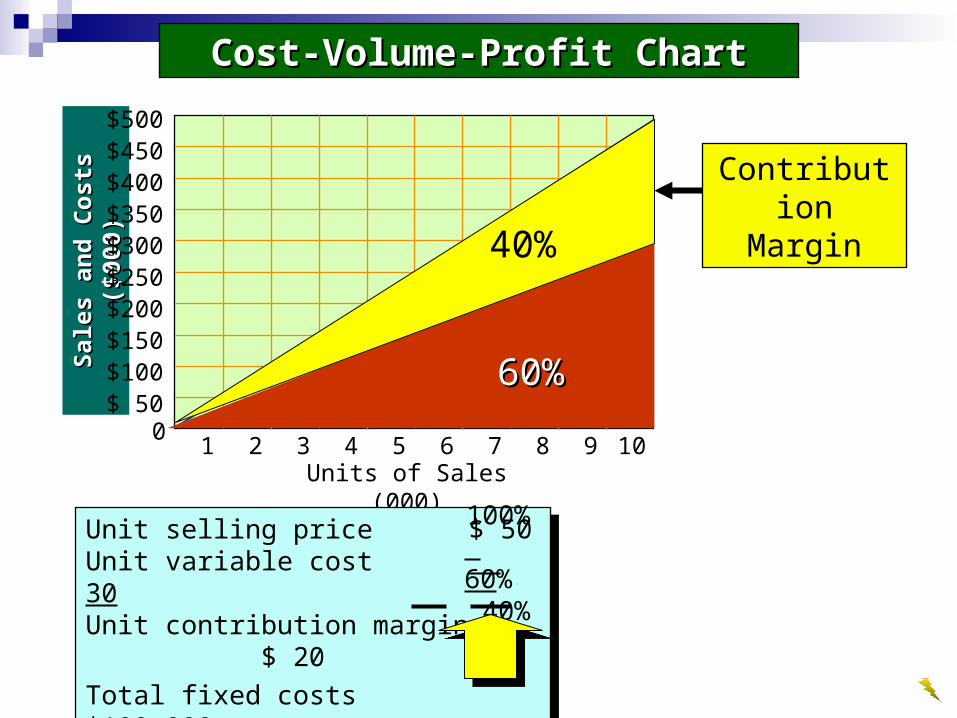
Cost-Volume-Profit ChartCost-Volume-Profit ChartSa
les
and
Cos
ts (
$000
)Sa
les
and
Cos
ts (
$000
)
0
Units of Sales (000)
$500$450$400$350$300$250$200$150$100$ 50
Unit selling price $ 50Unit variable cost 30Unit contribution margin $ 20
Total fixed costs $100,000
Unit selling price $ 50Unit variable cost 30Unit contribution margin $ 20
Total fixed costs $100,000
60%60%
40%
Contribution Margin
100% 60%
40%
1 2 3 4 5 6 7 8 9 10

Cost-Volume-Profit ChartCost-Volume-Profit ChartSa
les
and
Cos
ts (
$000
)Sa
les
and
Cos
ts (
$000
)
0
Units of Sales (000)
$500$450$400$350$300$250$200$150$100$ 50
Unit selling price $ 50Unit variable cost 30Unit contribution margin $ 20
Total fixed costs $100,000
Unit selling price $ 50Unit variable cost 30Unit contribution margin $ 20
Total fixed costs $100,000
Fixed CostsFixed Costs
100% 60%
40%
TotalTotalCostsCosts
1 2 3 4 5 6 7 8 9 10

Cost-Volume-Profit ChartCost-Volume-Profit ChartSa
les
and
Cos
ts (
$000
)Sa
les
and
Cos
ts (
$000
)
0
$500$450$400$350$300$250$200$150$100$ 50
1 2 3 4 5 6 7 8 9 10
Break-Even Point
Units of Sales (000)
Unit selling price $ 50Unit variable cost 30Unit contribution margin $ 20
Total fixed costs $100,000
Unit selling price $ 50Unit variable cost 30Unit contribution margin $ 20
Total fixed costs $100,000
100% 60%
40%$100,000
$20= 5,000 units

Cost-Volume-Profit ChartCost-Volume-Profit ChartSa
les
and
Cos
ts (
$000
)Sa
les
and
Cos
ts (
$000
)
0
Units of Sales (000)
$500$450$400$350$300$250$200$150$100$ 50
Unit selling price $ 50Unit variable cost 30Unit contribution margin $ 20
Total fixed costs $100,000
Unit selling price $ 50Unit variable cost 30Unit contribution margin $ 20
Total fixed costs $100,000
100% 60%
40%
Operating Profit Area
Operating Loss Area


$100$75$50$25$ 0
$(25)$(50)$(75)
$(100)
Sales (10,000 units x $50) $500,000 Variable costs (10,000 units x $30) 300,000
Contribution margin (10,000 units x $20) $200,000 Fixed costs 100,000
Operating profit $100,000
Sales (10,000 units x $50) $500,000 Variable costs (10,000 units x $30) 300,000
Contribution margin (10,000 units x $20) $200,000 Fixed costs 100,000
Operating profit $100,000
Units of Sales (000’s)
1 2 3 4 5 6 7 8 9 10
Relevant range is
10,000 units
Relevant range is
10,000 units
Op
erat
ing
Pro
fit
(Los
s) $
000’
s
Units of Sales (000’s)
1 2 3 4 5 6 7 8 9 10
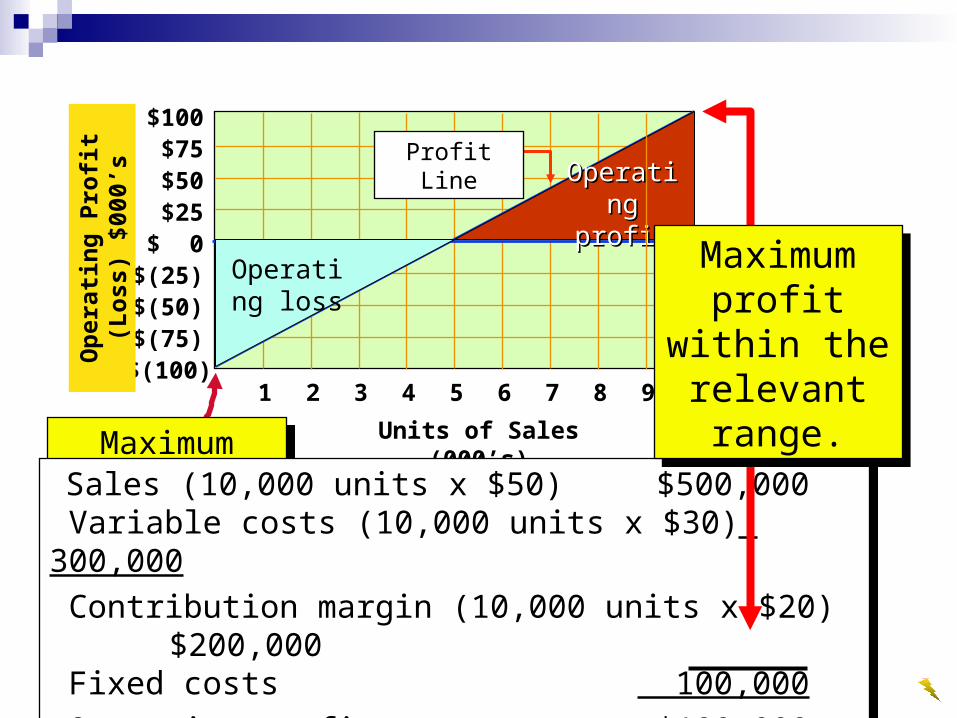
Maximum loss is equal to the
total fixed costs.
Maximum loss is equal to the
total fixed costs.
Profit Line
Operating loss
Operating Operating profitprofit
$100$75$50$25$ 0
$(25)$(50)$(75)
$(100)
Sales (10,000 units x $50) $500,000 Variable costs (10,000 units x $30) 300,000
Contribution margin (10,000 units x $20) $200,000 Fixed costs 100,000
Operating profit $100,000
Sales (10,000 units x $50) $500,000 Variable costs (10,000 units x $30) 300,000
Contribution margin (10,000 units x $20) $200,000 Fixed costs 100,000
Operating profit $100,000
Maximum profit within the relevant
range.
Maximum profit within the relevant
range.
Op
erat
ing
Pro
fit
(Los
s) $
000’
s

Op
erat
ing
Pro
fit
(Los
s) $
000’
s
Units of Sales (000’s)
1 2 3 4 5 6 7 8 9 10
Operating loss
Operating Operating profitprofit
Break-Even Point
Sales (10,000 units x $50) $500,000 Variable costs (10,000 units x $30) 300,000
Contribution margin (10,000 units x $20) $200,000 Fixed costs 100,000
Operating profit $100,000
Sales (10,000 units x $50) $500,000 Variable costs (10,000 units x $30) 300,000
Contribution margin (10,000 units x $20) $200,000 Fixed costs 100,000
Operating profit $100,000
$100$75$50$25$ 0
$(25)$(50)$(75)
$(100)

Sales Mix Considerations

Cascade Company sold 8,000 units of Product A and 2,000 units of Product B during the past year. Cascade Company’s fixed costs are $200,000. Other relevant data are as follows:
Sales $ 90 $140 Variable costs 70 95 Contribution margin $ 20 $ 45 Sales mix 80% 20%
Products A B

Sales $ 90 $140 Variable costs 70 95 Contribution margin $ 20 $ 45 Sales mix 80% 20%
Sales Mix ConsiderationsSales Mix Considerations Sales Mix ConsiderationsSales Mix Considerations
Products A B
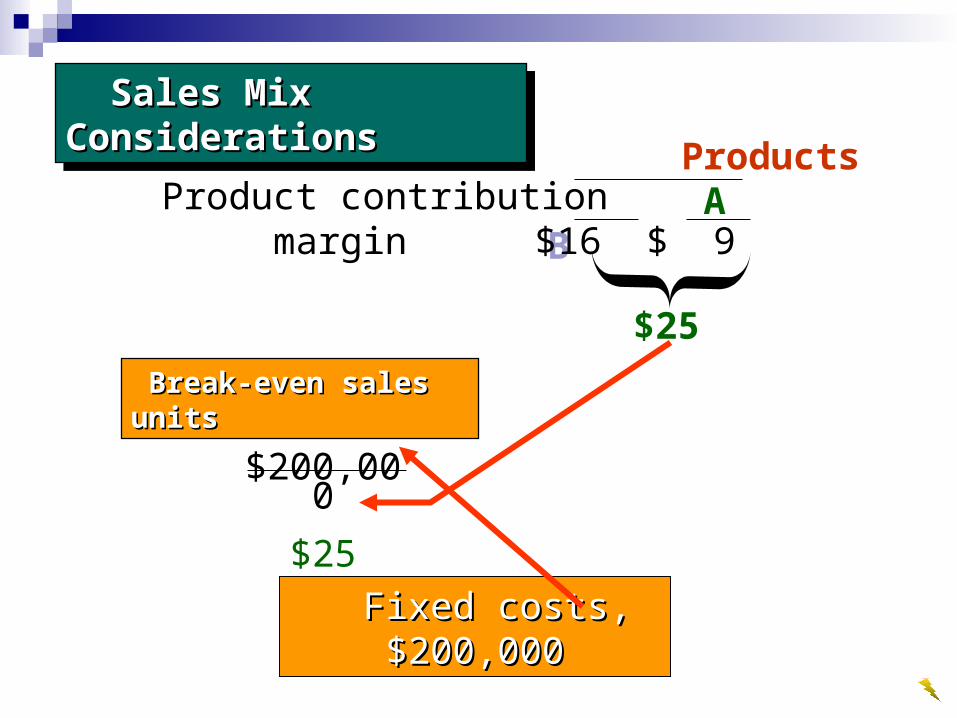
Product contribution margin $16 $ 9
$25
Fixed costs, $200,000Fixed costs, $200,000
Sales Mix ConsiderationsSales Mix Considerations Sales Mix ConsiderationsSales Mix Considerations
Products A BProduct contribution
margin $16 $ 9
$25
Break-even sales unitsBreak-even sales units
$200,000
$25
Fixed costs, $200,000Fixed costs, $200,000

Sales Mix ConsiderationsSales Mix Considerations Sales Mix ConsiderationsSales Mix Considerations
Products A BProduct contribution
margin $16 $ 9
$25
Break-even sales unitsBreak-even sales units
$200,000
$25
Fixed costs, $200,000Fixed costs, $200,000
= 8,000 units

Sales Mix ConsiderationsSales Mix Considerations Sales Mix ConsiderationsSales Mix Considerations
Products A BProduct contribution
margin $16 $ 9
$25
A:A: 8,000 units x Sales Mix (80%) = 6,400
B:B: 8,000 units x Sales Mix (20%) = 1,600

PROOFPROOF
Product A Product B Total
Sales:6,400 units x $90 $576,000 $576,0001,600 units x $140 $224,000 224,000Total sales $576,000 $224,000 $800,000
Variable costs:6,400 x $70 $448,000 $448,0001,600 x $95 $152,000 152,000Total variable costs $448,000 $152,000 $600,000
Contribution margin $128,000 $ 72,000 $200,000
Fixed costs 200,000Income from operations $ 0Break-even point

Margin of Safety

Margin of Safety =Sales – Sales at break-even point
Sales
The margin of safety indicates the possible decrease in sales that may occur
before an operating loss results.
Margin of Safety =$250,000 – $200,000
$250,000
Margin of Safety = 20%

Operating LeverageOperating Leverage

Both companies have the same contribution margin.Both companies have the same contribution margin.
Operating LeverageOperating Leverage
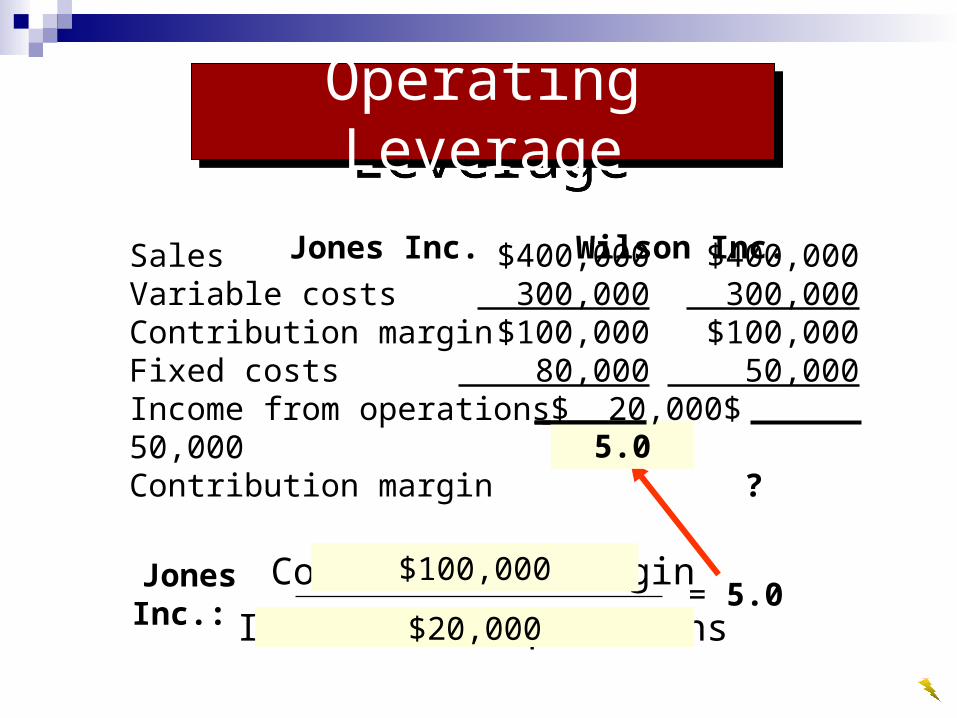
Jones Inc. Wilson Inc.
Contribution margin
Income from operations
Sales $400,000 $400,000Variable costs 300,000 300,000Contribution margin $100,000 $100,000Fixed costs 80,000 50,000Income from operations $ 20,000 $ 50,000Contribution margin ? ?
Contribution margin
Income from operations
Jones Inc. Wilson Inc.
$100,000
$20,000= 5.0 Jones Inc.:
Operating LeverageOperating Leverage
5.0
Sales $400,000 $400,000Variable costs 300,000 300,000Contribution margin $100,000 $100,000Fixed costs 80,000 50,000Income from operations $ 20,000 $ 50,000Contribution margin ?

Contribution margin
Income from operations
Jones Inc. Wilson Inc.
= 5.0
$100,000
$20,000Jones Inc.
Operating LeverageOperating Leverage
Sales $400,000 $400,000Variable costs 300,000 300,000Contribution margin $100,000 $100,000Fixed costs 80,000 50,000Income from operations $ 20,000 $ 50,000Contribution margin 5.0 ?

Contribution margin
Income from operations
Jones Inc. Wilson Inc.
= 2.0$100,000Wilson Inc.:
Capitalintensive?
Laborintensive?
2.0
Operating LeverageOperating Leverage
Sales $400,000 $400,000Variable costs 300,000 300,000Contribution margin $100,000 $100,000Fixed costs 80,000 50,000Income from operations $ 20,000 $ 50,000Contribution margin 5.0
$50,000
Assumptions of Cost-Volume-Profit AnalysisAssumptions of Cost-Volume-Profit AnalysisAssumptions of Cost-Volume-Profit AnalysisAssumptions of Cost-Volume-Profit Analysis
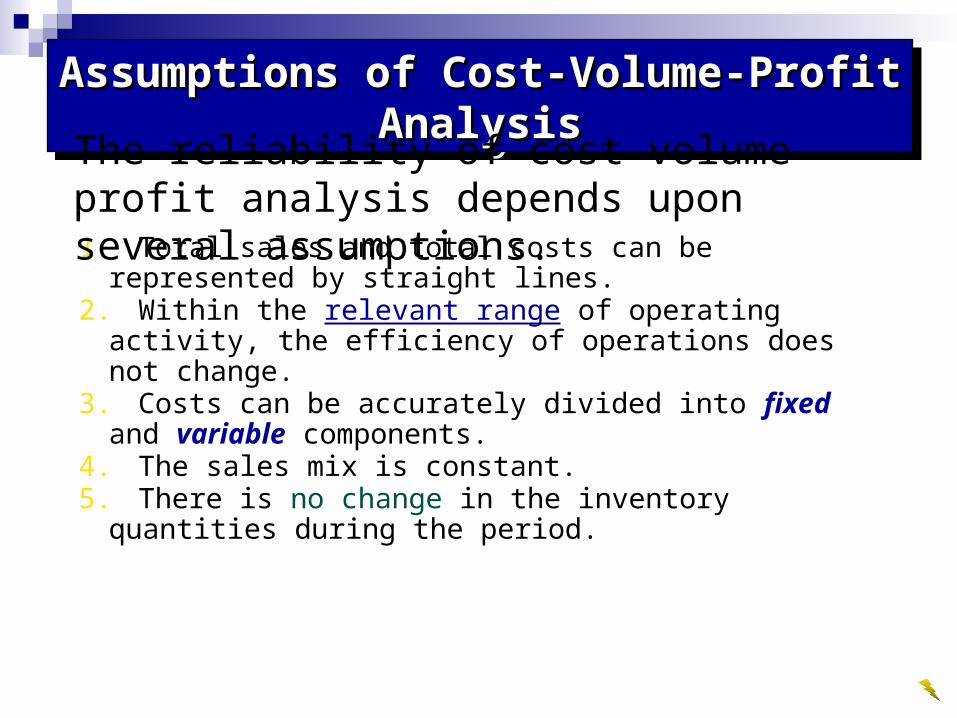
1. Total sales and total costs can be represented by straight lines.
2. Within the relevant range of operating activity, the efficiency of operations does not change.
3. Costs can be accurately divided into fixed and variable components.
4. The sales mix is constant.5. There is no change in the inventory quantities during the
period.
The reliability of cost-volume-profit analysis depends upon several assumptions.
The EndThe End
Chapter 18Chapter 18