Embed Size (px)
Citation preview
Objectives:1.To identify quadratic functions and graphs2.To model data with quadratic functions
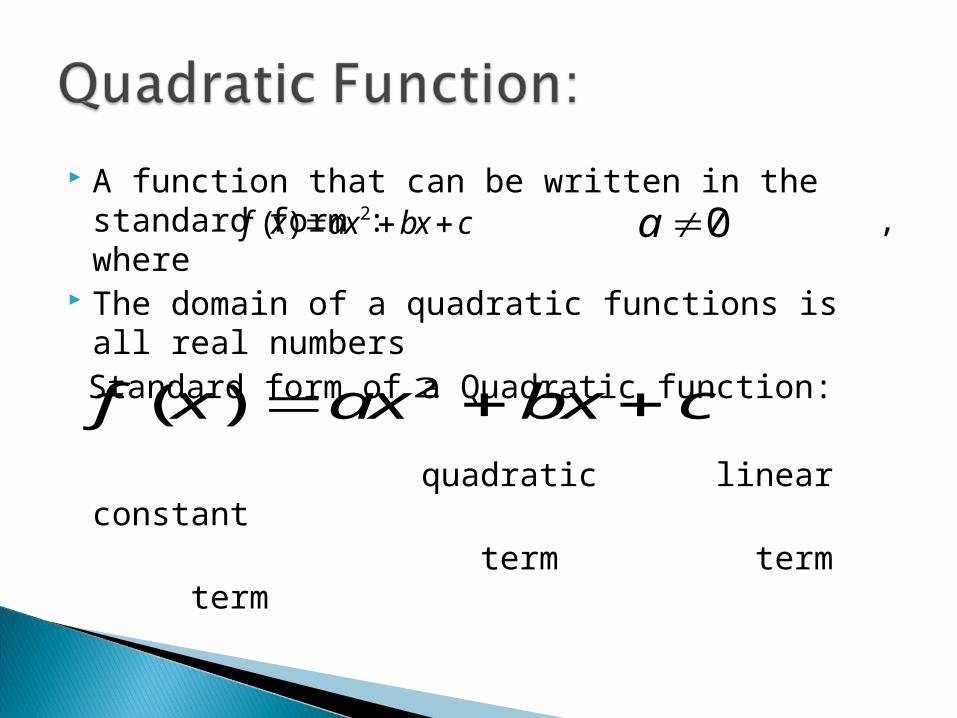
A function that can be written in the standard form : , where
The domain of a quadratic functions is all real numbers
Standard form of a Quadratic function:
quadratic linear constant term term term
2( )f x ax bx c 0a
2( )f x ax bx c
-The graph of a quadratic function is a parabola
-The axis of symmetry is the line that divides a parabola into two parts that are mirror images
-The vertex of a parabola is the point at which the parabola intersects the axis of symmetry
-The y-value of the vertex of a parabola represents the maximum or minimum value of the function
-The axis of symmetry of the graph of a quadratic function is always a vertical line defined by the x-coordinate of the vertex
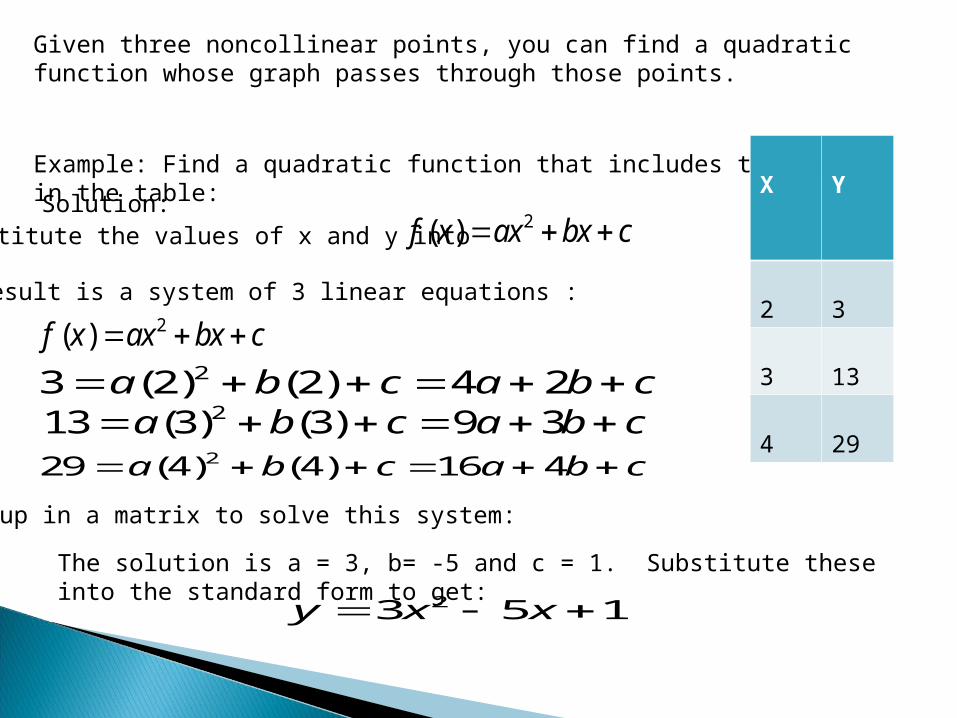
Given three noncollinear points, you can find a quadratic function whose graph passes through those points.
Example: Find a quadratic function that includes the values in the table: X
Y
2 3
3 13
4 29
Solution: Substitute the values of x and y into
2( )f x ax bx c
The result is a system of 3 linear equations :2( )f x ax bx c 23 (2) (2) 4 2a b c a b c 213 (3) (3) 9 3a b c a b c 229 (4) (4) 16 4a b c a b c
Set up in a matrix to solve this system:
The solution is a = 3, b= -5 and c = 1. Substitute these into the standard form to get:23 5 1y x x
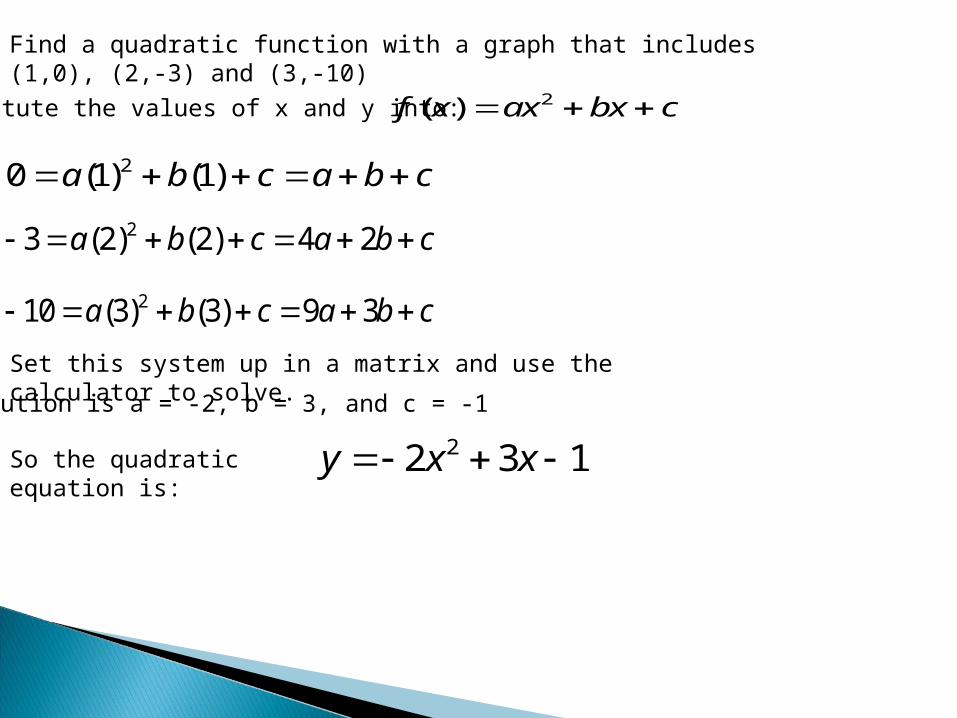
Find a quadratic function with a graph that includes (1,0), (2,-3) and (3,-10)
Substitute the values of x and y into: 2( )f x ax bx c
20 (1) (1)a b c a b c
23 (2) (2) 4 2a b c a b c
210 (3) (3) 9 3a b c a b c
Set this system up in a matrix and use the calculator to solve.
The solution is a = -2, b = 3, and c = -1
So the quadratic equation is: 22 3 1y x x
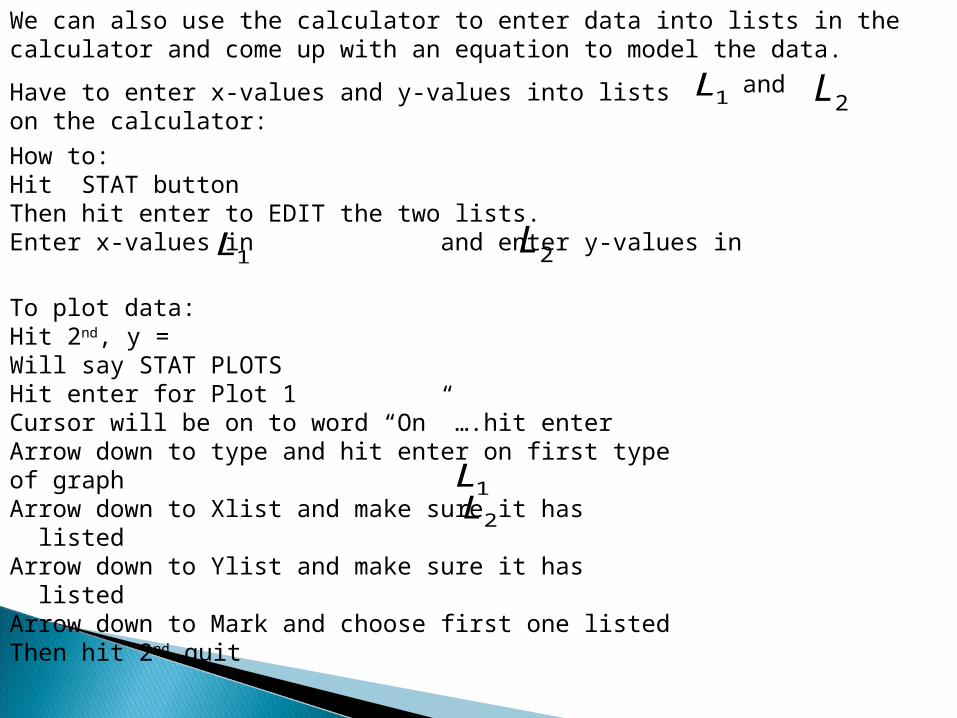
We can also use the calculator to enter data into lists in the calculator and come up with an equation to model the data.
Have to enter x-values and y-values into lists on the calculator: 1L and2L
How to:Hit STAT buttonThen hit enter to EDIT the two lists.Enter x-values in and enter y-values in
1L 2L
To plot data:Hit 2nd, y =Will say STAT PLOTSHit enter for Plot 1Cursor will be on to word “On” ….hit enterArrow down to type and hit enter on first type of graphArrow down to Xlist and make sure it has listedArrow down to Ylist and make sure it has listedArrow down to Mark and choose first one listedThen hit 2nd quit
1L2L
Then hit graph and the data points will be graphed
Once the data is in, we can use the calculator to get an approximate equation to model the data
How to:Hit the STAT buttonArrow right onceThen either hit the number 5 or arrow down to QuadRegQuadReg will appear by itself on the screenHit enterThe calculator will then give you the coefficients for the variables and the constant for the quadratic equation.Write these numbers down and use them to make an equation in the y = editor.After entering this into the y = editor, hit graph again, and you will see the graph going through the previously plotted data points
Do example 4 on page 240