Embed Size (px)
Citation preview

1
Optimizing Care for Patients with Limited Literacy & English ProficiencyDean Schillinger MD, Alicia Fernandez MD
UCSF Professors of Medicine Division of General Internal Medicine
UCSF Center for Vulnerable Populations @ SF General Hospital
DISCLOSURESWhile we both are conflicted, we have no conflicts of interest
and nothing to disclose
Objectives� To review the evidence that limited health literacy and
limited English proficiency (LEP) have untoward health consequences
� To describe how these barriers affect clinical communication
� To provide a brief set of actionable strategies to optimize care for patients with limited health literacy and LEP
Common Social Vulnerabilitiesiolenceninsurediteracy and Languageeglectconomic hardship/food insecurityace/ethnic discordance, discriminationddictionrain disorders, e.g. depression, dementiammigrantegal statussolation/Informal caregiving burdenransportation problemsllness Modelyes and Earshelter
Schillinger 2007
VULNERABILITIES

2
What is Health Literacy?� “The degree to which individuals have the capacity to obtain, process, and understand basic health information and services needed to make [informed] health decisions.”� 3 domains: oral (speaking, listening); written (reading, writing); numerical (quantitative)� ?Web? Patient portals?� Capacity/Preparedness �� Demand Mismatch
Schillinger Am J Bioethics 2007
1st National Assessment of Health Literacy n=19,714
� Below Basic: Circle date on doctor’s appointment slip
� Basic: Give 2 reasons a person with no symptoms should get tested for cancer based on a clearly written pamphlet
� Intermediate: Determine what time to take Rx medicine based on label
� Proficient: Calculate employee share of health insurance costs using table
National Center for Educational Statistics, U.S. De partment of Education, 2003
1st Health Literacy Assessment
Basic
BelowBasic
Proficient14%
12%
53%
22%
National Assessment of Adult Literacy (NAAL): National Center for Educational Statistics, U.S. Department of Education, 2003.
Intermediate
AverageMedicare
Hispanic
n=19,000 U.S. AdultsPatients with Diabetes and Low Literacy Less Likely to Know Correct Management
0 20 40 60 80 100
Percent
Need to Know:symptoms of low blood sugar (hypoglycemia)
Need to Do:
correct action for hypoglycemic symptoms
*Williams et al., Archive of Internal Medicine, 1998
Low
ModerateHigh
LowModerate
High
3
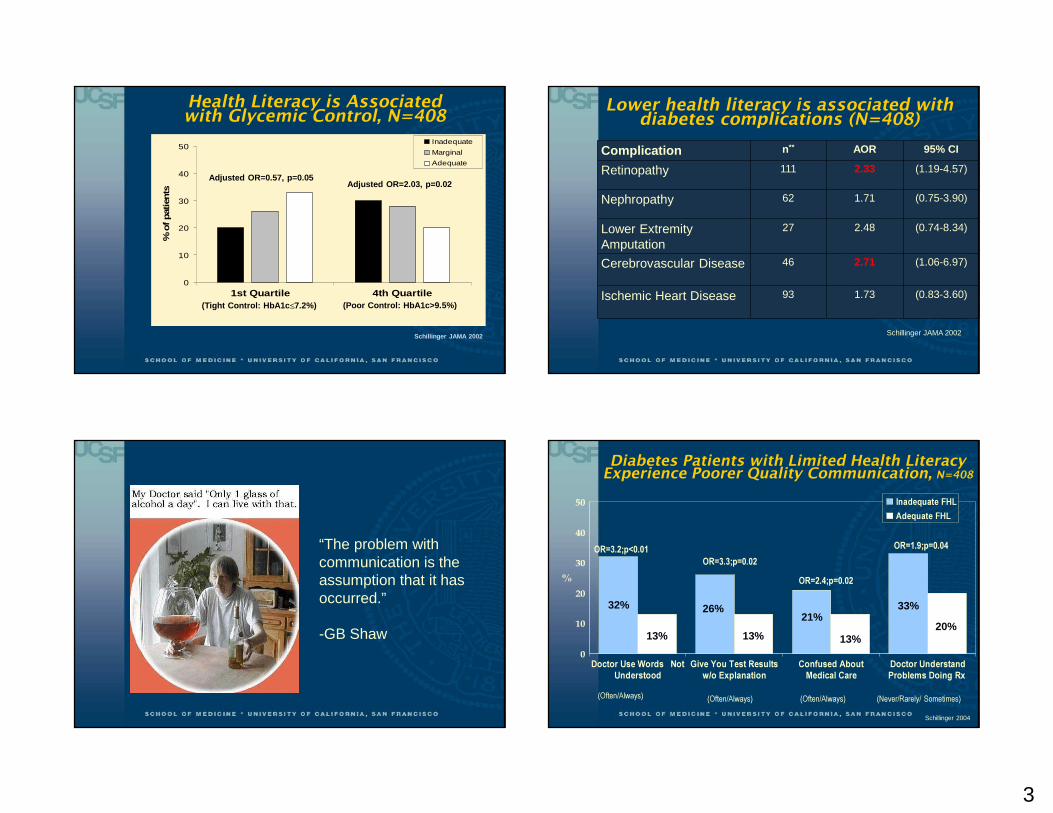
Health Literacy is Associated with Glycemic Control, N=408
0
10
20
30
40
50
1st Quartile 4th Quartile
% o
f pat
ient
s
Inadequate
Marginal
Adequate
(Tight Control: HbA1c ≤7.2%) (Poor Control: HbA1c>9.5%)
Adjusted OR=0.57, p=0.05Adjusted OR=2.03, p=0.02
Schillinger JAMA 2002
Complication n** AOR 95% CI
Retinopathy 111 2.33 (1.19-4.57)
Nephropathy 62 1.71 (0.75-3.90)
Lower Extremity Amputation
27 2.48 (0.74-8.34)
Cerebrovascular Disease 46 2.71 (1.06-6.97)
Ischemic Heart Disease 93 1.73 (0.83-3.60)
Lower health literacy is associated with diabetes complications (N=408)
Schillinger JAMA 2002
“The problem with communication is the assumption that it has occurred.”
-GB Shaw
Diabetes Patients with Limited Health Literacy Experience Poorer Quality Communication, N=408
0
10
20
30
40
50
%
Doctor Use Words NotUnderstood
Give You Test Resultsw/o Explanation
Confused AboutMedical Care
Doctor UnderstandProblems Doing Rx
Inadequate FHLAdequate FHL
(Often/Always) (Often/Always) (Often/Always) (Never/Rarely/ Sometimes)
OR=3.2;p<0.01OR=3.3;p=0.02
OR=2.4;p=0.02
OR=1.9;p=0.04
32%
13% 13% 13%
26%21%
33%
20%
Schillinger 2004

4
Conceptual framework: 4 basic functions of communication in outpatient care
Communication Characteristics
1. Disease state Health outcomes
Treatment adherence
Clinical decision-making
4. Treatment plan
3.Diagnosis
2. Barriers
•Clinician-patientconcordance
elicitation
explanation
Schillinger, AJ Bioethics 2007
Trust/ therapeutic alliance
Recommendation #1: Eliminate Jargon (Use “Living Room Language”)GLUCOMETER
HEMOGLOBIN A1c
DIALYSIS
ANGINA
RISK FACTORS
CREATININE
Jargon Terms…unclarified
� Glucometer � Immunizations� Weight is stable� Microvascular complication� System of nerves� HbA1c� EKG abnormalities� Dialysis� Wide Range� Risk factors� Kidney function� Interact
…clarified� Angina� Microalbuminuria� Ophthalmology� Genetic� Creatinine� Symptoms
…from Patient’s own visit:• benign• blood drawn• blood count
• CAT scan• blood count• correlate• stool was negative• stool• baseline• respiratory tract• polyp
•washed out of your system•receptors•short course•renal clinic•blood cells•increase your R•screening•vaccine
Provide Health Education
29%
Deliver Test Results24%
Provide Recommendations
37%
Assess Symptoms10%
n = 60
Function of Physician Jargon in Outpatient Visit
Castro, Schillinger AJHB 2007
jpm=0.4

5
Would you please tell me in your own words what dialysis means?
In your own words, what do you think the doctor was trying to tell the patient?
“Check something every day.” 1 “Sugar is too high.” 1
“What? Is that about you toes?” 1 “ I can't say it.” 1
“ It means that your diabetes is going worse that you have to exercise to make diabetes.”
1 “Means that more people are getting diabetes.” 1
“You got to get on machine to pump.. redo blood to come up to par.”
4 “That the sugar was not…hmm.” 1
“… regarding kidney.” 2 “Diabetes is one cause of kidney problems.” 3
“That is a warning…about the kidney…my doctor told me about those side effects of the diabetes.”
3
“About dialysis, because they are warning us, they are telling me about the complications…that if I'm having problems in my kidney, I'm going to have dialysis.”
4
“ It’s a way to clean blood get off toxins out the blood.”
4“That you need to be on dialysis to cleanse blood or gonna die.” 4
Dialysis “Do you know what the number one cause for people in this country being on dialysis is? Diabetes”
Recommendation #2: Assess comprehension with the “teach'back” method aka “Closing the Loop”� In this interactive technique, the clinician prioritizes
amongst the information exchange and explicitly asks the patient to “teach-back” what he/she has recalled and understood re those high-priority domains.
� Similarly, clinicians can use the strategy to assess patient’s perceptions of the information or advice given.
� The technique can be used toward the end of a visit or during the course of the visit, so as to tailor communication earlier.
Closing the Loop: Interactive Communication to Enhance Recall & Comprehension
Re-AssessPatient Recall &Comprehension
Adherence
New Concept:Health Information,
Advice, or Change in Management
Provider Explains New Concept
Patient Recalls and Comprehends
AssessPatient Recall & Comprehension
Clarify & Tailor Explanation
We Rarely “Close the Loop” ''But It’s Good When We Do� Physicians assessed recall or comprehension for 15/124 new concepts (12%)
� When new concepts included patient assessment, patient provided incorrect response half the time (7/15=47%)
� Visits using interactive communication loop not longer (20 min vs. 22 min)
� Application of loop associated with better HbA1c (AOR 9.0, p=.02)
Schillinger Arch Int Med 2003

6
Recommendation #2: Assess comprehension by using the “teach'back” method� In this interactive technique, the clinician prioritizes
amongst the information exchange and explicitlyasks patients to “teach-back” what he/she has recalled and understood re high-priority domains.
� Similarly, clinicians can use the strategy to assess patient’s perceptions of the information or advice given.
� The technique can be used toward the end of a visit or during the course of the visit, so as to tailor communication earlier.
How to use “Teach Back”?Example 1 (medication change): � Doctor (to patient): “ I want to make sure I did a good job explaining your heart medications, because this can sometimes be confusing. Can you tell me what changes we decided to make and how you NOW will take the medications? “� Note especially how the physician places the onus of any possible miscommunication on him/herself. In other words, the “teach-back” task is conveyed not as a test of the patient, but of how well the physician explained the concept.
How Not To… Example #2: Taking the Easy Way Out� Doctor (to patient): “Do you understand what we just talked about? “ or “Do you understand the plan regarding your blood pressure medications?” “Did that makes sense?”
� These routine queries, which do not require explicit articulation of recall, comprehension, or perceptions on the part of the patient, will universally be met with an uninformative (and possible falsely re-assuring) “Yes, doctor”.
© American College of Physicians Foundation
http://diabetes.acponline.org/patient/index.html
RECOMMENDATION #3EMPLOY WELL8TESTED VISUAL AIDS

7
25
Carb Counting Vs. Plate Method?
Rothman 2010
Plate Model> Carb Counting>Usual Care in lowering HbA1c, especially for low numeracyBlack=High NumGrey=Low Num
Rothman et al 2010
Recommendation #4: Use Accessible Technology
The future is already here, it's just not evenly di stributedWilliam Gibson The Economist 2003
Randomize 339 Patients with HbA1c >8.0%
•6-10 Patients•Health Educator•Primary Care Physician
Usual Care Monthly Group Medical Visits
Weekly Interactive Technology
Nurse Care Manager
Primary Care Physician
Weekly ATSM
Patient
Cantonese-Speaking
Group
English-Speaking
GroupSpanish-Speaking
Group
Follow-Up Questionnaires (Patient-Centered Outcomes, Functional Status, Glycemic Control, Blood Pressure)
IDEALL PROJECT

8
Key Findings of IDEALL ProgramEstimating Public Health “Reach” of Programs
Composite reach productATSM GMV
� Overall 22.1 4.8
� English 20.0 6.4� Chinese 22.0 2.7� Spanish 24.3 4.0
� Adequate Literacy 15.6 7.6� Limited Literacy 28.0 3.6
Schillinger Health Ed and Behavior 2007
3.9 3.8 3.63.1
1.4
3.6
012345
UC ATSM GMV
Bed Days
*≠
Results: ATSM superior inImproving Quality of Life
13 14
18
6
1717
0
5
10
15
20
UC ATSM GMV
Diabetes Interference
*
pre
post
*P<.05
Rate ratio 0.5 vs UC, 0.35 vs GMV OR 0.37 vs UC
Resources� AHRQ Health Literacy 2016 Toolkit:http://www.ahrq.gov/professionals/quality-patient-safety/quality-resources/tools/literacy-toolkit/index.html?utm_source=DPI&utm_medium=Email&utm_term=16&utm_content=1&utm_campaign=HLUPT
Language Barriers in Health Care

9
Case: LEP patient with diabetes� You are scheduled to see Ana Jimenez, a 53 y old
Mexican-American woman with diabetes. Pre-rounding, you note that her A1c=9.2, LDL= 104, other labs WNL. The transfer note reads “Spanish speaking only, brings daughter”.
� You speak “un poquito” and, depending on circumstances, you “get by” with your skills.
� Is there an evidence base to guide your approach to communicating with Ms. Jimenez?
Learning Objectives� Review growth of LEP population
� Highlight recent evidence on language barriers and DM outcomes� Glycemic control� Lipid, blood pressure control� Patient centered outcomes: trust, respect, satisfaction
� Review practical recommendations for improving communication with LEP patients
NYT, 4/21/15
Growth of US Linguistic Diversity
US Census

10
Defining Limited English ProficiencyUS Census: “How well do you speak English: very well, well, not well, not at all”
�1 in 5 (20%) speak non English language at home
�45% are LEP : English less than “very well”�25% are LEP: English “not well” or “not at all”
�Spanish : 62%�Chinese: 4%
�Many Asian and European languages under 1-2%
If US Spanish(speaking Latinos were a country…. Country Population
(millions)Mexico 115Colombia 45Argentina 42US-SpanishSpeakers
35
::::::::::::::::::::Guatemala 14Honduras 8Nicaragua 6Costa Rica 5 US Census
Back to our patient..� You wonder if Ms. Gonzalez’ poor diabetes control is
related to the fact that she has a language barrier with her clinician. But then again, she has lots of issues: poor, low educational level in Spanish, lots of competing demands, and she has always been reluctant to take medications.
� Does the language barrier really matter? And, if so, how can it best be overcome.

11
DISTANCE: Diabetes Study of Northern California • Data from KPNC: uniform access to care, financial barriers to medication are controlled, interpreters available.
• DISTANCE: survey study of 20,000 patients, conducted in 5 languages including English and Spanish. (PI: Andy Karter, Dean Schillinger)
• Clinical data abstracted from electronic records
Characteristics of 3193 Latino Patients with Diabet es by English Language Ability
English Latinos(n=2683)
LEP Latinos(n=510)
p value
Demographics
Age, mean (SD) 57.3 (10.8) 56.9 (10.8) 0.43
Women, n (%) 1338 (49.9) 326 (63.9) <0.001
Education, n (%)
Less than High School 741 (27.6) 356 (69.8) <0.001
High School or above 1864 (69.5) 148 (29.0)
Annual household Income , n (%)
0-$34,999 898 (33.5) 296 (58.0) <0.001
≥ $35,000 1505 (56.1) 119 (23.3)
Missing 280 (10.8) 95 (18.6)
DM duration, mean (SD) 9.5 (8.2) 9.5 (8.5) 0.97
Comorbidity Score (2005), mean (SD) 4.4 (4.7) 4.0 (4.2) 0.06
Continuous Pharmacy Benefits, n (%) 2533 (94.4) 438 (85.9) <0.001Abbreviations: LEP: Limited English Proficient;
Fernandez, JGIM (2010)
Characteristics of 252 Latino Patients with Diabete s and LEP by Physician-patient Language Concordance
LEP-LC(n=137)
LEP-LD(n=115)
p value
Demographics
Age, mean (SD) 57.5 (11.5) 56.0 (10.5) 0.29
Women, n (%) 85 (62.0) 77 (67.0) 0.42
Education, n (%) *
Less than High School 100 (73.0) 81 (70.4) 0.68
High School or above 33 (24.1) 32 (27.8)
Annual household Income , n (%)
0-$34,999 88 (64.2) 67 (58.3) 0.08
≥ $35,000 37 (27.0) 27 (23.5)
Missing 12 (8.8) 21 (18.3)
DM duration, mean (SD) 9.8 (8.3) 10.1 (10.1) 0.80
Comorbidity Score (2005), mean (SD) 3.7 (3.4) 4.3 (5.2) 0.29
Continuous Pharmacy Benefits, n (%) 113 (82.5) 104 (90.4) 0.07Abbreviations: LEP: Limited English Proficient; LEP-LC: LEP with language concordant physician ; LEP-LD: LEP with language discordant physician
Fernandez, JGIM (2010)
WhiteEnglish
Speakersn=3545
LatinoEnglish
Speakersn=2683
All LEP n=510
LEP - LC n=137
LEP- LD n=115
A1c, mean (SD)
7.2 (1.4) 7.65 (1.71)* 7.81(1.85) 7.58(1.62) 7.99(1.92)
Poor GlycemicControl %
10.0 18.0* 21.4** 16.1 27.8***
Abbreviations: PCP: Primary Care Physician; * Latino English vs. White; **All LEP vs Latino English; LEP: Limited English Proficient; LEP-LC: LEP with language concordant PCP; LEP-LD: LEP with language discordant PCP
Among LEP
Poor Glycemic Control (A1c≥9%) by Race, Language, and PCP Language
Fernandez, JGIM (2010)

12
Language and Glycemic Control• LEP slightly more likely to have poor glycemic control than Latino English-speakers.
• Yet differed greatly by the Spanish skills of their PCP
• LEP patients with Spanish speaking PCP have similar rates of poor glycemic control as Latino English speaking patients
• LEP patients with language discordant PCP are about twice as likely to have poor glycemic control than LEP with Spanish speaking PCPs
Fernandez, JGIM (2011)
Poor Lipid and Blood Pressure Control among Patients with Diabetes by Ethnicity, English Language Proficiency, and Patient�Physician Language Concordance
Ethnicity and English Language ProficiencyAmong Latino LEP
White*Latino English-
speakingⱡ Latino LEPLanguage concordant
Language discordant
Total n=3896 n=2921 n=542 n=147 n=120
LDL > 100, % 33.8* 36.8 32.5ⱡ 29.7 29.7
SBP > 140, % 21.7 20.4 17.3 13.9 14.9
* p ≤ 0.05 for comparisons between white patients and Latino English-speaking patients.ⱡ p ≤ 0.05 for comparisons between Latino English-speaking patients and Latino-LEP patients.
Fernandez, under review
Recommendation #5:� Switch patients with LEP and chronic disease to a
language concordant clinician if chronic disease control is poor
Recommendation # 6: Test your language skills� Two ways to test: self-report and objective
� How well do you speak (language)?� Not at all/poor/fair/very good/excellent
� Patients agreed that docs spoke Spanish or not when self report was at either end of scale.
� Agreement with patient report of MD skills when “fair” : 50%
� New study: How confident are you in conducting medication reconciliation or sensitive discussion: highly
Rosenthal/Fernandez, JIMH2011

13
Language Barriers and Patient –MD Relationship
• Multiple studies have shown less patient satisfaction and lower patient comprehension in language discordant care, even when professional interpreters are involved.
Interpreter System A
Interpreter System B
LanguageConcordant MD
Understood MD
explanation35% 39% 59%
Understood instructions
33% 38% 63%
Gany, JGIM (2007)
Suboptimal Communication By LEP and Language ConcordanceEnglish-proficien
tN=8116
LEPN=522
P value LEP-LCN=210
LEP-LDN=153
P value
Lack of trust in MD
26% 25% 0.37 16% 35% <0.0001
Treatedpoorly because language
2% 12% <0.001 9% 20% 0.001
MD not showing respect
28% 30% 0.31 29% 39% 0.04
MD not listening
33% 28% 0.02 26% 32% 0.24
Schenker/Fernandez, Patient Educ Couns (2010)
Language Barriers and Patient Centered Measures
• Language barriers are associated with:• less trust
• less comprehension• worse patient satisfaction
Overcoming Language Barriers• Evidence for Professional Interpreters
• Analysis of audiotapes show fewer errors• Increased patient satisfaction over ad hoc or no interpreters• Increased satisfaction for clinicians
• Certification and supply problem
• Underuse of interpreters by clinicians
• Patient centered interpreter mediated encounters

14
San Francisco General HospitalLevel 1 Trauma Center for SFCounty Hospital/UCSF PhysiciansUninsured and publically insuredpatients2nd most ethnically diverse MedicalCenter in US140 languages spoken per monthProfessional interpreter availablein 40 languages60 languages on contract
Recommendation # 7: Use Professional interpreters� Multiple studies showing better communication and higher
patient satisfaction with professional interpreters (vs ad hoc, or family)
� Far fewer errors
� Studies also show higher clinician satisfaction
� Physicians who got training in use of professional interpreters were more satisfied (Karliner, JIGM 2004)
Documentation of Informed Consent for Invasive ProceduresLEP
(n=74)%
English(n=74)
% p
Procedure note documenting IC discussion, n (%)
59% 58% 0.9
Consent Form - any language, n (%)70% 85% 0.03
Consent Form - pt’s language n (%)22% 85% <0.001
Fully Documented Informed Consent n (%) 28% 53% 0.003
Schenker/Fernandez, 2007
Recommendation # 8: Technology Raises Rate of Interpreter Use

15
Interpreter Use� MD underuse is common� Quality is uncertain� Technology may help� Payment is problematic
Patient centeredness suffers: audiotape studies Indicate that patients speak less and have values elicited less in interpreter mediated interactions
“What do you think might be causing the problem?”“What worries or concerns you most about this problem?”“What have you done to treat this illness so far?”How were you hoping I could help you most?
Frankel/Stein. The Permanente Journal, 1999.
Recommendation # 8: Elicit patient viewpoint
Answer to MOC question� The following strategy NOT an evidnced-based method to
imprve communication with patients who have limited health literacy and limited English proficiency (LEP) have untoward health consequences:
� Speak LOUDER
Conclusions� Limited health literacy and limited English proficiency
(LEP) are very common in healthcare and often resulkt in untoward health consequences
� These barriers affect clinical communication in ways that can be remediable
� There are a set of actionable strategies that clinicians should employ to optimize care for patients with limited health literacy and LEP� Avoid jargon� Use the teach-back method, elicit patients’ perspectives� Use well-tested visual aids� Use accessible technology� Test your own language skills� Switch patients to language concordant provider when feasible� Always use professional interpreters