Embed Size (px)
Citation preview
CONCURRENCY AND COMPUTATION: PRACTICE AND EXPERIENCEConcurrency Computat.: Pract. Exper. 2009; 21:2213–2231Published online inWiley InterScience (www.interscience.wiley.com). DOI: 10.1002/cpe.1486
Observation and analysis of themulticore performance impacton scientific applications
Tyler A. Simon1,!,† and James McGalliard2
1Computer Sciences Corporation, Greenbelt, MD, U.S.A.2FEDSIM, Greenbelt, MD, U.S.A.
SUMMARY
With the proliferation of large multicore high-performance computing systems, application performanceis often negatively affected. This paper provides benchmark results for a representative workload fromthe Department of Defense High-performance Computing Modernization Program. The tests were runon a Cray XT-3 and XT-4, which use dual- and quad-core AMD Opteron microprocessors. We use acombination of synthetic kernel and application benchmarks to examine the cache performance, MPI taskplacement strategies and compiler optimizations. Our benchmarks show performance behavior similar tothat reported in other studies and sites. Dual- and quad-core tests show a run-time performance penaltycompared with single-core runs on the same systems. We attribute this performance degradation to acombination of L1 to main memory contention and task placement within the application. Copyright ©2009 John Wiley & Sons, Ltd.
Received 6 April 2009; Accepted 23 June 2009
KEY WORDS: multicore; benchmark; high-performance computing; memory contention; MPI
1. INTRODUCTION
Generally speaking, application runtimes on large high-performance computing (HPC) systemswith dual- or quad-core chips are slower when compared, core for core, with single-core chipperformance. This paper provides a multilevel approach to analyzing application performance onmulticore architectures. This paper presents an analysis of the results of a variety of currentlyused applications by examining latencies within the processor, compiler optimizations and theMPI communication layer. We contrast the results with similar studies and synthetic test results.Furthermore, the authors suggest alternatives for addressing the performance loss that the ‘multicoreera’ has introduced to the scientific computing community.
!Correspondence to: Tyler A. Simon, Computer Sciences Corporation, Greenbelt, MD, U.S.A.†E-mail: [email protected]
Copyright 2009 John Wiley & Sons, Ltd.
2214 T. A. SIMON AND J. MCGALLIARD
The synthetic kernel and application benchmark tests were run at the U.S. Army EngineerResearch and Development Center, Department of Defense (DoD) Supercomputer Resource Center(ERDCDSRC) at the U.S. Army Corps of Engineers in Vicksburg, Mississippi. The ERDCDSRC ispart of the DoD high-performance computing modernization program (HPCMP). These tests showperformance behavior and challenges similar to those reported in other studies and at other sites, forexample that contention for memory degrades the performance of multicore processors—in this caseCray cluster systems using dual- and quad-core AMD processors. Low-level memory read/writetime measurements using synthetic kernels are consistent with wall-clock runtimes measured usingapplication software representative of HPCMP science and engineering workloads.This paper is organized as follows:
• Section 2 describes the Sapphire and Jade benchmark systems that the authors used.• Section 3 reviews a sample of prior studies of multicore processor performance.• Section 4 presents our analysis of Sapphire and Jade test results and some contrasting results
from other sites.• Section 5 discusses some of the practical implications of our results.• Section 6 presents our conclusions.
2. BENCHMARK SYSTEMS
For this study, there were two systems that were upgraded with multicore AMD processors, a CrayXT3 that went from single-core to dual-core and a Cray XT-4 that went from dual-core to quad-core,both of which are located at the U.S. Army ERDC in Vicksburg and as of November 2008 areranked internationally at 75th and 45th, respectively [1]. An overview of each system is providedbelow.
2.1. Sapphire
The Sapphire system includes the following and is rated at 42.6 Tflops peak performance.
• 4096 2.6GHz 64-bit Dual-Core AMD-Opteron (8192 computation cores).• 2GB memory per core.• Total Disk Storage 374 TB, Fiber Channel Raid.• 3-D torus using a HyperTransport link to a dedicated Cray SeaStar.• Custom MPI message-passing implementation.
2.2. Jade
The Jade system includes the following and is rated at 36.2 Tflops peak performance.
• 2152 2.1GHz 64-bit Quad-Core AMD-Opteron (8608 computation cores).• 2GB memory per core.• Total Disk Storage 379 TB, Fiber Channel Raid.• 3-D torus using a HyperTransport link to a dedicated Cray SeaStar2.
Copyright 2009 John Wiley & Sons, Ltd. Concurrency Computat.: Pract. Exper. 2009; 21:2213–2231DOI: 10.1002/cpe
MULTICORE PERFORMANCE IMPACT ON SCIENTIFIC APPLICATIONS 2215
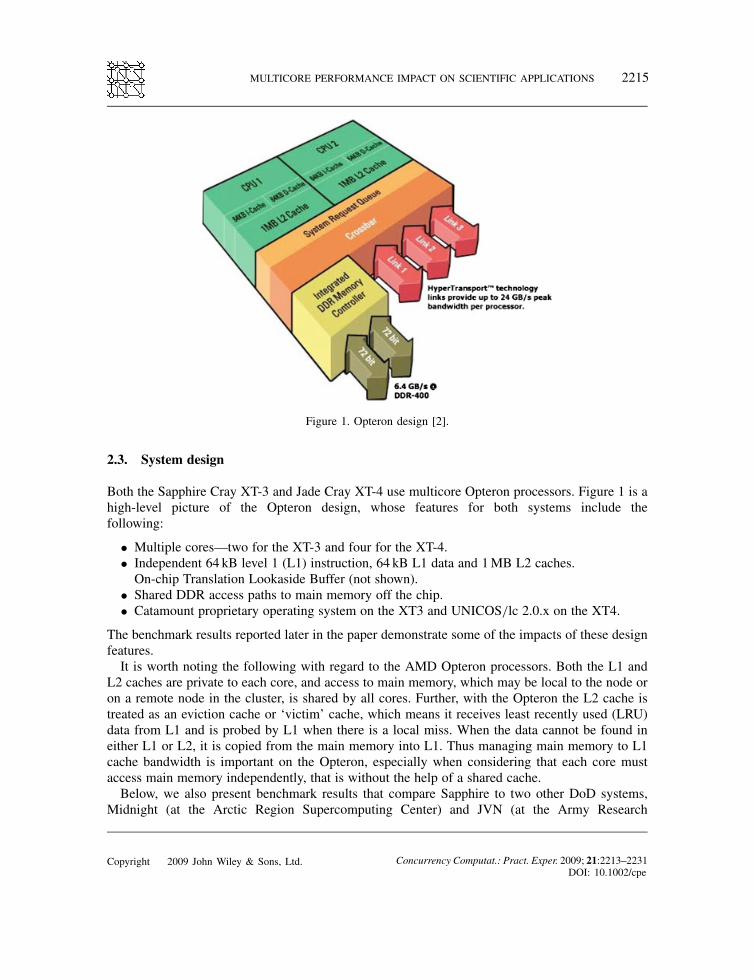
Figure 1. Opteron design [2].
2.3. System design
Both the Sapphire Cray XT-3 and Jade Cray XT-4 use multicore Opteron processors. Figure 1 is ahigh-level picture of the Opteron design, whose features for both systems include thefollowing:
• Multiple cores—two for the XT-3 and four for the XT-4.• Independent 64 kB level 1 (L1) instruction, 64 kB L1 data and 1MB L2 caches.
On-chip Translation Lookaside Buffer (not shown).• Shared DDR access paths to main memory off the chip.• Catamount proprietary operating system on the XT3 and UNICOS/lc 2.0.x on the XT4.
The benchmark results reported later in the paper demonstrate some of the impacts of these designfeatures.It is worth noting the following with regard to the AMD Opteron processors. Both the L1 and
L2 caches are private to each core, and access to main memory, which may be local to the node oron a remote node in the cluster, is shared by all cores. Further, with the Opteron the L2 cache istreated as an eviction cache or ‘victim’ cache, which means it receives least recently used (LRU)data from L1 and is probed by L1 when there is a local miss. When the data cannot be found ineither L1 or L2, it is copied from the main memory into L1. Thus managing main memory to L1cache bandwidth is important on the Opteron, especially when considering that each core mustaccess main memory independently, that is without the help of a shared cache.Below, we also present benchmark results that compare Sapphire to two other DoD systems,
Midnight (at the Arctic Region Supercomputing Center) and JVN (at the Army Research
Copyright 2009 John Wiley & Sons, Ltd. Concurrency Computat.: Pract. Exper. 2009; 21:2213–2231DOI: 10.1002/cpe
2216 T. A. SIMON AND J. MCGALLIARD
Laboratory). The key characteristics of these systems are as follows:Midnight
• Sun Fire X4600.• 716 2.6GHz 64-bit Dual-Core AMD-Opteron (1432 cores).• 4GB memory per core.• Four cores per node.• 64k instruction and 64k data Level 1 cache per core, not shared.• 1MB Level 2 cache per core, not shared.• 4X Voltaire Infiniband commercial network mesh.
JVN
• Linux Networx Evolocity II.• 2048 3.6GHz 64-bit Single-core Intel EM64T Xeon (2048 cores).• 2GB memory per core• Two cores per node.• 12k instruction and 16k data Level 1 cache per core, not shared.• 2MB Level 2 cache per core, not shared.• Myrinet network mesh.
The benchmark results and these specifications yield insights into the multicore performance andstrategies for alleviating the performance bottlenecks.
3. BACKGROUND
The problem of multicore memory contention has received considerable attention in the literature.Dongarra et al. [3] present a concise assessment of the multicore effect on large-scale HPC andput forth a clear agenda for addressing this ‘multicore revolution’ from a software developmentperspective. In general, our results are consistent with others’. Following are some points from priorstudies.Alam et al. [4] pointed out that on the XT3 at the Oak Ridge National Laboratory, the contention
for the memory link shared by multiple cores limits performance and that communications within acore vs. across multiple cores showed an 8–12% benefit. Additionally, they found that appropriateMPI task and memory placement can yield a 25% performance benefit.Regarding the MPI performance on multicore systems, Chai et al. [5] found that around 50%
of the messages are intra-node vice inter-node, so performance gains can be seen by focusing onintra-node optimization. In addition, Chai suggests that multicore aware applications and message-passing algorithms optimized for data locality can improve performance by up to 70%.Finally, Levesque et al. report in [6] that for the NAS benchmarks, the average dual-core degra-
dation was 27%. We compare our NAS kernel results with Levesque’s specific results in Figure 5.Additional noteworthy information from his paper is that the general atomic and molecular
electronic structure system (GAMESS) code showed a 2 to 3% degradation when running in dual-core mode vs. single-core mode—one of the application codes that we also tested. Further resultsshow that the dual-core performance degradation is directly proportional to degradation in memory
Copyright 2009 John Wiley & Sons, Ltd. Concurrency Computat.: Pract. Exper. 2009; 21:2213–2231DOI: 10.1002/cpe
MULTICORE PERFORMANCE IMPACT ON SCIENTIFIC APPLICATIONS 2217
bandwidth and that dual core results have observed memory bandwidth almost exactly one-half ofsingle-core results for the same tests.
4. PERFORMANCE ANALYSIS
Prior to our discussion of application runtimes, we will examine the difference between memorylatencies as we multiply cores on nodes.
4.1. Opteron memory performance
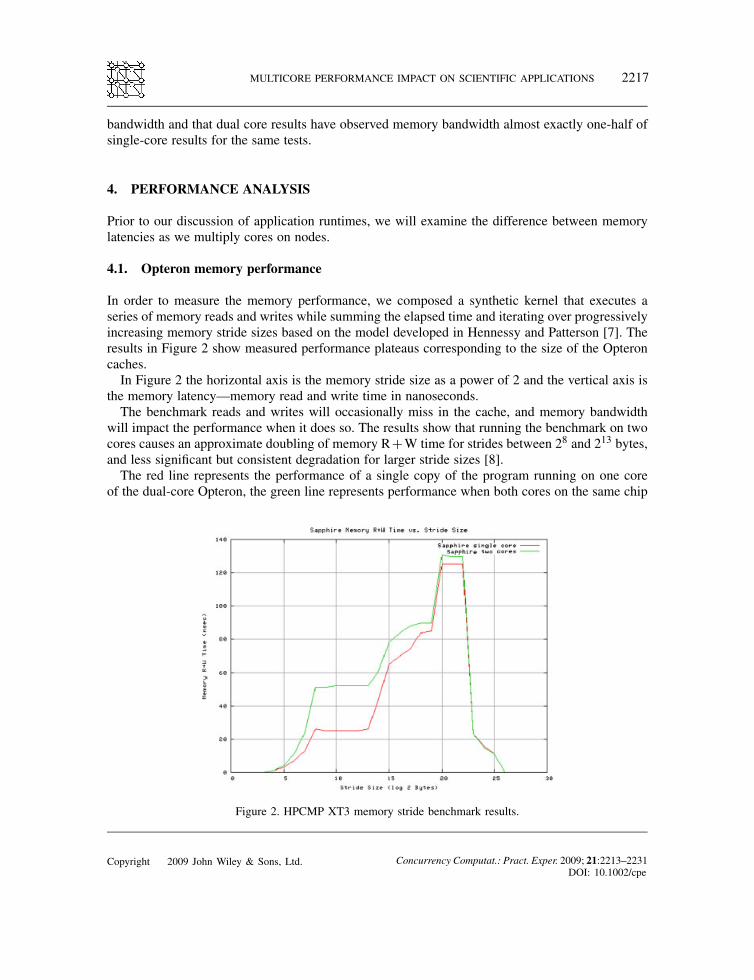
In order to measure the memory performance, we composed a synthetic kernel that executes aseries of memory reads and writes while summing the elapsed time and iterating over progressivelyincreasing memory stride sizes based on the model developed in Hennessy and Patterson [7]. Theresults in Figure 2 show measured performance plateaus corresponding to the size of the Opteroncaches.In Figure 2 the horizontal axis is the memory stride size as a power of 2 and the vertical axis is
the memory latency—memory read and write time in nanoseconds.The benchmark reads and writes will occasionally miss in the cache, and memory bandwidth
will impact the performance when it does so. The results show that running the benchmark on twocores causes an approximate doubling of memory R+W time for strides between 28 and 213 bytes,and less significant but consistent degradation for larger stride sizes [8].The red line represents the performance of a single copy of the program running on one core
of the dual-core Opteron, the green line represents performance when both cores on the same chip
Figure 2. HPCMP XT3 memory stride benchmark results.
Copyright 2009 John Wiley & Sons, Ltd. Concurrency Computat.: Pract. Exper. 2009; 21:2213–2231DOI: 10.1002/cpe
2218 T. A. SIMON AND J. MCGALLIARD
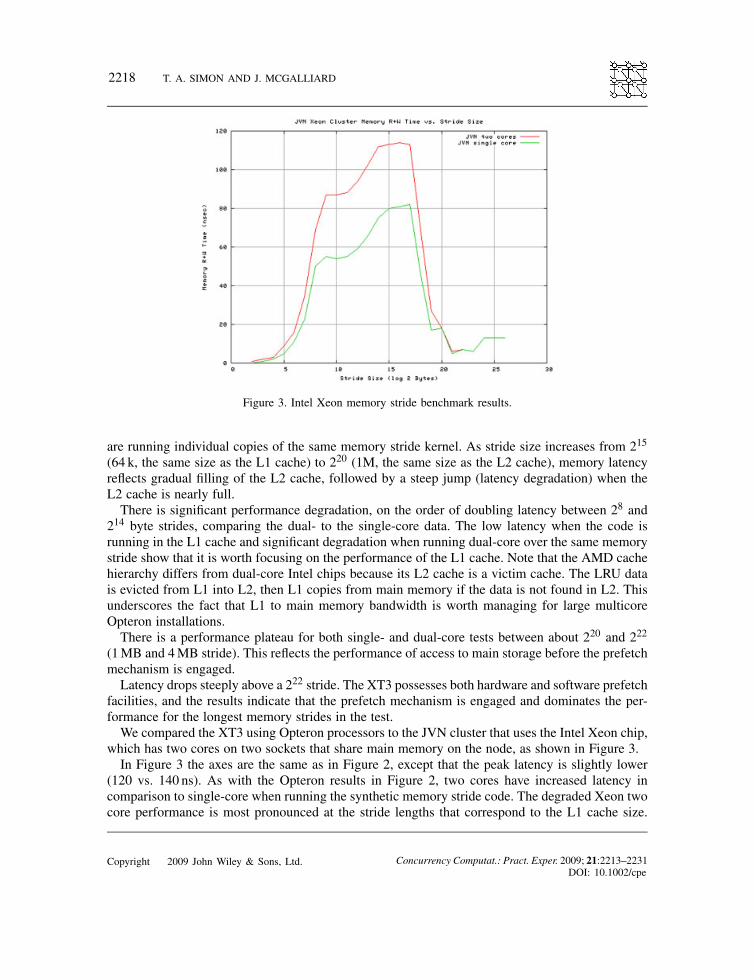
Figure 3. Intel Xeon memory stride benchmark results.
are running individual copies of the same memory stride kernel. As stride size increases from 215
(64 k, the same size as the L1 cache) to 220 (1M, the same size as the L2 cache), memory latencyreflects gradual filling of the L2 cache, followed by a steep jump (latency degradation) when theL2 cache is nearly full.There is significant performance degradation, on the order of doubling latency between 28 and
214 byte strides, comparing the dual- to the single-core data. The low latency when the code isrunning in the L1 cache and significant degradation when running dual-core over the same memorystride show that it is worth focusing on the performance of the L1 cache. Note that the AMD cachehierarchy differs from dual-core Intel chips because its L2 cache is a victim cache. The LRU datais evicted from L1 into L2, then L1 copies from main memory if the data is not found in L2. Thisunderscores the fact that L1 to main memory bandwidth is worth managing for large multicoreOpteron installations.There is a performance plateau for both single- and dual-core tests between about 220 and 222
(1MB and 4MB stride). This reflects the performance of access to main storage before the prefetchmechanism is engaged.Latency drops steeply above a 222 stride. The XT3 possesses both hardware and software prefetch
facilities, and the results indicate that the prefetch mechanism is engaged and dominates the per-formance for the longest memory strides in the test.We compared the XT3 using Opteron processors to the JVN cluster that uses the Intel Xeon chip,
which has two cores on two sockets that share main memory on the node, as shown in Figure 3.In Figure 3 the axes are the same as in Figure 2, except that the peak latency is slightly lower
(120 vs. 140 ns). As with the Opteron results in Figure 2, two cores have increased latency incomparison to single-core when running the synthetic memory stride code. The degraded Xeon twocore performance is most pronounced at the stride lengths that correspond to the L1 cache size.
Copyright 2009 John Wiley & Sons, Ltd. Concurrency Computat.: Pract. Exper. 2009; 21:2213–2231DOI: 10.1002/cpe
MULTICORE PERFORMANCE IMPACT ON SCIENTIFIC APPLICATIONS 2219
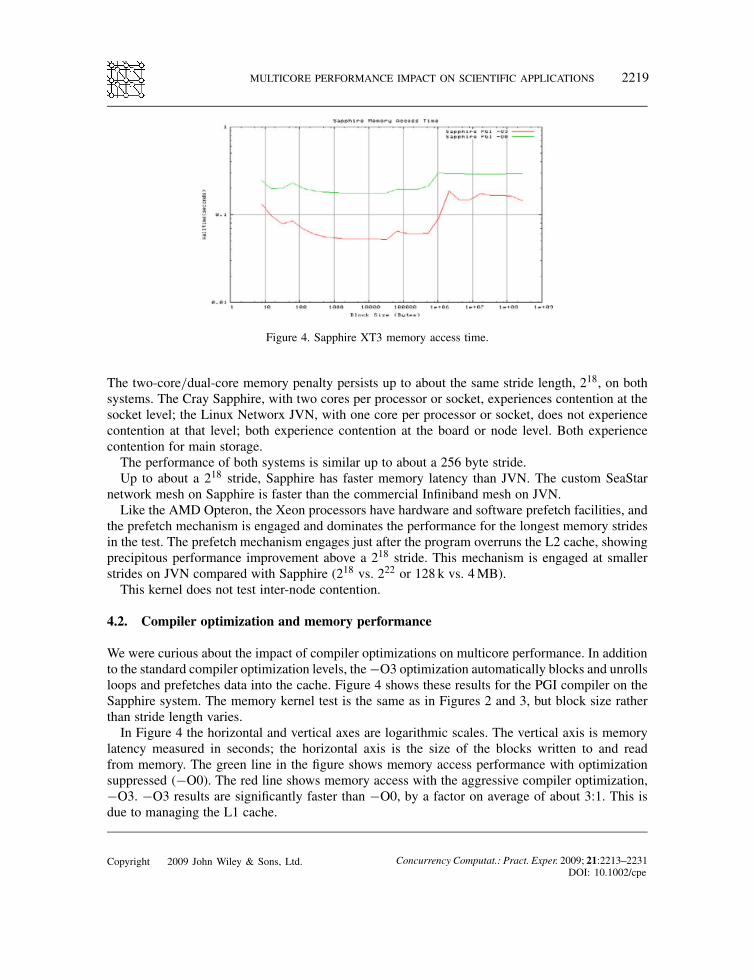
Figure 4. Sapphire XT3 memory access time.
The two-core/dual-core memory penalty persists up to about the same stride length, 218, on bothsystems. The Cray Sapphire, with two cores per processor or socket, experiences contention at thesocket level; the Linux Networx JVN, with one core per processor or socket, does not experiencecontention at that level; both experience contention at the board or node level. Both experiencecontention for main storage.The performance of both systems is similar up to about a 256 byte stride.Up to about a 218 stride, Sapphire has faster memory latency than JVN. The custom SeaStar
network mesh on Sapphire is faster than the commercial Infiniband mesh on JVN.Like the AMD Opteron, the Xeon processors have hardware and software prefetch facilities, and
the prefetch mechanism is engaged and dominates the performance for the longest memory stridesin the test. The prefetch mechanism engages just after the program overruns the L2 cache, showingprecipitous performance improvement above a 218 stride. This mechanism is engaged at smallerstrides on JVN compared with Sapphire (218 vs. 222 or 128 k vs. 4MB).This kernel does not test inter-node contention.
4.2. Compiler optimization and memory performance
We were curious about the impact of compiler optimizations on multicore performance. In additionto the standard compiler optimization levels, the "O3 optimization automatically blocks and unrollsloops and prefetches data into the cache. Figure 4 shows these results for the PGI compiler on theSapphire system. The memory kernel test is the same as in Figures 2 and 3, but block size ratherthan stride length varies.In Figure 4 the horizontal and vertical axes are logarithmic scales. The vertical axis is memory
latency measured in seconds; the horizontal axis is the size of the blocks written to and readfrom memory. The green line in the figure shows memory access performance with optimizationsuppressed ("O0). The red line shows memory access with the aggressive compiler optimization,"O3. "O3 results are significantly faster than "O0, by a factor on average of about 3:1. This isdue to managing the L1 cache.
Copyright 2009 John Wiley & Sons, Ltd. Concurrency Computat.: Pract. Exper. 2009; 21:2213–2231DOI: 10.1002/cpe
2220 T. A. SIMON AND J. MCGALLIARD
Notice that there are performance shifts near the 65k and 1MB block sizes that correspond to theL1 and L2 cache sizes. Once each level of cache fills up and the job starts to access the next level ofcache or main storage, the performance degrades. Note also that the performance improves betweenthe smallest block sizes and about 50 000 bytes. This suggests that as use of the cache increases toa certain point, the latency improves. More data is reused from the cache, so the average latencydrops.
4.3. Effect of main memory bandwidth
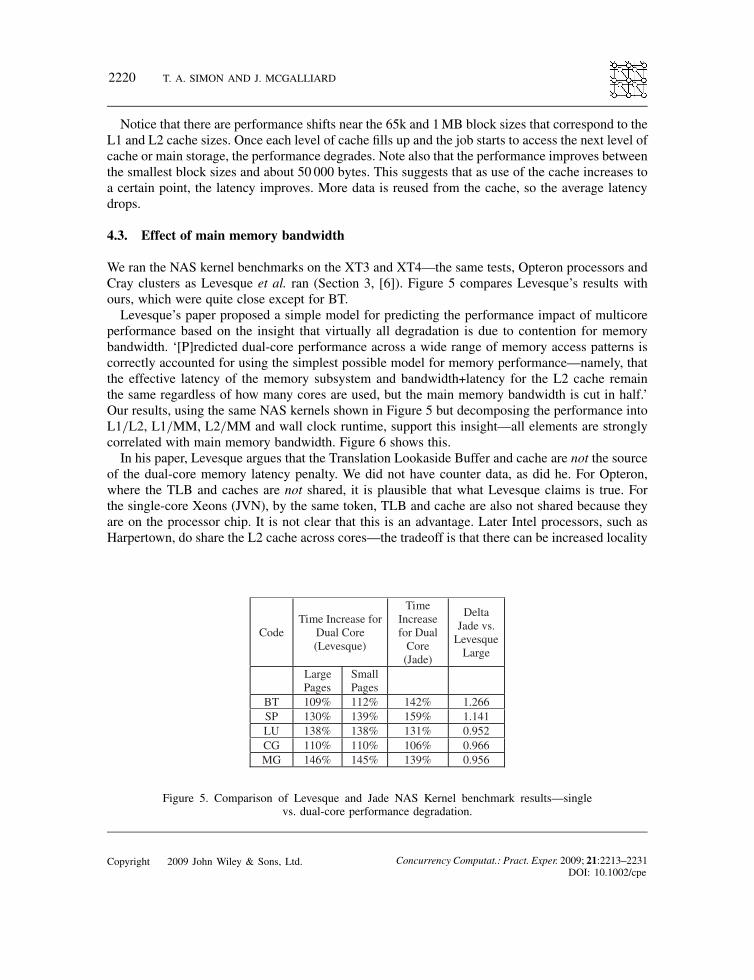
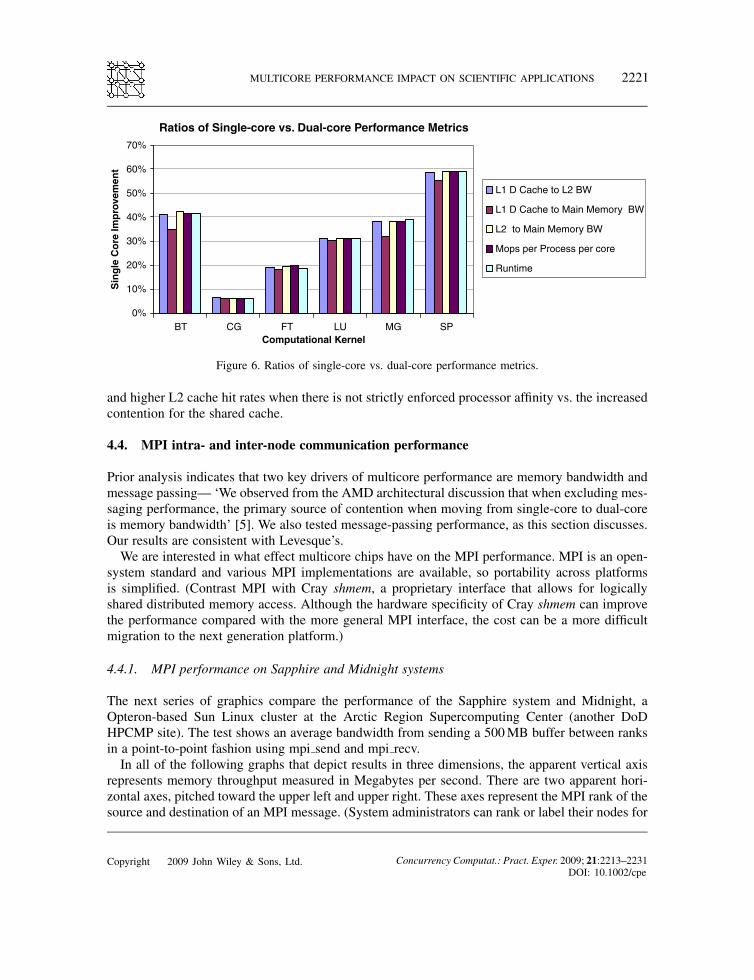
We ran the NAS kernel benchmarks on the XT3 and XT4—the same tests, Opteron processors andCray clusters as Levesque et al. ran (Section 3, [6]). Figure 5 compares Levesque’s results withours, which were quite close except for BT.Levesque’s paper proposed a simple model for predicting the performance impact of multicore
performance based on the insight that virtually all degradation is due to contention for memorybandwidth. ‘[P]redicted dual-core performance across a wide range of memory access patterns iscorrectly accounted for using the simplest possible model for memory performance—namely, thatthe effective latency of the memory subsystem and bandwidth+latency for the L2 cache remainthe same regardless of how many cores are used, but the main memory bandwidth is cut in half.’Our results, using the same NAS kernels shown in Figure 5 but decomposing the performance intoL1/L2, L1/MM, L2/MM and wall clock runtime, support this insight—all elements are stronglycorrelated with main memory bandwidth. Figure 6 shows this.In his paper, Levesque argues that the Translation Lookaside Buffer and cache are not the source
of the dual-core memory latency penalty. We did not have counter data, as did he. For Opteron,where the TLB and caches are not shared, it is plausible that what Levesque claims is true. Forthe single-core Xeons (JVN), by the same token, TLB and cache are also not shared because theyare on the processor chip. It is not clear that this is an advantage. Later Intel processors, such asHarpertown, do share the L2 cache across cores—the tradeoff is that there can be increased locality
Code Time Increase for
Dual Core (Levesque)
Time Increase for Dual
Core (Jade)
Delta Jade vs.
Levesque Large
Large Pages
Small Pages
BT 109% 112% 142% 1.266 SP 130% 139% 159% 1.141 LU 138% 138% 131% 0.952 CG 110% 110% 106% 0.966 MG 146% 145% 139% 0.956
Figure 5. Comparison of Levesque and Jade NAS Kernel benchmark results—singlevs. dual-core performance degradation.
Copyright 2009 John Wiley & Sons, Ltd. Concurrency Computat.: Pract. Exper. 2009; 21:2213–2231DOI: 10.1002/cpe
MULTICORE PERFORMANCE IMPACT ON SCIENTIFIC APPLICATIONS 2221
Ratios of Single-core vs. Dual-core Performance Metrics
0%
10%
20%
30%
40%
50%
60%
70%
BTComputational Kernel
Sin
gle
Cor
e Im
prov
emen
t
L1 D Cache to L2 BW
L1 D Cache to Main Memory BW
L2 to Main Memory BW
Mops per Process per core
Runtime
CG FT LU MG SP
Figure 6. Ratios of single-core vs. dual-core performance metrics.
and higher L2 cache hit rates when there is not strictly enforced processor affinity vs. the increasedcontention for the shared cache.
4.4. MPI intra- and inter-node communication performance
Prior analysis indicates that two key drivers of multicore performance are memory bandwidth andmessage passing— ‘We observed from the AMD architectural discussion that when excluding mes-saging performance, the primary source of contention when moving from single-core to dual-coreis memory bandwidth’ [5]. We also tested message-passing performance, as this section discusses.Our results are consistent with Levesque’s.We are interested in what effect multicore chips have on the MPI performance. MPI is an open-
system standard and various MPI implementations are available, so portability across platformsis simplified. (Contrast MPI with Cray shmem, a proprietary interface that allows for logicallyshared distributed memory access. Although the hardware specificity of Cray shmem can improvethe performance compared with the more general MPI interface, the cost can be a more difficultmigration to the next generation platform.)
4.4.1. MPI performance on Sapphire and Midnight systems
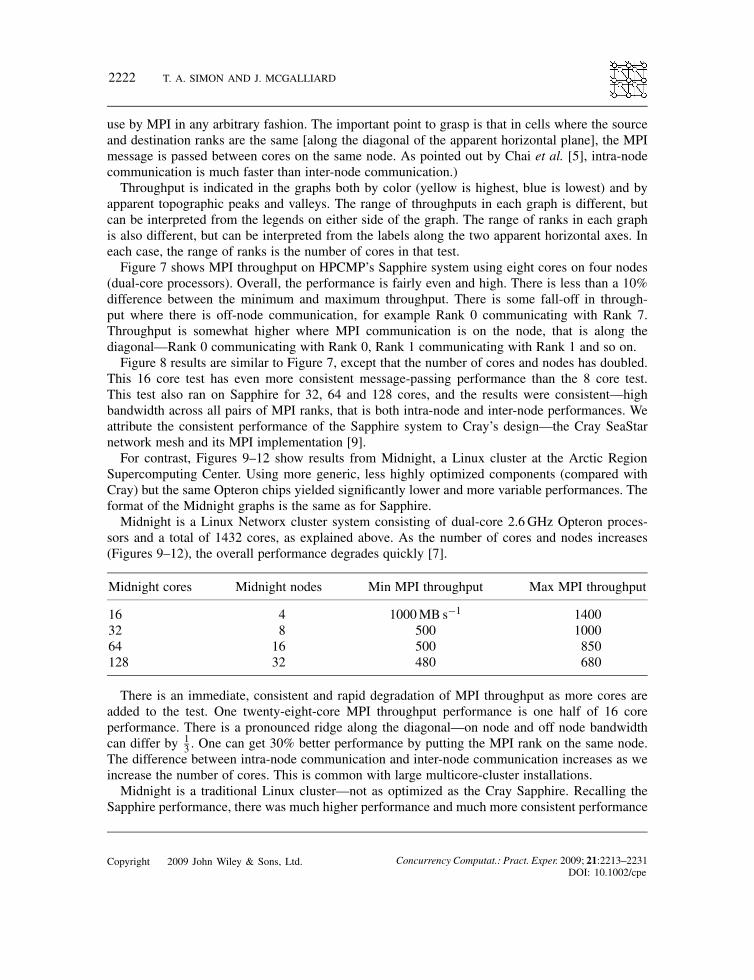
The next series of graphics compare the performance of the Sapphire system and Midnight, aOpteron-based Sun Linux cluster at the Arctic Region Supercomputing Center (another DoDHPCMP site). The test shows an average bandwidth from sending a 500MB buffer between ranksin a point-to-point fashion using mpi send and mpi recv.In all of the following graphs that depict results in three dimensions, the apparent vertical axis
represents memory throughput measured in Megabytes per second. There are two apparent hori-zontal axes, pitched toward the upper left and upper right. These axes represent the MPI rank of thesource and destination of an MPI message. (System administrators can rank or label their nodes for
Copyright 2009 John Wiley & Sons, Ltd. Concurrency Computat.: Pract. Exper. 2009; 21:2213–2231DOI: 10.1002/cpe
2222 T. A. SIMON AND J. MCGALLIARD
use by MPI in any arbitrary fashion. The important point to grasp is that in cells where the sourceand destination ranks are the same [along the diagonal of the apparent horizontal plane], the MPImessage is passed between cores on the same node. As pointed out by Chai et al. [5], intra-nodecommunication is much faster than inter-node communication.)Throughput is indicated in the graphs both by color (yellow is highest, blue is lowest) and by
apparent topographic peaks and valleys. The range of throughputs in each graph is different, butcan be interpreted from the legends on either side of the graph. The range of ranks in each graphis also different, but can be interpreted from the labels along the two apparent horizontal axes. Ineach case, the range of ranks is the number of cores in that test.Figure 7 shows MPI throughput on HPCMP’s Sapphire system using eight cores on four nodes
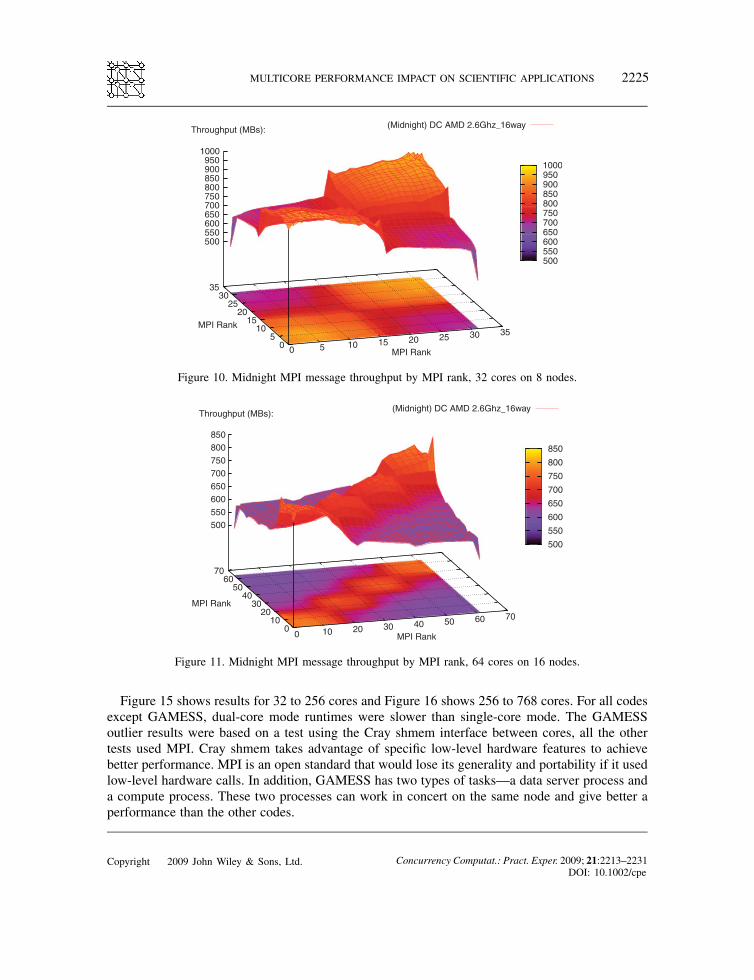
(dual-core processors). Overall, the performance is fairly even and high. There is less than a 10%difference between the minimum and maximum throughput. There is some fall-off in through-put where there is off-node communication, for example Rank 0 communicating with Rank 7.Throughput is somewhat higher where MPI communication is on the node, that is along thediagonal—Rank 0 communicating with Rank 0, Rank 1 communicating with Rank 1 and so on.Figure 8 results are similar to Figure 7, except that the number of cores and nodes has doubled.
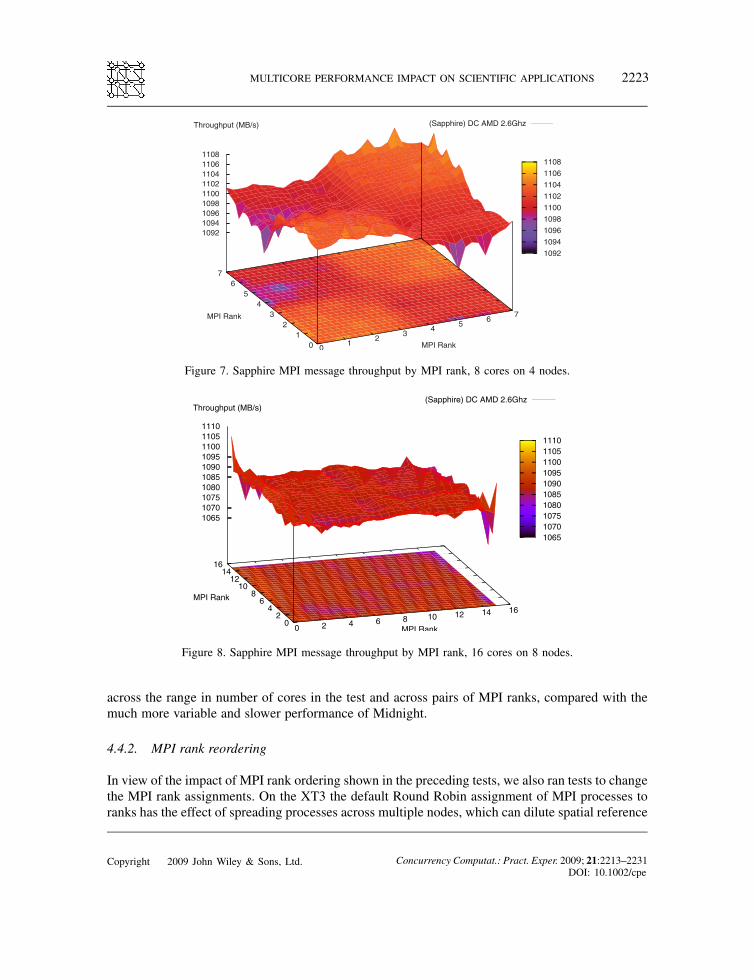
This 16 core test has even more consistent message-passing performance than the 8 core test.This test also ran on Sapphire for 32, 64 and 128 cores, and the results were consistent—highbandwidth across all pairs of MPI ranks, that is both intra-node and inter-node performances. Weattribute the consistent performance of the Sapphire system to Cray’s design—the Cray SeaStarnetwork mesh and its MPI implementation [9].For contrast, Figures 9–12 show results from Midnight, a Linux cluster at the Arctic Region
Supercomputing Center. Using more generic, less highly optimized components (compared withCray) but the same Opteron chips yielded significantly lower and more variable performances. Theformat of the Midnight graphs is the same as for Sapphire.Midnight is a Linux Networx cluster system consisting of dual-core 2.6GHz Opteron proces-
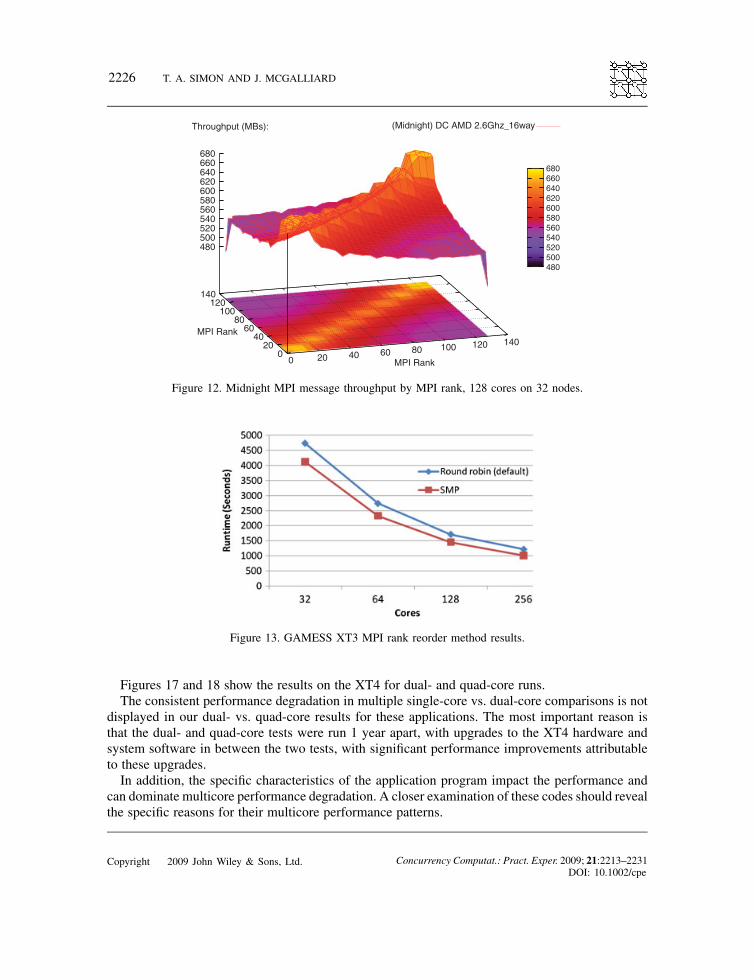
sors and a total of 1432 cores, as explained above. As the number of cores and nodes increases(Figures 9–12), the overall performance degrades quickly [7].
Midnight cores Midnight nodes Min MPI throughput Max MPI throughput
16 4 1000MB s"1 140032 8 500 100064 16 500 850128 32 480 680
There is an immediate, consistent and rapid degradation of MPI throughput as more cores areadded to the test. One twenty-eight-core MPI throughput performance is one half of 16 coreperformance. There is a pronounced ridge along the diagonal—on node and off node bandwidthcan differ by 1
3 . One can get 30% better performance by putting the MPI rank on the same node.The difference between intra-node communication and inter-node communication increases as weincrease the number of cores. This is common with large multicore-cluster installations.Midnight is a traditional Linux cluster—not as optimized as the Cray Sapphire. Recalling the
Sapphire performance, there was much higher performance and much more consistent performance
Copyright 2009 John Wiley & Sons, Ltd. Concurrency Computat.: Pract. Exper. 2009; 21:2213–2231DOI: 10.1002/cpe
MULTICORE PERFORMANCE IMPACT ON SCIENTIFIC APPLICATIONS 2223
Figure 7. Sapphire MPI message throughput by MPI rank, 8 cores on 4 nodes.
Figure 8. Sapphire MPI message throughput by MPI rank, 16 cores on 8 nodes.
across the range in number of cores in the test and across pairs of MPI ranks, compared with themuch more variable and slower performance of Midnight.
4.4.2. MPI rank reordering
In view of the impact of MPI rank ordering shown in the preceding tests, we also ran tests to changethe MPI rank assignments. On the XT3 the default Round Robin assignment of MPI processes toranks has the effect of spreading processes across multiple nodes, which can dilute spatial reference
Copyright 2009 John Wiley & Sons, Ltd. Concurrency Computat.: Pract. Exper. 2009; 21:2213–2231DOI: 10.1002/cpe
2224 T. A. SIMON AND J. MCGALLIARD
1000 1050 1100 1150 1200 1250 1300 1350 1400
(Midnight) DC AMD 2.6Ghz_16way
0 2 4 6 8 10 12 14 16
MPI Rank 0
2 4
6 8
10 12
14 16
MPI Rank
1000 1050 1100 1150 1200 1250 1300 1350 1400
Throughput (MBs):
Figure 9. Midnight MPI message throughput by MPI rank, 16 cores on 4 nodes.
locality and degrade performance. The symmetric multiprocessing (SMP) MPI option increasesreference locality, increases the proportion of intra-core vice inter-core message traffic and soimproves performance on certain codes. Figure 13 illustrates the results of running the GAMESSapplication with both placement policies on Sapphire; we can see that as the core count increasedthe performance, gains are reduced. This is likely caused by inter-node communication overhead.The following section shows the benchmark results for complex application software pack-
ages. The results of the memory stride kernel (Section 4.1), NAS Kernel (Section 4.3) and MPI(Section 4.4) low-level benchmarks predict that memory and message passing will cause dual-coreperformance degradation for such complex applications, and our results bear out thisprediction.
4.5. HPCMP TI application benchmark results
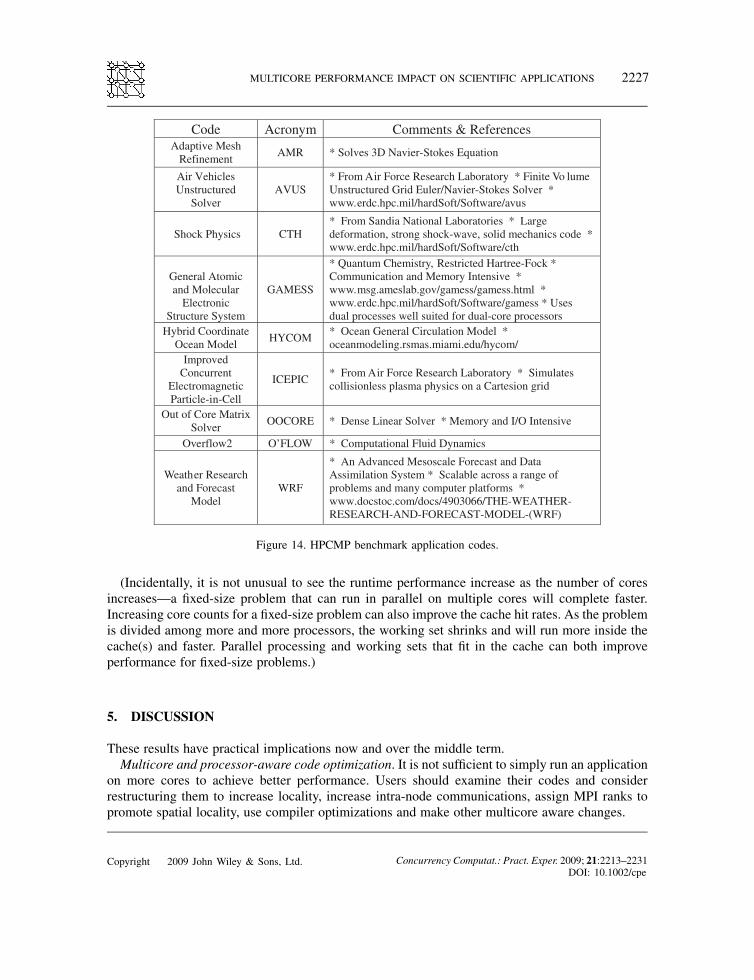
Each year the DoD assesses its computational workload and develops a benchmark suite whichit uses for acquisitions. The HPCMP releases this package to vendors for benchmarking pur-poses [10]. Figure 14 provides a short description and references for the codes included in thestudy.This section shows Sapphire (XT3) and Jade (XT4) results using this HPCMP TI benchmark
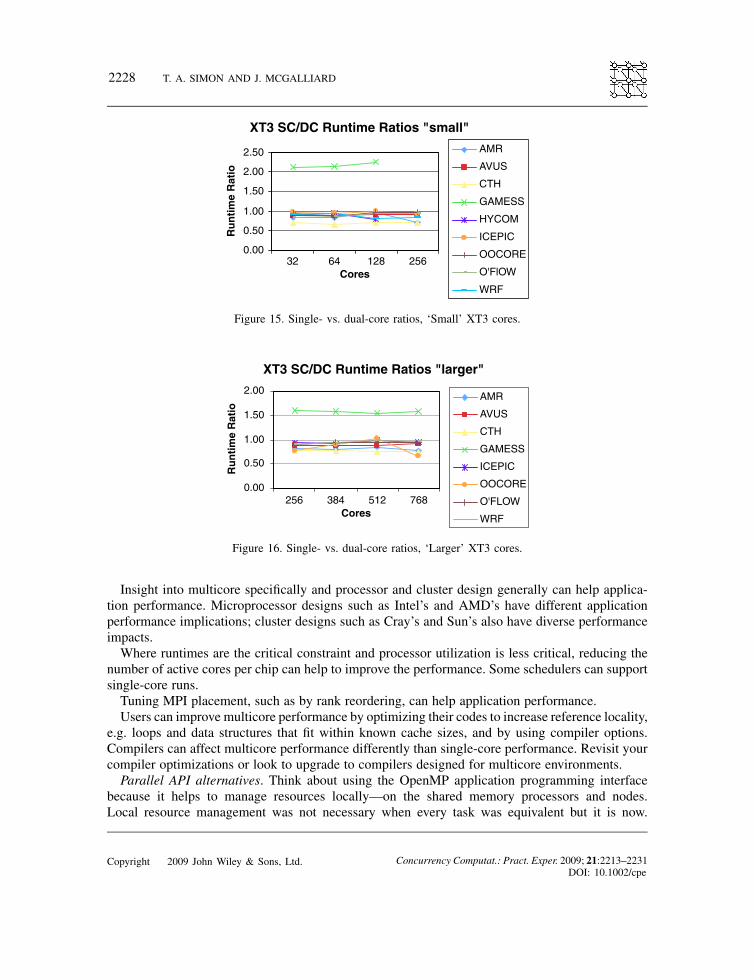
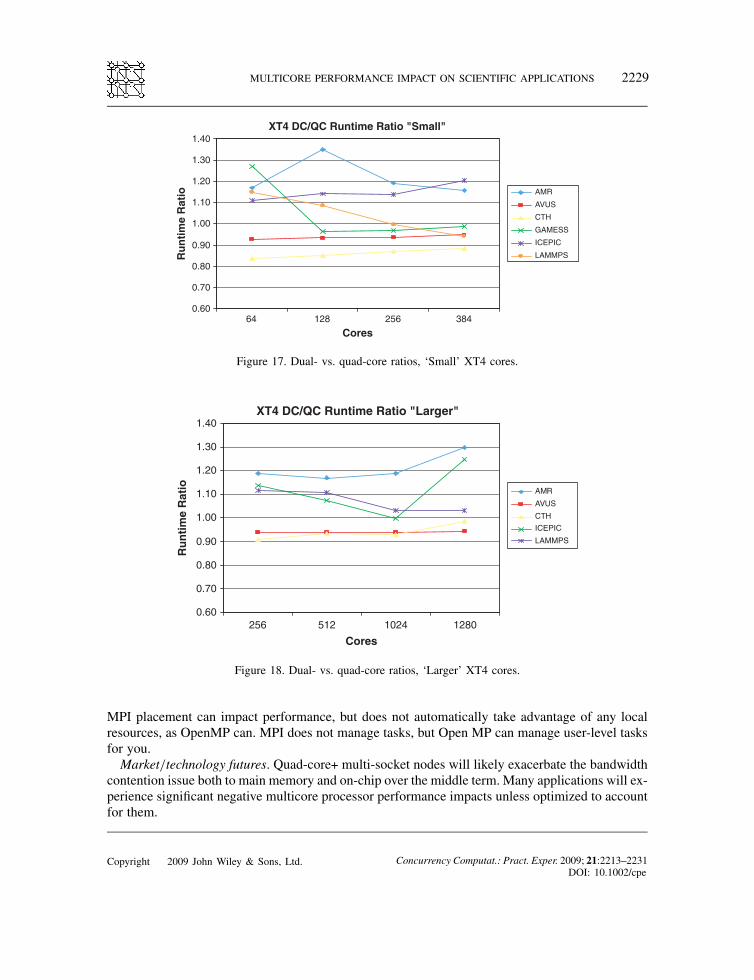
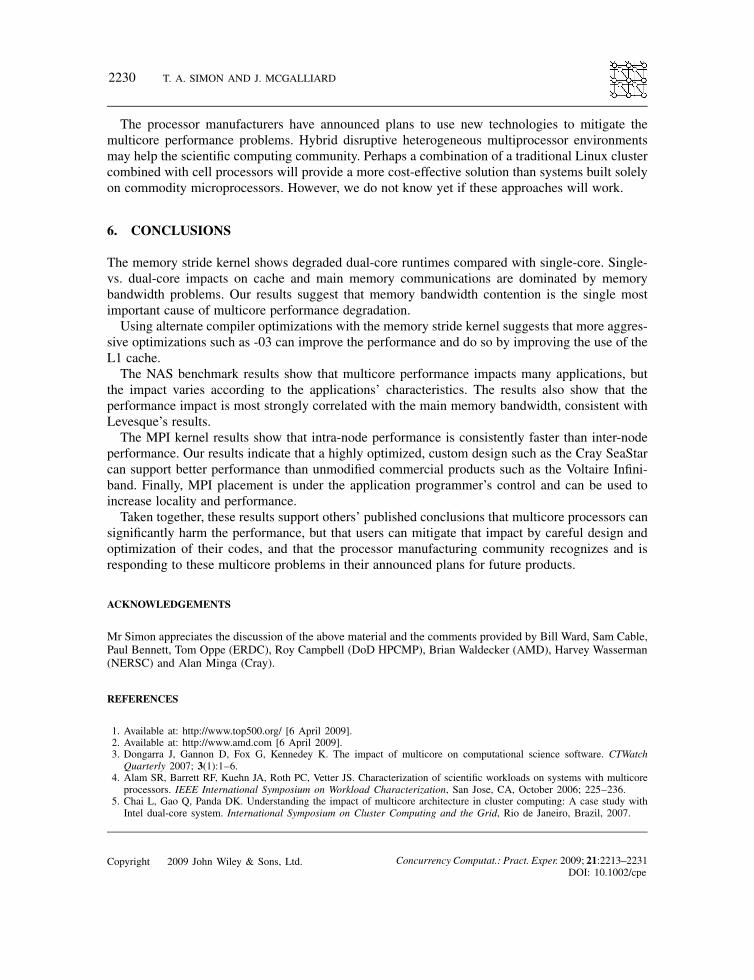
suite. For Figures 15–18, the horizontal axis reflects the number of cores running in the test. Eachtest was run in single- and dual-core modes for Figures 15 and 16. In dual-core mode, both coreson a single chip ran the same benchmark code.In Figures 17 and 18, each test was run in dual- and quad-core mode. In quad-core mode, all
four cores on the same processor ran the benchmark code. The vertical axis is the ratio betweenthe dual-core and single-core runtimes (Figures 15 and 16) or quad-core and dual-core runtimes(Figures 17 and 18).
Copyright 2009 John Wiley & Sons, Ltd. Concurrency Computat.: Pract. Exper. 2009; 21:2213–2231DOI: 10.1002/cpe
MULTICORE PERFORMANCE IMPACT ON SCIENTIFIC APPLICATIONS 2225
500 550 600 650 700 750 800 850 900 950 1000
(Midnight) DC AMD 2.6Ghz_16way
0 5 10 15 20 25 30 35
MPI Rank 0
5 10
15 20
25 30
35
MPI Rank
500 550 600 650 700 750 800 850 900 950
1000
Throughput (MBs):
Figure 10. Midnight MPI message throughput by MPI rank, 32 cores on 8 nodes.
500
550
600
650
700
750
800
850
(Midnight) DC AMD 2.6Ghz_16way
0 10 20 30 40 50 60 70
MPI Rank 0
10 20
30 40
50 60
70
MPI Rank
500 550 600 650 700 750 800 850
Throughput (MBs):
Figure 11. Midnight MPI message throughput by MPI rank, 64 cores on 16 nodes.
Figure 15 shows results for 32 to 256 cores and Figure 16 shows 256 to 768 cores. For all codesexcept GAMESS, dual-core mode runtimes were slower than single-core mode. The GAMESSoutlier results were based on a test using the Cray shmem interface between cores, all the othertests used MPI. Cray shmem takes advantage of specific low-level hardware features to achievebetter performance. MPI is an open standard that would lose its generality and portability if it usedlow-level hardware calls. In addition, GAMESS has two types of tasks—a data server process anda compute process. These two processes can work in concert on the same node and give better aperformance than the other codes.
Copyright 2009 John Wiley & Sons, Ltd. Concurrency Computat.: Pract. Exper. 2009; 21:2213–2231DOI: 10.1002/cpe
2226 T. A. SIMON AND J. MCGALLIARD
480 500 520 540 560 580 600 620 640 660 680
(Midnight) DC AMD 2.6Ghz_16way
0 20 40 60 80 100 120 140
MPI Rank 0
20 40
60 80
100 120
140
MPI Rank
480 500 520 540 560 580 600 620 640 660 680
Throughput (MBs):
Figure 12. Midnight MPI message throughput by MPI rank, 128 cores on 32 nodes.
Figure 13. GAMESS XT3 MPI rank reorder method results.
Figures 17 and 18 show the results on the XT4 for dual- and quad-core runs.The consistent performance degradation in multiple single-core vs. dual-core comparisons is not
displayed in our dual- vs. quad-core results for these applications. The most important reason isthat the dual- and quad-core tests were run 1 year apart, with upgrades to the XT4 hardware andsystem software in between the two tests, with significant performance improvements attributableto these upgrades.In addition, the specific characteristics of the application program impact the performance and
can dominate multicore performance degradation. A closer examination of these codes should revealthe specific reasons for their multicore performance patterns.
Copyright 2009 John Wiley & Sons, Ltd. Concurrency Computat.: Pract. Exper. 2009; 21:2213–2231DOI: 10.1002/cpe
MULTICORE PERFORMANCE IMPACT ON SCIENTIFIC APPLICATIONS 2227
Code Acronym Comments & References Adaptive Mesh
Refinement AMR * Solves 3D Navier-Stokes Equation
Air Vehicles Unstructured
Solver AVUS
* From Air Force Research Laboratory * Finite Vo lume Unstructured Grid Euler/Navier-Stokes Solver * www.erdc.hpc.mil/hardSoft/Software/avus
Shock Physics CTH * From Sandia National Laboratories * Large deformation, strong shock-wave, solid mechanics code * www.erdc.hpc.mil/hardSoft/Software/cth
General Atomic and Molecular
Electronic Structure System
GAMESS
* Quantum Chemistry, Restricted Hartree-Fock * Communication and Memory Intensive * www.msg.ameslab.gov/gamess/gamess.html *www.erdc.hpc.mil/hardSoft/Software/gamess * Uses dual processes well suited for dual-core processors
Hybrid Coordinate Ocean Model HYCOM * Ocean General Circulation Model *
oceanmodeling.rsmas.miami.edu/hycom/ Improved
Concurrent Electromagnetic Particle-in-Cell
ICEPIC * From Air Force Research Laboratory * Simulates collisionless plasma physics on a Cartesion grid
Out of Core Matrix Solver OOCORE * Dense Linear Solver * Memory and I/O Intensive
Overflow2 O’FLOW * Computational Fluid Dynamics
Weather Research and Forecast
Model WRF
* An Advanced Mesoscale Forecast and Data Assimilation System * Scalable across a range of problems and many computer platforms * www.docstoc.com/docs/4903066/THE-WEATHER-RESEARCH-AND-FORECAST-MODEL-(WRF)
Figure 14. HPCMP benchmark application codes.
(Incidentally, it is not unusual to see the runtime performance increase as the number of coresincreases—a fixed-size problem that can run in parallel on multiple cores will complete faster.Increasing core counts for a fixed-size problem can also improve the cache hit rates. As the problemis divided among more and more processors, the working set shrinks and will run more inside thecache(s) and faster. Parallel processing and working sets that fit in the cache can both improveperformance for fixed-size problems.)
5. DISCUSSION
These results have practical implications now and over the middle term.Multicore and processor-aware code optimization. It is not sufficient to simply run an application
on more cores to achieve better performance. Users should examine their codes and considerrestructuring them to increase locality, increase intra-node communications, assign MPI ranks topromote spatial locality, use compiler optimizations and make other multicore aware changes.
Copyright 2009 John Wiley & Sons, Ltd. Concurrency Computat.: Pract. Exper. 2009; 21:2213–2231DOI: 10.1002/cpe
2228 T. A. SIMON AND J. MCGALLIARD
XT3 SC/DC Runtime Ratios "small"
0.00
0.50
1.00
1.50
2.00
2.50
32Cores
Run
time
Rat
io
AMR
AVUS
CTH
GAMESS
HYCOM
ICEPIC
OOCORE
O'FlOW
WRF
64 128 256
Figure 15. Single- vs. dual-core ratios, ‘Small’ XT3 cores.
XT3 SC/DC Runtime Ratios "larger"
0.00
0.50
1.00
1.50
2.00
256Cores
Run
time
Rat
io
AMR
AVUS
CTH
GAMESS
ICEPIC
OOCORE
O'FLOW
WRF
384 512 768
Figure 16. Single- vs. dual-core ratios, ‘Larger’ XT3 cores.
Insight into multicore specifically and processor and cluster design generally can help applica-tion performance. Microprocessor designs such as Intel’s and AMD’s have different applicationperformance implications; cluster designs such as Cray’s and Sun’s also have diverse performanceimpacts.Where runtimes are the critical constraint and processor utilization is less critical, reducing the
number of active cores per chip can help to improve the performance. Some schedulers can supportsingle-core runs.Tuning MPI placement, such as by rank reordering, can help application performance.Users can improve multicore performance by optimizing their codes to increase reference locality,
e.g. loops and data structures that fit within known cache sizes, and by using compiler options.Compilers can affect multicore performance differently than single-core performance. Revisit yourcompiler optimizations or look to upgrade to compilers designed for multicore environments.Parallel API alternatives. Think about using the OpenMP application programming interface
because it helps to manage resources locally—on the shared memory processors and nodes.Local resource management was not necessary when every task was equivalent but it is now.
Copyright 2009 John Wiley & Sons, Ltd. Concurrency Computat.: Pract. Exper. 2009; 21:2213–2231DOI: 10.1002/cpe
MULTICORE PERFORMANCE IMPACT ON SCIENTIFIC APPLICATIONS 2229
XT4 DC/QC Runtime Ratio "Small"
0.60
0.70
0.80
0.90
1.00
1.10
1.20
1.30
1.40
64
Cores
Run
time
Rat
io AMR
AVUS
CTH
GAMESS
ICEPIC
LAMMPS
128 256 384
Figure 17. Dual- vs. quad-core ratios, ‘Small’ XT4 cores.
XT4 DC/QC Runtime Ratio "Larger"
0.60
0.70
0.80
0.90
1.00
1.10
1.20
1.30
1.40
256
Cores
Run
time
Rat
io
512 1024 1280
AMR
AVUS
CTHICEPIC
LAMMPS
Figure 18. Dual- vs. quad-core ratios, ‘Larger’ XT4 cores.
MPI placement can impact performance, but does not automatically take advantage of any localresources, as OpenMP can. MPI does not manage tasks, but Open MP can manage user-level tasksfor you.Market/technology futures. Quad-core+ multi-socket nodes will likely exacerbate the bandwidth
contention issue both to main memory and on-chip over the middle term. Many applications will ex-perience significant negative multicore processor performance impacts unless optimized to accountfor them.
Copyright 2009 John Wiley & Sons, Ltd. Concurrency Computat.: Pract. Exper. 2009; 21:2213–2231DOI: 10.1002/cpe
2230 T. A. SIMON AND J. MCGALLIARD
The processor manufacturers have announced plans to use new technologies to mitigate themulticore performance problems. Hybrid disruptive heterogeneous multiprocessor environmentsmay help the scientific computing community. Perhaps a combination of a traditional Linux clustercombined with cell processors will provide a more cost-effective solution than systems built solelyon commodity microprocessors. However, we do not know yet if these approaches will work.
6. CONCLUSIONS
The memory stride kernel shows degraded dual-core runtimes compared with single-core. Single-vs. dual-core impacts on cache and main memory communications are dominated by memorybandwidth problems. Our results suggest that memory bandwidth contention is the single mostimportant cause of multicore performance degradation.Using alternate compiler optimizations with the memory stride kernel suggests that more aggres-
sive optimizations such as -03 can improve the performance and do so by improving the use of theL1 cache.The NAS benchmark results show that multicore performance impacts many applications, but
the impact varies according to the applications’ characteristics. The results also show that theperformance impact is most strongly correlated with the main memory bandwidth, consistent withLevesque’s results.The MPI kernel results show that intra-node performance is consistently faster than inter-node
performance. Our results indicate that a highly optimized, custom design such as the Cray SeaStarcan support better performance than unmodified commercial products such as the Voltaire Infini-band. Finally, MPI placement is under the application programmer’s control and can be used toincrease locality and performance.Taken together, these results support others’ published conclusions that multicore processors can
significantly harm the performance, but that users can mitigate that impact by careful design andoptimization of their codes, and that the processor manufacturing community recognizes and isresponding to these multicore problems in their announced plans for future products.
ACKNOWLEDGEMENTS
Mr Simon appreciates the discussion of the above material and the comments provided by Bill Ward, Sam Cable,Paul Bennett, Tom Oppe (ERDC), Roy Campbell (DoD HPCMP), Brian Waldecker (AMD), Harvey Wasserman(NERSC) and Alan Minga (Cray).
REFERENCES
1. Available at: http://www.top500.org/ [6 April 2009].2. Available at: http://www.amd.com [6 April 2009].3. Dongarra J, Gannon D, Fox G, Kennedey K. The impact of multicore on computational science software. CTWatch
Quarterly 2007; 3(1):1–6.4. Alam SR, Barrett RF, Kuehn JA, Roth PC, Vetter JS. Characterization of scientific workloads on systems with multicore
processors. IEEE International Symposium on Workload Characterization, San Jose, CA, October 2006; 225–236.5. Chai L, Gao Q, Panda DK. Understanding the impact of multicore architecture in cluster computing: A case study with
Intel dual-core system. International Symposium on Cluster Computing and the Grid, Rio de Janeiro, Brazil, 2007.
Copyright 2009 John Wiley & Sons, Ltd. Concurrency Computat.: Pract. Exper. 2009; 21:2213–2231DOI: 10.1002/cpe
MULTICORE PERFORMANCE IMPACT ON SCIENTIFIC APPLICATIONS 2231
6. Levesque J, Larkin J, Foster M, Glenski J, Geissler G, Whalen S, Waldecker B, Carter J, Skinner D, He H, Wasserman H,Shalf J, Shan H, Strohmaier E. Understanding and mitigating multicore performance issues on the AMD opteronarchitecture. Paper LBNL-62500, Lawrence Berkeley National Laboratory, 7 March 2007.
7. Hennessy J, Patterson D. Computer Architecture: A Quantitative Approach (3rd edn). Morgan Kauffmann: San Mateo,CA, 2003; 516.
8. Chandra D, Guo F, Kim S, Solihin Y. Predicting inter-thread cache contention on a chip multi-processor architecture.Proceedings of International Symposium on High Performance Computer Architecture (HCPA), San Francisco, 12–13February 2003.
9. Brightwell R, Pedretti K, Underwood KD. Initial performance evaluation of the Cray SeaStar Interconnect. Proceedingsof the 13th Symposium on High Performance Interconnects (HOTI’05). IEEE: New York, 2005; 51–57.
10. Available at: http://www.hpcmo.hpc.mil/bizopps/TI/ [6 April 2009].
Copyright 2009 John Wiley & Sons, Ltd. Concurrency Computat.: Pract. Exper. 2009; 21:2213–2231DOI: 10.1002/cpe