Embed Size (px)
Citation preview
10
75
Research ArticleReceived: 5 April 2010 Accepted: 16 August 2010 Published online in Wiley Online Library: 8 October 2010
(wileyonlinelibrary.com) DOI 10.1002/jrs.2806
Observation of carbon-facilitated phasetransformation of titanium dioxide formingmixed-phase titania by confocal RamanmicroscopyA. Chatterjee,a S.-B. Wu,a P.-W. Chou,b M. S. Wongb and C.-L. Chenga∗
Confocal Raman microscopy, a relatively new and advanced technique, is found to be suitable for imaging the chemicalmorphology below the submicrometer scale. It has been employed to probe the phase transformation of carbon-containingtitania (TiO2) nanopowder and titania thin film subjected to laser annealing. The observation of phase transformation from theanatase phase to the rutile phase at high laser power annealing is attributed to carbon inclusion inside or on the surface oftitania. Upon annealing, carbon could react with the oxygen of titania and create oxygen vacancies favoring the transformationfrom the anatase to the rutile phase. This study provides evidence for the carbon-assisted phase transformation for creatingcarbon-containing mixed-phase titanium dioxide by laser annealing. We explicitly focus on the presence of carbon in thephase transformation of TiO2 using confocal Raman microscopy. In all of the investigated samples, mixed anatase/rutilephases with carbon specifically was found at the rutile site. X-ray diffraction (XRD), scanning electron microscopy (SEM) andenergy-dispersive spectroscopy (EDS) studies have been performed in addition to Raman mapping to verify the mixed-phasetitania formation. Copyright c© 2010 John Wiley & Sons, Ltd.
Keywords: titania; TiO2; anatase; rutile; carbon-containing titania; phase transformation
Introduction
Titanium dioxide (TiO2) nanoparticles have been known to be anefficient photocatalyst[1 – 3] during the past few decades owingto its superior photocatalytic activity, chemical stability, low cost,and nontoxicity.[4 – 8] However, due to its wide bandgap of 3.2 eV,it can only absorb ultraviolet light, which occupies only 3–5% ofthe solar energy spectrum.[9,10] Therefore, enormous efforts havebeen devoted to research on the photosensitivity of TiO2 in thevisible light region. The probable ways by which the bandgap oftitania can be modified for visible-light photocatalytic activitiesare plasma,[11] ion implantation,[12,13] ion-assisted sputtering,[14]
chemical vapor deposition (CVD), and sol–gel to dope traceimpurity of transition metals or nonmetals.[15 – 20] In titaniumdioxide crystal, the three naturally occurring major crystallinephases are anatase, brookite, and rutile. Among them, anatasepossesses superior photocatalytic properties,[21] but is metastableand transforms irreversibly to rutile upon heating.[3] Rutile is theonly stable phase in the bulk form. Hence, much research has beenperformed to elucidate and control the phase transformationbetween these two phases.[15,22 – 24] Certain dopants like carbon,nitrogen, and sulfur favor the anatase–rutile transformation. Ithas been proved theoretically as well as experimentally thatcarbon-doped TiO2 can show the best photoresponse comparedto nitrogen or sulfur doping. Carbon-doped TiO2 obtained atan elevated temperature range of 500–800 ◦C using carbonmonoxide precursor[25] as well as oxidative annealing of TiC canwork efficiently in photochemical water splitting under visiblelight.[26]
Recently, it has been observed in some studies that the additionof the relatively inactive rutile phase with the anatase phase can
significantly improve the photocatalytic activity of pure anatasetitanium dioxide crystal.[27,28] The efficiency of mixed-phase TiO2
in photocatalytic reactions are sometimes related to the averagegrain size, phase distribution, pore size, and the connectionsbetween the grains, or may be due to some surface defects.[29]
At present, there are very few methods capable of producingmixed-phase TiO2 thin films, e.g. vapor-phase deposition methodslike reactive sputtering.[30,31] The microstructural control of mixed-phase TiO2 nanocomposite materials has also been achieved usinga simple sol–gel method and/or hydrothermal processing.[32]
However, successful synthesis of a titania system with controllablephase and morphology is still limited.
In our previous studies,[33 – 35] we have prepared carbon-containing mixed anatase/rutile phase TiO2 using a modifiedsol–gel method followed by thermal annealing. The photoac-tivity was increased due to carbon-producing interface states,which decrease the effective bandgap and also serve as traps forphotogenerated electron–hole pairs. Nevertheless, the mecha-nism leading to mixed-phase formation and the role of carbonare still unclear. As a follow-up experiment, here we observedcarbon-facilitated phase transformation of titanium dioxide form-ing mixed-phase titania by laser annealing under high laser
∗ Correspondence to: C.-L. Cheng, Department of Physics, National Dong HwaUniversity, Hualien 97401, Taiwan. E-mail: [email protected]
a Department of Physics, National Dong Hwa University, Hualien 97401, Taiwan
b Department of Materials Science and Engineering, National Dong HwaUniversity, Hualien 97401, Taiwan
J. Raman Spectrosc. 2011, 42, 1075–1080 Copyright c© 2010 John Wiley & Sons, Ltd.
10
76
A. Chatterjee et al.
power. Our results show that carbon plays an important role inphase transformation from anatase to rutile phase predominantlyin anatase-dominated titania nanopowder. Confocal Raman mi-croscopy allows the observation of phase transformation andprovides evidence on the amorphous anatase to rutile phasetransformation. This finding helps us to clarify the role carbonplays in visible-light-responsive nanostructured mixed-phase TiO2
that are useful in visible-light photocatalytic reactions.
Experimental
Three different TiO2 samples were used throughout the experi-ments. One is the commercially available TiO2 powder (Sachtleben,Germany, labeled as UV100), which absorbs only ultraviolet lightand typically has the anatase phase with a mean particle size<8 nm; they were used without any further purification. The sec-ond sample (labeled as UV100-CNT) was prepared by mechanicallymixing commercial TiO2 powder (UV100) with carbon nanotubes(0.5 mg of CNT and 1 mg of UV100 powder in 3 ml of doublydistilled water). Here we used unpurified multiwall CNTs (multi-wall CNT, Yonyu Applied Technology Material Corporation, Tainan,Taiwan) to provide an extra source of carbons. The third samplewas a carbon-containing amorphous TiO2 thin film prepared bya reactive unbalance magnetron DC sputtering system. Details ofthe system have been described elsewhere.[36] The thin film wasprepared by the reactive cosputtering of a 99.5% titanium (SDIC)metal target of fixed 250 W power and a 99.995% graphite (SDIC)as the other target with powers varying from 100 to 350 W inan Ar/O2 plasma. The targets were 5.1 cm in diameter, and thesubstrate temperature was ∼250 ◦C and under 2.67 × 10⁻¹ Pa(2 mTorr) pressure. This thin-film sample is labeled as C-TiO2.[36]
Raman spectral and X-ray diffraction (XRD) investigations of theTiO2 film show the anatase crystal structure phases of TiO2 to bediscussed in the next section.
For measurements, a 488-nm wavelength laser and two laserpower conditions were used: low laser power (15 µW, measuredat the laser focus, for initial checking of the TiO2 phases) and highlaser power (610 µW, measured at the laser focus, for annealingand Raman mapping). The accumulation time in each Ramanspectrum was 1 s.
Raman mapping investigation was carried out with a confocalRaman spectrometer (Witec α-SNOM, Germany) using the same488-nm wavelength laser as the excitation source with themaximum power density of ∼1.6 × 10⁵ W/cm2 (for 610 µW)measured at the output of the objective. The Raman mappingswere conducted typically in a 20 × 20 µm region with a 0.5-µmstep and 1 s accumulation time at each point.
XRD measurements were performed on a Max 2500(Rigaku D), X-ray diffractometer equipped with the graphite-monochromatized Cu Kα radiation (λ = 1.54178 Å), at thescanning rate of 0.02 s−1 in the 2θ range from 20 to 65◦. The sur-face morphology of the samples before and after laser annealingwas studied by a scanning electron microscope (SEM, JSM6500F,JEOL, Japan). The SEM, equipped with the energy-dispersive X-rayspectroscopy (EDS) mode, was also used for elemental analysis ofthe samples.
Results and Discussion
The anatase and rutile phases of TiO2 can be sensitively identifiedby Raman spectroscopy and Raman mapping experiments based
UV100High power
400 600 1200 1600 2000
X40
X40
2
1
Amorphouscarbon
A
AA
Ram
an In
tens
ityWavenumber / cm-1
(a) (b)
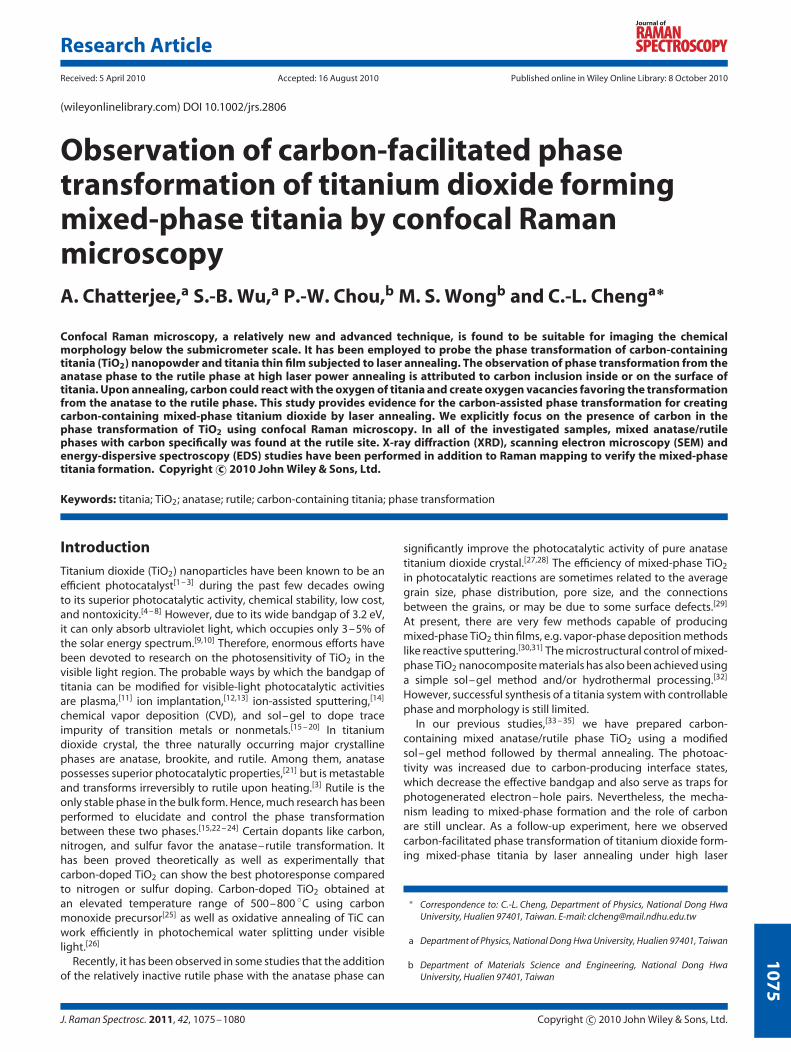
Figure 1. Confocal Raman spectra (a) and Raman mapping (b) of UV100sample measurements under high power laser (610 µW) taken at differentpoints of the sample. The wavenumber range for the Raman mapping areanatase: 586–682 cm−1; rutile: 421–461 cm−1; carbon: 1556–1675 cm−1.The Raman spectra are from the marked points 1 and 2, where the Ramanshifts are A: anatase phase (399, 515 and 639 cm−1) and trace amorphouscarbon (around 1640 cm−1).
on their Raman spectra. The anatase structure is characterized bythe tetragonal space group DI9
4h (I4/amd). The unit cell containstwo TiO2 units with Ti ions at (0,0,0) and (0,1/2,1/4) and O ionsat (0,0,u), (0,0,u), (0,1/2,u + 1/4), and (0,1/2,1/2 − u). There aresix Raman active modes: (1A1g + 2B1g + 3Eg) for anatase. Rutilestructure belongs to the P42/mnm tetragonal space group. Theunit cell, defined by lattice vector a and c, also contains two TiO2
units with Ti ions at (0,0,0) and (1/2,1/2,1/2) and O ions at ± (u,u,0)and ±(1/2 + u, 1/2 − u, 1/2). It has four Raman active modes: B1g,Eg, A1g, and B2g.[37] However, all these vibrations are not observedat a particular laser excitation in the Raman measurements. In ourexperiments, we observed three peaks (Fig. 1(a)) of Raman shiftsaround 399, 515 and 639 cm−1, which are assigned to B1g, A1g, andEg, respectively, for the anatase phase and two peaks at 445 and610 cm−1 (Fig. 2(a)), which are assigned to Eg and A1g for the rutilephase.[37]
The phase transformation studies were monitored by laserannealing and subsequent Raman mapping measurements withhigh laser power for all the three samples, namely UV100, UV100-CNT, and C-TiO2 thin film. Figure 1 shows the Raman spectraand Raman mapping images of the UV100 sample deposited ona silicon substrate. Raman spectra were recorded in the regionfrom 250 to 2000 cm−1 at high laser power. Raman mapping wasperformed over a fixed scanned area (20 × 20 µm2) of step size0.5 µm in the x and y directions. The accumulation time for eachpoint was 1 s. Typical Raman spectra of the anatase-dominatedtitania nanopowder sample (UV100) are presented in Fig. 1(a)and the corresponding Raman mapping images are displayed inFig. 1(b). For convenience, these spectra were divided into two
wileyonlinelibrary.com/journal/jrs Copyright c© 2010 John Wiley & Sons, Ltd. J. Raman Spectrosc. 2011, 42, 1075–1080
10
77
Phase transformation of titanium dioxide forming mixed-phase titania
UV100+CNTHigh power
400 600 1200 1600 2000
X10
X50
X5
Wavenumber / cm-1
1
2
Amorphouscarbon
RR
AA
ARam
an In
tens
ity(a) (b)
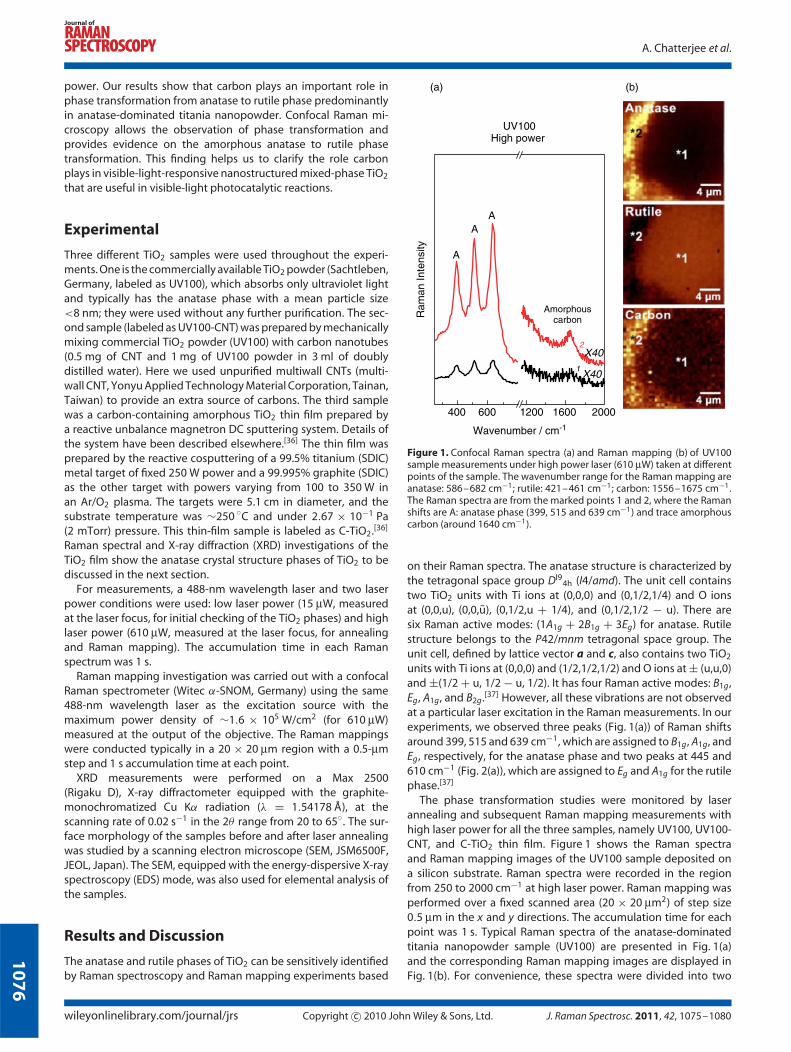
Figure 2. Confocal Raman spectra (a) and Raman mapping (b) of UV100sample mixed with CNT measured under high power laser (610 µW)and taken at different points of sample. The wavenumber range forthe Raman mapping are anatase: 586–682 cm−1; rutile: 421–461 cm−1;carbon: 1556–1675 cm−1. The Raman spectra are from marked points1 and 2, where the Raman shifts are A: anatase phase (399, 515 and639 cm−1); R: rutile phase (445 and 610 cm−1); and amorphous carbon(around 1600 cm−1).
parts along x scale from 250 to 1000 and 1000 to 2000 cm−1
as shown in Fig. 1(a). We can see three peaks of Raman shiftaround 399, 515 and 639 cm−1, which correspond to the anatasephase (labeled A).[38,39] One very weak peak centered around1640 cm−1 is assigned to trace amorphous carbon coexisting withthe anatase phase which may be present in the UV100 sampleitself. Figure 1(b) shows three mapping images from the same area(20 × 20 µm2 area) of the sample, mapped for anatase, rutile, andamorphous carbon, respectively. The bright part of the imagesdisplay locked Raman intensities used in this experiment: forexample, in the wavenumber range from 586 to 682 cm−1 lockedfor anatase phase; from 421 to 461 cm−1 for rutile phase, andfrom 1556 to 1675 cm−1 for carbon species present in the sample.The corresponding Raman spectra were taken from two differentpoints within the scanned area of the sample at points 1 and 2 asmarked in Fig. 1(a), and corresponding Raman mapping images at1∗ and 2∗ marked in Fig. 1(b).
Raman mapping allows us to monitor the phase changes inthe investigated sample. One can clearly distinguish the phasedistributions in the sample by the Raman signals originatingfrom different crystal structures within the scanned area. Wecan see clearly that the anatase phase dominates in this sample(UV100). Moreover, the anatase phase is accompanied by tracesof amorphous carbon, as seen from the weak carbon signal in theRaman spectra, Fig. 1(b). It is evident that the laser power used(610 µW) did not induce any phase transformation from anataseto rutile for the titania sample UV100. A similar observation hasbeen made by Lottici et al.,[39] who used laser powers as high
20 30 40 50 60
Cou
nts
[211]
[101]
2σ
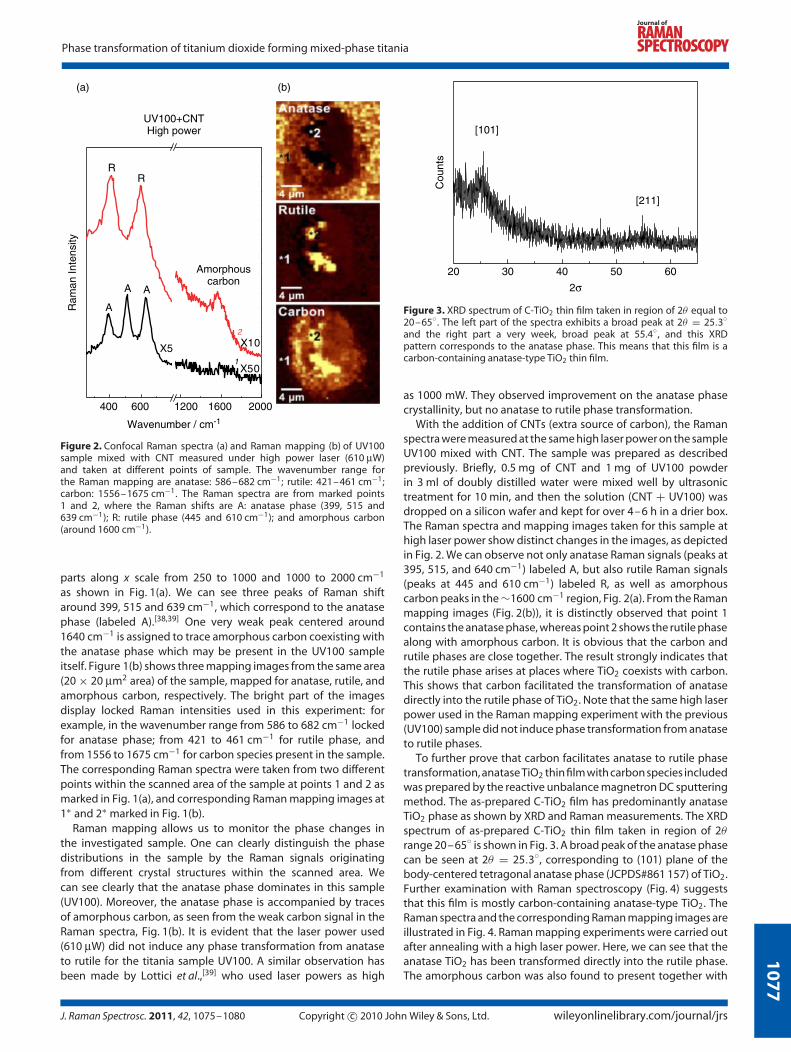
Figure 3. XRD spectrum of C-TiO2 thin film taken in region of 2θ equal to20–65◦ . The left part of the spectra exhibits a broad peak at 2θ = 25.3◦
and the right part a very week, broad peak at 55.4◦ , and this XRDpattern corresponds to the anatase phase. This means that this film is acarbon-containing anatase-type TiO2 thin film.
as 1000 mW. They observed improvement on the anatase phasecrystallinity, but no anatase to rutile phase transformation.
With the addition of CNTs (extra source of carbon), the Ramanspectra were measured at the same high laser power on the sampleUV100 mixed with CNT. The sample was prepared as describedpreviously. Briefly, 0.5 mg of CNT and 1 mg of UV100 powderin 3 ml of doubly distilled water were mixed well by ultrasonictreatment for 10 min, and then the solution (CNT + UV100) wasdropped on a silicon wafer and kept for over 4–6 h in a drier box.The Raman spectra and mapping images taken for this sample athigh laser power show distinct changes in the images, as depictedin Fig. 2. We can observe not only anatase Raman signals (peaks at395, 515, and 640 cm−1) labeled A, but also rutile Raman signals(peaks at 445 and 610 cm−1) labeled R, as well as amorphouscarbon peaks in the ∼1600 cm−1 region, Fig. 2(a). From the Ramanmapping images (Fig. 2(b)), it is distinctly observed that point 1contains the anatase phase, whereas point 2 shows the rutile phasealong with amorphous carbon. It is obvious that the carbon andrutile phases are close together. The result strongly indicates thatthe rutile phase arises at places where TiO2 coexists with carbon.This shows that carbon facilitated the transformation of anatasedirectly into the rutile phase of TiO2. Note that the same high laserpower used in the Raman mapping experiment with the previous(UV100) sample did not induce phase transformation from anataseto rutile phases.
To further prove that carbon facilitates anatase to rutile phasetransformation, anatase TiO2 thin film with carbon species includedwas prepared by the reactive unbalance magnetron DC sputteringmethod. The as-prepared C-TiO2 film has predominantly anataseTiO2 phase as shown by XRD and Raman measurements. The XRDspectrum of as-prepared C-TiO2 thin film taken in region of 2θ
range 20–65◦ is shown in Fig. 3. A broad peak of the anatase phasecan be seen at 2θ = 25.3◦, corresponding to (101) plane of thebody-centered tetragonal anatase phase (JCPDS#861 157) of TiO2.Further examination with Raman spectroscopy (Fig. 4) suggeststhat this film is mostly carbon-containing anatase-type TiO2. TheRaman spectra and the corresponding Raman mapping images areillustrated in Fig. 4. Raman mapping experiments were carried outafter annealing with a high laser power. Here, we can see that theanatase TiO2 has been transformed directly into the rutile phase.The amorphous carbon was also found to present together with
J. Raman Spectrosc. 2011, 42, 1075–1080 Copyright c© 2010 John Wiley & Sons, Ltd. wileyonlinelibrary.com/journal/jrs
10
78
A. Chatterjee et al.
(a) (b)
400 600 1200 1600 2000
GD
AA
SiR
GD
Ram
an In
tens
ity
Wavenumber / cm-1
R
C-TiO2 filmHigh power
Figure 4. Confocal Raman spectra (a) and Raman mapping (b) ofC-TiO2 film measurements under high power laser (610 µW) taken atdifferent points of sample. The wavenumber range for the Ramanmapping are: anatase 586–682 cm−1; rutile 421–461 cm−1; and carbon1556–1675 cm−1. The Raman spectra are from the marked points 1 and2, where the Raman shifts are A: anatase phase (399, 515 and 639 cm−1);R: rutile phase (445 and 610 cm−1); D-band and G-band – phase of carbon(1350 and 1580 cm−1); Si: silicon wafer (521 cm−1).
the newly formed rutile phase and the anatase phase as shownin the Raman mapping images and the corresponding Ramanspectra. After the phase transformation, the carbon remains inclose contact with the rutile and anatase structures. This dataprovides a clear evidence for the co-existence of mixed rutileand anatase phases. The rutile phase was covered with carbonstructures as observed in the Raman mapping and correspondingRaman spectra. The D-band (disordered carbon at 1350 cm−1)and G-band (graphite carbons at 1580 cm−1) originated from theamorphous carbon structures (Fig. 4).
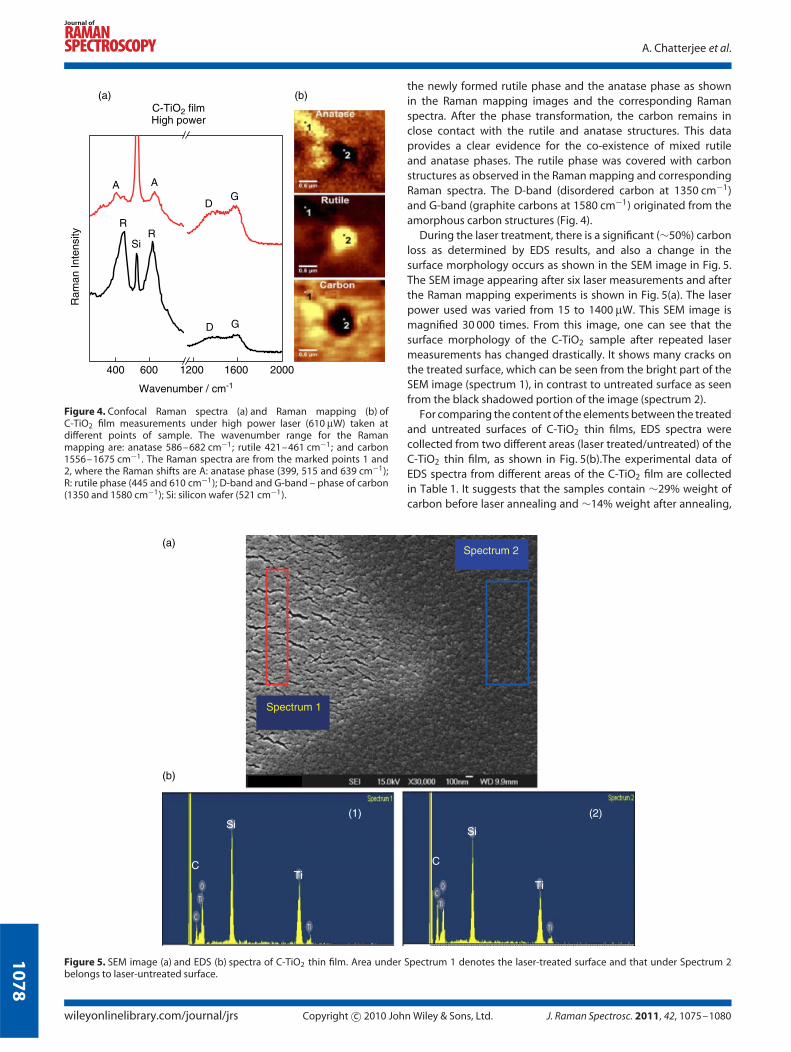
During the laser treatment, there is a significant (∼50%) carbonloss as determined by EDS results, and also a change in thesurface morphology occurs as shown in the SEM image in Fig. 5.The SEM image appearing after six laser measurements and afterthe Raman mapping experiments is shown in Fig. 5(a). The laserpower used was varied from 15 to 1400 µW. This SEM image ismagnified 30 000 times. From this image, one can see that thesurface morphology of the C-TiO2 sample after repeated lasermeasurements has changed drastically. It shows many cracks onthe treated surface, which can be seen from the bright part of theSEM image (spectrum 1), in contrast to untreated surface as seenfrom the black shadowed portion of the image (spectrum 2).
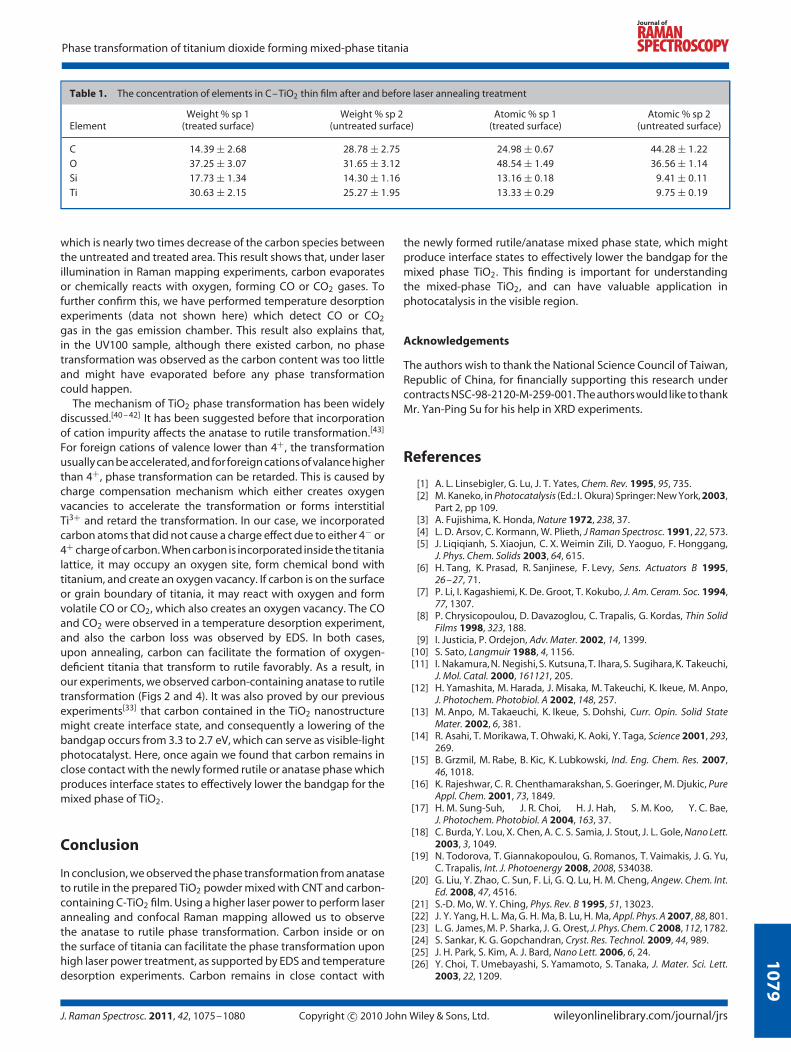
For comparing the content of the elements between the treatedand untreated surfaces of C-TiO2 thin films, EDS spectra werecollected from two different areas (laser treated/untreated) of theC-TiO2 thin film, as shown in Fig. 5(b).The experimental data ofEDS spectra from different areas of the C-TiO2 film are collectedin Table 1. It suggests that the samples contain ∼29% weight ofcarbon before laser annealing and ∼14% weight after annealing,
Spectrum 2
Spectrum 1
(a)
(b)
(1) (2)
Ti
CTi
C
SiSi
Figure 5. SEM image (a) and EDS (b) spectra of C-TiO2 thin film. Area under Spectrum 1 denotes the laser-treated surface and that under Spectrum 2belongs to laser-untreated surface.
wileyonlinelibrary.com/journal/jrs Copyright c© 2010 John Wiley & Sons, Ltd. J. Raman Spectrosc. 2011, 42, 1075–1080
10
79
Phase transformation of titanium dioxide forming mixed-phase titania
Table 1. The concentration of elements in C–TiO2 thin film after and before laser annealing treatment
ElementWeight % sp 1
(treated surface)Weight % sp 2
(untreated surface)Atomic % sp 1
(treated surface)Atomic % sp 2
(untreated surface)
C 14.39 ± 2.68 28.78 ± 2.75 24.98 ± 0.67 44.28 ± 1.22
O 37.25 ± 3.07 31.65 ± 3.12 48.54 ± 1.49 36.56 ± 1.14
Si 17.73 ± 1.34 14.30 ± 1.16 13.16 ± 0.18 9.41 ± 0.11
Ti 30.63 ± 2.15 25.27 ± 1.95 13.33 ± 0.29 9.75 ± 0.19
which is nearly two times decrease of the carbon species betweenthe untreated and treated area. This result shows that, under laserillumination in Raman mapping experiments, carbon evaporatesor chemically reacts with oxygen, forming CO or CO2 gases. Tofurther confirm this, we have performed temperature desorptionexperiments (data not shown here) which detect CO or CO2
gas in the gas emission chamber. This result also explains that,in the UV100 sample, although there existed carbon, no phasetransformation was observed as the carbon content was too littleand might have evaporated before any phase transformationcould happen.
The mechanism of TiO2 phase transformation has been widelydiscussed.[40 – 42] It has been suggested before that incorporationof cation impurity affects the anatase to rutile transformation.[43]
For foreign cations of valence lower than 4+, the transformationusually can be accelerated, and for foreign cations of valance higherthan 4+, phase transformation can be retarded. This is caused bycharge compensation mechanism which either creates oxygenvacancies to accelerate the transformation or forms interstitialTi3+ and retard the transformation. In our case, we incorporatedcarbon atoms that did not cause a charge effect due to either 4− or4+ charge of carbon. When carbon is incorporated inside the titanialattice, it may occupy an oxygen site, form chemical bond withtitanium, and create an oxygen vacancy. If carbon is on the surfaceor grain boundary of titania, it may react with oxygen and formvolatile CO or CO2, which also creates an oxygen vacancy. The COand CO2 were observed in a temperature desorption experiment,and also the carbon loss was observed by EDS. In both cases,upon annealing, carbon can facilitate the formation of oxygen-deficient titania that transform to rutile favorably. As a result, inour experiments, we observed carbon-containing anatase to rutiletransformation (Figs 2 and 4). It was also proved by our previousexperiments[33] that carbon contained in the TiO2 nanostructuremight create interface state, and consequently a lowering of thebandgap occurs from 3.3 to 2.7 eV, which can serve as visible-lightphotocatalyst. Here, once again we found that carbon remains inclose contact with the newly formed rutile or anatase phase whichproduces interface states to effectively lower the bandgap for themixed phase of TiO2.
Conclusion
In conclusion, we observed the phase transformation from anataseto rutile in the prepared TiO2 powder mixed with CNT and carbon-containing C-TiO2 film. Using a higher laser power to perform laserannealing and confocal Raman mapping allowed us to observethe anatase to rutile phase transformation. Carbon inside or onthe surface of titania can facilitate the phase transformation uponhigh laser power treatment, as supported by EDS and temperaturedesorption experiments. Carbon remains in close contact with
the newly formed rutile/anatase mixed phase state, which mightproduce interface states to effectively lower the bandgap for themixed phase TiO2. This finding is important for understandingthe mixed-phase TiO2, and can have valuable application inphotocatalysis in the visible region.
Acknowledgements
The authors wish to thank the National Science Council of Taiwan,Republic of China, for financially supporting this research undercontracts NSC-98-2120-M-259-001. The authors would like to thankMr. Yan-Ping Su for his help in XRD experiments.
References
[1] A. L. Linsebigler, G. Lu, J. T. Yates, Chem. Rev. 1995, 95, 735.[2] M. Kaneko, in Photocatalysis (Ed.: I. Okura) Springer: New York, 2003,
Part 2, pp 109.[3] A. Fujishima, K. Honda, Nature 1972, 238, 37.[4] L. D. Arsov, C. Kormann, W. Plieth, J Raman Spectrosc. 1991, 22, 573.[5] J. Liqiqianh, S. Xiaojun, C. X. Weimin Zili, D. Yaoguo, F. Honggang,
J. Phys. Chem. Solids 2003, 64, 615.[6] H. Tang, K. Prasad, R. Sanjinese, F. Levy, Sens. Actuators B 1995,
26–27, 71.[7] P. Li, I. Kagashiemi, K. De. Groot, T. Kokubo, J. Am. Ceram. Soc. 1994,
77, 1307.[8] P. Chrysicopoulou, D. Davazoglou, C. Trapalis, G. Kordas, Thin Solid
Films 1998, 323, 188.[9] I. Justicia, P. Ordejon, Adv. Mater. 2002, 14, 1399.
[10] S. Sato, Langmuir 1988, 4, 1156.[11] I. Nakamura, N. Negishi, S. Kutsuna, T. Ihara, S. Sugihara, K. Takeuchi,
J. Mol. Catal. 2000, 161121, 205.[12] H. Yamashita, M. Harada, J. Misaka, M. Takeuchi, K. Ikeue, M. Anpo,
J. Photochem. Photobiol. A 2002, 148, 257.[13] M. Anpo, M. Takaeuchi, K. Ikeue, S. Dohshi, Curr. Opin. Solid State
Mater. 2002, 6, 381.[14] R. Asahi, T. Morikawa, T. Ohwaki, K. Aoki, Y. Taga, Science 2001, 293,
269.[15] B. Grzmil, M. Rabe, B. Kic, K. Lubkowski, Ind. Eng. Chem. Res. 2007,
46, 1018.[16] K. Rajeshwar, C. R. Chenthamarakshan, S. Goeringer, M. Djukic, Pure
Appl. Chem. 2001, 73, 1849.[17] H. M. Sung-Suh, J. R. Choi, H. J. Hah, S. M. Koo, Y. C. Bae,
J. Photochem. Photobiol. A 2004, 163, 37.[18] C. Burda, Y. Lou, X. Chen, A. C. S. Samia, J. Stout, J. L. Gole, Nano Lett.
2003, 3, 1049.[19] N. Todorova, T. Giannakopoulou, G. Romanos, T. Vaimakis, J. G. Yu,
C. Trapalis, Int. J. Photoenergy 2008, 2008, 534038.[20] G. Liu, Y. Zhao, C. Sun, F. Li, G. Q. Lu, H. M. Cheng, Angew. Chem. Int.
Ed. 2008, 47, 4516.[21] S.-D. Mo, W. Y. Ching, Phys. Rev. B 1995, 51, 13023.[22] J. Y. Yang, H. L. Ma, G. H. Ma, B. Lu, H. Ma, Appl. Phys. A 2007, 88, 801.[23] L. G. James, M. P. Sharka, J. G. Orest, J. Phys. Chem. C 2008, 112, 1782.[24] S. Sankar, K. G. Gopchandran, Cryst. Res. Technol. 2009, 44, 989.[25] J. H. Park, S. Kim, A. J. Bard, Nano Lett. 2006, 6, 24.[26] Y. Choi, T. Umebayashi, S. Yamamoto, S. Tanaka, J. Mater. Sci. Lett.
2003, 22, 1209.
J. Raman Spectrosc. 2011, 42, 1075–1080 Copyright c© 2010 John Wiley & Sons, Ltd. wileyonlinelibrary.com/journal/jrs
10
80
A. Chatterjee et al.
[27] J. M. Kroon, N. J. Bakker, H. J. P. Smit, P. Liska, K. R. Thampi, P. Wang,S. M. Zakeeruddin, M. Gratzel, A. Hinsch, S. Hore, U. Wurfel,R. Sastrawan, J. R. Durrant, E. Palomares, H. Pettersson, T. Gruszecki,J. Walter, K. Skupien, G. E. Tulloch, Prog. Photovoltaics 2007, 15, 1.
[28] A. Kolmakov, M. Moskovits, Annu. Rev. Mater. Res. 2004, 34, 151.[29] L. A. Parussulo Andre, A. Bonacin Juliano, H. Toma Sergio, K. Araki,
E. Toma Henrique, Langmuir Lett. 2009, 25, 11269.[30] L. Chen, M. E. Graham, G. Li, K. A. Gray, Thin Solid Film 2006, 515,
1176.[31] S. Tanemura, L. Miao, W. Wunderlich, M. Tanemura, Y. Mori, S. Toh,
K. Kaneko, Sci. Technol. Adv. Mater. 2005, 6, 11.[32] L. Gonghu, A. Gray Kimberly, Chem. Mater. 2007, 19, 1143.[33] P. W. Chou, S. Treschev, P.-H. Chung, C.-L. Cheng, Y.-H. Tseng,
Y.-J. Chen, M. S. Wong, Appl. Phys. Lett. 2006, 89, 131919.[34] Y.-H. Tseng, C.-S. Kuo, C.-H. Huang, Y.-Y. Li, P.-W. Chou, C.-L. Cheng,
M.-S. Wong, Nanotechnology 2006, 17, 2490.
[35] S. Treschev, P.-W. Chou, Y.-H. Tseng, J.-B. Wang, E. Perevedentseva1,C.-L. Cheng, Appl. Catal. B Environ. 2008, 79, 8.
[36] S. H. Wang, T. K. Chen, K. K. Rao, M. S. Wong, Appl. Catal. B Environ.2007, 76, 328.
[37] S. P. S. Porto, P. A. Fleury, T. C. Damen, Phys. Rev. 1967, 154, 522.[38] M. Gotic, M. Ivanda, S. Popovic, S. Music, A. Sekulic, A. Turkovic,
K. Furic, J. Raman Spectrosc. 1997, 28, 555.[39] P. P. Lottici, D. Bersani, M. Braghini, A. Montenero, J. Mater. Sci. 1993,
28, 177.[40] R. D. Shannon, J. A. Pask, J. Am. Ceram. Soc. 1965, 48, 391.[41] P. I. Gouma, M. J. Mills, J. Am. Ceram. Soc. 2001, 84, 619.[42] Y. Hu, H.-L. Tsai, C.-L. Huang, J. Eur. Ceram. Soc. 2003, 23, 691.[43] K. Okada, N. Yamamoto, Y. Kameshima, A. Yasumori, J. Am. Ceram.
Soc. 2001, 84, 1591.
wileyonlinelibrary.com/journal/jrs Copyright c© 2010 John Wiley & Sons, Ltd. J. Raman Spectrosc. 2011, 42, 1075–1080