Embed Size (px)
Citation preview

7th ECCOMAS Thematic Conference on Smart Structures and Materials
SMART 2015
A.L. Araúo, C.A. Mota Soares, et al. (Editors)
c© IDMEC 2015
OBSERVATION OF CONTINUOUS MODE CONVERSION
OF LAMB WAVES IN COMPOSITE PLATES FOR SHM
Bianca Hennings∗, Rolf Lammering†
Helmut-Schmidt-University/ University of the Federal Armed Forces Hamburg
Holstenhofweg 85, D-22043 Hamburg
⋆[email protected]†[email protected]
Keywords: fiber composites, material modeling, structural health monitoring, LAMB-waves,quasi-continuous mode conversion.
Summary: This work presents mode conversion effects in carbon fiber reinforced plastic
plates. The optically observed pattern of wave propagation, which include the inhomogeneity
of the material and additionally the information of eventually existing defects will be discussed.
Furthermore, the modeling of the carbon fiber reinforced plastic for subsequent finite element
analysis of wave propagation in plates from this material will be presented. The random distri-
bution of fibers in the matrix material has to be considered in a microscale model to properly
capture the “quasi-continuous mode conversion”. Finally, a numerical example will show the
influence of the material model on the developing wave modes.
1. INTRODUCTION
Modern infrastructure includes a vast variety of structural systems which have to be keptunder surveillance in order to avoid malfunction and accidents. Typical examples are steeland concrete bridges, pressure vessels, railway tracks, and transmission lines, to name just afew. Especially aerospace structures are in the focus of improved inspection techniques since aconsiderably amount of life cycle costs is due to inspection and repair and since damage can leadto catastrophic failure. A reliable monitoring technique would allow for adjusted maintenanceintervals in accordance to the real requirements so that a reduction of the operating costs can beexpected.
Because of the reasons above mentioned, current research on structural health monitoringmethods and non-destructive testing techniques aims at fast, efficient, and reliable detection ofvisible and hidden structural damages in engineering structures.
The difficulty in identifying the damage is often caused by the complex phenomena of dam-age initiation and evolution including various failure modes which have to be detected reliably.Among others, techniques based on elastic waves play an important role for damage detection.In plate and shell structures, especially high frequency waves, i.e. guided waves or LAMB-waves, cf. GRAFF [4], and their possible contributions to structural health monitoring methods

B. Hennings, R. Lammering
are in the focus of current research, cf. GIURGIUTIU [3]. Reflections, refractions or mode con-versions are distinct indications of faults or defects and are often instantaneous visible in thepattern of an otherwise undisturbed propagating wave.
Beyond that, the increasing application of fiber reinforced plastics in lightweight structuresis currently demanding for advanced monitoring techniques. Thus LAMB-wave based tech-niques are investigated for potential use in carbon fiber reinforced plastic structures. However,with the anisotropic behavior of this class of materials and their layered structure in mind,the arising physical phenomena are more complicated and the interpretation of the observedLAMB-wave behavior becomes more challenging, cf. ROSE [8].
This work deals with the observation of a phenomenon which is called “quasi-continuousmode conversion”, cf. NEUMANN ET AL. [7] and WILLBERG ET AL. [9]. It appears after thefastest guided wave (S0-wave in isotropic solids) has passed the observed area and before thesecond-fastest wave (A0-wave in isotropic solids) arrives. In this time period, regular patternsoccur which are not seen in isotropic solids. This phenomenon is observed in thin-walled fiberreinforced plastic material with arbitrary fiber orientation and lay-up or with woven fabrics.
The manuscript is structured as follows: First, the experimentally observed quasi-continuousmode conversion is described in detail. In a next step, possible reasons of the quasi-continuousmode conversion are discussed and the material inhomogeneity is identified as the source. Then,a stochastic inhomogeneity is implemented into the material law, cf. HENNINGS [5]. Subse-quently, numerical investigations show that this phenomenon can be captured in this way.
2. THEORETICAL FOUNDATIONS
2.1 Waves in elastic plates
In the analysis of wave motion in elastic media the balance of momentum (σ: stress tensor,ρ: material density, b: distributed volume specific body forces, u: displacement field, super-posed dot: differentiation with respect to time)
divσ + ρb = ρ u , (1)
the linear strain-displacement relation (linear GREEN-LAGRANGIAN strain tensor E)
E =1
2(gradu+ gradT u) , (2)
as well as HOOKE’s law (fourth order elasticity tensor C)
σ = C : E (3)
are combined to obtaindiv(C : gradu) + ρb = ρ u . (4)
In the case of isotropic material HOOKE’s law can be expressed by the LAMÉ-constants λ andµ and Eq. (4) may be rewritten as
(λ+ µ) grad(divu) + µ div(gradu) = ρ u (5)
2
B. Hennings, R. Lammering
which is well-known as LAMÉ-NAVIER differential equation. Solutions of the differential equa-tion (5) are given in many textbooks, cf. ACHENBACH [1] or GRAFF [4], and are not repeatedhere for brevities sake.
In an unbounded elastic media it is well known that two and only two types of waves arepropagated, namely the compression (P-) wave and the shear (S-) wave. These types of wavesare fundamental to the following considerations.
In the case of semi-infinite media the existence of a boundary comes into play and distin-guishes this problem from the latter. The analysis leads to the phenomenon of mode conversionthat occurs when waves encounter a free boundary. This means that in the case of an incident P-or S-wave, both a P-wave as well as an S-wave may be reflected. Similar effects are observed atthe interface between two elastic layers. In the analysis of the reflections SNELL’s law is funda-mental. The result of the respective mathematical problem, i.e. differential equations includingboundary condition is interpreted as a surface wave which is a third type of wave. These waveshave been named after LORD RAYLEIGH who showed that their amplitudes decrease rapidlywith depth. Depending on POISSON’s ratio of the media the velocity of propagation is some-what less than shear velocity. RAYLEIGH waves are non-dispersive.
LAMB-waves belong to another type of waves which is found in traction-free thin plateand shell structures. Their formation may be considered as a consequence of P- and S-wavereflections at the surfaces of plates and shells. Many textbooks, e.g. GRAFF [4], deal withthe LAMB-wave theory for isotropic media which is not repeated here for that reason. Fromthe analytical solution of the governing equations one obtains finally the RAYLEIGH-LAMB-equation
tan qd
tan pd= −
[
4k2pq
(q2 − k2)
]±1
. (6)
The parameters p and q are defined as p2 = ω2/c2L − k2 and q2 = ω2/c2T − k2. Furthermore, kstands for the wave number, ω for the excitation frequency, and cL and cT for the phase veloc-ities of the longitudinal and transversal waves, respectively. The numerical solution of Eq. (6)with the exponent +1 yields the symmetric eigenvalues, with consideration of the exponent -1the antisymmetric eigenvalues. The results show that an infinite number of wave modes propa-gates in plates and that at least two modes exist at any frequency. In structural health monitoringthe fundamental symmetric (S0) and antisymmetric (A0) modes are typically generated withoutexcitation of higher modes. LAMB-waves are generally dispersive. They are able to propagateover long distances in thin plate and shell structures with low attenuation so that they are at-tractive for health monitoring techniques. Due to their short wavelength LAMB-waves are alsoapplicable for the detection of small faults.
In the case of transversal isotropic media, e.g. a single layer of carbon fiber reinforced plasticmaterial, the derivation of the result corresponding to Eq. (6) is much more sophisticated, cf.HENNINGS [5] or ROSE [8], and is not presented here for brevities sake. Instead of the analyticalexpressions the graphical visualization is shown in Figs. 1 and 2 as dispersion diagrams for fiberorientations of 0◦ and 45◦, respectively.
3

B. Hennings, R. Lammering
00 1
2
2 3
4
4 5
6
6
8
10
12
14
S0
S1
S2 S3S4
A0
A1
A2A3
A4
frequency × thickness in MHz mm
phas
eve
loci
tyin
km/s
Figure 1: Dispersion diagram of a single unidirectional layer in fiber orientation (0◦-layer)
frequency × thickness in MHz mm
00 1
2
2 3
4
4 5
6
6
8
10
12
14
symmetric LAMB- and SH-waves
antisymmetric LAMB- and SH-waves
phas
eve
loci
tyin
km/s
Figure 2: Dispersion diagram of a single unidirectional layer in fiber orientation (45◦-layer)
4

B. Hennings, R. Lammering
It becomes visible, that the dispersion diagram for wave propagation in fiber direction, cf.Fig. 1, is quite similar to the isotropic case. Here, the symmetric (Si) and antisymmetric (Ai)modes can clearly be distinguished. This is not the case for wave propagation at the angle of45◦ with respect to the fiber orientation. Therefore, the various curves are not marked in Fig. 2.Furthermore, SH-waves (shear horizontal waves) are included in Fig. 2.
2.2 Material modeling
Carbon fiber reinforced plastic material is composed from the carbon fiber and the shap-ing matrix material as depicted in Fig. 3, where a lay-up with four layers in an orientation of[0◦, 90◦]s is shown. The physical structure (left picture) is transferred to a fiber-matrix-modelon the micro-scale. Here, both components are described by their individual material proper-ties (center picture). Now, an appropriate homogenization technique, e.g. the semi-empiricalhomogenization method of HALPIN & TSAI, cf. JONES [6], is applied in order to obtain thefiber-matrix model on the macro-scale (right picture). This procedure leads to a layer-wise ho-mogeneous structure. In a subsequent re-consideration, this idealization will be reviewed andan enhanced material model will be proposed.
3. QUASI-CONTINUOUS MODE CONVERSION (QCMC)
To clearly explain the phenomenon of “quasi-continuous mode conversion”, the differenceof LAMB-wave propagation in carbon fiber reinforced plastic (CFRP) plates compared to thatin an isotropic one is pointed out.
EM
1, νM
12
EF
1, EF
2, νF
12, GF
12, GF
23
E90◦
1, E90
◦
2, ν90
◦
12,
G90◦
12, G90
◦
23
E0◦
1, E0
◦
2, ν0
◦
12,
G0◦
12, G0
◦
23
x1 x1x1
x3 x3x3
x1
x3
x2
x3
microscopic observation fiber-matrix-model(micro-scale)
fiber-matrix-model(macro-scale)
Figure 3: Material modeling: from microscopy to fiber-matrix-model
5

B. Hennings, R. Lammering
S0-Mode
A0-Mode
(a) isotropic plate (Aluminium)
S
A0-Mode
S0-Mode
QCMC
(b) quasi-isotropic plate[UD255 0◦/ UD500 ± 45◦/ UD255 90◦]S
S0-Mode
A0-Mode QCMC
(c) cross-plyUD255 [0◦/90◦]S
S0-Mode
A0-Mode
QCMC
(d) UD plateUD255 [4×0◦]
Figure 4: Measured wave propagation via scanning laser vibrometry
6
B. Hennings, R. Lammering
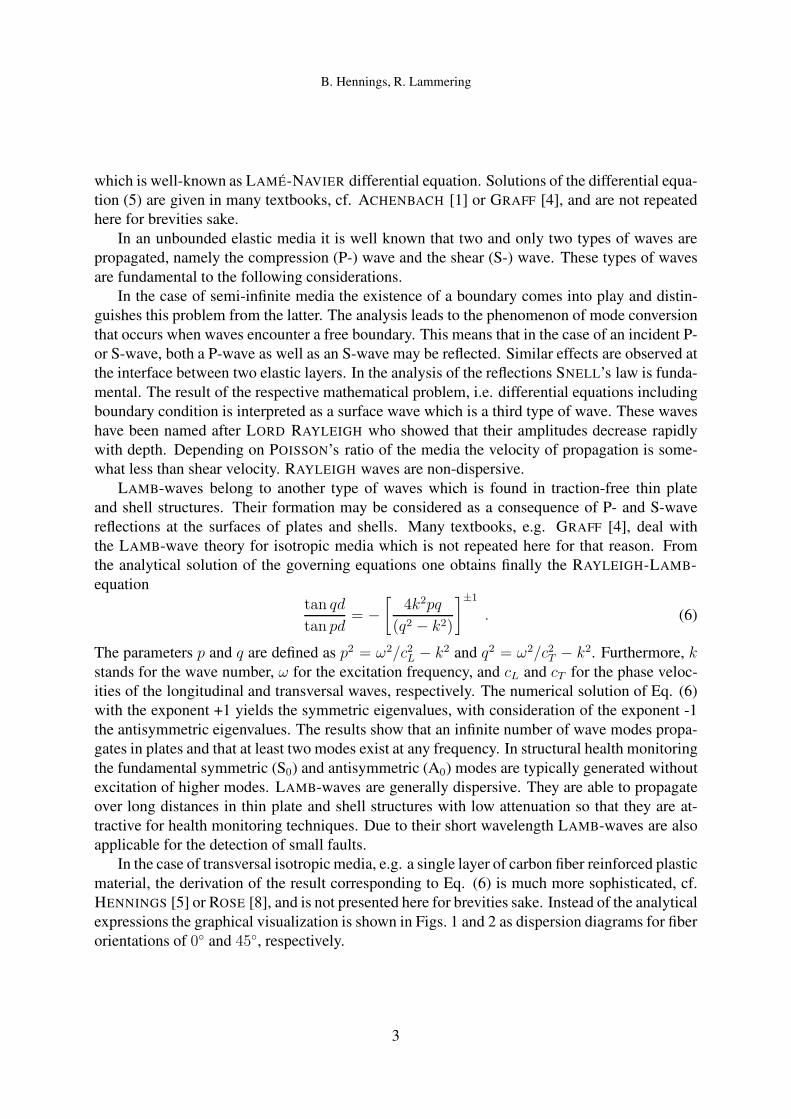
Figure 4a shows the experimental investigation of the fundamental S0- and A0-modes in anintact aluminium plate (thickness: 1 mm) taken with a scanning laser vibrometer. As expected,the transiently excited primarily S0- and A0-wave groups propagating with their inherent phasevelocity and wave length and separating in a certain travelling time without any mode conver-sion. As mentioned before, an almost identical behavior is expected from transiently excitedwave groups in intact CFRP laminates.
However, recent experimental investigations showed irregularities from this regular patternin assumedly undamaged CFRP plates, which can be seen in the following examples. Thewave propagation in a quasi-isotropic plate exclusively composed of unidirectional (UD) layers[UD255 0◦/ UD500 ± 45◦/ UD255 90◦]S is shown in Figure 4b. The faster S0- and slowerA0-waves occur and move as expected, but the arising waves between the primary excited sym-metric and antisymmetric wave groups, highlighted by white ellipses, represent an anomaly inthe wave behavior. Wave length and propagation velocity of these “new” waves point towardadditional A0-waves. Though, these secondary A0-waves appear farther from the excitationpoint than the primary excited ones.
Beside quasi-isotropic laminates, this phenomenon is also observed in cross-plies as wellas in UD laminates, (cf. Fig. 4c, 4d). Since the secondary A0-waves immediately appear inthe whole plate during and after passing of the S0-wave field, this behavior implies “quasi-continuous” mode conversion. In all of the investigated laminates, the secondary A0-wavefronts run almost parallel to the fiber direction of the near surface layers. Furthermore, animatedmeasurements identify them as secondary A0-waves propagating in same and opposite directionof the primary excited wave groups, as well as standing waves.
4. ENHANCED MATERIAL MODELING
In numerical computations the described wave phenomenon cannot be represented by theconventionally utilized complete homogenization of the single layers in a laminate. Therefore,an enhanced material modeling approach, which enables the realistic reproduction of the QCMCeffect, is presented in this section.
Figure 5 shows the details of two photomicrographs of a single UD-layer with fibers in x1-direction. In both sectional views it can be seen that the assumption of uniformly distributedfibers does not reflect the reality. On closer inspection, obviously, the global fiber volume ratioϕf of a single layer does not correspond to the local fiber-matrix ratio. This fact is clearly evi-dent in Figure 5b, where the randomly distributed fibers may form regions with a considerablylower fiber volume ratio, e.g. in the upper left corner.
Since the QCMC phenomenon does not just occur in complex anisotropic laminates butalready in the simplest case of a single layer UD-plate this particular type of plate is consideredfor development of enhanced material modeling. For the simulation of wave propagation thethree-dimensional problem (plate with actuator at the top and/or bottom surfaces) is reduced toa two-dimensional plane strain plate, cf. Fig. 6 (top) and Fig. 7. Additionally, the boundaryconditions are introduced in the axis of symmetry and the excitation of the actuators is replacedby nodal forces. They act in the same or in opposite direction dependant on whether symmetric
7

B. Hennings, R. Lammering
or antisymmetric waves are to be generated.A look at the 90◦-sectional view of the UD layer motivates a novel approach with sectored
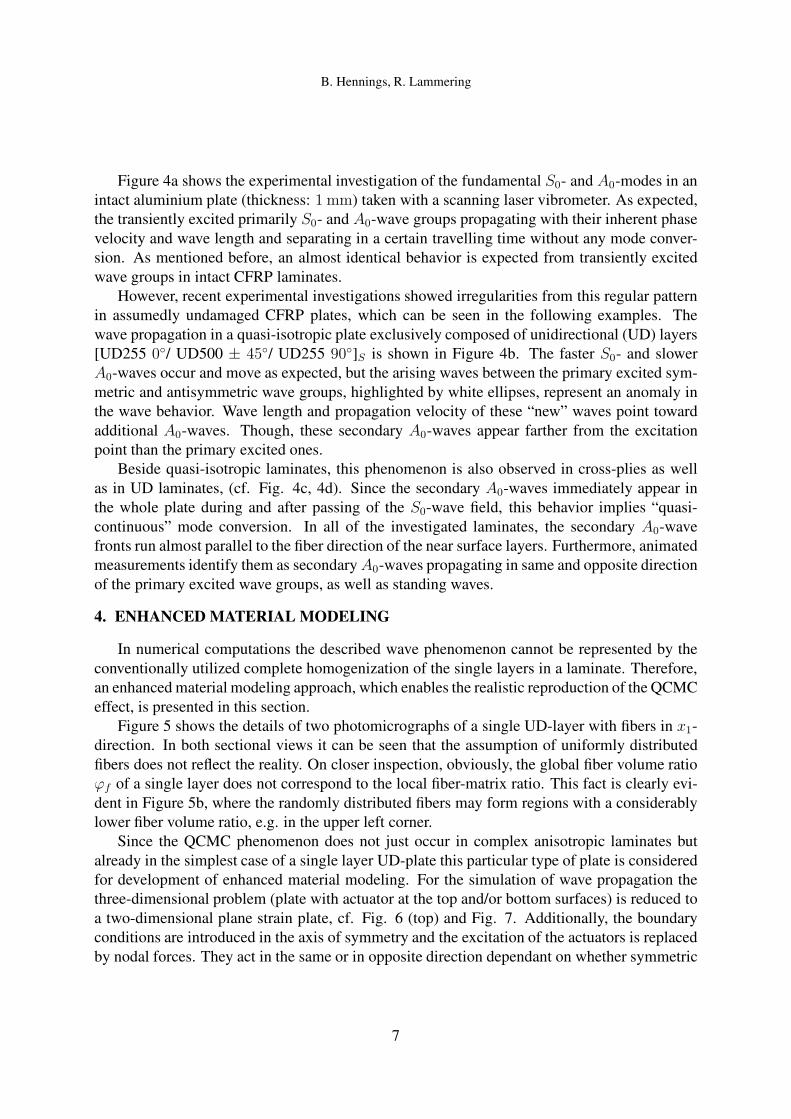
homogenized zones. Figure 6 shows the procedure to generate the enhanced model by meansof a single UD layer with a thickness of 0.4 mm.
In a first step the fiber-matrix-model is viewed on the micro scale. The fibers are idealizeddepicted as squares (black) with an edge length (8 µm) corresponding to the dimension of areal fiber diameter (5− 10 µm). Furthermore, the fibers are randomly distributed (GAUSSiandistribution) in the matrix material (represented by white squares) in consideration of the globalfiber volume ratio. Here, each square corresponds to a single finite element. The resulting high-resolution numerical model is able to reproduce the QCMC effect. However, due to the vastnumber of degrees of freedom (DOF) this model is unsuitable for efficient numerical evaluation.
In the next step the micro-model will be divided into subsets. Both center pictures in Figure6 show the same detail of the micro-model with their respectively subsets, which are composedof an arbitrary square number of fiber-matrix-elements and are highlighted by colored frames.Since the primary allocation of fiber and matrix elements is randomly distributed, the fibervolume ratio of every subset can differ from the global ratio.
Subsequently, the material properties (YOUNG’s modulus, POISSON ratio, shear modulus)of each subset are determined by using the semi-empirical homogenization method of HALPIN
& TSAI, cf. JONES [6]. With displacement amplitudes and wave velocity in mind, this methodoffers the best approximation to the values of the micro-model. Due to the fact that now allelements in a subset have the same material parameters, the sectored homogenization allowsa coarser discretization as the micro-model, so that every subset in the meso-model can beexpressed by only one finite element. The shades of gray in the bottom pictures of Figure 6correlate to the local fiber volume ratio of the subsets, in which brighter squares reflect a highermatrix concentration than darker ones.
The subsets of the left meso-model show marginal variations in coloring resp. fiber volumeratio, whereas the color changes (and with this the different fiber volume ratios) are clearly
2 1
3
(a) Sectional view in 0◦
1 2
3
(b) Sectional view in 90◦
Figure 5: Detail of photomicrographs of a single UD-layer (fibers in x1-direction)
8
B. Hennings, R. Lammering
Division intosubsets
Sectoredhomogenization
Micro-model
Detail of micro-model
Detail of meso-model
0 0.5 1Matrix Fiber
Fiber volume ratio ϕf
Figure 6: Approach for the generation of an enhanced material modeling using a sectored ho-mogenization of the UD layer
9

B. Hennings, R. Lammering
visible in the right meso-model. The reason for this is the number of fiber and matrix elementsper subset. The smaller the number of elements, the stronger is the influence of the randomdistribution of fiber and matrix, which arises in the deviation from the global fiber volume ratio.
5. RESULTS
The dimensions of the micro-model of a single UD layer (fibers in x2-direction) are illus-trated in Figure 7. The material parameters of fibers and matrix material are listed in Table 1.The fiber volume ratio is ϕf = 0.5. Based on the edge length of 8 µm the micro-model consistsof 12500× 50 squared fiber-matrix-elements (FM elements).
F
x1
x3
100 mm
0.4 mm 8 µm
8 µm
Figure 7: Dimensions of the micro-model and a fiber-matrix-element (FM element).
Originating from the micro-model different meso-models are created, in which varioussquared numbers of FM elements (2×2/ 5×5/ 10×10/ 25×25/ 50×50 elements) are combinedto subsets, cf. Figure 8. As mentioned in the section before, each subset is discretized by onefinite element with its homogenized material properties. The computation of wave propagationin this meso-models is supposed to answer the question at which homogenization level of thelayer the QCMC effect can be reproduced.
Table 2 shows the information of the micro and meso-models concerning element distribu-tion and local fiber volume ratios. The first rows lists the number of subsets of each model.Every subset is represented by a 9-node element (2 DOF per node) and thus leads to the totalnumber of DOF for each model shown in the second row.
Due to the mergence of fiber and matrix elements there are different fiber volume ratios ϕef
in the subsets. The number of occurring ratios as well as their minimum and maximum arelisted in line 3 to 5. It is evident that the number of local fiber volume ratios rises with anincreasing number of FM elements per subset (see Tab. 2 line 3). Simultaneously, the minimumand maximum values converge to the global fiber volume ratio of the layer (ϕf = 0.5).
The excitation of the plate takes place at 2.5 mm from the left edge (symmetry axis) at a load
Table 1: Material properties of fiber and matrix
MaterialE|| E|⊥ ν|⊥ ν⊥⊥ G|⊥ ρ
[GPa] [GPa] [-] [-] [GPa] [kg/m3]
Fiber 200 16.7 0.2 0.2 83 1800
Matrix 3.5 - 0.4 - - 1400
10

B. Hennings, R. Lammering
Elements per subset
50×50
25×25
10×10
5×52×2
Figure 8: Detail of the micro-model with illustration (red squares) of the subsets
of 100 N applied as a two cycle sine burst signal with a central frequency of 100 kHz. Over twocycles the sine signal is multiplied by a HANNING window. Since the effect of QCMC occursafter the symmetric waves are passing the plate the structure is excited symmetrically.
Figure 9 shows the results of the numerical simulation. The red curves display the out-of-plane displacements (u3) of the different meso-models at the top edge of the plate. Forcomparison also the displacement amplitudes of the micro-model calculation (black curves) aredepicted in the diagrams.
At the time of t = 49.5 µs the primary excited S0-wave has passed the whole plate andreached the right end of the structure. As expected, due to the random allocation of FM elements
Table 2: Model parameter
meso-models micro-model
FM elements/subset 2× 2 5× 5 10× 10 25× 25 50× 50 (1× 1)
Subsets 156 250 25 000 6 250 1 000 250 (625 000)
DOF 1 275 051 210 021 55 011 10 005 3 003 5 050 101
Number of ϕef 5 18 37 73 95 2
min(ϕef ) 0 0.16 0.29 0.437 0.464 0
max(ϕef ) 1 0.84 0.68 0.563 0.532 1
11

B. Hennings, R. Lammering
2× 2 FM elements per subset
5× 5 FM elements per subset
10× 10 FM elements per subset
25× 25 FM elements per subset
50× 50 FM elements per subset
micro-model meso-model
Location [mm]
10
10
10
10
10
10
10
10
10
5
5
5
5
5
0
0
0
0
0
-5
-5
-5
-5
-5
-10
-10
-10
-10
-10
0
0
0
0
0
10 20
20
20
20
20
30
30
30
30
30
40
40
40
40
40
50
50
50
50
50
60
60
60
60
60
70
70
70
70
70
80
80
80
80
80
90
90
90
90
90
100
100
100
100
100
primary S0-wave
secondary A0-waves
Figure 9: Out-of-plane-displacements [nm] of the UD plate at the top edge by using variouslysized subsets (t = 49.5 µs).
12

B. Hennings, R. Lammering
the displacement curves of the micro-model show secondary A0-wave groups appearing afterthe symmetric waves have passed the plate. These secondary wave groups are propagating insame and opposite direction of the primary excited S0-wave and moreover they appear locallyas standing waves.
As it can be seen in Figure 9, every meso-model is able to reproduce this behavior, except themodel with the coarsest discretization (50× 50 FM elements per subset). Even the meso-modelwith 25 × 25 FM elements per subset is able to capture the amplitudes of the secondary A0-wave in an excellent manner and shows the peaks of the primary excited S0-wave. The offset ofthe S0-displacement curves between the micro and meso-model is owed to the homogenizationmethod and is not a consequence of the application of subsets.
The reason for the absence of secondary A0-waves in the coarsest meso-model with 50×50FM elements per subset is not explained by a bad discretization resp. oversized finite elements.Also these finite elements (length of 0.4 mm) are 10 times smaller than the A0-waves (wavelength λa ≈ 4 mm). Since this meso-model uses only one finite element across the thickness,the structure gets a symmetric set-up relating to the midplane of the plate and for this reason noconversion from S0- to A0-mode happens, see AHMAD [2].
6. CONCLUSION
An enhanced material modeling method for single UD layer is presented. Here, compared tothe conventional layer-wise homogenization, size-varying subsets with homogenized materialproperties are generated to successfully reproduce the phenomenon of “quasi-continuous modeconversion” in this particular type of CFRP plates. For the homogenization the semi-empiricalmethod of HALPIN& TSAI is applied.
Investigations concerning the maximum size of the subregions for simulating the “quasi-continuous mode conversion” yield at least two subregions over the height of the UD layer, butsolely to ensure an asymmetric set-up of the numerical model because of the varying materialparameters of the subsets. Additionally taking into account the common restrictions as nodenumber resp. polynomial degree per expected wave length the enhanced material model excel-lently simulates the real propagation behavior in UD layers and thus motivates the need for astochastic material model for proper analysis of wave propagation.
References
[1] J. Achenbach, Wave propagation in elastic solids. Elsevier Science Publishers, Amster-dam, The Netherlands, 1973.
[2] Z. A. B. Ahmad, Numerical simulations of LAMB-waves in plates using a semi-analytical
finite element method. PhD-Thesis, Department of Mechanical Engineering, Otto-von-Guericke-University Magdeburg, Germany, 2011.
[3] V. Giurgiutiu, Structural health monitoring with piezoelectric wafer active sensors. Aca-demic Press, Burlington, MA, USA, 2007.
13

B. Hennings, R. Lammering
[4] K. F. Graff, Wave motion in elastic solids. Clarendon Press, Oxford, UK, 1975.
[5] B. Hennings, Elastische Wellen in faserverstärkten Kunststoffplatten - Modellierung und
Berechnung mit spektralen finiten Elementen im Zeitbereich -. PhD-Thesis, Institute ofMechanics, Helmut-Schmidt-University/University of the Federal Armed Forces Ham-burg, Germany, 2015.
[6] R. M. Jones, Mechanics of composite materials. Scripta Book, Washington, 1975.
[7] M. N. Neumann, B. Hennings, R. Lammering, Quasi-continuous mode conversion ofLAMB-waves in CFRP plates due to inhomogeneity on micro and meso scale. 7th Eu-
ropean Workshop on Structural Health Monitoring, Nantes, France, 2014.
[8] J. L. Rose, Ultrasonic waves in solid media. Cambridge University Press, Cambridge, UK,2014.
[9] C. Willberg, S. Koch, G. Mook, J. Pohl, U. Gabbert, Continuous mode conversion ofLAMB-waves in CFRP plates. Smart Materials and Structures, 21, 2012.
14