Embed Size (px)
Citation preview

PAPER • OPEN ACCESS
Observation of energetic protons trapped inlaboratory magnetic-tower jetsTo cite this article: F Suzuki-Vidal et al 2013 New J. Phys. 15 125008
View the article online for updates and enhancements.
You may also likeReal-time monitoring of volatiles andparticles emitted from thermoplasticfilaments during 3D printingWojciech Wojnowski, RenataMarcinkowska and Boena Zabiegaa
-
Future Regulation-based Particle NumberEmission Characteristics for a Heavy-dutyDiesel EngineXiaowei Wang, Xiaojun Jing, Xuejing Guet al.
-
Initial assessment of the legitimacy oflimiting the maximum permissible speedon highways and motorways based ontests in real traffic conditionsWojciech Gis, Maciej Gis, Piotr Winiowskiet al.
-
This content was downloaded from IP address 191.53.131.66 on 28/01/2022 at 13:07
Observation of energetic protons trapped inlaboratory magnetic-tower jets
F Suzuki-Vidal1,5, S Patankar2, S V Lebedev1, S N Bland1,H Doyle2,3, D Bigourd1, G Burdiak1, P de Grouchy1, G N Hall1,A J Harvey-Thompson1,4, E Khoory1, L Pickworth1,J Skidmore1, R A Smith2 and G F Swadling1
1 Department of Physics, Plasma Physics Group, Imperial College London,Prince Consort Road, London SW7 2BW, UK2 Department of Physics, Quantum Optics and Laser Science Group, ImperialCollege London, Prince Consort Road, London SW7 2BW, UKE-mail: [email protected]
New Journal of Physics 15 (2013) 125008 (11pp)Received 31 July 2013Published 5 December 2013Online at http://www.njp.org/doi:10.1088/1367-2630/15/12/125008
Abstract. Preliminary results of the self-emission of charged particles frommagnetically driven plasma jets has been investigated. The jets were launchedand driven by a toroidal magnetic field generated by introducing a ∼1.4 MA,250 ns electrical current pulse from the MAGPIE generator into a radialwire array. This configuration has shown to reproduce some aspects of theastrophysical magnetic-tower jet launching model, in which a jet is collimatedby a toroidal magnetic field inside a magnetic cavity. The emission of ions andprotons from the plasma was recorded onto Columbia Resin 39 plates using time-integrated pinhole cameras. In addition a fly-eye camera, an array of 25–496cylindrical apertures allowed estimating the location of the ion emitting source.The results show the ion emission comes from both the jet and its surroundingmagnetic cavity, with the emission extending to a height of at least ∼9 cm fromthe initial position of the wires. The emission of ions is consistent with the
3 Present address: Department of Physics, University of Oxford, Oxford OX1 3RH, UK.4 Present address: Sandia National Laboratories, Albuquerque, NM, USA.5 Author to whom any correspondence should be addressed.
Content from this work may be used under the terms of the Creative Commons Attribution 3.0 licence.Any further distribution of this work must maintain attribution to the author(s) and the title of the work, journal
citation and DOI.
New Journal of Physics 15 (2013) 1250081367-2630/13/125008+11$33.00 © IOP Publishing Ltd and Deutsche Physikalische Gesellschaft
2
dynamics of the jet obtained from time-resolved imaging diagnostics, i.e. opticallaser probing and self-emission of the plasma in the extreme ultra-violet. Thesepreliminary results suggest the ions are trapped inside the cavity due to the strongtoroidal magnetic field which drives the jet. In addition these studies providefirst estimates of the energy and fluence of protons for future laser-driven protonprobing diagnostics aimed at measuring the magnetic field in these experiments.
Contents
1. Introduction 22. Experimental setup 3
2.1. Magnetic tower-jet formation using radial wire arrays . . . . . . . . . . . . . . 32.2. Diagnostics . . . . . . . . . . . . . . . . . . . . . . . . . . . . . . . . . . . . 4
3. Results and discussion 63.1. Jet evolution . . . . . . . . . . . . . . . . . . . . . . . . . . . . . . . . . . . . 63.2. Ion pinhole imaging . . . . . . . . . . . . . . . . . . . . . . . . . . . . . . . . 63.3. Fly-eye camera and magnetic spectrometer . . . . . . . . . . . . . . . . . . . . 8
4. Discussion and future work 10References 11
1. Introduction
Highly collimated jets are ubiquitous in the Universe and are observed in objects as diverseas supernovae, active galactic nuclei (AGN), planetary nebulae and young stellar objects andit is believed that magnetic fields play a key role in their launching and collimation (Livio2002). Among the different models of magnetically driven jets we are interested in magnetic-tower jets (Lynden-Bell 2003, Uzdensky and MacFadyen 2006, Huarte-Espinosa et al 2012),which have been recently approached experimentally through the use of dense, magnetizedplasmas (Lebedev et al 2005). In this model a jet on the axis of a cavity is confined by apredominantly toroidal magnetic field, which in turns is confined by the external pressureof an ambient medium. The cavity expands due to the magnetic pressure inside it and theconfined central jet propagates in the axial direction developing nonlinear stages of magneto-hydrodynamic (MHD) instabilities. Experiments show that these instabilities not necessarilydisrupt the formation of the jet, and for large enough radiative cooling it evolves into a wellcollimated but clumpy outflow. Many AGN outflows are characterized by strong synchrotronradiation (Gallo et al 2005), which indirectly demonstrates the presence of energetic trappedelectrons. In non-relativistic, stellar jets (Hartigan et al 2011) the jet-launching region cannotbe resolved through observations, however trapped energetic particles could be also presentinside the magnetic cavity in the launching region. In this paper we present first experimentalevidence of the presence of a long-lasting population of energetic charged particles, i.e. ions andenergetic protons, which exist inside a laboratory driven, magnetic-tower jet. The observationof such particles could provide an indirect estimate of the magnetic field strength inside thecavity. In addition these studies are useful for designing diagnostics to measure magnetic fieldsbased on laser-driven protons (Petrasso et al 2009) which are planned to be fielded in futureexperiments.
New Journal of Physics 15 (2013) 125008 (http://www.njp.org/)
3
current
toroidalmagneticfieldcentral
electrode
wires
magnetic cavitystarts forming
MHD instability growthmagneticallydrivenjet
clumpy-jetis launched
circulatingcurrents
(a) (b) (c) (d)
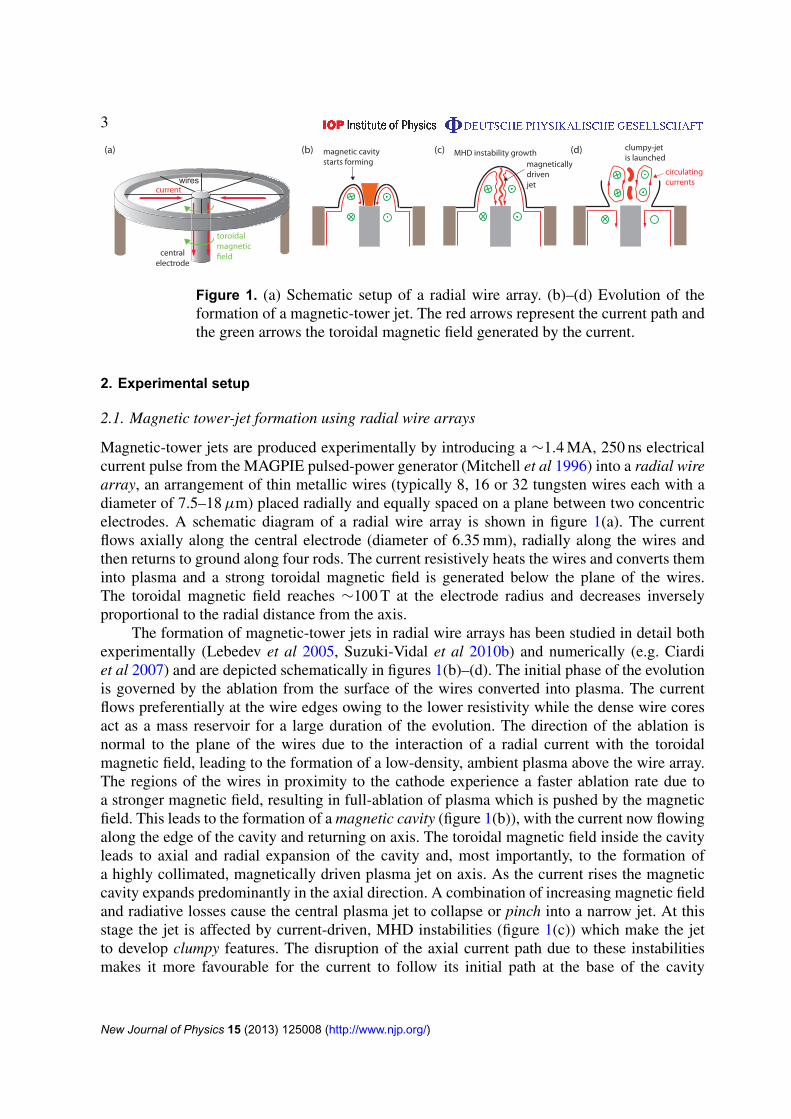
Figure 1. (a) Schematic setup of a radial wire array. (b)–(d) Evolution of theformation of a magnetic-tower jet. The red arrows represent the current path andthe green arrows the toroidal magnetic field generated by the current.
2. Experimental setup
2.1. Magnetic tower-jet formation using radial wire arrays
Magnetic-tower jets are produced experimentally by introducing a ∼1.4 MA, 250 ns electricalcurrent pulse from the MAGPIE pulsed-power generator (Mitchell et al 1996) into a radial wirearray, an arrangement of thin metallic wires (typically 8, 16 or 32 tungsten wires each with adiameter of 7.5–18 µm) placed radially and equally spaced on a plane between two concentricelectrodes. A schematic diagram of a radial wire array is shown in figure 1(a). The currentflows axially along the central electrode (diameter of 6.35 mm), radially along the wires andthen returns to ground along four rods. The current resistively heats the wires and converts theminto plasma and a strong toroidal magnetic field is generated below the plane of the wires.The toroidal magnetic field reaches ∼100 T at the electrode radius and decreases inverselyproportional to the radial distance from the axis.
The formation of magnetic-tower jets in radial wire arrays has been studied in detail bothexperimentally (Lebedev et al 2005, Suzuki-Vidal et al 2010b) and numerically (e.g. Ciardiet al 2007) and are depicted schematically in figures 1(b)–(d). The initial phase of the evolutionis governed by the ablation from the surface of the wires converted into plasma. The currentflows preferentially at the wire edges owing to the lower resistivity while the dense wire coresact as a mass reservoir for a large duration of the evolution. The direction of the ablation isnormal to the plane of the wires due to the interaction of a radial current with the toroidalmagnetic field, leading to the formation of a low-density, ambient plasma above the wire array.The regions of the wires in proximity to the cathode experience a faster ablation rate due toa stronger magnetic field, resulting in full-ablation of plasma which is pushed by the magneticfield. This leads to the formation of a magnetic cavity (figure 1(b)), with the current now flowingalong the edge of the cavity and returning on axis. The toroidal magnetic field inside the cavityleads to axial and radial expansion of the cavity and, most importantly, to the formation ofa highly collimated, magnetically driven plasma jet on axis. As the current rises the magneticcavity expands predominantly in the axial direction. A combination of increasing magnetic fieldand radiative losses cause the central plasma jet to collapse or pinch into a narrow jet. At thisstage the jet is affected by current-driven, MHD instabilities (figure 1(c)) which make the jetto develop clumpy features. The disruption of the axial current path due to these instabilitiesmakes it more favourable for the current to follow its initial path at the base of the cavity
New Journal of Physics 15 (2013) 125008 (http://www.njp.org/)

4
which can be formed at some stage due to expansion of plasma from the central electrodeand wires. This triggers the jet to detach from the base and propagate away together withthe surrounding magnetic cavity. The magnetic field of the expanding cavity could provideconditions for confinement of energetic particles inside it (figure 1(d)). It should be noted thatquasi-episodic magnetic-tower ejections can also be obtained experimentally by replacing thewires by a radial foil (Ciardi et al 2009, Suzuki-Vidal et al 2010a).
2.2. Diagnostics
2.2.1. Ion detector. The detection of ions emitted from the magnetically driven plasma jetswas achieved by using 50 × 50 mm square Columbia Resin 39 (CR-39) plates as detectors. Ionsdeposit energy in the bulk material as they traverse through it, breaking the bonds within thepolymer material causing localized damage. The damage can be visualized by etching the platein a solution of 6.25 molar of sodium hydroxide (NaOH) at 85 ◦C. The etching occurs at apreferential rate in regions where there is ion damage compared to bulk material. This resultsin the formation of pits at each interaction site which can be observed under a microscope andcounted for quantitative analysis. Since each ion forms one pit, the detector offers nearly 100%quantum efficiency. The size of the pits depends on the etching duration, however due to thechallenges of counting individual pits the data was etched to saturation to visualize large-scalefeatures. CR-39 plates are commonly used as a solid-state nuclear track detector (Fleischeret al 1965) and have a low threshold for saturation of ∼106 particles cm−2 (Gaillard et al 2007).Recent work has shown that ions with energies as low as ∼85 keV can be detected (Doyle2012). One of the main advantages in using CR-39 is that is exclusively sensitive to ions as theinteraction with electrons and photons does not cause any localized damage, in contrast withother detectors such as radiochromic film (RCF).
2.2.2. Ion diagnostics. In order to image the self-emission of ions from the plasma, the presentexperiments used two types of diagnostics based on time-integrated pinhole imaging. The firstdiagnostic consisted of using a single pinhole to image onto a CR-39 plate. The diameter of thepinhole was varied between 100 µm and 1 mm in order to control the ion flux onto the CR-39.The camera was positioned inside the vacuum chamber at a distance of ∼22 cm from the jet.This diagnostic offers a simple and cost-effective method of imaging the emission of ions fromthe plasma.
The second diagnostic was a fly-eye camera, which consisted of a two-dimensional arrayof cylindrical apertures, with the CR-39 plate placed at one end. The geometry of the apertures,e.g. their diameter, length and position in respect to the emitting object, sets a range of anglesthrough which ions can reach the detector resulting in shadows from which information on thelocation and size of the source can be inferred. This diagnostic is based on the principle of codedaperture imaging whereby information about the source can be inferred from the pattern whicha known aperture mask leaves on the image. Like pinhole cameras, it is a useful and simple wayof imaging radiation which is difficult to focus and is widely used in astronomy (e.g. Caroliet al 1987). The apertures were machined onto a solid piece of aluminium or alternatively,three-dimensional (3D) printed using an ultraviolet-light cured epoxy resin. Both materials werethick enough to block the emission of ions besides those passing through the apertures. Theresolution of the camera depends on the number, length and the diameter of the apertures.
New Journal of Physics 15 (2013) 125008 (http://www.njp.org/)

5
magneticcavity / jet
B
v
v x B
B = 0.85 T
CR-39 plates
Slits
proton/ion emission proton/ion emission
proton magnetic spectrometerhigh-resolution fly-eye camera
Figure 2. Schematic setup of the fly-eye camera and the magnetic spectrometer.The latter was calibrated to measure protons emitted from the plasma.
Two designs were tested during the present experiments. A first, low-resolution versionconsisted of 25 apertures (5 × 5 array), each with a diameter of 6 mm equally spaced onto a50 × 50 mm cross-section area. A second, high-resolution camera consisted of 496 apertures(24 × 24 array) each one with a diameter of 1.2 mm. For both versions the length of the apertureswas ∼50 mm. In addition a 6.5 µm thick aluminium foil was placed in front of the CR-39 as afilter to limit the range of ion energies reaching the detector. The stopping power for this filterwas calculated using a SRIM Monte-Carlo simulation (Ziegler and Biersack 1985) resulting ina threshold proton energy of ∼ 600 keV.
In addition a magnetic spectrometer was fielded to measure the energy spectrum of protonsemitted from the plasma with energies between 0.1–5 MeV. A pair of crossed-entrance slitscollimate an ion beam which is then deflected by a constant magnetic field generated by apair of permanent magnets (B ∼ 0.85 T). The deflection of the ions is proportional to theLorentz force ∝ v × B, where v is the incoming velocity of the ions and thus proportional totheir energy. A large detection area is achieved by placing four CR-39 plates in an L-shapeconfiguration. Using solely a magnetic field does not allow to distinguish between different ionspecies, however this diagnostic is a simple method to obtain a preliminary energy spectrum ofthe ion emission. The fly-eye camera and the spectrometer are shown schematically in respect tothe experimental jet in figure 2.
2.2.3. Other diagnostics. Time-resolved imaging diagnostics were also fielded to study theevolution of the magnetic cavity and the jet on axis. The self-emission of radiation from theplasma in the extreme ultra-violet (XUV, photon energy > 40 eV) was recorded by the meansof pinhole cameras (diameter of 100 µm) backed by a micro-channel plate (MCP) detector.The MCP is divided into four quadrants capable of giving four independent frames in a singleshot, separated by 30 ns with ∼2 ns exposure time (Bland et al 2004). In addition optical laserprobing using a commercial Nd:YAG laser (200 mJ, λ = 532 nm, ∼0.3 ns) was used to image theplasma by the means of shadowgraphy and dark-field Schlieren. Both diagnostics are sensitive togradients of the electron density in the plasma, i.e. they are particularly useful to image shockedplasma regions such as the edges of the magnetic cavity.
New Journal of Physics 15 (2013) 125008 (http://www.njp.org/)

6
Figure 3. Experimental results of magnetic-tower jet formation from time-resolved XUV imaging. Results were obtained from the same experiment.
3. Results and discussion
3.1. Jet evolution
The formation and evolution of a magnetic-tower jet can be seen from XUV emission imagesshown in figure 3. The first image of the sequence (at 180 ns after the start of the current) showsthe initial formation of the magnetic cavity inside the low-density halo plasma ablated from thewires. At 210 ns the jet is visible on the axis of the cavity. The cavity expands radially and axiallydue to the magnetic pressure inside it, with radial and axial velocities of VR ∼ 65 km s −1 andVZ ∼ 265 km s −1, respectively, estimated from the first two frames. As peak current is reachedat ∼250 ns the jet is affected by current-driven instabilities which disrupt the current path onthe axis of the cavity leading to detachment of the jet from the base. This process is clearlyseen on the image at 240 ns, with the jet evidencing the formation of a kink-type instability.The detachment, however, does not greatly affect the collimation of the jet as it continues topropagate axially. Instead the plasma retains some of the magnetic field, leading to the formationof a series of collimated clumps which continue to propagate supersonically. The late-timeevolution of the clumps is shown in figure 4(d) at 370 ns using a larger field of view of theXUV camera.
3.2. Ion pinhole imaging
Time-integrated pinhole images of ion emission for different pinhole diameters (1 mm, 300 µmand 100 µm, respectively) are shown in figures 4(a)–(c). The images were obtained fromdifferent shots, however the magnification was kept constant (M = 0.5) in order to makemeaningful comparisons. In all cases the etching time was chosen to produce saturated imagesin order to distinguish large-scale ion features, particularly to determine the overall size of theion emitting region. It should be noted that the etching duration was approximately constant forall the data shown. The smaller pinhole diameter reduces the ion fluence reaching the detectorand effectively highlights regions of higher flux. The results using 1 mm and 300 µm pinholediameters show images very resemblant of the shape of the magnetic cavity (e.g. see figure 3 at210 and 240 ns). For the smallest pinhole diameter of 100 µm (figure 4(c)) the aspect ratio ofthe ion emission becomes more ‘jet-like’, implying the central axis emits more ions compared
New Journal of Physics 15 (2013) 125008 (http://www.njp.org/)

7
Figure 4. (a)–(c) Time-integrated ion pinhole images for different pinholediameters (1 mm, 300 µm and 100 µm, respectively). The increase in aspect ratioof the jets indicates that the central axis emits more ions. (d) Large field of viewXUV emission at 370 ns showing the late-time development of the clumpy jetprovides a comparison of the spatial extent of the emission with a time-resolveddiagnostic.
to the surrounding magnetic cavity. This is consistent with the regions of strongest toroidalmagnetic field, which pinches the jet into a narrow column. The increased emission of ionsfrom the axis of the magnetic cavity can be studied quantitatively by analysing a non-saturatedpinhole image, and results of radial lineouts at different heights from the base of the cavityare shown in figure 5. The data were obtained by counting the number of pits as a function ofposition using a cell-counting routine on ImageJ (Rasband 1997–2012). The profiles show anincrease of ion emission from the axis which is consistent with the saturated pinhole images.In addition the profiles show a systematic increase of peak ion emission with height, becomingmaximum at z = 31 mm. The peak emission is a factor ∼7–13 times higher than the average
New Journal of Physics 15 (2013) 125008 (http://www.njp.org/)

8
Figure 5. Individual ion counts as a function of radius across an unsaturatedpinhole image. The profiles were obtained at different heights respect to the baseof the magnetic cavity.
background ion count at large radii. This increase might be related to the formation of highlyemitting clumps from the jet, which is consistent with results obtained with the fly-eye camera,which are presented next.
3.3. Fly-eye camera and magnetic spectrometer
Results from fly-eye cameras with 25 and 496 apertures (with 6 and 1.2 mm diameter apertures,respectively) are shown in figure 6. In comparison with the pinhole cameras, the fly-eyecameras had a 6.5 µm thick aluminium filter to look at emission of more energetic particles.The results are characterized by a distinct shadow pattern imprinted on the CR-39, e.g. asobserved in the low-resolution version of the fly-eye in figure 6(a). The results show that thetop-central apertures are fully illuminated, however the rest of the apertures show only partialillumination with a well-defined azimuthal asymmetry in respect to the central apertures. Byusing the known position, diameter and length of the apertures it is possible to discern thelocation of the ion-source assuming the emission is azimuthally symmetric. Each apertureis able to give one point of information which corresponds to the furthest a source can beto give the required pattern. This allows a locus of points to be plotted which encompassthe extended source. The analysis of the low-resolution version of the fly-eye camera using25 apertures is shown in the right hand side of figure 6(a). The source is located at a heightof ∼30 mm from the plane of the wires, with a width of ∼ 6 mm (limited by the diameter ofthe apertures) and an axial extension of ∼12 mm. A similar analysis performed using the high-resolution fly-eye (figure 6(b)) resulted in a source with a width of ∼3.5 mm and an axialextension of ∼9 mm. The inferred position of the ions is consistent with the location of theunstable, detached jet that develops on the axis of the cavity, which is shown from a time-resolved, dark-field Schlieren results presented in the right hand side of figure 6(b). The pinchingand subsequent development of a kink-type MHD instability in the jet has been reported inprevious experiments with radial wire arrays in Lebedev et al (2005), Suzuki-Vidal et al (2010b)and in radial foil Z-pinches, in which the wires are replaced by a continuous metallic foil
New Journal of Physics 15 (2013) 125008 (http://www.njp.org/)

9
radius [mm]
heig
ht [m
m]
0
5
10
15
20
25
30 direction vectors
initial positionof the wires s091710
emitting source
s071811
555 50 0
radius [mm]
heig
ht [m
m]
-10-20 10 20
0
10
20
30
40
0
Direction VectorsSource Point
intial positionof wires s092310
-10-20 10 200
(a)
(b)
Figure 6. Results of ion emission from fly-eye cameras: (a) low-resolutionversion with 25 apertures, each one with 6 mm diameter, (b) high-resolutionversion with 496 apertures, each one with 1.2 mm diameter. A comparison witha time-resolved dark-field Schlieren image at 240 ns shows the source of ionemission is consistent with the position of the unstable jet once it detaches fromthe base of the magnetic cavity.
(Suzuki-Vidal et al 2007, 2009, 2011, Ciardi et al 2009, Gourdain et al 2009, 2012, 2013).The development of a kink instability in the latter leads to the formation of strong, tangledmagnetic fields as studied from numerical simulations of radial foils Z-pinches using the codeGORGON (Ciardi et al 2009).
The aluminium filter used on the fly-eye cameras means the emission is due to eithertungsten ions, with energies in excess of 50 MeV, or protons with energies of ∼600 keV. Theemission of protons from the jet is consistent with the measured energy spectrum of ions usinga magnetic spectrometer, which is shown in figure 7. The spectrometer slits were located at∼31 mm above the cathode which is the region where the higher energy ions were seen tooriginate from. The CR-39 counts were converted into absolute fluence values using cross-calibrated RCF film which measures the dose accurately. The spectrum in figure 7 reveals a lowenergy peak at ∼100 keV and a tail which stretches out to ∼4 MeV. There is no significant spike
New Journal of Physics 15 (2013) 125008 (http://www.njp.org/)

10
Figure 7. Proton spectrum from the magnetic spectrometer.
in the spectrum to account for the higher energy protons seen from the fly-eye data, suggestingthey are indeed just the tail of the spectrum. Although the spectrometer cannot differentiatebetween ion species, etching durations and pit sizes confirmed that the bulk of the signal wasindeed due to protons. Although there might be a contribution from high-energy tungsten ionsto the spectra, we believe the majority is due to protons from impurities (e.g. CH) which arealways present in the tungsten wires.
4. Discussion and future work
Charged particles confined inside the magnetic cavity with predominantly toroidal magneticfield evolve together with the cavity expansion. After reaching the boundary of the cavity dueto drifts, collisions or increase of Larmor radius due to decrease of the magnetic field, protonscan propagate towards the ion diagnostics and form an image of the cavity/jet. The observationof ions and protons emitted in experimental magnetic-tower jets provides us with an indirectmethod to understand the dynamics of the magnetic field that drives and collimates the jet insidethe magnetic cavity. The emission region from time-integrated pinhole images is consistentwith the late-time evolution of the magnetic cavity, and there is evidence of increased emissionfrom the axis. The results show that the emission extends axially at least ∼6.5 cm from the initialposition of the wires, limited by the field of view of the camera. The peak of the proton spectra of∼100 keV is consistent with measurements of the voltage across the base of the magnetic cavityusing an inductive probe (Suzuki-Vidal et al 2011, Burdiak et al 2013). Observation of thelarge emission region is consistent with the conditions needed to trap low-energy protons. Forinstance 100 keV protons would need a toroidal magnetic field of 4.5 T to be confined to a radiusof the order of the cavity radius (∼1 cm). This required value is consistent with measurementof magnetic field strength from radial foils (Bφ ∼ 1.5–5 T) (Gourdain et al 2010, Suzuki-Vidalet al 2010a).
The data from the fly-eye cameras suggest that protons with energies > 600 keV comefrom a region on axis located at ∼20–30 mm from the base of the cavity with a typical width
New Journal of Physics 15 (2013) 125008 (http://www.njp.org/)

11
of ∼3–6 mm. This region coincides with the minimum width of the jet as it is pinched bythe toroidal magnetic field which is maximum at peak current (i.e. at ∼250 ns). The emissionof protons from the axis, where the magnetic field is strongest, together with a tail in theproton spectrum of ∼MeV suggests an acceleration mechanism which is not clear at present.A possibility might be from the evolution of the initially toroidal magnetic field into a morecomplex topology, i.e. turbulent magnetic fields, and this has been investigated with numericalsimulation using the 3D MHD code GORGON (Ciardi et al 2009). Future experiments will lookinto fielding time-resolved particle diagnostics in order to further understand the dynamics ofproton and ion emission from experimental magnetic-tower jets.
References
Bland S N et al 2004 Rev. Sci. Instrum. 75 3941Burdiak G C et al 2013 Phys. Plasmas 20 032705Caroli E, Stephen J B, Di Cocco G, Natalucci L and Spizzichino A 1987 Space Sci. Rev. 45 349Ciardi A et al 2009 Astrophys. J. Lett. 691 L147Doyle H 2012 PhD Thesis Imperial College LondonCiardi A et al 2007 Phys. Plasmas 14 056501Fleischer R L, Price P B and Walker R M 1965 J. Appl. Phys. 36 3645Gaillard S, Fuchs J, Renard-Le Galloudec N and Cowan T E 2007 Rev. Sci. Instrum. 78 013304Gallo E et al 2005 Nature 436 819Gourdain P-A et al 2009 APS Meeting Abstracts 5009Gourdain P-A et al 2010 Phys. Plasmas 17 012706Gourdain P-A et al 2012 Phys. Plasmas 19 022701Gourdain P-A and Seyler C E 2013 Phys. Rev. Lett. 110 015002Hartigan P et al 2011 Astrophys. J. 736 29Huarte-Espinosa M et al 2012 Astrophys. J. 757 66Lebedev S V et al 2005 Mon. Not. R. Astron. Soc. 361 97Livio M 2002 Nature 417 125Lynden-Bell D 2003 Mon. Not. R. Astron. Soc. 341 1360Mitchell I H et al 1996 Rev. Sci. Instrum. 67 1533Petrasso R D et al 2009 Phys. Rev. Lett. 103 085001Rasband W S 1997–2012 ImageJ (Bethesda, MD: US National Institutes of Health) (http://imagej.nih.gov/ij/)Suzuki-Vidal F et al 2007 APS Meeting Abstracts 4007Suzuki-Vidal F et al 2009 Astrophys. Space Sci. 322 19Suzuki-Vidal F et al 2010a Phys. Plasmas 17 112708Suzuki-Vidal F et al 2010b IEEE Trans. Plasma Sci. 38 581Suzuki-Vidal F et al 2011 Astrophys. Space Sci. 336 41Uzdensky D A and MacFadyen A I 2006 Astrophys. J. 647 1192Ziegler J F and Biersack J P 1985 Treatise on Heavy-Ion Science ed B D Allan (Berlin: Springer) p 93
New Journal of Physics 15 (2013) 125008 (http://www.njp.org/)