Embed Size (px)
Citation preview

Observation of nanosecond laser inducedfluorescence of in vitro seawater
phytoplankton
Thomas J. Bensky,1,* Lisa Clemo,1 Chris Gilbert,2 Bryan Neff,1
Mark A. Moline,3 and Dov Rohan1
1Department of Physics, California Polytechnic State University, San Luis Obispo, California 93407, USA2Department of Electrical Engineering, California Polytechnic State University, San Luis Obispo, California 93407, USA3Department of Biological Sciences, California Polytechnic State University, San Luis Obispo, California 93407, USA
*Corresponding author: [email protected]
Received 8 April 2008; revised 17 June 2008; accepted 25 June 2008;posted 30 June 2008 (Doc. ID 94802); published 22 July 2008
Seawater has been irradiated using a train of 70ns flashes from a 440nm laser source. This wavelengthis on resonance with the blue absorption peak of Chlorophyll pigment associated with the photosystem ofin vitro phytoplankton. The resulting fluorescence at 685nm is instantaneously recorded during eachlaser pulse using a streak camera. Delayed fluorescence is observed, yielding clues about initiation ofthe photosynthetic process on a nanosecond time scale. Further data processing allows for determinationof the functional absorption cross section, found to be 0:0095Å2, which is the first reporting of this num-ber for in vitro phytoplankton. Unlike other flash-pump studies of Chlorophyll, using a LED or flashlamp-based sources, the short laser pulse used here does not reveal any pulse-to-pulse hysteresis (i.e., variablefluorescence), indicating that the laser pulses used here are not able to drive the photosynthetic processto completion. This is attributed to competition from a back reaction between the photoexcited photo-system II and the intermediate electron acceptor. The significance of this work as a new type of deploy-able ocean fluorimeter is discussed, and it is believed the apparatus will have applications in thin-layerphytoplankton research. © 2008 Optical Society of America
OCIS codes: 010.1030, 010.4450, 140.3450, 260.2510, 280.1415, 300.2530.
1. Introduction
We report on the observation of fluorescent emissionof in vitro seawater phytoplankton as a response to atrain of 440nm laser flashes, each lasting approxi-mately 70ns, arriving at 1ms intervals. Choosing towork on fluorescence in the nanosecond regime wasmotivated bya larger effort to develop an inexpensive,laser-based, deployable ocean-plankton fluorimeter(discussed below), using as many off-the-shelf opticalcomponents aspossible.The success of aLEDor flash-lamp-based fluorimeters is acknowledged [1,2], but alaser-based fluorimeter has two primary strengths
that this effort seeks to exploit. First, optical harmo-nics of diode pumped lasers nowmake an off-the-shelf440nm laser readily available, maximizing efficiencyof Chlorophyll-a (Chl-a) pumping. Second, since thelaser is naturally collimated, fluorescence can be sti-mulated along the entire volume of water traversedby the laser beam, lifting spatial restrictions ofnon-laser-based fluorimeters. It is hoped this willopenup the possibility of performing real-time spatialmapping of plankton communities, via their fluores-cence, over a distance of several meters from thepump source.
Prior work in this area has revealed that thephotosynthetic apparatus (PA) is marvelously di-verse in its response to optical stimulation. Pumpingwith picosecond light sources will reveal similarly
0003-6935/08/223980-07$15.00/0© 2008 Optical Society of America
3980 APPLIED OPTICS / Vol. 47, No. 22 / 1 August 2008

timed fluorescent events, as will pumping with nano-second, microsecond, and millisecond flashes. Eachregime has its value in revealing the nature of energymigration through the PA, and it appears as if lightwith longer pump durations is able to probe deeperinto the long succession of steps that ultimately leadsto stable charge separation and stored energy [3].Picosecond pump sources, for example, do not probethe PA at all, reporting only the singlet lifetime of(Chlorophyll) Chl antenna [4–6], perhaps even beforeany energy is transferred to the PA. Nanosecondpump sources, used in the work presented here, doreveal initial traversal of the pump energy fromthe Chl-a as “light antenna” into the PA, and allowfor monitoring the early attempts of the PA at chargeseparation [7,8]. The photosynthetic reactions in-duced with these short pump pulses, however, areunstable and fluorescence results from their rever-sal, as seen in Ref. [7], and in this paper. Microsecondpump sources probe so deeply as to even allow formeasurement of oxygen evolution in the PA [9]. Fi-nally, millisecond pump sources are perhaps themost prolific and probe deeply into the dynamicsof the PA, even resolving closure of the PA to addi-tional photons as photosynthesis and charge separa-tion occur [3,10–13].
2. Instruments and Methods
Specific details concerning the construction of the ap-paratus used in this work will be presented in aforthcoming publication [14]. Briefly, a Q-switched,1kHz, diode pumped, Nd:YLF laser [15] is used tostimulate the Chl-a fluorescence. The laser has aspectral peak at 440nmwith a bandwidth of approxi-mately 20nm at half-maximum. The temporallaser pulse width is also Gaussian shaped, with a fullwidth at half-maximum of approximately 50ns. Timeaveraged output power is 10mW, corresponding toa peak pulse power of 200W and a pulse intensityof 6:4 × 10⁷ W=m2, or 233mol quanta s−1m−2. Thestreak camera is a bare 20 Model ST-X streak tube[16] that is powered with circuits constructed in-house. The resulting streak image is captured usinga thermoelectrically cooled, integrating CCD cam-era. Synchronization between the sweep voltage ofthe streak camera and the laser/sample traversalis ensured using a precision delay generator [17].The seawater samples used in this work are live sam-ples of ocean water collected near a university-ownedpier facility at Avila Beach, California, which ex-tends about 1km into San Luis Obispo Bay, locatedon the central California coast at 35:3N, 120:6W.A sample was transported to the laboratory andplaced in the laser beam within 15 min after collec-tion. Enough seawater is collected to fill a 30 cmwater column. Scattering of the blue laser beam byparticulates in the seawater clearly reveals thethin blue laser beam by direct observation. Thesame observation through a 692ð�40Þnm (red) filter(Edmund Optics 48148) reveals a faint red glow ema-nating from the same volume traversed by the laser
beam. In normal operation, two filters are placed infront of the streak camera aperture, the 692 band-pass filter, and a 440nm band-reject filter, whichblocks scattered laser light from entering the streakcamera. Data presented in this paper representtypical observations from eight samples collectedbetween January 2006 and March 2007. A schematicfor the assembled apparatus is shown in Fig. 1. Thewater column, laser beam, and streak camera aper-ture are mutually parallel allowing an image of thethin volume of water traversed by the laser beam tobe captured by the streak camera.
3. Results
A typical streak image taken for live seawater isshown in Fig. 2. As shown, the vertical extent ofthe streak image represents approximately 30 cm ofa laboratory water column; the entire horizontal ex-tent of the frame represents 150ns of time. The laserenters thewater columnat the bottomof the image, ata time of 0ns. The bright features near 10 and 30 cmare surface features due towater–glass andwater–airinteractions from the container holding the seawateritself and are ignored in favor of a surface free regionnear the center of thewater column, near 20 cm.A sin-gle image from the streak camera is considered as acollection of pixels in a (time, distance) coordinatespace. Each vertical pixel represents a discrete vo-lume of seawater a given distance from the bottomof the container, while each horizontal pixel repre-sents the time evolution of the fluorescence of a givenvolume after irradiation. The sweep voltage for thestreak camera we used makes each horizontal pixelrepresent an additional 1ns in time evolution.
For analysis, a row of pixels was chosen at the mid-dle of the image in Fig. 2, near 20 cm. Using imageanalysis software [18], a horizontal pixel intensityprofile is extracted from the image and plotted asthe fluorescence curve in Fig. 3. The horizontal axisis the same time axis as in the raw streak image. Theright vertical axis, in its rawest form, would be adigital pixel value from 0 to 4098 (from the 12 bit
Fig. 1. Schematic of the apparatus used in this work. The laserpumps a column of seawater, oriented parallel to the slit of a streakcamera. Imaging optics creates an image of the water traversed bythe laser beam onto the aperture of the streak camera, after pas-sing through a blue-reject and 685nm bandpass filter. A CCD cam-era is used to capture the resulting streak camera output
1 August 2008 / Vol. 47, No. 22 / APPLIED OPTICS 3981

CCD camera) sampled along the horizontal line inthe image in Fig. 2 at 20 cm. For this paper, however,these pixel values were calibrated by tabulating pixelintensity values observed as a result of sending laserpulses with known powers [19] into the streak cam-era at the same wavelength as the fluorescence.Hence the right vertical axis in Fig. 3 is fully cali-brated in microwatts. The vertical axis of the streakcamera represents the spatial extent of a sample tra-versed by the laser beam. However, because of thesurface features discussed above, any extended useof this axis is ignored. Thus attenuation coefficientsare not presented in this paper, but will be an impor-tant analysis point in the ocean-deployable version ofthis apparatus.To make correlations with the pump light, another
streak image was acquired with the laser reject filterremoved. In this configuration, the 440nm scatteredlaser light dominates the fluorescence light, and thestreak camera effectively captures the time evolutionof the laser pulse. A pixel intensity profile is taken forthis second streak image (at the same vertical posi-tion as the first) and is plotted in Fig. 3 as the lasercurve, with a calibrated power axis on the left. Whenviewing Fig. 3, the reader is cautioned to observe thevertical axes carefully. The laser intensity values arealong the left vertical axis, while the fluorescence in-tensity values are along the right vertical axis. Thereis a factor of 108 between the two scales. This figureessentially represents the raw data this apparatus isable to capture: instantaneous fluorescent emissionfrom a seawater sample during the evolution of theexcitation (or pump) light pulse.
4. Discussion of Data
A. Temporal Features
In examining Fig. 3, it is noted that the horizontal(time) axis is absolute. The point “time ¼ 0” repre-sents when the laser is preparing to fire, starting
a measurement cycle. Light from the laser pulse isseen first, followed by the fluorescent emission fromChl, presumably Chl-a. The most prominent tempor-al feature is an approximate 10ns delay between thepump and the fluorescent light emission curves. Thisdelay was consistently observed over several months,with eight different seawater samples, and varied byð�2Þns. It is tempting to call the delay instrumental,but this is difficult to justify given that the only ex-perimental difference between the two curves inFig. 3 is the removal of the laser light rejection filter.Light travel times cannot be the cause, since a 10nsdelay would represent some spatial gap of approxi-mately 3m, which is two to three times larger thanthe entire apparatus. Such a delay between pumpand fluorescent emission has been seen in other work[20] and is common in photosynthetic systems[7,21–27], being called delayed fluorescence (DF).It is noted that, with the exception of Ref. [20], thesereferences do not directly show evidence of DF, asshown in Fig. 3 here. This is attributed to the factthat, to our knowledge, this work is the first to ob-serve fluorescence of seawater during a laser flash,with a detector having such an extremely large tem-poral bandwidth at correspondingly short timescales. Two elements of control against the live sea-water samples have been performed.
The first control is a set of data acquired using asample consisting of fresh spinach leaves soaked inacetone for approximately 2h. The sample was fil-tered of any visible particulates then placed in thelaser beam. The sample is seen to fluoresce verybrightly in the red. Apart from a multiplicative con-stant in amplitude, the temporal shapes of the laserpulse and spinach fluorescence responses areidentical; the time delay observed in Fig. 3 is absent.The absence of a delay in the spinach sample makesphysical sense, as follows. The Chl-a in the acetonesolution is not connected to a photosynthetic appara-tus; it is a dead sample. In such a solution, the Chl-amolecules absorb laser photons and subsequently
Fig. 2. Typical streak image obtained for in vitro seawater.
Fig. 3. Laser (solid curve) versus fluorescence (dotted curve) asextracted from a horizontal row near 20 cm in Fig. 2. The lasercurve was taken independently from the fluorescence curve, withthe laser-light reject filter removed.
3982 APPLIED OPTICS / Vol. 47, No. 22 / 1 August 2008
fluoresce with a lifetime lasting approximately 2ns(see picosecond references above), which is too fastto observe during the 70ns laser pulse we used. Dur-ing the laser pulse, therefore, there is a continualpump-fluoresce–pump-fluoresce cycle occurring. Theshort fluorescent lifetime, relative to the laser pulsewidth, means that, at any given instant, there is asupply of unexcited or recently deexcited Chl-a elec-tron transitions that can (re)absorb a pump photonand subsequently fluoresce. More pump photonsyields more fluorescence and the overall fluorescenceresponse simply follows the temporal envelope of thelaser pulse itself. (As a small additional control stepsample, off-the-shelf distilled water was placed in theapparatus, which yielded no detectable signal.)The second control was in additional measure-
ments on the seawater signal as follows. Upon care-ful inspection of Fig. 3, it is evident that, althoughthe rising edge of both the laser and the fluorescencepulses are similar in appearance, the laser pulseclearly has a longer decaying “tail,”making it appearto last approximately 9ns longer than the fluores-cence pulse. This leads to the possibility that thefluorescence signal is actually stimulated Ramanscattering. This possibility has been eliminated withtwo tests. The first test is in a light spectrum col-lected from the volume of seawater traversed bythe laser beam, taken with an Ocean Optics USB4000 spectrometer [28]. The spectrometer returns in-tensity versus wavelength of an injected light samplein real time. For the seawater sample, a strong peakat 440nm was observed, in addition to an ≈20nmwide feature centered near 690nm. The overall spec-trum closely resembles the “Chlorophyll-a” curvefound on page 55 of Ref. [12]. In other words, to with-in the detectability of the spectrometer, the spectrumlooks very “clean,” unlike that expected from lightdominated by stimulated Raman scattering, whichwould contain many more features spread through-out the spectral region of interest. The second test isin the observation of the temporal laser-pulse profilegenerated by the streak tube, as a function of laser-light power scattered into the tube. Observations re-veal an overall temporal intensity-broadening of thelaser pulse, by the phosphor screen, at full laserpower. This is attributed to the phosphor being inun-dated with higher kinetic energy electrons, as gener-ated by the higher frequency laser photons. Uponimpact, the phosphor glows very strongly, which“bleeds” into neighboring pixels on the phosphor.As the laser pulse is attenuated using a variable neu-tral density filter, it is observed to decrease in width,relative to its fixed peak. In particular, the long tailseen from 80 to 140ns in Fig. 3 disappears, causingthe laser pulse and fluorescence to share a nearlyidentical temporal width. Since the peaks in the laserand fluorescence curves do not shift as a function ofinput laser power, Fig. 3 is presented to illustrate themaximum fluorescence signal attainable for sea-water, given all available laser pump power producedby the off-the-shelf laser we used.
The lack of a delay in fluorescence in the acetonesample indicates the DF observed in the seawater(or “live”) sample comes from some connection be-tween the Chl-a antenna and the photosyntheticapparatus (see below). Despite this connection, how-ever, the live data still do not reveal any pulse-to-pulse dynamics. That is, the fluorescence shown inFig. 3, due to laser pulse N is not affected by laserpulse N − 1, and will not affect the fluorescencecaused by laser pulse N þ 1. This indicates a discon-nection between the Chl-a antenna and the photosyn-thetic apparatus. This apparent paradox sets a limitfor what the pump source that we used is able toachieve relative to the photosynthetic process: theDF indicates that the photosynthetic process hasstarted in the live sample, but the lack of pulse-to-pulse dynamics indicates that the process then failsto sustain itself over the 1 μs off time between laserpulses. It is concluded then that stable charge separa-tion is not achieved with a pump source lasting a fewtens of nanoseconds, and any initiated photosyntheticprocesses identifiable via fluorescence terminateswith each laser pulse. This is in stark contradistinc-tionwith studies performedwith aLED or flashlamp-based pump sources, where the pump durations lastup to several orders of magnitude longer in time [1,2].It appears that pumping a live sample in the nanose-cond regime is at an awkward boundary in the photo-initiation of photosynthesis. Such pulses are too longto observe any fluorescent lifetimes, and too short tofully initiate the photosynthetic process.
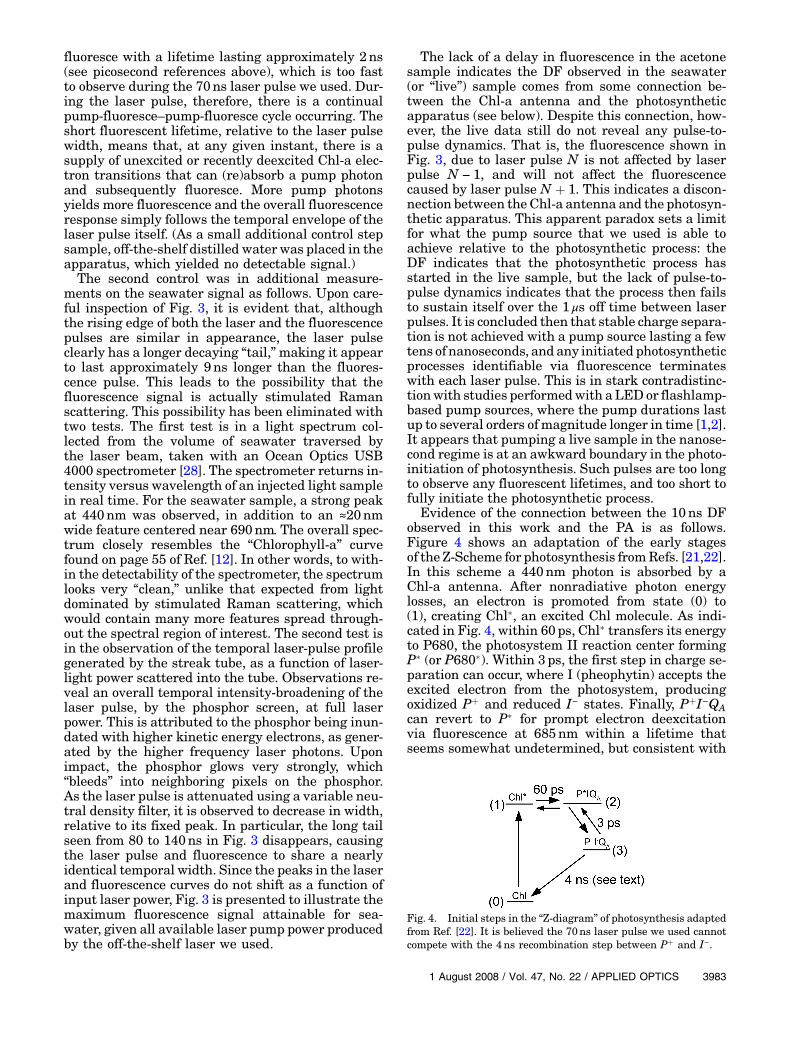
Evidence of the connection between the 10ns DFobserved in this work and the PA is as follows.Figure 4 shows an adaptation of the early stagesof the Z-Scheme for photosynthesis fromRefs. [21,22].In this scheme a 440nm photon is absorbed by aChl-a antenna. After nonradiative photon energylosses, an electron is promoted from state (0) to(1), creating Chl�, an excited Chl molecule. As indi-cated in Fig. 4, within 60ps, Chl� transfers its energyto P680, the photosystem II reaction center formingP� (or P680�). Within 3ps, the first step in charge se-paration can occur, where I (pheophytin) accepts theexcited electron from the photosystem, producingoxidized Pþ and reduced I− states. Finally, PþI−QAcan revert to P� for prompt electron deexcitationvia fluorescence at 685nm within a lifetime thatseems somewhat undetermined, but consistent with
Fig. 4. Initial steps in the “Z-diagram” of photosynthesis adaptedfrom Ref. [22]. It is believed the 70ns laser pulse we used cannotcompete with the 4ns recombination step between Pþ and I−.
1 August 2008 / Vol. 47, No. 22 / APPLIED OPTICS 3983

the 8–12ns DF observed here. Reference [22] putsthis time at 4ns, Ref. [7] puts this time between15 and 60ns, and Ref. [21] reports between 100and 300ns. It is also noted that all these studiesuse different samples in different environments.The lifetime of the Pþ and I− recombination back re-action occurs within the time of the DF observed inthis work, prompting the belief that this back reac-tion is responsible for the DF observed. Any furthercharge separation, for example, to QA−, the second-ary plastoquinone electron acceptor, does not occur,since this step involves dynamic processes lastingmilliseconds to seconds, which are simply not seenin this work. It is concluded then that a 70ns laserpulse cannot drive the photosynthetic process pastthe reduction of I (the pheophytin).It is noted that fluorescence at the red wavelength
(685nm) can only come from deexcitation of the Chlantenna. Thus, a 10ns delay in fluorescence meansan excited electron must be prevented from deexcita-tion for this time duration. This cannot be explainedby deexcitation of the Chl-a antenna alone, since thisfluoresce is prompt, with a 2ns lifetime. If, however,charge separation is initiated via the pheophytinelectron acceptor, a delay in fluorescence is possibleas the back reaction takes its respective time to com-plete, while the excited electron is energetically sepa-rated from the Chl antenna and not available fordeexcitation and fluorescence.
B. Fluorescent Yield
The data shown in Fig. 3 allow for a direct determina-tion of the fluorescent yield from the Chl-a as a func-tion of instantaneous pump intensity. This result isshown in Fig. 5, where the ratio of fluorescent emis-sionto laser fluence is computedatagiventimeduringthe laser pulse. This result allows for comparison ofthis paper with that of others [12,29]. In particular,as shown in Ref. [30], fluorescent yield follows the“onehit Poisson” function 1 − e−σJ , whereJ is the laserfluence and σ is the functional cross section. For therelatively small number of photons in a single laserpulse (a factor of 1000 lower than that used in Fig. 2of Ref. [14]), σJ ≪ 1, so e−σJ ¼ 1 − σJ, meaning thePoisson function reduces to simply σJ. Hence, theslope of the data shown inFig. 5 is the functional crosssection, found to be 9:46 × 10−19 cm2 or 0:0095ð�0:0002ÞÅ2.This cross section for in vitro seawater has not
been found in the literature, and this may be the firstreporting of it. The closest variant, as derived fromfluorescence yield measurements, has been reportedfor Chlorella Vulgaris at 1.3 to 280Å2 [31,32].Another report shows this number to be dependenton ambient lighting conditions and flash energy[30] with values as low as 0:29Å2, which is(merely) a factor of 30 larger than the value foundhere for seawater. It is not possible to decide onthe correctness of this cross section for seawater; in-stead it is pleasing that a cross section, with a some-what similar value to the work of others, can be
derived here, considering the extremely different cir-cumstances under which it was taken. Further workis needed to quantify the place of this result.
5. Use as a Deployable Ocean Fluorimeter
As mentioned in Section 1, this work is part of a lar-ger effort to develop a deployable, laser-based, oceanfluorimeter. The two parameters discussed above,the time lag of DF, and the functional cross sectioncame by analyzing pixel intensities across only a sin-gle horizontal axis of an acquired streak image.Other horizontal rows, representing the spatial axisof the streak camera (due to laboratory constraints)went completely unused in this paper. It is hoped thisspatial axis will prove useful in real-time phyto-plankton mapping applications for the eventualocean fluorimeter. In use, the DF can be observedand the cross section derived for every horizontalrow of pixels acquired from a streak camera image,representing (with suitable optics) many vertical feetof instantaneous phytoplankton fluorescent responseto each pulse of the laser.
Current work involves integrating this entire ap-paratus onto a REMUS [33] platform. Initial goalswhen deployed in the ocean will be to monitor theDF and functional cross section along the full spatialcapability of the streak camera and attempt to attachthe results to global oceanographic parameters.
6. Conclusions
En route to developing a laser-based ocean fluori-meter, we observed instantaneous fluorescent emis-sion from Chl in phytoplankton resident in in vitroseawater samples as a result of pumping with a440nm, 70ns laser pulse. Delayed fluorescence of10ð�2Þns is seen, and a functional cross section of0:0095Å2 is derived from the data. The delayed fluor-escence is connected to a back reaction in the earlystages of the charge-transfer process of photosynth-esis. The data do not reveal any pulse-to-pulse hys-teresis, such as that seen with pump sources with
Fig. 5. Fluorescent yield versus laser fluence, as derived from thedata shown in Fig. 3 by eliminating time between the two curves.The slope is the functional cross section for in vitro seawaterphytoplankton.
3984 APPLIED OPTICS / Vol. 47, No. 22 / 1 August 2008

flashes lasting milliseconds. The lack of pulse-to-pulse hysteresis may prove useful for direct phyto-plankton mapping as a function of concentrationsince the fluorescent emission from the plankton willbe linear with pump energy. This linearity is a desir-able feature for an ocean fluorimeter, not possiblewith systems exhibiting variable fluorescence, sincefluorescence emission in these regimes has a compli-cated, nonlinear dependence on pump energy andrelative irradiation time.Finally, future work includes deploying the appa-
ratus into the open ocean andmonitoring the delayedfluorescence and cross section as a function of loca-tion and depth [34]. It is hoped either or both of theseparameters will yield clues to the instantaneous phy-toplankton taxonomy and/or physiology relative tothe local ocean environment. Finally, it is hopedthe spatial discretization of seawater, made possibleby the streak camera, will allow for increasedmonitoring resolution of thin-layer, coherent, phyto-plankton patches [35].
The authors gratefully acknowledge funding fromthe National Science Foundation under grant OCE-0428929. T. J. Bensky thanks M. Moelter of theCalifornia Poytechnic State University PhysicsDepartment for a careful proofreading of this manu-script. We also thank the anonymous reviewers forhelpingus to clarify various claimsmade in thispaper.
References1. Z. Kolber, O. Prasil, and P. Falkowski, “Measurements of
variable chlorophyll fluorescence using fast repetition ratetechniques: defining methodology and experimental proto-cols,” Biochim. Biophys. Acta 1367, 888–106 (1988).
2. P. Falkowski and Z. Kolber, “Variations in chlorophyll fluores-cence yields in phytoplankton in the world oceans,” Aust. J.Plant Physiol. 22, 341–355 (1995).
3. G. Papageorgiou and Govindjee, Chlorophyll a Fluorescence: aSignature of Photosynthesis (Springer, 2004).
4. G. Portrer, J. A. Synowiec, and C. J. Tredwell, “Intensityeffects on the fluorescence of in vivo chlorophyll,” Biochim.Biophys. Acta 11, 329–3361 (1977).
5. J. Ide, D. Klug, W. Kuhlbrandt, L. Giorgi, and G. Porter, “Thestate of detergent solubilised light-harvesting chlorophyll-a/bprotein complex as monitored by ps time-resolved fluores-cence and circular dichroism,” Biochim. Biophys. Acta 893,349–364 (1987).
6. A. J. Campillo, S. L. Shapiro, V. H. Kollman, K. R. Winn, andR. C. Hyer, “Picosecond exciton annihilation in photosyntheticsystems,” Biophys. J. 16, 93–97 (1976).
7. M. Mimuro, S. Akimoto, T. Tomo, M. Yokono, H. Miyashita,and T. Tsuchiya, “Delayed fluorescence observed in the nstime region at 77K orginated directly from the photosystemII reaction center,” Biochim. Biophys. Acta Mol. Basis Dis.1767, 327–334 (2007).
8. P. Booth and J. Paulsen, “Assembly of light-harvestingchlorophyll a/b complex in vitro. Time-resolved fluorescencemeasurements,” Biochemistry 25, 5103–5108 (1996).
9. V.Goltsev,T.Ortoidze,Z.Socolov,D.Matorin,andP.Venediktov,“Delayed luminescence yield kinetics in flash illuminatedgreen plants,” Plant science letters 19, 339–346 (1980).
10. P. Falkowski and D. A. Kiefer, “Chlorophyll a fluorescence inphytoplankton: relationship to photosynthesis and biomass,”J. Plank. Res. 7, 715–731 (1985).
11. Z. Kolber and P. Falkowski, “Use of active fluorescence toestimate phytoplankton photosynthesis in situ,” Limnol.Oceanogr. 38, 1646–1665 (1993).
12. P. Falkowski and J. Raven, Aquatic Photosynthesis, (BlackwellScience, 1997).
13. V. Goltsev, P. Chernev, I. Zaharieva, P. Lambrev, and R. J.Strasser, “Kinetics of delayed cholorophyll a fluorescence re-gistered in the ms time range,” Photosynth. Res. 84, 209–215(2005).
14. T. J. Bensky (Department of Physics, California PolytechnicStateUniversity,SanLuisObispo,California93407),L.Chemo,C. Gilbert, B. Neff, M. A. Moline, I. Robbins, and D. Rohan arepreparinga paper to be called “Streak camera apparatus for in-stantaneous observation of nanosecond laser induced fluores-cence of in vitro seawater.”
15. Crystalaser, 4750 Longley Ln., Suite 205, Reno, Nevada89502, www.crystalaser.com. Laser model #QB440.
16. Photek Inc., 26 Castleham Road St, Leonards on Sea, EastSussex, TN38 9NS, United Kingdom, www.photek.com.
17. Stanford Research Systems, 1290-D Reamwood Ave., Sunny-vale, California 94089, www.thinksrs.com, Model #DG535.
18. See “ImageJ” software at http://rsb.info.nih.gov/ij/.19. A readily available 685nm continuous-wave diode laser was
used for this calibration step. Power was controlled via neutraldensity filters.
20. D. R. James, A. Siemiarczuk, and W. R. Ware, “Stroboscopicoptical boxcar technique for the determination of fluorescencelifetimes,” Rev. Sci. Instrum. 63, 1710–1716 (1992).
21. Govindjee, J. Amesz, and D. C. Fork, Light Emission by Plantsand Bacteria (Academic, 1986).
22. N. G. Bukhov, U. Heber, C. Wiese, and V. A. Shuvalov, “Energydissipation in photosynthesis: does the quenching of chloro-phyll fluorescence originate from antenna complexes of photo-system II or from the reaction center?,” Planta 212, 749–758(2001).
23. V.Goltsev,I.Zaharieva,P.Lambrev,I.Yordanov,andR.Strasser,“Simultaneous analysis of prompt and delayed chlorophyll afluorescence in leaves during the induction period of dark tolight adaptation,” J. Theor. Biol. 225, 171–183 (2003).
24. I. Zaharieva, V. Goltsev, “Advances on photosystem II investi-gationbymeasurementofdelayed fluorescencebyaphosphoro-scopic method,” Photochem. Photobiol. 77, 292–298 (2003).
25. J. Haveman and J. Lavorel, “Identification of the 120 micro-second phase in the decay of delayed fluorescence in spinachchloroplasts and subchloroplast particles as the intrinsic backreaction. The dependence of the level of phase on the thyla-koids internal pH,” Biochim. Biophys. Acta, Mol. Basis Dis.408, 269–283 1975).
26. K. K. Karukstis and K. Sauer, “Fluorescence decay kinetics ofchlorophyll in photosynthetic membranes,” J. Cell Biochem.23, 131–158 (1983).
27. W. A. Arnold, “Experiments,” Photosynth. Res. 27, 73–82(1991).
28. Ocean Optics, 830 Douglas Ave., Dunedin, Florida 34698,USA, www.oceanoptics.com, see the USB-4000 spectrometer.
29. L. Valkunas, N. E. Geacintov, L. France, and J. Breton, “Thedependence of the shapes of fluorescence induction curves inchloroplasts on the duration of illumination pulses,” Biophys.J. 59, 397–408 (1991).
30. A. C. Ley and D. Mauzerall, “Absolute absorption cross sec-tions for photosystem II and the minimum quantum require-ment for photosynthesis in Chlorella vulgaris,” Biochim.Biohys. Acta 680, 95–106 1982).
31. Z. S. Kolber, O. Prasil, and P. G. Falkowski, “Measurements ofvariable chlorophyll fluorescence using fast repetition ratetechniques: defining methodology and experimental proto-cols,” Biochim. Biophys. Acta Mol. Basis Dis. 1367, 88–106(1998).
1 August 2008 / Vol. 47, No. 22 / APPLIED OPTICS 3985

32. D. Mauzerall, “Light-induced fluorescence changes in chlorel-la, and the primary photoreactions for the production of oxy-gen,” Proc. Natl. Acad. Sci. USA 69, 1358–1362 (1972).
33. Hydroid,LLC,6BenjaminNyeCircle,Pocasset,Massachusetts02559-4900, www.hydroid.com.
34. U. Uehlinger, “An in situ pulse light fluorimeter for chlorophylldetermination as a monitor for vertical and horizontal phyto-
plankton distribution in lakes,” J. Plank. Res. 7, 605–615(1985).
35. M. M. Dekshenkis, P. L. Donaghay, J. M. Sullivan, J. E. B.Rines, T. R. Osborn, and M. S. Twardowski, “Temporal andspatial occurrence of thin phytoplankton layers in relationto physical processes,”Mar. Ecol. Prog. Ser. 223, 61–71 (2001).
3986 APPLIED OPTICS / Vol. 47, No. 22 / 1 August 2008