1
Abstract The density, behavior, and group size distribution of bowhead whales over Barrow Canyon and the Beaufort Sea shelf near Barrow, AK, during late summer and fall exhibit interannual variability that may be partially explained by the presence of dense patches of euphausiids (krill) and copepod prey. The “krill trap” model theorizes that moderate to strong easterly winds cause upwelling that advects prey onto the shelf, which then become aggregated (“trapped”) when wind speed decreases or direction changes to westerly or southwesterly. Furthermore, the model predicts that during upwelling periods bowhead whales will be found in smaller groups, often in Barrow Canyon, whereas during krill trap active periods bowhead whales will be found in larger groups over the shelf. Between 26 August and 4 October 2015, the Aerial Surveys of Arctic Marine Mammals (ASAMM) project (funded and co- managed by BOEM, conducted by NOAA) found historically high densities of feeding bowhead whales on the shelf south of 72 o N, between Pt. Barrow and Cape Halkett (152 o -157 o W). During this period, ASAMM conducted 8 surveys totaling over 40 hrs and observed 672 total bowhead whales, 454 of which were either feeding or milling. The ratio of feeding/milling to total bowhead whales in 2015 (0.676) was second only to 2009 (0.732) in a time series of annual surveys beginning in 1989. Seven ASAMM surveys were conducted on 6 of 8 krill trap active periods in 2015; feeding/milling bowhead whales were observed on 5 of those surveys. During the active krill trap phase, the observed mean and maximum bowhead whale group sizes were larger than at other times. A single survey was conducted during the upwelling phase and moderate numbers of bowhead whales were observed, none of which were feeding/milling. Comparison of bowhead whale group sizes on krill trap active days with data from surveys conducted 5 days prior showed that krill trap group sizes were larger, implying that the bowhead whale congregation response was rapid. All of the fall bowhead whales harvested near Barrow in 2015 had been feeding on euphausiids. ASAMM bowhead whale observations in 2015 support the krill trap model. Winds and Whales 1) The ratio of feeding & milling bowhead whales in 2015 was second only to 2009 in records dating back to 1989 2) During krill trap active periods, the observed mean and maximum bowhead whale group sizes were larger than at other times 3) Comparison of bowhead whale group sizes on krill trap active days with data from surveys conducted 5 days prior showed that krill trap group sizes were larger, implying that the bowhead whale congregation response was rapid 4) ASAMM bowhead whale observations in 2015 support the krill trap model The recommendations and general content presented in this poster do not necessarily represent the views or official position of the Department of Commerce, the National Oceanic and Atmospheric Administration, or the National Marine Fisheries Service. Line-transect aerial surveys for marine mammals were conducted by observers in high-wing twin engine turboprop aircraft Focal study area: 152 o to 157 o W, from the coast to 72 o N (Figure 2) Focal survey dates in 2015: August 26; September 1, 7, 16 * , 21, 26, 27; October 4 (Table 2). * Survey conducted during upwelling period. Survey effort and sightings were recorded as one of four flight types: deadhead, circling, search, or transect Similar survey protocols were used from 1989 to 2015 Observations of Bowhead Whale Foraging Near Barrow, Alaska, in 2015 Support the Krill Trap Model Megan Ferguson Marine Mammal Laboratory, Alaska Fisheries Science Center, NMFS, NOAA, [email protected] Stephen Okkonon – University of Alaska Fairbanks Janet Clarke – Leidos Amy Willoughby & Amelia Brower – Joint Institute for the Study of the Atmosphere and Ocean Carin Ashjian – Woods Hole Oceanographic Institution Craig George – North Slope Borough Department of Wildlife Management Krill Trap Model Figure 1. The “krill trap” model 1 theorizes that moderate to strong easterly winds cause upwelling that advects prey onto the shelf (A), which then become aggregated (“trapped”) when wind speed decreases or direction changes to westerly or southwesterly (B). Black arrows show schematized currents. The model predicts that during upwelling periods bowhead whales will be found in smaller groups, often in Barrow Canyon, whereas during krill trap active periods bowhead whales will be found in larger groups over the shelf. Methods Figure 2. ASAMM Bowhead whale sightings (including circling, search, and transect) and survey effort (including deadhead, circling, search, and transect) in the focal study area near Barrow, Alaska, during krill trap active and upwelling periods, 26 August to 4 October 2015. Table 2. Summary of ASAMM survey flights and bowhead whales observed in the focal area between 26 August and 4 October 2015. Red = krill trap active period. Blue = upwelling period. References 1 Ashjian, C.J., S.R. Braund, R.G. Campbell, J.C. George, J. Kruse, W. Maslowski, S.E. Moore, C.R. Nicolson, S.R. Okkonen, B.F. Sherr, E.B. Sherr, and Y.H. Spitz. 2010. Climate variability, oceanography, bowhead whale distribution, and Iñupiat subsistence whaling near Barrow, Alaska. Arctic 63(2): 179-194. Acknowledgments This study is funded and co-managed by the Bureau of Ocean Energy Management (IA No. M11PG00033), where we appreciate the support of Carol Fairfield and Dee Williams. At NMML, additional support was provided by Robyn Angliss, Phil Clapham, Stefan Ball, Nancy Friday, Kim Shelden, Janice Waite, and administrative and travel personnel. Thank you to the hard-working and talented marine mammal observers and pilots who spent their summer and fall flying over the Arctic. Real-time monitoring via satellite tracking of survey flights was provided by USDOI, Bureau of Land Management, Anchorage Interagency Dispatch Center. We also appreciate the analytical and programming expertise of Mike Hay (XeraGIS), who always responds instantaneously to questions from our field teams. Thank you to AFSC Graphics for assisting with the poster design. During krill trap active periods, the observed mean (2.43 whales) and maximum (40 whales) group sizes were larger than during the upwelling period (mean = 1.23 whales, maximum = 4 whales) (Figures 2 and 4). In 2015, the total number of bowhead whales and the number of feeding and milling bowhead whales were high, resulting in the second-highest feeding ratio (# feeding and milling whales / total # whales) since 1989 (Table 1). In 2015, feeding and milling bowhead whales were observed only during krill trap active periods (Figures 2 and 3, Table 2). Figure 3. Wind speed and direction near Barrow from 20 August to 9 October, 2015. Upwelling periods, when easterly winds are stronger than 5.4 m/s, are shown as blue stripes. Red stripes depict krill trap active periods, which occur under westerly winds or when winds are weak from any direction. Feeding bowhead whales sighted during survey. No feeding bowhead whales sighted during survey ASAMM 26 Aug to 4 Oct, All Effort Upwelling Other Behaviors 1 2 - 4 Bowhead Whale Sightings by Group Size Flightlines Flightlines Krill Trap Active Other Behaviors 1 2 - 4 5 - 9 10 - 20 21 - 40 Feeding & Milling 1 2 - 4 5 - 9 10 - 20 21 - 40 ! ( ! ( ! ( ! ( ! ( 20 m ! ! 50 m 100 m 200 m 500 m 1000 m 2000 m Isobaths ( ! ( ! ( ! ( ! ( ! ) " ) " Conclusions Date Flight Time (hours) in Focal Area Number of Bowhead Whales Observed Total Calves Mill Feed 8/26/2015 3.23 32 1 0 23 9/1/2015 1.33 57 2 0 9 9/7/2015 2.23 8 0 0 0 9/16/2015 6.62 46 3 0 0 9/21/2015 4.28 187 6 0 136 9/26/2015 2.55 10 1 0 0 9/27/2015 3.18 187 0 18 165 10/4/2015 6.93 164 8 36 79 Table 1. Number of feeding or milling and total bowhead whales observed during all flight types, by month, near Barrow during ASAMM surveys, 1989-2015. Feeding ratios were calculated as the number of feeding or milling bowhead whales divided by total bowhead whales. Black cells identify periods with no survey effort. JUL AUG SEP OCT TOTAL Year Feed & Mill Total Feeding Ratio Feed & Mill Total Feeding Ratio Feed & Mill Total Feeding Ratio Feed & Mill Total Feeding Ratio Feed & Mill Total Feeding Ratio 1989 0 0 NaN 0 0 NaN 0 0 NaN 3 9 0.333 3 9 0.333 1990 0 0 NaN 0 0 NaN 0 0 NaN 3 32 0.094 3 32 0.094 1991 0 0 NaN 0 0 NaN 0 0 NaN 0 1 0.000 0 1 0.000 1992 0 0 NaN 0 0 NaN 0 1 0.000 37 77 0.481 37 78 0.474 1993 0 0 NaN 0 0 NaN 0 9 0.000 6 32 0.188 6 41 0.146 1994 0 0 NaN 0 0 NaN 0 6 0.000 0 2 0.000 0 8 0.000 1995 0 0 NaN 0 0 NaN 0 1 0.000 0 8 0.000 0 9 0.000 1996 0 0 NaN 0 0 NaN 6 18 0.333 0 0 NaN 6 18 0.333 1997 0 0 NaN 0 0 NaN 55 105 0.524 127 204 0.623 182 309 0.589 1998 0 0 NaN 0 0 NaN 243 385 0.631 9 55 0.164 252 440 0.573 1999 0 0 NaN 0 0 NaN 3 24 0.125 57 109 0.523 60 133 0.451 2000 0 0 NaN 0 0 NaN 38 57 0.667 0 7 0.000 38 64 0.594 2001 0 0 NaN 0 0 NaN 0 2 0.000 0 0 NaN 0 2 0.000 2002 0 0 NaN 1 1 1.000 0 1 0.000 3 13 0.231 4 15 0.267 2003 0 0 NaN 0 0 NaN 0 12 0.000 0 1 0.000 0 13 0.000 2004 0 0 NaN 0 0 NaN 138 200 0.690 0 23 0.000 138 223 0.619 2005 0 0 NaN 0 0 NaN 28 37 0.757 1 8 0.125 29 45 0.644 2006 0 0 NaN 0 0 NaN 37 75 0.493 6 17 0.353 43 92 0.467 2007 0 0 NaN 0 0 NaN 0 0 NaN 12 20 0.600 12 20 0.600 2008 0 0 NaN 0 0 NaN 15 89 0.169 23 64 0.359 38 153 0.248 2009 0 0 NaN 0 0 NaN 2 11 0.182 266 355 0.749 268 366 0.732 2010 0 0 NaN 0 0 NaN 22 34 0.647 0 13 0.000 22 47 0.468 2011 0 0 NaN 0 0 NaN 0 13 0.000 0 6 0.000 0 19 0.000 2012 0 8 0.000 24 37 0.649 1 29 0.034 20 91 0.220 45 165 0.273 2013 0 0 NaN 24 45 0.533 54 105 0.514 0 35 0.000 78 185 0.422 2014 0 14 0.000 0 8 0.000 69 129 0.535 40 78 0.513 109 229 0.476 2015 0 0 NaN 24 48 0.500 322 461 0.698 108 163 0.663 454 672 0.676 Figure 4. Histogram of observed bowhead whale group sizes in the focal area in 2015, all flight types, during krill trap active and upwelling periods. 0 20 40 60 80 100 120 140 160 1 2 to 4 5 to 9 10 to 20 21 to 40 Number of Groups Group Size Observed Bowhead Whale Group Sizes in 2015 Krill Trap Active Upwelling

Observations of Bowhead Whale Foraging Near Barrow, Alaska, … · Abstract The density, behavior, and group size distribution of bowhead whales over Barrow Canyon and the Beaufort

Embed Size (px)

Citation preview

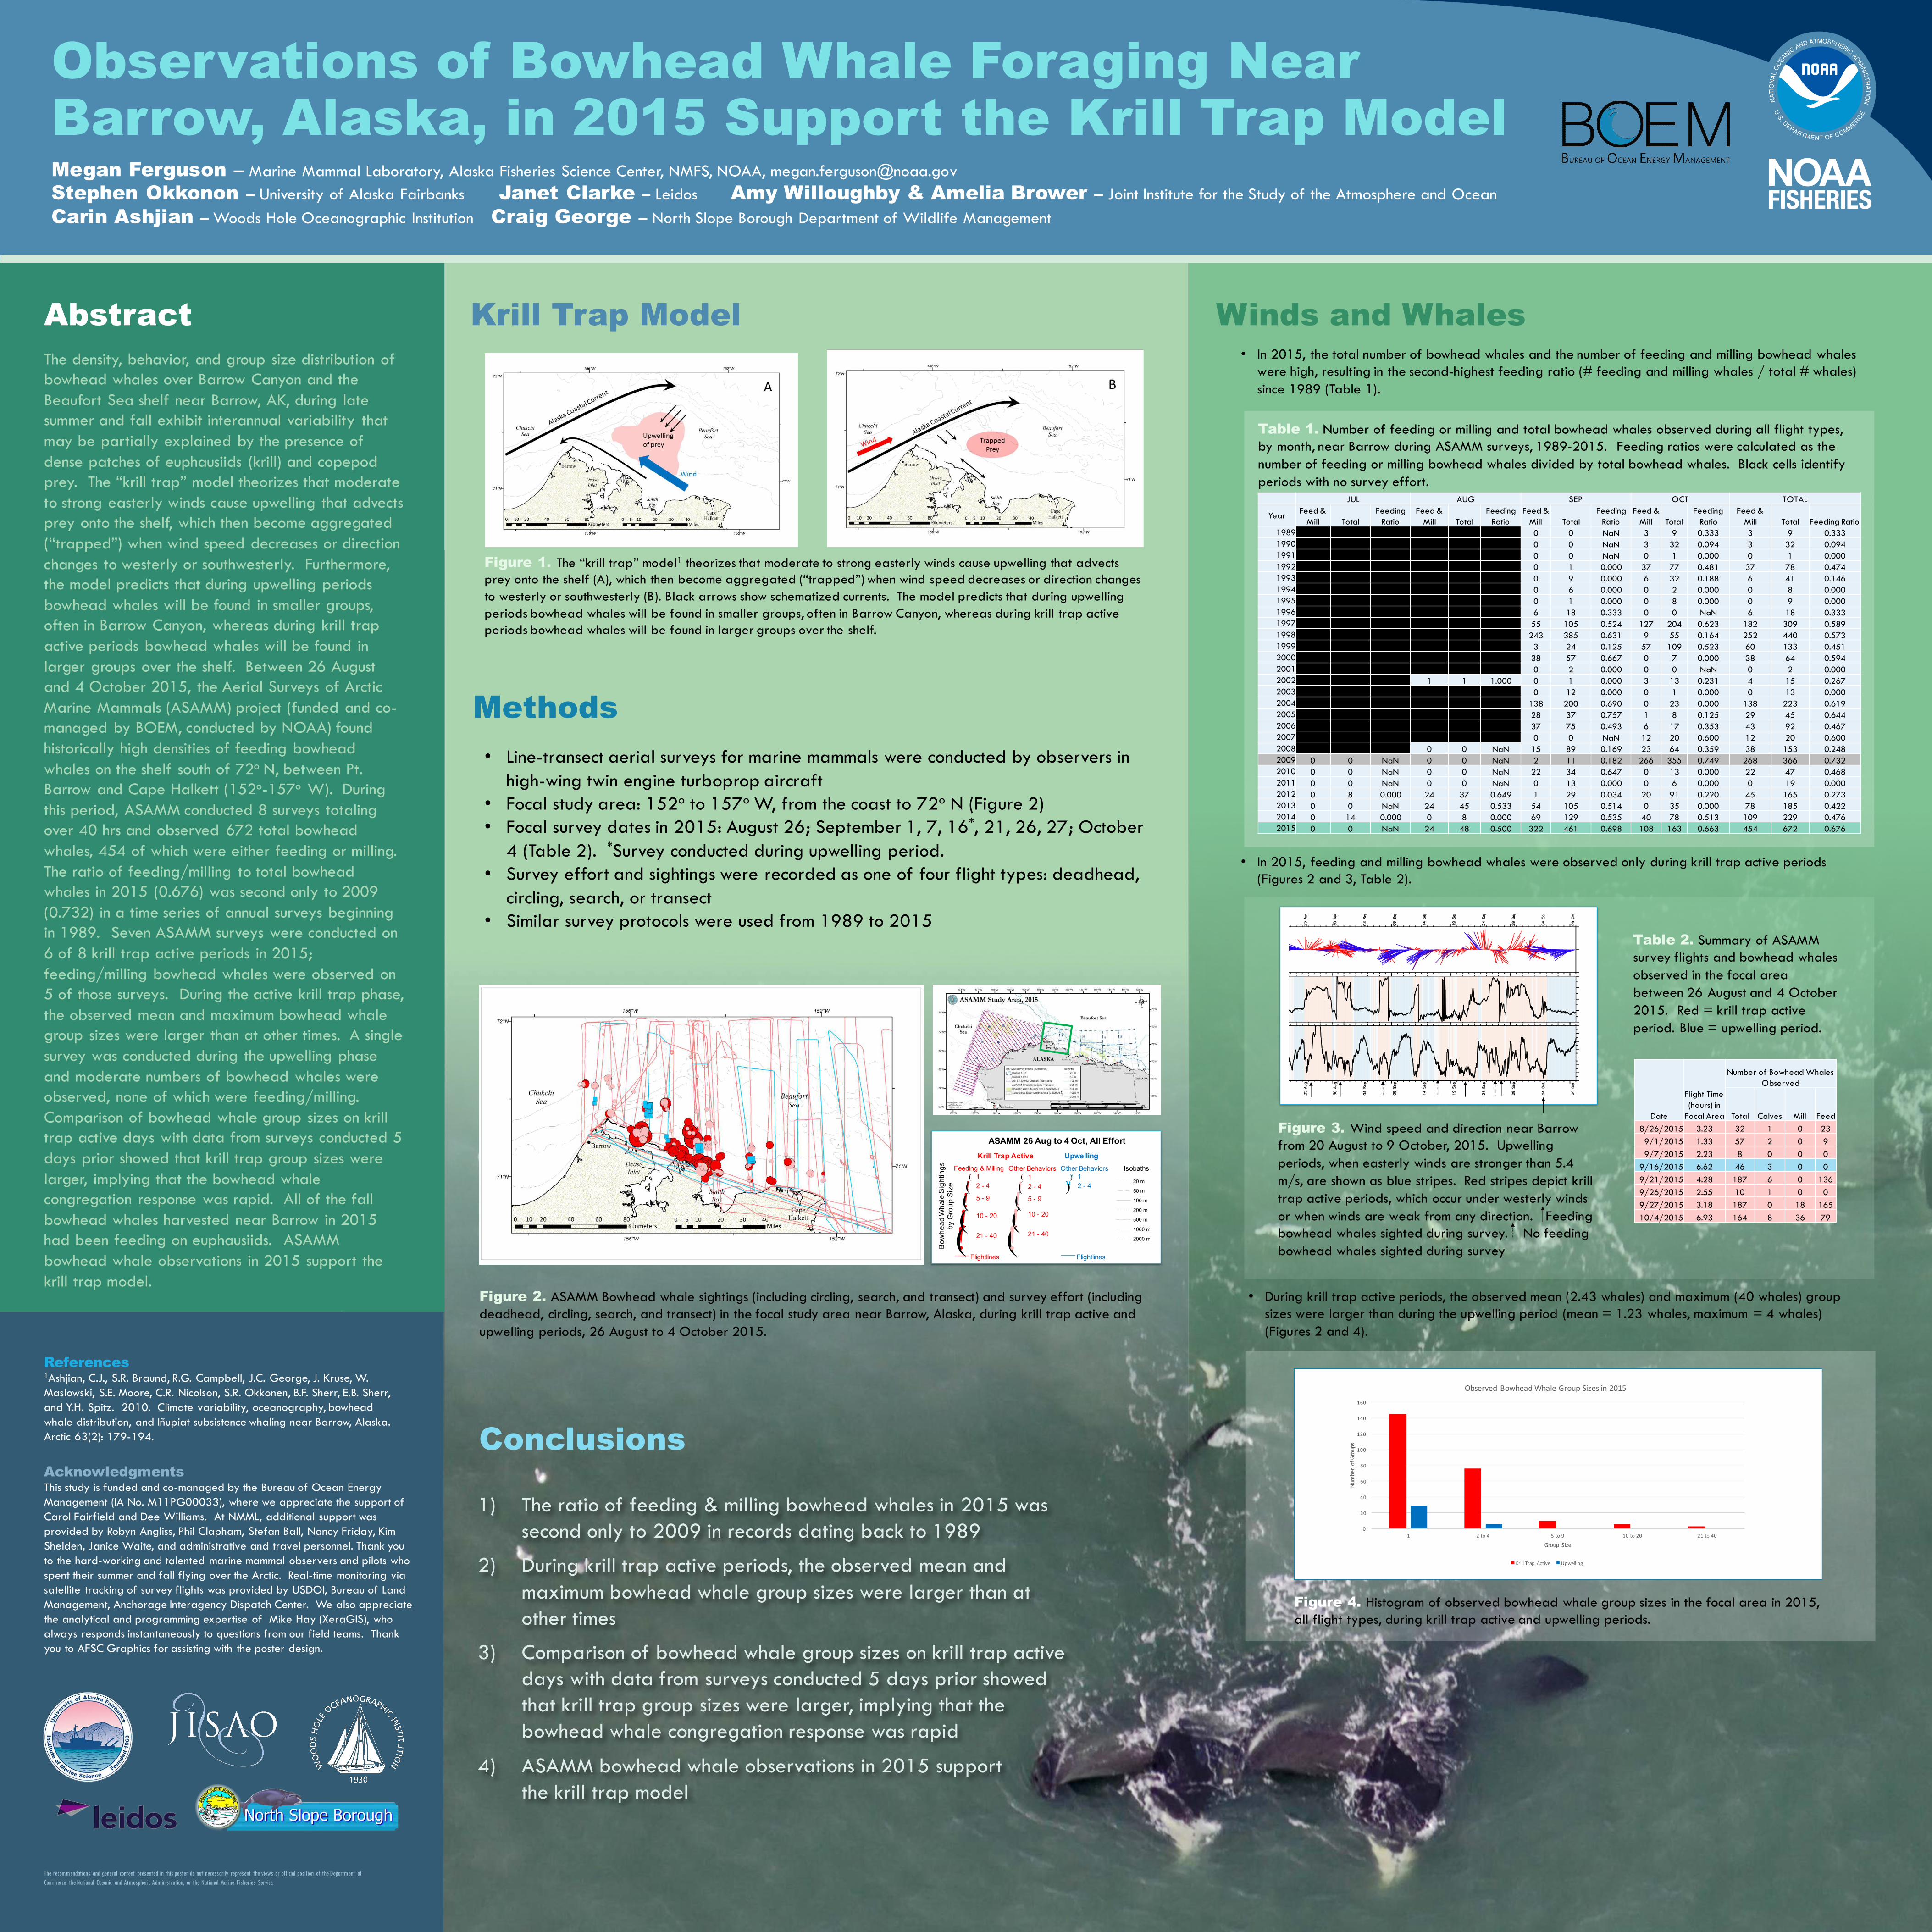
AbstractThe density, behavior, and group size distribution of bowhead whales over Barrow Canyon and the Beaufort Sea shelf near Barrow, AK, during late summer and fall exhibit interannual variability that may be partially explained by the presence of dense patches of euphausiids (krill) and copepod prey. The “krill trap” model theorizes that moderate to strong easterly winds cause upwelling that advectsprey onto the shelf, which then become aggregated (“trapped”) when wind speed decreases or direction changes to westerly or southwesterly. Furthermore, the model predicts that during upwelling periods bowhead whales will be found in smaller groups, often in Barrow Canyon, whereas during krill trap active periods bowhead whales will be found in larger groups over the shelf. Between 26 August and 4 October 2015, the Aerial Surveys of Arctic Marine Mammals (ASAMM) project (funded and co-managed by BOEM, conducted by NOAA) found historically high densities of feeding bowhead whales on the shelf south of 72o N, between Pt. Barrow and Cape Halkett (152o-157o W). During this period, ASAMM conducted 8 surveys totaling over 40 hrs and observed 672 total bowhead whales, 454 of which were either feeding or milling. The ratio of feeding/milling to total bowhead whales in 2015 (0.676) was second only to 2009 (0.732) in a time series of annual surveys beginning in 1989. Seven ASAMM surveys were conducted on 6 of 8 krill trap active periods in 2015; feeding/milling bowhead whales were observed on 5 of those surveys. During the active krill trap phase, the observed mean and maximum bowhead whale group sizes were larger than at other times. A single survey was conducted during the upwelling phase and moderate numbers of bowhead whales were observed, none of which were feeding/milling. Comparison of bowhead whale group sizes on krill trap active days with data from surveys conducted 5 days prior showed that krill trap group sizes were larger, implying that the bowhead whale congregation response was rapid. All of the fall bowhead whales harvested near Barrow in 2015 had been feeding on euphausiids. ASAMM bowhead whale observations in 2015 support the krill trap model.

Winds and Whales

1) The ratio of feeding & milling bowhead whales in 2015 was second only to 2009 in records dating back to 1989

2) During krill trap active periods, the observed mean and maximum bowhead whale group sizes were larger than at other times

3) Comparison of bowhead whale group sizes on krill trap active days with data from surveys conducted 5 days prior showed that krill trap group sizes were larger, implying that the bowhead whale congregation response was rapid

4) ASAMM bowhead whale observations in 2015 support the krill trap model

The recommendations and general content presented in this poster do not necessarily represent the views or official position of the Department of Commerce, the National Oceanic and Atmospheric Administration, or the National Marine Fisheries Service.

• Line-transect aerial surveys for marine mammals were conducted by observers in high-wing twin engine turboprop aircraft

• Focal study area: 152o to 157o W, from the coast to 72o N (Figure 2)• Focal survey dates in 2015: August 26; September 1, 7, 16*, 21, 26, 27; October

4 (Table 2). *Survey conducted during upwelling period.• Survey effort and sightings were recorded as one of four flight types: deadhead,

circling, search, or transect• Similar survey protocols were used from 1989 to 2015

Observations of Bowhead Whale Foraging Near Barrow, Alaska, in 2015 Support the Krill Trap ModelMegan Ferguson – Marine Mammal Laboratory, Alaska Fisheries Science Center, NMFS, NOAA, [email protected] Stephen Okkonon – University of Alaska Fairbanks Janet Clarke – Leidos Amy Willoughby & Amelia Brower – Joint Institute for the Study of the Atmosphere and Ocean Carin Ashjian – Woods Hole Oceanographic Institution Craig George – North Slope Borough Department of Wildlife Management

Krill Trap Model

Figure 1. The “krill trap” model1 theorizes that moderate to strong easterly winds cause upwelling that advectsprey onto the shelf (A), which then become aggregated (“trapped”) when wind speed decreases or direction changes to westerly or southwesterly (B). Black arrows show schematized currents. The model predicts that during upwelling periods bowhead whales will be found in smaller groups, often in Barrow Canyon, whereas during krill trap active periods bowhead whales will be found in larger groups over the shelf.

Methods

Figure 2. ASAMM Bowhead whale sightings (including circling, search, and transect) and survey effort (including deadhead, circling, search, and transect) in the focal study area near Barrow, Alaska, during krill trap active and upwelling periods, 26 August to 4 October 2015.

Table 2. Summary of ASAMM survey flights and bowhead whales observed in the focal area between 26 August and 4 October 2015. Red = krill trap active period. Blue = upwelling period.

References1Ashjian, C.J., S.R. Braund, R.G. Campbell, J.C. George, J. Kruse, W. Maslowski, S.E. Moore, C.R. Nicolson, S.R. Okkonen, B.F. Sherr, E.B. Sherr, and Y.H. Spitz. 2010. Climate variability, oceanography, bowhead whale distribution, and Iñupiat subsistence whaling near Barrow, Alaska. Arctic 63(2): 179-194.

AcknowledgmentsThis study is funded and co-managed by the Bureau of Ocean Energy Management (IA No. M11PG00033), where we appreciate the support of Carol Fairfield and Dee Williams. At NMML, additional support was provided by Robyn Angliss, Phil Clapham, Stefan Ball, Nancy Friday, Kim Shelden, Janice Waite, and administrative and travel personnel. Thank you to the hard-working and talented marine mammal observers and pilots who spent their summer and fall flying over the Arctic. Real-time monitoring via satellite tracking of survey flights was provided by USDOI, Bureau of Land Management, Anchorage Interagency Dispatch Center. We also appreciate the analytical and programming expertise of Mike Hay (XeraGIS), who always responds instantaneously to questions from our field teams. Thank you to AFSC Graphics for assisting with the poster design.

• During krill trap active periods, the observed mean (2.43 whales) and maximum (40 whales) group sizes were larger than during the upwelling period (mean = 1.23 whales, maximum = 4 whales) (Figures 2 and 4).

• In 2015, the total number of bowhead whales and the number of feeding and milling bowhead whales were high, resulting in the second-highest feeding ratio (# feeding and milling whales / total # whales) since 1989 (Table 1).

• In 2015, feeding and milling bowhead whales were observed only during krill trap active periods (Figures 2 and 3, Table 2).

Figure 3. Wind speed and direction near Barrow from 20 August to 9 October, 2015. Upwelling periods, when easterly winds are stronger than 5.4 m/s, are shown as blue stripes. Red stripes depict krill trap active periods, which occur under westerly winds or when winds are weak from any direction. Feeding bowhead whales sighted during survey. No feeding bowhead whales sighted during survey

ASAMM 26 Aug to 4 Oct, All EffortUpwelling

Other Behaviors12 - 4

Bow

head

Wha

le S

ight

ings

by G

roup

Siz

e

Flightlines Flightlines

Krill Trap ActiveOther Behaviors

12 - 4

5 - 9

10 - 20

21 - 40

Feeding & Milling12 - 4

5 - 9

10 - 20

21 - 40!(!(!(!(!(

20 m! ! 50 m

100 m

200 m

500 m

1000 m

2000 m

Isobaths(!

(!(!(!(!

)")"

Conclusions

Date

Flight Time (hours) in

Focal Area

Number of Bowhead Whales Observed

Total Calves Mill Feed8/26/2015 3.23 32 1 0 239/1/2015 1.33 57 2 0 99/7/2015 2.23 8 0 0 0

9/16/2015 6.62 46 3 0 09/21/2015 4.28 187 6 0 1369/26/2015 2.55 10 1 0 09/27/2015 3.18 187 0 18 16510/4/2015 6.93 164 8 36 79

Table 1. Number of feeding or milling and total bowhead whales observed during all flight types, by month, near Barrow during ASAMM surveys, 1989-2015. Feeding ratios were calculated as the number of feeding or milling bowhead whales divided by total bowhead whales. Black cells identify periods with no survey effort.

JUL AUG SEP OCT TOTAL

Year Feed & Mill Total

Feeding Ratio

Feed & Mill Total

Feeding Ratio

Feed & Mill Total

Feeding Ratio

Feed & Mill Total

Feeding Ratio

Feed & Mill Total Feeding Ratio

1989 0 0 NaN 0 0 NaN 0 0 NaN 3 9 0.333 3 9 0.3331990 0 0 NaN 0 0 NaN 0 0 NaN 3 32 0.094 3 32 0.0941991 0 0 NaN 0 0 NaN 0 0 NaN 0 1 0.000 0 1 0.0001992 0 0 NaN 0 0 NaN 0 1 0.000 37 77 0.481 37 78 0.4741993 0 0 NaN 0 0 NaN 0 9 0.000 6 32 0.188 6 41 0.1461994 0 0 NaN 0 0 NaN 0 6 0.000 0 2 0.000 0 8 0.0001995 0 0 NaN 0 0 NaN 0 1 0.000 0 8 0.000 0 9 0.0001996 0 0 NaN 0 0 NaN 6 18 0.333 0 0 NaN 6 18 0.3331997 0 0 NaN 0 0 NaN 55 105 0.524 127 204 0.623 182 309 0.5891998 0 0 NaN 0 0 NaN 243 385 0.631 9 55 0.164 252 440 0.5731999 0 0 NaN 0 0 NaN 3 24 0.125 57 109 0.523 60 133 0.4512000 0 0 NaN 0 0 NaN 38 57 0.667 0 7 0.000 38 64 0.5942001 0 0 NaN 0 0 NaN 0 2 0.000 0 0 NaN 0 2 0.0002002 0 0 NaN 1 1 1.000 0 1 0.000 3 13 0.231 4 15 0.2672003 0 0 NaN 0 0 NaN 0 12 0.000 0 1 0.000 0 13 0.0002004 0 0 NaN 0 0 NaN 138 200 0.690 0 23 0.000 138 223 0.6192005 0 0 NaN 0 0 NaN 28 37 0.757 1 8 0.125 29 45 0.6442006 0 0 NaN 0 0 NaN 37 75 0.493 6 17 0.353 43 92 0.4672007 0 0 NaN 0 0 NaN 0 0 NaN 12 20 0.600 12 20 0.6002008 0 0 NaN 0 0 NaN 15 89 0.169 23 64 0.359 38 153 0.2482009 0 0 NaN 0 0 NaN 2 11 0.182 266 355 0.749 268 366 0.7322010 0 0 NaN 0 0 NaN 22 34 0.647 0 13 0.000 22 47 0.4682011 0 0 NaN 0 0 NaN 0 13 0.000 0 6 0.000 0 19 0.0002012 0 8 0.000 24 37 0.649 1 29 0.034 20 91 0.220 45 165 0.2732013 0 0 NaN 24 45 0.533 54 105 0.514 0 35 0.000 78 185 0.4222014 0 14 0.000 0 8 0.000 69 129 0.535 40 78 0.513 109 229 0.4762015 0 0 NaN 24 48 0.500 322 461 0.698 108 163 0.663 454 672 0.676

Figure 4. Histogram of observed bowhead whale group sizes in the focal area in 2015, all flight types, during krill trap active and upwelling periods.

0

20

40

60

80

100

120

140

160

1 2to4 5to9 10to20 21to40

NumberofGroups

Group Size

ObservedBowheadWhaleGroupSizesin2015

KrillTrapActive Upwelling