Embed Size (px)
Citation preview

ACPD10, 9839–9893, 2010
Observations ofelevated
formaldehyde
W. Choi et al.
Title Page
Abstract Introduction
Conclusions References
Tables Figures
J I
J I
Back Close
Full Screen / Esc
Printer-friendly Version
Interactive Discussion
Atmos. Chem. Phys. Discuss., 10, 9839–9893, 2010www.atmos-chem-phys-discuss.net/10/9839/2010/© Author(s) 2010. This work is distributed underthe Creative Commons Attribution 3.0 License.
AtmosphericChemistry
and PhysicsDiscussions
This discussion paper is/has been under review for the journal Atmospheric Chemistryand Physics (ACP). Please refer to the corresponding final paper in ACP if available.
Observations of elevated formaldehydeover a forest canopy suggest missingsources from rapid oxidation of arborealhydrocarbons
W. Choi1, I. C. Faloona1, N. C. Bouvier-Brown2,*, M. McKay2,**, A. H. Goldstein2,J. Mao3,***, W. H. Brune3, B. W. LaFranchi4, R. C. Cohen4,5, G. M. Wolfe6,J. A. Thornton7, D. M. Sonnenfroh8, and D. B. Millet9
1University of California, Davis, Land, Air, and Water Resources, Davis, California, USA2University of California, Berkeley, Dept. of Environmental Science, Policy, & Management,Berkeley, California, USA3Pennsylvania State University, Dept. of Meteorology, University Park, Pennsylvania, USA4University of California, Berkeley, Dept. of Chemistry, Berkeley, California, USA5University of California, Berkeley, Dept. of Earth and Planetary Science, Berkeley,California, USA6University of Washington, Dept. of Chemistry, Seattle, Washington, USA7University of Washington, Dept. of Atmospheric Sciences, Seattle, Washington, USA
9839

ACPD10, 9839–9893, 2010
Observations ofelevated
formaldehyde
W. Choi et al.
Title Page
Abstract Introduction
Conclusions References
Tables Figures
J I
J I
Back Close
Full Screen / Esc
Printer-friendly Version
Interactive Discussion
8Physical Sciences Inc., Atmospheric Sciences group, Andover, Massachusetts, USA9University of Minnesota, Department of Soil, Water, and Climate, St. Paul, Minnesota, USA∗now at: Loyola Marymount University, Department of Chemistry and Biochemistry, LosAngeles, California, USA∗∗now at: California Air Resources Board, Sacramento, California, USA∗∗∗now at: Harvard University, School of Engineering and Applied Sciences, Cambridge,Massachustte, USA
Received: 23 March 2010 – Accepted: 1 April 2010 – Published: 16 April 2010
Correspondence to: W. Choi ([email protected])
Published by Copernicus Publications on behalf of the European Geosciences Union.
9840

ACPD10, 9839–9893, 2010
Observations ofelevated
formaldehyde
W. Choi et al.
Title Page
Abstract Introduction
Conclusions References
Tables Figures
J I
J I
Back Close
Full Screen / Esc
Printer-friendly Version
Interactive Discussion
Abstract
To better understand the processing of biogenic VOCs (BVOCs) in the pine forestsof the U.S. Sierra Nevada, we measured HCHO at Blodgett Research Station us-ing Quantum Cascade Laser Spectroscopy (QCLS) during the Biosphere Effects onAerosols and Photochemistry Experiment (BEARPEX) of late summer 2007. Four days5
of the experiment exhibited particularly copious HCHO, with midday peaks between15–20 ppbv, while the other days developed delayed maxima between 8–14 ppbv inthe early evening. From the expansive photochemical data set, we attempt to explainthe observed HCHO concentrations by quantifying the various known photochemicalproduction and loss terms in its chemical budget. Overall, known chemistry predicts10
a factor of 3–5 times less HCHO than observed. By examining diurnal patterns of thevarious budget terms we conclude that, during the high HCHO period, local, highlyreactive oxidation chemistry produces an abundance of formaldehyde at the site. Theresults support the hypothesis of previous work at Blodgett Forest suggesting that largequantities of BVOC oxidation products, observed directly above the ponderosa pine15
canopy, are evidence of profuse emissions of very reactive volatile organic compounds(VR-VOCs) from the forest. However, on the majority of days, under generally coolerand more moist conditions, lower levels of HCHO develop primarily influenced by theinflux of precursors transported into the region along with the Sacramento plume.
1 Introduction20
Formaldehyde (HCHO) is one of the most abundant volatile organic compounds(VOCs) found in the atmosphere. It is emitted directly from human activities, suchas vehicular exhaust, wood burning, and industrial activity, but is formed in greatestabundance from the oxidation of other VOCs (Facchini et al., 1992; Lee et al., 1998;Seinfeld and Pandis, 1998). Not only does HCHO play an important role in tropospheric25
photochemistry as both a source and a sink of free radicals (Grosjean, 1982), and as
9841
ACPD10, 9839–9893, 2010
Observations ofelevated
formaldehyde
W. Choi et al.
Title Page
Abstract Introduction
Conclusions References
Tables Figures
J I
J I
Back Close
Full Screen / Esc
Printer-friendly Version
Interactive Discussion
an important precursor of molecular hydrogen (Hauglustaine and Ehhalt, 2002), but itis also believed to be a highly toxic air pollutant (Suh et al., 2000). Tan et al. (2001)showed HCHO to be a significant source of HOx (=OH+HO2) in a mixed forest in North-ern Michigan, and thus it is often strongly linked to the formation of tropospheric ozone.Bowman et al. (1995) calculated ozone productivities for carbonyls, aromatics, alkanes,5
and alkenes for the Southern California Air Quality Study air pollution episode of Au-gust 1987, concluding that HCHO is one of the most effective ozone producing VOCsas well as the greatest OH precursor in that case. In forest environments, most HCHOis produced from photooxidation of biogenic VOCs rather than from direct emissions(Lee et al., 1998). Virtually all oxidation of hydrocarbons in the atmosphere involves10
the production of HCHO at some point in its reaction sequence. Sumner et al. (2001)reported that isoprene was the most important precursor of HCHO in the same de-ciduous/coniferous forest as the Tan et al. (2001) study, contributing 82% on averageto the calculated midday HCHO production rate. However, little is known about theeffect of biogenic VOCs on regional photochemistry in coniferous forests in which 2-15
methyl-3-buten-2-ol (MBO) and monoterpenes, rather than isoprene, are predominant.Further complicating the picture, Hozinger et al. (2005) observed large quantities of pu-tative oxidation products near the canopy top at Blodgett Forest, implicating a sourceof unidentified, very-reactive biogenic VOCs comparable in magnitude to the source ofMBO. Emissions of such VOCs might be responsible for the reactive (chemical) com-20
ponent of the canopy ozone flux observed by Kurpius and Goldstein (2003) and wouldbe expected to leave a large HCHO imprint in the near canopy environment.
High concentrations of HCHO in the polluted boundary layer have been documentedin a number of previous studies: 19 ppbv by Grosjean et al. (1990) in Sao Paulo to25 ppbv by Possanzini et al. (1996) in Rome. The largest values tend to be found in25
urban centers where primary emissions undoubtedly hold sway. In forested and semi-rural regions peak concentrations are typically lower, e.g. between 4.5 (Macdonald etal., 2001) and 12 ppbv (Sumner et al., 2001). However, Largiuni et al. (2002) have re-ported concentrations up to 17 ppbv in a botanical garden in Florence, Italy and Muller
9842

ACPD10, 9839–9893, 2010
Observations ofelevated
formaldehyde
W. Choi et al.
Title Page
Abstract Introduction
Conclusions References
Tables Figures
J I
J I
Back Close
Full Screen / Esc
Printer-friendly Version
Interactive Discussion
et al. (2002) observed 18 ppbv over a blooming field of rape in Germany, possibly indi-cating that in certain locales where anthropogenic emissions are blended with biogenicVOCs high levels of formaldehyde may be generated. Here we report HCHO concen-trations which peak between 8–20 ppb over a rural pine plantation ∼75 km downwindof the California state capital during the summer–fall transition. Our focus is on using5
these observations and a unique suite of simultaneous supporting photochemical andmeteorological observations to test the current understanding of HCHO sources.
Local atmospheric HCHO concentrations are controlled by advection, direct emis-sions from point and regional sources, secondary chemical production from variousprecursors such as biogenic and anthropogenic VOCs, CH4, and PAN, in conjunction10
with loss mechanisms, including the reaction with OH, photolysis, and dry deposition.In a fairly remote forest environment, direct emissions are likely to be insignificant, andhence the governing equation of mean boundary layer [HCHO] can be expressed asEq. (1), where U is the mean wind speed (in the x-direction aligned with the meanwind), kOH and jHCHO are rate constants for the OH+HCHO reaction and photolysis of15
HCHO, respectively, Vd is dry deposition velocity, and H is the boundary layer mixingheight.
∂[HCHO]∂t
=−U · ∂[HCHO]∂x
+PHCHO−(kOH[OH]+ jHCHO+
VdH
)· [HCHO] (1)
PHCHO represents a total production term from atmospheric photochemical pro-cesses, including biogenic VOCs+OH and O3 reactions, and methyl peroxy (CH3O2)radical formation from CH4 oxidation and peroxyacetyl (PA, CH3C(O)O2) radicals. We20
neglect solubility-driven partitioning of HCHO into particulate matter, which is likely tobe minor (Munger et al., 1984).
9843

ACPD10, 9839–9893, 2010
Observations ofelevated
formaldehyde
W. Choi et al.
Title Page
Abstract Introduction
Conclusions References
Tables Figures
J I
J I
Back Close
Full Screen / Esc
Printer-friendly Version
Interactive Discussion
2 The Experiment (BEARPEX 2007)
2.1 Site description
Measurements were conducted near the Blodgett Forest Research Station located onthe western slope of the Sierra Nevada Mountains in California (38.9◦N, 120.6◦W;1315 m elevation) approximately 75 km northeast of Sacramento. The managed forest5
consists mainly of conifer trees (30% of ground area), dominated by Pinus ponderosaL. with individuals of Douglas fir, white fir, and incense-cedar, a few oak trees (Californiablack oak; 2%), forbs (7%) and shrubs (Mazaita and Ceanothus; 25%) (Goldstein et al.,2000; Misson et al., 2005). The mean canopy height during the experiment in late sum-mer 2007 was 7.9 m. The summertime meteorology at the site is characterised by a10
strong, thermally driven cross-valley circulation with anabatic (west-southwesterly, up-slope) winds bringing a complex mixture of anthropogenic and biogenic compounds tothe site throughout the day followed by katabatic flow (east-northeasterly, downslope)of relatively cleaner air overnight. The major anthropogenic emission source is vehic-ular traffic in the Sacramento region and there are no major industrial point sources15
between Sacramento and Blodgett Forest (Dillon et al., 2002). The characteristics ofthe Sacramento plume during the daytime are described in detail by Dillon et al. (2002)and Murphy et al. (2007). Between Sacramento and Blodgett Forest, an oak forestis situated with a width of approximately 30 km transverse to the predominant winddirection (Goldstein et al., 2000), and is a large source of isoprene to the plume.20
Two observation towers were in place at the site; a 15 m walk-up tower (south tower)and a 18 m scaffolding tower, 10 m to the north. The HCHO sample inlet (1/4′′ ODTeflon tubing) was installed near the top of the south tower (11.8 m), drawing the am-bient air sample into a trailer at the base at a flow rate of 2.4 LPM. Power was suppliedby a propane generator located ∼125 m north of the measuring towers, perpendicular25
to the prevailing wind directions.
9844

ACPD10, 9839–9893, 2010
Observations ofelevated
formaldehyde
W. Choi et al.
Title Page
Abstract Introduction
Conclusions References
Tables Figures
J I
J I
Back Close
Full Screen / Esc
Printer-friendly Version
Interactive Discussion
2.2 QCL spectroscopy of HCHO
Atmospheric formaldehyde was measured with a thermoelectrically-cooled distributedfeedback quantum cascade laser spectrometer, designed and developed by PhysicalScience Inc. A multi-pass Herriott cell (operated at 50 to 70 mbar) is used to obtain highsensitivity. The spectrometer uses two liquid nitrogen cooled, photovoltaic HgCdTe de-5
tectors (6 µm cutoff, Fermionics) in a Balanced Ratiometric Detection (BRD) techniquethat electronically cancels common mode laser noise (Hobbs, 1997). Approximately35% of the QCL beam is diverted by a 2 µm thick pellicle beam-splitter to the referencedetector before the transmitted beam is sent on through a Herriott cell with an effectivepathlength of 100 m through the absorbing gas sample.10
The laser was originally fabricated to emit near 5.7 µm, which is the ν2 band of HCHO(C=O stretch mode: 1746 cm−1; Perrin et al., 2003). However, the active lasing surfaceused in this experiment emitted closer to 1721 cm−1, and the thermoelectric coolingsystem was not able to cool the laser mount below −10 ◦C at typical ambient roomtemperature, limiting the tuning range to ∼2 cm−1. Controlling the laser mount tem-15
perature (−10.5 ◦C to 8.0 ◦C), the emission line was scanned in the range from 1720.0to 1722.2 cm−1, with a standard gas from a NIST traceable permeation tube to deter-mine the optimal target wavenumber to measure the HCHO absorption feature. Usingthe published FTIR spectra of the ν2 absorption band of HCHO (Gratien et al., 2007),and the corresponding spectral features observed during the scan, we concluded that20
the optimal wavelength for routine detection was 1721 cm−1 in a P-branch band of therovibrational spectrum (Fig. 1).
2.2.1 Spectroscopic interferences
Water vapor is one of the most potentially important interferences in any spectroscopicmeasurement of atmospheric HCHO. In order to experimentally verify whether water25
vapor has any interfering absorption at 1721 cm−1, we installed a humidifier into thezero air stream, diluting the output of the HCHO permeation system. In addition, to
9845

ACPD10, 9839–9893, 2010
Observations ofelevated
formaldehyde
W. Choi et al.
Title Page
Abstract Introduction
Conclusions References
Tables Figures
J I
J I
Back Close
Full Screen / Esc
Printer-friendly Version
Interactive Discussion
avoid the effect of any changes in the background spectrum for humidified and drysamples, zero air alternately flowed through and then bypassed the humidifier beforeadding HCHO gas from the permeation tube. The difference in absorbance obtainedfrom humid and dry samples was <0.1%, indicating that the interference of water vaporabsorption is negligible at 1721 cm−1.5
Although formic acid is known to be sufficiently active near the v2 band of HCHO(1746 cm−1) due to its C=O double bond, the strongest absorption band is located at1765 cm−1 which is far from our target wavenumber. The only possible interferencefrom formic acid in HCHO absorption around 1721 cm−1 is the C=O stretch mode forcis-DCOOH (Macoas et al., 2003). However, considering the ratio of cis-HCOOH to10
trans-HCOOH is ∼10−3 at 298 K, and further considering it is deuterated, which isonly a very minor constituent in the atmosphere (0.015% abundance in the ocean),it is unlikely that there is any significant interference from deuterated formic acid at1721 cm−1. Another possible interference may come from acetaldehyde. Acetaldehydehas a strong absorption band (ν4) ranging from 1680 to 1820 cm−1 with a peak mag-15
nitude in the R branch at 1764 cm−1 (Kamat et al., 2007). The nearest recorded lineto our target wavelength is a P branch of the C=O stretch at 1725 cm−1 (Kegley-Owenet al., 1999). Because it is far enough from the target, it is unlikely that acetaldehydeinfluences the HCHO absorption at 1721 cm−1.
2.2.2 Calibration, uncertainty, and data reduction20
During the BEARPEX 2007, a permeation tube (Metronics Dynacal; 88±4 ng/min at45 ◦C) diluted with ultra high purity grade zero air (Airgas) was used to calibrate theHCHO absorption measurements. The emission rate of the permeation tube froman independent gravimetric test agreed with the reported value to within a 10% mea-surement error (±8 ng/min). The permeation tube is held in an oven at a regulated25
temperature and pressure (typically, 45 ◦C and 1856 mbar, respectively). The con-centrations from the permeation system are calculated from the emission rate of the
9846

ACPD10, 9839–9893, 2010
Observations ofelevated
formaldehyde
W. Choi et al.
Title Page
Abstract Introduction
Conclusions References
Tables Figures
J I
J I
Back Close
Full Screen / Esc
Printer-friendly Version
Interactive Discussion
permeation tube and the flow rates of the dilution and carrier gases through the per-meation tube. We used two different permeation tubes with different emission rates(88 ng/min and 35 ng/min at 45 ◦C), and the results of the two permeation tubes werein very good agreement. In addition, the multipoint calibration curve showed good lin-earity and correlation between calculated concentrations and integrated absorbance of5
the HCHO spectra (R2=0.999). For the precision test, the spectra for a HCHO stan-dard (18.1 ppm) from the permeation tube in high calibration mode were collected over15 min intervals. The standard error was 2.1% with 1-min average scans. The spectraof diluted HCHO with zero air (93.3 ppb and 27 ppb) were also collected yielding 3.9%and 8.9% standard error. In order to verify whether ultra high purity (UHP) zero air10
(additionally purified with a charcoal hydrocarbon trap) contains any trace of HCHO,we compared absorption spectra of zero air between the cell pressure of 1.8 mbar andthe operational cell pressure of 60 mbar. If the zero air contained any kind of absorberat the target wavenumber, the spectrum at 60 mbar should show a bigger and broaderpeak due to its greater density and Lorentz broadening. However, the shapes of spec-15
tra between two zero air samples at 1.8 and 60 mbar showed good agreement within∼1σ error range for a whole scanned frequency interval. We, therefore, considered thezero air to be free of any HCHO contamination.
By far the largest source of instrumental noise was the background spectrum in zeroair which drifted and changed its shape throughout the experiment, presumably in re-20
sponse to shifting conditions of the laser and optical train. Spectra in zero air wereobtained approximately every 8 h before and after refilling the liquid nitrogen Dewarsof the detectors. Assuming that the background spectra change gradually over the 8 h,we obtained 9th order polynomial curve fitting parameters to the background (zero air)spectrum on either end of the ambient air measurement interval. We then interpolate25
the polynomial coefficients between times of the zero air scans to calculate the ex-pected baseline during the intervening measurements. However, we came to suspectthat some baseline changes were further caused by room temperature changes, be-cause the temperature changes may lead to subtle changes in the actual laser mount
9847

ACPD10, 9839–9893, 2010
Observations ofelevated
formaldehyde
W. Choi et al.
Title Page
Abstract Introduction
Conclusions References
Tables Figures
J I
J I
Back Close
Full Screen / Esc
Printer-friendly Version
Interactive Discussion
temperature (despite being controlled to a fixed set point.) In actuality, we found thatat some times, the interpolated baseline with time did not reflect the baseline changesin ambient spectra with time, and in such cases, a temperature correction (linear inter-polation of fitting curve coefficients with cell temperature) was more effective than theusual time-based correction. HCHO spectra of the ambient air were collected every5
10 s during the campaign, and averaged for 5 min. Then, an interpolated backgroundspectrum, as described above, was subtracted from the 5 min average spectrum ofthe ambient air. The area of the background-removed spectrum was finally calculatedto get the integrated absorbance of ambient HCHO. An example of a typical averagedbaseline and ambient spectrum is shown in Fig. 2.10
Aside from zero-air backgrounds, we further obtained at least one HCHO calibrationpoint from the permeation system every 8 h. The average sensitivity of the spectrom-eter, defined as the integrated absorbance per unit ppb of HCHO was 2.3×10⁻⁴ ppb−1
(1σ=7.1×10⁻⁵ ppb−1). We examined the sensitivity variation over the entire experimentby considering all possible variables that might influence instrument performance (such15
as cell temperature and pressure, laser mount temperature, sample flow rate, and time)in a multivariate regression analysis. Reproduced sensitivities from the regressionanalyses agreed well with the observed sensitivities (R2=0.92, N=49), and hence ob-served ambient HCHO absorbance data were calibrated by the derived time-dependentsensitivity function taking into account all the operating parameters recorded. Fluctu-20
ations in observed sensitivity and the time-dependent sensitivity function during themeasurement period are shown in Fig. 3. The estimated standard error of sensitivityis ∼14%. Based on errors from permeation rate, linearity between absorbance andconcentrations, precision tests, and variability in sensitivity we estimate the uncertaintyin the technique to be no more than 20% of the signal.25
2.2.3 Other measurements used in this study
During the 2007 BEARPEX field intensive, many key species involved in forest pho-tochemistry were simultaneously measured, affording a superb opportunity to investi-
9848

ACPD10, 9839–9893, 2010
Observations ofelevated
formaldehyde
W. Choi et al.
Title Page
Abstract Introduction
Conclusions References
Tables Figures
J I
J I
Back Close
Full Screen / Esc
Printer-friendly Version
Interactive Discussion
gate the HCHO chemistry in this coniferous forest. The team measurements used inthis analysis include HOx (=OH+HO2), biogenic VOC’s, O3, NO2, peroxyacetyl nitrate(PAN), and meteorological data such as temperature, wind speed/direction, H2O, andPAR (photosynthetically active radiation, which is measured throughout the solar spec-tral range of 400 to 700 nm). The measured atmospheric species, methods, measuring5
height, and research investigators who provided the data are shown in Table 1.
3 Results and data analysis
HCHO was measured from 16 September to 4 October of 2007 (Julian days 259–277). During that period the prevailing winds exhibited a strong diurnal cycle, follow-ing a typical cross-valley wind system as discussed in detail by Dillon et al. (2002).10
During the daytime, west-south-westerly anabatic winds predominate with speeds of2.85±0.75 m/s. Reciprocally, the nighttime katabatic winds usually come from the east-northeast direction at lower speeds of 1.1±0.7 m/s. The 30-min averaged timeseries ofHCHO, temperature, PAR, representative BVOCs (total monoterpenes, MBO, isoprene,methacrolein), and HOx are shown in Fig. 4.15
Observed HCHO concentrations ranged up to the maximum of 20.5 ppb aroundnoontime and showed a consistent decrease at night with a mean overnight low of0.8 ppb (1σ of 0.9 ppb) just before sunrise (Fig. 5a). Based on the timeseries ofHCHO, we split our analysis into two different periods: high HCHO (doy 259∼261and 264, hereinafter referred to as the High phase) and lower HCHO (doy 262∼26320
and 265∼277, hereinafter Low phase) when it was relatively wet with a few intermit-tent rainfall events. Interestingly, the diurnal profiles of HCHO show distinct patterns inHigh and Low phases (Fig. 5). During the High phase, HCHO concentrations started in-creasing sharply immediately after sunrise and attained a midday peak with a smaller,secondary peak in the evening around 20:00. However, during the Low phase, al-25
though the rise in the HCHO concentration after sunrise was observed, the middaypeak was significantly suppressed and gives way to a continued build-up throughout
9849

ACPD10, 9839–9893, 2010
Observations ofelevated
formaldehyde
W. Choi et al.
Title Page
Abstract Introduction
Conclusions References
Tables Figures
J I
J I
Back Close
Full Screen / Esc
Printer-friendly Version
Interactive Discussion
the day until early evening. In fact, an evening peak of just under 10 ppb occurred near20:00 in both periods. The decrease in midday HCHO concentrations in the Low phaseis likely related to suppressed photochemistry and BVOC emissions during those days.Therefore, our discussion about the HCHO budget will proceed based on two differentperiods: the High and Low phases. Nevertheless, in both phases, a consistent de-5
crease in overnight HCHO was observed until dawn most likely due to dry depositionwithin a shallow nocturnal boundary layer.
Figure 6 shows the mean diurnal profiles of meteorological data during the High andLow phases. The most pronounced differences between the two periods are observedin air temperature, particularly in the morning and early afternoon (08:00∼13:00), and10
also in insolation (actually measured PAR), whose midday peak is lower by 15–20% inthe Low phase. On the other hand, no observable difference in wind speed or directionwas found, save for perhaps a slight increase in predawn katabatic winds during theLow phase. In spite of significant changes in the mean diurnal patterns of temperaturebetween the two phases, temperature does not seem to be the dominant control on15
HCHO levels because relatively lower HCHO was observed during the higher temper-atures for doy 268∼270 and later doy 275–276 (Fig. 4). The mean diurnal patternsof O3, another secondary photochemical product, showed a marked difference fromthose of HCHO during the High period. The ozone builds gradually throughout the dayreaching a peak in the late afternoon around 16:00 with no evening peak near 20:00 as20
HCHO shows, implying that HCHO and O3 have different sources and sinks in this re-gion (Fig. 7e). However, the HCHO diurnal profile during the Low period has a similarbuild-up throughout the day as O3 in both periods, indicating that the local concen-trations of both species are predominantly controlled by advection of the Sacramentoplume. This same steady daytime rise is seen in other species known to advect into25
the region such as NOx, benzene, and isoprene (Figs. 7, 8c and 8f; Day et al., 2009),although O3 tends to peak earlier than the rest at 16:00. Averaged diurnal patternsof HOx support daytime enhanced HCHO during the High period. Daytime HO2 dur-ing the High phase is 2–4 times as large as the Low phase, whereas OH shows no
9850

ACPD10, 9839–9893, 2010
Observations ofelevated
formaldehyde
W. Choi et al.
Title Page
Abstract Introduction
Conclusions References
Tables Figures
J I
J I
Back Close
Full Screen / Esc
Printer-friendly Version
Interactive Discussion
remarkable difference between two phases (Fig. 7g and h). Considering that HCHOis a major source of HO2, enhanced HO2 during the High period is likely linked to theabundant daytime HCHO.
NO abundance regulates HOx cycling, thereby affecting secondary photochemi-cal products such as O3 and HCHO. For example, HCHO yields, in many cases,5
strongly depend on the abundance of NO in the surroundings. Unfortunately, NO wasnot directly measured during BEARPEX 2007. Therefore, [NO] was estimated froma HO2-RO2-NO-NO2-O3 photostationary state relationship assuming [HO2]≈[RO2]in this study. The resultant expression for [NO]ss is shown in Eq. (2), where
kO3−NO=1.8×10⁻¹² ·e−1370/T (Tuazon and Atkinson, 1990), kRO2−NO=2.7×10⁻¹² ·e360/T10
(Atkinson, 1997), kHO2−NO=3.6×10⁻¹² ·e270/T (Atkinson et al., 1999). [NO2], [HO2] and[O3] were obtained from the measurements at Blodgett Forest. jNO2 was estimatedfrom the TUV model v.4.5 (2008) and scaled by observed PAR (Appendix A).
[NO]ss =jNO2
[NO2]
kO3−NO[O3]+kRO2−NO[RO2]+kHO2−NO[HO2](2)
Due to a lack of overlapping NO2 data with the HCHO measurements, NOx wasaveraged for the period from Julian day 245–279 (outside the HCHO observation pe-15
riod) to obtain a diurnal average. As shown in Fig. 8a, photostationary NO increasessharply immediately after sunrise due to an increase in [NO2] (presumably from fumi-gation of the residual layer) and actinic radiation at the surface. It then remains nearlyconstant around 120 ppt until 14:00 and then gradually falls off due to the diminutionof solar radiation, although the total NOx continues to build throughout the afternoon20
due to advection of the Sacramento plume (Fig. 8b). Nighttime [NO]ss was not ableto be estimated from the photostationary state assumption, and hence assumed to be10 ppt (Day et al., 2009; Dillon et al., 2002). Although [RO2], assumed equal to theobserved [HO2], influences the steady state [NO]ss estimation, the sensitivity of [NO]ss
9851

ACPD10, 9839–9893, 2010
Observations ofelevated
formaldehyde
W. Choi et al.
Title Page
Abstract Introduction
Conclusions References
Tables Figures
J I
J I
Back Close
Full Screen / Esc
Printer-friendly Version
Interactive Discussion
to a change in assumed [RO2] is not very large: merely a 10% difference in [NO]ss fora doubling of [RO2] (=2×[HO2]).
3.1 Observed formaldehyde sinks and inferred dry deposition
Our initial goal is to first broadly characterize the processes responsible for the ob-served diurnal patterns in HCHO. In this section, we discuss HCHO sinks from obser-5
vations. Photolysis is a major daytime sink of HCHO that ultimately produces nearly anequivalent of hydroperoxy (HO2) radicals via subsequent Reactions (R1∼R3). Underconditions with relatively high concentrations of HCHO and low UV fluxes (near sealevel and at high solar zenith angles), HCHO is one of the most important sources ofhydroperoxy radicals in the atmosphere.10
HCHO+hν λ<330 nm−−−−−−−→ H+HCO · (45%) (R1a)λ<330 nm−−−−−−−→ H2+CO(55%) (R1b)
H ·+O2 −→ HO2· (R2)
HCO ·+O2 −→ HO2 ·+CO (R3)
The overall HCHO loss rate by photolysis can be obtained from measured HCHOconcentrations and its photolysis rate constants, j1a and j1b, which were parameterizedby the observed PAR using the TUV model, similar to the estimate of jNO2
(Appendix A).15
Direct reaction with hydroxyl radicals (k4=8.6×10⁻¹² ·e20/T ; Atkinson et al., 1999)is another major HCHO removal processes in the atmosphere, producing HO2 (Reac-tions R4 and R3). Generally speaking, diurnal average OH concentrations at BlodgettForest rapidly increase immediately after sunrise, peaking near 11:00 with a maximumof 0.27 ppt (5.9×10⁶ molecules cm−3), and decreasing thereafter but not dropping be-20
low 0.05 ppt, which is equivalent to 1.2×10⁶ molecules cm−3, even throughout the night.
9852

ACPD10, 9839–9893, 2010
Observations ofelevated
formaldehyde
W. Choi et al.
Title Page
Abstract Introduction
Conclusions References
Tables Figures
J I
J I
Back Close
Full Screen / Esc
Printer-friendly Version
Interactive Discussion
The mean concentration of nighttime OH for 22:00∼06:00 is 0.084±0.03 (1σ) ppt, or1.9×106 molecules cm−3 (Fig. 7g). Such elevated nocturnal OH has been observedbefore in forested environments with small local NO emissions (Faloona et al., 2001),and has been proposed to be the result of the ozonolysis of reactive BVOCs. Consid-ering this relatively high and consistent [OH], the nighttime HCHO loss rate due to OH5
was significant, accounting for about 20% of total HCHO sinks (0.21±0.07 ppb h−1) atnight.
HCHO+OH· −→H2O+HCO· (R4)
Dry deposition is typically the most important nocturnal removal process controllingHCHO variation when, compared with daytime, oxidative production is less important10
and OH is a less effective sink (Sumner et al., 2001). Observed nighttime HCHOshowed a consistent decline in both the High and Low periods, implying that HCHOlosses predominate and remain steady overnight mainly due to dry deposition, aslong as advection is not a significant contributor. While, in reality, our estimation ofnocturnal OH-initiated HCHO production from known BVOCs is non-negligible (mean15
0.20±0.06 ppb h−1 during 22:00∼04:00), resulting from both the elevated nighttime OHand the temperature-dependent emissions of BVOCs such as monoterpenes (Bouvier-Brown et al., 2009a), the magnitude of production is largely balanced by loss to OH(∼0.21 ppb h−1) in the budget equation. Thus the assumption that dry deposition isthe primary sink of HCHO during night remains effectively valid. Because the noctur-20
nal boundary layer depth is critical to estimating the nighttime dry deposition velocity,a comparative method with nighttime ozone decay rates is used to circumvent theunobserved nocturnal boundary layer depth as in previous studies (Shepson et al.,1992; Sumner et al., 2001). Assuming that nocturnal production and loss from OHcancel, we calculate a first-order loss from the averaged logarithmic [HCHO] decay25
during the middle of the night (01:00∼04:00) to be −0.27 h−1. Scaling the nighttimeozone dry deposition velocity observed for the same season by Kurpius et al. (2002),0.05 cm s−1, to the measured O3 decay of −0.016 h−1 yields a HCHO dry deposition
9853

ACPD10, 9839–9893, 2010
Observations ofelevated
formaldehyde
W. Choi et al.
Title Page
Abstract Introduction
Conclusions References
Tables Figures
J I
J I
Back Close
Full Screen / Esc
Printer-friendly Version
Interactive Discussion
rate of 0.84 cm s−1. This nighttime rate is similar to those from Sumner et al. (2001)and Krinke and Wahner (1999), 0.65 cm s−1 and 0.75 cm s−1, respectively, and impliesa nocturnal boundary layer mixing depth at Blodgett Forest of about 110 m. We use avalue of 1.5 cm s−1, as in Sumner et al. (2001) and Krinke and Wahner (1999), for thedaytime dry deposition velocity in our time-dependent HCHO model described below.5
By our estimation the role of HO2 and NO3 in HCHO removal at Blodgett is negligible(Appendix B). The overall loss rates of HCHO, calculated from the observed OH, pho-tolysis frequencies scaled to observed PAR, and dry deposition as discussed aboveare shown in Figure 9 for the High and Low phases. In general, a maximum at 10:30is influenced both by the maximum OH concentrations near 10:00 and by the peak10
photolysis rate constant at 11:00 PST, accounting for 38% and 47% of total loss rate(10:00∼14:00), respectively, in both the High and Low periods. The difference in overalllosses between the two periods is less than 20%, implying that the dramatic differenceof daytime HCHO levels between the two periods is determined by the sources.
3.2 Known HCHO production from VOC observations15
HCHO is secondarily produced in the atmosphere through the oxidation of variousVOCs by oxidants such as OH, O3, and NO3. Therefore, with the known HCHO yieldsof those oxidation processes and the concentrations of the parent VOC’s and oxidants,the chemical production rate can be estimated as shown in Eq. (3), where i denotes aspecies of oxidant such as OH or O3, j denotes a species of VOC that produces HCHO20
through its oxidation, and ki j and γi j represent the reaction rate coefficients and HCHOyields for the reaction between oxidant i and VOCj , respectively.
Pki j =∑i
∑j
(γi jki j [VOC]j [Oxidant]i
)(3)
9854

ACPD10, 9839–9893, 2010
Observations ofelevated
formaldehyde
W. Choi et al.
Title Page
Abstract Introduction
Conclusions References
Tables Figures
J I
J I
Back Close
Full Screen / Esc
Printer-friendly Version
Interactive Discussion
3.2.1 OH-initiated HCHO production
Among the numerous BVOCs known to yield HCHO upon reaction with OH,17 representative hydrocarbons observed by GC/MS during BEARPEX, includingmonoterpenes (α- and β-pinene, myrcene, limonene, 3-carene, terpinolene, α- andγ-terpinene), isoprene, 2-methyl-3-buten-2-ol (MBO), methyl vinyl ketone (MVK),5
methacrolein (MACR), methanol, longifolene, methyl chavicol, ethene, and propene,were used in calculating HCHO production rates. Although the HCHO yield from iso-prene oxidation is relatively well understood (Appendix C1), the NOx dependence ofHCHO yields is not well established for most other biogenic VOCs, and hence, thefixed yields derived from chamber experiments in the presence of NO reported in the10
literature were used in this study (Atkinson and Arey, 2003; Griffin et al., 1999; Hoff-mann et al., 1997; Lee et al., 2006a, b; Sumner et al., 2001; Tuazon and Atkinson,1990; Paulot et al., 2009a) as summarized in Table 2.
The mean diurnal patterns of overall OH-initiated HCHO production from knownBVOC sources show significant differences between the High and Low periods15
(Fig. 10). During the High period, HCHO production rates display a strong diurnal cyclewith the first maximum in the early morning and the second peak in the early afternoon,whereas no remarkable diurnal patterns are evident in the Low period. The daytimemagnitude in HCHO production is reduced from 0.87 ppb h−1 in the High to 0.35 ppb −1
in the Low period. The sudden surge of HCHO production in the early morning of the20
High period is the result of the drastic rise in both OH and BVOCs (Bouvier-Brownet al., 2009a). Although OH tends to steadily decrease after its peak around 10:30,the increase or persistence of the BVOC concentrations maintains a similar HCHOproduction through the late afternoon. The detailed atmospheric behavior of BVOCsat Blodgett Forest, depending on the types of emission and mixed layer height, are25
described in detail by Bouvier-Brown et al. (2009a). Enhanced OH concentrations atnight combined with nocturnal emissions of terpenes and CH3OH lead to considerableHCHO production (∼0.21 ppb h−1 in both periods) at night, which is about 25% and
9855

ACPD10, 9839–9893, 2010
Observations ofelevated
formaldehyde
W. Choi et al.
Title Page
Abstract Introduction
Conclusions References
Tables Figures
J I
J I
Back Close
Full Screen / Esc
Printer-friendly Version
Interactive Discussion
64% of the daytime production rate from the known BVOCs+OH reactions in the Highand Low period, respectively. During the daytime (10:00∼16:00) when OH-initiatedHCHO production is most active, the main contributions are made by monoterpenes(15%, 28%), MBO (20%, 11%), isoprene (27%, 12%), and methanol (20%, 29%), to-gether accounting for over 80% of the total known OH-initiated production (High, Low5
phases.)
3.2.2 Ozone-initiated HCHO production
Thirteen BVOCs, including monoterpenes (α- and β-pinene, myrcene, 3-carene, ter-pinolene, α-terpinene, limonene), MBO, isoprene, linalool, ethene, propene, andmethyl chavicol, are included in the estimate of ozonolytic production. The HCHO10
yields from the ozonolysis of BVOCs and their reaction rate constants used in thisestimate are described in Table 3. The mean diurnal variation of the overall HCHOproduction due to ozonolysis shows a maximum around 18:00 due to the [O3] peak inconjunction with BVOC diurnal variations. The main known contributors to HCHO pro-duction when ozonolysis is most active (16:00∼20:00) were monoterpenes, isoprene,15
and MBO, accounting for 50/56%, 26/20%, and 14/12% of the total O3-initiated pro-duction from known BVOCs during the High/Low period, respectively.
The HCHO production rate resulting from the 13 observed BVOCs+O3 reactions isan order of magnitude smaller than the contributions of known OH-initiated oxidationprocesses. Assuming a HCHO yield of 20%, five sesquiterpenes (α-bergamotene, α-20
farnesene, β-farnesene, and 2 unidentified) measured during BEARPEX lead to a 40%increase in the total HCHO production from daytime BVOC ozonolysis, still an inisig-nificant source, but the measurement was made above the canopy at 9.5 m. It shouldbe noted that Bouvier-Brown et al. (2009a) found strong intra-canopy concentrationgradients of sesquiterpenes due to their high reactiviety (τO3
∼4 min), therefore using25
sesquiterpene concentrations measured above canopy may lead to significant under-estimation of intra-canopy HCHO production. In addition, very reactive species likeβ-caryophyllene, which reacts with O3 100∼10 000 times faster than those BVOCs
9856

ACPD10, 9839–9893, 2010
Observations ofelevated
formaldehyde
W. Choi et al.
Title Page
Abstract Introduction
Conclusions References
Tables Figures
J I
J I
Back Close
Full Screen / Esc
Printer-friendly Version
Interactive Discussion
observed (τO3∼1 min with [O3]=55 ppb; Atkinson and Arey, 2003) and has a high
HCHO yield of 0.76 (Atkinson and Arey, 2003; Lee et al., 2006a), were not mea-sured during BEARPEX due to their extremely high reactivity. However, consideringthat β-caryophyllene is a compound known to be emitted in significant quantities frommanzanita branches and that manzanita accounts for 29% of total leaf area at Blodgett5
Forest as of 2003 (Bouvier-Brown et al., 2009b), β-caryophyllene cannot be ruled outas a HCHO precursor to some degree at least in Blodgett Forest. Consequently, thepossibility remains that such unrecognized species may exist in the enviroment andcould contribute significantly to the overall HCHO production. In fact, a recent branchenclosure study of BVOC emissions from Blodgett forest (Bouvier-Brown et al., 2009b)10
indicates that there are considerable sesquiterpene emissions at the site which aremostly oxidized before they can be observed in ambient air. Further discussion of thepossible effects of sesquiterpenes follows below.
3.2.3 Peroxy radicals as HCHO precursors
Globally, methylperoxy radicals (CH3O2), which are produced from the oxidation of15
CH4 and peroxyacetyl (PA) radicals, are an important precursor of HCHO (Fried et al.,1997; Sumner et al., 2001; Tuazon and Atkinson, 1990; Lee et al., 1998). The HCHOproduction mechansim via CH4 oxidation is described in detail by Fried et al. (1997).The lifetime of CH4 at 298 K with 6×10⁶ molecule cm−3 OH is ∼10 months (Atkin-son et al., 2006), and hence it is assumed that CH4 is homogeneously distributed20
throughout the boundary layer at a concentration of 1.774 ppm (IPCC, 2007). Peroxy-acetyl (PA, CH3C(O)O2) radicals are produced from OH-initiated oxidation of CH3CHOand MVK (Tuazon and Atkinson, 1990), thermal decomposition of PAN, methylglyoxal(CH3C(O)C(O)H, MeGly) photolysis (Atkinson et al., 1999), and other minor sources(LaFranchi et al., 2009). PA radicals are rapidly destroyed by reactions with NO, HO2,25
and RO2 with a lifetime of ∼10s under BEARPEX conditions (LaFranchi et al., 2009).Therefore, the steady-state concentration of PA radicals, [PA]ss, can be estimated byEq. (C3) as outlined in Appendix C. PA removal reactions produce CH3CO2 (Moise
9857

ACPD10, 9839–9893, 2010
Observations ofelevated
formaldehyde
W. Choi et al.
Title Page
Abstract Introduction
Conclusions References
Tables Figures
J I
J I
Back Close
Full Screen / Esc
Printer-friendly Version
Interactive Discussion
et al., 1999; Tyndall et al., 2001; Hasson et al., 2004; Jenkin et al., 2007), which,upon decomposition and reaction with O2 forms CH3O2 (Reactions R10–R12 in Ap-pendix C). We assume that CH3O2 is rapidly converted into HCHO. The HCHO pro-duction from CH3O2 showed a strong diurnal patterns with a daytime peak both in theHigh and Low period due to diurnal distributions of [PA], [OH], temperature, and light5
intensity (Eq. C4). The mean production rates in the High and Low period are 0.40 and0.16 ppb h−1 during the daytime, respectively, which are comparable in magnitude tothe OH-initiated production (Fig. 11).
4 Estimated HCHO constrained by observed production and loss rates
To evaluate in-situ chemical processes based on known HCHO production and loss10
mechanisms, HCHO concentrations were calculated from an integration of the budgetequation as shown in Eq. (4). PHCHO is the total production rate from observed BVOCs(17 BVOCs from OH-initiated oxidation, 13 BVOCs from Ozonolysis, and CH3O2 rad-ical from PA radical and CH4 oxidation.) LHCHO is the sum of the 1st order photoly-sis loss rate from the TUV model scaled to the PAR observations, reaction with ob-15
served OH, and estimated dry deposition, and A represents advection by the meanwind. The calculation was performed every 30 min from 10:00 initialized with the ob-served [HCHO]09:30 to avoid large, unconstrained effects of entrainment during therapid growth phase of the morning boundary layer (e.g., fumigation), and thereafter thepreceding result was used as [HCHO]t−1 for the next step’s calculation.20
[HCHO]t = [HCHO]t−1+∫ t
t−1
(PHCHO+A−LHCHO · [HCHO]t−1
)dt (4)
Advection is one of the most vexing uncertainties in most atmospheric chemistrystudies, especially when moderately reactive secondary products are concerned likeHCHO or other OVOCs. The oak forests located approximately 30 km upwind from the
9858

ACPD10, 9839–9893, 2010
Observations ofelevated
formaldehyde
W. Choi et al.
Title Page
Abstract Introduction
Conclusions References
Tables Figures
J I
J I
Back Close
Full Screen / Esc
Printer-friendly Version
Interactive Discussion
observation site are hearty emitters of isoprene, and are expected to affect the HCHObudget at Blodgett Forest. Therefore, advection from sources upwind (most notably theoak forests of the foothills) may be much more important than local photochemistry. Toset the upper limit of the advection, we first focus on the mean diurnal pattern of theobserved HCHO for the Low phase, which appears similar to other species whose5
levels at Blodgett are controlled by advection, such as ozone, NOx, and isoprene asdiscussed earlier (Figs. 7 and 8). If we assume the discrepancies between modelledand observed [HCHO] are solely the result of advection, ignoring additional sources ofHCHO in the Low period, an upper-limit to the background advection rate can be esti-mated. Figure 12b shows the daytime rise of observed [HCHO] corresponds fairly well10
with the model results using A=1.2 ppb h−1. The advection rate may also be indepen-dently estimated by the horizontal gradient of HCHO from model results and satellitedata, and the mean wind. Photochemical modelling of California’s central valley per-formed for the summer daytime conditions of 2000 by Steiner et al. (2007) indicatesthe potential for formaldehyde gradients to exist in the transect from Sacramento to15
Blodgett. The largest gradients observed in the vicinity of Blodgett forest (see theirFig. 3), irrespective of exact orientation, appears to be about 0.04 ppb/km. Similarestimates of the regional gradients can be made using satellite data from the OzoneMonitoring Instrument as shown in Millet et al. (2008). Assuming that ∼80% of theHCHO column resides in the ABL in regions with strong surface sources (Martin et20
al., 2004), broad summertime horizontal gradients can be seen that range from 0.015–0.04 ppb/km. While the daytime surface winds average below 3 m/s, mixed layer windsabove Blodgett Forest are known to be somewhat higher – from 3 to 5 m/s (Faloona,unpublished data). A very liberal estimate of daytime HCHO advection rates, then,can be made ranging from 0.2–0.7 ppb h−1. We used 0.7–1.2 ppb h−1 as the largest25
conceivable advection term for the time dependent [HCHO] calculation in Eq. (4).The principal terms of the HCHO budget are summarized as a diurnal mean pat-
tern in Fig. 12, which clearly shows the losses (linearly dependent on the observedHCHO) outpacing the known sources steadily throughout the day (10:00∼16:00) par-
9859
ACPD10, 9839–9893, 2010
Observations ofelevated
formaldehyde
W. Choi et al.
Title Page
Abstract Introduction
Conclusions References
Tables Figures
J I
J I
Back Close
Full Screen / Esc
Printer-friendly Version
Interactive Discussion
ticularly for the High period. Modelled concentrations of HCHO, [HCHO]model, showedsignificant discrepancies with observed levels, [HCHO]obs, implying that there are largesources not considered in the analysis of the measured VOCs, especially during theHigh phase. [HCHO]model decreases dramatically in the beginning of the calculationdue to loss rates in great excess over observed production terms, reaching an equi-5
librium after ∼3 h, consistent with the HCHO lifetime. The modelled concentrationonly starts to rise significantly after ∼15:00 when the loss terms are fading and the(constant) advection begins to outpace them. Although the large advection estimateis clearly not enough to fully explain the overabundance observed at the site duringmidday, it does capture the feature of gradual late afternoon build-up in [HCHO]obs.10
Further investigation of other trace gases that originate upwind can provide in-sight into the importance of HCHO advection. Isoprene oxidation products, MVK andmethacrolein, are expected to peak in the midday if the local isoprene emission is im-portant because their concentrations strongly depend on the OH level and isopreneemission, which depends on leaf temperature and photon flux density incident on the15
leaf (Monson and Fall, 1989). However, isoprene and methacrolein at Blodgett build upcontinuously to the early evening in both High and Low phases (Fig. 7c and d), imply-ing that the late afternoon increase is caused by advection from the upwind oak forestsof the foothills. Anthropogenic VOCs, such as benzene and toluene, which are trans-ported from upwind urban areas show a similar late afternoon or early evening peak20
around 18:00∼20:00 (Fig. 7f). Ozone also displays this characteristic rise throughoutthe day as photochemical precursors (anthropogenic VOCs and NOx as well as bio-genic isoprene) and their products advect to the site (Fig. 7e). Taken in sum, the lateafternoon increase in [HCHO]model and in [HCHO]obs of the Low period, as well as thesecondary maximum in [HCHO]obs seen in the High period from 16:00–20:00 (Fig. 6a)25
can likely be explained in large part by advection from the upwind oak forest and/or ur-ban sources of HCHO and its precursors. However, advection is unlikely to explain theHCHO maxima reached during the peak in photochemical activity of the High period.
We note that [HCHO]obs in the High phase has a pattern similar to the chemical
9860

ACPD10, 9839–9893, 2010
Observations ofelevated
formaldehyde
W. Choi et al.
Title Page
Abstract Introduction
Conclusions References
Tables Figures
J I
J I
Back Close
Full Screen / Esc
Printer-friendly Version
Interactive Discussion
species controlled by local, fast photochemistry, such as HO2 (Fig. 7h) and OH. In ad-dition, local OH-initiated HCHO production significantly decreased in the Low phasealong with [HCHO]obs due to the decrease in concentrations both of BVOCs and OH,implying midday HCHO in the High phase was strongly influenced by local photochem-istry. According to Holzinger et al. (2005), the concentrations of oxidation products5
from VR-BVOCs emitted from the pine forest at Blodgett rapidly increase at sunrise,peak between 10:00∼15:00 and steadily decrease in the late afternoon with a smallersecondary peak around 20:00. These diurnal patterns may also imply that the oxida-tion of unidentified BVOCs play an important role in HCHO production during midday,because of their similarity to the High phase HCHO profile and the fact that the oxida-10
tion of most reactive BVOCs will produce HCHO. Kurpius and Goldstein (2003) showedthat half of the measured canopy ozone flux in the summer is believed to be due to anadditional chemical sink; namely, the reactions of VR-BVOCs with ozone, supportingthe possible existence of undetected VR-BVOCs purported by Holzinger et al. (2005)and further evinced in this HCHO study.15
5 Possible HCHO missing sources
The analysis presented so far clearly indicates that there may be other, more signifi-cant sources of HCHO during midday in the High period at Blodgett, where isopreneis not the dominant BVOC. Bouvier-Brown et al. (2009b) showed significant levels ofsesquiterpene emissions that mostly react before escaping the forest canopy from20
branch enclosure experiments, supporting this argument. In addition, Farmer and Co-hen (2008) argued that vigorous intra-canopy chemistry was evident at this site basedon estimates of vertical gradients and fluxes of ΣANs, ΣPNs, NO2 and HNO3. Wolfeet al. (2009) also supported that hypothesis based on the relatively larger downwardflux of PPN compared to those of MPAN and PAN. All of these findings support rapid25
production of oxidized VOCs, likely including HCHO, within or just above the canopy. Inwhat follows, we assume that the discrepancies between [HCHO]model and [HCHO]obs
9861

ACPD10, 9839–9893, 2010
Observations ofelevated
formaldehyde
W. Choi et al.
Title Page
Abstract Introduction
Conclusions References
Tables Figures
J I
J I
Back Close
Full Screen / Esc
Printer-friendly Version
Interactive Discussion
shown in Fig. 12a result from missing local source terms. The contribution of missingsources can be estimated by adding a new term, Pmissing to Eq. (4), and by forcing[HCHO]model to match [HCHO]obs over several hours. The average Pmissing magnitude
during daytime (10:00∼18:00) was 0.8∼1.3 ppb·h−1 in the High phase. In order to ex-plain this missing source term, we examine, in more detail, the validity of some of the5
major production terms currently in the model.As noted above, BVOC sources of HCHO from ozone or OH reactions may be under-
estimated. Bouvier-Brown et al. (2009a) reported that total sesquiterpenes measuredat 1.5 m above the forest floor showed a large discrepancy with branch enclosure mea-surements, implying that about 90% of the measured reactive compounds disappear10
through oxidation shortly after they are emitted into the sub-canopy atmosphere. Con-sidering that all monoterpene and sesquiterpene data were obtained at 9.3 m and otherBVOCs obtained at least 6.4 m above the ground, the possibility remains that ozonoly-sis of BVOCs, too reactive to be detected at those levels, could contribute significantlyto the overall HCHO. With the assumption that the discrepancies in sesquiterpene15
concentrations between branch enclosures and tower measurements are caused bya rapid chemical loss, and that HCHO is produced through the oxidation processeswith a yield of 10∼50%, analogous to the analysis of Bouvier-Brown et al. (2009a),the ozonolysis of sesquiterpenes could contribute approximately 0.2 to 0.9 ppb h−1 tothe HCHO production rate near the branches. This result is a lower limit because20
some compounds such as β-caryophyllene, which was one of the major emissionsfrom manzanita (Bouvier-Brown et al., 2009b), were not taken into account due to theirhigh reactivity (Bouvier-Brown et al., 2009a). Furthermore, their estimates were de-rived all together for both the High and Low periods of HCHO measurements and arelikely greater still during the High phase.25
Similarily, Holzinger et al. (2005) estimated that 13∼66 µmol m−2 h−1 of unknown VR-BVOCs is emitted at Blodgett Forest during the summer and rapidly oxidized within 1minute just above the canopy during daytime. Because their lifetime is short enoughto assume steady state at midday, the expected [VR-BVOCs] can be estimated using
9862

ACPD10, 9839–9893, 2010
Observations ofelevated
formaldehyde
W. Choi et al.
Title Page
Abstract Introduction
Conclusions References
Tables Figures
J I
J I
Back Close
Full Screen / Esc
Printer-friendly Version
Interactive Discussion
Eq. (5), which assumes that most VR-BVOCs are oxidized within a canopy scale, andthus their flux aloft is negligible (this does not appear unrealistic considering their veryshort lifetime and the vertical distributions of their oxidation products; Holzinger et al.,2005).
[VR−BVOCs]=Fnet
z·τVR−BVOCs (5)
Fnet is the net flux of VR-BVOCs (13∼66 µmol m−2 h−1), z is the vertical length scale5
(12 m), and τ is the chemical lifetime of VR-BVOCs. The estimated HCHO produc-tion rate with a HCHO yield of 10% from VR-BVOC oxidation within the canopy is2.1∼10.8 ppb h−1. We also note that the diurnal profile of the oxidation products ofVR-BVOCs showed a strong daytime peak, which is consistent with that of HCHO dur-ing the High phase, implying VR-BVOC oxiation may be an additional missing source10
of HCHO. LaFranchi et al. (2009) suggested high RO2/HO2 ratios (4 to 6) in the PANanalysis at Blodgett given the measured OH reactivity and photostationary state es-timates of NO. In addition, modelled OH at Blodgett was significantly lower than ob-served, whereas HO2 showed reasonable agreement (Mao, unpublished data). Suchsituations have been reported for other high VOC and low NOx conditions where high15
RO2/HO2 ratios are expected (Stevens et al., 1997; Hofzumahaus et al., 2009; Steineret al., 2008; Tan et al., 2001). We assumed RO2 ∼ HO2, thus our source of HCHO fromRO2 chemistry is potentially underestimated.
Perhaps more confounding than all of the above are recent indications that our un-derstanding of HOx cycling in low-NOx, high VOC environments is poor. In one of the20
first indications of this problem, Thornton et al. (2002) proposed that RO2+HO2 reac-tions must be an inefficient sink of HOx in order for HOx loss to match known HOxsources and to explain observationally constrained ozone production rates obtainedduring the 1999 Southern Oxidant Study in Nashville, Tennessee. In this region, whereisoprene was a dominant RO2 source, they suggested that the majority of RO2+HO2 re-25
actions resulted in HOx recycling rather than termination via: RO2+HO2→RO+OH+O29863

ACPD10, 9839–9893, 2010
Observations ofelevated
formaldehyde
W. Choi et al.
Title Page
Abstract Introduction
Conclusions References
Tables Figures
J I
J I
Back Close
Full Screen / Esc
Printer-friendly Version
Interactive Discussion
or rapid photolysis of ROOH, the major product of RO2+HO2 reactions. Similar con-clusions were reached by Lelieveld et al. (2008) in explaining the descrepancies be-tween models and aircraft measurements made over tropical forests. The increasedflux through alkoxy radicals implied by these suggestions could provide another HCHOsource not contained in our model.5
Moreover, a recent HOx study downwind of the urban region of the Pearl River Deltain China (Hofzumahaus et al., 2009) suggested the need for additional recycling of RO2to OH that does not alter the HO2 and O3 levels. As the most simple case, Hofzuma-haus et al. (2009) suggested the existence of a new reactant or suite of reactants, X,that react with both RO2 and HO2 at a similar rate, like NO, but without net production10
of ozone. If such reactions, regardless of the number of reactants, produce HCHO as asecondary product as the RO2+NO reactions do, then enhanced RO2/HO2 ratios mightalso contribute to the requisite missing sources of HCHO at Blodgett without drasticallymodifying the observed O3 and NO.
Consequently, we conclude from the above discussion that the elevated levels of15
HCHO observed during the High phase of the experiment are consistent with the hy-pothesis of Holzinger et al. (2005) and the sesquiterpene emission measurements ofBouvier-Brown et al. (2009a, b); namely, that highly reactive VOCs emitted from thepine forest at Blodgett are being rapidly oxidized before escaping the canopy. How-ever, a detailed mechanistic description and identification of the VOC and oxidants (O320
and/or OH) responsible for the anomalously high HCHO remains elusive. Clearly eddycovariance flux measurements of HCHO above this or similar forests would provide akey test of our extention of the Holzinger hypothesis. Underlying this large, local photo-chemical HCHO source, is a more modest advective component from the Sacramentoplume and forests of the foothills that appears more dominant in the Low phase.25
9864

ACPD10, 9839–9893, 2010
Observations ofelevated
formaldehyde
W. Choi et al.
Title Page
Abstract Introduction
Conclusions References
Tables Figures
J I
J I
Back Close
Full Screen / Esc
Printer-friendly Version
Interactive Discussion
Appendix A
Estimate of photolysis rate constants
All photolysis rate constants used in this study were estimated from the TUV modelv4.5 (NACR, 2008). During the BEARPEX 2007 intensive observational period, the5
TUV model yields strong relationships between PAR and jNO2, j1a, j1b, and j9 (in Ap-
pendix C), which are based on a least-squares polynomial fit, under several differentconditions (cloud optical depth (COD) 0 and aerosol optical depth (AOD) 0.235; COD0.5 and AOD 0.235; COD 0 and AOD 0.5; COD 0.5 and AOD 0.5) with R2=0.998,1.000, 0.999, and 0.999, respectively as shown in Eqs. (A1) to (A4).10
jNO2(s−1)=−3.68×10⁻¹³(PAR)3−8.15×10⁻¹¹(PAR)2+5.91×10⁻⁶(PAR)−1.03×10⁻⁵
(A1)
j1a(s−1)=−2.67×10⁻¹⁵(PAR)3+9.65×10⁻¹²(PAR)2+6.47×10⁻⁸(PAR)−1.25×10⁻⁸
(A2)
j1b(s−1)=−3.25×10⁻¹⁵(PAR)3+8.12×10⁻¹²(PAR)2+1.90×10⁻⁸(PAR)−1.37×10−815
(A3)
j9(s−1)=5.7×10⁻¹⁸(PAR)4−2.4×10⁻¹⁴(PAR)3+2.6×10⁻¹¹(PAR)2+6.0×10⁻⁸(PAR)
+8.5×10⁻⁸ (A4)
Appendix B20
HO2 and NO3 as a HCHO sink
Observed HO2 at Blodgett is big enough to make HO2+HCHO Reaction (R1 in Ap-pendix B) significant compared to OH+HCHO reaction. However, the reverse thermal
9865

ACPD10, 9839–9893, 2010
Observations ofelevated
formaldehyde
W. Choi et al.
Title Page
Abstract Introduction
Conclusions References
Tables Figures
J I
J I
Back Close
Full Screen / Esc
Printer-friendly Version
Interactive Discussion
decomposition is also very fast under the low-NOx conditions with the rate constant,
k−1=2.4×10¹² ·e(−7000/T ) (Atkinson et al., 2006). Provided that thermal decomposi-tion of HOCH2OO (0.68×10² s−1 at 15 ◦C) is much faster than other reactions of theadduct, we can assume that (Reaction R1 in Appendix B) reaches equilibrium within avery short time (∼15 ms). HOCH2OO also reacts with NO, HO2, or RO2, through which5
HCHO can be removed in the atmosphere instead of being regenerated from thermaldissociation. Therefore, at equilibrium of Reaction (R1 in Appendix B), the net HCHOloss rate can be expressed as
knet =K1[HO2] ·(kHOCH2O2
[HO2]+kHOCH2O2[RO2]+kHOCH2O2
[NO])
(B1)
Although it can be an important HCHO loss under very low temperature conditions(T ≤210 K) typical of the tropopause (Hermans et al., 2005), the net HCHO loss rate10
by HO2 estimated at Blodgett Forest is only 9.1×10⁻⁹ s−1 with K1=1.3×10⁻¹⁵ at 15 ◦C(Atkinson et al., 2006), observed HCHO and HO2, and estimated [NO]ss and [RO2],which is 4 orders of magnitude smaller than the HCHO loss by OH during daytime.Therefore, we concluded that HO2 initiated HCHO removal processes within the bound-ary layer is negligible.15
HCHO removal process due to NO3 (Reaction R2 in Appendix B) was about 450times slower than that from OH oxidation even at night when [NO3]=3 ppt was assumed(Hurst et al., 2001), and the nitrate at Blodgett is believed to be far less (R. Cohen,unpublished data). Thus, we also concluded that NO3 does not play an important rolein nighttime HCHO loss mechanisms compared to OH in Blodgett forest.20
HCHO+HO2←→ HOCH2OO (R1)
HCHO+NO3 −→ HNO3+HCO· (R2)
9866

ACPD10, 9839–9893, 2010
Observations ofelevated
formaldehyde
W. Choi et al.
Title Page
Abstract Introduction
Conclusions References
Tables Figures
J I
J I
Back Close
Full Screen / Esc
Printer-friendly Version
Interactive Discussion
Appendix C
HCHO production pathways
C1 HCHO yield from OH-initiated isoprene oxidation
The HCHO yield from isoprene oxidation is relatively well understood compared to5
other biogenic VOCs (Sumner et al., 2001; Dreyfus et al., 2002; Paulot et al., 2009a).Isoprene (Isop) is attacked by OH to form isoprene peroxy radical (Isop−O2). Isop−O2then reacts with NO to produce Isop−O radical with the yield of 95% (Reaction R5a,b in Appendix C) and subsequently to produce HCHO, MVK, and MACR (RA7a, b)with a yield of 63%, 35%, and 24%, respectively, in high-NOx conditions (Tuazon and10
Atkinson, 1990; Paulson et al., 1992; Ruppert and Becker, 2000; Paulot et al., 2009a;Miyoshi et al., 1994; Sprengnether et al., 2002; Karl et al., 2006). On the other hand,Isop−O2 also competitively reacts with RO2 to produce HCHO, MVK, and MACR witha yield of 34%, 16%, and 20%, respectively, via Isop−O (Reaction R4a in Appendix C)under NOx – free conditions (Ruppert and Becker, 2000; Miyoshi et al., 1994). Recent15
isoprene photooxidation studies proposed HCHO can be secondarily produced fromisoprene nitrates, which are products of the Isop+OH reaction under high-NOx con-ditions (Paulot et al., 2009a), and about 30% of Isop−O2+HO2 reaction yields HCHOaccompanying OH regeneration under pristine conditions (Paulot et al., 2009b). How-ever, considering a low yield of isoprene nitrates (5–7%) and assuming that the cham-20
ber experimental results already reflect HCHO yield from Isop−O2+HO2 reaction, wedo not consider these new findings in this calculation. Consequently, assuming thatthe HCHO yield from isoprene oxidation responds linearly to the relative abundanceof NO, we can define a HCHO yield of OH-initiated isoprene oxidation as Eqs. (C1)and (C2), where k2=0.9×10⁻¹¹, k3=1.6×10⁻¹¹, and k4=4.0×10⁻¹² (cm3 molec−1 s−1,25
at room temperature), and [RO2]=[HO2] is assumed in order to obtain β (Sumner et
9867

ACPD10, 9839–9893, 2010
Observations ofelevated
formaldehyde
W. Choi et al.
Title Page
Abstract Introduction
Conclusions References
Tables Figures
J I
J I
Back Close
Full Screen / Esc
Printer-friendly Version
Interactive Discussion
al., 2001; Dreyfus et al., 2002).
Isop+OHO2−−→ Isop−O2+H2O (R1)
Isop−O2+NO −→ Isop−O+NO2(95%) (R2a)
−→ Isop−ONO2(5%) (R2b)
Isop−O2+HO2 −→ Isop−OOH+O2 (R3)
Isop−O2+RO2 −→ Isop−O+RO+O2(75%) (R4a)
−→ Isop−OH+carbonyl+O2(25%) (R4b)
Isop−O+O2 −→ MVK+HCHO+HO2 (R5a)
−→ MACR+HCHO+HO2 (R5b)
−→ products+HO2 (R5c)
Depending on [NO], [RO2], and [HO2], the HCHO yield varied from 0.51 to 0.58 dur-ing the experiment. Therefore, we used the averaged value of 0.55 for the calculation5
of HCHO production rate from OH-initiated isoprene oxidation.
HCHO Yield,γ =0.63β+0.34(1−β) (C1)
β=0.95k8[NO]
k8[NO]+k9[HO2]+k10[RO2](C2)
9868

ACPD10, 9839–9893, 2010
Observations ofelevated
formaldehyde
W. Choi et al.
Title Page
Abstract Introduction
Conclusions References
Tables Figures
J I
J I
Back Close
Full Screen / Esc
Printer-friendly Version
Interactive Discussion
C2 HCHO production from CH3O2 radical
PA radical is produced from OH-initiated oxidation of CH3CHO and MVK (Tuazonand Atkinson, 1990), thermal decomposition of PAN, and photolysis of methylglyoxal(CH3C(O)C(O)H, MeGly) (Atkinson et al., 1999) as shown in Reactions (R6–R9 in Ap-pendix C). Although the MeGly+OH reaction also produces PA radical, the lifetime due5
to OH (16 h) is 10 times longer than photolysis (∼1.7 h) (Koch and Moortgat, 1998)during the day, and hence we do not consider it here. A previous study at Blodgett For-est reported that the ratio of [MeGly] to [glyoxal] is ∼3.4 during daytime (Spaulding etal., 2003). Thus, we assumed [MeGly]=3.4·[glyoxal] in this discussion, and nighttime[MeGly] was ignored due to the absence of light. The detailed production pathways10
of PA radical is thoroughly described by LaFranch et al. (2009). PA radical is decom-posed through the reactions with NO, HO2, and RO2 rapidly with a lifetime of ∼10 s(LaFranchi et al., 2009), and therefore, the concentration of PA radical, [PA]ss, at steadystate can be estimated from Eq. (C3), where k6=1.6×10⁻¹¹, k7=2.0×10⁻¹¹ (Tuazon
and Atkinson, 1990), k8=4.1×10¹⁶ ·e−13,600/T , k−8=12.1×10⁻¹² ·(T /298)−0.9 (Beine and15
Krognes, 2000), k10=6.0×10⁻¹² ·e320/T (Moise et al., 1999), k11=4.3×10⁻¹³ ·e1,040/T ,
and k12=2.0×10⁻¹² ·e500/T , for which PA-CH3O2 reaction rate was used (Tyndall et al.,2001).
CH3CHO+OH −→ PA+H2O (R6)
MVK+OH −→ 0.72 ·PA+CH2(OH)CHO (R7)
PAN←→ PA+NO2 (R8)
CH3C(O)CHO+hν −→ PA+HCO (R9)
PA+NO −→ CH3CO2+NO2 (R10)
PA+HO2 −→ products (R11)
PA+RO2 −→ RO+O2+CH3CO2 (R12)9869

ACPD10, 9839–9893, 2010
Observations ofelevated
formaldehyde
W. Choi et al.
Title Page
Abstract Introduction
Conclusions References
Tables Figures
J I
J I
Back Close
Full Screen / Esc
Printer-friendly Version
Interactive Discussion
j9 was estimated from Eq. (A4) using TUV model as described previously. Finally,CH3C(O)O formed from PA radicals rapidly reacts with O2 to produce CH3O2 radical.
[PA]ss =(k6[CH3CHO][OH]+0.72 ·k7[MVK][OH]+k8[PAN]+ j9[MeGly]
k−8[NO2]+k10[NO]+k11[HO2]+k12[RO2]
)(C3)
Once CH3O2 is formed from the oxidation of CH4 and PA radical, it further reactswith NO to produce CH3O radical and subsequently to generate HCHO. Methyl hydro-gen peroxide (MHP, CH3OOH), the product of CH3O2+HO2 reactions, also produces5
HCHO in all pathways (Fried et al., 1997). The CH3O2-CH3O2 self-reaction, moreover,generates HCHO as its final product in all pathways (Takezaki et al., 1956). Therefore,we assumed that once CH3O2 is generated, it rapidly produces HCHO with a yieldof 100%. Consequently, the HCHO production rate from CH3O2 can be estimated byEq. (C4).10
PCH3O2=kCH4−OH[CH4][OH]+ (k10[NO]+k12[RO2]+0.4 ·k11[HO2]) · [PA]ss (C4)
Recent studies proposed that a new channel of PA+HO2 reaction can be importantwith a branching ratio of 0.4 (Hasson et al., 2004; Jenkin et al., 2007), through whichCH3O2 is produced, and therefore this new finding can be a potential HCHO source.We added the new HCHO producing channel of PA+HO2 reaction in HCHO productioncalculation (Eq. C4). However, the inclusion of the new PA+HO2 reaction channel in15
PCH3O2resulted in just a 5% increase in the total PCH3O2
, due to relatively small impactof HO2 compared to NO at Blodgett.
Acknowledgements. The lead author would like to thank the Kearney Foundation of Soil Sci-ence, the NASA-UCSC University Affiliated Research Center (Grant #NAS2-03144), and theAtmospheric Aerosols & Health Lead Campus program of the Toxic Substances Research &20
Teaching Program for support. The deployment was also supported by a NSF small grant for ex-ploratory research (grant # 0741375). We also thank James Podolske of NASA Ames Research
9870
ACPD10, 9839–9893, 2010
Observations ofelevated
formaldehyde
W. Choi et al.
Title Page
Abstract Introduction
Conclusions References
Tables Figures
J I
J I
Back Close
Full Screen / Esc
Printer-friendly Version
Interactive Discussion
Center for loan of the formaldehyde QCL system, Sierra Pacific Industries for the use of land,Blodgett Forest Research Station staff for cooperation during BEARPEX, and J. A. de Gouwand J. B. Gilman of NOAA for sharing biogenic VOC data. G. Wolfe acknowledges support fromNASA Earth Systems Science Fellowship NNG-05GP64H. Discussions with Frank Kuetsch andJessie Charrier were helpful to the final realization of this work.5
References
Alvarado, A., Tuazon, E. C., Aschmann, S. M., Arey, J., and Atkinson, R.: Products and mecha-nisms of the gas-phase reactions of OH radicals and O-3 with 2-methyl-3-buten-2-ol, Atmos.Environ., 33, 2893–2905, 1999.
Atkinson, R.: Gas-phase tropospheric chemistry of volatile organic compounds. 1. Alkanes and10
alkenes, J. Phys. Chem. Ref. Data, 26, 215–290, 1997.Atkinson, R., Baulch, D. L., Cox, R. A., Hampson, R. F., Kerr, J. A., Rossi, M. J., and Troe,
J.: Evaluated kinetic and photochemical data for atmospheric chemistry, organic species:Supplement VII, J. Phys. Chem. Ref. Data, 28, 191–393, 1999.
Atkinson, R. and Arey, J.: Gas-phase tropospheric chemistry of biogenic volatile organic com-15
pounds: a review, Atmos. Environ., 37, S197–S219, doi:10.1016/s1352-2310(03)00391-1,2003.
Atkinson, R., Baulch, D. L., Cox, R. A., Crowley, J. N., Hampson, R. F., Hynes, R. G., Jenkin,M. E., Rossi, M. J., Troe, J., and IUPAC Subcommittee: Evaluated kinetic and photochemicaldata for atmospheric chemistry: Volume II – gas phase reactions of organic species, Atmos.20
Chem. Phys., 6, 3625–4055, 2006,http://www.atmos-chem-phys.net/6/3625/2006/.
Beine, H. J. and Krognes, T.: The seasonal cycle of peroxyacetyl nitrate (PAN) in the EuropeanArctic, Atmos. Environ., 34, 933–940, 2000.
Bouvier-Brown, N. C., Goldstein, A. H., Gilman, J. B., Kuster, W. C., and de Gouw, J. A.: In-25
situ ambient quantification of monoterpenes, sesquiterpenes, and related oxygenated com-pounds during BEARPEX 2007: implications for gas- and particle-phase chemistry, Atmos.Chem. Phys., 9, 5505–5518, 2009a,http://www.atmos-chem-phys.net/9/5505/2009/.
Bouvier-Brown, N. C., Holzinger, R., Palitzsch, K., and Goldstein, A. H.: Large emissions of30
9871

ACPD10, 9839–9893, 2010
Observations ofelevated
formaldehyde
W. Choi et al.
Title Page
Abstract Introduction
Conclusions References
Tables Figures
J I
J I
Back Close
Full Screen / Esc
Printer-friendly Version
Interactive Discussion
sesquiterpenes and methyl chavicol quantified from branch enclosure measurements, At-mos. Environ., 43, 389–401, doi:10.1016/j.atmosenv.2008.08.039, 2009b.
Bowman, F. M., Pilinis, C., and Seinfeld, J. H.: OZone and aerosol productivity of reactiveorganics, Atmos. Environ., 29, 579–589, 1995.
Day, D. A., Farmer, D. K., Goldstein, A. H., Wooldridge, P. J., Minejima, C., and Cohen, R.5
C.: Observations of NOx,∑
PNs,∑
ANs, and HNO3 at a Rural Site in the California SierraNevada Mountains: summertime diurnal cycles, Atmos. Chem. Phys., 9, 4879–4896, 2009,http://www.atmos-chem-phys.net/9/4879/2009/.
Dillon, M. B., Lamanna, M. S., Schade, G. W., Goldstein, A. H., and Cohen, R. C.: Chemicalevolution of the Sacramento urban plume: Transport and oxidation, J. Geophys. Res. Atmos.,10
107, 4045, doi:10.1029/2001jd000969, 2002.Dreyfus, G. B., Schade, G. W., and Goldstein, A. H.: Observational constraints on the contri-
bution of isoprene oxidation to ozone production on the western slope of the Sierra Nevada,California, J. Geophys. Res. Atmos., 107, 4365, doi:10.1029/2001jd001490, 2002.
Facchini, M. C., Fuzzi, S., Lind, J. A., Fierlingeroberlinninger, H., Kalina, M., Puxbaum, H.,15
Winiwarter, W., Arends, B. G., Wobrock, W., Jaeschke, W., Berner, A., and Kruisz, C.:Phase-partitioning and chemical-reactions of low-molecular-weight organic-compounds infog, Tellus Ser. B-Chemical and Physical Meteorology, 44, 533–544, 1992.
Faloona, I., Tan, D., Brune, W., Hurst, J., Barket, D., Couch, T. L., Shepson, P., Apel, E.,Riemer, D., Thornberry, T., Carroll, M. A., Sillman, S., Keeler, G. J., Sagady, J., Hooper, D.,20
and Paterson, K.: Nighttime observations of anomalously high levels of hydroxyl radicalsabove a deciduous forest canopy, J. Geophys. Res. Atmos., 106, 24315–24333, 2001.
Fantechi, G., Jensen, N. R., Hjorth, J., and Peeters, J.: Mechanistic studies of the atmosphericoxidation of methyl butenol by OH radicals, ozone and NO3 radicals, Atmos. Environ., 32,3547-3556, 1998.25
Farmer, D. K. and Cohen, R. C.: Observations of HNO3, Sigma AN, Sigma PN and NO2 fluxes:evidence for rapid HOx chemistry within a pine forest canopy, Atmos. Chem. Phys., 8, 3899–3917, 2008,http://www.atmos-chem-phys.net/8/3899/2008/.
Ferronato, C., Orlando, J. J., and Tyndall, G. S.: Rate and mechanism of the reactions of OH30
and Cl with 2-methyl-3-buten-2-ol, J. Geophys. Res., 103(D19), 25579–25586, 1998Fried, A., McKeen, S., Sewell, S., Harder, J., Henry, B., Goldan, P., Kuster, W., Williams, E.,
Baumann, K., Shetter, R., and Cantrell, C.: Photochemistry of formaldehyde during the 1993
9872
ACPD10, 9839–9893, 2010
Observations ofelevated
formaldehyde
W. Choi et al.
Title Page
Abstract Introduction
Conclusions References
Tables Figures
J I
J I
Back Close
Full Screen / Esc
Printer-friendly Version
Interactive Discussion
Tropospheric OH Photochemistry Experiment, J. Geophys. Res. Atmos., 102, 6283–6296,1997.
Goldstein, A. H., Hultman, N. E., Fracheboud, J. M., Bauer, M. R., Panek, J. A., Xu, M., Qi, Y.,Guenther, A. B., and Baugh, W.: Effects of climate variability on the carbon dioxide, water,and sensible heat fluxes above a ponderosa pine plantation in the Sierra Nevada (CA), Agric.5
For. Meteorol., 101, 113–129, 2000.Gratien, A., Picquet-Varrault, B., Orphal, J., Perraudin, E., Doussin, J. F., and Flaud, J. M.: Lab-
oratory intercomparison of the formaldehyde absorption cross sections in the infrared (1660–1820 cm(−1)) and ultraviolet (300–360 nm) spectral regions, J. Geophys. Res. Atmos., 112,D05305 doi:10.1029/2006jd007201, 2007.10
Griffin, R. J., Cocker, D. R., and Seinfeld, J. H.: Incremental aerosol reactivity: Application toaromatic and biogenic hydrocarbons, Environ. Sci. Technol., 33, 2403–2408, 1999.
Grosjean, D.: Formaldehyde and other carbonyls in Los Angeles ambient air, Environ. Sci.Technol., 16, 254–262, 1982.
Grosjean, D., Miguel, A. H., and Tavares, T. M.: Urban air-pollution in Brazil – acetaldehyde15
and other carbonyls, Atmos. Environ., 24, 101–106, 1990.Grosjean, D., Williams, E. L., and Grosjean, E.: Atmospheric chemistry of isoprene and of its
carbonyl products, Environ. Sci. Technol., 27, 830–840, 1993.Grosjean, D. and Grosjean, E.: Carbonyl products of the ozone-unsaturated alcohol reaction,
J. Geophys. Res., 100(D11), 22815–22820, 1995.20
Hasson, A. S., Tyndall, G. S., and Orlando, J. J.: A product yield study of the reaction ofHO2 radicals with ethyl peroxy (C2H5O2), acetyl peroxy (CH3C(O)O−2 ), and acetonyl per-oxy (CH3C(O)CH2O2) radicals, J. Phys. Chem. A, 108, 5979–5989, doi:10.1021/jp048873t,2004.
Hauglustaine, D. A. and Ehhalt, D. H.: A three-dimensional model of molecular hydrogen in the25
troposphere, J. Geophys. Res. Atmos., 107, 4330 doi:10.1029/2001jd001156, 2002.Hermans, I., Muller, J. F., Nguyen, T. L., Jacobs, P. A., and Peeters, J.: Kinetics of
alpha-hydroxy-alkylperoxyl radicals in oxidation processes. HO2 center dot-initiated oxi-dation of ketones/aldehydes near the tropopause, J. Phys. Chem. A, 109, 4303–4311,doi:10.1021/jp044080v, 2005.30
Hobbs, P. C. D.: Ultrasensitive laser measurements without tears, Appl. Opt., 36, 903–920,1997.
Hoffmann, T., Odum, J. R., Bowman, F., Collins, D., Klockow, D., Flagan, R. C., and Seinfeld,
9873

ACPD10, 9839–9893, 2010
Observations ofelevated
formaldehyde
W. Choi et al.
Title Page
Abstract Introduction
Conclusions References
Tables Figures
J I
J I
Back Close
Full Screen / Esc
Printer-friendly Version
Interactive Discussion
J. H.: Formation of organic aerosols from the oxidation of biogenic hydrocarbons, J. Atmos.Chem., 26, 189–222, 1997.
Hofzumahaus, A., Rohrer, F., Lu, K. D., Bohn, B., Brauers, T., Chang, C. C., Fuchs, H., Hol-land, F., Kita, K., Kondo, Y., Li, X., Lou, S. R., Shao, M., Zeng, L. M., Wahner, A., andZhang, Y. H.: Amplified Trace Gas Removal in the Troposphere, Science, 324, 1702–1704,5
doi:10.1126/science.1164566, 2009.Holzinger, R., Lee, A., Paw, K. T., and Goldstein, U. A. H.: Observations of oxidation products
above a forest imply biogenic emissions of very reactive compounds, Atmos. Chem. Phys.,5, 67–75, 2005,http://www.atmos-chem-phys.net/5/67/2005/.10
Hurst, J. M., Barket, D. J., Herrera-Gomez, O., Couch, T. L., Shepson, P. B., Faloona, I., Tan,D., Brune, W., Westberg, H., Lamb, B., Biesenthal, T., Young, V., Goldstein, A., Munger, J.W., Thornberry, T., and Carroll, M. A.: Investigation of the nighttime decay of isoprene, J.Geophys. Res. Atmos., 106, 24335–24346, 2001.
IPCC: Climate Change 2007: The Physical Science Basis, Intergovernmental Panel on Climate15
Change, Chapter 2, 140, 2007.Jenkin, M. E., Hurley, M. D., and Wallington, T. J.: Investigation of the radical product channel of
the CH3C(O)O−2+HO2 reaction in the gas phase, Phys. Chem. Chem. Phys., 9, 3149–3162,doi:10.1039/b702757e, 2007.
Kamat, P. C., Roller, C. B., Namjou, K., Jeffers, J. D., Faramarzalian, A., Salas, R., and McCann,20
P. J.: Measurement of acetaldehyde in exhaled breath using a laser absorption spectrometer,Appl. Opt., 46(19), 3969–3975, 2007.
Karl, M., Dorn, H.-P., Holland, F., Koppmann, R., Poppe, D., Rupp, L., Schaub, A., and Wahner,A.: Product study of the reaction of OH radicals with isoprene in the atmosphere simulationchamber SAPHIR, J. Atmos. Chem., 55, 167–187, 2006.25
Kegley-Owen, C. S., Tyndall, G. S., Orlando, J. J., and Fried, A.: Tunable diode laser studies ofthe reaction of Cl atoms with CH3CHO, Int. J. Chem. Kinet., 31, 766–775, 1999.
Koch, G. and Moortgat, G. K.: Photochemistry of methylglyoxal in the vapor phase, J. Phys.Chem. A, 102, 9142–9153, 1998.
Krinke, S. M. and Wahner, A.: Formaldehyde and ozone deposition velocities determined above30
a deciduous forest during summer, Eos Trans AGU, 80(46), Fall Meet. Suppl., F158, 1999.Kurpius, M. R. and Goldstein, A. H.: Gas-phase chemistry dominates O−3 loss to a forest,
implying a source of aerosols and hydroxyl radicals to the atmosphere, Geophys. Res. Lett.,
9874

ACPD10, 9839–9893, 2010
Observations ofelevated
formaldehyde
W. Choi et al.
Title Page
Abstract Introduction
Conclusions References
Tables Figures
J I
J I
Back Close
Full Screen / Esc
Printer-friendly Version
Interactive Discussion
30, 1371, doi:10.1029/2002gl016785, 2003.LaFranchi, B. W., Wolfe, G. M., Thornton, J. A., Harrold, S. A., Browne, E. C., Min, K. E.,
Wooldridge, P. J., Gilman, J. B., Kuster, W. C., Goldan, P. D., de Gouw, J. A., McKay, M.,Goldstein, A. H., Ren, X., Mao, J., and Cohen, R. C.: Closing the peroxy acetyl nitrate budget:observations of acyl peroxy nitrates (PAN, PPN, and MPAN) during BEARPEX 2007, Atmos.5
Chem. Phys., 9, 7623–7641, 2009,http://www.atmos-chem-phys.net/9/7623/2009/.
Largiuni, O., Giacomelli, M. C., and Piccardi, G.: Concentration of peroxides and formaldehydein air and rain and gas-rain partitioning, J. Atmos. Chem., 41, 1–20, 2002.
Lee, A., Goldstein, A. H., Keywood, M. D., Gao, S., Varutbangkul, V., Bahreini, R., Ng, N.10
L., Flagan, R. C., and Seinfeld, J. H.: Gas-phase products and secondary aerosol yieldsfrom the ozonolysis of ten different terpenes, J. Geophys. Res. Atmos., 111, D07302,doi:10.1029/2005jd006437, 2006a.
Lee, A., Goldstein, A. H., Kroll, J. H., Ng, N. L., Varutbangkul, V., Flagan, R. C., and Seinfeld, J.H.: Gas-phase products and secondary aerosol yields from the photooxidation of 16 different15
terpenes, J. Geophys. Res. Atmos., 111, D17305, doi:10.1029/2006jd007050, 2006b.Lee, Y. N., Zhou, X., Kleinman, L. I., Nunnermacker, L. J., Springston, S. R., Daum, P. H.,
Newman, L., Keigley, W. G., Holdren, M. W., Spicer, C. W., Young, V., Fu, B., Parrish, D.D., Holloway, J., Williams, J., Roberts, J. M., Ryerson, T. B., and Fehsenfeld, F. C.: Atmo-spheric chemistry and distribution of formaldehyde and several multioxygenated carbonyl20
compounds during the 1995 Nashville Middle Tennessee Ozone Study, J. Geophys. Res.Atmos., 103, 22449–22462, 1998.
Lelieveld, J., Butler, T. M., Crowley, J. N., Dillon, T. J., Fischer, H., Ganzeveld, L., Harder,H., Lawrence, M. G., Martinez, M., Taraborrelli, D., and Williams, J.: Atmospheric oxidationcapacity sustained by a tropical forest, Nature, 452, 737–740, doi:10.1038/nature06870,25
2008.Macdonald, A. M., Makar, P. A., Anlauf, K. G., Hayden, K. L., Bottenheim, J. W., Wang, D., and
Dann, T.: Summertime formaldehyde at a high-elevation site in Quebec, J. Geophys. Res.Atmos., 106, 32361–32374, 2001.
Macoas, E. M. S., Lundell, J., Pettersson, M., Khriachtchev, L., Fausto, R., and Rasanen, M.:30
Vibrational spectroscopy of cis- and trans-formic acid in solid argon, J. Mol. Spectrosc., 219,70–80, doi:10.1016/s0022-2852(03)00018-3, 2003.
Martin, R. V., Parrish, D. D., Ryerson, T. B., Nicks, D. K., Chance, K., Kurosu, T. P., Jacob, D.
9875

ACPD10, 9839–9893, 2010
Observations ofelevated
formaldehyde
W. Choi et al.
Title Page
Abstract Introduction
Conclusions References
Tables Figures
J I
J I
Back Close
Full Screen / Esc
Printer-friendly Version
Interactive Discussion
J., Sturges, E. D., Fried, A., and Wert, B. P.: Evaluation of GOME satellite measurements oftropospheric NO2 and HCHO using regional data from aircraft campaigns in the southeasternUnited States, J. Geophys. Res. Atmos., 109, D24307, doi:10.1029/2004jd004869, 2004.
Millet, D. B., Jacob, D. J., Boersma, K. F., Fu, T. M., Kurosu, T. P., Chance, K., Heald, C. L., andGuenther, A.: Spatial distribution of isoprene emissions from North America derived from5
formaldehyde column measurements by the OMI satellite sensor, J. Geophys. Res. Atmos.,113, D02307 doi:10.1029/2007jd008950, 2008.
Misson, L., Tang, J. W., Xu, M., McKay, M., and Goldstein, A.: Influences of recovery fromclear-cut, climate variability, and thinning on the carbon balance of a young ponderosa pineplantation, Agric. For. Meteorol., 130, 207–222, doi:10.1016/j.agrformet.2005.04.001, 2005.10
Miyoshi, A., Hatakeyama, S., and Washida, N.: On radical-initiated photooxidation of isoprene– an estimate of global co production, J. Geophys. Res. Atmos., 99, 18779–18787, 1994.
Moise, T., Denzer, W., and Rudich, Y.: Direct kinetics study of the reaction of peroxyacetylradical with NO between 218 and 370 K, J. Phys. Chem. A, 103, 6766–6771, 1999.
Monson, R. K. and Fall, R.: Isoprene emission from aspen leaves – influence of environment15
and relation to photosynthesis and photorespiration, J. Plant Physiol., 90, 267–274, 1989.Muller, K., Pelzing, M., Gnauk, T., Kappe, A., Teichmann, U., Spindler, G., Haferkorn, S., Jahn,
Y., and Herrmann, H.: Monoterpene emissions and carbonyl compound air concentrationsduring the blooming period of rape (Brassica napus), Chemosphere, 49, 1247–1256, 2002.
Munger, J. W., Jacob, D. J., and Hoffmann, M. R.: The occurrence of bisulfite-aldehyde addition-20
products in fogwater and cloudwater, J. Atmos. Chem., 1, 335–350, 1984.Murphy, J. G., Day, D. A., Cleary, P. A., Wooldridge, P. J., Millet, D. B., Goldstein, A. H., and Co-
hen, R. C.: The weekend effect within and downwind of Sacramento – Part 1: Observationsof ozone, nitrogen oxides, and VOC reactivity, Atmos. Chem. Phys., 7, 5327–5339, 2007,http://www.atmos-chem-phys.net/7/5327/2007/.25
National Center for Atmospheric Research (NCAR): TUV Raidation Model v4.5, online: http://cprm.acd.ucar.edu/Models/TUV/, 2008.
Paulot, F., Crounse, J. D., Kjaergaard, H. G., Kroll, J. H., Seinfeld, J. H., and Wennberg, P.O.: Isoprene photooxidation: new insights into the production of acids and organic nitrates,Atmos. Chem. Phys., 9, 1479–1501, 2009a,30
http://www.atmos-chem-phys.net/9/1479/2009/.Paulot, F., Crounse, J. D., Kjaergaard, H. G., Kurten, A., Clair, J. M., Seinfeld, J. H., and
Wennberg, P. O.: Unexpected epoxide formation in the gas-phase photooxidation of iso-
9876

ACPD10, 9839–9893, 2010
Observations ofelevated
formaldehyde
W. Choi et al.
Title Page
Abstract Introduction
Conclusions References
Tables Figures
J I
J I
Back Close
Full Screen / Esc
Printer-friendly Version
Interactive Discussion
prene, Science, 325, 730–733, 2009b.Paulson, S. E., Flagan, R. C., and Seinfeld, J. H.: Atmospheric photooxidation of iso-
prene. 2. the ozone-isoprene reaction, Int. J. Chem. Kinet., 24, 103–125, 1992.Perrin, A., Keller, F., and Flaud, J. M.: New analysis of the nu(2), nu(3), nu(4), and nu(6) bands
of formaldehyde, (H2CO)-C-12-O-16 line positions and intensities in the 5–10 µm spectral5
region, J. Mol. Spectrosc., 221, 192–198, doi:10.1016/s0022-2852(03)00207-8, 2003.Possanzini, M., Dipalo, V., Petricca, M., Fratarcangeli, R., and Brocco, D.: Measurements of
lower carbonyls in Rome ambient air, Atmos. Environ., 30, 3757–3764, 1996.Ruppert, L. and Becker, K. H.: A product study of the OH radical-initiated oxidation of isoprene:
formation of C-5-unsaturated diols, Atmos. Environ., 34, 1529–1542, 2000.10
Seinfeld, J. H. and Pandis, S. N.: Atmospheric Chemistry and Physics: From Air Pollution toClimate Change, John Willey & Sons, Inc, 1998.
Shepson, P. B., Bottenheim, J. W., Hastie, D. R., and Venkatram, A.: Determination of therelative ozone and pan deposition velocities at night, Geophys. Res. Lett., 19, 1121–1124,1992.15
Spaulding, R. S., Schade, G. W., Goldstein, A. H., and Charles, M. J.: Characterization ofsecondary atmospheric photooxidation products: Evidence for biogenic and anthropogenicsources, J. Geophys. Res. Atmos., 108, 4247 doi:10.1029/2002jd002478, 2003.
Sprengnether, M., Demerjian, K. L., Donahue, N. M., and Anerson, J. G.: Product analysis ofthe OH oxidation of isoprene and 1,3-butadiene in the presence of NO, J. Geophys. Res.,20
107, 4269, doi:10.1029/2001JD000716, 2002.Steiner, A. L., Tonse, S., Cohen, R. C., Goldstein, A. H., and Harley, R. A.: Biogenic 2-methyl-
3-buten-2-ol increases regional ozone and HOx sources, Geophys. Res. Lett., 34, L15806,doi:10.1029/2007gl030802, 2007.
Stevens, P. S., Mather, J. H., Brune, W. H., Eisele, F., Tanner, D., Jefferson, A., Cantrell, C.,25
Shetter, R., Sewall, S., Fried, A., Henry, B., Williams, E., Baumann, K., Goldan, P., andKuster, W.: HO2/OH and RO(2)/HO2 ratios during the Tropospheric OH Photochemistry Ex-periment: Measurement and theory, J. Geophys. Res. Atmos., 102, 6379–6391, 1997.
Suh, H. H., Bahadori, T., Vallarino, J., and Spengler, J. D.: Criteria air pollutants and toxic airpollutants, Environ. Health Perspect., 108, 625–633, 2000.30
Sumner, A. L., Shepson, P. B., Couch, T. L., Thornberry, T., Carroll, M. A., Sillman, S., Pippin,M., Bertman, S., Tan, D., Faloona, I., Brune, W., Young, V., Cooper, O., Moody, J., andStockwell, W.: A study of formaldehyde chemistry above a forest canopy, J. Geophys. Res.
9877

ACPD10, 9839–9893, 2010
Observations ofelevated
formaldehyde
W. Choi et al.
Title Page
Abstract Introduction
Conclusions References
Tables Figures
J I
J I
Back Close
Full Screen / Esc
Printer-friendly Version
Interactive Discussion
Atmos., 106, 24387–24405, 2001.Takezaki, Y., Miyazaki, T., and Nakahara, N.: Photolysis of dimethyl peroxide, J. Chem. Phys.,
25, 536–542, 1956.Tan, D., Faloona, I., Simpas, J. B., Brune, W., Shepson, P. B., Couch, T. L., Sumner, A. L.,
Carroll, M. A., Thornberry, T., Apel, E., Riemer, D., and Stockwell, W.: HOx budgets in a5
deciduous forest: Results from the PROPHET summer 1998 campaign, J. Geophys. Res.Atmos., 106, 24407–24427, 2001.
Thornton, J. A., Wooldridge, P. J., Cohen, R. C., Martinez, M., Harder, H., Brune, W. H.,Williams, E. J., Roberts, J. M., Fehsenfeld, F. C., Hall, S. R., Shetter, R. E., Wert, B.P., and Fried, A.: Ozone production rates as a function of NOx abundances and HOx10
production rates in the Nashville urban plume, J. Geophys. Res. Atmos., 107, 4146,doi:10.1029/2001jd000932, 2002.
Tuazon, E. C. and Atkinson, R.: A product study of the gas-phase reaction of isoprene with theoh radical in the presence of NOx, Int. J. Chem. Kinet., 22, 1221–1236, 1990.
Tyndall, G. S., Cox, R. A., Granier, C., Lesclaux, R., Moortgat, G. K., Pilling, M. J., Ravis-15
hankara, A. R., and Wallington, T. J.: Atmospheric chemistry of small organic peroxy radicals,J. Geophys. Res. Atmos., 106, 12157–12182, 2001.
Wolfe, G. M., Thornton, J. A., Yatavelli, R. L. N., McKay, M., Goldstein, A. H., LaFranchi, B.,Min, K.-E., and Cohen, R. C.: Eddy covariance fluxes of acyl peroxy nitrates (PAN, PPN andMPAN) above a Ponderosa pine forest, Atmos. Chem. Phys., 9, 615–634, 2009,20
http://www.atmos-chem-phys.net/9/615/2009/.
9878
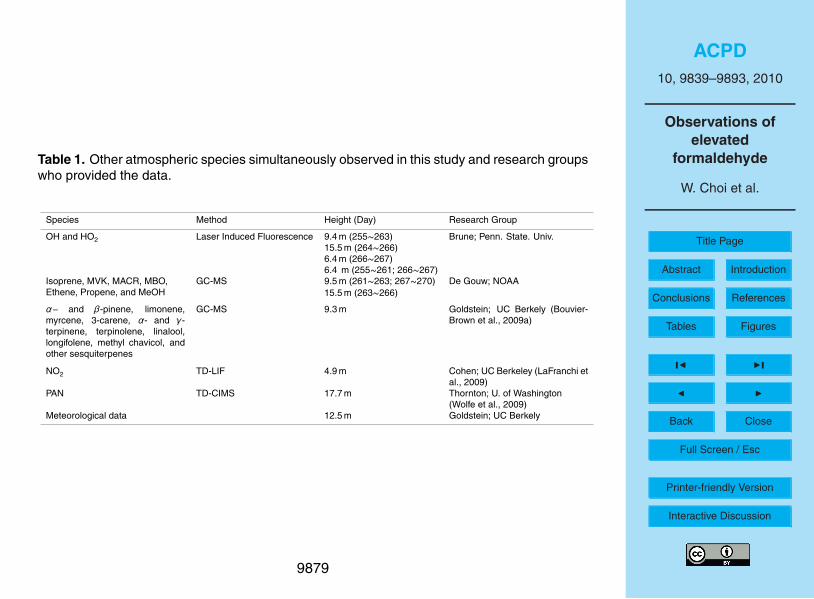
ACPD10, 9839–9893, 2010
Observations ofelevated
formaldehyde
W. Choi et al.
Title Page
Abstract Introduction
Conclusions References
Tables Figures
J I
J I
Back Close
Full Screen / Esc
Printer-friendly Version
Interactive Discussion
Table 1. Other atmospheric species simultaneously observed in this study and research groupswho provided the data.
Species Method Height (Day) Research Group
OH and HO2 Laser Induced Fluorescence 9.4 m (255∼263) Brune; Penn. State. Univ.15.5 m (264∼266)6.4 m (266∼267)6.4 m (255∼261; 266∼267)
Isoprene, MVK, MACR, MBO,Ethene, Propene, and MeOH
GC-MS 9.5 m (261∼263; 267∼270) De Gouw; NOAA15.5 m (263∼266)
α− and β-pinene, limonene,myrcene, 3-carene, α- and γ-terpinene, terpinolene, linalool,longifolene, methyl chavicol, andother sesquiterpenes
GC-MS 9.3 m Goldstein; UC Berkely (Bouvier-Brown et al., 2009a)
NO2 TD-LIF 4.9 m Cohen; UC Berkeley (LaFranchi etal., 2009)
PAN TD-CIMS 17.7 m Thornton; U. of Washington(Wolfe et al., 2009)
Meteorological data 12.5 m Goldstein; UC Berkely
9879

ACPD10, 9839–9893, 2010
Observations ofelevated
formaldehyde
W. Choi et al.
Title Page
Abstract Introduction
Conclusions References
Tables Figures
J I
J I
Back Close
Full Screen / Esc
Printer-friendly Version
Interactive Discussion
Table 2. Reaction rate constants k for reaction of biogenic VOC’s with OH and HCHO yields.
k (cm3 molecule−1 s−1)d at 298 K HCHO yielde Reference
Isoprene 1.10×10⁻¹⁰ 0.55a See text Seinfeld and Pandis (1998)d; Steiner et al. (2007)d; estimatee
MBO 6.26×10⁻¹¹ (at 300 K) 0.32b Steiner et al. (2007)d; Alvarado et al. (1999)e; Ferronato et al. (1998)e
MVK 1.88×10⁻¹¹ 0.28c Tuazon and Atkinson (1990)d, e; Paulot et al. (2009a)e
MACR 3.35×10⁻¹¹ 0.61 Tuazon and Atkinson (1990)d, e; Paulot et al. (2009a)e
α−pinene 5.34×10⁻¹¹ 0.19 Atkinson and Arey (2003)d, e; Lee et al. (2006b)d,e
β−pinene 7.89×10⁻¹¹ 0.51 Atkinson and Arey (2003)d, e; Lee et al. (2006b)d, e
Myrcene 2.14×10⁻¹⁰ 0.52 Atkinson and Arey (2003)d, e; Lee et al. (2006b)d, e
Methanol 3.60×10⁻¹² ·e(−415/T ) 1.0 Atkinson et al. (1999)d, e
Methyl chavicol 5.40×10⁻¹¹ 0.52 Bouvier-Brown et al. (2009a)d; Lee et al. (2006b)e
Limonene 1.71×10⁻¹⁰ 0.47 Atkinson and Arey (2003)d; Lee et al. (2006b)b; Sumner et al. (2001)e
3-carene 8.68×10⁻¹¹ 0.28 Atkinson and Arey (2003)d, e; Lee et al. (2006b)d, e
Terpinolene 2.25×10⁻¹⁰ 0.26 Atkinson and Arey (2003)d, e; Lee et al. (2006b)d, e
α−terpinene 3.62×10⁻¹⁰ 0.078 Atkinson and Arey (2003)d, e; Lee et al. (2006b)d, e
γ−terpinene 1.77×10⁻¹⁰ 0.17 Atkinson and Arey (2003)d, e; Lee et al. (2006b)d, e
Longifolene 4.79×10⁻¹¹ 0.25 Atkinson and Arey (2003)e; Lee et al. (2006b)e
Ethene 9.0×10⁻¹² 1.8 Sumner et al. (2001)Propene 3.0×10⁻¹¹ 1.0 Atkinson et al. (1999)d; Sumner et al. (2001)e
a Yield does not include the yield from its oxidation products such as MVK and MACR. b Averaged HCHO yield 0.29from Alvarado et al. (1999) and 0.35 from Ferronato et al. (1998). Fantech et al. (1998) reported 0.09 as HCHOyield, but we did not include this value above due to huge discrepancy with others. c Total HCHO yield for MVK is0.58 (Tuazon and Atkinson, 1990); however we deal with HCHO yield directly from the oxidation of MVK by OH here,because we also consider MVK effect on HCHO production from PA raidcal. d Reference for reaction constants.e Reference for HCHO yields.
9880

ACPD10, 9839–9893, 2010
Observations ofelevated
formaldehyde
W. Choi et al.
Title Page
Abstract Introduction
Conclusions References
Tables Figures
J I
J I
Back Close
Full Screen / Esc
Printer-friendly Version
Interactive Discussion
Table 3. Reaction rate constants k and HCHO yield for ozonolysis of VOC’s that are at leastpartially biogenic.
k (cm3 molecule−1 s−1)b at 298 K HCHO yieldc Reference
MBO 9.30×10⁻¹⁸ 0.47a Steiner et al. (2007)b; Fantechi et al. (1998)c;Alvarado et al. (1999)c; Grosjean and Grosjean (1995)c
Isoprene 1.28×10⁻¹⁷ 0.9 Seinfeld and Pandis (1998)b; Grosjean et al. .(1993)c
α−pinene 8.4×10⁻¹⁷ 0.25 Atkinson and Arey (2003)b, c; Lee et al. (2006a)c
β−pinene 1.5×10⁻¹⁷ 0.65 Atkinson and Arey (2003)b, c; Lee et al. (2006a)c
Myrcene 4.76×10⁻¹⁶ 0.51 Atkinson and Arey (2003)b, c; Lee et al. (2006a)c
3-carene 3.61×10⁻¹⁷ 0.25 Atkinson and Arey (2003)b, c; Lee et al. (2006a)c
Terpinolene 1.83×10⁻¹⁵ 0.29 Atkinson and Arey (2003)b, c; Lee et al. (2006a)c
Linalool 4.33×10⁻¹⁶ 0.35 Atkinson and Arey (2003)b, c; Lee et al. (2006a)c
α−terpinene 2.38×10⁻¹⁴ 0.04 Atkinson and Arey (2003)b, c; Lee et al. (2006a)c
Limonene 1.98×10⁻¹⁶ 0.15 Atkinson and Arey (2003)b, c
Methy chavicol 1.2×10⁻¹⁷ 0.61 Bouvier-Brown et al. (2009a)b; Lee et al. (2006a)c
α−humulene 1.19×10⁻¹⁴ 0.035 Atkinson and Arey (2003)b; Lee et al. (2006a)c
β−caryophyllene 1.19×10⁻¹⁴ 0.76 Atkinson and Arey (2003)b; Lee et al. (2006a)c
Ethene 1.6×10⁻¹⁸ 1.03 Atkinson et al. (1999)b; Sumner et al. (2001)c
Propene 1.0×10⁻¹⁷ 0.78 Atkinson et al. (1999)b; Sumner et al. (2001)c
a Averaged HCHO yield (0.48, 0.57 with OH scavangers from Fantechi et al., 1999, 0.29 from Alvarado et al., 1999,and 0.36 from Grosjean and Grosjean, 1995). b Reference for reaction constants. c Reference for HCHO yields.
9881

ACPD10, 9839–9893, 2010
Observations ofelevated
formaldehyde
W. Choi et al.
Title Page
Abstract Introduction
Conclusions References
Tables Figures
J I
J I
Back Close
Full Screen / Esc
Printer-friendly Version
Interactive Discussion
Fig. 1. Peak absorption strength of HCHO as a function of wavenumber (cm−1) used to de-termine the target for ambient HCHO detection. Left y-axis is ν2 absorption cross section(×10−18 cm2 molecule−1; gray line) measured by Gratien et al. (2007) and the right y-axis isan arbitrary absorbance (open circle and dashed line) obtained from the experiments with thequantum cascade laser (QCL) spectrometer. Undiluted HCHO of about 18.1 ppm from a per-meation system was used in the multipass cell at 60 mbar.
9882

ACPD10, 9839–9893, 2010
Observations ofelevated
formaldehyde
W. Choi et al.
Title Page
Abstract Introduction
Conclusions References
Tables Figures
J I
J I
Back Close
Full Screen / Esc
Printer-friendly Version
Interactive Discussion
Fig. 2. Example of ambient 10 s absorption spectra (gray lines) and 5 min averaged spectrum(blue line) for 30 samples. Zero air spectrum (magenta line) is interpolated from the two zeroair spectra obtained before and after the measurement interval.
9883

ACPD10, 9839–9893, 2010
Observations ofelevated
formaldehyde
W. Choi et al.
Title Page
Abstract Introduction
Conclusions References
Tables Figures
J I
J I
Back Close
Full Screen / Esc
Printer-friendly Version
Interactive Discussion
Fig. 3. Observed HCHO sensitivity variation (black circles) and the derived time-dependentsensitivity function (a combination of three Gaussian fitting curves; gray line) throughout themeasurement period. Y-axis is the integrated absorbance of HCHO per unit ppb.
9884

ACPD10, 9839–9893, 2010
Observations ofelevated
formaldehyde
W. Choi et al.
Title Page
Abstract Introduction
Conclusions References
Tables Figures
J I
J I
Back Close
Full Screen / Esc
Printer-friendly Version
Interactive DiscussionFig. 4. Timeseries of (a) HCHO, (b) temperature and PAR, (c) total monoterpenes and MBO, (d) isoprene andmethacrolein, and (e) HOx during days 258∼277 of BEARPEX 2007. All data points are 30 min average.
9885

ACPD10, 9839–9893, 2010
Observations ofelevated
formaldehyde
W. Choi et al.
Title Page
Abstract Introduction
Conclusions References
Tables Figures
J I
J I
Back Close
Full Screen / Esc
Printer-friendly Version
Interactive Discussion
Fig. 5. Box plots of the average diurnal HCHO concentration patterns observed during BEAER-PEX 2007. The upper plot is for the High phase (days 259∼261 and 264) and the bottom plot isthe Low phase (262∼263 and 265∼277) during which there were occasional rain and snowfallevents. 50% of observed data is distributed within each 30 min box and vertical bars denotemaximum and minimum. Black circles and blue horizontal bars represent mean and median,respectively. Average daytime (10:00∼16:00) [HCHO]=7.3±0.8 ppb for the entire measurementperiod.
9886

ACPD10, 9839–9893, 2010
Observations ofelevated
formaldehyde
W. Choi et al.
Title Page
Abstract Introduction
Conclusions References
Tables Figures
J I
J I
Back Close
Full Screen / Esc
Printer-friendly Version
Interactive Discussion
Fig. 6. Mean diurnal profiles of (a) temperature (K), (b) PAR (µmol m−2 s−1), (c) wind speed(m s−1), and (d) wind direction (0◦ to North) during HCHO High (dark squares; 259∼261 and264) and Low phases (gray circles; 262∼263 and 265∼277) of BEARPEX 2007.
9887

ACPD10, 9839–9893, 2010
Observations ofelevated
formaldehyde
W. Choi et al.
Title Page
Abstract Introduction
Conclusions References
Tables Figures
J I
J I
Back Close
Full Screen / Esc
Printer-friendly Version
Interactive DiscussionFig. 7. Mean diurnal profiles of (a) [MBO (ppb)], (b) [β-pinene (ppb)], (c) [isoprene (ppb)], (d) [MACR (ppb)], (e) [O3
(ppb)], (f) [benzene (ppb)], (g) [OH (molecule/cm3)], and (h) [HO2 (ppt)] for the High (dark squares; 259∼261 and 264)and the Low phases (gray circles; 262∼263 and 265∼277) of BEARPEX. The data is sorted into 30 min bins duringeach phase.
9888

ACPD10, 9839–9893, 2010
Observations ofelevated
formaldehyde
W. Choi et al.
Title Page
Abstract Introduction
Conclusions References
Tables Figures
J I
J I
Back Close
Full Screen / Esc
Printer-friendly Version
Interactive Discussion
Fig. 8. Mean diurnal patterns of calculated [NO] and observed [NO2]. [NO]ss was estimatedassuming NO-NO2-HO2-RO2-O3 photostationary state with [RO2]=[HO2]. [NO2] was measuredwith TD-LIF by the UC Berkeley research group.
9889

ACPD10, 9839–9893, 2010
Observations ofelevated
formaldehyde
W. Choi et al.
Title Page
Abstract Introduction
Conclusions References
Tables Figures
J I
J I
Back Close
Full Screen / Esc
Printer-friendly Version
Interactive Discussion
Fig. 9. Mean diurnal variations of HCHO loss rate (h−1) by photolysis (dark gray), reaction withOH (light gray), and dry deposition (white) in (a) HCHO High period and (b) HCHO Low periodof BEARPEX 2007.
9890

ACPD10, 9839–9893, 2010
Observations ofelevated
formaldehyde
W. Choi et al.
Title Page
Abstract Introduction
Conclusions References
Tables Figures
J I
J I
Back Close
Full Screen / Esc
Printer-friendly Version
Interactive Discussion
Fig. 10. Mean diurnal variations of HCHO production rates (ppb h−1) from the OH-initiated ox-idation of 17 measured BVOCs (total monoterpenes (includes a-pinene, b-pinene, myrcene,limonene, 3-carene, terpinolene, α-terpinene, and γ-terpinene), MBO, isoprene, methanol,MVK, MACR, methyl chavicol, longifolene, ethane, and propene) in (a) HCHO High periodand (b) HCHO Low period.
9891

ACPD10, 9839–9893, 2010
Observations ofelevated
formaldehyde
W. Choi et al.
Title Page
Abstract Introduction
Conclusions References
Tables Figures
J I
J I
Back Close
Full Screen / Esc
Printer-friendly Version
Interactive Discussion
Fig. 11. Mean diurnal HCHO production rate (ppb h−1) from CH3O2 radical, which is producedfrom PA (light gray) radical and CH4 (dark gray) during (a) the High and (b) Low HCHO period.
9892

ACPD10, 9839–9893, 2010
Observations ofelevated
formaldehyde
W. Choi et al.
Title Page
Abstract Introduction
Conclusions References
Tables Figures
J I
J I
Back Close
Full Screen / Esc
Printer-friendly Version
Interactive Discussion
Fig. 12. Total mean daytime production and loss rates (left y-axis) and the concentrations (right y-axis) of HCHO (a)for the High and (b) Low HCHO period. Bar plots denote observed production and loss rates and estimates based onobservations (P: production, L: loss, and subscripts represent reaction pathways such as oh: by OH, o3: by ozone,ch3o2: from methyl peroxy radical, photo: by photolysis, and dry: by dry deposition). White circles with dotted linedenote the observed [HCHO]obs. Thick gray and black lines show the calculated [HCHO]model using a time dependentintegration of the mean HCHO production and loss rates initialized by [HCHO]obs at 09:30 with a constant advectionrate of 0.7 and 1.2 ppb h−1, respectively.
9893