Embed Size (px)
Citation preview
Observations of Heat Flow on Hotspot Swells
Robert N. Harris, Oregon State Univ.Marcia K. McNutt, MBARI
1. Marine Heat and Fluid Flow2. Heat Flow on Hotspot Swells3. Conclusions
H
B
C
CV
R
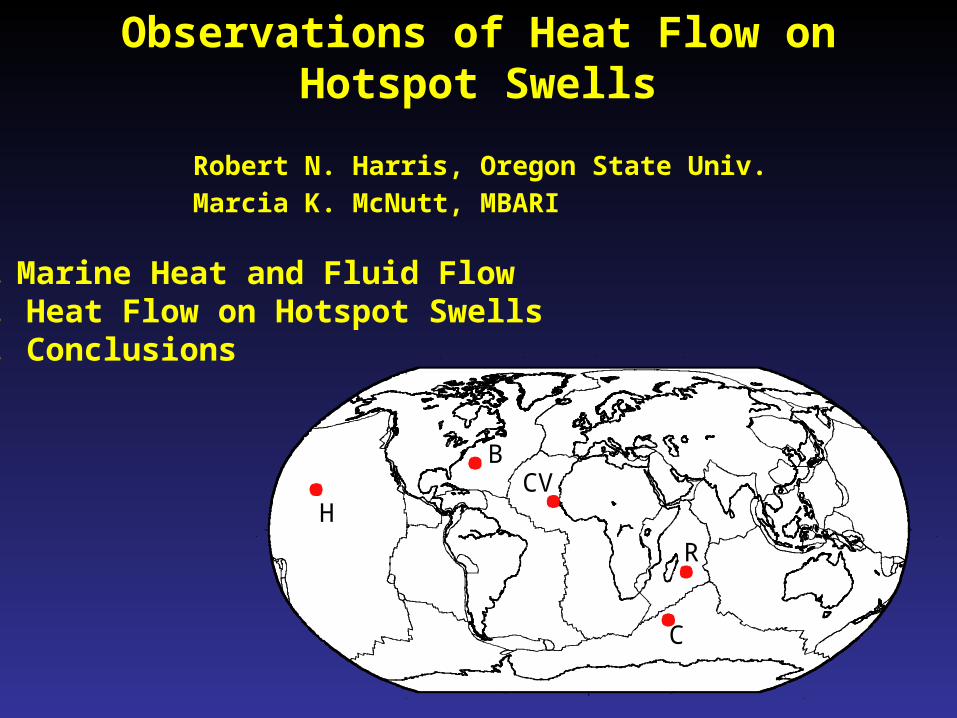
seafloor
thermistors
Tem
pera
ture
Time
each thermistor
q = -k dT/dz
dT/dz = thermal gradient
k = thermal conductivity
Marine Heat Flow
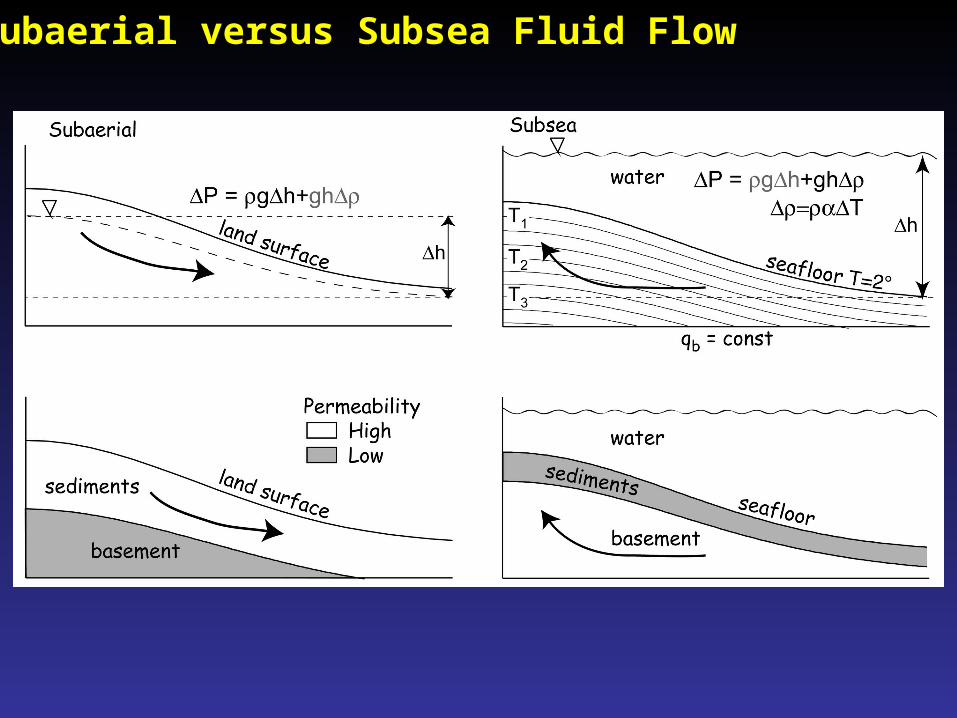
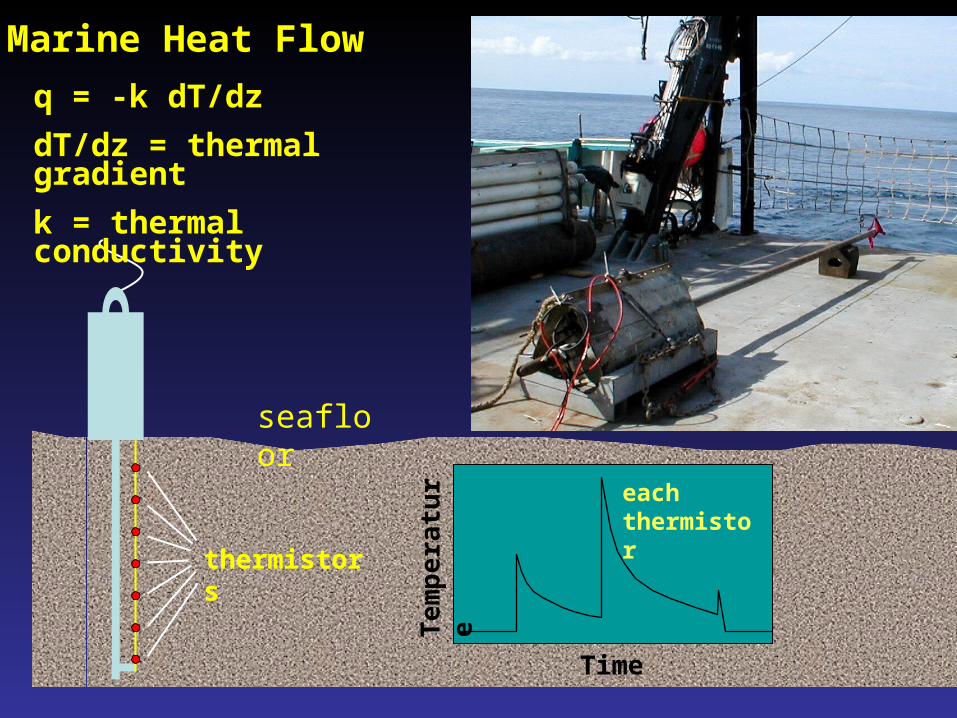
Subaerial versus Subsea Fluid Flow
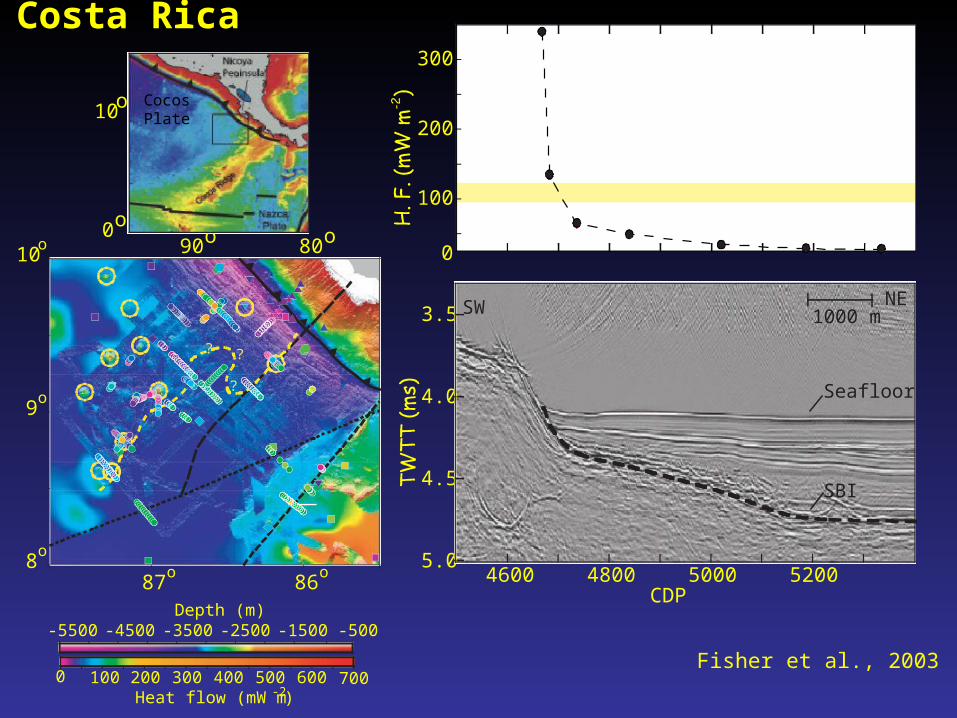
Costa Rica
Fisher et al., 2003
Seafloor
SBI
NESW 1000 m
? ?
?
0
100
200
300
3.5
4.0
4.5
5.04600 4800 5000 5200
CDP
Heat flow (mW m -2)0 100 300 500 600200 400 700
Depth (m)-5500 -4500 -3500 -2500 -1500 -500
87o
86o
8o
9o
10o
0o
10o
80o90o
CocosPlate
Cocos-NazcaSpreading
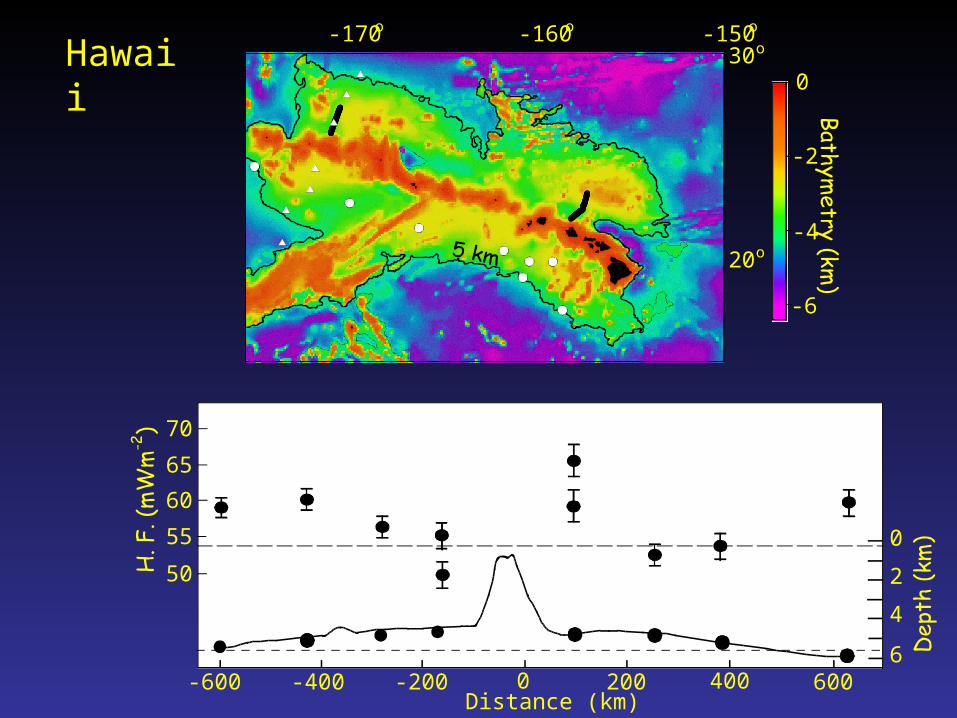
Hawaii
-6
-4
-2
0
-170o -160o -150o
20o
30o
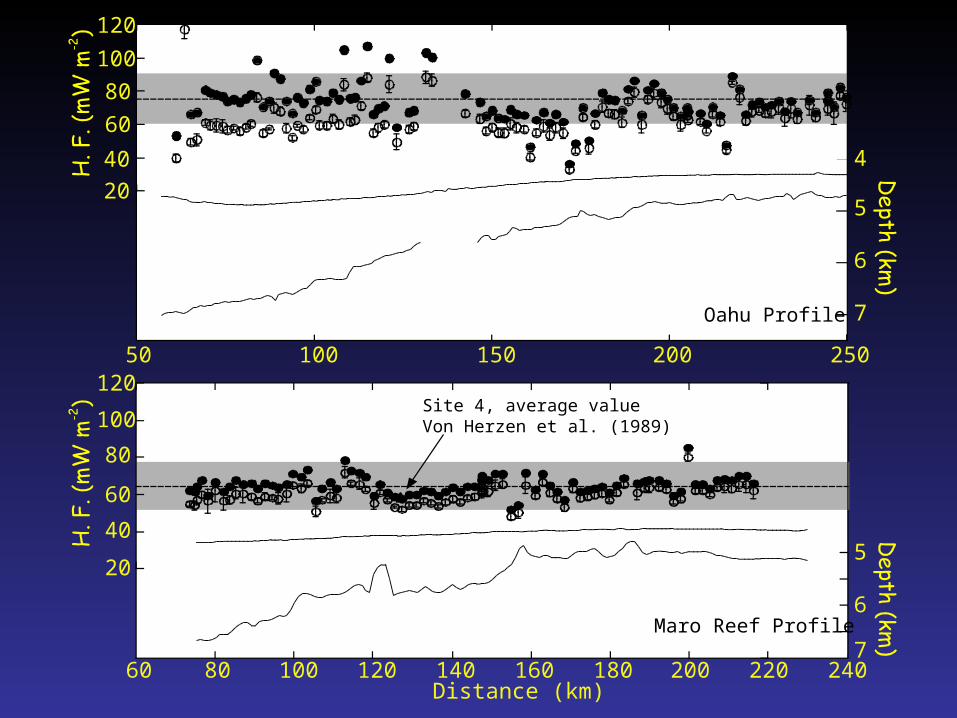
Oahu
Maro Reef
0
2
4
60-200-400-600 200 400 600
Distance (km)
70
65
60
55
50
50 100 150 200 250
4
5
6
7
2040
60
80
100
120
Oahu Profile
5
6
760 22080 100 120 140 160 180 200 240
Distance (km)
20
40
60
80
100
120Site 4, average valueVon Herzen et al. (1989)
Maro Reef Profile
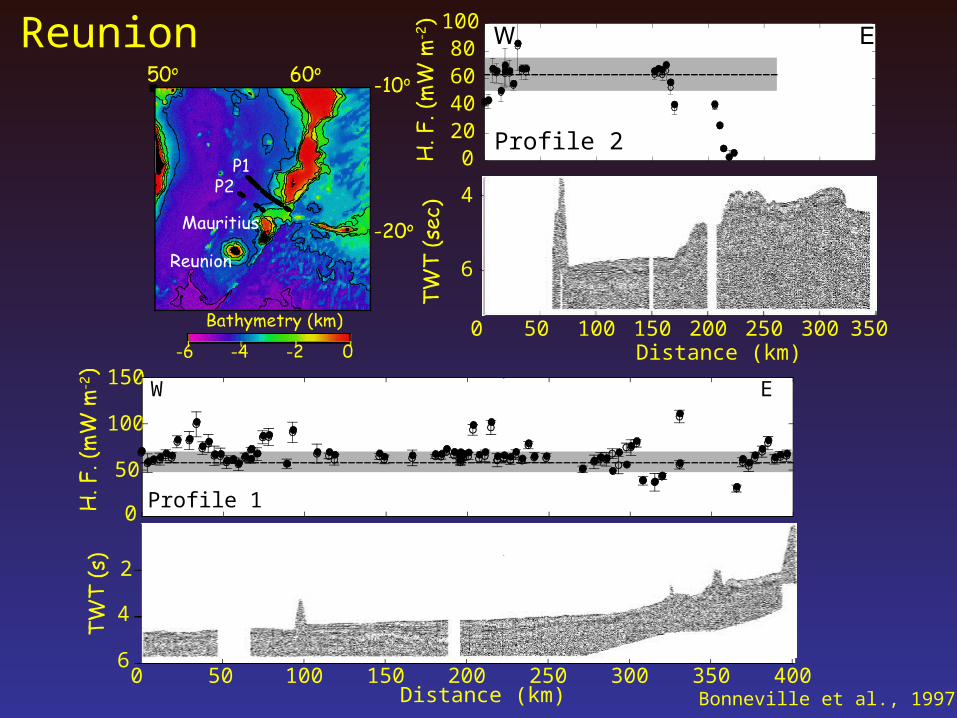
Reunion
Bonneville et al., 19970 50 100 150 200 250 300 350 400
Distance (km)
6
4
2
020406080
100
Profile 2
4
6
0 50 100 150 200 250 300 350Distance (km)
W E
50
100
150
Profile 10
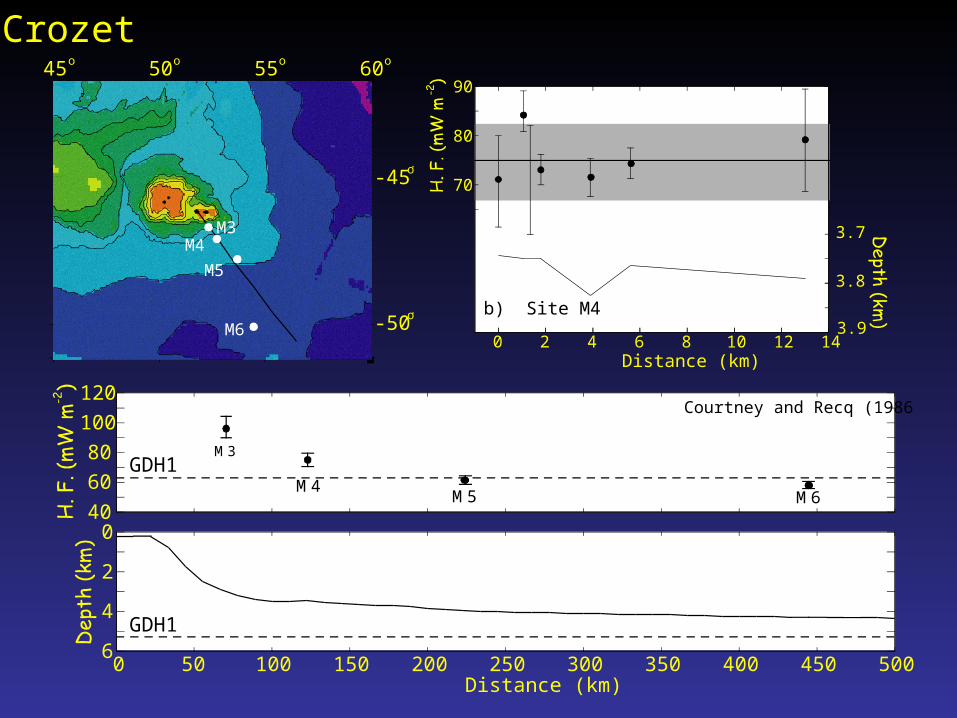
Crozet
40
60
80
100
120
Distance (km)0 50 100 150 200 250 300 350 400 450 500
6
4
2
0
GDH1
GDH1
Courtney and Recq (1986)
M6
M3
M4M5
45o 50o 55o 60o
-50o
-45o
M3M4
M6
M5
Distance (km)0 2 4 6 8 10 12 14
70
80
90
3.8
3.7
3.9b) Site M4
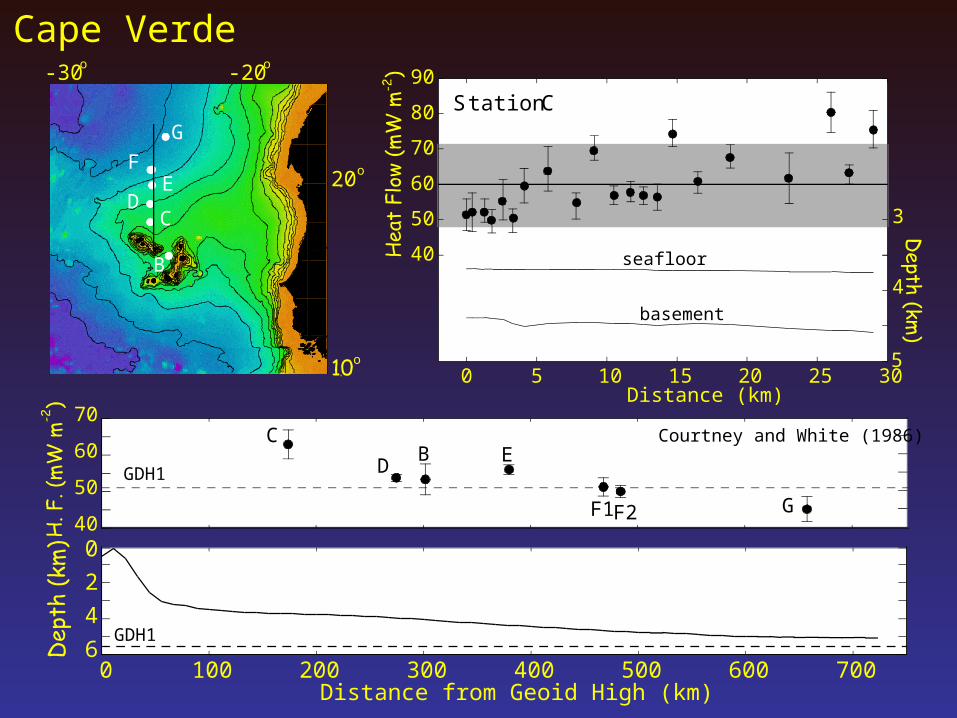
Cape Verde
40
50
60
70
BC
D E
F1F2 G
-30o -20o
o
20o
G
B
CD
EF
Distance from Geoid High (km)0 100 200 300 400 500 600 700
6
4
2
0
Courtney and White (1986)
GDH1
GDH1
40
50
60
70
80
90
0 5 10 15 20 25 30Distance (km)
5
4
3
seafloor
basement
Station C
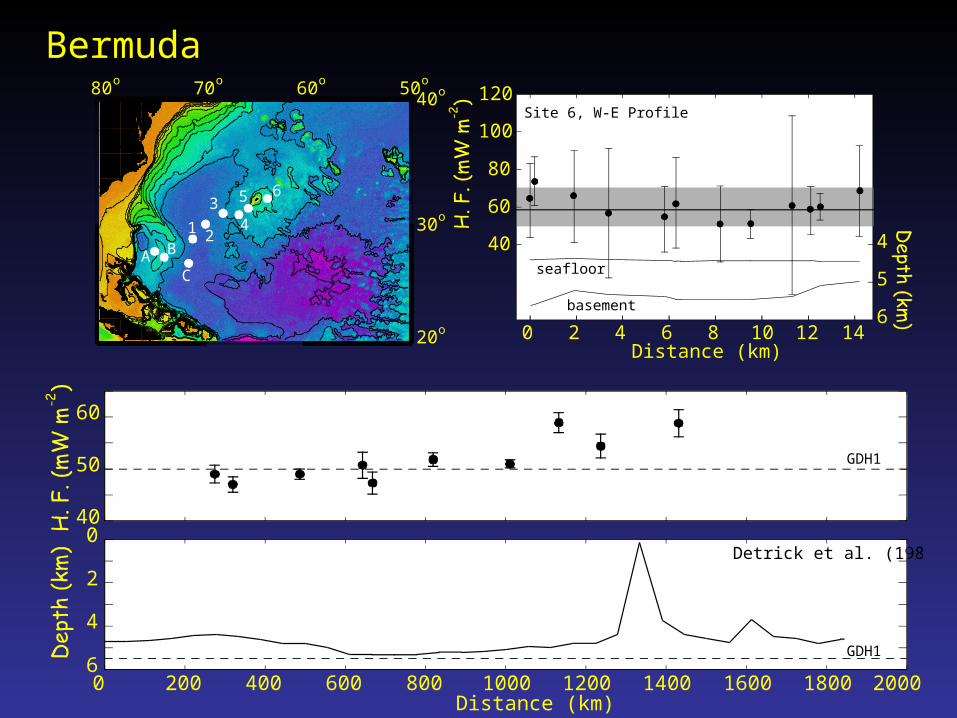
Bermuda80o 70o 60o 50o
20o
30o
40o
A B
C
1
65
43
2
40
50
60
Detrick et al. (1986)
6
4
2
0
0 200 400 600 800 1000 1200 1400 1600 1800 2000Distance (km)
GDH1
GDH1
0 2 4 6 8 10 12 14
40
60
80
100
120
Distance (km)
6
5
4seafloor
basement
Site 6, W-E Profile
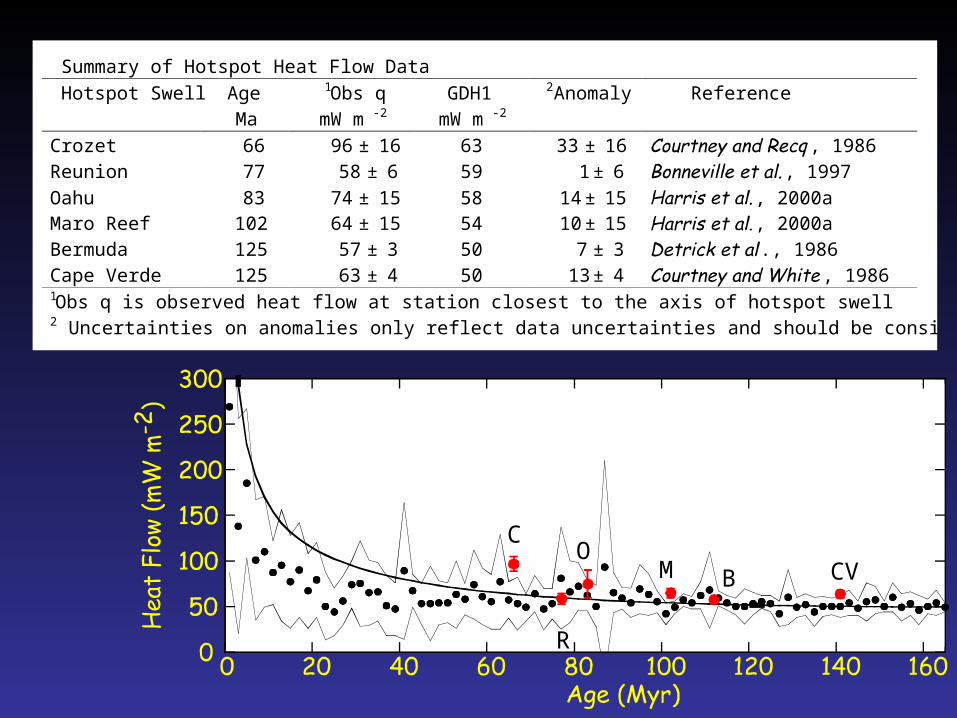
C
R
OM B CV
Summary of Hotspot Heat Flow DataHotspot Swell Age
Ma
1Obs qmW m-2
GDH1mW m-2
2Anomaly Reference
Crozet 66 96 ± 16 63 33 ± 16 , 1986Reunion 77 58 ± 6 59 1± 6 , 1997Oahu 83 74 ± 15 58 14± 15 , 2000aMaro Reef 102 64 ± 15 54 10± 15 , 2000aBermuda 125 57 ± 3 50 7 ± 3 ., 1986Cape Verde 125 63 ± 4 50 13± 4 , 19861Obs q is observed heat flow at station closest to the axis of hotspot swell2 Uncertainties on anomalies only reflect data uncertainties and should be considered a minimum.
Take Home Points
1. High-resolution heat flow surveys at Hawaii and Reunion show large variability. Coarse surveys on other hotspot swells show increasing variability as volcanic edifices are approached. Both observations are consistent with fluid flow.
2. The most likely driving force is the bathymetric relief of the volcanic edices coupled with thin to nonexistant sediment cover.
3. One potential outcome of fluid flow is that the heat flux is diminished where sublithospheric heat flow anomalies are expected to be the greatest.
4. In areas of hydrothermal circulation, conductive thermal models should be used with caution.