Embed Size (px)
Citation preview

HAL Id: hal-00316568https://hal.archives-ouvertes.fr/hal-00316568
Submitted on 1 Jan 1999
HAL is a multi-disciplinary open accessarchive for the deposit and dissemination of sci-entific research documents, whether they are pub-lished or not. The documents may come fromteaching and research institutions in France orabroad, or from public or private research centers.
L’archive ouverte pluridisciplinaire HAL, estdestinée au dépôt et à la diffusion de documentsscientifiques de niveau recherche, publiés ou non,émanant des établissements d’enseignement et derecherche français ou étrangers, des laboratoirespublics ou privés.
Observations of polar patches generated by solar windAlfvén wave coupling to the dayside magnetosphere
P. Prikryl, J. W. Macdougall, I. F. Grant, D. P. Steele, G. J. Sofko, R. A.Greenwald
To cite this version:P. Prikryl, J. W. Macdougall, I. F. Grant, D. P. Steele, G. J. Sofko, et al.. Observations of polar patchesgenerated by solar wind Alfvén wave coupling to the dayside magnetosphere. Annales Geophysicae,European Geosciences Union, 1999, 17 (4), pp.463-489. �hal-00316568�

Observations of polar patches generated by solar wind Alfve n wavecoupling to the dayside magnetosphere
P. Prikryl1, J. W. MacDougall2, I. F. Grant2*, D. P. Steele3, G. J. Sofko3, R. A. Greenwald4
1 Communications Research Centre, 3701 Carling Ave., Box 11490, Station H, Ottawa, Ont. K2H 8S2, Canada2Department of Physics and Astronomy, University of Western Ontario, London, Ont. N6A 5B9, Canada3 Institute of Space and Atmospheric Studies, University of Saskatchewan, Saskatoon, Sask. S7N 5E2, Canada4 The Johns Hopkins University Applied Physics Laboratory, Laurel, MD 20723-6099, USA
Received: 19 March 1998 / Revised: 4 September 1998 /Accepted: 18 September 1998
Abstract. A long series of polar patches was observedby ionosondes and an all-sky imager during a disturbedperiod (Kp � 7- and IMF Bz < 0). The ionosondesmeasured electron densities of up to 9 ´ 1011 m)3 in thepatch center, an increase above the density minimumbetween patches by a factor of �4.5. Bands of F-regionirregularities generated at the equatorward edge of thepatches were tracked by HF radars. The backscatterbands were swept northward and eastward across thepolar cap in a fan-like formation as the afternoonconvection cell expanded due to the IMF By > 0. Nearthe north magnetic pole, an all-sky imager observed the630-nm emission patches of a distinctly band-like shapedrifting northeastward to eastward. The 630-nm emis-sion patches were associated with the density patchesand backscatter bands. The patches originated in, ornear, the cusp footprint where they were formed byconvection bursts (¯ow channel events, FCEs) structur-ing the solar EUV-produced photoionization and theparticle-produced auroral/cusp ionization by segment-ing it into elongated patches. Just equatorward of thecusp footprint Pc5 ®eld line resonances (FLRs) wereobserved by magnetometers, riometers and VHF/HFradars. The AC electric ®eld associated with the FLRsresulted in a poleward-progressing zonal ¯ow patternand backscatter bands. The VHF radar Doppler spectraindicated the presence of steep electron density gradientswhich, through the gradient drift instability, can lead tothe generation of the ionospheric irregularities found inpatches. The FLRs and FCEs were associated withpoleward-progressing DPY currents (Hall currentsmodulated by the IMF By) and riometer absorptionenhancements. The temporal and spatial characteristicsof the VHF backscatter and associated riometerabsorptions closely resembled those of poleward movingauroral forms (PMAFs). In the solar wind, IMP 8
observed large amplitude Alfve n waves that werecorrelated with Pc5 pulsations observed by the groundmagnetometers, riometers and radars. It is concludedthat the FLRs and FCEs that produced patches weredriven by solar wind Alfve n waves coupling to thedayside magnetosphere. During a period of southwardIMF the dawn-dusk electric ®eld associated with theAlfve n waves modulated the subsolar magnetic recon-nection into pulses that resulted in convection ¯owbursts mapping to the ionospheric footprint of the cusp.
Key words. Ionosphere (polar ionosphere). Magneto-spheric physics (magnetosphere-ionosphere interactions;polar wind-magnetosphere interactions).
1 Introduction
The regions of electron density enhancements known aspolar patches drifting antisunward in the polar capionosphere can be observed by various techniques,principally radio or optical (Crowley, 1996). Initially,polar patches were identi®ed as enhancements in the 630-nm airglow emission due to dissociative recombination ofO�2 while the enhanced F-region ionization in the polarpatches was tracked by sophisticated ionosondes(Buchau et al., 1983; Weber et al., 1984). Scintillationmeasurements (Buchau et al., 1985) showed that thepatches are highly structured and implied the presence ofsmall-scale irregularities with considerable irregularityamplitude (Basu et al., 1994). These techniques, plus totalelectron content and incoherent scatter radar measure-ments, were combined to study the structure anddynamics of polar patches (Weber et al., 1986). A reviewof past research on polar cap patches was presented byTsunoda (1988). A more recent advance in the study ofpatches (Crowley, 1996) was brought about by imagingriometers and HF radars that turned out to be rather
*Present address: CSIRO Division of Atmospheric Research,Aspendale, VIC 3195, Australia
Correspondence to: P. Prikryl
Ann. Geophysicae 17, 463±489 (1999) Ó EGS ± Springer-Verlag 1999

successful in detecting and tracking the patch relatedabsorption and irregularities from the source region nearthe cusp footprint into the polar cap (Rosenberg et al.,1993; Nishino et al., 1998). The HF radars, together withother techniques, were used to discover some newfeatures of polar patches, such as their close relationshipto the cusp and the hemispherical conjugacy (Rodgeret al., 1994a, b; Rodger and Graham, 1996).
In spite of these e�orts to understand the phenom-enon, the question of polar patch formation remainsunresolved (Crowley, 1996). Several mechanisms havebeen proposed and, while each of them can explain someaspects of polar patches, none of them alone seems toprovide a complete picture. However, one should keepin mind that several mechanisms may in fact be neededto explain this rather complex phenomenon. Andersonet al. (1988) suggested that a time-varying convectioncan generate patchiness assuming there is a large solarinduced enhancement in the electron density near theconvection reversal boundary. When the cross-polar-cappotential rises abruptly, the polar cap expands bringingin sunlit plasma from low geomagnetic latitudes whichthereafter convects into the polar cap. The polar capboundary then retracts, ``breaking o� '' a polar patch.Lockwood and Carlson (1992), using a new concept of¯ow excitation developed by Cowley and Lockwood(1992), proposed that time-dependent magnetic recon-nection and convection produce polar cap patches frompre-existing enhancements of the electron density andassociated density gradients produced by solar photo-ionization near the terminator. They invoked transientbursts of magnetic reconnection, known as ¯ux transferevents (FTEs), in their mechanism of patch production.It should be noted that patches were tentatively asso-ciated with FTEs earlier by Walker et al. (1986) whoused an HF radar to study pulsations near the cusp.Rodger et al. (1994a) suggested that enhanced ionizationof the convecting plasma by particle precipitation in thecusp and subsequent disruption of the convection by¯ow channel events (FCEs) (Pinnock et al., 1993) canform polar patches.
In models of polar cap patches that rely on the solarinduced ionization the problem becomes one of under-standing how the patches are produced from a tongue ofionization (TOI) drawn into the polar cap by convec-tion. Sojka et al. (1993) modeled polar cap patches andsuggested that they can be formed without a complexplasma source and can occur naturally as the magneto-spheric convection varies in time in response to changesin the IMF By component. As a result, TOIs that areextended into the polar cap become severely distorted(Sojka et al., 1994) but it is not clear whether thisdistortion can segment TOIs into patches. Valladareset al. (1994, 1996) observed and modeled fast plasma jetscollocated with regions of low F-region density andenhanced plasma temperature. They concluded that thelatter resulted in an enhanced recombination rate thuseroding a substantial volume of the ionization tongueand segmenting it into patches.
There is strong evidence suggesting that patchesoriginate in the dayside auroral (Buchau et al., 1985) or
even subauroral ionosphere (Tsunoda, 1988) althoughthese authors emphasized the EUV-produced photoion-ization plasma as the source of patches. Sojka andSchunk (1986) modeled signi®cant density enhance-ments produced by soft and hard precipitation in thedayside auroral oval. Enhanced F-region plasma hadbeen observed convecting from the solar-illuminateddayside ionosphere through the cusp region and into thepolar cap (Foster and Doupnik, 1984; Foster, 1993;Valladares et al., 1994; Pinnock et al., 1995a). Also,local enhancements of F-region densities in patcheswhich formed near the cusp were attributed to softelectron precipitation (Valladares et al., 1994).
A detailed understanding of the process of couplingbetween the solar wind and dayside magnetosphere mayultimately be necessary to explain patch formation. In acase study, Prikryl et al. (1998) (hereafter referred to aspaper 1) showed evidence for the coupling to the daysidemagnetosphere of solar wind compressional waves.Here, we present the results of another case study whichindicates that Alfve nic ¯uctuations in the solar windcouple to the dayside magnetosphere, modulate themagnetic reconnection and drive ®eld line resonances.The coupling process and associated ionospheric signa-tures are illustrated in Fig. 1 for IMF By > 0. It issuggested that the electron precipitation associated with®eld line resonances (FLRs) equatorward of the cuspcan contribute signi®cantly to patch formation. Thisplasma is then restructured into patches as it convectsthrough the cusp footprint and is drawn into the polarcap. A multi-instrument data base is used to identify thepatches and a variety of phenomena that are involved intheir formation.
2 Instruments and techniques
The Kapuskasing-Saskatoon pair of HF radars (Fig. 2)is a part of an extended network of HF radars calledSuperDARN (Super Dual Auroral Radar Network)(Greenwald et al., 1995). The FoV of this pair of radarsextends from 65° to 85° north magnetic latitude andcovers �4 hours in magnetic local time. The radarsemploy linear phased arrays of 16 log-periodic antennasand operate at frequencies between 8 and 20 MHz. Eachradar forms a beam which is narrow in azimuth (2.5±6°)but broad in elevation (up to �40° at 8 MHz). Thebeams were stepped through 16 adjacent azimuthalpositions every 96 s. In near-real time, the radarsmeasure the backscatter power, line-of-sight velocityand Doppler spectral width by ®tting the auto-correla-tion functions (ACFs) for 70 range bins starting at theslant range of 180 km (normally with the rangeresolution of 45 km).
The Canadian Advanced Digital Ionosonde (CADI)installed at Rabbit Lake, Resolute Bay and Eurekaobserved patches drifting overhead. Each CADI (Mac-Dougall et al., 1995) uses a receiving antenna arrayconsisting of four dipoles arranged along the sides of asquare 60 m on a side, with each antenna attached to adedicated receiver. A ®xed transmitter frequency mode
464 P. Prikryl et al.: Observations of polar patches generated by solar wind Alfve n waves

(usually three frequencies) was interleaved with ion-osonde frequency-sweep mode generating an ionogramevery 15 min. The drift was measured using the ®xedtransmitter frequency mode (Grant et al., 1995).
A polar camera operated in Eureka is a pair of CCD-based all-sky imagers (Steele and Cogger, 1995). The630.0-nm images to be discussed here are 60-s timeexposures at intervals of two to three minutes.
The 48.5-MHz Bistatic Auroral Radar System(BARS) was part of the Canadian Auroral Networkfor OPEN Uni®ed Study (CANOPUS) ground-basednetwork (Rostoker et al., 1995) before the radars were
shut down in summer 1994. The BARS normal mode ofoperation was described by McNamara et al. (1983),and Andre et al. (1988). Figure 2 shows the Nipawinand Red Lake radar ®eld-of-view (FoV) projected ontoa map that also shows the FoVs of a pair ofSuperDARN radars and the CANOPUS sites (referredto later in this work). After the summer of 1992 BARSwas operated in a mixed mode. The normal operationmode employed an alternating single-pulse/double-pulsetechnique to measure the intensity and mean Dopplervelocity in 20-km range gates out to a maximum of1300 km. In every 30-s time interval, the normal mode
Fig. 1. Schematic representation of thesolar wind-magnetosphere-ionosphere cou-pling and generation of polar patches.Several phenomena and causal relation-ships that are portrayed in this ®gure aresupported by the data presented in the casestudy (December 2, 1993): the interplane-tary magnetic ®eld (IMF ) and solar windAlfve n waves (Fig. 3), ionospheric cleft(DPY) currents (Fig. 5), ®eld line reso-nances (FLRs) (Figs. 6, 8, 12, and 13), ®eldaligned currents (FACs) and the iono-spheric structure equatorward of the cuspfootprint (Figs. 7, 8, 9, and 10), pulsedmagnetic reconnection (¯ux transfer events,FTEs) at the subsolar magnetopause, ¯owchannel events (FCEs) and polar patchformation near the cusp footprint (Figs. 8and 16), polar cap convection (Fig. 15), andpatches convecting in the polar cap(Figs. 14, 17, 18, and 19)
Fig. 2. The locations and ®eldsof view of the SuperDARNKapuskasing-Saskatoon andBARS Nipawin-Red Lake radarsprojected onto a map that is alsoshowing some of the CANOPUSand CADI sites. The all-skyimager was located in Eureka
P. Prikryl et al.: Observations of polar patches generated by solar wind Alfve n waves 465

integrated 450 single pulses for the intensity and 450double pulses for the mean Doppler determination. Thenormal mode was interleaved at 5-min intervals with thespectral mode, which was a burst of 34 pulses at a pulserepetition frequency (PRF) of 500 Hz. In the spectralmode the echo ranges were aliased by the 300-km longinterval which was established by the 500-Hz PRF.Fourteen of the 15 range gates in each of the eightbeams were usable within the 300-km interval and weresampled simultaneously. Normally, the high rate burstanalysis used the last 32 pulses as a time series over aninterval of 64 milliseconds. Fourier transformations ofthe 112 simultaneous time series for all range gates yieldDoppler spectra with a spectral resolution of approxi-mately 16 Hz (50 m/s). In this mode, spectral aliasingcan occur for Doppler shifts greater than 250 Hz(773 m/s). Range and spectral ambiguities can usuallybe resolved with the aid of the intensity and meanDoppler data from the neighboring 30-s intervals ofnormal mode operation, for which there are no rangeambiguities.
Another CANOPUS instrument group from whichdata are used in this study is the Magnetometer andRiometer Array (MARIA), whose site coordinates(geographic, geomagnetic and L-values) have been listedby Rostoker et al. (1995). Each MARIA site is equippedwith a three-component ¯uxgate magnetometer of thering-core type and a 30-MHz zenith riometer with anantenna composed of two half-wave dipoles separatedby half a wavelength and equipped with a re¯ector. Inthe case study presented here (December 2, 1993, 1800±2200 UT) quiet day baselines derived from data onDecember 9 and 13 are used for magnetometer andriometer data, respectively. Mainly the data from thenorth-south array (Pinawa (PINA), Island Lake (ISLL),Gillam (GILL), Back (BACK), Fort Churchill (FCHU),Eskimo Point (ESKI) and Rankin Inlet (RANK)) areused in this work, although some data from east-westarray are mentioned (Fort Smith (FSMI) and Dawson(DAWS)).
Pure state ®ltering techniques (Samson and Olson,1980; Samson, 1983a, b) were used to identify highlypolarized Pc5 pulsations and determine their spectral,polarization, and phase characteristics (see Ziesolleckand McDiarmid, 1994).
3 Dayside event of December 2, 1993: a case study
On December 2, 1993 (1800±2200 UT), the IMFconditions (Sect. 3.1) were favorable for dayside mag-netic merging and polar patch formation. The cuspshifted from �71° down to �68° magnetic latitude(Sects. 3.2, 3.3 and 3.8). During this disturbed period(Kp = 7-), BARS observed a series of poleward-pro-gressing Pc5 backscatter bands entering the cusp fromthe auroral oval. The bands were associated withdiscrete riometer absorption enhancements and Pc5magnetic pulsations (Sects. 3.4 and 3.5) as a result of®eld line resonances (FLRs) (Sect. 3.6) which occurrednear the polar cap boundary (magnetopause) and were
correlated with solar-wind-driven, poleward-progressingDPY currents (Sect. 3.3) observed in the cusp andpoleward of it. The ground-based data coverage fromregions equatorward of the cusp to the central polar capduring this event support evidence in paper 1 thatmagnetosphere-ionosphere coupling processes on theopen and closed ®eld lines are closely interrelated (Sects.3.4, 3.5, 3.6 and 4.2). The F-region irregularitiesassociated with polar patches that formed in, or near,the cusp were observed with SuperDARN (Sect. 3.7).Separate patches, of width 100±200 km, came throughthe cusp during FCEs (Sect. 3.8) and were observed withCADIs and an all-sky imager as they drifted polewardinto and across the polar cap (Sect. 3.9). Combiningthese multi-instrument observations, we conclude thatsome of the patches extended over at least 2500 km inlength (Sect. 3.10).
3.1 Observations of AlfveÂnic ¯uctuations in the solar wind
The IMP 8 spacecraft was located at ()7.7, )30.3, 8.2RE; GSE coordinates) at 1800 UT and moved to ()6.4,)30.7, 7.4 RE) at 2000 UT. The IMF and plasmameasurements were obtained between 1800 and 2050UT. There were no IMP-8 data available between 2050and 2315 and several hours before 1800 UT. Figure 3ashows the 15-s interplanetary magnetic ®eld and 1-minplasma parameters (solar wind velocity and protondensity). The IMF Bz component was negative most ofthe time ()6.7 nT on average). The By component waspositive (4.4 nT on average) except for a few briefnegative excursions. These are favorable conditions fordayside magnetic merging and polar patch formation(Rodger et al., 1994a). The plasma measurementsindicate dynamic pressure between 4 and 5 nPa. Forthese solar wind conditions, we have taken the distancesof the subsolar magnetopause and bow shock to beabout 9 and 12 RE, respectively (Roelof and Sibeck,1993; Fair®eld, 1971).
The IMF components ¯uctuated on the scale from afew minutes to an hour and were anticorrelated withcorresponding components of the solar wind velocity.The ¯uctuations of the IMF magnitude and protondensity were small. Since the IMF Bx was negative (theIMF pointing away from the Sun), on average, theabove anticorrelation indicates outward propagatingAlfve n waves in the solar wind (Belcher and Davis,1971). In order to emphasize the short period ¯uctua-tions the 1-min IMF and velocity time series weredetrended by subtracting the 10-min running averagebefore the pure state ®lter was applied. Figure 3b showsthe 3-component pure state ®ltered time series of theIMF, velocity and the inferred dawn-dusk electric ®eld()V ´ B). These time series clearly show Alfve nic¯uctuations with periods down to a few minutes.Unfortunately, short period oscillations could not bewell resolved because of averaging and interpolation ofgaps in the plasma data. The wave Poynting ¯ux S (ofthe pure state ®ltered signal; Fig. 3b) further supportsthe above interpretation of solar wind ¯uctuations. The
466 P. Prikryl et al.: Observations of polar patches generated by solar wind Alfve n waves

Fig. 3. The IMP-8 15-s interplanetarymagnetic ®eld and 1-min plasma mea-surements demonstrating the presence ofAlfve n waves. b The pure state ®ltered1-min IMF, solar wind velocity andinferred dawn-dusk electric ®eld. Lowfrequency oscillations are attenuated by a10-min detrender. Also, the wave Poyn-ting ¯ux is shown (bottom)
P. Prikryl et al.: Observations of polar patches generated by solar wind Alfve n waves 467
Sx-component of the Poynting vector is negative (awayfrom the Sun) and the magnitude is enhanced duringtwo main periods (1800±1850 and 1930±2000 UT). Itshould be noted that most of the electromagnetic energywas carried by long period Alfve n waves which hadlarger amplitudes but are strongly attenuated in the timeseries shown in Fig. 3b. Using the 60-min detrender thepeak total Poynting ¯ux exceeded 12 lWm)2 as com-pared to �4 lWm)2 (10-min detrender). The waveelectric ®eld was linearly polarized in the plane contain-ing the XGSE-axis and inclined at about 45° to the eclipticplane ± the oscillations of Ey and Ez (not shown) hadsimilar amplitudes and were anticorrelated. This isfavorable for coupling of these Alfve n waves to thesubsolar magnetopause. The oscillating dawn-duskcomponent of the electric ®eld is expected to modulatethe magnetic reconnection rate (see, e.g., Lockwood,1996). In another case study in paper 1, compressionalMHD waves in the solar wind were found to modulatethe ionospheric cusp ¯ows that were interpreted assignatures of pulsed reconnection at the dayside mag-netopause. In the case study presented in this work, thecoupling of solar wind Alfve n waves to the daysidemagnetosphere is discussed. At times (particularlybefore 1930 UT), a small admixture of other modesmay have resulted in small changes in the magnetic ®eldmagnitude, but there was no signi®cant compressionalcomponent in the solar wind. However, the interactionbetween the solar wind Alfve n waves and the bowshock can generate both Alfve n waves and dynamicpressure pulses downstream of the bow shock (Lin et al.,1996).
Transmission of Alfve n waves and/or their interac-tion with the bow shock have been studied by severalauthors (e.g., McKenzie and Westphal, 1969; Scholerand Belcher, 1971; Hassam, 1978; Sibeck et al., 1997).For the general case of incident Alfve n waves witharbitrary k vectors, this interaction can result in severalMHD modes (outgoing waves) that include fast andslow magnetoacoustic modes and Alfve n waves. For aspecial case, when the incident Alfve n wave k vectorsare parallel to, and the ®eld perturbations normal to,the plane B0-n de®ned by the ambient magnetic ®eld B0
and the shock normal n, the Alfve n waves aretransmitted through the bow shock as forward andbackward propagating Alfve n waves (Hassam, 1978).Recently, the observational evidence of this prediction(oppositely propagating Alfve nic ¯uctuations in thesolar wind and magnetosheath) was presented by Sibecket al. (1997).
For the case study presented we are interested in theinteraction and coupling of Alfve n waves near thesubsolar points of the bow shock and magnetopause,respectively. The IMP-8 location near the bow shock(YGSE �)30 RE) and the lack of magnetosheath dataprecluded any detailed analysis of the Alfve n wavetransmission across the bow shock. However, theorientation of the mean IMF (strongly southward)along with the large amplitude of the By oscillationssuggest that the ®eld perturbations were polarized nearthe plane perpendicular to the B0)n plane (particularly
when the ambient IMF had nearly zero duskwardcomponent) while the solar wind Alfve n waves propa-gated along the spiral IMF (k vectors parallel to theB0)n plane). These geometrical considerations areconsistent with the conditions required for transmissionof solar wind Alfve n waves to the magnetosheath.
3.2 The cusp location
No DMSP satellites passed over the geographical areacovered by SuperDARN radars during the time of theevent. Later, the poleward edge of the auroral oval inthe northern hemisphere was estimated from F11satellite particle data to be near Fort Churchill at 2207UT. In the southern hemisphere, the cusp was identi®edfrom the particle data (Rich, 1995, private communica-tion) during two passes of the F10 DMSP satellite. Itwas located at )69° magnetic latitude at 1851 and justbefore 2030 UT. These observations of the particle cuspin the Southern Hemisphere agree (within 2° of latitude)with the northern radar cusp signatures which extended1±2° further equatorward at times.
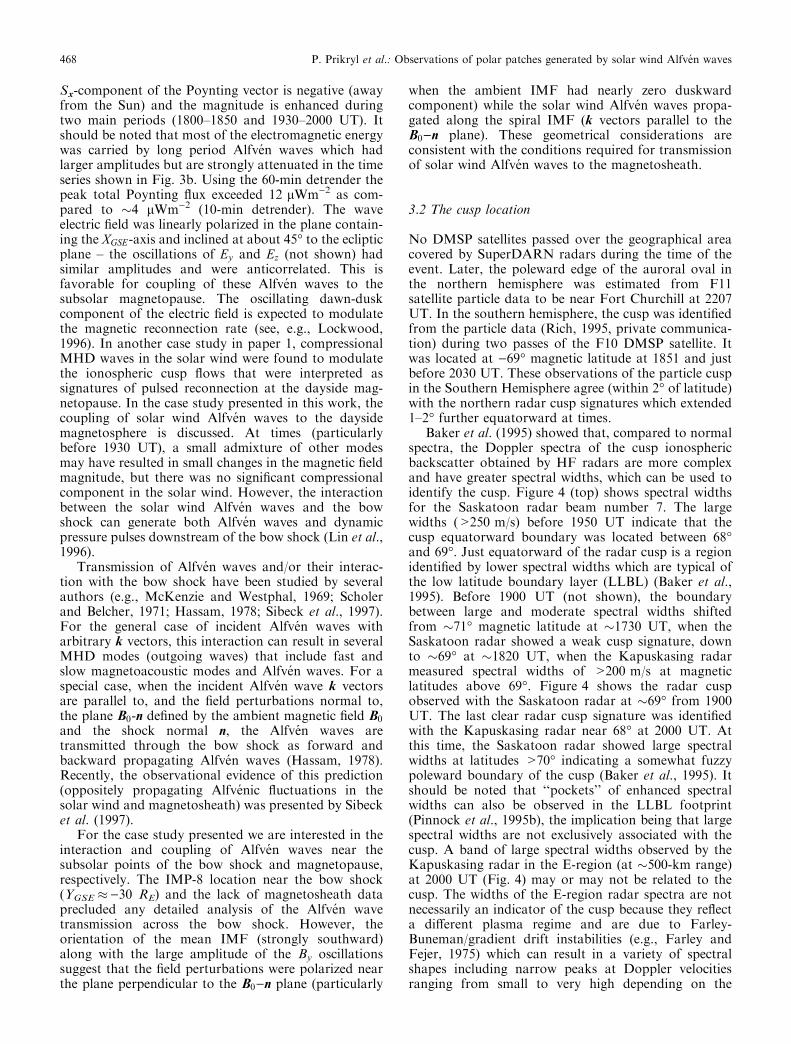
Baker et al. (1995) showed that, compared to normalspectra, the Doppler spectra of the cusp ionosphericbackscatter obtained by HF radars are more complexand have greater spectral widths, which can be used toidentify the cusp. Figure 4 (top) shows spectral widthsfor the Saskatoon radar beam number 7. The largewidths (>250 m/s) before 1950 UT indicate that thecusp equatorward boundary was located between 68°and 69°. Just equatorward of the radar cusp is a regionidenti®ed by lower spectral widths which are typical ofthe low latitude boundary layer (LLBL) (Baker et al.,1995). Before 1900 UT (not shown), the boundarybetween large and moderate spectral widths shiftedfrom �71° magnetic latitude at �1730 UT, when theSaskatoon radar showed a weak cusp signature, downto �69° at �1820 UT, when the Kapuskasing radarmeasured spectral widths of >200 m/s at magneticlatitudes above 69°. Figure 4 shows the radar cuspobserved with the Saskatoon radar at �69° from 1900UT. The last clear radar cusp signature was identi®edwith the Kapuskasing radar near 68° at 2000 UT. Atthis time, the Saskatoon radar showed large spectralwidths at latitudes >70° indicating a somewhat fuzzypoleward boundary of the cusp (Baker et al., 1995). Itshould be noted that ``pockets'' of enhanced spectralwidths can also be observed in the LLBL footprint(Pinnock et al., 1995b), the implication being that largespectral widths are not exclusively associated with thecusp. A band of large spectral widths observed by theKapuskasing radar in the E-region (at �500-km range)at 2000 UT (Fig. 4) may or may not be related to thecusp. The widths of the E-region radar spectra are notnecessarily an indicator of the cusp because they re¯ecta di�erent plasma regime and are due to Farley-Buneman/gradient drift instabilities (e.g., Farley andFejer, 1975) which can result in a variety of spectralshapes including narrow peaks at Doppler velocitiesranging from small to very high depending on the
468 P. Prikryl et al.: Observations of polar patches generated by solar wind Alfve n waves

horizontal density gradient scales and orientations(St.-Maurice et al., 1994; Prikryl et al., 1995). Thusthe spatial and temporal averaging of E-region back-scatter may result in broad spectra even in the auroraloval. Nevertheless, it was observed that the region ofvery narrow widths (Fig. 4) kept shifting equatorward.This and the fact that FCEs were observed at progres-sively lower latitudes (Sect. 3.8) indicate that the cuspalso shifted further equatorward as more and moreclosed magnetic ¯ux was eroded by ¯ux transfer eventsafter 2000 UT. The polar cap expanded as far equator-ward as 70° magnetic latitude at 2045 UT as indicatedby signi®cantly reduced spectral widths associated withpatches (Fig. 4). The equatorward shift of the cusp alsoagreed with observations of DPY currents associatedwith the FCEs discussed later. Also, it should be notedthat the cusp can span up to 6 h of local time (Crookeret al., 1991; Newell and Meng, 1994). At 2100 UT, mostof the radar data are from magnetic local times before1400 MLT and the Northern Hemisphere cusp isexpected to be shifted into the afternoon sector for theIMF By > 0 (Cowley et al., 1991). This supports theargument that the cusp/cleft was present and observed
by the radars at near ranges until at least 2200 UT(�1500 MLT).
3.3 Poleward edge of the ionospheric cleft currents(DPY currents)
Figure 5 shows 5-s ground magnetic X-component(quiet time mean value subtracted) from the CAN-OPUS meridional chain and the 30-s IMF By-compo-nent (broken line; solid line shows the smoothed trace).During the ®rst hour shown (1700±1800 UT), pole-ward-progressing currents were observed poleward ofFCHU. At �1730 UT, as we mentioned already, theSaskatoon radar showed a weak signature of a radarcusp with an equatorward boundary at �71° magneticlatitude. After 1800 UT, the poleward-progressingdisturbances were correlated with the IMF By-compo-nent and thus were due to eastward DPY (Hall)currents (Friis-Christensen and Wilhjelm, 1975; Claueret al., 1995; Stauning et al., 1995) poleward of, andnear, the cusp that now shifted further equatorward.The thick arrows in Fig. 5 show corresponding phases
Fig. 4. Range versus time plot(top) and radar maps (bottom) ofspectral widths. Radar cusp can beidenti®ed by large widths (particu-larly between 1900 and 2000 UT)while the region of small widths(<100 m/s) just equatorward of itcan be associated with low latitudeboundary layer (LLBL). The spec-tral widths in the patches driftingantisunward well inside the polarcap are also signi®cantly reduced
P. Prikryl et al.: Observations of polar patches generated by solar wind Alfve n waves 469
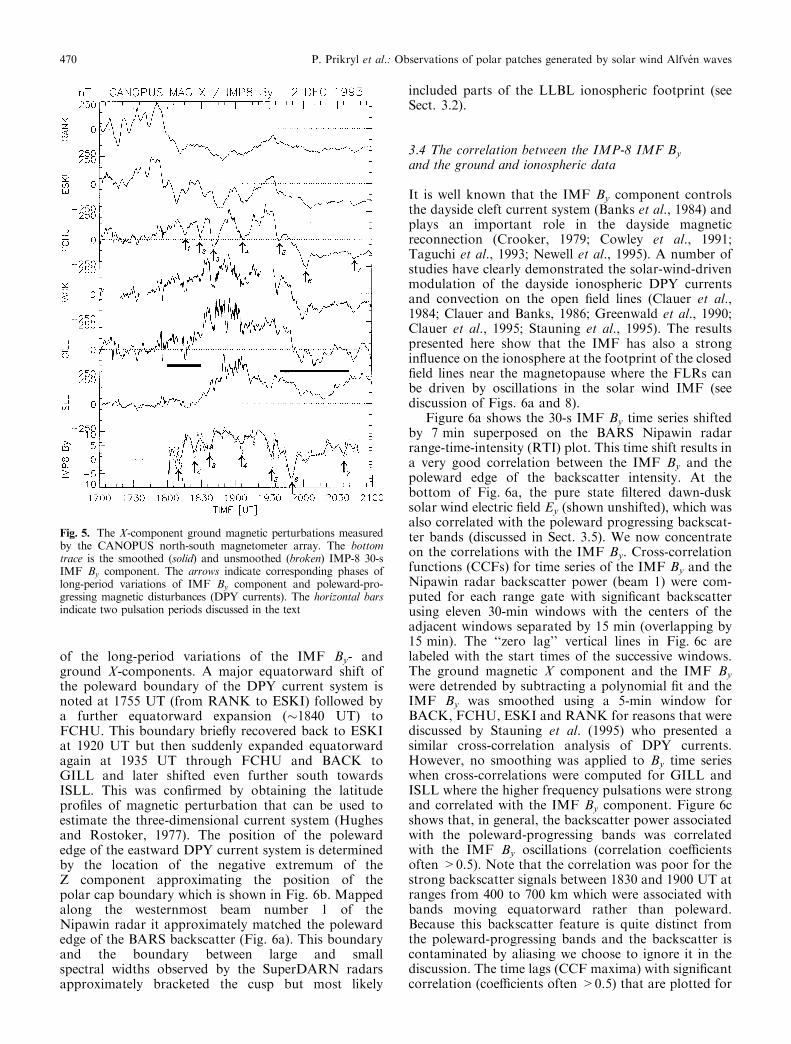
of the long-period variations of the IMF By- andground X-components. A major equatorward shift ofthe poleward boundary of the DPY current system isnoted at 1755 UT (from RANK to ESKI) followed bya further equatorward expansion (�1840 UT) toFCHU. This boundary brie¯y recovered back to ESKIat 1920 UT but then suddenly expanded equatorwardagain at 1935 UT through FCHU and BACK toGILL and later shifted even further south towardsISLL. This was con®rmed by obtaining the latitudepro®les of magnetic perturbation that can be used toestimate the three-dimensional current system (Hughesand Rostoker, 1977). The position of the polewardedge of the eastward DPY current system is determinedby the location of the negative extremum of theZ component approximating the position of thepolar cap boundary which is shown in Fig. 6b. Mappedalong the westernmost beam number 1 of theNipawin radar it approximately matched the polewardedge of the BARS backscatter (Fig. 6a). This boundaryand the boundary between large and smallspectral widths observed by the SuperDARN radarsapproximately bracketed the cusp but most likely
included parts of the LLBL ionospheric footprint (seeSect. 3.2).
3.4 The correlation between the IMP-8 IMF By
and the ground and ionospheric data
It is well known that the IMF By component controlsthe dayside cleft current system (Banks et al., 1984) andplays an important role in the dayside magneticreconnection (Crooker, 1979; Cowley et al., 1991;Taguchi et al., 1993; Newell et al., 1995). A number ofstudies have clearly demonstrated the solar-wind-drivenmodulation of the dayside ionospheric DPY currentsand convection on the open ®eld lines (Clauer et al.,1984; Clauer and Banks, 1986; Greenwald et al., 1990;Clauer et al., 1995; Stauning et al., 1995). The resultspresented here show that the IMF has also a strongin¯uence on the ionosphere at the footprint of the closed®eld lines near the magnetopause where the FLRs canbe driven by oscillations in the solar wind IMF (seediscussion of Figs. 6a and 8).
Figure 6a shows the 30-s IMF By time series shiftedby 7 min superposed on the BARS Nipawin radarrange-time-intensity (RTI) plot. This time shift results ina very good correlation between the IMF By and thepoleward edge of the backscatter intensity. At thebottom of Fig. 6a, the pure state ®ltered dawn-dusksolar wind electric ®eld Ey (shown unshifted), which wasalso correlated with the poleward progressing backscat-ter bands (discussed in Sect. 3.5). We now concentrateon the correlations with the IMF By. Cross-correlationfunctions (CCFs) for time series of the IMF By and theNipawin radar backscatter power (beam 1) were com-puted for each range gate with signi®cant backscatterusing eleven 30-min windows with the centers of theadjacent windows separated by 15 min (overlapping by15 min). The ``zero lag'' vertical lines in Fig. 6c arelabeled with the start times of the successive windows.The ground magnetic X component and the IMF By
were detrended by subtracting a polynomial ®t and theIMF By was smoothed using a 5-min window forBACK, FCHU, ESKI and RANK for reasons that werediscussed by Stauning et al. (1995) who presented asimilar cross-correlation analysis of DPY currents.However, no smoothing was applied to By time serieswhen cross-correlations were computed for GILL andISLL where the higher frequency pulsations were strongand correlated with the IMF By component. Figure 6cshows that, in general, the backscatter power associatedwith the poleward-progressing bands was correlatedwith the IMF By oscillations (correlation coe�cientsoften >0.5). Note that the correlation was poor for thestrong backscatter signals between 1830 and 1900 UT atranges from 400 to 700 km which were associated withbands moving equatorward rather than poleward.Because this backscatter feature is quite distinct fromthe poleward-progressing bands and the backscatter iscontaminated by aliasing we choose to ignore it in thediscussion. The time lags (CCF maxima) with signi®cantcorrelation (coe�cients often >0.5) that are plotted for
Fig. 5. The X-component ground magnetic perturbations measuredby the CANOPUS north-south magnetometer array. The bottomtrace is the smoothed (solid) and unsmoothed (broken) IMP-8 30-sIMF By component. The arrows indicate corresponding phases oflong-period variations of IMF By component and poleward-pro-gressing magnetic disturbances (DPY currents). The horizontal barsindicate two pulsation periods discussed in the text
470 P. Prikryl et al.: Observations of polar patches generated by solar wind Alfve n waves

Fig. 6. a Range-versus-time plot of the Nipawin radar backscatterpower. The poleward-progressing Pc5 FLR bands for two events arelabeled. The IMP-8 IMF By component (top) shifted by 7 min and thepure state ®ltered dawn-dusk electric ®eld Ey (unshifted at the bottom)are shown. b An approximate position of the poleward edge of theeastward DPY (Hall) currents and the equatorward boundary of largespectral widths measured by SuperDARN radars are mapped alongthe Nipawin radar beam 1 (leftmost beam). c Time delays between theIMF By component and the ionospheric/ground signals obtainedfrom CCFs computed for 30-min windows stepped by 15 min are
plotted. The vertical lines represent the zero delays and/or the starttime for the corresponding window. The delays for the BARS power(open symbols) and CANOPUS magnetometer X components (solidsymbols) are plotted for correlation coe�cients greater than 0.3. Thelargest values of the cross-correlation coe�cient for BARS (®rst row)andMARIA (second row) are printed at the top for each window. The®rst set of points (squares) is for the interval of 1800±1830 UT, thesecond set of points (triangles) is for the interval of 1815±1845 UT,etc. A generic scale for time lags is shown (bottom-right)
P. Prikryl et al.: Observations of polar patches generated by solar wind Alfve n waves 471
each 30-min window in Fig. 6c increased with range/latitude from a few minutes (at the low-latitude edge ofthe backscatter where the E-region bands started toappear) up to several minutes near the polar capboundary or cusp (Fig. 6b). These radar results are ingood agreement with those for the magnetometer data.Time delays obtained from CCFs for IMF By-/groundX-component data sets that were highly correlated arealso shown in Fig. 6c. The largest values of the cross-correlation coe�cient are printed for each window forBARS (®rst line of numbers at the top) and MARIA(second line). The time lags obtained for the radarbackscatter power and ground magnetic perturbationsdisagreed in the 30-min window starting at 1930 UT whenthe IMF By oscillated between positive and negativevalues thus reversing the polarity of DPY currents.
These results are similar to the observations ofpoleward-progressing By-related ionospheric distur-bances (Stauning et al., 1995). The latter authors closelyexamined the observed time delays and found goodagreement with the values they calculated. IMP 8 waslocated somewhat unfavorably during the event pre-sented here. However, the conditions in the solar wind(the IMF orientation and dynamic pressure of 4±5 nPa)were very similar to those for the event of August 2,1981 (Stauning et al., 1995) and gave similar distancesfor the subsolar bow shock and magnetopause (Sect.3.1). With the spacecraft at �7 RE downstream from theEarth and solar wind speed of 770 km/s, negativepropagation delays of about )2.5 min between IMP 8and the bow shock subsolar point are expected. Thepropagation time of the decelerated solar wind from thebow shock to the magnetopause could exceed 2 min(e.g., Clauer and Banks, 1986, derived 4 min) and thuswould likely eliminate the negative propagation delaybetween IMP 8 and the bow shock. So the measureddelays (shown in Fig. 6c) and those inferred from purestate ®ltered time series (Fig. 8; discussed later) approx-imately represent the propagation times in the magne-tosphere across and/or along the ®eld lines. For BARSdata, at times, the minimum time lags of the IMF By-driven ionospheric disturbances were 1±2 min near theequatorward edge of the backscatter region. This shortdelay could result if the disturbances propagated in fastmode before coupling to the shear mode at smaller L-shells. The measured delays are signi®cantly smaller (by�10 min for cusp locations) than those obtained byStauning et al. (1995), who mainly discussed the daysideconvection disturbances observed poleward of the cusp.Our results show that these solar-wind-driven distur-bances spanned both the regions poleward and equa-torward of the cusp and that the coupling processes onthe open and closed ®eld lines are closely interrelated (asdiscussed in paper 1).
3.5 Solar wind AlfveÂn wave driven Pc5 pulsationsnear the cusp footprint
The Pc5 pulsations that were observed with radars,magnetometers and riometers clearly spanned the re-
gions of closed and open ®eld lines. We shall concentrateon two periods (1800±1830 UT and 1940±2040 UT;hereafter referred to as event 1 and event 2, respectively)when the pulsations appeared to be most coherent andthe BARS data were the least contaminated withsidelobe leakage due to very intense backscatter.
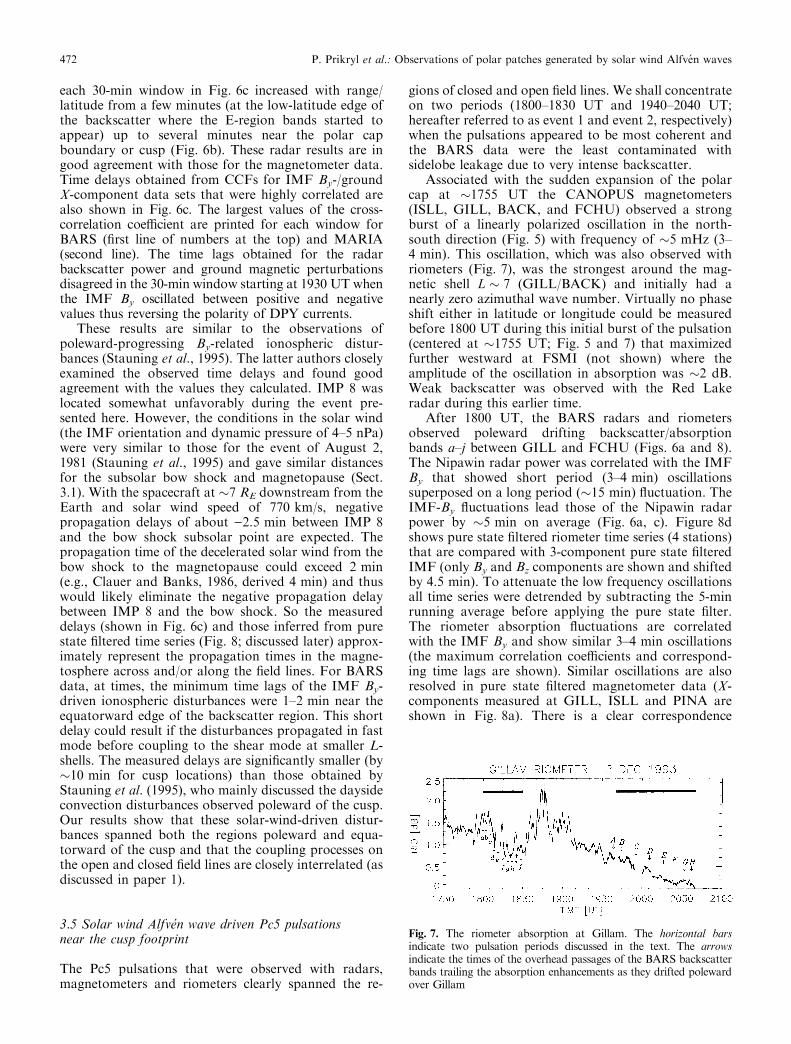
Associated with the sudden expansion of the polarcap at �1755 UT the CANOPUS magnetometers(ISLL, GILL, BACK, and FCHU) observed a strongburst of a linearly polarized oscillation in the north-south direction (Fig. 5) with frequency of �5 mHz (3±4 min). This oscillation, which was also observed withriometers (Fig. 7), was the strongest around the mag-netic shell L � 7 (GILL/BACK) and initially had anearly zero azimuthal wave number. Virtually no phaseshift either in latitude or longitude could be measuredbefore 1800 UT during this initial burst of the pulsation(centered at �1755 UT; Fig. 5 and 7) that maximizedfurther westward at FSMI (not shown) where theamplitude of the oscillation in absorption was �2 dB.Weak backscatter was observed with the Red Lakeradar during this earlier time.
After 1800 UT, the BARS radars and riometersobserved poleward drifting backscatter/absorptionbands a±j between GILL and FCHU (Figs. 6a and 8).The Nipawin radar power was correlated with the IMFBy that showed short period (3±4 min) oscillationssuperposed on a long period (�15 min) ¯uctuation. TheIMF-By ¯uctuations lead those of the Nipawin radarpower by �5 min on average (Fig. 6a, c). Figure 8dshows pure state ®ltered riometer time series (4 stations)that are compared with 3-component pure state ®lteredIMF (only By and Bz components are shown and shiftedby 4.5 min). To attenuate the low frequency oscillationsall time series were detrended by subtracting the 5-minrunning average before applying the pure state ®lter.The riometer absorption ¯uctuations are correlatedwith the IMF By and show similar 3±4 min oscillations(the maximum correlation coe�cients and correspond-ing time lags are shown). Similar oscillations are alsoresolved in pure state ®ltered magnetometer data (X-components measured at GILL, ISLL and PINA areshown in Fig. 8a). There is a clear correspondence
Fig. 7. The riometer absorption at Gillam. The horizontal barsindicate two pulsation periods discussed in the text. The arrowsindicate the times of the overhead passages of the BARS backscatterbands trailing the absorption enhancements as they drifted polewardover Gillam
472 P. Prikryl et al.: Observations of polar patches generated by solar wind Alfve n waves

between the IMF By, ground magnetic oscillations,riometer absorptions and the VHF radar backscatterpower. Similarly to the radar backscatter bands, theriometer absorptions progressed poleward with theoscillations at GILL leading those at ESKI in phaseby about 180°. The phase of the magnetic pulsationprogressed poleward from PINA to GILL but thenstayed nearly constant for BACK and FCHU (notshown) while the oscillation amplitude peaked at GILL.The amplitude of the riometer absorption oscillationtapered o� from GILL to ESKI, while the BARSbakscatter power peaked between BACK and FCHU.It should be noted that the radar backscatter power ishighly aspect sensitive (line-of-sight magnetic ®eldaspect angles decreased with the range for both radarsand were �5° and 3° at 800 km for Nipawin and RedLake radars, respectively). If the discrete absorptions
were associated with auroral arcs, refraction of VHFradio waves would bring the beam close to perpendic-ularity with the magnetic ®eld about 50±150 km behindthe arc where the backscatter power would maximize(Watermann, 1990; Hall et al., 1990; Prikryl andCogger, 1992). This is about the distance betweenGILL and BACK and could explain the separationbetween the peak in the backscatter power and the peakin the amplitude of riometer absorption and groundmagnetic oscillations. It is less clear why the phase ofthe magnetic pulsation did not continue to decrease(progress) poleward of GILL while it did so for theriometer and radar data. However, the large amplitudeof the pulsation observed in GILL suggests intenseionospheric currents which could have been strongenough to dominate the magnetic perturbation atBACK/FCHU and mask weaker ionospheric currents
Fig. 8. a The Red Lake radar backscatter power. Poleward driftingbackscatter bands a±i are correlated with the pure state ®lteredground magnetic pulsations indicating FLRs. The strongest radarbackscatter is side-lobe contaminated. Horizontal dotted lines showmapped positions of four CANOPUS stations. b The Nipawin radarbackscatter power. The FCHU and BACK riometer absorption(detrended) time series are superposed. c The Nipawin radar Doppler
velocity. The ESKI riometer absorption (detrended) and IMP-8 IMFBy (shifted) are superposed. The ¯ow bursts near the cusp areassociated with riometer absorption and ¯ow channel events observedwith SuperDARN in the cusp. d Pure state ®ltered riometer and IMFBy and Bz (shifted). The maximum correlation coe�cients for theriometer absorption and IMF By, and corresponding lag times areshown
P. Prikryl et al.: Observations of polar patches generated by solar wind Alfve n waves 473
¯owing immediately above these stations. Apart from thelatter anomaly, the above magnetometer, riometer andradar observations are consistent with poleward driftingauroral arcs associated with FLRs (see also Sect. 3.6).
The pulsations continued after 1830 UT but weremore complex (composed of several oscillation frequen-cies superposed) while the IMF By remained stronglypositive (By�+10 nT) and Bz was southward except fora brief turning to northward at �1848 UT. The GILLriometer absorption (Fig. 7) and the BARS backscatterpower (Fig. 6a) increased signi®cantly while ¯uctuatingwith short periodicities but were more irregular thanbefore 1830 UT. These observations indicate intenseprecipitation which was apparently a result of strongcoupling of the solar wind wave energy to the magne-topause (note a �7-min oscillation of the IMF Bz andcorresponding oscillation of the inferred dawn-duskelectric ®eld Ey). This precipitation likely resulted in adense ionosphere which precluded SuperDARN obser-vations for about an hour due to HF absorption.
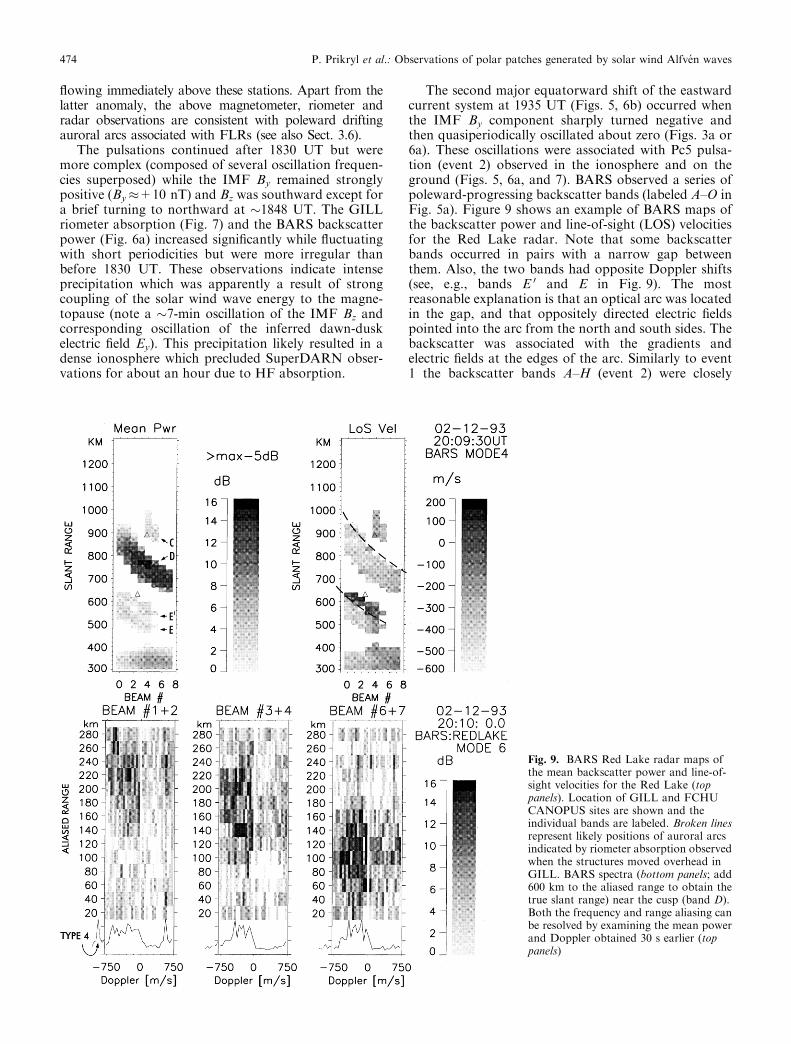
The second major equatorward shift of the eastwardcurrent system at 1935 UT (Figs. 5, 6b) occurred whenthe IMF By component sharply turned negative andthen quasiperiodically oscillated about zero (Figs. 3a or6a). These oscillations were associated with Pc5 pulsa-tion (event 2) observed in the ionosphere and on theground (Figs. 5, 6a, and 7). BARS observed a series ofpoleward-progressing backscatter bands (labeled A±O inFig. 5a). Figure 9 shows an example of BARS maps ofthe backscatter power and line-of-sight (LOS) velocitiesfor the Red Lake radar. Note that some backscatterbands occurred in pairs with a narrow gap betweenthem. Also, the two bands had opposite Doppler shifts(see, e.g., bands E 0 and E in Fig. 9). The mostreasonable explanation is that an optical arc was locatedin the gap, and that oppositely directed electric ®eldspointed into the arc from the north and south sides. Thebackscatter was associated with the gradients andelectric ®elds at the edges of the arc. Similarly to event1 the backscatter bands A±H (event 2) were closely
Fig. 9. BARS Red Lake radar maps ofthe mean backscatter power and line-of-sight velocities for the Red Lake (toppanels). Location of GILL and FCHUCANOPUS sites are shown and theindividual bands are labeled. Broken linesrepresent likely positions of auroral arcsindicated by riometer absorption observedwhen the structures moved overhead inGILL. BARS spectra (bottom panels; add600 km to the aliased range to obtain thetrue slant range) near the cusp (band D).Both the frequency and range aliasing canbe resolved by examining the mean powerand Doppler obtained 30 s earlier (toppanels)
474 P. Prikryl et al.: Observations of polar patches generated by solar wind Alfve n waves

associated with riometer absorption (backscatter trailingthe absorption enhancements at GILL; see Fig. 7)suggesting that the backscatter was located near theequatorward edge of an arc. However, at this time thecusp/cleft shifted further equatorward and there were noriometer data available south of GILL. (There were noriometer data from ISLL, a gap in the riometer datafrom BACK, and no optical data available at aurorallatitudes during this daytime event.) BARS spectralmode (Fig. 9; bottom panels) showed broad and com-plex spectra as these ``arcs'' entered the cusp/cleftregion. The spectra are averaged for two adjacentbeams and also for all ranges. The latter average isshown in the line plot at the bottom. An aliased (inrange and frequency) type-4 peak ()900 m/s) is super-posed on a broad component. The range aliasing can beresolved because the spectra are clearly associated withthe strongest backscatter band D (for the true range600 km should be added to the aliased range shown inFig. 9). Also, the frequency aliasing can be resolvedbecause the mean Doppler velocity was highly negativeduring the standard mode of BARS operation 30 searlier (Fig. 9; top panels), clearly indicating that thepeak near +600 m/s must be aliased as shown (Fig. 9;bottom left). Such spectra are explained by strongelectric ®elds, electron heating, and/or steep horizontalgradients in the electron density associated with auroralarcs (St.-Maurice et al., 1994; Prikryl et al., 1995).Previously, large BARS and optical databases wereexamined and it was found that backscatter bands suchas those shown in Fig. 9 are commonly associated withauroral arcs (Prikryl and Cogger, 1992).
Similarly to event 1 the backscatter bands andassociated riometer absorptions at GILL strongly sug-
gest poleward moving auroral forms and FLRs whichare discussed later. As we have already discussed in Sect.3.4, the IMF By is well correlated with the radar,magnetic and riometer pulsations. The pure state ®ltereddawn-dusk electric ®eld Ey (Fig. 3b) of the Alfve nic¯uctuations in the solar wind is also shown in Fig. 6a.After 1930 UT, the Ey oscillation with a period of 6±8min is closely correlated with the VHF radar backscatterpower (event 2). There is one-to-one correspondencebetween the duskward turnings of the wave electric ®eldand the poleward-progressing backscatter bands.
For SuperDARN, at ranges less than 800 km, thelimited refraction usually limits observations to E-regionirregularities. Similarly to BARS, SuperDARN ob-served the poleward drifting Pc5 bands, although withlower spatial and temporal resolution. There wasconsiderably less SuperDARN E-region backscatterbefore 2000 UT, when the Kapuskasing radar (Fig. 10a)observed only a trace of several Pc5 bands. After 2000UT, a direct comparison between BARS and Super-DARN was possible for the Nipawin radar beam 1(Fig. 6a) and the Saskatoon SuperDARN beam 12(Fig. 10b). These RTI plots showed a good correspon-dence between the E-region backscatter bands observedwith both radars. The spatial correlation of the VHFand HF backscatter is further discussed in Sect. 3.7 and3.8.
We have already mentioned several oscillation modesthat were identi®ed in the solar wind and ground/ionospheric data. Figure 11a, b shows normalizedMEM power spectra of pure state ®ltered solar windmagnetic and inferred electric ®elds, riometer absorp-tion, BARS backscatter power and ground magneticpulsations for events 1 and 2. Low resolution FFT
Fig. 10a, b. SuperDARNRTI plots for aKapuskasing and b Saskatoon radars before and after 2000 UT, respectively. The E-region backscatterbands and corresponding F-region patches are labeled.
P. Prikryl et al.: Observations of polar patches generated by solar wind Alfve n waves 475

power spectra showed similar but broad peaks. There isgood agreement (�0.5 mHz) between the position ofthe spectral peaks obtained for the solar wind andground/ionospheric data. For event 1, the spectra aredominated by peaks near 1 and 4.5 (5) mHz but there isalso an intermediate peak near 3 mHz which is partic-ularly strong in the riometer data. The 5-mHz peakcorresponds to the short period (3±4 min) oscillations(Fig. 8). For event 2, the spectra show peaks near 1, 2and 2.5 mHz. These peaks are also identi®ed in FFTspectra of the Saskatoon (SuperDARN) radar line-of-sight velocity (Fig. 13; discussed in Sect. 3.6). TheBARS radar backscatter spectra (event 2) are somewhatmore complex, showing peaks that are slightly down-shifted, and include an additional peak near 3 mHz.This can be explained by the fact that some of theBARS backscatter bands were actually pairs of bands(e.g., bands E 0 and E ) essentially ``doubling'' thefrequency of the backscatter power oscillations. Ingeneral, the correlations in the frequency domainbetween the IMF and ground/ionosphere oscillationsfurther indicate the presence of an external driver forthe observed Pc5 pulsations, i.e., the Alfve n waves in
the solar wind. The evidence for externally driven FLRsis presented in the next section.
3.6 Evidence for FLRs
The response of the ionosphere to Alfve nic oscillationsin the solar wind showed evidence for FLRs. Thelatitude dependent frequency response and other char-acteristic FLR signatures during event 1 have alreadybeen pointed out in Sect. 3.5. FLR signatures wereidenti®ed in the ground magnetometer, riometer andradar backscatter signals. It should be noted that thiswas not possible for all data subsets. For example, therewas not enough SuperDARN E-region backscatterduring the ®rst pulsation event. BARS Doppler datawere not always reliable because of a sidelobe contam-ination problem (Fig. 8a). Also, note that the F-regionSuperDARN backscatter which is usually very useful tolook for FLRs (see, e.g., Ruohoniemi et al., 1991) couldnot be used during this very disturbed event becausemost of the F-region backscatter was in the polar cap onthe open ®eld lines. However, the ground magnetome-
Fig. 11a,b. Normalized MEM power spectra of pure state ®ltered IMP-8 IMF, riometer absorption, BARS backscatter power, and groundmagnetometer data for a event 1 and b event 2. BARS backscatter power at range gates near BACK (left panel ) and GILL (right panel) is used
476 P. Prikryl et al.: Observations of polar patches generated by solar wind Alfve n waves
ter, riometer and E-region radar backscatter data (bothSuperDARN and BARS) all showed evidence for FLRs.
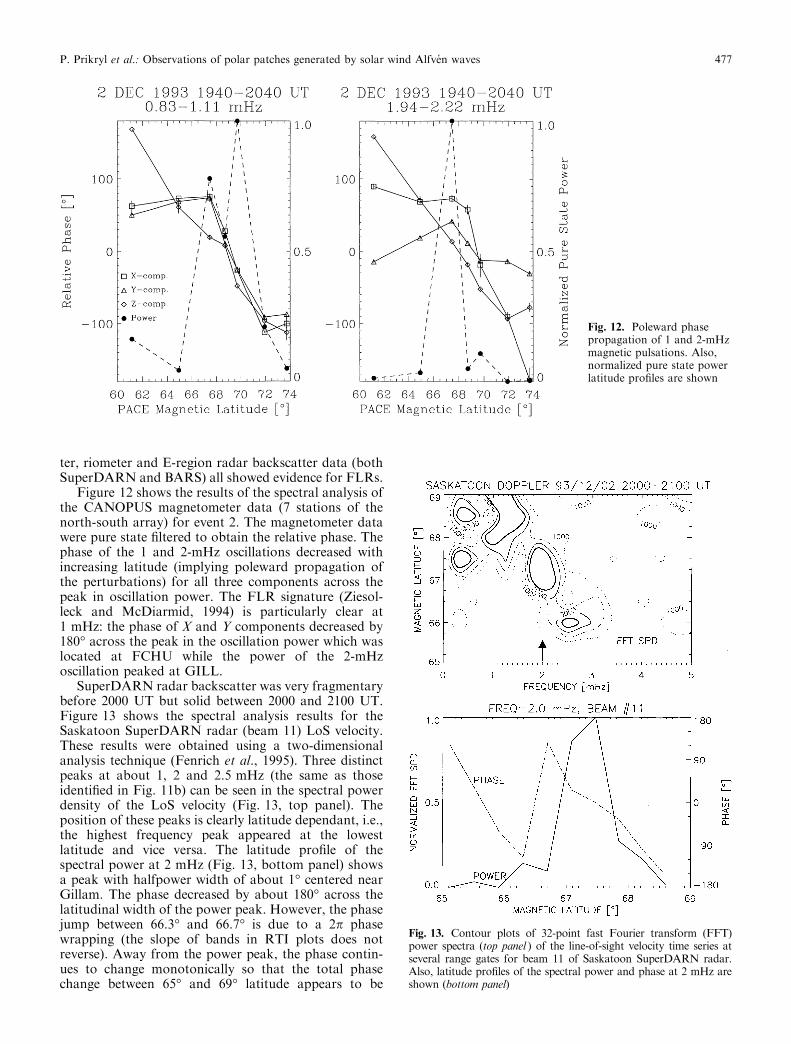
Figure 12 shows the results of the spectral analysis ofthe CANOPUS magnetometer data (7 stations of thenorth-south array) for event 2. The magnetometer datawere pure state ®ltered to obtain the relative phase. Thephase of the 1 and 2-mHz oscillations decreased withincreasing latitude (implying poleward propagation ofthe perturbations) for all three components across thepeak in oscillation power. The FLR signature (Ziesol-leck and McDiarmid, 1994) is particularly clear at1 mHz: the phase of X and Y components decreased by180° across the peak in the oscillation power which waslocated at FCHU while the power of the 2-mHzoscillation peaked at GILL.
SuperDARN radar backscatter was very fragmentarybefore 2000 UT but solid between 2000 and 2100 UT.Figure 13 shows the spectral analysis results for theSaskatoon SuperDARN radar (beam 11) LoS velocity.These results were obtained using a two-dimensionalanalysis technique (Fenrich et al., 1995). Three distinctpeaks at about 1, 2 and 2.5 mHz (the same as thoseidenti®ed in Fig. 11b) can be seen in the spectral powerdensity of the LoS velocity (Fig. 13, top panel). Theposition of these peaks is clearly latitude dependant, i.e.,the highest frequency peak appeared at the lowestlatitude and vice versa. The latitude pro®le of thespectral power at 2 mHz (Fig. 13, bottom panel) showsa peak with halfpower width of about 1° centered nearGillam. The phase decreased by about 180° across thelatitudinal width of the power peak. However, the phasejump between 66.3° and 66.7° is due to a 2p phasewrapping (the slope of bands in RTI plots does notreverse). Away from the power peak, the phase contin-ues to change monotonically so that the total phasechange between 65° and 69° latitude appears to be
Fig. 12. Poleward phasepropagation of 1 and 2-mHzmagnetic pulsations. Also,normalized pure state powerlatitude pro®les are shown
Fig. 13. Contour plots of 32-point fast Fourier transform (FFT)power spectra (top panel ) of the line-of-sight velocity time series atseveral range gates for beam 11 of Saskatoon SuperDARN radar.Also, latitude pro®les of the spectral power and phase at 2 mHz areshown (bottom panel)
P. Prikryl et al.: Observations of polar patches generated by solar wind Alfve n waves 477

considerably larger than 180°. However, the phaseestimates at latitudes with low spectral power densitymust be considered less reliable. We note, though, that®eld line resonances with a latitudinal phase shift largerthan the theoretically predicted 180° (e.g., Chen andHasegawa, 1974; Southwood, 1974) have been observedpreviously at auroral latitudes (see for instance Ziesol-leck and McDiarmid, 1994; their Figs. 7 and 15). Also,it should be noted that beam 11 makes an angle with themagnetic meridian; thus any longitudinal phase changewill result in a systematic error in the phase dependenceon latitude.
The ground magnetic, riometer and radar backscattersignal characteristics (event 1 and 2) are consistent withdiscrete low-m ®eld line resonances (e.g., Ruohoniemiet al., 1991; Samson et al., 1991, 1992a, b; Ziesolleck andMcDiarmid, 1994, 1995; Fenrich et al., 1995). Theobserved magnetic FLR signatures at frequencies>1 mHz were not as clear cut as those for the radar/riometer data. As mentioned in Sect. 3.5, this could bebecause a magnetometer averages over much largervolume than a radar/riometer and also because ofscreening of the pulsation signals by the ionosphere(Hughes and Southwood, 1976a, b).
Because the spectra obtained for solar wind andground/ionospheric data were quite similar (the corre-lation between the IMF By component and the groundand ionospheric data has been discussed in Sect. 3.4), weconclude that FLRs were externally (although notnecessarily directly) driven by the solar wind Alfve nwaves. As we have already noted, the interactionbetween the Alfve n waves and the bow shock couldhave generated dynamic pressure oscillations in themagnetosheath which would then excite FLRs.
3.7 The F-region backscatter bandsobserved by SuperDARN
The F-region density irregularities that caused the HFradar backscatter are expected to be generated along theequatorward border of the patches by the gradient-driftinstability (Tsunoda, 1988). Poleward-progressing E-region backscatter bands were located near the equa-torward edge of the riometer absorption enhancementsand showed Doppler spectra indicative of steep hori-zontal density gradients in auroral arcs. The bandsfaded away near the cusp latitudes but the remanent F-region ionization and the steep density gradients pro-vided favorable conditions for production of irregular-ities in the trailing edges of patches. The F-regionbackscatter bands observed by SuperDARN weremapped along and/or connected with the E-regionbackscatter bands (see, e.g., Figs. 14, 16). In otherwords, the E- and F-region irregularities were associatedwith (generated by) the same density ridges (gradients)at the equatorward edge of patches at times and/orlocations when the patches were formed near the cusp.These density gradients were convected into the polarcap where they continued to generate the F-regionirregularities associated with patches. Unfortunately,there were no ionosonde data available from CambridgeBay and the backscatter bands did not extend as far asResolute Bay to further provide stronger evidence aboutthe location of the backscatter with respect to patches.However, some of the backscatter bands were associatedwith equatorward edges of patches observed by theriometer and CADI in RABB after 2000 UT.
Before 1840 UT, the Kapuskasing radar observedthree major bands that were detached from the cuspevery 10±15 minutes (Fig. 10a). Also, there was anindication of intermediate weaker bands that were
Fig. 14a, b. The Saskatoon SuperDARN radar maps of backscatter power showing the location of patches (G-K) at a 2108 UT and b 2114 UT.The positions of the BARS E-region backscatter bands are shown superposed in the Nipawin (crosses) and Red Lake (triangles) radar ®elds ofview
478 P. Prikryl et al.: Observations of polar patches generated by solar wind Alfve n waves

similar to those identi®ed in BARS/riometer data(Fig. 8). This backscatter structure appears to be a``fossil'' F-region signature of the auroral arcs associatedwith FLRs that imposed ionization density and gradi-ents (depletions) on the ionospheric structure at aurorallatitudes. The ¯ow bursts (FCEs) near the cusp(Figs. 16a, 8c) were similarly modulated (see Sect. 3.8).When patches reached Resolute Bay half an hour later(Fig. 19; discussed below) some of this complex struc-ture was still resolved in the CADI ®xed frequencyionograms.
After 2000 UT, many F-region backscatter bandswere observed (mainly with the Saskatoon radar;Fig. 10b) and there was a one-to-one correspondencebetween the E- and F-region bands, which wascon®rmed by comparing the BARS and SuperDARNradar maps. The patches and associated backscatterbands retained their bandlike form while they drifted inthe polar cap. Apparent drift velocities of up to 400 m/sfor the E-region bands along the BARS Nipawin radarbeam 1 were estimated from the slope of the bands inthe RTI plots. Because of the tilt of the bands thisvalue is an overestimate of the actual progression speedperpendicular to the bands. In the polar cap, the``fossil'' polar patches/bands moved with convection(�600 m/s as inferred from the translational motion ofa series of bands observed with the Saskatoon radar).Just before about 2020 UT the backscatter bands wereonly slightly tilted with respect to L shells and driftedpredominantly poleward. After the IMF By-componentturned strongly positive the polar cap convectionchanged from poleward to north-eastward. The far(west) ends of the bands drifted faster, the bandsrotated clockwise, became nearly sun-aligned andeventually drifted eastward. Figure 14 shows two radarmaps of backscatter power where a series of bands
G±K is identi®ed at two di�erent times as the bandsdrifted eastward. At these times, the band J was stillobserved with BARS at lower latitudes. The gapbetween the E- and F-region HF backscatter widenedbecause the cusp/cleft (where the enhanced ionizationwould help the refraction that is needed to intercept®eld-aligned irregularities) was shifted further equator-ward (Figs. 4 and 6b).
Convection maps were obtained by merging the LoSvelocities from a pair of SuperDARN radars after 2000UT (Fig. 15). The direction and magnitude of theconvection agreed with the bulk motion of backscatterbands (Fig. 14) derived by tracking individual bands.The 200-s (two-sweep) average radially smoothed ve-locity maps (Fig. 15) show the initially poleward ¯owturning eastward. The change of the convection frompoleward to eastward at these high latitudes is anexpected result of the IMF By-component changingfrom small values about zero to larger (positive) valuesafter 2020 UT.
SuperDARN observations of backscatter associatedwith patches spanned the gap between the regions ofthe patch formation in, or near, the cusp footprint andthat of the central polar cap where the patches wereobserved by ionosondes and a polar camera. At closeranges (E-region and near F-region backscatter) theradar (BARS and SuperDARN) observations providedevidence that the structure imposed on the ionosphereby FLRs was propagated into the polar cap. The largespatial coverage of the radars allowed mapping of thepatch related irregularities and the spatial extent ofpatches/bands could be determined (Sect. 3.10). Theconvection velocities agreed with the motion of thebands (Fig. 14), optical patches (Fig. 18), and the driftvelocities measured by CADIs (brie¯y discussed inSect. 3.9).
Fig. 15. Polar cap convection observed by the Saskatoon-Kapuskasing pair of radars
P. Prikryl et al.: Observations of polar patches generated by solar wind Alfve n waves 479

3.8 Convection ¯ow bursts (¯ow channel events)
Similarly to the case study described in paper 1SuperDARN observed FCEs that were associated withFLRs. Figure 16 shows examples of FCEs that intesi®edas the poleward-progressing E-region backscatter bandsfaded near the cusp footprint. Rodger et al. (1994a)proposed that patches are detached from the cusp byFCEs which produce density depletions in the iono-sphere. The results presented here con®rm that but alsoprovide evidence that the plasma is ``pre-structured'' onthe closed ®eld lines before it enters into the polar cap asa patch.
Figure 16a shows an FCE near 71° of magneticlatitude associated with an E-region backscatter band fthat had already faded away in the BARS FoV by thistime. The LoS ¯ow velocity for this FCE exceeded1.2 km/s. Considering the tilt of the ¯ow channel withrespect to the radar beams the actual ¯ow along theband likely exceeded 2 km/s in this case. Another FCEthat has started to form at 69° magnetic latitude wasassociated with the next E-region backscatter band gwhich moved poleward to replace the previous bandthat had faded away.
Moderately enhanced ¯ow bursts were also observedwith the BARS Nipawin radar (Fig. 8c) just poleward ofFCHU near the cusp. These E-region ¯ow enhancementspreceded FCEs that were observed by the Kapuskasingradar by 1±2 min. It should be noted that the E-regionradar measurements often strongly underestimate theactual plasma ¯ows because of the saturation of theFarley-Buneman instability near the ion-acoustic speed(Nielsen and Schlegel, 1985). Just after 1800 UT, the ®rst¯ow burst appeared to be associated with a couple ofweak backscatter bands a and b (observed with BARS)and riometer absorption enhancements progressingpoleward (Fig. 8). The next BARS backscatter band cthat was associated with relatively strong riometerabsorption at lower latitudes faded after it reached
FCHU and no signi®cant ¯ow enhancement was ob-served. The second E-region ¯ow enhancement thatspanned bands d and e (later observed by the Kapuska-sing radar) originated at rather low latitudes (FCHU)which is consistent with strongly southward IMF(Fig. 8c). However, the next ¯ow burst that was associ-ated with band f was rather inconspicuous in the BARSdata while it was quite strong later in the SuperDARN®eld of view (FOV). The reason for this could have beensimply lack of VHF backscatter poleward of FCHU atthis time or the FCE that was observed by theKapuskasing radar (Fig. 16a) originated at somewhathigher latitudes and eastward of BARS ®eld of view. TheFCE associated with the band g clearly originated below68° magnetic latitude (Fig. 16a). The E-region ¯owenhancements associated with bands g and i werecoincident with the strongest riometer absorption atESKI and correlated with strongly southward IMF Bz
suggesting increased reconnection rate. These two FCEssandwiched a weaker ¯ow burst (band h) associated witha weak IMF-By pulse (Fig. 8c) while the IMF Bz turnedtowards zero and then brie¯y northward.
After 1940 UT (event 2), there were several ¯owbursts (FCEs) observed with SuperDARN radars(mainly the Kapuskasing radar). At �1940 and 1950UT, two patchy ¯ow bursts (�1 km/s) were observed inthe western part of the Saskatoon radar associated withthe large amplitude ¯uctuation of By and possibly withbands A and B (Fig. 6a). The next FCE that started at�2003 UT showed an evidence of westward motion ofthe FCE which is consistent with the expected westwardand poleward motion of the FTE signature (e.g., Smithet al., 1992). After a deep negative bay the By compo-nent turned positive again and a high ¯ow burst(>1 km/s) was associated with the band C. Figure 16bshows the last of the three consecutive radar scans takenas the ¯ow burst propagated westward with a bulk speedthat was comparable with the plasma ¯ow speed.Somewhat weaker FCEs that followed (observed be-
Fig.16a, b. The Kapuskasing SuperDARN radar maps of line-of-sight velocities. a Flow channel events (FCEs) is associated with theBARS E-region backscatter bands f and g. Symbols in the BARS ®eld
of view indicate the position of the latter band. b Another FCEassociated with the E-region backscatter band C
480 P. Prikryl et al.: Observations of polar patches generated by solar wind Alfve n waves
tween 67 and 68° magnetic latitude at 2010, 2017, and2022 UT) were associated with bands D, E and F. Later,the F-region backscatter in the western part of theKapuskasing radar FoV became rather fragmented orcompletely absent.
As discussed in Sect. 3.5, at least two dominantfrequency components/bands (<2 mHz and 4±5 mHz)were identi®ed in the pulsation data between 1800 and1830 UT (event 1) and these frequencies also modulatedthe ¯ow bursts. In particular, it was noted that theseparations between the strongest ¯ow bursts (Fig. 8c)were 10±11 min (between d and g), 7±8 min (e.g.,between g and i) while only 3±4 min separated theweaker ¯ows, e.g., band h from the latter ¯ow bursts.The presence of at least two competing FLR modes(driven by multi frequency IMF oscillations) contribut-ed to some structural complexity of polar patches duringevent 1. After 1940 UT (event 2), two dominant (andmore comensurable) frequency components were �1and 2 mHz. The FCEs (as long as they were observed)were associated with individual E-region bands andthere was a one-to-one correspondence between thepatches and E-region bands.
3.9 The ionosonde and optical observations of patches
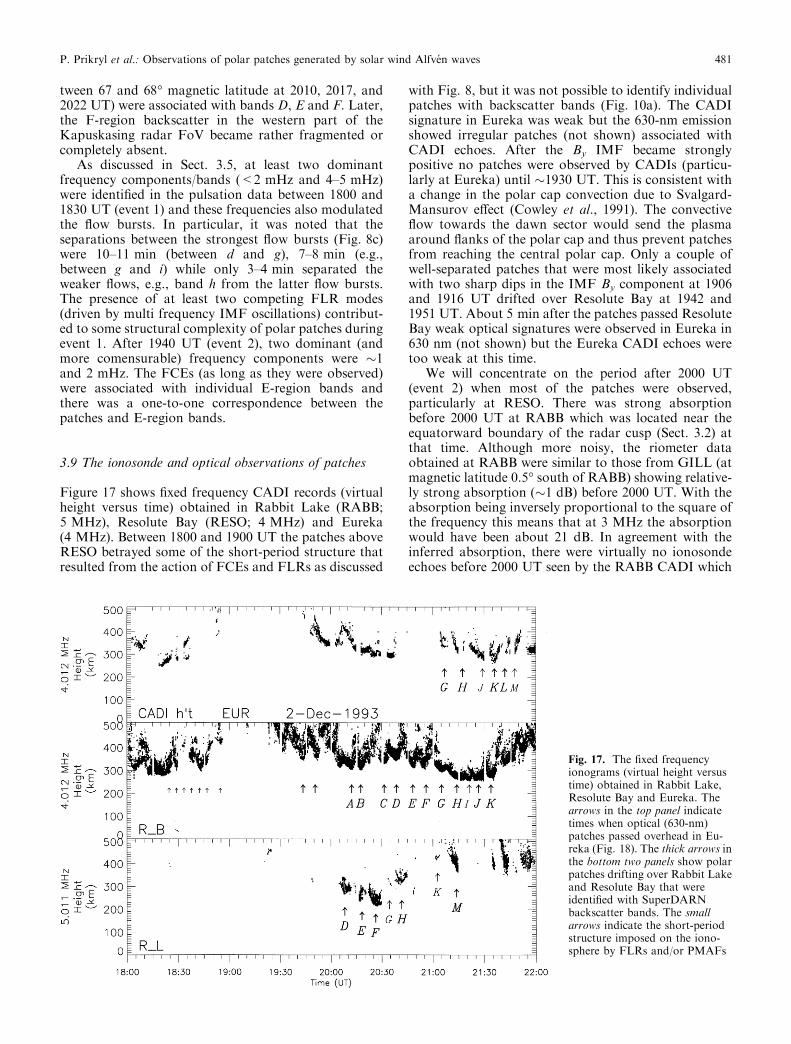
Figure 17 shows ®xed frequency CADI records (virtualheight versus time) obtained in Rabbit Lake (RABB;5 MHz), Resolute Bay (RESO; 4 MHz) and Eureka(4 MHz). Between 1800 and 1900 UT the patches aboveRESO betrayed some of the short-period structure thatresulted from the action of FCEs and FLRs as discussed
with Fig. 8, but it was not possible to identify individualpatches with backscatter bands (Fig. 10a). The CADIsignature in Eureka was weak but the 630-nm emissionshowed irregular patches (not shown) associated withCADI echoes. After the By IMF became stronglypositive no patches were observed by CADIs (particu-larly at Eureka) until �1930 UT. This is consistent witha change in the polar cap convection due to Svalgard-Mansurov e�ect (Cowley et al., 1991). The convective¯ow towards the dawn sector would send the plasmaaround ¯anks of the polar cap and thus prevent patchesfrom reaching the central polar cap. Only a couple ofwell-separated patches that were most likely associatedwith two sharp dips in the IMF By component at 1906and 1916 UT drifted over Resolute Bay at 1942 and1951 UT. About 5 min after the patches passed ResoluteBay weak optical signatures were observed in Eureka in630 nm (not shown) but the Eureka CADI echoes weretoo weak at this time.
We will concentrate on the period after 2000 UT(event 2) when most of the patches were observed,particularly at RESO. There was strong absorptionbefore 2000 UT at RABB which was located near theequatorward boundary of the radar cusp (Sect. 3.2) atthat time. Although more noisy, the riometer dataobtained at RABB were similar to those from GILL (atmagnetic latitude 0.5° south of RABB) showing relative-ly strong absorption (�1 dB) before 2000 UT. With theabsorption being inversely proportional to the square ofthe frequency this means that at 3 MHz the absorptionwould have been about 21 dB. In agreement with theinferred absorption, there were virtually no ionosondeechoes before 2000 UT seen by the RABB CADI which
Fig. 17. The ®xed frequencyionograms (virtual height versustime) obtained in Rabbit Lake,Resolute Bay and Eureka. Thearrows in the top panel indicatetimes when optical (630-nm)patches passed overhead in Eu-reka (Fig. 18). The thick arrows inthe bottom two panels show polarpatches drifting over Rabbit Lakeand Resolute Bay that wereidenti®ed with SuperDARNbackscatter bands. The smallarrows indicate the short-periodstructure imposed on the iono-sphere by FLRs and/or PMAFs
P. Prikryl et al.: Observations of polar patches generated by solar wind Alfve n waves 481

had a rather limited dynamic range. At about 2000 UT,when the equatorward boundary of the radar cuspmoved near and possibly south of RABB, the absorptiondecreased and the CADI data on the highest of the ®xedfrequencies showed a few patches soon after they wereformed near the cusp. However, these CADI observa-tions were still somewhat fragmented because of theabsorption. Half an hour later the patches were observeddrifting northeastward over Resolute Bay and a fewmore minutes later (almost simultaneously) over Eureka.
After 2000 UT, many bandlike patches that wereobserved with SuperDARN (Figs. 10b, 4) were alsoobserved with CADIs (Fig. 17) and the all-sky imager(Fig. 18). For example, between 2100 and 2140 UT,CADIs in Resolute Bay and Eureka observed a series ofstrong patches (G±K) that were seen with SuperDARNat lower latitudes as bands moving eastward (Fig. 14).The transit times of the optical bands (Fig. 18) acrossthe zenith in Eureka (indicated by arrows in the toppanel of Fig. 17) were correlated with patches observedwith CADI at Eureka. CADI measured horizontal
plasma drift velocities for the patches ranging between500 and 1000 m/s northeastward to eastward. Theaverage velocity agreed with the mean translationalmotion observed by SuperDARN (�600 m/s). Note thatthe latter speed was estimated for the band centers asobserved by SuperDARN. The poleward ends of thesebands moved faster as they rotated turning eastwardwith convection.
Figure 19 shows the ionograms, taken at 15-minintervals by the Resolute Bay CADI, over the period2100±2145 UT. Approximate values of fxF2 are shownfor patches and/or troughs separating the patches. Thevalue of foF 2 can be obtained by subtracting 0.8 MHz(half of the electron gyrofrequency). At 2100 UT,oblique echoes from the patch G approaching the zenithand a trough between patch F and G were recorded. At2115 UT, the center of the patch H was overhead(foF2 � 8:5 MHz) indicating the maximum electrondensity of about 9 ´ 1011 m)3. This is an increase by afactor of about 4.5 from the trough density estimated inthe previous ionogram. The ionogram at 2130 UT
Fig. 18. The 630-nm emission images from the polar camera in Eureka showing patches/bands associated with CADI and SuperDARNobservations
482 P. Prikryl et al.: Observations of polar patches generated by solar wind Alfve n waves

showed spread echoes which were due to oblique echoesfrom edges of the patch J (receding) and the patch K(approaching). Note that a couple of minutes later thepoleward end of the bands J and K swept over Eurekaand were also observed optically (Fig. 18).
As mentioned, the RABB CADI observed somepatches soon after they formed near the cusp (before2030 UT). At 2015 UT, a full ionogram (not shown) wastaken when the patch E was overhead. It showed almostthe same foF2 value (electron density) as that of thepatch H over Resolute Bay (Fig. 19) suggesting that thepatches were fully formed in the cusp. Also, there is apossibility that the electron precipitation associated withFLRs contributed to patches. However, as furtherdiscussed in Sect. 4.3, the electron precipitation aloneis not su�cient to build up enough of the patchionization relative to the background. In fact, lookingat quiet days (November 30 and December 4) themaximum ionization density at RABB between 2000and 2100 UT would correspond to fxF2 of 8±9 MHzwhich is not too di�erent from the 9.4-MHz maximumshown for patch E overhead at Rabbit Lake at 2015 UT.Therefore, a combination of a small enhancement due toauroral precipitation on top of the solar EUV ionizationand redistribution of the plasma into enhancements anddepletions by means of ionospheric currents couldexplain the patches. Further evidence for restructuringis that the ionization between patches was much lowerthan quiet day values thus indicating that it had beendepleted (see Sect. 4.3). For example, at 2100 UT the
Resolute Bay CADI ionogram showed an F-region peakdensity corresponding to about 6 MHz at the edge of apatch and 4 MHz in the overhead trough.
The peak electron densities of nearly 1012 m)3 (factor�5 above the background/trough density) are similar toprevious measurements (Weber et al., 1984; Buchau andReinisch, 1991; Rosenberg et al., 1993; Fukui et al.,1994; Rodger et al., 1994a; Nishino et al., 1998).However, the patches, particularly those observed after2000 UT, were distinctly bandlike in appearance.
3.10 The spatial extent of bands/patches
At 1750 UT, the riometer absorption enhancementsextended from BACK to FSMI and just before 1800 UTeven farther to DAWS (>3 h of local time). In theBARS FoV the absorption enhancements were associ-ated with irregularity bands. The observed F-regionpatches were more irregular than those observed after2000 UT (see Sect. 3.7). Also, the optical patches inEureka were structured and distorted (likely a result ofthe large amplitude IMF By-component oscillationa�ecting the polar cap convection).
Figures 14 and 16 show several examples when the E-and F-region radar (BARS and SuperDARN) back-scatter bands were joined into one structure extended inazimuth and altitude. The CADI observations in Res-olute Bay and Eureka indicated that, as the bandsturned eastward, they were extended poleward even
Fig. 19. The Resolute Bay CADI iono-grams of polar cap patches and troughsbetween patches
P. Prikryl et al.: Observations of polar patches generated by solar wind Alfve n waves 483

farther than observed with the SuperDARN radars.Furthermore, the F-region patches were imaged (630-nm emission) from Eureka (Fig. 18).
Combining all these observations one can concludethat some of the bands/patches were extended over �3 hof local time and/or 2500 km in observed length. Thewidths of the backscatter bands were mostly between100 and 200 km except for the strongest band H which,at one time, may have been over 300 km wide in the Fregion (Fig. 14a). The widths of the optical and densitypatches were similar and the separations betweenneighboring patches were between 200 to 300 km.
4 Discussion
4.1 Dayside poleward moving auroral forms
Dayside poleward moving auroral forms (PMAFs) arefrequently observed near the auroral oval aroundmagnetic local noon (see e.g. Sandholt et al., 1990;Fasel, 1995, and references therein). The arcs appearnear the equatorial edge of the auroral oval with arepetition rate ranging from a few to several minutes,drift poleward spanning about two degrees of latitudeand then usually brighten and/or disappear. Vorobjevet al. (1975) were ®rst to suggest that these events are themanifestations of the transfer of magnetic ®eld linesfrom the dayside to the nightside, which are now calledFTEs. A statistical study by Fasel (1995) found that thePMAFs have a mean lifetime of 5 min and that themean time between successive PMAFs is 6 min. SuchPMAF recurring rates, similar to Pc5 periodicities, werealso found by Lockwood et al. (1989) and Sandholt et al.(1990) who called the events dayside auroral break upevents or simply cusp/cleft auroral activity (Sandholtet al., 1994). McHarg and Olson (1992) correlated suchevents with the ULF wave activity and Leontyev et al.(1992) showed magnetometer data for one of their``PMAF'' events but did not discuss the associated Pc5pulsations that can clearly be identi®ed in their Fig. 5.Lockwood et al. (1989) found that the mean repetitionperiod of the ionospheric ¯ow and auroral burst eventsis about 8.5 min when the IMF is continuously andstrongly southward. They suggested that transientmomentum exchange between the magnetosheath andthe ionosphere occurs quasi-periodically with a meanperiod similar to that of FTE occurrence rate at themagnetopause. More recently, éieroset et al. (1997)studied signatures of pulsed magnetopause reconnectionthat included PMAFs during IMF By > 0 conditions.The PMAFs events recurred every 5±8 min and wereassociated with poleward-progressing geomagnetic dis-turbances. Just equatorward of PMAFs, short period(2±4 min) pulsations were observed.
While there were no optical data during the daytimeevent presented here, the similarities of the radar andriometer signatures (near cleft/cusp locations, recurrencerates, lifetimes, and drift velocities) with those ofPMAFs are rather suggestive of poleward driftingauroral forms associated with FLRs (Figs. 6a, 8d).
The BARS radar signatures alone (backscatter structureand the Doppler spectra) combined with riometerobservations provide strong evidence for the presenceof auroral arcs. Even the more subtle details of themotions observed in the radar backscatter agree with theresults by Sandholt et al. (1990) and Fasel (1995). Theseauthors described two phases of PMAF evolution. Inphase I, the PMAF tends to elongate in the east-westdimension and rapidly moves westward while progress-ing poleward (Fasel, 1995). During phase II, the PMAFjust moves poleward and the optical intensities fades.The BARS radar backscatter exhibited very similarsignatures. Shortly after the bands appeared, some ofthem showed a westward moving intensi®cation alongthe band. Later the bands just drifted poleward andfaded away. Another feature of PMAFs reported byFasel et al. (1992) is multiple brightenings of a PMAF.The Nipawin radar backscatter power (Figs. 6a, 8b)indicated that some bands (e.g., f, g, and h) showedseveral intensi®cations as they progressed poleward. Amultiple ¯aring of poleward drifting arcs and possiblyeven splitting of such arcs due to higher FLR frequen-cies that were mentioned (Sect. 3.5) could explain thecomplex riometer signature (Fig. 8).
4.2 A link between Pc5 FLRsand dayside magnetic reconnection
The phenomena (PMAFs, DPY currents, FCEs, andpolar patches) that we discussed already have beenlinked to the process of dayside magnetopause magneticreconnection, which often appears to be pulsed. In paper1, it was shown that compressional MHD waves in thesolar wind modulated the magnetic reconnection intopulses, but it was suggested that FLRs might play a role.Similarly, the present results show that FCEs, DPYcurrents and FLRs can be driven by Alfve n waves in thesolar wind. In particular, the dawn-dusk component ofthe electric ®eld of the Alfve n wave was closelycorrelated with the poleward-progressing radar back-scatter bands associated with FCEs and patches. Thecross-correlation analysis and similarity of power spec-tra between the solar-wind By, Ey and ground/iono-spheric data show evidence of an external driver of theobserved FLRs and FCEs. We have already mentionedthat, although the Alfve nic ¯uctuations are non-com-pressive, they can generate dynamic pressure pulsesdownstream of the bow shock (Lin et al., 1996). Thelatter authors suggested that the interaction between thesolar wind Alfve n waves with the bow shock generatesAlfve n waves and large-amplitude pressure pulses in themagnetosheath. Both can play an important role in thecoupling process at the magnetopause. While there wasno magnetosheath data available on December 2, 1993,time lags of a few minutes or less (Sect. 3.4) that wereobserved between the solar wind IMF ¯uctuations andauroral (subcusp) ground/ionospheric pulsations sug-gest propagation of solar-wind generated disturbancesfrom the subsolar magnetopause to the resonant L shellsvia the fast compressional mode which would then
484 P. Prikryl et al.: Observations of polar patches generated by solar wind Alfve n waves

couple to the shear mode driving the resonance. Also, asdiscussed in paper 1, it is suggested that there is apossibility of a reverse feedback from the resonatingmagnetic shells near the magnetopause to the reconnec-tion region at the magnetopause (Fig. 1). While themagnetospheric magnetic ®eld oscillations (due toFLRs) were predominantly in the azimuthal directionthey contained a signi®cant radial component as well.The amplitudes of the magnetic oscillations on theground that were discussed in Sect. 3.5 exceeded 100 nTin the X component (corresponding to the azimuthalmagnetic ®eld oscillation in the magnetosphere) butreached up to 50 nT in the Y component (correspondingto the radial magnetic ®eld oscillation in the magneto-sphere). Thus the electric ®eld component of a resonantAlfve n wave on the outermost closed magnetic ¯uxtubes (see also paper 1) could have modulated themagnitude of the electric ®eld along the reconnectionline, i.e., the reconnection rate.
4.3 Patch formation
The polar patches have been found to break o� from thecusp region shortly after quasiperiodic FCEs (Rodgeret al., 1994a) and drift poleward in trains (series ofpatches separated by a few hundred kilometers) (Foster,1993; Rosenberg et al., 1993; Nishino et al., 1998).Lockwood et al. (1993) observed the ionosphericsignatures of pulsed FTEs and suggested the role oflow-energy precipitation in the polar patch formation.
The observations we present showed that polarpatches were associated with Pc5 irregularity bandsand the bulk of the ionization forming the patch had itsorigin in the dayside auroral oval which includes boththe solar photoionization and auroral precipitation. Wesuggest that FLR associated precipitation in auroralarcs (PMAFs) drifting into the cusp region, combinedwith the cusp precipitation and density depletions inregions of strong electric ®eld, can build up signi®cantabsolute and/or relative densities in addition to thosecaused by solar EUV ionization. Weber et al. (1984)proposed the possibility of ``spatial resonance'', wherethe plasma and the particle source convect together atthe same velocity, thus exposing a ¯ux tube to particle¯uxes for several minutes. The coupling of the solarwind Alfve n waves during a period of Bz < 0 couldprovide such a mechanism if the background antisun-ward convection becomes comparable to the drift speedof the FLR imposed ¯ow/precipitation pattern. Theauroral plasma is then restructured into enhancementsand depletions by means of ionospheric currents andenhanced recombination in the F region. Even if theauroral precipitation does not signi®cantly increase theabsolute values of the F-region density, the arcs arelikely to be associated with latitudinally narrow, ®eld-aligned auroral density depletions formed by verticalevacuation in the downward FACs adjacent to an arc(Opgenoorth et al., 1990) which could then lead togreater di�erences between patch and trough densities.Electron density depletions were observed to be associ-
ated with regions of enhanced perpendicular electric®elds adjacent to auroral arcs (Opgenoorth et al., 1990).Such density depletions would create the steep densitygradients which are required for generation of theionospheric irregularities associated with patches(Crowley, 1996). If auroral forms drifting across thecusp are signatures of FTEs (Sandholt et al., 1990), theresulting precipitation and associated density depletionswould further enhance the absolute and relative densi-ties (gradients) in patches that are formed in the cusp.Signatures of magnetopause reconnection in the spatialdistribution of ionospheric densities observed usingionospheric tomography have been identi®ed and relat-ed to optical aurora (Walker et al., 1998). Also, it wasshown that the plasma density can be depleted byenhanced O+ recombination in the F region (Valladareset al., 1994) and/or by vertical evacuation of electrons ina strong downward FAC (Doe and Vickrey, 1995).These processes would increase the relative density inthe patch with respect to the electron density troughformed within the ¯ow channel adjacent to the patch.Incoherent scatter radar measurements (Doe et al.,1993) demonstrated that auroral ionospheric cavities(AICs) with depletions of the F-region densities by 40%or more can occur on time scales as short as 4 min.Valladares et al. (1994; see their Figs. 4b, 5b) presentedSondrestrom incoherent scatter radar data whichshowed density structures resembling auroral arcsbeing drawn into the cusp footprint prior to the onsettime of the fast plasma jet which they associated withenhanced ion temperature and O+ recombination rate.These poleward-progressing local density enhancements(�5 ´ 1011 m)3) that were a few hundred kilometersapart in the north-south direction of the elevation scanswere most likely produced by auroral arcs. The F-regiondensity enhancements that can be inferred from theelevation scans range up to 50%. Similar F-regiondensity enhancements (associated with riometerabsorptions) in series of plasma patches drifting fromthe cusp to the polar cap were observed by EISCATincoherent scatter radar (Nishino et al., 1998).
In general agreement with the conclusions by Lock-wood et al. (1993), we suggest that patches observed onDecember 2, 1993 were generated by FTEs during timesof southward IMF. It appears that the magneticreconnection at the dayside magnetopause was pulsedby the dawn-dusk component of the electric ®eldassociated with an Alfve n wave in the solar wind andpossibly also by the electric ®eld associated with thesolar-wind-driven FLR in the magnetic shell adjacent tothe magnetopause. The patches were a by-product ofthis coupling process. The FLR driven arcs and/orassociated density structure of remanent F-region den-sity enhancements/depletions convected into the iono-spheric cusp where the plasma was reformed by cuspprecipitation and FCEs producing even more pro-nounced density enhancements/depletions. This processwould eliminate some while it may reinforce other partsof the short period FLR structure that was imposed onthe ionosphere prior to the entry to the cusp. Forexample, during the ®rst event presented here (1800±
P. Prikryl et al.: Observations of polar patches generated by solar wind Alfve n waves 485

1830 UT), the reconnection associated ¯ows in the cuspwere modulated by low frequencies (1±2 mHz), thusreshaping the FLR imposed high frequency (4±5 mHz)structure into patches that were more irregular. After1930 UT, patches were produced by a (more harmoni-ous) combined action of 1- and 2 mHz FLR/FCEmodulation of ¯ows and densities near the cusp whichresulted in patches that were identi®ed with individual¯ow bursts and FLR backscatter bands.
We have associated the patch formation with pole-ward-progressing DPY currents (Hall currents associat-ed with FCEs). A large statistical data base of DPYcurrent observations was accumulated by Stauning et al.(1994). The longitudinal and latitudinal extents of theDPY Hall currents that are most intense in the regionbetween the downward and upward ®eld-aligned currentsheets are comparable with the observed separationsbetween the patches. The horizontal electric ®eldsassociated with the convection enhancements (FCEs)result in the E-region electron heating which can explainthe radio wave absorption near the cusp (Stauning et al.,1995). A gradual fading of DPY currents as theytraverse the dayside polar cap could explain the riometerabsorption associated with polar patches (Rosenberget al., 1993). The absence of DPY events for northwardIMF is consistent with the absence of patches duringsuch periods (Rodger et al., 1994a). If the link betweenthe poleward-progressing DPY currents and polarpatches is con®rmed, this mechanism of patch formationcould be identi®ed as a dominant source of patches,considering the abundance of the By-modulated DPYevents (Stauning et al., 1994).
We have referred to several possible sources ofionization and/or mechanisms for patch formation.Now we brie¯y summarize their relative importance.The electron density given by the International ReferenceIonosphere (IRI) 1990 model for an altitude of 250 kmabove Gillam at 2000 UT near solar minimum (meansunspot number 60) is 7 ´ 1011 m)3 and drops to4 ´ 1011 m)3 at 400 km. With the cusp and auroraloval sunlit the solar EUV ionization is the main sourceof the large background density onto which auroral andcusp ionization is superposed (Roble and Rees, 1977).Sojka and Schunk (1986) considered the e�ect ofdiscrete auroral precipitation on the density pro®leand found large density enhancements (see their Fig. 3)within a few minutes of a plasma ¯ux tube entering aregion of auroral precipitation.
Another mechanism we consider is redistribution ofionization by currents. To estimate the electron densitieswe assume an electric ®eld �50 mV/m and a standardvalue for ion mobility of 50 (MKS units) at an altitudeof 250 km. From BARS data showing bands associatedwith FCEs, we estimated the wavelength of the electric®eld variation to be �150 km (2 cycles in 300 km). Also,we assume that it takes �15 min for the bands totraverse a 300-km wide cusp. The corresponding driftvelocity is consistent with the poleward drift velocityinferred from the BARS backscatter (see Sect. 3.7) andin good agreement with the mean drift velocity(�350 m/s) measured by CADI in RABB just before
2030 UT. Then the relative plasma ``relocation'' bycurrents can be estimated from the charge continuityequation to be �10%. This is comparable to the auroralprecipitation, because it would cause both an enhance-ment and a depletion of density (i.e., relative enhance-ment of 20%). Doe et al. (1995) modeled the formationof auroral ionospheric cavities (AICs), showing thatFACs are very e�cient at modifying the polar iono-sphere. They showed that moderate downward FACs(0.2 lA m)2) can create a 40% depletion in time scalesof 30 s, while di�usion and chemistry operate on longertime scales (hundreds of seconds). These authorssuggested that ``cavities are created by closure ofdownward magnetospheric ®eld-aligned currents andthat AIC-arc pairs are the imprint of an oppositelydirected pair of FACs''. This mechanism of densitydepletion appears to be directly applicable to FLRswhich are associated with a pair of oscillatory FACs.Similarly, the signature of an FTE footprint (FCE)implies oppositely directed FACs (Southwood et al.,1988). While the horizontal dimensions of FCEs areabout one order of magnitude larger than those of theAICs modeled by Doe et al. (1995), the latter authorsshowed that the narrow and fast-growing depletionregions can grow to larger widths by allowing more timeto build them up.
5 Conclusions
Elongated ionization patches were observed with CADIionosondes and an all-sky imager in the polar cap.SuperDARN (HF) and BARS (VHF) radars, along withthe CANOPUS magnetometers and riometers, wereused to trace the origin of polar patches to theionospheric regions near and just equatorward of thecusp footprint during a period of southward IMF.Ionospheric and ground signatures of intense couplingbetween the solar wind Alfve n waves (identi®ed in theIMP-8 magnetic ®eld and plasma data) and the daysidemagnetosphere were observed. These signatures includ-ed ¯ow channel events (FCEs), poleward-progressingDPY currents, and ®eld line resonances (FLRs) thatwere manifested by poleward-progressing ground mag-netic perturbations, riometer absorptions and radarbackscatter bands. It is suggested that the FLRs wereassociated with precipitation (poleward moving auroralforms, PMAFs). The cross-correlation of the groundand ionospheric data with the IMF By showed evidencethat these Pc5 pulsations were driven by Alfve nicoscillations in the solar wind. In particular, FLRs weredriven by the IMF-By oscillations, as were DPY currentsin and poleward of the cusp. Near the cusp, thepoleward-progressing backscatter bands were associatedwith FCEs and were closely correlated with the dawn-dusk component of the inferred solar wind electric ®eld,which is expected to modulate the reconnection rate atthe subsolar magnetopause. Polar patches were a by-product of the coupling process which could haveincluded compressional oscillations generated by the
486 P. Prikryl et al.: Observations of polar patches generated by solar wind Alfve n waves

solar wind Alfve n waves downstream of the bow shockin the magnetosheath.
The F-region ionosphere, pre-structured by FLRs(auroral precipitation, density depletions and gradients),was segmented into polar patches by FCEs carving outelectron depletions while the soft cusp precipitationinferred from the riometer data augmented the densityof the patch formed poleward (IMF By > 0) of the ¯owchannel. Also, as previously reported, it is likely that theF-region O+ recombination loss associated with theenhanced ¯ows further depleted the trough densitiesbetween patches. The density patches which werestructured by irregularities produced by density gradi-ents at the equatorward edge of the patches had a largelongitudinal extent spanning �3 h of local time(�2500 km) but were only �200 km wide. It is con-cluded that the solar EUV ionization, signi®cantlyaugmented by the auroral/cusp ionization and pre-structured by FLRs, was reformed into bandlike patchesby FCEs redistributing the ionization into enhance-ments and depletions by means of ionospheric/®eldaligned currents, while the ®eld lines were being recon-nected to the IMF and convected into the polar cap.
Acknowledgements. The CANOPUS program is a project of theCanadian Space Agency. The CADI and polar camera installationsand operations were funded by the Canadian Network of SpaceResearch. The Kapuskasing radar is supported by NASA GrantNAG5-1099. The Saskatoon radar is funded by an NSERC CSPGrant. We acknowledge the contributions by A. Lazarus (MIT)and R. Lepping (NASA, Goddard Space Flight Center) who madeavailable the IMP-8 data and by F. Rich (Phillips Laboratory,Hanscom Air Force Base) who provided us with DMSP satellitedata and helped with their interpretation. We gratefully acknowl-edge use of the Arctic Stratospheric Ozone Laboratory (Eureka,NWT), a facility of Environment Canada's Atmospheric Environ-ment Service, and instrument operation support provided by theUniversity of Saskatchewan. The FLR analysis software forSuperDARN data was provided by F. Fenrich (University ofAlberta). A. McNamara and D. Wallis (National Research Councilof Canada) assisted us in evaluation of the BARS and riometerdata, respectively. We also bene®ted from discussions with D.McDiarmid, T. Hughes, G. James, R. Jenkins, A. Rodger,J. Samson, A.D.M. Walker, and C.W.S. Ziesolleck.
Topical Editor K.-H. Glassmeier thanks W. Lotko and anotherreferee for their help in evaluating this paper.
References
Anderson, D. N., J. Buchau, and R. A. Heelis, Origin of densityenhancements in the winter polar cap ionosphere, Radio Sci.,23, 513±519, 1988.
Andre , D., A. G. McNamara, D. D. Wallis, B. A. McIntosh, T. J.Hughes, G. J. Sofko, J. A. Koehler, D. R. McDiarmid, P.Prikryl, and J. Watermann, Diurnal radio aurora variations at50 MHz measured by the Bistatic Auroral Radar Systemradars, J. Geophys. Res., 93, 8651±8661, 1988.
Baker, K. B., J. R. Dudeney, R. A. Greenwald, M. Pinnock, P. T.Newell, A. S. Rodger, N. Mattin, and C.-I. Meng, HF radarsignatures of the cusp and low-latitude boundary layer, J. Geo-phys. Res., 100, 7671±7695, 1995.
Banks, P. M., T. Araki, C. R. Clauer, J.-P. St-Maurice, and J. C.Foster, The interplanetary electric ®eld, cleft currents, andplasma convection in the polar caps, Planet. Space Sci., 32,1551±1557, 1984.
Basu, S., Su. Basu, P. K. Chaturvedi, and C. M. Bryant, Jr.,Irregularity structures in the cusp/cleft and polar cap regions,Radio Sci., 29, 195±207, 1994.
Belcher, J. W., and L. Davis, Jr., Large-amplitude Alfve n waves inthe interplanetary medium, 2, J. Geophys. Res., 76, 3534±3563,1971.
Buchau, J., and B. W. Reinisch, Electron density structures in thepolar F region, Adv. Space Res., 11(10), 29, 1991.
Buchau, J., B. W. Reinisch, E. J. Weber, and J. G. Moore, Structureand dynamics of the winter polar cap F region, Radio Sci., 18,995±1010, 1983.
Buchau, J., E. J. Weber, D. N. Anderson, H. C. Carlson, Jr., J. G.Moore, B. W. Reinisch, and R. C. Livingston, Ionosphericstructures in the polar cap: their origin and relation to 250-MHzscintillation, Radio Sci., 20, 325±338, 1985.
Chen, L., and A. Hasegawa, A theory of long-period magneticpulsations, 1, steady state excitation of ®eld line resonance,J. Geophys. Res., 79, 1024±1032, 1974.
Clauer, C. R., and P. M. Banks, Relationship of the interplanetaryelectric ®eld to the high-latitude ionospheric electric ®eld andcurrents: observations and model simulation, J. Geophys. Res.,91, 6959±6971, 1986.
Clauer, C. R., P. M. Banks, A. Q. Smith, T. S. Jorgensen, E. Friis-Christensen, S. Vennerstrom, V. B. Wickwar, J. D. Kelly, andJ. Doupnik, Observation of interplanetary magnetic ®eld and ofionospheric plasma convection in the vicinity of the daysidepolar cleft, Geophys. Res. Lett., 1, 891±894, 1984.
Clauer, C. R., P. Stauning, T. J. Rosenberg, E. Friis-Christensen, P.M. Miller, and R. J. Sitar, Observations of a solar-wind-drivenmodulations of the dayside ionospheric DPY current system,J. Geophys. Res., 100, 7697±7713, 1995.
Cowley, S. W. H., and M. Lockwood, Excitation and decay ofsolar-wind driven ¯ows in the magnetosphere-ionosphere sys-tem, Annales Geophysicae, 10, 103±115, 1992.
Cowley, S. W. H., J. P. Morelli, and M. Lockwood, Dependence ofconvective ¯ows and particle precipitation in the high-latitudedayside ionosphere on the X and Y components of theinterplanetary magnetic ®eld, J. Geophys. Res., 96, 5557±5564,1991.
Crooker, N. U., Dayside merging and cusp geometry, J. Geophys.Res., 84, 951±959, 1979.
Crooker, N. U., F. R. To�oletto, and M. S. Gussenhoven, Openingthe cusp, J. Geophys. Res., 98, 263, 1991.
Crowley, G., Critical review of ionospheric patches and blobs, inEd. W. Ross Stone Review of Radio Science 1993±1996, OxfordUniversity Press, New York, pp. 619±648, 1996.
Doe, R. A. and J. F. Vickrey, Electrodynamic model for theformation of auroral ionospheric cavities, J. Geophys. Res., 100,9683±9696, 1995.
Doe, R. A., M. Mendillo, J. F. Vickrey, L. Zanetti, and R. Eastes,Observations of nightside auroral cavities, J. Geophys. Res., 98,263, 1993.
Fair®eld, D. H., Average and unusual locations of the Earth'smagnetopause and bow shock, J. Geophys. Res., 76, 6700±6716,1971.
Farley D. T., and B. G. Fejer, The e�ect of the gradient drift termon the type 1 electrojet irregularities, J. Geophys. Res., 80, 3087±3090, 1975.
Fasel, G. J., Dayside poleward moving auroral forms: a statisticalstudy, J. Geophys. Res., 100, 11891±11905, 1995.
Fasel, G. J., J. I. Minow, R. W. Smith, C. S. Deehr, and L. C. Lee,Multiple brightenings of transient dayside auroral forms duringoval expansions, Geophys. Res. Lett., 12, 2429±2432, 1992.
Fenrich, F. R., J. C. Samson, G. Sofko, and R. A. Greenwald, ULFhigh and low-m ®eld line resonances observed with Super-DARN, J. Geophys. Res., 100, 21535±21547, 1995.
Foster, J. C., Storm time plasma transport at middle and highlatitudes, J. Geophys. Res., 98, 1675±1689, 1993.
Foster, J. C., and J. R. Doupnik, Plasma convection in the vicinityof the dayside cleft, J. Geophys. Res., 89, 9107±9113, 1984.
P. Prikryl et al.: Observations of polar patches generated by solar wind Alfve n waves 487
Fukui, K., J. Buchau, and C. E. Valladares, Convection of polar cappatches observed at Qaanaaq, Greenland, during the winter1989±1990, Radio Sci., 29, 231±248, 1994.
Friis-Christensen, E., and J. Wilhjelm, Polar cap currents fordi�erent directions of the interplanetary magnetic ®eld in the Y-Z plane, J. Geophys. Res., 80, 1248±1260, 1975.
Grant, I. F., J. W. MacDougall, J. M. Ruohoniemi, W. A. Bristow,G. J. Sofko, J. A. Koehler, D. Danskin, and D. Andre ,Comparison of plasma ¯ow velocities determined by theionosonde Doppler drift technique, SuperDARN radars, andpatch motion, Radio Sci., 30, 1537±1549, 1995.
Greenwald, R. A., K. B. Baker, J. M. Ruohoniemi, J. R. Dudeney,M. Pinnock, N. Mattin, J. M. Leonard, and R. P. Lepping,Simultaneous conjugate observations of dynamic variations inhigh-latitude dayside convection due to changes in IMF By,J. Geophys. Res., 95, 8057±8072, 1990.
Greenwald, R. A., K. B. Baker, J. R. Dudeney, M. Pinnock, T. B.Jones, E. C. Thomas, J.-C. Villain, J.-C. Cerrisier, C. Senior, C.Hanuise, R. D. Hunsucker, G. Sofko, J. Koehler, E. Nielsen, R.Pellinen, A. D. M. Walker, N. Sato, and H. Yamagishi, DARN/SUPERDARN: a global view of the dynamics of high-latitudeconvection, Space Sci. Rev., 71, 761±796, 1995.
Hall, G., D. R. Moorcroft, L. L. Cogger, and D. Andre , Spatialrelationship between large aspect angle VHF radio aurora and557.7-nm emission: evidence from refraction, J. Geophys. Res.,95, 15281±15288, 1990.
Hassam, A. B., Transmission of Alfve n waves through the earth'sbow shock: theory and observation, J. Geophys. Res., 83, 643±653, 1978.
Hughes, T. J., and G. Rostoker, Current ¯ow in the magnetosphereand ionosphere during periods of moderate activity, J. Geophys.Res., 82, 2271±2282, 1977.
Hughes, W. J., and D. J. Southwood, The screening of micropul-sation signals by the atmosphere and ionosphere, J. Geophys.Res., 81, 3234±3240, 1976a.
Hughes, W. J., and D. J. Southwood, An illustration of modi®ca-tion of geomagnetic pulsation structure by the ionosphere,J. Geophys. Res., 81, 3241±3247, 1976b.
International Reference Ionosphere 1990, URSI/COSPAR, Nation-al Space Science Data Center/World Data Center A for Rocketsand Satellites, Rep. 90-22, 1990.
Lin, Y., L. C. Lee, and M. Yan, Generation of dynamic pressurepulses downstream of the bow shock by variations in theinterplanetary magnetic ®eld orientation, J. Geophys. Res., 101,479±493, 1996.
Leontyev, S. V., G. V. Starkov, V. G. Vorobjev, V. L. Zverev, and Y.I. Feldstein, Dayside aurorae and their relation to othergeophysical phenomena, Planet. Space Sci., 40, 621±639,1992.
Lockwood, M., The case for transient magnetopause reconnection,Eos, Trans., 77, 246±250, 1996.
Lockwood, M., and H. C. Carlson, Jr., Production of polar capelectron density patches by transient magnetopause reconnec-tion, Geophys. Res. Lett., 19, 1731±1734, 1992.
Lockwood, M., P. E. Sandholt, S. W. H. Cowley, and T. Oguti,Interplanetary magnetic ®eld control of dayside auroral activityand the transfer of momentum across the dayside magneto-pause, Planet. Space Sci., 67, 1347±1365, 1989.
Lockwood, M., W. F. Denig, A. D. Farmer, V. N. Davda, S. W. H.Cowley, and H. Luhr, Ionospheric signatures of pulsed reconnec-tion at the Earth's magnetopause, Nature, 361, 424±428, 1993.
MacDougall, J. W., I. F. Grant, and X. Shen, The CanadianAdvanced Digital Ionosonde: design and results, in ``ReportUAG-14: Ionospheric Networks and Stations'', World DataCenter A for Solar-Terrestrial Physics, 21, 1995.
McHarg, M. G., and J. V. Olson, Correlated optical and ULFmagnetic observations of the winter cusp ± boundary layersystem, Geophys. Res. Lett., 19, 817±820, 1992.
McKenzie, J. F., and K. O. Westphal, Transmission of Alfve nwaves through the Earth's bow shock, Planet. Space Sci., 17,1029±1037, 1969.
McNamara, A. G., D. R. McDiarmid, G. J. Sofko, J. A. Koehler, P.A. Forsyth, and D. R. Moorcroft, BARS ± a dual bistatic auroralradar system for the study of electric ®elds in the Canadiansector of the auroral zone, Adv. Space Res., 2, 145±148, 1983.
Newell, P. T. and Ch. -I. Meng, Ionospheric projections ofmagnetospheric regions under low and high solar wind pressureconditions, J. Geophys. Res., 99, 273±286, 1994.
Newell, P. T., D. G. Sibeck, and Ch.-I. Meng, Penetration of theinterplanetary magnetic ®eld By and magnetosheath plasmainto the magnetosphere: implications for the predominantmagnetopause merging site, J. Geophys. Res., 100, 235±243,1995.
Nielsen, E., and K. Schlegel, Coherent radar Doppler measure-ments and their relationship to the ionospheric electron driftvelocity, J. Geophys. Res., 90, 3498±3504, 1985.
Nishino, M., S. Nozawa, and J. A. Holtet, Daytime ionosphericabsorption features in the polar cap associated with polewarddrifting F-region plasma patches, Earth Planet. Space, 50, 107±117, 1998.
Opgenoorth, H. J., I. Haggstrom, P. J. S. Williams, and G. O. L.Jones,Regions of strongly enhanced perpendicular electric ®eldsadjacent to auroral arcs, J. Atmos. Terr. Phys., 52, 449±458, 1990.
éieroset, M., P. E. Sandholt, H. LuÈ hr, W. F. Denig, and T.Moretto, Auroral and geomagnetic events at cusp/mantlelatitudes in the prenoon sector during positive IMF By
conditions: Signatures of pulsed magnetopause reconnection,J. Geophys. Res., 102, 7191±7205, 1997.
Pinnock, M., A. S. Rodger, J. R. Dudeney, K. B. Baker, P. T.Newell, R. A. Greenwald, and M. E. Greenspan, Observations ofan enhanced convection channel in the cusp ionosphere,J. Geophys. Res., 98, 3767±3776, 1993.
Pinnock, M., A. S. Rodger, and K. B. Berkey, High-latitude F-region electron concentration measurements near noon ± a casestudy, J. Geophys. Res., 100, 7723±7729, 1995a.
Pinnock, M., A. S. Rodger, J. R. Dudeney, F. Rich, and K. B. Baker,High spatial and temporal resolution observations of theionospheric cusp, Annales Geophysicae, 13, 919±925, 1995b.
Prikryl, P., and L. L. Cogger, Statistical analysis of the spatialrelationship between the radio and optical aurora: furtherevidence for refraction, Radio Sci., 27, 469±479, 1992.
Prikryl, P., G. J. Sofko, J. A. Koehler, J. Mu, and D. Andre , Steepelectron density gradients associated with discrete auroraeexplaining the diversity of auroral VHF doppler spectra,Annales Geophysicae, 13, 25±37, 1995.
Prikryl, P., R. A. Greenwald, G. J. Sofko, J. P. Villain, C. W. S.Ziesolleck, and E. Friis-Christensen, Solar-wind-driven pulsedmagnetic reconnection at the dayside magnetopause, Pc5compressional oscillations and ®eld line resonances, J. Geophys.Res., 103, 17 307±17 322, 1998.
Roble, R. G., and M. H. Rees, Time-dependent studies of theaurora: e�ects of particle precipitation on the dynamic mor-phology of ionospheric and atmospheric properties, Planet.Space. Sci., 25, 991±1010, 1977.
Rodger, A. S., and A. C. Graham, Diurnal and seasonal occurrenceof polar patches, Annales Geophysicae, 14, 533±537, 1996.
Rodger, A. S., M. Pinnock, J. R. Dudeney, K. B. Baker, and R. A.Greenwald, A new mechanism for polar patch formation,J. Geophys. Res., 99, 6425±6436, 1994a.
Rodger, A. S., M. Pinnock, J. R. Dudeney, J. Watermann, O. de laBeaujardiere, and K. B. Baker, Simultaneous two hemisphereobservations of the presence of polar patches in the nightsideionosphere, Annales Geophysicae, 12, 642±648, 1994b.
Roelof, E. C., and D. G. Sibeck, Magnetopause shape as a bivariatefunction of interplanetary magnetic ®eld Bz and solar winddynamic pressure, J. Geophys. Res., 98, 21 421±21 450, 1993.
Rosenberg, T. J., Z. Wang, A. S. Rodger, J. R. Dudeney, and K. B.Baker, Imaging riometer and HF radar measurements ofdrifting F region electron density structures in the polar cap,J. Geophys. Res., 98, 7757±7764, 1993.
Rostoker, G., J. C. Samson, F. Creutzberg, T. J. Hughes, D. R.McDiarmid, A. G. McNamara, A. Vallance Jones, D. D. Wallis,
488 P. Prikryl et al.: Observations of polar patches generated by solar wind Alfve n waves

L. L. Cogger, CANOPUS - a ground-based instrument arrayfor remote sensing the high-latitude ionosphere during theISTP/GGS program, Space Sci. Rev., 71, 743±760, 1995.
Ruohoniemi, J. M., R. A. Greenwald, K. B. Baker, and J. C.Samson, HF radar observations of Pc5 ®eld line resonances inthe midnight/early morning MLT sector, J. Geophys. Res., 96,15 697±15 710, 1991.
Samson, J. C., Pure states, polarized waves, and principalcomponents in the spectra of multiple, geophysical time-series,Geophys. J. R. Astron. Soc., 72, 647±664, 1983a.
Samson, J. C., The reduction of sample-bias in polarizationestimators for multichannel geophysical data with anisotropicnoise, Geophys. J. R. Astron. Soc., 75, 289±308, 1983b.
Samson, J. C., and J. V. Olson, Some comments on the descriptionsof the polarization states of waves, Geophys. J. R. Astron. Soc.,61, 115±129, 1980.
Samson, J. C., R. A. Greenwald, J. M. Ruohoniemi, T. J. Hughes,and D. D. Wallis, Magnetometer and radar observations ofmagnetohydrodynamic cavity modes in the earth's magneto-sphere, Can. J. Phys., 69, 929±937, 1991.
Samson, J. C., B. G. Harrold, J. M. Ruohoniemi, and A. D. M.Walker, Field line resonances associated with MHD waveguidesin the magnetosphere, Geophys. Res. Lett., 19, 441±444, 1992a.
Samson, J. C., D. D. Wallis, T. J. Hughes, F. Creutzberg, J. M.Ruohoniemi, and R. A. Greenwald, Substorm intensi®cationsand ®eld line resonances in the nightside magnetosphere,J. Geophys. Res., 97, 8495±8518, 1992b.
Sandholt, P. E., M. Lockwood, T. Oguti, S. W. H. Cowley, K. S. C.Freeman, B. Lybekk, A. Egeland, and D. M. Willis, Middayauroral breakup events and related energy and momentumtransfer from the magnetosheath, J. Geophys. Res., 95, 1039±1060, 1990.
Sandholt, P. E., C. J. Farrugia, L. F. Burlaga, J. A. Holtet, J.Moen, B. Lybekk, B. Jacobsen, D. Opsvik, A. Egeland, R.Lepping, A. J. Lazarus, T. Hansen, A. Brekke, and C. Friis-Christensen, Cusp/cleft auroral activity in relation to solar winddynamic pressure, interplanetary magnetic ®eld Bz and By,J. Geophys. Res., 99, 17 323±17 342, 1994.
Scholer, M., and J. W. Belcher, The e�ect of Alfve n waves onMHD fast shocks, Solar Phys., 16, 472±483, 1971.
Sibeck, D. G., K. Takahashi, S. Kokubun, T. Mukai, K. W. Ogilvie,and A. Szabo, A case study of oppositely propagating Alfve nic¯uctuations in the solar wind and magnetosheath, Geophys. Res.Lett., 24, 3133±3136, 1997.
Smith, M. F., M. Lockwood, and S. W. H. Cowley, The statisticalcusp: a ¯ux transfer event model, Planet. Space Sci., 40, 1251±1268, 1992.
Sojka, J. J., and R. W. Schunk, A theoretical study of theproduction and decay of localized electron density enhance-ments in the polar ionosphere, J. Geophys. Res., 91, 3245±3253,1986.
Sojka, J. J., M. D. Bowline, R. W. Schunk, D. T. Decker, C. E.Valladares, R. Sheehan, D. N. Anderson, and R. A. Heelis,Modeling polar cap F-region patches using time varyingconvection, Geophys. Res. Lett., 20, 1783±1786, 1993.
Sojka, J. J., M. D. Bowline, and R. W. Schunk, Patches in the polarionosphere: UT and seasonal dependence, J. Geophys. Res., 99,14 959±14 970, 1994.
Southwood, D. J., Some features of ®eld line resonances in themagnetosphere, Planet. Space Sci., 22, 483±491, 1974.
Southwood, D. J., C. J. Farrugia, and M. A. Saunders, What are¯ux transfer events?, Planet. Space Sci., 36, 503±508, 1988.
Stauning, P., E. Friis-Christensen, O. Rasmussen, and S. Vennerst-rom, Progressing polar convection disturbances: signature of aopen magnetosphere, J. Geophys. Res., 99, 11 303±11 317, 1994.
Stauning, P., C. R. Clauer, T. J. Rosenberg, E. Friis-Christensen,and R. Sitar, Observations of solar-wind-driven progression ofinterplanetary magnetic ®eld By-related dayside ionosphericdisturbances, J. Geophys. Res., 100, 7567±7585, 1995.
Steele, D. P., and L. L. Cogger, Polar patches and the ``tongue ofionization'', Radio Sci., 31, 667±677, 1996.
St.-Maurice, J.-P., P. Prikryl, G. J. Sofko, A. Kustov, J. A.Koehler, D. Danskin, A. Hamza, and J. Chen, On the origin ofnarrow non-ion-acoustic coherent radar spectra in the high-latitude E region, J. Geophys. Res., 99, 6447±6474, 1994.
Taguchi, S., M. Sugiura, J. D. Winningham, and J. A. Slavin,Characterization of the IMF By-dependent ®eld-aligned cur-rents in the cleft region based on DE 2 observations, J. Geophys.Res., 98, 1393±1407, 1993.
Tsunoda, R. T., High-latitude Fregion irregularities: a review andsynthesis, Rev. Geophys., 26, 719±760, 1988.
Valladares C. E., S. Basu, J. Buchau, and E. Friis-Christensen,Experimental evidence for the formation and entry of patchesinto the polar cap, Radio Sci., 29, 167±194, 1994.
Valladares C. E., D. T. Decker, R. Sheehan, and D. N. Anderson,Modeling the formation of polar cap patches using large plasma¯ows, Radio Sci., 31, 573±593, 1996.
Vorobjev, V. G., G. Gustafsson, G. V. Starkov, Y. I. Feldstein, andN. F. Shevnina, Dynamics of day and night aurora duringsubstorms, Planet. Space Sci., 23, 269±278, 1975.
Walker, A. D. M., R. A. Greenwald, and K. B. Baker, HF radarobservations of pulsations near the magnetospheric cusp,J. Geophys. Res., 91, 8919±8928, 1986.
Walker, I. K., J. Moen, C. N. Mitchell, L. Kersley, and P. E.Sandholt, Ionospheric e�ects of magnetopause reconnectionobserved using ionospheric tomography, Geophys. Res. Lett.,25, 293±296, 1998.
Watermann, J., Refraction of 50-MHz dara waves in a realisticionospheric model, Radio Sci., 25, 805±812, 1990.
Weber E. J., J. Buchau, J. G. Moore, J. R. Sharber, R. C.Livingston, J. D. Winningham, and B. W. Reinisch, F Layerionization patches in the polar cap, J. Geophys. Res., 89, 1683±1694, 1984.
Weber, E. J., J. A. Klobuchar, J. Buchau, H. C. Carlson, Jr., R. C.Livingston, O. de la Beaujardiere, M. McCready, J.G. Moore,and G. J. Bishop, Polar cap F layer patches: Structure anddynamics, J. Geophys. Res., 91, 12 121±12 129, 1986.
Ziesolleck, C. W. S., and D. R. McDiarmid, Auroral latitude Pc 5®eld line resonances: quantized frequencies, spatial character-istics, and diurnal variation, J. Geophys. Res., 99, 5817±5830,1994.
Ziesolleck, C. W. S., and D. R. McDiarmid, Statistical survey ofauroral latitude Pc5 spectral and polarization characteristics,J. Geophys. Res., 100, 19299±19312, 1995.
P. Prikryl et al.: Observations of polar patches generated by solar wind Alfve n waves 489


![Satellite Observations of Polar Ice Fields [and Discussion]](https://img.pdfslide.net/doc/110x75/61fc8a738d33c02b785e5ede/satellite-observations-of-polar-ice-fields-and-discussion.jpg)

