Embed Size (px)
Citation preview

OBSERVATIONS ON THE RUMINAL PROTEIN DEGRADATION PRODUCTS
AND THE ABSORPTION OF RUMINALLY DERIVED FREE AND PEPTIDE-
BOUND AMINO ACIDS VIA OVINE FORESTOMACH EPITHELIA IN VITRO.
Vajira P. Jayawardena
Dissertation submitted to the Faculty of the
Virginia Polytechnic Institute and State University
in partial fulfillment of the requirement for the degree of
Doctor Of Philosophy
in
Animal Science
K. E. Webb, Jr., Chair
H. Herbein, Jr.
D. M. Denbow
F. W. Thye
A. McElroy
November 10, 2000
Blacksburg, Virginia
Keywords: Protein, Peptides, Amino acids, Rumen, Omasum, Absorption
Copyright 2000, Vajira P. Jayawardena
ii
OBSERVATIONS ON THE RUMINAL PROTEIN DEGRADATION PRODUCTS
AND THE ABSORPTION OF RUMINALLY DERIVED FREE AND PEPTIDE-
BOUND AMINO ACIDS VIA OVINE FORESTOMACH EPITHELIA IN VITRO.
Vajira P. Jayawardena
(ABSTRACT)
Production of ammonia N, α-amino N, and peptide N was investigated following
in vitro ruminal incubation of solvent soybean meal (SBM), dehydrated alfalfa, corn
gluten feed, fish meal, distillers dried grains with solubles (DDG), cotton seed meal,
brewers fried grains, meat and bone meal, blood meal, prolac, and casein (CAS). The
influence of milling procedures on the production of ammonia N, α-amino N, and peptide
N was also evaluated using different batches of soybean meals and distillers dried grains
with solubles. The concentrations of peptide N and ammonia N measured in the cell free
media at 0, 2, 4, 6, and 8 h were increased linearly (P < 0.001) with time. The mean
concentrations of α-amino N were lower (P < 0.05) than the mean concentrations of
peptide N and ammonia N. Production of peptide N, α-amino N, and ammonia N were
varied (P < 0.05, time x protein) between proteins and between batches. Irrespective of
the protein used, the amino acid composition of peptides (<3,000 MW) that appeared at 8
h had specific patterns suggesting differential utilization of peptides by ruminal
microorganisms. Cell-free supernatants obtained following incubation (8 h) of SBM,
CAS, and DDG were used as mucosal substrates in parabiotic chambers to quantify
absorption of free and peptide-bound amino acids via ruminal and omasal epithelia of
sheep. Serosal appearance of amino acids in peptide form was nearly three times higher
(P < 0.001) than free amino acids. On tissue dry weight basis, serosal appearance of
amino acids was greater (P < 0.01) across omasal than via ruminal tissues. There was a
greater serosal appearance of amino acids from CAS than from SBM. Total, total
essential (EAA), total nonessential (NEAA), and individual amino acid appearance in
serosal fluids varied (P < 0.05, amino acid form x protein source) among SBM, CAS, and
DDG. Collectively, these results indicate that the forestomach epithelia of sheep possess
the potential to absorb ruminally derived peptides (relatively large amounts) and free
amino acids (relatively small amounts). Also, the ruminal microbial degradation of

iii
dietary proteins may influence the amounts and types of free and peptide-bound amino
acids absorbed via forestomach.
(Key words: Ammonia, Amino acid, Peptide, Protein, Rumen, Omasum,
Microorganisms)

iv
ACKNOWLEDGEMENTS
I would like to express my sincere gratitude to Dr. K. E. Webb, Jr. for his
professional guidance, inspiration and assistance throughout my graduate training and in
the preparation of this manuscript. Because of his futuristic vision, meticulous effort and
commitment for excellence, my training under him has been much meaningful. Also, I
am very grateful to late Dr. E. T. Kornegay for the friendship and interest showed while
he was serving in my advisory committee. My appreciation is extended to Drs. J. H.
Herbein Jr., D. M. Denbow, F. W. Thye, and A. McElroy for their interest shown to serve
in my committee. Their guidance, assistance, discussions and comments have immensely
contributed towards a successful completion of this study. I am very indebted to the John
Lee Pratt Animal Nutrition Program for the monetary support given to undertake my
graduate program at Virginia Tech. My sincere thanks are also rendered to Dr. V.
Ravindran for his numerous helps, years of friendship and encouragement that helped me
greatly to pursue graduate studies. I am also thankful to Dr. Clint Coakley of the
Department of Statistics, VPI &SU and Drs. M. Dematawewa and L. H. P. Gunaratne of
the University of Peradeniya for their advice on statistical analysis of data. I am very
grateful to Kristine Lee and Donald Shaw for their technical support and friendship. My
sincere thanks should also go to Martha McCollum, Yuanxiang Pan, Hong Chen, and
Cindy Hixon for numerous assistance and friendship. I greatly appreciate Mr. Chuck
Miller and the staff of the Virginia Tech Dairy Center for their valuable support during
ruminal fluid collection. My cordial thanks should also go to Dr. C. Ling of Roanoke
City Mill, Mr. D. Long of Big Spring Mill and Mr. S. Nichols of Southern States Mill for
their cooperation given at the time of collecting protein samples. Finally, I am very
thankful to my wife Monica for her love, understanding, patience and encouragement
added throughout my graduate life.
v
TABLE OF CONTENTS
ABSTRACT ii
ACKNOWLEDGEMENTS iv
LIST OF TABLES viii
LIST OF FIGURES xi
CHAPTER I. INTRODUCTION 1
CHAPTER II. REVIEW OF LITERATURE 3
THE SIGNIFICANCE OF THE RUMINANT FORESTOMACH 3
PROTEIN METABOLISM IN RUMINANTS: 7
CLASSICAL CONCEPTS AND NEW PERSPECTIVES
Dietary Protein Degradation in the Reticulorumen 7
Factors Influencing Microbial Protein Breakdown 12
Methods to Predict Ruminal Protein Degradation 14
Accumulation of Products Following Digestion of Proteins 16
in the Rumen
Mechanisms of Peptide Accumulation in the Forestomach 21
Alternative Sources of Peptides and Amino Acids Added to 24
the Ruminal Digesta
Duodenal Flow of Ruminal Protein Degradation Products 26
ABSORPTION OF PROTEIN DIGESTION PRODUCTS 26
ACROSS THE RUMINANT FORESTOMACH
Ammonia Absorption 26
Amino Acid Transport 27
Evidence on Intact Peptide Absorption 30
Mechanisms of Peptide Absorption 30
Nutritional Importance of Peptide Transport 31
A DESCRIPTION ON PROTEIN INGREDIENTS USED IN 33
THIS STUDY
CHAPTER III. OBJECTIVES 37
CHAPTER IV. OBSERVATIONS ON RUMINAL PROTEIN 38
vi
DEGRADATION PRODUCTS FOLLOWING IN VITRO
INCUBATION WITH MIXED MICROORGANISMS
ABSTRACT 38
INTRODUCTION 39
MATERIALS AND METHODS 39
Preparation of Inoculant Enriched with Mixed 39
Ruminal Microorganisms
In vitro Incubation of Dietary Proteins 40
Chemical Analysis 42
Statistical Analysis 42
RESULTS 43
Changes in Ammonia N Concentration with Time 43
Changes in α-Amino N Concentration with Time 44
Changes in Peptide N Concentration with Time 45
The Amino Acid Composition of Ruminal Protein 46
Degradation Products
DISCUSSION 48
IMPLICATIONS 55
CHAPTER V. ABSORPTION OF RUMINALLY DERIVED 68
PEPTIDES AND FREE AMINO ACIDS VIA ISOLATED
OVINE RUMINAL AND OMASAL EPITHELIA
ABSTRACT 68
INTRODUCTION 69
MATERIALS AND METHODS 69
In vitro Incubation of Dietary Proteins 70
Animals, Feeding and Tissue Collection 70
Buffer Preparation 71
Uptake Measurement 71
Statistical Analysis 72
RESULTS AND DISCUSSION 73
vii
Mucosal Concentrations 73
Serosal Appearances 74
IMPLICATIONS 79
CHAPTER VI. EPILOGUE 83
LITERATURE CITED 87
APPENDIX-A
Preparation of Mixed Ruminal Microbial Culture 111
for Incubation Experiments
APPENDIX-B
Procedure for Amino Acid Uptake Experiment Using 114
Parabiotic Chambers
APPENDIX-C
Statistical Analysis Examples 118
VITA 125

viii
LIST OF TABLES
Table
2.1. RUMINAL DEGRADABILITY ESTIMATES OF SOME SELECTED 9
FEED PROTEINS
4.1. COMPOSITION OF THE BUFFER AND THE NUTRIENT MEDIUM 61
USED FOR INCUBATION EXPERIMENTS
4.2. CRUDE PROTEIN % OF THE PROTEIN SOURCES USED IN THE 62
INCUBATION EXPERIMENTS
4.3 FREE AMINO ACID, PEPTIDE (TOTAL) AMINO ACID, AND 63
PEPTIDE (< 3,000 MW) AMINO ACID CONCENTRATIONS IN
EXTRACELLULAR MEDIA FOLLOWING IN VITRO RUMINAL
INCUBATION (8H) OF DEHYDRATED ALFALFA (DA), SOYBEAN
MEAL (SBM), CORN GLUTEN FEED (CGF), FISH MEAL (FM) AND
DISTILLER DRIED GRAIN WITH SOLUBLES (DDG; EXPERIMENT 1)
4.4. FREE AMINO ACID, PEPTIDE (TOTAL) AMINO ACID, AND 64
PEPTIDE (< 3,000 MW) AMINO ACID CONCENTRATIONS IN
EXTRACELLULAR MEDIA FOLLOWING IN VITRO RUMINAL
INCUBATION (8H) OF COTTON SEED MEAL (CSM), BREWERS
DRIED GRAINS (BDG), PROLAC (PRL), BLOOD MEAL (BLM) AND
MEAT AND BONE MEAL (MBM; EXPERIMENT 2)
4.5. FREE AMINO ACID, PEPTIDE (TOTAL) AMINO ACID, AND 65
PEPTIDE (< 3,000 MW) AMINO ACID CONCENTRATIONS IN
EXTRACELLULAR MEDIA FOLLOWING IN VITRO RUMINAL
INCUBATION (8H) OF EXPELLER SOYBEAN MEAL (ESB) AND
DIFFERENT BATCHES OF SOLVENT SOYBEAN MEALS
ix
(SSR1, SSR2, SSB AND SSS; EXPERIMENT 3)
4.6. FREE AMINO ACID, PEPTIDE (TOTAL) AMINO ACID, AND 66
PEPTIDE (< 3,000 MW) AMINO ACID CONCENTRATIONS IN
EXTRACELLULAR MEDIA FOLLOWING IN VITRO RUMINAL
INCUBATION (8H) OF DIFFERENT BATCHES OF DISTILLERS
DRIED GRAINS WITH SOLUBLES (DGR1, DGR2, DGR3, DGB
AND DGS; EXPERIMENT 4)
4.7. CONCENTRATIONS OF FREE AMINO ACIDS, PEPTIDE (TOTAL) 67
AMINO ACIDS, AND PEPTIDE (< 3,000 MW) AMINO ACIDS
PERSISTED IN THE EXTRACELLULAR MEDIA FOLLOWING
IN VITRO RUMINAL INCUBATION CASEIN (EXPERIMENT 5)
5.1. THE INITIAL CONCENTRATIONS OF FREE, PEPTIDE (TOTAL) 80
AND PEPTIDE (< 3,000 MW) AMINO ACIDS AMONG MUCOSAL
SUBSTRATES PREPARED FROM SOYBEAN MEAL (SBM), CASEIN
(CAS), AND DISTILLERS DRIED GRAINS WITH SOLUBLES (DDG)
5.2. MAIN EFFECT MEANS OF PROTEIN SOURCE, AMINO ACID 81
FORM, AND TISSUE TYPE ON SEROSAL APPEARANCE OF
AMINO ACIDS FOLLOWING 240 MIN OF INCUBATION WITH
SUBSTRATES PREPARED FROM SOYBEAN MEAL (SBM), CASEIN
(CAS), AND DISTILLERS DRIED GRAINS WITH SOLUBLES (DDG)

x
5.3. SEROSAL APPEARANCE OF FREE, PEPTIDE (TOTAL), AND 82
PEPTIDE (< 3,000 MW) AMINO ACIDS VIA RUMINAL AND
OMASAL EPITHELIA INCUBATED FOR 240 MIN WITH
SUBSTRATES PREPARED FROM SOYBEAN MEAL (SBM),
CASEIN, AND DISTILLERS DRIED GRAINS WITH SOLUBLES (DDG)

xi
LIST OF FIGURES
Figure
2.1. THE DIGESTIVE SYSTEM OF A GOAT SHOWING 6
(A) ESOPHAGUS, (B) RETICULUM, (C) RUMEN, (D) OMASUM,
(E) ABOMASUM, (F) SMALL INTESTINE, AND (G) LARGE INTESTINE
2.2. MAJOR PATHWAYS OF N METABOLISM IN THE RUMEN 8
2.3. A SCHEMATIC REPRESENTATION OF THE PROTEIN 22
UTILIZATION BY RUMINAL BACTERIA
4.1. CHANGES IN CONCENTRATION (MG/L) OF (A) AMMONIA N 56
(B) α-AMINO N, AND (C) PEPTIDE N IN THE EXTRACELLULAR
MEDIA DURING IN VITRO RUMINAL INCUBATION OF SOYBEAN
MEAL (SBM), FISH MEAL (FM), DEHYDRATED ALFALFA (DA),
DISTILLERS DRIED GRAINS WITH SOLUBLE MEAL (DDG), AND
CORN GLUTEN FEED (CGF; EXPERIMENT 1)
4.2. CHANGES IN CONCENTRATION (MG/L) OF (A) AMMONIA N, 57
(B) α-AMINO N, AND (C) PEPTIDE N IN THE EXTRACELLULAR
MEDIUM DURING IN VITRO RUMINAL INCUBATION OF COTTON
SEED MEAL (CSM), BREWERS DRIED GRAINS (BDG), PROLAC
(PRL), BLOOD MEAL (BLM), AND MEAT AND BONE MEAL
(MBM; EXPERIMENT 2)
4.3. CHANGES IN CONCENTRATION (MG/L) OF (A) AMMONIA N, 58
(B) α-AMINO N, AND (C) PEPTIDE N IN THE EXTRACELLULAR
MEDIUM DURING IN VITRO RUMINAL INCUBATION OF
EXPELLER EXTRACTED SOYBEAN MEAL (ESB) AND DIFFERENT
BATCHES OF SOLVENT EXTRACTED SOYBEAN MEALS (SSR1, SSR2,
SSB AND SSS; EXPERIMENT 3)
xii
4.4. CHANGES IN CONCENTRATION (MG/L) OF (A) AMMONIA N, 59
(B) α-AMINO N, AND (C) PEPTIDE N IN THE EXTRACELLULAR
MEDIUM DURING IN VITRO RUMINAL INCUBATION OF
DIFFERENT BATCHES OF DISTILLERS DRIED GRAINS WITH
SOLUBLE MEALS (DGR1, DGR2, DGR3, DGB AND DGS;
EXPERIMENT 4)
4.5. CHANGES IN THE CONCENTRATIONS (MG/L) OF AMMONIA N, 60
α-AMINO AMINO N AND PEPTIDE N IN THE EXTRACELLULAR
MEDIUM DURING IN VITRO RUMINAL INCUBATION OF CASEIN
(EXPERIMENT 5)

1
Chapter 1
INTRODUCTION
The complicated gut anatomy, coupled with the massive intervention of
microorganisms in the digestive process, have largely delayed the complete
understanding of amino acid nutrition in ruminants. Sequential breakdown of dietary
proteins into peptides, amino acids and ammonia due to the microbial activity in the
rumen was recognized from very early studies on ruminant protein metabolism (Annison,
1956). It is generally assumed that this process of microbial protein degradation proceeds
very rapidly until ammonia is formed, hence an accumulation of intermediates (peptides
and amino acids) does not occur to any significant level in the rumen. Thus, ruminant
nutritionists frequently discuss the fate of dietary protein N in terms of its conversion to
ammonia, incorporation into microbial proteins, postruminal digestion of microbial and
undegraded dietary proteins and subsequent absorption of amino acids in the intestine
(NRC, 1985).
The existence of an alternative mode of amino acid absorption in ruminants has
been strongly demonstrated through continuous efforts of this laboratory. Peptides as a
major form of amino acid absorption in ruminants was suggested when they constituted a
high proportion (79%) of the total amino acids appearing in the portal circulation of
steers (Koeln et al., 1993). The forestomach as a major site of peptide absorption in
ruminants was hypothesized when a large net flux (approximately 77%) of peptide-bound
amino acids was observed in the plasma of non-mesenteric drained viscera of both
wethers and steers (Webb et al., 1993). Using different techniques, the ability of ruminal
and omasal epithelia to absorb both free and peptide amino acids (Matthews and Webb,
1995), and some understanding on the specific mechanisms involved in this process was
also revealed (Matthews, et al., 1996b; Mc Collum, 1996; Pan et al., 1997). However,
the information on the magnitude and nutritional significance of peptide and amino acid
absorption across the ruminant forestomach is not very well understood.
If peptides and amino acids are to be absorbed from the forestomach, they must
be present in the ruminal digesta. The measurement of peptides in the ruminal fluid has

2
not been of wide interest until recently. Early observations of very low ruminal
concentrations of free amino acids (Annison, 1956), and the small contribution of free
amino acids absorbed by the rumen (Leibholz, 1971a) are the basis for the belief that
amino acid absorption from the rumen is not important. However, an accumulation of
peptides (Chen et al., 1987a) and amino acids (Leibholz, 1969) in the ruminal fluid
following feeding of protein diets have been reported. Accumulation of specific peptides
due to the resistance to ruminal microbial degradation was also revealed (Chen et al.,
1987c; Wallace et al., 1990a). However, the amounts and precise patterns of
accumulation of peptides and amino acids appears to vary with different studies. A
combination of analytical and animal variations could partly be responsible for the above.
But the differences in diet appear to play a major role on the accumulation of these
protein degradation products in the rumen.

3
Chapter II
REVIEW OF LITERATURE
The Significance of the Ruminant Forestomach
The presence of a complex stomach in ruminants marks one of higher stages of
evolutionary development in mammals. The ruminant stomach consists of four major
compartments (rumen, reticulum, omasum, and abomasum) that have similar embryonic
origins as the stomach of nonruminants (Figure 2.1). However, the last compartment
(abomasum) is considered the only structure that is analogous anatomically and
functionally to the glandular stomach of monogastric species. The rumen, reticulum, and
omasum are assumed to be outgrowths of the conventional mammalian stomach, and are
collectively known as the ‘forestomach’ in ruminants.
The ruminant forestomach possesses a variety of functional properties; to serve as
an organ of storage and delayed passage of ingested feed can be considered one of its
basic functions. The large ruminal capacity and the longer retention time of feeds in the
forestomach are two main attributes to achieve this activity. Reticulorumen volumes of
around 60 to 100 L are quite common in cattle (Church, 1960), and the contents of the
forestomach can account for approximately 15 to 20% of the total body weight of
ruminants (Giesecke and VanGylswyk, 1975). The mean retention time of fluid in cattle,
sheep, and goats fed forage diets is approximately 10h. The particles are retained for a
longer time which varies among species, and is approximately 28h for cattle and 20h for
sheep and goats (Lechner et al., 1991). Due to large ruminal capacity and a selective
retention of particles within the rumen, ruminants are capable of retaining feeds for a
longer time in their forestomach to facilitate rumination, fermentation, and absorption of
nutrients.
The forestomach harbors a diverse microbial population of bacteria, protozoa, and
fungi (Orpin and Joblin, 1988). The bacteria are the dominant microbial group in the
rumen (approximately 1010/mL) and are absolutely essential for the normal ruminal
function. The numbers of protozoa are much less (approximately 106/mL). But protozoa
can account for around 40 to 60% of the total microbial mass in the rumen due to their
comparatively larger size (Leng and Nolan, 1984). Fungi can account for about 8% of
4
the microbial mass in the rumen of animals fed lignified fiber diets (Citron et al., 1987),
but their numbers were quite low when diets rich in concentrates were given (Fonty et al.,
1987).
The reticulorumen provides a favorable environment for microbial growth and
survival. Nutrients are regularly supplied mainly via ingested feeds. Some nutrients are
also added with saliva and by diffusion through the ruminal epithelium. The condition in
the rumen is highly anaerobic with a redox potential of between –300 and –350mV. On
average, the ruminal contents are usually between 85 to 93% moisture due to the dilution
of feeds with saliva secreted during feeding. Typical quantities of saliva produced per
day are around 150 L in cattle and 10 L in sheep (McDonald et al., 1982). The anaerobic
and moist conditions favor the survival and growth of a broad category of microbes. Due
to the buffering capacity of saliva and rapid absorption of VFA, electrolytes, and
ammonia through the ruminal wall, pH is maintained mostly between 5.5 to 7.
Temperature is near optimum (39 to 410C) for many enzyme activities, which is
controlled mainly by the animal’s homeothermic mechanisms and partly due to the heat
generated during fermentation. The rhythmic ruminal contractions help to bring
microorganisms in contact with freshly ingested or ruminated feeds. End products of
microbial fermentation are continuously removed by absorption and passage out of the
stomach thus preventing the chances of growth inhibition (Church, 1960).
The breakdown of feed constituents into simple compounds by the
microorganisms in the reticulorumen has been recognized as a major function of the
forestomach. The ability of the ruminant to digest β-linked cell wall carbohydrates
enabled them to consume a wide range of feeds of plant origin. The carbohydrates are
digested to yield pyruvate, lactate, VFA (acetic, propionic, and butyric) and CO2 (Van
Soest, 1982). Proteins are broken down to peptides, amino acids, and ammonia
(Annison, 1956). Dietary lipids are hydrolyzed to free fatty acids and glycerol (Hoffman,
1973).
The forestomach is also involved in the synthesis of several compounds.
Synthesis of microbial proteins from feed proteins and nonprotein N is a major product of
ruminant N metabolism (Leng and Nolan, 1984). The microbes in the rumen can
synthesize all essential amino acids when supplied with a source of ammonia and carbon
5
skeleton (Loosly, 1949). The ruminal microorganisms can also synthesize essentially all
of the B-complex vitamins and vitamin K (Church and Pond, 1988). Additionally,
unsaturated fatty acids are hydrogenated to yield saturated fats in the rumen (Jenkins,
1993).
The ruminant forestomach may also serve as an important site of nutrient
absorption. All three compartments are lined with a stratified, squamous, nonglandular
epithelium that exhibits transport ability (Steven and Marshall, 1970). The mucosal
surface of the rumen contains numerous papillae, which may serve as organs of
absorption. The omasum consists of a large number of laminae of different orders and
sizes. The small particles of digesta are slowly passed through the interspaces between
adjacent laminae, thus allowing water and other nutrients (VFA, Na+ and Cl-) to be
absorbed before digesta reaches the abomasum (Englehardt and Hauffe, 1975). The ions
(Na+, H+) responsible for active transport of nutrients (Webb and Matthews, 1994) and
transporter proteins such as Na+/K+ ATPase and Na+/H+ exchanger are reported to exist
in the forestomach epithelium (Martens and Gabel, 1988). The osmotic gradient
established by the active transport of Na+ across the granulosa strata (Gabel et al., 1993)
is considered to be important for the non-mediated absorption of nutrients. The multi-
layered epithelial cell structure and comparatively “loose” tight junction of the granulosa
strata (Fell and Weekes, 1975) would be some useful anatomical features for a possible
paracellular absorption of nutrients (Matthews and Webb, 1995).
Microorganisms in the rumen are known to modify several toxic compounds in to
harmless substances. Those toxic compounds are found in a variety of feeds; examples
for such anti-nutritional compounds include mimosine in Leucaena leucocephala (Singh,
1990), saponins in raw soybean (Liener, 1969), HCN in cassava (Singh, 1990) and
gossipol in cottonseed meal (Kornegay et al., 1961). Feeding excessive amounts of such
feeds to monogastric species and preruminants leads to detrimental effects. But
ruminants can frequently prevent ill effects from those compounds due to the
detoxification by the microorganisms in the rumen.

6
Figure 2.1. The digestive system of a goat showing (a) esophagus, (b) reticulum,(c) rumen, (d) omasum, (e) abomasum, (f) small intestine, and (g) large intestine.
a bc
de
f
g

7
Protein Metabolism in Ruminants: Classical Concepts and New Perspectives
The complexity in ruminant N metabolism is evident by many studies on their
protein nutrition. The complicated stomach anatomy of ruminants and the heavy
interrelationship found between the microorganisms and host animal in the digestive
process appear to contribute mainly to this complexity. The major pathways of N
metabolism in the rumen have been recognized for many years. A schematic
representation of the major N pathways in the rumen is illustrated in Figure 2.2. Further
details on these metabolic pathways and quantitative understanding of each pool are still
gathering.
Proteins are the main nitrogenous materials in most ruminant diets. Non protein
nitrogen (NPN) in the form of peptides, free amino acids, amides, amines, nucleotides,
urea, uric acids and nitrates can occur in varying proportions. Usually the true protein
content accounts for 75 to 85% of the total N in most of the forage plants and seeds
(Lindberg, 1985). However, the NPN fraction can contribute to over half of the total N in
some feeds such as legume forages and ensiled feeds (Reid, 1994). In general, a mixed
concentrate-forage diet fed to ruminants contains approximately 85 to 95% of the dietary
nitrogen in true protein form (Satter and Roffler, 1975).
Dietary Protein Degradation in the Reticulorumen. Feed proteins are degraded
at varying rates and to varying extents due to the microbial activity in the rumen, the first
major change that occurs when these are consumed by ruminants. The extent of protein
degradation influences the N needs of ruminal microorganisms as well as the amino acid
requirements of ruminants, and thus becomes an important parameter when determining
the protein value of a feed (Madsen and Hvelplund, 1985). Presented in Table 2.1 are
ruminal protein degradation values estimated after compiling several previous
measurements by Satter (1986) and by NRC (1989) for some selected feeds. The protein
degradation in the rumen varies widely between feeds, within feeds, and with different
chemical or physical treatments (ARC, 1980).

8
Table2.2. Major Pathways of N Metabolism in Ruminants (Classical Concepts).
D i e t
P r o t e i n N P N
P e p t i d e s
A m i n o a c i d s
N H 3
M i c r o b i a l P r o t e i n
T o A b o m a s u m a n d I n t e s t i n e s
U r e a
L i v e r
S a l i v a
U n d e g r a d e d P r o t e i n
R u m e n

9
Table 2.1. Ruminal Degradability Estimates of Some Selected Feed Proteins.
Feed Satter (1986) NRC (1989)
--------------------- %------------------------
Alfalfa dehydrated 44 41
Blood meal 32 18
Brewers dried grains 47 51
Casein N.D.a 81
Corn gluten feed 80 75
Cotton seed meal 59 57
Distillers dried grains with soluble N.D. 53
Fish meal 20 40
Meat and bone meal 40 51
Soybean meal 73 65a. Not Determined
10
Degradation of proteins in the rumen consists of several steps. An association
between microorganisms and substrate should occur at the beginning. This association
may involve either the adsorption of a soluble protein to the bacterial cell surface or of
the adhesion of bacteria to an insoluble substrate or the ingestion of a particulate substrate
by protozoa. Proteolytic cleavage of the protein to peptides, followed by hydrolysis of
peptides to amino acids may occur in the next steps. Both peptides and amino acids can
be transported into the microbial cell and either protein synthesis or deamination may
take place. Deamination will result in the production of ammonia, VFA, CO2, and
methane. (Wallace, 1994). The ammonia can be used for assimilation and resynthesis of
microbial proteins. When the production rate of ammonia in the rumen exceeds the
capacity of ammonia-utilizing species, large quantities can accumulate. Excess ammonia
is absorbed across the reticulorumen or is passed to the lower gut for absorption and is
converted to urea in the liver. Some of the urea is recycled back to the rumen via blood
or saliva but a significant proportion may be lost in the urine (Russell et al., 1991).
All the enzymes that convert proteins to ammonia in the rumen are assumed to be
microbial in origin. This assumption is well supported by the observations of Brock and
coworkers (1982) who suggested that enzyme activities were predominantly associated
with the small particle phase, rather than the fluid phase. Bacteria, protozoa and to a
lesser extent anaerobic fungi, can all carry out proteolysis, peptidolysis and deamination
in the rumen (Broderick et al., 1991).
Bacteria are generally regarded as being mainly responsible for degrading dietary
protein. The surface area presented to the ruminal fluid by bacteria is four times that of
protozoa, and as the metabolic rate is related to surface area, bacteria are metabolically
more important (Buttery, 1976). Between 30 to 50% of the bacteria isolated from
ruminal fluid have proteolytic activity towards extracellular protein (Prins et al., 1983),
and a mixed population is necessary to account for the degradation activity found in the
rumen (Wallace and Brammall, 1985). Numerous bacterial species are involved in the
protein breakdown. Most attention has been focused on three species considered to be
the major proteolytic organisms, namely Bacteroides ruminicola, Bacteroides
amylophilus and Bacteroides fibrisolvens. Several other ruminal bacteria are also
11
reported to be proteolytic. These include the species of Clostridium, Eubacterium,
Strptococus, and Selenomonas (Wallace and Brammall, 1985; Wallace, 1994).
Protozoa are actively engaged in the hydrolysis of proteins in the rumen. Several
species of ruminal protozoa including Ophrysocolex spp., Entodinium and Eudiplodinium
medium have been identified as being proteolytic (Williams and Coleman, 1992). When
the protein digesting enzyme activities of ruminal protozoa and bacteria were compared,
protozoa exhibited a higher aminopeptidase and trypsin-like activity (Forsberg et al.,
1984). The reduced ruminal ammonia concentrations frequently observed in defaunated
animals also suggest that protozoa can greatly influence the ruminal N metabolism (Leng
and Nolan, 1984). But, protozoa poorly degrade soluble proteins in the diet. The specific
activity of protozoa accounted for only one-tenth of the activity in the breakdown of
azocasein (Brock et al., 1982). Protozoa seem to be mainly involved on the degradation
of bacterial cells and insoluble feed proteins (Hino and Russell, 1986). By converting
bacterial protein into protozoal protein, and with the selective retention of protozoa in the
rumen (Viera, 1986), they can serve as a continuous source of N within the forestomach
following death and lysis.
Studies on the protein degradation ability of ruminal fungi are scanty. Several
ruminal fungi species were reported to have a distinctive extracellular metaloprotease that
has a trypsin-like protease activity (Wallace and Joblin, 1985). But the studies of Brock
et al., (1982) suggest that fungal protease activity is low in the rumen. Michael and
coworkers (1993) evaluated the proteolytic and peptidase activities of seven of the most
common strains of ruminal fungi in vitro. Proteolytic activity was detected only in one
strain (i.e. Piromyces sp.). All the strains exhibited aminopeptidase activity but
carboxypeptidase activity was not found in any strain. Their study further concluded that
the contribution of ruminal fungi is relatively insignificant in comparison to the total
proteolytic and peptidase activity in the rumen. Thus, the influence of fungi on protein
degradation in the rumen appears to be minor.
The proteolytic activity in the rumen, the numbers of proteolytic species and the
predominant proteolytic species present all appear to be influenced by diet. Switching
cows from hay-concentrate diet to one containing fresh alfalfa caused a nine-fold increase
in proteolytic activity (Nugent and Mangan, 1981). Bacteroides ruminicola has been
12
identified as the predominant species of proteolytic bacterium found in the rumen of
cattle and sheep under variety of dietary conditions (Wallace and Brammall, 1985).
Bacteroides amylophilus can also be a very active proteolytic organism particularly with
the ingestion of high starchy diets (Blackburn and Hobson, 1962). Changing the protein
in the diet from casein to less readily degraded ovalbumin can stimulate the growth of B.
fibrisolvens, a bacterial species with a higher proteolytic activity (Cotta and Hespell,
1986).
Factors Influencing Microbial Protein Breakdown. The degradation of dietary
protein in the rumen is influenced by a number of factors. Solubility of the protein,
which is usually measured in artificial saliva at body temperature, seems to be an
important factor influencing degradability. Soluble proteins tend to be more readily or
completely degraded than insoluble proteins. A good correlation was obtained between
the solubility and the rate of protein breakdown in the rumen for several feeds
(Henderickx and Martin, 1963). Because ruminal microorganisms and extracellular
enzymes must come in contact with feeds through a water to feed interaction, it can be
expected that soluble proteins are frequently degraded at faster rates than insoluble ones
(Nocek and Russell, 1988). However, the opposite was observed with certain proteins
including soluble proteins such as albumin which is hydrolyzed slowly while some
insoluble proteins, such as hide powder, are degraded rapidly (Wallace, 1983). By
demonstrating that soluble and insoluble proteins of soybean meal were hydrolyzed at
almost identical rates, Mahadevan et al. (1980) showed that solubility or insolubility of a
protein is not by itself an indication of the protein’s resistance or susceptibility to
hydrolysis by rumen microbial proteases. Therefore, the solubility and the rate of ruminal
degradation are not correlated universally with all the proteins and feeding conditions.
The extent of protein degradation is influenced by the retention time of protein in
the rumen which may vary with its particle size and intake (Church, 1960). With
increasing intake, the proportion of insoluble N degraded in the rumen decreases,
presumably due to a decreased rumen retention time (Lechner-Doll et al., 1991).
Ruminal retention time of proteins varies not only between feeds but also between
animals (Balch and Campling, 1965). High producing ruminants consuming large
13
quantities of feed are likely to have a smaller fraction of dietary protein degraded in the
rumen than animals consuming low or moderate amounts (Satter, 1986).
The primary, secondary, and tertiary structures of the protein molecule can have a
great influence on its accessibility by proteolytic enzymes and thus can affect ruminal
degradability. When proteins are extensively crosslinked with disulfide bonds, their
ruminal degradability is slow due to the poor accessibility by enzymes (Nugent and
Mangan, 1978). Casein, which has essentially a linear secondary and tertiary structure
(having no disulfide bonds), is very sensitive to degradation (Mangan, 1972). Bovine
serum albumin (BSA) has a complex tertiary structure with 6% cysteine, disulfide bonds
and possesses a greater resistance to degradation. When different proteins were subjected
to treatment with mercaptoethanol or performic acid to cleave the disulfide bonds, no
difference was found in their rates of degradation (Mahadevan et al., 1980). The cyclic
feature of ovalbumin can greatly reduce the rate of proteolysis even though this protein is
more soluble in ruminal fluid (Mangan, 1972).
Feed processing and storage can have a marked influence on the breakdown of
protein in the rumen. During processing and storage, feeds may be exposed to heat that
can alter the nature of the protein. By-product feeds are frequently dried during
processing and ensiled feeds may be exposed to elevated temperatures during storage.
During different feed processing methods such as pelleting, extrusion and steam rolling, a
sufficient heat to alter protein is usually generated. Heat used in the drying process of
fish protein can induce formation of S-S cross-linking from sulfhydryl oxidation
(Opstvedt et al., 1984) and can lower rate of ruminal proteolysis (Chen et al., 1987b).
Mehrez and coworkers (1980) have studied the effect of processing methods of fishmeal
on the rate and extent of ruminal degradation. They suggested that the most important
factor was the length of storage prior to processing, which is presumably correlated to the
extent of hydrolysis or denaturation of the fish protein. Also, the addition of formalin as
a preservative in the storage of fish prior to processing, drying method, and the addition
of antioxidants are all factors that may affect degradability of protein in the rumen.
Studying the effect of heat treatment on ruminal protein degradation in cottonseed meal,
Broderick and Craig (1980) concluded that the heat treatment decreases ruminal
degradation partly by blocking reactive sites for microbial proteolytic enzymes and partly
14
by reducing protein solubility. Therefore, the ruminally degradable N content may vary
between and within feeds depending on the method of processing and storage conditions.
Methods to Predict Ruminal Protein Degradation. A considerable amount of
effort has been made in the investigation of methods to measure ruminal protein
degradation. These methods can be broadly classified as in vivo, in situ, and in vitro
techniques. More details on each of these procedures can be found in several reviews
(Johnson, 1966; Lindberg, 1985; Nocek, 1988).
The in vivo procedures are designed to measure the amounts of total and
microbial proteins reaching the duodenum or abomasum using cannulated animals. The
microbial proteins are determined using specific markers such as diamino pimelic acid
(DAPA), RNA, 35S, 32P, and 15N (Tamminga, 1979). The undegraded dietary fraction is
estimated by the difference between total and microbial proteins. The undegraded dietary
fraction also includes proteins added by endogenous sources and partially degraded
proteins in the rumen. Therefore, Clark and coworkers (1992) proposed that the more
accurate terminology for this N fraction would be nonammonia nonmicrobial N
(NANMN). To overcome these limitations, Hogan and Weston (1970) suggested a
method to predict the endogenous protein flow using equations and subtract from
NANMN fraction. The in vivo measurements of ruminal protein degradation are
expensive, time consuming, labor intensive, and subject to error due to inaccurate
estimation of endogenous proteins as well as in differentiation of feed and microbial
proteins using markers (Stern et al., 1994).
The in situ procedures have been commonly used to predict ruminal degradation.
This technique involves suspending dacron polyester or nylon bags containing feeds in
the rumen of cannulated animals and measuring N disappearance at various time
intervals. The in situ methods provide an opportunity to use digestive process in the
rumen of a live animal similar to what occurs under in vivo conditions. The popularity of
this method also lies in its relative simplicity, low cost and its ability to measure the rate
of N disappearance in the rumen (Orskov et al., 1980). The assumption of a constant
flow rate is an inherent weakness of this procedure. The estimates of protein degradation
by in situ methods may also depend on several factors. These include porosity of the
bags, particle size of feed samples, ratio of sample weight to bag surface area, bag

15
placement in the rumen, and the colonization of bacteria in the feed residues (Weakly et
al., 1983). The use of standardized procedures has been recommended to overcome the
discrepancies that might occur when using this technique (Lindberg, 1985; Nocek, 1988).
The necessity to maintain surgically prepared animals imposes a severe restriction
on the use of both in vivo and in situ techniques for routine determination of ruminant
degradability of large numbers of feed samples. Hence, many in vitro procedures have
been devised to estimate ruminal degradability under laboratory conditions. Ability to
quantify end products of dietary protein degradation in the rumen before these products
flow to the duodenum or are absorbed by the gastrointestinal tract is an important
advantage of in vitro techniques. Also, the use of markers may not be required and the
complications that might arise due to the addition of endogenous N can be eliminated.
Reduction of cost and time would also be added advantages of in vitro procedures
(Chamberlain and Thomas, 1979).
The development of continuous culture fermenters provide an opportunity to
study ruminal N degradation by more closely simulating the ruminal environment in a
laboratory (Czerkuski and Breckenridge, 1977). In these systems, solid feeds can be
added continuously at variable rates and the turnover of solids and fluid in vessels may be
varied independently. Reliable procedures are required for differentiation of effluent
digesta into microbial and dietary N fractions. A good correlation was reported between
the continuous culture fermentation and in vivo measurement of ruminal degradability
(Lindberg, 1985). In comparison to other in vitro methods, continuous culture
fermentation techniques are more expensive, elaborate, and not suitable when a large
number of samples are to be analyzed.
Nitrogen solubility has been used to predict ruminal degradability because of the
high correlation observed between the two parameters in some purified proteins (Hendrix
and Martin, 1963). Several solvents such as Burrough’s mineral buffer (Burrough et al.,
1950), McDougal’s mineral buffer (Crooker et al., 1978), and Durand’s buffer (Lindberg,
1985) have been used to estimate solubility. But a poor correlation between N solubility
and in vivo protein degradation has been frequently reported (Stern and Satter, 1984).
Thus, the solubility is not synonymous with degradability as previously proposed.
16
The use of proteolytic enzymes to estimate dietary protein degradation in the
rumen was attempted. Proteases from bacteria, fungi and plants were used
(Krishnamoorthy et al., 1982; Poos-Floyd et al., 1985) and variable responses were
reported. The most suitable protease preparation for predicting feed protein degradation
appears to be the one that is prepared from mixed ruminal microorganisms (Mahadevan
et al., 1987). However, the extraction of protease from ruminal microbes is very tedious.
The measurement of ammonia production during in vitro incubation of feeds with
ruminal fluid has been used to study protein degradation (Chamberlain and Thomas,
1979). But the accumulation of ammonia during incubation of proteins occurs as a net
effect of ruminal protein degradation and microbial utilization for protein synthesis.
Also, the concentration is greatly influenced by the amount and nature of the fermentable
carbohydrates available. Consequently an underestimation of the true degradability is
usually the result (Broderick, 1982). To overcome these limitations, a modified in vitro
procedure to inhibit microbial protein synthesis by adding hydrazine or chloramphenicol
was suggested (Broderick, 1987).
An alternative in vitro method based on measurement of ammonia concentration
and gas (CO2 & CH4) production during incubation of feeds with ruminal fluid was
proposed by Raab et al. (1983). Starch was added in graded amounts and the gas
production and NH3 concentration were measured. Ammonia released at zero gas
production was extrapolated and this point was considered as zero microbial growth. The
requirement of a large number of incubations for more accurate estimation of ruminal
protein degradation would be the major drawback in this procedure. Several other
modified in vitro procedures have also been proposed (Broderick and Clayton, 1992;
Mahadevan et al., 1979). Thus, the methods to measure ruminal protein degradation are
numerous and each method has its own merits and limitations. The specific objective of
the researcher and the availability of resources would be two major determinants in the
choice of a method.
Accumulation of Products Following Digestion of Proteins in the Rumen.
Ammonia is considered to be a major end product of fermentation of nitrogenous
compounds by the microorganisms in the rumen. The concentration of ammonia in the
ruminal fluid can vary from 0 to 130 mg/dL for a wide variety of dietary conditions

17
(Hungate, 1966). Satter and Roffler (1974) indicated that the mean ruminal ammonia
concentration ranged from .8 to 56 mg/dL ruminal fluid increasing with percent of dietary
N level. Ammonia is produced in the rumen by the metabolism of proteins as well as
NPN compounds in the diets and from those added endogenously (Leng and Nolan,
1984). Incorporation into microbial proteins would be the primary route of ammonia loss
from the rumen. Studies with 15N indicate that 50 to 75 % of the microbial N in the
rumen of animals fed common diets is derived from the ruminal ammonia pool (Oldham,
1981). Ammonia is an essential nutrient for several species of ruminal bacteria namely,
Bacteroides amylophilus, Bacteroides succinogen, Eubacterium ruminantium,
Methanobacterium ruminantium, Ruminicocus albus, and Ruminicocus flavefaciens
(Hungate, 1966). Synthesis of amino acids from ammonia by the ruminal
microorganisms requires the use of carbon skeleton and energy. Carbon from a wide
variety of sources (e.g. Carbohydrates, VFA) could be used, but specific carbon skeletons
may be required for the synthesis of some amino acids (Tillman and Sidhu, 1969). There
has been considerable controversy over the optimum concentration of ammonia in the
rumen to sustain maximum microbial yields. The reported values range from 1 mM
(Schaefer et al., 1980) to 15.8 mM (Allen and Miller, 1976) and may depend on the
dietary situation and animal variations. When the production rate of ammonia exceeds
the capacity of ammonia utilizing species, large quantities can accumulate in the rumen.
The excess ammonia is mainly absorbed across the rumen wall or may pass out to the
duodenum for absorption.
Reported values of the free amino acid concentration in the rumen are frequently
low (Annison, 1956; Wright and Hungate, 1967). This observation was hypothetically
explained as due to the rapid deamination by microorganisms (Chalupa, 1976). Leibholz
(1969) found that free amino acid concentration was dependent on the dietary protein
intake and may exceed free amino acid concentration in the blood plasma. In a recent
review of literature, Matthews and coworkers (1996) indicated that the reported values of
the concentration of free amino acids in the strained ruminal fluid were .12 to 1.5 mg/dL
prefeeding and .72 to 6 mg/dL postfeeding. Increased amino acid concentrations
observed postfeeding implies that the utilization of free amino acids can also be rate
limiting during ruminal protein degradation. The appearance of peak amino acid
18
concentration was apparently different in different studies, most likely due to dietary and
animal variations.
It was usually assumed that all amino acids are catabolized equally during ruminal
fermentation (Burroughs et al., 1975). But substantial evidence to indicate different rates
of degradation of individual amino acids and interactions among certain amino acids
during microbial catabolism were reported (Chalupa, 1976; Tamminga, 1979).
Nonessential amino acids are usually degraded very rapidly in the rumen. Essential
amino acids are broken down at different rates depending on the amino acid. Methionine
and valine are more stable while arginine and threonine are very susceptible to
degradation (Chalupa, 1976). Therefore, depending on the diet and animal variations,
specific amino acids may potentially be available in the rumen.
Until recently, many nutritionists have neglected the magnitude and the
nutritional significance of peptides produced following the protein hydrolysis in the
rumen. In an early study, Winter et al. (1964) observed that tungstic acid precipitated as
much as seven times more soluble N from ruminal fluid than trichloroacetic acid.
Several years later, Chen et al. (1987a) noted that tungstic acid but not trichloroacetic
acid, precipitates peptides in addition to the proteins. Referring to the above
observations, Russell et al., (1991) hypothesized that the peptides could represent a
sizable proportion of the soluble N fraction in the ruminal digesta. Mangan (1972) also
noted a large increase in nonammonia, NPN when casein was infused into the rumen, but
whether it was due to the peptides was not certain. When Chen and Russell (1990)
incubated casein and soybean proteins with mixed ruminal bacteria, the proteins were
degraded rapidly (.68 to .72 mg N.L-1.min-1, respectively). But the rate of ammonia
production was nearly 10-fold lower (.08 and .1 mg N.L-1.min-1, respectively), and the
microbial proteins were increased by only about 3%. Consequently, as much as 80% of
the degraded protein N could not be accounted by considering only ammonia and
microbial protein production. The fraction of non-ammonia, non-protein N (NAN-NPN)
that accumulated was large. This NAN-NPN reacted more strongly with ninhydrin
following acid hydrolysis suggesting that peptides were the main component of this
fraction. Peptide accumulation following ruminal protein degradation has also been
demonstrated in a number of studies (Chen et al., 1987b; Broderick and Wallace, 1988;

19
Broderick et al., 1990). Compiling previously reported measurements on the
concentration of peptide N in ruminal fluid, Matthews and coworkers (1996) indicated
that the values ranged from 1.5 to 6 mg/dL prefeeding, and 10 to 27 mg/dL postfeeding.
All these studies have clearly indicated the presence of increased peptide concentrations
in the rumen following protein meals, but the total concentrations, rates of production,
and time required for the decrease of peptide concentration to a prefeeding level varied
among studies.
The diet can have a major influence on the accumulation of peptides in the rumen.
The peptide accumulation has been suggested to occur when diets containing rapidly
degraded proteins are supplemented (Chen et al., 1987b). Sheep fed a diet containing
casein (a rapidly degraded protein) resulted in an accumulation of peptides in the rumen,
but no accumulation was observed when either urea or ovalbumin replaced casein
(Broderick and Wallace, 1988). Replacing half of the soybean meal in the diet of
lactating dairy cows with slowly degraded proteins (either extruded soybean meal or fish
meal) resulted in a lower concentration of peptide N in the ruminal fluid (Chen et al.,
1987b). They suggested that peptides accumulate in the rumen during the proteolysis of
rapidly degraded proteins due to the saturation of ruminal bacterial proteinases with
substrates, but that peptide uptake by bacteria would exceed the rate of release from more
slowly degraded proteins.
Williams and Cockburn (1991) refuted the concept that the peptide accumulation
in the rumen is highly correlated with the degradability and the solubility of the proteins.
They fed steers, a diet of straw and tapioca supplemented with either urea, casein,
formaldehyde treated casein, decorticated groundnut meal, soybean meal, maize gluten
meal, or fish meal to determine the effect of degradability on ruminal amino acid and
peptide concentrations. The peptide N concentrations at 1 h after feeding of straw
supplemented urea, casein, formaldehyde treated casein, decorticated groundnut meal,
soybean meal, maize gluten meal, and fish meal were 2.4, 160, 87, 76.5, 21, 136, and 90
mg/L, respectively. They concluded that peptides were accumulated postfeeding, but the
peptide N concentrations were poorly correlated with the degradability and solubility of
the proteins.
20
Differences that may occur in the level and frequency of feeding can also
influence the production of peptides in the rumen. Chen et al. (1987b) fed diets (12
times/d) supplemented with soybean meal to provide 14.5, 17.1, and 20.6% CP to
lactating cows. When the protein content of the diet was increased from 14.5 to 17.1%,
the ruminal peptide N concentration also increased (from 106 to 154 mg/L). However,
the ruminal peptide concentration was not further increased with an additional increase in
protein level, indicating that the protease activity in the rumen was saturated with
substrates. Greater concentrations of ruminal peptides were also noted as the frequency of
feeding was decreased from 12 times/d to once a day.
Persistence of specific peptides resistant to further hydrolysis in the rumen is a
relatively new concept. The size of the peptide has been suggested to influence their
susceptibility to ruminal degradation (Cooper and Ling, 1985). Pittman and Bryant
(1964) observed that ruminal bacteria utilized large oligopeptides more rapidly than the
small peptides. Hence, the small peptides can frequently accumulate in the extracellular
ruminal fluid. Wallace et al. (1990b) have also indicated that the peptides containing
three or more amino acids are hydrolyzed and utilized more rapidly than the dipeptides.
Using di- to pentapeptides of alanine and glycine, Wallace et al. (1990a) have further
studied the influence of peptide size on the rate of disappearance in the rumen. Ala2,
among alanine peptides, and Gly5, among glycine peptides, were slowly hydrolyzed
suggesting that the peptide size and the amino acid composition can have an interaction
effect on the rate of degradation of peptides.
The amino acid composition and the structure of the peptide substrates have been
considered to be important determinants of their susceptibility to microbial degradation.
Chen et al., (1987c) separated tripticase (pancreatic digest of casein containing mostly
peptides) into alcohol soluble and insoluble fractions using 90% isopropyl alcohol. The
alcohol soluble fraction had an abundance of peptides composed of hydrophobic amino
acids (leucine, tryptopan, tyrosine, phenylalanine, proline, and valine). The insoluble
fraction contained peptides with a large proportion of hydrophilic amino acids (arginine,
aspartic acid, glutamic acid, and lysine). When these two fractions were incubated with
mixed ruminal bacteria in vitro, hydrophilic peptides were metabolized more rapidly than
the hydrophobic peptides (39 vs 18 mg of NH3 per g of bacterial protein per h). Yang
21
and Russell (1992) incubated enzymatic digests of casein and gelatin with an inoculant of
mixed ruminal bacteria and measured the persistence of peptides in the incubation
medium. The results showed that ruminal bacteria were unable to degrade much of the
peptides from enzymatic digests of casein and gelatin, even when the incubation period
was as long as 96 h. The peptides resistant to microbial degradation contained a large
amount of proline. Therefore, they hypothesized that proline-containing peptides might
be degraded at a slower rate than other peptides in the rumen.
Some selectivity may occur during the metabolism of peptides by ruminal
microorganisms and the resistant peptides could specifically persist in the ruminal fluid.
Peptides of different size, structure, and amino acid composition are broken down at
different rates in the rumen. The structural differences of proteins and variations in feed
processing conditions may greatly influence the persistence of specific peptides in the
ruminal fluid.
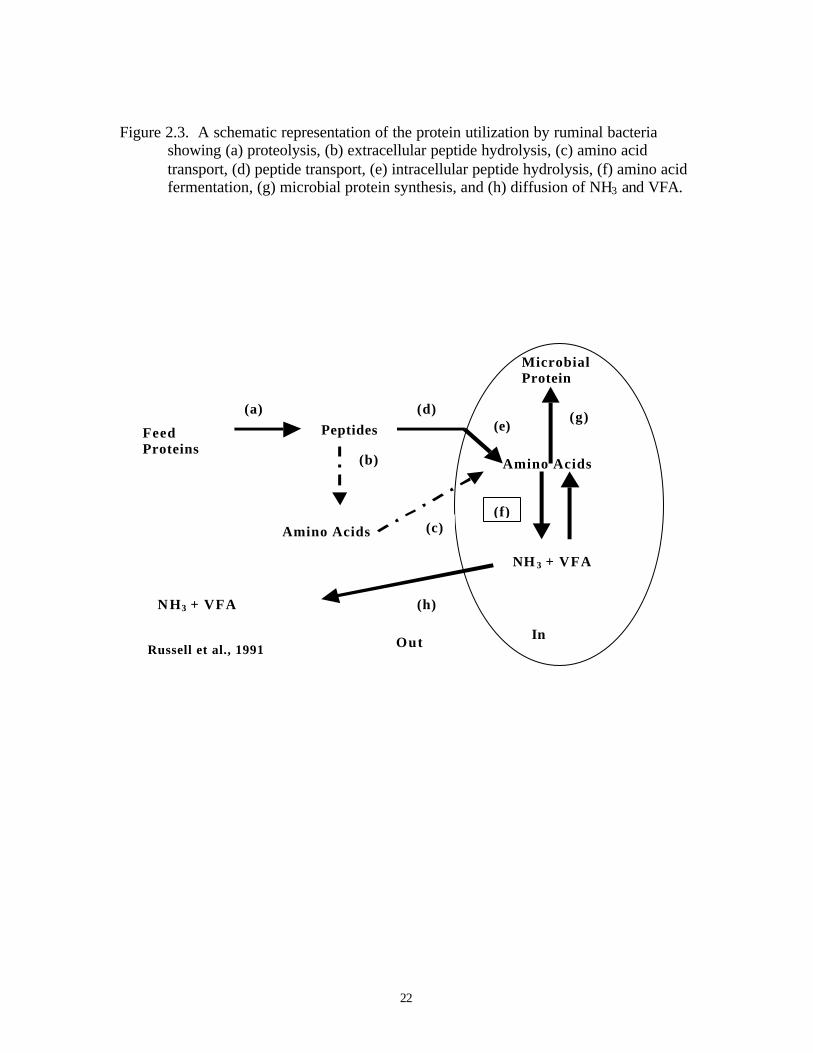
Mechanisms of Peptide Accumulation in the Ruminant Forestomach. The
mechanisms involved in the accumulation of peptides during ruminal protein degradation
are being investigated. Figure 2.3 illustrates a scheme that has been proposed to explain
further details of the utilization of proteins by ruminal bacteria (Russell et al., 1991).
According to this scheme, the protein utilization by ruminal microorganisms is a
multistep process involving proteolysis, peptide hydrolysis, the uptake of peptides or
amino acids into the microbial cells and either fermentation or microbial protein
synthesis. As the protein utilization by ruminal microorganisms occurs in several
distinctive steps to yield a number of intermediate products with different degradation
characteristics, accumulation of intermediate products during dietary protein degradation
might be possible.
Proteolysis of dietary proteins will result in the production of a variety of peptides
in the rumen. Proteases are mainly associated with the cell surface of bacteria (Kopency
and Wallace, 1982) and the hydrolysis of proteins to peptides usually occurs
extracellularly.
22
Figure 2.3. A schematic representation of the protein utilization by ruminal bacteriashowing (a) proteolysis, (b) extracellular peptide hydrolysis, (c) amino acidtransport, (d) peptide transport, (e) intracellular peptide hydrolysis, (f) amino acidfermentation, (g) microbial protein synthesis, and (h) diffusion of NH3 and VFA.
FeedProteins
Peptides
Amino Acids
Amino Acids
MicrobialProtein
InOutRussell et al., 1991
NH 3 + VFA
N H3 + VFA
(a)
(b)
(c)
(d)(e)
(f)
(g)
(h)
23
Peptides of a transportable size are produced by some extracellular peptidase activity in
the next step (Russell et al., 1991). When soy protein hydrolysate was incubated with
mixed ruminal bacteria, high molecular weight peptides (> 3,000 MW) disappeared
rapidly resulting in an accumulation of smaller peptides (500 to 1,000 MW) in the
extracellular medium (Depardon et al., 1995). The microorganisms in the rumen may
either transport these smaller peptides directly into their cells or hydrolyze them further
to amino acids extracellularly. As the ruminal bacteria have transport systems for the
uptake of both peptides (Chen et al., 1987a) and free amino acids (Russell et al., 1988),
protein utilization can proceed in either route.
The majority of bacteria in the rumen are gram-negative, and their outer
membrane could act as a selective barrier to many substances. Porins, which serve as
channels to allow nutrient passage through the outer membrane have a maximum size
exclusion limit of around 600 (Nikaido, 1979) to 750 Dalton (Westlake and Mackie,
1990). Also, the peptide transporters in the cytoplasmic membrane of both gram-
negative and positive bacteria are reported to have a size exclusion of approximately five
amino acids (Higgins and Gibbson, 1986). Thus, peptides smaller than five amino acids
are usually transportable. However, Bacteroides ruminicola are reported to take up
peptides containing 16 amino acids (Pittman et al., 1967).
Experiments comparing the rates of utilization of free versus peptide amino acids
by ruminal microorganisms indicate a rapid use of peptides. When Prins et al., (1979)
added free and peptide-bound forms of glycine, methionine, valine, and histidine to a
medium containing mixed ruminal microorganisms, peptide forms disappeared rapidly.
Also, the ammonia production by mixed ruminal bacteria was rapid when peptides rather
than the corresponding free amino acids were incubated (Chen et al., 1987a). The rapid
utilization of peptides was suggested as due to the dominance of peptide uptake pathways
in comparison to those of free amino acids. This hypothesis is further confirmed as the
peptidase activities were found mostly membrane-bound or intracellular (Broderick et al.,
1988). Therefore, peptide uptake is the preferred method of transport followed by either
membrane or intracellular hydrolysis of peptides. As amino acid catabolism depends on
intracellular enzymes and cofactors, the amino acid deamination must occur
intracellularly (Hino and Russell, 1985).

24
Accumulation of peptides in the extracellular ruminal fluid suggests that either
extracellular peptidase activity or peptide uptake into the bacterial cells could be the rate
limiting steps in the overall degradation of some feed proteins (Russell et al. 1991).
Ruminal bacteria could utilize only a small fraction of peptides regardless of the
concentration used suggesting that some peptides were specifically resistant to further
degradation in the rumen (Cotta and Russell, 1982). Accumulation of dialanine (Wallace
et al., 1989), hydrophobic (Chen et al., 1987c) and proline containing (Yang and Russell,
1992) peptides in the rumen indicates that the size, structure and the amino acid
composition of the peptides can have a great influence on the peptide utilization by the
microorganisms in the rumen. Therefore, specific peptides could persist in the rumen
depending on the nature of the protein fed to the animal.
Alternative Sources of Peptides and Amino Acids Added to the Ruminal Digesta.
Peptides and amino acids can be produced in the rumen from sources other than feed
proteins. These alternative sources include the microbial proteins that are recycled within
the reticulorumen and the endogenous proteins added into the forestomach. A significant
contribution to the ruminal NAN pool can be made by these sources.
A substantial proportion of N is recycled within the forestomach of ruminants due
to microbial cell lysis. In a study using intraruminal injection of (15N) ammonia sulfate to
sheep fed alfalfa chaff diet, Nolan and Leng (1972) noted that the amount of ammonia
recycled within the rumen accounted for 30% of the total ammonia flux. Extensive
recycling of N in the rumen has also been reported in several other studies (Demeyer and
Van Nevel, 1979; Cottle, 1980). A portion of this N recycling may be attributed to the
ammonia absorption from the forestomach and its return as urea. But according to Nolan
and Leng (1972), the proportion of N recycled this way could account for only one-third
of the total N recycling; the remainder being recycled due to the turnover of microbial
proteins within the rumen. When (15N) ammonia was infused into the rumen of sheep fed
hay based diets, as much as 50% of the microbial mass was turned over before N passed
to the lower gut (Nolan and Stachiw, 1979).
The turnover of microbial proteins in the rumen can occur due to a number of
reasons. Predation of bacteria by ruminal protozoa is considered to be a major factor
(Williams and Coleman, 1992), and around 40% of bacteria in the rumen were shown to

25
be engulfed (Abe and Kandatsu, 1969). Coleman and Sanford (1979) calculated that with
a protozoal concentration of 106 cells/mL, 2.4 to 45 g of bacteria are engulfed daily in the
rumen. Bacterial protein turnover can occur even in the absence of protozoa. Autolysis
of bacteria, particularly during starvation has often been reported (Russell et al., 1983).
Bacteriolytic microorganisms similar to mycoplasma (Hungate, 1966), anaeroplasma
(Robinson and Hungate, 1973) and bacteriophages (Klieve and Bauchop, 1988) can also
cause bacterial lysis in the rumen. Protozoa may also lyse within the rumen.
Observations on high ruminal protozoal mass (Williams and Coleman, 1992), their rapid
lysis under in vitro conditions (Coleman, 1985) and selective retention in the forestomach
region (Leng, 1982) suggest that protozoa can also contribute to a significant proportion
of the microbial proteins recycled in the rumen. Additionally, dietary manipulations such
as salt feeding can also have an influence on microbial protein turnover in the rumen
(Wells and Russell, 1996).
Endogenous sources other than urea can also add significant amounts of protein N
to the ruminal digesta. The endogenous protein N (EPN) includes mucoproteins from
saliva and cellular debris from sloughing and abrasion of gastrointestinal tract epithelial
cells. These endogenous proteins are also reported to degrade in the rumen (Hogan,
1975) and would contribute to the ruminal NAN pool. In cattle fed forage diets, the mean
flow of EPN from the rumen and abomasum was estimated to be 6.2 and 23 g/d,
respectively (Hart and Leibholz, 1990). These values corresponded to 2.2 and 6.3 g/kg
DM intakes, respectively. The flow of EPN was increased as the DM intake increased.
Estimates by Baily and Balch (1961) suggest that the flow of saliva in cattle fed forage
diets was 90 L/d contributing 5.4 g proteins per day. Their calculations further indicate
that an amount of nitrogen equivalent to approximately 10% dietary N is recycled via
saliva. According to Orskov and McLeod (1982), about 5g of EPN was added daily from
the rumen of cows and steers due to the sloughing off and abrasions of epithelial cells.
The flow of gastric juice secreted in cattle was found to be 30 L/d contributing between 8
to 19g endogenous protein N (Hill, 1961). Summarizing previous data, Egan et al. (1986)
suggest that between 3 to 12g of endogenous proteins are usually added daily before
digesta reaches the duodenum.

26
Duodenal Flow of Ruminal Protein Degradation Products. Nitrogenous
compounds reaching the small intestine of ruminants are generally assumed to consist of
microbial and undegraded dietary proteins, nucleic acids of microbial origin, constituents
of bacterial cell walls, ammonia, and endogenous N sources (Armstrong et al., 1977).
Peptides and amino acids that could arise due to the microbial activity in the rumen have
usually been ignored. Therefore, very limited information is available on the duodenal
flow of these products in ruminants. Recently, Chen et al. (1987b) studied the effect of
dietary proteins on the peptide flow from the rumen of lactating dairy cows. When the
cows were fed a forage diet with a soybean meal supplement, the estimated peptide flow
from the rumen was over 200 g/d. Their calculations suggest that at this rate of flow,
peptides escaping ruminal degradation could have accounted for more than 25% of the
milk protein synthesized by the cows. Even if the soybean was heat-treated to decrease
its solubility, a substantial amount of peptides (100 g/d) was reported to flow out of the
rumen. However, the calculations of Broderick and Wallace (1988) indicate that the free
amino acids and peptides can accounts for only 1.2 to 2.4% of the total NAN flow to the
duodenum. Variation in diets, animals, and the analytical techniques used, can be the
reasons for above discrepancy in the duodenal flux of peptides and amino acids. The
effect of diet on the amount and composition of peptides and free amino acids flowing
out of the rumen is yet to be known.
Absorption of Ruminal Protein Digestion Products Across the Ruminant Forestomach
Ammonia Absorption. Ammonia absorption is one pathway of N disappearance
from the rumen. McDonald (1948) first demonstrated the absorption of ammonia from
the rumen of sheep. A few years later, Lewis (1957) observed that the portal blood
ammonia concentration increased in a curvilinear function with ruminal ammonia
concentration. At higher ruminal concentrations, ammonia absorption across the rumen
is increased, strictly by passive diffusion processes. The data of Hogan (1961) suggested
that the ammonia absorption through ruminal wall was dependent on the concentration
gradient at pH 6.5, but the losses were negligible at pH 4.5. Bloomfield et al. (1963) also
reported a reduction in ammonia absorption across ruminal forestomach with decreasing
ruminal pH. The dependency of the rate of ammonia absorption on ruminal pH is
27
dictated by the behavior of ammonia as a weak base. In solution, ammonia exists in a
state of equilibrium between un-ionized (NH3) and ionized (NH4+) forms, and the extent
of ionization is highly pH dependent. The pKa for this equilibrium is near 9. Therefore,
the proportion of free NH3 vs NH4+ increases at higher pH. The ammonium ion (NH4
+) is
less readily absorbed through the rumen wall than the un-ionized (NH3) form (Visek,
1968). Consequently, increased rates of absorption occur at high pH due to the increases
in concentration of free NH3. Thus, the ruminal concentrations and pH play an important
role in the absorption of ammonia across forestomach epithelium.
Amino Acid Transport. According to the current knowledge, free amino acids are
the major form in which nitrogen is absorbed to meet the tissue needs of ruminants
(NRC, 1985). The small intestine, specifically the more distal region (i.e. ileum) is
considered to be the principal site of amino acid absorption in ruminants (Webb and
Matthews, 1994). Data is accumulating to suggest with a reasonable degree of certainty
that ruminant forestomach is a site of amino acid absorption. But the magnitude and the
mechanisms of this process are yet to be understood.
Using both in vitro and in vivo procedures, Cook et al. (1965) demonstrated the
ability of the ruminant forestomach epithelial tissue to absorb free amino acids. Sections
of forestomach tissues (rumen, reticulum, and omasum) obtained from two goats were
folded into sacs and suspended in a saline bath which was gassed with oxygen. Solutions
of glycine in saline (perfusate) were placed in each sac. The disappearance of glycine
from the perfusate and the appearance of glycine in the bath were determined over a
period of 2 to 3 h. They were able to show that the glycine was transferred from
perfusate to bath in all the tissues. In their in vivo experiments, absorption of amino
acids across the rumen was demonstrated using two catheterized goats and a steer. When
the goats were either forced fed ground shelled corn (450 g) or when glycine (15 g) was
infused into the rumen, the blood glycine concentration in the ruminal vein increased
markedly and remained elevated for a considerable period of time. In the goat that was
infused with glycine into the rumen, the blood glycine concentration in the ruminal vein
exceeded that of the jagular vein by 49 µmole/dL at 1 h after feeding. A marked
difference was still evident after 2 h but was no longer after 3 h. Similarly, when a
mixture of amino acids (serine, threonine, methionine, aspartic acid, asparagine,
28
glutamine, isoleucine and leucine) was placed in the rumen of a steer, the concentrations
of these amino acids in the ruminal vein increased to different levels. Thus individual
amino acids appear to be absorbed across the rumen in a different manner. However,
their study was criticized, as the initial concentrations of amino acids used may not occur
under normal physiological conditions in the rumen.
Subsequently, Leibholz (1971a) determined the relative rates of amino acid
absorption across ruminal epithelium by placing a mixture of amino acids in the washed
rumen of sheep. The amounts of individual amino acids lost from the rumen over a 4-h
period ranged from almost zero to 50% of the initial concentrations placed in the rumen.
However, her calculations of amino acid absorption across the rumen accounted for only
6% of the total N absorbed by the rumen. This estimate of N absorption was based on
her assumptions that amino acids and ammonia are usually present in the rumen in 1 : 8,
and the absorption occurs at 1 : 2 ratios. In another parallel study, Leibholz (1971b)
further suggested that the amount of amino acids lost from the rumen depended on their
concentration found in the ruminal fluid. Thus, Leibholz’s estimates of amino acid
absorption across the rumen may be subject to considerable variation depending on
dietary and animal conditions.
The specific mechanisms involved in the absorption of free amino acids across the
forestomach epithelium is not very well known. When Leibholz (1971b) investigated the
absorption of histidine across ruminal epithelial tissues (in vitro), the transport process
was clearly dependent on the substrate concentration used and was not saturable at
concentrations between 30 to 600 µmoles. However, a greater uptake of L-histidine than
D-histidine across ruminal epithelium suggested that the absorption was associated with
factors other than simple diffusion. Also, the increases in histidine uptake in the presence
of glucose or VFA and the inhibition in histidine uptake in the presence of 2,4,
dinitrophenol and iodoacetate implied that energy was required for this process. Further,
the transfer of L-histidine across the ruminal epithelium was reduced by 10 to 50% in the
presence of other amino acids suggesting that a common mediated transport mechanism
could be involved in the absorption of these amino acids.
Matthews and Webb (1995) studied the absorption of methionine and
methionylglycine via ruminal and omasal epithelia of sheep using parabiotic chambers.

29
Serosal appearance and tissue accumulation of 35S-methionine and 35S-methionylglycine
was quantified over a period of 240 min. The quantity of methionine transferred was
linearly dependent on time, greater across omasal than ruminal epithelia, and was greater
than methionylglycine. Transepithelial passage of methionine was non-saturable between
substrate concentrations of 0.375 to 12 mM. Hence they assumed that the absorption of
methionine across ruminal and omasal epithelia occurred by non-mediated mechanisms.
McCollum (1996) investigated the absorption of lysine across ruminal and omasal
epithelia of wethers using parabiotic chambers. The appearance of lysine (using 3H-L-
lysine as a representative marker) in the serosal buffers increased linearly with time for
both tissues during 60-min incubation. When the absorption was expressed on a tissue
dry weight basis, more lysine absorption was observed in omasal tissues than in ruminal
tissues. The tissues responded differently to increases in the mucosal concentrations of
lysine. The serosal appearance of lysine across ruminal epithelia increased proportionally
as the lysine concentration increased in the mucosal buffers between 0.09 to 3 mM.
Because the lysine uptake was not saturable across ruminal tissues, she postulated that
this occurred through nonmediated processes. But the appearance of lysine in the serosal
buffers of omasal tissues increased proportionately up to a substrate concentration of 1.5
mM and then plateaued suggesting a mediated absorption of lysine across omasal
epithelium.
The potential for mediated absorption of lysine in omasal epithelium was
evaluated further by studying the functional expression of ovine omasal mRNA in
Xenopus laevis oocytes (Matthews et al., 1996b). Compared to water injected oocytes,
RNA injected oocytes displayed a greater ability to absorb lysine from both Na+-free and
Na+-containing buffers. The linear rate of lysine uptake by RNA-injected oocytes was
approximately two times greater than that demonstrated by water-injected oocytes.
Within RNA fractions, the amount of induced lysine absorption did not differ between
buffers. Based on the above observations the authors indicate that the induced uptake of
lysine occurred by Na+ independent processes. In order to verify if this RNA-induced
uptake was the result of an increase in mediated absorption ability, the uptake of 0.05
mM lysine by water- and RNA-injected oocytes was evaluated in the presence of leucine,
glutamate or cystein. The absorption of lysine by oocytes was completely inhibited in the
30
presence of leucine but was not affected by glutamate displaying characteristic bo, +-like
mediated transport activity.
Evidence on Intact Peptide Absorption Across the Forestomach. Transmembrane
transport of peptides is a phenomenon widely distributed throughout the nature and is
present in animals including man, bacteria, fungi, yeast and in growing seeds (Matthews,
1991). Also, it was demonstrated to occur in several organs of the mammalian body
including intestine, liver, kidney and brain (Leibach and Ganapathy, 1996). Evidence of
the absorption of peptides across the gastrointestinal tract of ruminants have been
revealed in a number of recent studies (Koeln and Webb, 1982; Seal and Parker, 1991;
Backwell et al., 1995).
The first indication on the possibility of peptide absorption across ruminant
forestomach surfaced when DiRienzo (1990) quantified the fluxes of free and peptide
amino acids across the nonmesenteric-drained viscera of steers and wethers fed a hay and
concentrate (30:70) based diet. Flux of peptide amino acids across the nonmesenteric-
drained viscera accounted for 77% of the total portal drained viscera in both steers and
wethers. The ability of ruminal and omasal epithelial tissues to transport peptides was
demonstrated subsequently using different in vitro procedures (Matthews and Webb,
1995; McCollum, 1996; Pan, 1996). Matthews and Webb (1995) used ruminal and
omasal epithelia collected from sheep to study absorption of L-carnosine and L-
methionylglycine. The tissues collected were placed in parabiotic chambers with
mucosal surface exposed to a buffered solution (pH 6.0) containing varying
concentrations of the dipeptides. The serosal surface was exposed to a buffer (pH 7.0)
with no peptides. The chambers were maintained at 390C with O2 supply throughout the
experiment period. Serosal samples obtained at regular intervals for 240 min were
analyzed for carnosine and methionylglycine. The quantity of both peptides transferred
was linearly increased during 240-min incubation. With increasing mucosal
concentrations of dipeptides, a linear increase in the serosal appearance of peptides was
noted. When peptide uptake was expressed on tissue dry weight basis, omasal epithelia
exhibited a greater ability to absorb peptides than ruminal epithelia.
Mechanisms of Peptide Absorption. Proton-dependent dipeptide transport activity
in sheep omasal epithelium was demonstrated in a recent study conducted in this
31
laboratory (Matthews et al., 1996b). When size-fractionated poly (A+) RNA isolated
from omasal epithelial tissues of sheep were injected into defolliculated Xenopus laevis
oocytes, an increased rate of glycyl-L-sarcosine absorption was recorded by the oocytes.
The dependency of glycyl-L-sarcosine absorption on the presence of a pH gradient was
also noted in this study. Thus, carrier-mediated absorption can be an important
mechanism of peptide transport across the forestomach region of ruminants.
Pan (1996) revealed further details on the carrier-mediated peptide transport
activity in sheep omasal epithelium. Poly (A+) RNA isolated from sheep omasal
epithelium was injected into Xenopus laevis oocytes and the peptide transport capability
was measured by impaling oocytes with a microelectrode to monitor membrane potential.
The study concluded that several di-, tri-, and tetrapeptides with different amino acid
composition could serve as substrates for the mediated peptide transport activity in sheep
omasum. Because the RNA injected oocytes did not respond to some di-, tri-, and
tetrapeptides used in this study, the author suggests that substrate specificity may be
present in the absorption of peptides across ruminant forestomach.
The interactions of L-methionylglycine, glycyl-L-Leucine, L-carnosine, and
methionylglycyl-L-methionyl-L-methionine when glycyl-L-sarcosine was absorbed
across sheep omasal epithelial tissues were investigated using parabiotic chambers
(McCollum, 1996). The accumulation of glycyl-L-sarcosine in epithelial tissues was
inhibited by the other peptides used in this experiment suggesting a common mediated
transport mechanism involved in peptide absorption across omasal epithelium. Serosal
appearance of glycyl-L-sarcosine was stimulated by these peptides. Therefore, she
postulated that this increased uptake of glycyl-L-sarcosine might be due to paracellular
absorption. The necessary components for paracellular absorption of peptides are known
to present in the forestomach of ruminants (Matthews et al., 1996). Thus, paracellular
absorption can be an important mechanism of peptide transport across the forestomach in
ruminants.
The Nutritional Importance of Peptide Transport. The existence of peptide
transport mechanisms in the body can offer a variety of advantages. One important
proposition about the fate of absorbed peptides is their ability to serve as sources of
amino acids for peripheral tissue utilization. Direct and indirect evidence on the

32
utilization of peptides by body tissues and organs can be found in several reviews
(Krzysik and Adibi, 1977; Webb et al., 1993; Matthews et al., 1996). Using in vitro cell
culture studies, Pan et al., (1996) were able to demonstrate that the methionine containing
peptides can be efficiently used as sources of methionine for protein accretion and cell
proliferation of ovine skeletal muscles and bovine mammary epithelial cells. The
cultured cells were able to utilize methionine-containing peptides with responses ranging
from 29 to 123% of the response of free methionine. Also, methionine-containing
peptides were able to promote the synthesis of secreted proteins as effectively as free
methionine by cultured mammary epithelial cells (Wang et al., 1996). The above studies
emphasized that the peptides can be directly used at the cellular level as sources of amino
acids for protein accretion by peripheral tissues, and for milk protein synthesis.
Rapid absorption of peptides in comparison to the free amino acids has been
frequently reported (Adibi and Phillips, 1968; Matthews et al., 1968; Lis et al., 1971).
The influence that the composition and structure of peptides might have on this process
can not be overlooked. But, when partially hydrolyzed proteins (containing mostly small
peptides) were used to replace free amino acids in test diets, the absorptive advantages of
peptides could be very clearly noticed. A greater rate and extent of amino acid
absorption from partially hydrolyzed proteins than the corresponding mixtures of free
amino acids was commonly observed (Silk et al., 1980; Hara et al., 1984).
Use of peptides has gained a wide interest in clinical nutrition. Because certain
amino acids (e.g. tyrosine, cystine) are known to be sparingly soluble in free form but are
very soluble when provided as peptides (Grimble and Silk, 1989). Also, amino acids
such as glutamine and tryptophan can be relatively unstable in solution, but are very
stable when present as peptides (Hemmarkvist et al., 1988). Therefore, provision of
those amino acids in peptide form may help to overcome insolubility and instability
problems. The other benefits of dietary supplementation of peptides may include
conservation of metabolic energy, steady appearance of amino acids in the blood and
prevention of diarrhea due to lower osmotic load (Daniel et al., 1994; Ganapathy et al.,
1994). Thus, there can be a variety of advantages in the use of peptides for the
nutritionists and particularly in future ruminant feeding schemes, more emphasis will be
placed on the form of amino acids to be supplemented.

33
A Description on the Protein Ingredients Used in this Study.
A general description on the protein ingredients used for in vitro ruminal
incubation experiments is presented below.
Dehydrated Alfalfa Meal. The leaves of alfalfa are harvested at an early stage of
maturity and are artificially dried and ground to make alfalfa meal. It is a fairly good
source of protein (17.4% CP) with a respectable amino acid balance (NRC, 1988). But
the protein quantity and the quality can vary considerably according to the age of the
plant, soil fertility, variety and processing conditions. It is relatively high in crude fiber
(24%), and constitutes a fair amount of tannins, which may depress protein digestibility
(Millic et al., 1972). Due to the lower protein digestibility, and the presence of saponins
that impairs growth (Leamaster and Cheek, 1979), its use is limited in swine and poultry
diets. However, dehydrated alfalfa meal is used as a supplement to provide vitamins,
xanthophylls and unidentified growth factors in the diets of monogastric species.
Blood Meal. This is a by-product of the animal slaughter and meat processing
industry. The coagulated blood is dried by either spray drying or flash drying procedures,
and is ground to make blood meal. It is extremely high in protein (over 80% CP), but the
digestibility of the protein is lower than most other animal protein feeds. Blood meal is a
rich source of lysine and leucine, but the concentration of isoleucine is very low (NRC,
1988). Also, the mineral levels are quite low in blood meal with the exception of iron.
Because of its high concentration of available lysine, blood meal is ideal for
incorporation into cereal grain-based diets. Its use in diets is restricted due to low
palatability, poor digestibility, and due to the imbalanced amino acid composition
(Miller, 1990).
Brewers’ Dried Grains. Brewers’ grains consist of the insoluble residue that
remains after most of the starches and sugars have been removed from barley and
possibly other grains (maize and rice) in the brewing process. The wet brewers’ grains
contain about 70 to 75% moisture, and are sometimes given to cattle, sheep and horses in
this form. Brewers’ grains are dried to facilitate handling, transport, and storage. The
dried brewers’ grains usually contain more than 90% dry matter of which between 20 to
27% is crude protein depending on the amount and nature of additives used (Morrison,

34
1950). The protein is particularly low in lysine and tryptophan. High fiber contents and
the low energy values for monogastric species limit its use in their diets. Brewers’ dried
grains are extensively used in dairy diets primarily as a source of protein and secondarily
as a source of energy (Ensminger and Olentine, 1978).
Corn Gluten Feed. During wet milling manufacture of cornstarch or syrup, most
of the starch, gluten, and germ are extracted, and the remains of the shelled corn are used
as the corn gluten feed. Basically this feed contains hulls, evaporated steep water, and
germ meal. The protein content of corn gluten feed is relatively high (24% CP), but the
amino acids are not very well balanced. It is usually low in lysine and tryptopan (Holden,
1990). The calcium and phosphorus levels of corn gluten feed are generally high but the
availability of the phosphorus is low (Burnell et al., 1989). Corn gluten feed is chiefly
used as a protein supplement in dairy cow diets.
Cotton Seed Meal. Dehulled, oil-extracted cottonseeds are ground to a meal with
a certain amount of ground cottonseed hulls to make cottonseed meal. The extraction of
oil involves either expeller (screw press) or solvent procedures. Cottonseed meal is one
of the most popular protein supplements for cattle and sheep (Morrison, 1950). The
crude protein content usually varies from 36 to 41% depending on the amount of hulls
added and the processing method. The protein quality can vary according to the different
processing conditions. The meal is generally low in lysine, calcium, and carotene. It is a
good source of phosphorus. Raw cottonseeds contain appreciable amounts of free
gossypol, which can be toxic to nonruminants. Most of the free gossypol is destroyed
due to the heat during processing. It is relatively non-toxic and is palatable to ruminants
(Tanksley, 1990).
Distillers Dried Grains with Solubles. This product is obtained after the removal
of ethyl alcohol by distillation from the yeast-fermented grains, and by condensing and
drying at least three-fourths of the solids of the resultant whole stillage. The composition
of the feed may be influenced by the raw materials used, as well as processing
procedures. The crude protein content of this feed is approximately 27% (NRC, 1988).
Distillers dried grains with solubles have been successfully used in dairy, beef, and sheep
diets primarily as a source of protein. Due to the relatively high crude fiber levels (4.4 to
12.1%) and high fat contents (8.4 to 9.8%) the feed is also valued as an energy source for

35
ruminants. As a whole, distillers dried grains with solubles are a good source of vitamin
E, water soluble vitamins and phosphorous (Newland and Mahan, 1990).
Fish Meal. As a by-product of the fisheries industry, fish meal is produced using
dried, ground whole fish or fish cuttings, with or without the extraction of part of the oil.
Several types of fish meals are commercially available depending on the type of fish
(Herring, Menhaden, Sardine etc.) used. The protein content in all the fish meals usually
ranges between 55 to 70% (Morrison, 1950). Fish meal is a rich source of essential
amino acids, including lysine, methionine, and tryptophan. Therefore, it is a useful
supplement to cereal-based diets. Also, it is a good source of B-vitamins and minerals
such as calcium and phosphorus. The feeding value of fish meals can vary according to
the method of drying, the type of raw material used and the partial decomposition before
processing. Presence of high levels of fish oil in the meal can impart a fishy taste to eggs,
meat, and milk, and can lead to rancidity during storage. The high price limits the use of
this valuable feed in animal diets (McDonald et al., 1982).
Meat and Bone Meal. In meat processing plants, a fair amount of usable animal
tissues and bones are discarded. Those tissues and bones are dried and ground to make a
valuable protein meal. The crude protein content in meat and bone meal usually ranges
between 45 to 50% (Ensminger and Olentine, 1978). The protein of this meal is of fairly
good quality with a high concentration of lysine. The protein quality may differ
according to processing and storage conditions. Because of its rich bone content, meat
and bone meal is a very good source of minerals particularly calcium, phosphorus, and
magnesium. It is also high in B complex vitamins (McDonald et al., 1982).
Soybean Meal. This byproduct feed is reputed as the most popularly used protein
ingredient in animal diets. Soybean meal is produced during the extraction of oil from
soybeans by solvent or mechanical methods. The meal is toasted and ground during
processing. The protein content of soybean meals is generally standardized by dilution
with soybean hulls. The solvent extracted soybean meals usually contain between 44 to
50% crude protein (NRC, 1988). The expeller process tends to extract less oil than the
solvent process. Consequently, the expeller-extracted soybean meal contains a lower
amount of protein (41 to 44%) and a higher amount of fat (4 to 5%) than that of solvent
extracted soybean meals. The popularity of soybean meals in animal diet formulation is
36
attributed to several factors including widespread availability, palatability, and high
protein and energy contents. Soybeans have a number of stimulatory (e.g. genistein) and
inhibitory (e.g. antitrypsin factor, saponins) substances. Most of these substances are
usually destroyed due to the heat during processing (Church and Pond, 1988).
Casein. This is a generic term for a group of phosphoproteins, which constituted
to about 85% of the total milk protein. In milk, casein exists as its calcium salt (viz.
Calcium casienate) in distinct globular particles (micelles) of <10 to 780 mµ. Each
micelle contains four recognized components (αs, β , κ and γ-casein), which differ in their
electrical charge. Commercial casein is obtained from fat-free skim milk by precipitation
with acids, ammonium sulfate and enzymes (rennin), and by sedimentation using high
speed centrifugation (Brunner, 1977). Purified casein has been used in many ruminal
studies (Russell et al., 1983; Broderick and Wallace, 1988) as a reference protein.
37
Chapter III
OBJECTIVES
The overall objective of the research presented in this dissertation was to
demonstrate the potential of forestomach tissues of sheep to absorb peptides and free
amino acids produced due to the microbial degradation of proteins in the rumen. Specific
objectives included:
1) To estimate peptide, free amino acid, and ammonia productions in the
extracellular medium when different dietary proteins are incubated (in vitro)
with mixed ruminal microorganisms.
2) To observe the influence of milling differences of a protein on peptide, amino
acid, and ammonia production following ruminal microbial degradation.
3) To determine the compositions of free and peptide-bound amino acids
persisting in the extracellular medium following ruminal microbial
degradation of different proteins and among different batches of a protein.
4) To investigate the ability of ruminal and omasal epithelia of sheep to absorb
ruminally-produced peptides and free amino acids by in vitro methods.
5) To observe whether dietary proteins influence this latter process.
38
Chapter IV
OBSERVATIONS ON RUMINAL PROTEIN DEGRADATION PRODUCTS
FOLLOWING IN VITRO INCUBATION WITH MIXED MICROORGANISMS
ABSTRACT
The influence of proteins and milling procedures on the production of peptide,
α-amino, and ammonia-N was investigated following incubation of proteins using a
mixed microbial culture prepared from ruminal contents of lactating cows. The proteins
evaluated were solvent soybean meal, dehydrated alfalfa, corn gluten feed (CGF), fish
meal, distillers dried grains with soluble (DDG), cotton seed meal (CSM), brewers dried
grains, meat and bone meal, blood meal, prolac and casein. Soybean meals and DDG
obtained from different mills and at different times from the same mill were also
compared in separate experiments. The concentrations of peptide N, α-amino N, and
ammonia N appearing in the cell free media were measured at 0, 2, 4, 6 and 8 h of
incubation. The amino acid profiles of free and peptide-bound fractions at 8 h were
measured. The concentrations of peptide N and ammonia N were increased (P < 0.001)
with time. The concentrations of α-amino N were lower (P < 0.05) than the
concentrations of peptide N and ammonia N. There were time x protein interactions (P <
0.05) between proteins and between batches for peptide, α-amino, and ammonia-N.
Different proteins and batches had amino acid x protein interactions (P < 0.05) for
concentrations of total essential, total nonessential, total and individual amino acids (8 h)
in free and peptide-bound fractions. Low molecular weight (< 3,000 MW) peptide amino
acids contributed between 30 (CSM) and 55% (CGF) of the total peptide amino acids at 8
h. Irrespective of the protein used, specific patterns in the amino acid contents of
peptides (< 3,000 MW) were noted; methionine and histidine contents were very low,
while proline, glycine and alanine contents were high in this fraction. During protein
degradation in the rumen, peptides can accumulate in the ruminal fluid and the
microorganisms can exhibit a differential utilization of peptides.
(Key words : Cow, Rumen, Microorganisms, Protein, Amino acid, Peptide)
39
Introduction
Dietary proteins consumed by ruminants may be degraded extensively by
microbial activity in the rumen. Ruminal microorganisms degrade feed proteins through
a series of steps and synthesize microbial proteins or yield energy by fermentation
(Russell et al., 1991). Peptides, amino acids, and ammonia are produced as intermediates
or end products during this process (Annison, 1956). Early investigations often indicated
low concentrations of peptides and amino acids in the ruminal fluid which was believed
to be because of the rapid degradation of these by ruminal microorganisms (Wright and
Hungate, 1967; Mangan, 1972).
Evidence indicates that peptides (Chen et al., 1987a; Broderick et al., 1990) and,
to a lesser extent, free amino acids (Broderick and Kang, 1980) can accumulate in
ruminal fluid for a considerable time post feeding. It also appears that some peptides
(Chen et al., 1987c; Yang and Russell, 1990) and free amino acids (Chalupa, 1976) are
particularly resistant to ruminal microbial degradation. Evidence continues to
accumulate suggesting that peptides and free amino acids resulting from the microbial
activity in the rumen can be an important source of N for ruminants (Webb and
Matthews, 1994). Therefore, carefully studying the factors governing peptide and amino
acid production in the rumen will be of benefit in planning future ruminant feed
formulations. The present study assumes that the variations among proteins and
processing conditions can influence the amounts and the types of protein degradation
products accumulating in the rumen. Hence, a series of experiments were conducted to
make quantitative and qualitative estimates of peptide, free amino acid, and ammonia
production in ruminal fluid during incubation (in vitro) of a variety of proteins and to
investigate how the differences of milling may affect this process.
Materials and Methods
Unless noted otherwise, all chemicals and reagents were purchased from Sigma Chemical
Company (St. Louis, MO).
Preparation of the Inoculant Enriched with Mixed Ruminal Microorganisms.
Ruminal contents were obtained from two ruminally cannulated lactating Holstein cows
fed a diet consisting of: 337 g alfalfa hay, 225 g barley silage, 247 g high moisture corn,
90 g dried brewers grain, 67 g whole cotton seeds, 22 g soybean meal, and 12 g

40
minerals/kg DM. Whole ruminal contents were collected from the bottom of the rumen
approximately 2 h after feeding. Strained ruminal fluid (SRF) was obtained by squeezing
the ruminal contents through eight layers of cheesecloth. To extract some of the particle-
associated organisms, the remaining solid residue was washed four times with a total
volume of warm (390C) buffer (Table 4.1) equal to the original volume of SRF. The SRF
plus buffer extract were mixed and filtered through eight layers of cheesecloth. Ruminal
contents collected from two cows were processed in a like manner and equal volumes
were mixed together. This SRF plus buffer extract was then centrifuged at 5,000 x g for
30 min to harvest mixed ruminal microorganisms (Luchini et. al., 1996). The pellets
obtained after centrifugation were blended (30 s) with a volume of nutrient medium
(Table 4.1) equal to the original volume of SRF. The harvested, mixed ruminal
microorganisms were then transferred to a 4L bottle and allowed to incubate at 390C in a
water bath under CO2 for 6 h (Preincubation; Luchini et. al., 1996). The necessity of
having a preincubation period was noted in preliminary investigations. The bottle
containing the inoculant was shaken manually at regular intervals during preincubation to
prevent sedimentation. The composition of the buffer and the nutrient medium used are
presented in the Table 4.1. Mercaptoethanol was added (0.16 mL/L) to the nutrient
medium to serve as a reducing agent during incubation of proteins (Broderick, 1987).
The pH of the buffer and the nutrient medium was adjusted to 6.9 and was saturated with
CO2. The temperature was maintained at 390C using a constant temperature bath.
In vitro Incubation of Dietary Proteins. Proteins were collected from three major
feed manufacturers located around the Virginia Polytechnic Institute and State
University, namely, Roanoke City Mill, Roanoke, VA (RCM), Big Spring Mill, Elliston,
VA (BSM), and Southern States Mill, Richmond, VA (SSM). A total of 18 protein
sources (one kg each) were collected from the above feed manufacturers. Air dried
samples were ground to pass through a 1 mm screen using a Cyclotech mill and
subsamples of 250 g were obtained. The crude protein contents of the protein sources
were analyzed (AOAC, 1990) and are shown in Table 4.2. Five proteins were used in
each incubation experiment (except in Exp. 5 where only casein was used). The protein
sources used in each experiment were as follows:
41
Exp. 1: Soybean meal (solvent, RCM), fish meal (menhaden, SSM), dehydrated alfalfa
(RCM), corn gluten feed (RCM), and distillers dried grains with soluble (RCM),
Exp. 2: Cottonseed meal (SSM), brewers dried grain (SSM), blood meal (SSM), meat and
bone meal (SSM), and prolac (BSM) which contained 42% meat and bone meal, 40%
hydrolyzed feather meal, and 14% fish meal,
Exp. 3: Four solvent-extracted SBM samples and one expeller-extracted SBM sample
(ESB) were compared. Samples of solvent soybean meal included batches from different
mills and batches from the same mill processed at different times. These were solvent
soybean meal of Big Spring Mill (SSB), Southern States Mill (SSS) and Roanoke City
Mill batches 1 and 2 (SSR1 and SSR2, respectively),
Exp. 4: Different batches of distillers dried grain with solubles were compared (DGR1,
DGR2, DGR3, DGB, DGS). The DGR1, DGR2, and DGR3 represented three different
batches obtained from the same mill (RCM). DGB and DGS represented distillers dried
grains with soluble samples of Big Spring Mill and Southern States Mill, respectively,
and
Exp. 5: Only casein (United States Biochemical Corporation) was compared with a
control treatment (no added protein source).
Incubation was performed in plastic tubes (50 mL) sealed with rubber stoppers
that were fitted with Bunsen gas release valves as described by Tilley and Terry (1963).
The incubation time periods, amounts of proteins, and inoculant added to the tubes were
all decided based on preliminary experiments. Duplicate tubes from five protein
treatments and the control (blank tubes with all components except proteins added) were
allowed to incubate 0, 2, 4, 6, and 8 h in a constant temperature bath (390C). The
proteins equal to 0.5 mg N/mL of inoculant were placed in each tube before the
incubation started. Incubations began by dispensing 20 mL of the inoculant into each
tube using an Oxford bottle top dispenser. The space above the liquid in each tube was
flushed with CO2. The tubes were then sealed with rubber stoppers and stirred on a
vortex mixer. This point was considered as time zero. To confirm viable ruminal
microbial activity during the study period, the numbers of active protozoa surviving in
the media were estimated (by microscopic examination) in some randomly selected tubes
at the beginning and end of incubation. The incubation was arrested by adding 5 mL of
42
25% trichloroacetic acid (TCA) into each tube and stirring on a vortex mixer at each time
point. The tubes were then held on ice (40C) for 60 min and centrifuged (27,000 x g, 25
min, 40C) to harvest a cell free supernatant containing soluble components including
ammonia, amino acids, and peptides produced as a result of the degradation of proteins.
Ten milliliters of the supernatant from each tube were drawn and stored at -200C until
analyzed. Incubations were conducted on four separate runs for each study (except in
Exp. 5) using the same procedures and cows. For Exp. 5, incubations were performed in
one run using eight replicate tubes for each point of time of casein and control treatments.
Chemical Analysis. The concentration of ammonia N in each supernatant was
measured by the indophenol reaction as described by Chaney and Marbach (1962). Total
and α-amino N concentrations were analyzed using the ninhydrin color reaction in
hydrolyzed and nonhydrolyzed (6N HCl, 24 h, 1100C) samples as described by Broderick
and Kang (1980). The concentration of peptide N was calculated as the difference
between hydrolyzed and nonhydrolyzed samples. The amino acid composition of free
and peptide bound fractions that persisted in the ruminal fluid at the end of incubations (8
h) were determined by HPLC. The samples were analyzed using two procedures: without
filtration or with a filtration step using a Centricon-3-microconcentrator of 3,000 MW
cut-off filter (Amicon, Beverly, MA). The filtrates obtained after centrifugation (2,700 x
g, 2 h) by both methods were divided into two parts: one for the determination of free
amino acids, the other for the determination of total amino acids after acid hydrolysis
(vaporized HCl at 1120C for 24 h). The individual amino acid concentrations were
determined using a Pico Tag Amino Acid Analysis System (Waters Millipore Corp.,
Milford, MA). Peptide amino acid concentrations were calculated as the difference
between hydrolyzed and nonhydrolyzed samples.
Statistical Analysis. Data were analyzed as a completely randomized design.
The effects of protein sources, time, and protein sources x time on peptide N, α-amino N,
and ammonia N concentrations were evaluated by analysis of variance using the GLM
procedure of SAS (1988). The differences among protein sources on the mean
concentration of peptide N, α-amino N, and ammonia N concentrations at each time
interval were compared using the Tukey’s Student Range Test. The statistical
significance of differences among individual amino acid concentrations between the

43
protein treatments was assessed using the GLM procedure of SAS (1988), followed by
Duncan’s Multiple Range test. Orthogonal contrast was used to compare free vs peptides
and peptides (total) vs peptides (< 3,000 MW) for essential (EAA), nonessential (NEAA),
total, and individual amino acids.
Results
Changes in Ammonia N Concentrations With Time. Figure 4.1A shows the
changes in concentration of ammonia N in the extracellular media during incubation of
five proteins (DA, SBM, DDG, FM and CGF) used in Exp.1. When the N concentrations
of ruminal protein degradation products obtained at 0, 2, 4, 6 and 8 h of incubations were
pooled for each protein, ammonia N accounted for between 52 (CGF) to 82% (FM) of the
total N. The ammonia N concentration increased linearly (P < 0.01) with time in all
proteins, and there was a time x protein interaction (P < 0.01). The mean ammonia N
concentration varied from 5.82 ± 3.22 at 0 h to 171.44 ± 11.28 mg/L at 8h. At 6 and 8 h
of incubation, FM had the highest (P < 0.05) ammonia N concentrations.
The proteins used in Exp. 2 (CSM, BDG, BLM, PRL and MBM) also showed
a linear increase (P < 0.05) in the concentration of ammonia N with time (Figure 4.2A).
The mean ammonia N concentrations varied from 3.65 ± 2.22 at 0 h to 276.73 ± 14.30
mg/L at 8h. There was also a time x protein interaction (P < 0.05). The treatments of
MBM and PRL had the highest (P < 0.05) ammonia production at 8 h. The contribution
of ammonia N to the total estimated ruminal degradation products of Exp. 2 was between
78 (MBM) and 86% (CSM).
Presented in the Figure 4.3A are the changes in ammonia N concentration
during incubation of different batches of SBM used in Exp.3. Ammonia N contributed
between 80 (ESB) and 83% (SSB) of the total ruminal protein degradation products of
Exp. 3. The different batches of SBM had a time x protein interaction (P < 0.05) in
ammonia N concentrations. The changes in ammonia N concentration with time among
different SBM were linear (P < 0.001) for SSR2, SSB and SSS and (or) quadratic (P <
0.05) for SSR1 and ESB. The ammonia N concentration of ESB at 2, 4, 6 and 8 h were
lower (P < 0.05) than the solvent extracted meals of SSR2, SSB and SSS.
Data presented in the Figure 4.4A show the changes in ammonia N
concentration following incubation of different batches of DDG (Exp. 4). Ammonia N
44
accounted for between 65 (DGR3) to 71% (DGR1) of the total ruminal protein
degradation products of Exp. 4. The different batches of DDG also showed a time x
protein interaction (P < 0.05) in ammonia N concentration. The pattern of ammonia N
production was linear (P < 0.001) for DGR1, DGR2 and DGR3, and (or) quadratic (P <
0.001) for DGB and DGS. The treatment of DGB had higher (P < 0.05) ammonia N
production than the other treatments at 2, 4, 6 and 8 h of incubation.
Very high ammonia N production (from 7.28 ± at 0 h to 1,121.86 ± mg/L at 8
h) was observed during the incubation of casein (Figure 4.5). Ammonia N accounted for
78% of total N of estimated protein degradation products in comparison to 8% for α-
amino N and 14% for peptide N in casein. The ammonia N concentration of casein
increased quadratically (P < 0.001) with time.
Changes in α -Amino N Concentrations With Time. Presented in the Figure
4.1B are the changes in α-amino N concentrations following incubation of different
proteins in Exp.1. The concentrations of α-amino N were much lower than ammonia N
concentrations contributing between 4 (FM) to 11% (CGF) of the total N in protein
degradation products. The mean α-amino N concentrations obtained by averaging 40
observations of each protein incubated to 0, 2, 4, 6 and 8 h varied between 3.88 ±1.47
(SBM) and 23.02 ± 3.15 (CGF) mg/L. There was a time x protein interaction (P < 0.05)
primarily because of the fact that there was a decrease in α- amino N concentration with
CGF and DA during the first 4 and 6 h. In contrast, concentration of α-amino N were
influenced little by time for DDG, SBM and FM. Corn gluten feed showed the highest
(P < 0.05) α-amino N concentrations across all times in Exp. 1.
Relatively low concentrations of α-amino N were consistently observed in the
incubation of different proteins (Figure 4.2B), different SBM (Figure 4.3B) and different
DDG (Figure 4.4B) used in the experiments of 2, 3, and 4, respectively. The mean
concentrations of α-amino N obtained by averaging 200 observations of Exp. 1, Exp2,
and Exp. 3 were 7.99 ± 1.11, 5.96 ± 0.57 and 1.23 ± 0.49 mg/L, respectively. Also,
variable patterns in the concentration of in α-amino N with time were noted among
proteins. Increases in α-amino N concentration after a lag period of 2 to 4 h were
observed with all the proteins used in Exp. 2 (Figure 4.2B). The α-amino N

45
concentration tended to increase after a lag period (2 to 4 h) with all the SBM treatments
(Figure 4.3B). The α-amino N concentration in all the DDG treatments (Exp. 4) declined
with time (P < 0.05), and were near zero after 8 h of incubation (Figure 4.4B).
Incubation of casein (Exp. 5) showed a quadratic (P < 0.001) increase in α-amino N
concentration with time, and the concentration varied from 4.57 ± 2.08 at 0 h to 108 ±
7.63 mg/L at 8 h (Figure 4.5).
Changes in Peptide N Concentrations With Time. The data for peptide N
concentration following incubation of proteins in the Exp.1 are presented in Figure 4.1C.
The mean concentrations of peptide N obtained by averaging all 40 observations for each
protein incubated to 0, 2, 4, 6 and 8 h varied from 44.16 ± 3.05 (SBM) to 103.64 ± 5.27
(CGF) mg/L. Peptide N contributed a considerable proportion, representing 14 (FM) to
36% (CGF) of the total ruminal protein degradation products of Exp. 1. There were
differences in peptide N production among proteins as indicated by a time x protein
interaction (P < 0.01). Corn gluten feed had the highest peptide N concentration across
all time intervals. The initial concentration of peptide N in CGF was fairly high which
showed a declining trend before leveling off at about 4 h. The peptide N concentration
increased linearly (P < 0.05) during the incubation of other proteins in Exp. 1.
The contribution of peptide N to the total estimated ruminal protein
degradation products of Exp. 2 was between 11 (BLM) to 17% (MBM). The mean
concentration of peptide N (22.06 mg/L) obtained by averaging all 200 observations in
the Exp. 2 was lower (P < 0.05) than the ammonia N concentration (137.24 mg/L) and
was higher (P < 0.05) than the α-amino N concentration (7.99 mg/L). All the proteins
used in the Exp. 2 showed a linear (P < 0.05) increase in peptide production (Figure
4.2B). Also, there was a time x protein interaction (P < 0.05) in peptide N concentration.
The treatments of MBM and PRL had a comparatively higher (P < 0.05) peptide N
concentration than the other treatments across all the times.
When different batches of SBM were incubated, Peptide N accounted for 13%
of the total N in the estimated protein degradation products in comparison to 5% for α-
amino N, and 82% for ammonia N. The accumulation of peptide N during incubation of
different SBM (Exp. 3) was obvious (Figure 4.3C). While there were some differences
(P < 0.05) among SBM samples, all responded generally the same with a linear (P <

46
0.01) increase in peptide N concentration with time. Incubation of different batches of
DDG also showed a linear (P < 0.05) increase of peptide N concentration with time
(Figure 4.4C). Peptide N contributed to 28% of the total N in protein degradation
products in comparison to 3% for α-amino N, and 69% for ammonia N during the
incubation of different batches of DDG. A higher (P < 0.05) average peptide N
production than the other DDG treatments was observed with DGR1.
An accumulation of peptide N (from 7.86 at 0 h to 194 mg/L at 8 h) was
observed during the incubation of casein (Figure 5). The peptide N concentration of
casein increased quadratically (P < 0.001) with time.
The Amino Acid Composition of Ruminal Protein Degradation Products. The
concentrations of amino acids present in the extracellular media following incubation (8
h) of DA, SBM, FM, CGF and DDG (Exp. 1) are given in Table 4.3. The data include 16
amino acids that were present in free, peptide (total) and peptide (< 3,000 MW) bound
fractions. Asparagine, cystine, glutamine, and tryptophan are not included in the data, as
these amino acids are known to be severely affected during hydrolysis (Blackburn, 1968;
Wallace et al., 1993). The mean concentration of EAA in the free form was greater (P <
0.002) than the concentration of EAA in peptide form. The mean concentration of
NEAA was greater (P < 0.01) for peptides than for free amino acids. The concentrations
of peptide-bound aspartate, glycine, proline, serine and tyrosine were higher (P < 0.001)
than their concentrations in the free form. Conversely, the concentrations of arginine,
histidine, methionine and threonine were higher (P < 0.001) in the free form than in the
peptide-bound form. The low molecular weight peptide (< 3,000 MW) amino acids
contributed between 34% (SBM) and 55% (CGF) of the total peptide-bound amino acids.
The concentrations of EAA, NEAA and total amino acids were greater (P < 0.001) for
peptides (total) than for peptides (< 3,000 MW). The mean concentrations of arginine,
histidine, methionine and threonine did not differ (P > .05) between the two peptide
fractions. Variations (P < 0.01) among protein sources were observed in EAA, NEAA,
and total amino acids within free, peptide (total), and peptide (< 3,000 MW) amino acid
fractions. Corn gluten feed had the highest (P < 0.05) amino acid concentrations for
EAA, NEAA and total amino acids in both free and peptide forms. Some similarity
across treatments was observed in the appearance of certain amino acids within the low
47
molecular weight (< 3,000 MW) peptide fraction. All proteins of Exp. 1 had a zero
concentration of peptide-bound methionine following 8-h incubation. Also, the
concentration of histidine was very low (between 0 to 4% of total amino acids). The
concentrations of peptide-bound (< 3,000 MW) glutamate, proline, glycine, and alanine
tended to be high among all the proteins. Glutamate, proline, glycine, and alanine in
combination contributed between 46 (DA) to 55% (FM) of the total peptide-bound (<
3,000 MW) amino acids.
The variations in amino acid composition in the cell free media following the
incubation of proteins in the Exp. 2 are shown in the Table 4.4. The mean concentrations
of EAA and total amino acids were lower (P < 0.01) for peptides than for amino acids in
the free form. The opposite was true for NEAA. The concentrations of peptide-bound
aspartic acid, glutamate, proline, glycine, and serine were higher (P < 0.01) than their
concentrations in the free form. The low molecular weight (< 3,000 MW) peptide-bound
amino acids contributed between 30 (CSM) and 48% (MBM) of the total peptide-bound
amino acids. The concentrations of EAA, NEAA, and total amino acids were lower (P <
0.001) for peptides (< 3,000 MW) than for peptides (total). Differences (P < 0.01)
among protein treatments were found in the EAA, NEAA and total amino acid
concentrations of free and peptide-bound fractions. In the low molecular weight (< 3,000
MW) peptides, the concentration of histidine was very low (< 1% of total amino acids)
among all the treatments. Glutamate, proline, glycine and alanine in combination
contributed between 44 (CSM) to 67% (MBM) of the total peptide-bound (< 3,000 MW)
amino acids.
The mean concentrations of EAA (P < .001), NEAA (P < 0.07), and total
amino acids (P < 0.001) were lower for peptides than for free amino acid fraction during
the incubation of different SBM (Table 4.5). The concentrations of EAA (P < 0.005) and
total amino acids (P < 0.001) were lower (P < 0.001) for peptides (< 3,000 MW) than for
peptides (total). Variations (P < 0.01) among different SBM sources were noted for
peptide (total) bound amino acids. The low molecular weight peptides accounted for 16
(SSR1) to 33% (SSB) of the total peptide bound amino acids. The treatments of SSR1,
SSR2, SSS and ESB had a zero concentration of peptide-bound (< 3,000 MW)
methionine after 8 h of incubation. The concentrations of peptide-bound (< 3,000 MW)
48
arginine, histidine and lysine were also low among all SBM treatments. Proline, glycine
and alanine in combination contributed between 71 (SSB) and 88% (SSR2) of the total
peptide-bound (< 3,000 MW) amino acids of SBM treatments.
Table 4.6 shows the amino acid composition data of different DDG treatments
(Exp. 5). The mean concentrations of EAA, NEAA, and total amino acids were greater
(P < 0.001) for peptide than for free amino acid fraction. Variations among different
DDG treatments were found in the concentration of peptide bound EAA, NEAA, total,
and individual amino acids. The low molecular weight (< 3,000 MW) peptides
contributed between 29 (DGR3) to 40% (DGB) of the total peptide-bound amino acids.
The mean concentrations of EAA, NEAA, and total amino acids were greater (P < 0.001)
for peptide (total) than for peptide (< 3,000 MW). Variations were also noted among
different DDG sources in the concentrations of peptide-bound (< 3,000 MW) amino
acids. The concentration of peptide-bound (< 3,000 MW) methionine was zero (DGR3,
DGB and DGS) or very low (DGR1 and DGR2). Alanine, glutamate, glycine and proline
contributed to a large proportion (between 79 to 84% of the total amino acids) in the
peptides (< 3,000 MW) of all DDG treatments.
The composition of free and peptide-bound amino acids persisted in the media
following incubation (8 h) of casein is presented in the Table 4.7. Relatively higher
concentrations of EAA, NEAA, and total amino acids were observed in the free (P <
0.001) than in the peptide-bound fractions. The concentrations of aspartic acid, glycine,
proline, serine, and threonine were higher (P < 0.001) in the peptide fractions than in the
free amino acid fraction. The low molecular weight (< 3,000 MW) peptides accounted
for 48% of the total peptide-bound amino acids in casein. The patterns of amino acid
appearance in the peptide (< 3,000 MW) fraction were similar to those observed in the
experiments 1, 2, 3 and 4. Zero concentrations of histidine, methionine, and tyrosine
were found in the peptide (3,000 MW) fraction while glutamate, proline, glycine, and
alanine accounted for over 70% of the total amino acids in this fraction.
Discussion
A broad objective of the present series of experiments was to understand the
patterns and the possible mechanisms involved in the production of peptide N, α-amino
N, and ammonia N during dietary protein degradation in the rumen. There are several
49
reasons why results from this type of study would be of value. These include the
following: (i) the amount of feed proteins that can be converted to peptides, free amino
acids, and ammonia in the rumen appears to be quite considerable (Annison, 1956;
Russell et al., 1991), (ii) all of these products have been shown to contribute directly to
the ruminal microbial protein synthesis (Nolan, 1975; Argyle and Baldwin, 1989), (iii)
there is a wide interest in controlling ruminal protein fermentation at peptide and free
amino acid levels (Broderick et al., 1991), and (iv) peptides and free amino acids
resulting from microbial activity in the rumen have been suggested as important
substrates for direct absorption via the ruminant forestomach and intestine (Webb and
Matthews, 1994). But, time course data on the appearance and metabolism of ruminal
protein degradation products are somewhat limited and are often confusing due to the
differences in substrates, experimental procedures, and animals or microorganisms used.
The production of peptide N, α-amino N, and ammonia N was measured in this
study by incubating (in vitro) a variety of common dietary proteins with a mixed ruminal
microbial culture and measuring the N concentrations associated with each fraction in the
cell free media at regular time intervals. Time course data on ruminal degradation
products using purified proteins or synthetic peptides are available (Broderick and
Wallace, 1988; Wallace et al., 1993). But ruminal microorganisms usually do not
encounter such substrates under normal feeding conditions. Therefore, protein
ingredients commonly used in animal diet formulations were selected for these
experiments. Also, the substrates consisted of different proteins (Exp.1 and Exp. 2) as
well as the different batches of the same protein (Exp. 3 and Exp. 4).
Previous measurements of ruminal protein degradation products carried out by in
vivo procedures are available (Annison, 1956; Leibholz, 1969). As soon as they are
produced, the ruminal protein degradation products can leave the rumen with the digesta
flow to the duodenum (Chen et al., 1987b) or can be absorbed across the forestomach
epithelia (Leibholz, 1971). Therefore, measurements of peptide N, α-amino N, and
ammonia N concentrations in ruminal fluid in vivo, may not provide the actual patterns
of these compounds produced during ruminal protein degradation. In the present study, a
mixed microbial culture prepared from the ruminal contents obtained from lactating dairy
cows was used to simulate the microbial activity in the rumen. The amount of protein
50
added (0.5 mg N / mL of inoculation medium) to each incubation tube was decided upon
based on the preliminary results (data not shown) and this level reasonably compares
with the level of protein usually present in the ruminal fluid following dietary protein
supplementation (Waldo, 1967). Additionally, (i) nutrients and other conditions required
for a normal ruminal microbial activity (Johnson, 1963) were maintained throughout
incubations, (ii) incubations were performed for a relatively short time (8 h) to prevent
inhibition of microbial activity due to the accumulation of end products, and (iii) the
presence of active protozoa during incubations was confirmed by microscopic
examinations of protozoal numbers surviving in the media. Therefore, the catabolic and
anabolic processes of the ruminal microorganisms can be expected to be at least
somewhat similar to what would occur under in vivo conditions during the incubation
period studied.
Peptides, amino acids, and ammonia are produced in the medium not only due to
the degradation of feed proteins, but also from the microbial proteins recycled during
ruminal incubations. The amounts of N recycled from microbial proteins could be
considerable both under in vitro and in vivo conditions. With respect to the above, Leng
(1973) estimated that approximately 30% of the bacterial proteins produced are usually
degraded within the rumen in intact animals. To help account for the effects due to
recycling of microbial proteins, and the residual N compounds of the inoculant,
references were made using control treatments (with no added proteins). Therefore, the
measurements of peptide N, α-amino N, and ammonia N should reasonably represent the
effect due to dietary protein addition.
The specific objective of the experiments 1 and 2 was to observe the production
of peptide N, α-amino N, and ammonia N during the incubation of different dietary
proteins. A total of ten different proteins were evaluated in Exp. 1 (SBM, FM, DA, CGF
and DDG) and in Exp.2 (CSM, BDG, PRL, BLM and MBM). The objective of the next
two experiments was to investigate how different batches of SBM (Exp. 3) and DDG
(Exp.4) influence the production of peptide N, α-amino N, and ammonia N during
incubation. Four solvent-extracted SBM samples obtained from three mills (SSR1,
SSR2, SSB and SSS) and one expeller-extracted SBM sample (ESB) were evaluated in
the Exp. 3. The SSR1 and SSR2 were obtained at two different times from Roanoke City

51
Mills. Three DDG samples obtained from Roanoke City Mills (DGR1, DGR2 and
DGR3) and a sample each from Big Spring Mill (DGB) and Southern States Mill (DGS)
were tested in the Exp. 4. The objective of the Exp. 5 was to investigate the production
of peptide N, α-amino N and ammonia N during incubation of the purified protein,
casein.
A large accumulation of ammonia N was observed in all the experiments. This
agrees well with previous measurements on ammonia N (Annison, 1956), which
recognized ammonia as the major end product of protein catabolism in the rumen. The
protein utilization by ruminal microorganisms is known to occur in several distinct steps
including solubilization, proteolysis, peptide hydrolysis, transport of peptide and amino
acids into bacteria, fermentation, and microbial protein synthesis (Russell et al., 1991).
Accumulation of ammonia N during incubations indicates that the ruminal protein
fermentation occurs extensively and the ammonia is produced in excess of the microbe’s
capacity to utilize it for protein synthesis.
The concentrations of α-amino N were frequently low and the pattern of α-amino
N appearance varied widely among proteins. Other workers also reported similar
concentrations of α-amino N in the extracellular ruminal fluid (Wallace, 1979; Broderick
and Wallace, 1988). The low extracellular concentrations of α-amino acids suggest that
the degradation of peptides to free amino acids mostly occur intracellularly. Rapid
uptakes of amino acids by ruminal microorganisms and/or rapid deamination could also
be possible reasons for low extracellular concentrations of free amino acids. When
Broderick and Craig (1989) incubated casein and bovine serum albumin with mixed
ruminal microorganisms, the intracellular free amino acid concentrations started to
increase prior to the appearance of extracellular free amino acids. This observation
suggests that peptide uptake followed by intracellular hydrolysis may be the major route
of amino acid absorption by ruminal microorganisms. The enhanced growth responses
observed when amino acids were supplied as peptides in comparison to the free forms
(Argyle and Baldwin, 1989) further substantiates the thought that peptides are the
preferred substrates for absorption by ruminal microorganisms. Thus, low concentrations
of free amino acids can frequently appear in the extracellular ruminal fluid.
52
The peptide N was produced to a substantial level and there was a continuous
build up in the concentration of peptide N during incubations. Accumulation of peptide
N observed throughout the present series of experiments is in agreement with some
previous observations on ruminal protein degradation products (Russell et al., 1983; Chen
et al., 1987a). The above observations strongly indicate that the ruminal microorganisms
degrade dietary proteins extracellularly to peptides, and that the subsequent steps in the
degradation of proteins can occur at relatively slower rates than the rate of proteolysis.
Therefore, the extracellular hydrolysis of peptides and/or peptide transport into the
microbial cells could be rate limiting steps during protein utilization by ruminal
microorganisms (Chen et al., 1987a). Also, it was reported that ruminal microorganisms
can saturate their growth responses to peptides and amino acids at low concentrations
such as 10 mg/L (Argyle and Baldwin, 1989), and some peptides are particularly resistant
to further degradation in the rumen (Yang and Russell, 1992). As a result, ruminal
microorganisms may not be utilizing large quantities of peptides produced due to
proteolysis. Hence, the peptides can accumulate in the extracellular ruminal fluid during
the degradation of dietary proteins in the rumen.
Accumulation of total peptide-bound amino acids was always greater than the low
molecular weight (< 3,000 MW) peptide amino acids. This observation suggests that
some of the accumulated peptides are of large molecular weight (>3,000 MW). The
accumulation of larger peptides indicates that the size of those peptides may have
influenced their further degradation in the rumen. As the peptide transport systems of
ruminal bacteria are known to transport peptides below 5 to 16 amino acid residues
(Russell et al., 1991), peptides of transportable size should be produced by extracellular
peptidase activity. Therefore, the accumulation of large molecular weight peptides in the
medium could have been due to the lack of extracellular peptidase activities to degrade
them into a transportable size.
Substantial proportions of low molecular weight (< 3,000 MW) peptides were
also present in the extracellular medium. If the average molecular weight of an amino
acid of a peptide is assumed to equal 137 Da (Chen et al., 1987a), then this fraction
should contain peptides smaller than 22 amino acid residues and are mostly of
transportable size. Thus, the factors other than the size would have been more important

53
on the resistance of these peptides to the uptake by ruminal microorganisms. Presence of
some common patterns observed in the amino acid profiles of this peptide fraction
throughout all the incubation experiments indicate that the amino acid composition and
the structure of low molecular weight peptides can influence their uptake by ruminal
microorganisms. Some previous studies (Chen et al., 1987c; Broderick et al., 1988) also
proposed the presence of such patterns in the peptides present in the ruminal fluid. When
Chen and coworkers incubated tripticase (pancreatic digest of casein containing mostly
peptides) with mixed ruminal bacteria, peptides containing hydrophilic amino acids
(arginine, aspartic acid, glutamate and lysine) were metabolized more rapidly than those
containing hydrophobic amino acids (leucine, tryptophan, tyrosine, phenylalanine,
proline and valine). When the enzymatic digest of casein and gelatin were incubated,
mixed ruminal bacteria were unable to utilize all of the peptides even when the
incubation period was as long as 96 h (Yang and Russell, 1992). Those peptides that
persisted in the media contained a large proportion of proline. All above observations
imply that the ruminal microorganisms can have preferences or resistance in the
utilization of certain peptides and the composition and structure of the peptides appear to
be important determinants of their susceptibility or resistance to microbial degradation.
The results of the present study support the idea that ruminal microorganisms prefer
methionine and possibly histidine and tyrosine containing peptides. Consequently,
peptides containing those amino acids can be frequently lacking in the extracellular
peptide (< 3,000 MW) fraction of the ruminal digesta. Alternatively, the presence of
relatively high proportions of glutamate, proline, glycine and alanine containing peptides
were noted irrespective of the protein used. High glutamate contents could probably be
due to the presence of high concentration of this amino acid in the dietary proteins used
(Jurgens, 1993). However, proline, glycine and alanine contents are generally not found
in very high concentrations among the feed proteins used. The resistance of proline
(Yang and Russell, 1992) and glycine (Broderick et al., 1988) containing peptides to
further degradation by ruminal microorganisms were demonstrated previously using
synthetic peptides. Therefore, high proline, glycine, and alanine contents in the low
molecular weight (< 3,000 MW) peptide fraction indicate that the peptides containing
those amino acids could be resistant to further degradation by ruminal microorganisms
54
due to lack of uptake mechanisms and extracellular peptidase activities. Consequently,
those resistant peptides could frequently accumulate in the ruminal fluid.
The differences observed in the production of peptide N, α-amino N, and
ammonia N among proteins (Exp. 1 and Exp. 2) indicate that the variations among
proteins can influence the multi-step process of ruminal protein metabolism. The
differences in amino acid composition and the structure of the proteins may have a major
influence at one or more of the above steps to produce different types and amounts of
ruminal protein degradation products. Variations in the production of peptide N, α-
amino N, and ammonia N were also observed among the samples of different batches of
the same protein (Exp. 3 and Exp. 4). The amino acid composition data also reveals that
the concentrations of individual amino acids present in the extracellular peptide and free
amino acid fractions varies among proteins (Exp. 1 and Exp. 2) and among different
batches of the same protein (Exp. 3 and Exp. 4). The differences in primary (amino acid
sequence), secondary, and tertiary structures (folding and disulfide bridges) and
differences in solubility due to variations in starting materials and processing conditions
of the proteins could be the reasons for the above variations. When Yoon et al. (1995)
estimated ruminal degradability of menhaden fish meal, the degradability varied
considerably among samples depending on the raw material used, and/or the processing
conditions. The heat used during processing may change the nature of proteins by
inducing disulfide bonds and by losing amino acids (Opstredt et al., 1984). Also, the
length of storage prior to processing could have an influence on the rate and extent of
ruminal degradation of some feed proteins (Mehrez et al., 1980). It can be assumed that
the differences may have occurred among different batches of SBM and DDG proteins
used in experiments 3 and 4 due to the differences in raw materials, storage and
processing conditions. Additionally, the microbial activities occurring during the
processing of some byproduct feeds such as DDG and CGF may also have an effect on
their ruminal degradability. Therefore, those differences in the starting material and the
changes that occur in the nature of the protein due to the differences in storage and
processing conditions appear to influence the ruminal production of peptide N, α-amino
N, and ammonia N.

55
Implications
The data presented in this study demonstrated that peptides can accumulate
during the ruminal degradation of dietary proteins, and there is differential utilization of
peptides by microorganisms in the rumen. If future research prove that the ruminally
produced peptides can serve as a source of absorbed amino acids for ruminants then the
present findings may be useful in planing dietary supplementation strategies to increase
their efficiency of protein utilization.

56
Figure 4.1. Changes in concentrations (mg/L) of (A) ammonia N, (B) α- amino N, and(C) peptide N in the extracellular medium during in vitro ruminal incubation ofsoybean meal (SBM), fish meal (FM), dehydrated alfalfa (DA), distillers driedgrains with solubles (DDG), and corn gluten feed (CGF; experiment 1).
A
050
100150200250300
0 2 4 6 8Time (h)
Con
cent
ratio
n (m
g/L
)
SBMFMDADDGCGF
B
05
10152025303540
0 2 4 6 8Time (h)
Con
cent
ratio
n (m
g/L
)
SBMFMDADDGCGF
C
020406080
100120
0 2 4 6 8Time (h)
Con
cent
ratio
n (m
g/L
)
SBMFMDADDGCGF
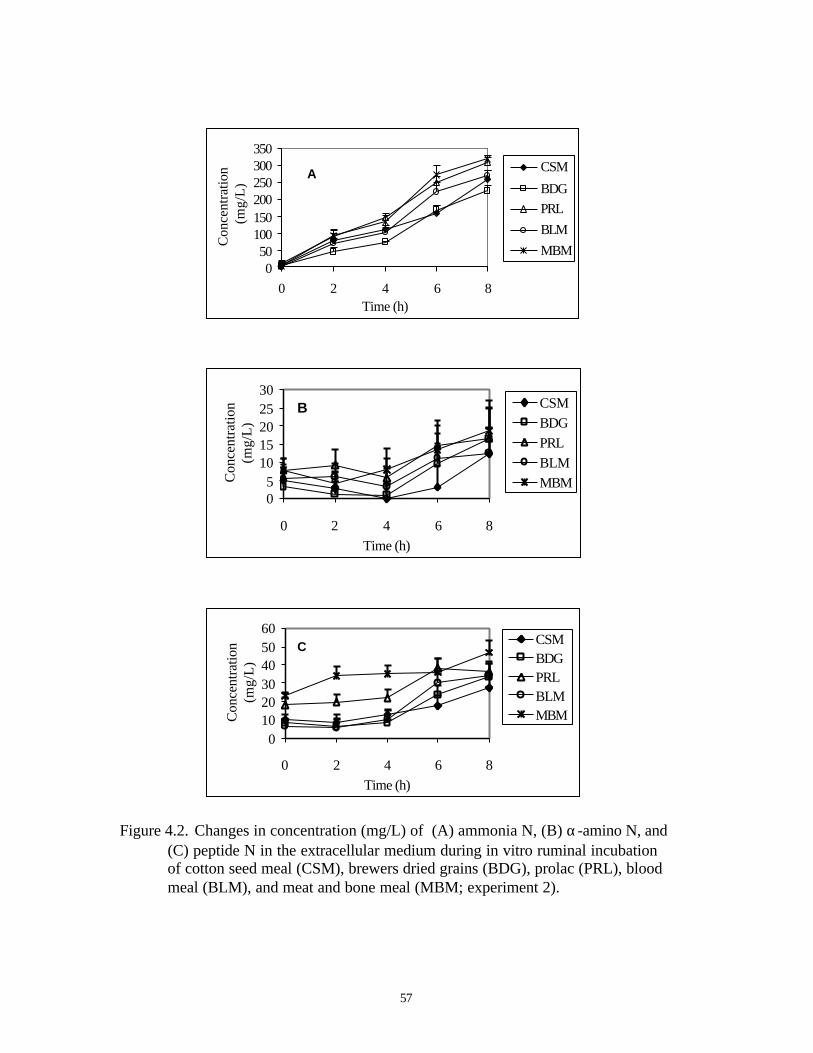
57
Figure 4.2. Changes in concentration (mg/L) of (A) ammonia N, (B) α-amino N, and(C) peptide N in the extracellular medium during in vitro ruminal incubationof cotton seed meal (CSM), brewers dried grains (BDG), prolac (PRL), bloodmeal (BLM), and meat and bone meal (MBM; experiment 2).
A
050
100150200250300350
0 2 4 6 8Time (h)
Con
cent
ratio
n (m
g/L
)
CSM
BDGPRLBLMMBM
B
05
1015202530
0 2 4 6 8Time (h)
Con
cent
ratio
n (m
g/L
)
CSMBDGPRLBLMMBM
C
0102030405060
0 2 4 6 8Time (h)
Con
cent
ratio
n (m
g/L
)
CSMBDGPRLBLMMBM
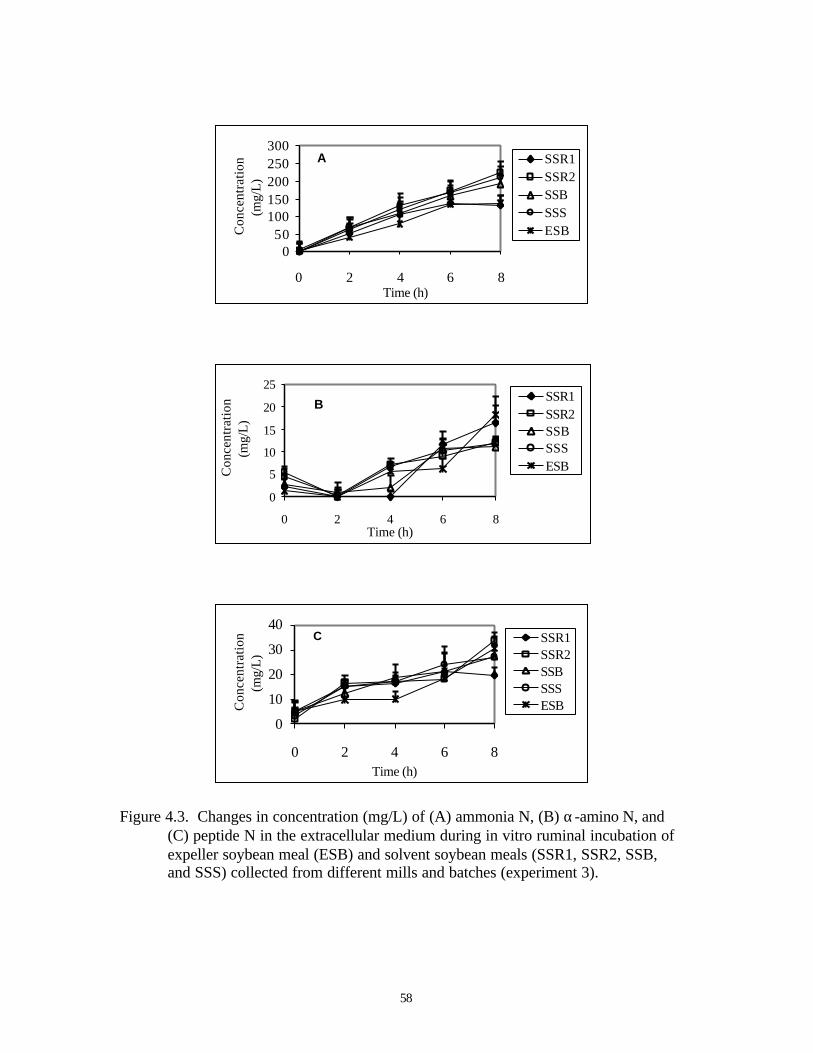
58
Figure 4.3. Changes in concentration (mg/L) of (A) ammonia N, (B) α-amino N, and(C) peptide N in the extracellular medium during in vitro ruminal incubation ofexpeller soybean meal (ESB) and solvent soybean meals (SSR1, SSR2, SSB,and SSS) collected from different mills and batches (experiment 3).
A
050
100150200250300
0 2 4 6 8Time (h)
Con
cent
ratio
n (m
g/L)
SSR1SSR2SSBSSSESB
B
0
5
10
15
20
25
0 2 4 6 8Time (h)
Con
cent
ratio
n (m
g/L)
SSR1SSR2SSBSSSESB
C
0
10
20
30
40
0 2 4 6 8Time (h)
Con
cent
ratio
n (m
g/L)
SSR1SSR2SSBSSSESB
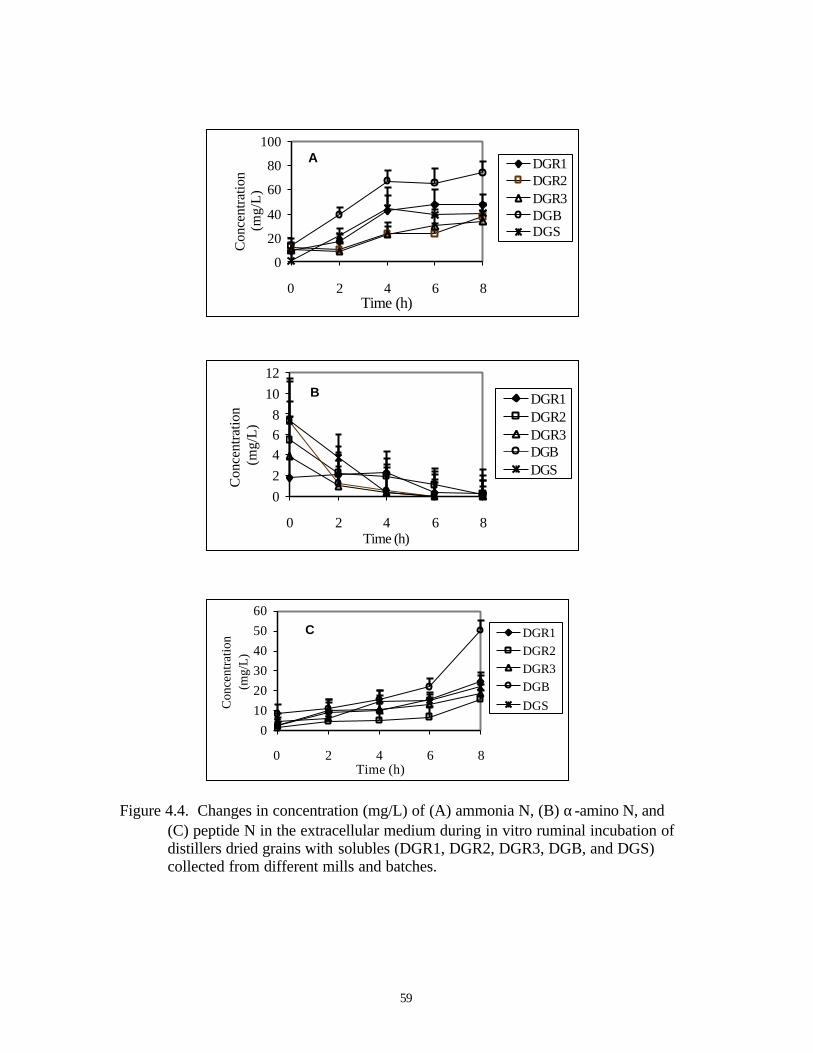
59
Figure 4.4. Changes in concentration (mg/L) of (A) ammonia N, (B) α-amino N, and(C) peptide N in the extracellular medium during in vitro ruminal incubation ofdistillers dried grains with solubles (DGR1, DGR2, DGR3, DGB, and DGS)collected from different mills and batches.
A
0
20
40
60
80
100
0 2 4 6 8Time (h)
Con
cent
ratio
n (m
g/L
)
DGR1DGR2DGR3DGBDGS
B
02468
1012
0 2 4 6 8Time (h)
Con
cent
ratio
n (
mg/
L)
DGR1DGR2DGR3DGBDGS
C
0102030405060
0 2 4 6 8Time (h)
Con
cent
ratio
n (m
g/L)
DGR1DGR2DGR3DGBDGS
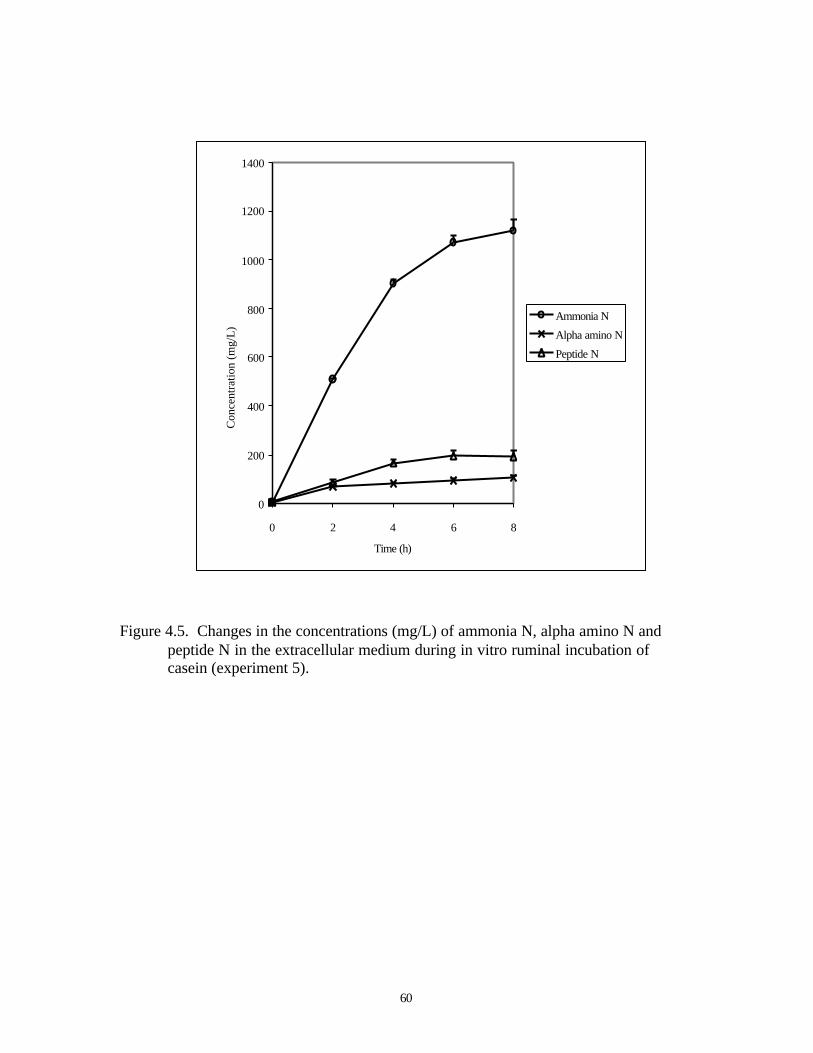
60
Figure 4.5. Changes in the concentrations (mg/L) of ammonia N, alpha amino N andpeptide N in the extracellular medium during in vitro ruminal incubation ofcasein (experiment 5).
0
200
400
600
800
1000
1200
1400
0 2 4 6 8
Time (h)
Con
cent
ratio
n (m
g/L
)
Ammonia N
Alpha amino N
Peptide N

61
Table 4.1. Composition of the buffer and the nutrient medium used for incubationexperiments.a
____________________________________________________________________________________________________________
Constituent Amounts (g/L)____________________________________________________________
Buffer Nutrient Medium________________________________________________________________________
Cellulose - 4.00
Starch - 1.00
KH2PO4 0.60 0.60
Na2HPO4.7H2O 1.20 1.20
NaHCO3 3.50 3.50
KCl 4.00 4.00
NaCl 4.00 4.00
MgSO4 0.15 0.15
CuSO4.5H2O - 0.002
MnSO4.5H2O - 0.0004
ZnSO4.7H2O - 0.0001
FeSO4.7H2O - 0.075
CoCl2.6H2O - 0.002
CaCl2 0.55 0.55______________________________________________________________________________________________________
a modified from Loper et al., 1966.

62
Table 4.2. Crude protein % of the protein sources used in the incubation experiments.
Protein source Mill / Batcha Crude Protein (%)
1. Soybean meal (solvent)2. Soybean meal (solvent)3. Soybean meal (solvent)4. Soybean meal (solvent)5. Soybean meal (expeller)6. Fish meal (Menhaden)7. Dehydrated alfalfa8. Corn Gluten Feed9. Distillers dried grains with solubles10. Distillers dried grains with solubles11. Distillers dried grains with solubles12. Distillers dried grains with solubles13. Distillers dried grains with solubles14. Cotton seed meal15. Brewers dried grain16. Meat and bone meal17. Prolac18. Blood meal19. Casein
RCM #1RCM # 2BSMSSMRCMSSMRCMRCMRCM # 1RCM # 2RCM # 3BSMSSMSSMSSMSSMBSMSSMUSBC
50.2451.5148.6950.9048.3766.3817.8523.9128.0128.6129.4628.1025.2746.1630.3959.8161.7999.4293.03
a RCM = Roanoke City Mill, BSM = Big Spring Mill, SSM = Southern States Mill,
USBC = United States Biochemical Corporation

63
Table 4.3 Free amino acid, peptide (total) amino acid, and peptide (< 3,000 MW) amino acid concentrations in extracellular media following in vitro ruminal incubation (8h) of dehydrated alfalfa (DA), soybean meal (SBM), corn
gluten feed (CGF), fish meal (FM) and distiller dried grain with solubles (DDG; experiment 1).
Free amino acids Peptide (total) amino acids Peptide (< 3,000 MW) amino acids Probabilitye Amino acid DA SBM CGF FM DDG Mean S.E. DA SBM CGF FM DDG Mean S.E DA SBM CGF FM DDG Mean S.E. 1 vs 2, 3 2 vs 3
------------------------------------------------------------------------------------------------------------ mg/L ----------------------------------------------------------------------------------------------
Arginine 4.44b 5.12b 4.86b 26.40a 4.38b 9.04 1.57 2.26b 2.16b 6.07a 0c 4.08ab 2.91 1.20 1.20cd 0.88d 3.87a 2.83b 1.90c 2.13 0.24 0.001 NSHistidine 3.87ab 3.97ab 2.97ab 6.64a 2.52b 3.99 0.76 0.64c 0d 6.46a 0d 2.55b 1.93 0.93 0.03c 0c 4.02a 0c 1.56b 1.12 0.89 0.001 NSIsoleucine 2.19b 3.17ab 6.03a 1.08b 1.86b 2.87 0.74 3.34b 2.51b 8.95a 3.01b 3.50b 4.26 0.49 1.88b 1.06b 5.55a 1.12b 1.23b 2.17 0.36 NS 0.001Leucine 1.91b 3.14b 10.06a 1.25b 1.81b 3.64 1.17 3.47b 3.03b 11.71a 4.36b 4.41b 5.40 0.58 1.66b 0.89b 7.31a 1.58b 1.45b 2.58 0.42 NS 0.001Lysine 6.54 6.32 5.33 6.84 5.87 6.18 0.41 7.74 bc 5.99c 12.69a 7.79bc 9.30b 8.70 0.51 4.36b 2.71c 6.32a 2.59c 4.34b 4.06 0.36 NS 0.001Methionine 5.56a 1.80b 4.38ab 3.21ab 3.15ab 3.62 0.55 0 0 0.02 0 0 0 0 0 0 0 0 0 0 0 0.001 NSPhenylalanine 1.55b 2.95ab 4.26a 0.33b 2.68ab 2.35 0.73 2.01b 2.21b 4.82a 2.95b 2.74b 2.95 0.22 1.11b 0.73 b 2.78a 1.21b 0.80b 1.33 0.17 NS 0.001Threonine 2.23b 1.67b 4.19a 1.66b 1.82b 2.31 0.26 5.25 bc 3.56c 12.79a 4.48bc 6.10b 6.44 0.63 2.88b 1.17c 7.89a 0.98c 2.35b 3.06 0.47 0.001 0.001Valine 3.11b 4.41b 9.02a 1.79b 2.73b 4.21 1.05 4.38b 2.88b 12.74a 3.70b 4.72b 5.68 0.68 2.45b 1.17b 8.15a 1.14b 1.74b 2.93 0.53 NS 0.001
Total essential 31.40b 32.56b 51.10a 49.20a 26.82b 38.22 4.11 29.08bc 22.34c 76.24a 26.28b 37.39b 38.27 3.82 15.57b 8.61c 45.88a 11.46c 15.37b 19.38 2.56 0.002 0.001
Alanine 5.50b 6.70b 14.21a 3.63b 6.25b 7.26 1.62 7.11b 5.88b 20.23a 8.43b 10.50b 10.43 0.92 2.81bc 1.49c 11.77 a 2.37bc 3.58b 4.40 0.68 NS 0.001Aspartic acid 0.15b 0.32b 0.93a 0.22b 0.22b 0.37 0.06 2.67b 2.30b 7.71a 2.13b 2.99b 3.56 0.53 1.74 1.16 2.11 .86 1.16 1.41 0.22 0.001 0.001Glutamic acid 4.70b 12.76a 18.12 a 7.55ab 12.14 a 11.05 1.46 7.64b 7.84b 36.16a 8.17b 13.14b 14.59 2.48 3.95b 1.52b 14.80a 2.18b 2.94b 5.08 1.37 NS 0.001Glycine 3.38ab 3.55ab 6.68a 2.29b 4.10ab 4.00 0.82 5.12b 3.66b 15.51a 6.69b 6.91b 7.58 0.79 3.10b 1.65c 9.62a 3.73b 3.05b 4.23 0.59 0.001 0.001Proline 2.52b 1.85b 4.82a 2.40b 3.07b 2.93 0.25 4.70bc 3.60c 20.72a 5.79bc 7.99b 8.56 1.24 2.75bc 1.84c 14.52 a 3.18bc 4.27b 5.31 0.97 0.001 0.001Serine 0.97b 0.82b 1.93a 0.85b 0.84b 1.08 0.12 5.59b 4.63b 12.06a 5.65b 6.98b 6.98 0.50 2.01b 1.02c 5.77a 1.56bc 1.80bc 2.43 0.33 0.001 0.001Tyrosine 1.96ab 2.19a 2.86a 1.20b 2.33a 2.11 0.33 0.39 0.47 1.11 0.43 0.69 0.62 0.21 0 0 0.47 0.05 0 0.11 0.15 0.001 0.01 Total nonessential 19.17b 28.19b 49.54 a 18.13b 28.96b 28.80 4.39 33.22c 28.37c 113.49a 37.30ab 49.19b 52.31 6.22 16.36b 8.68c 59.07a 13.93b 16.80 b 22.97 3.91 0.01 0.001
Total 50.57a 60.75a 100.64b 67.33a 55.78a 67.01 8.13 62.30bc 50.71c 189.73a 63.58bc 86.58b 90.58 9.84 31.93b 17.29 c104.95a 25.39 bc 32.17b 42.34 6.28 NS 0.001
a,b,c,d Within a row and within a category, means lacking a common superscript letter differ (P<.01).e 1= free amino acids, 2 = peptide (total) amino acids, and 3 = peptide (<3,000 MW) amino acids.

64
Table 4.4 Free amino acid, peptide (total) amino acid, and peptide (< 3,000 MW) amino acid concentrations in extracellular media following in vitro ruminal incubation (8h) of cotton seed meal (CSM), brewers dried grains (BDG),prolac (PRL), blood meal (BLM) and meat and bone meal (MBM; experiment 2).
Free amino acids Peptide (total) amino acids Peptide (< 3,000 MW) amino acids Probabilitye Amino acid CSM BDG PRL BLM MBM Mean S.E. CSM BDG PRL BLM MBM Mean S.E. CSM BDG PRL BLM MBM Mean S.E. 1 vs 2.3 2,vs 3
------------------------------------------------------------------------------------------------------------ mg/L ----------------------------------------------------------------------------------------------
Arginine 9.75ab 8.62b 14.78a 8.53b 11.54ab 10.64 0.42 2.11b 1.86b 2.67ab 1.89b 3.01a 2.31b 0.15 0.59b 0.62b 1.57a 0.28b 1.68a 0.95 0.13 0.001 0.001Histidine 2.66 2.77 3.02 3.23 2.82 2.90 0.10 1.19 1.10 1.39 1.19 1.55 1.28 0.07 0.34 0.52 0.45 0.16 0.66 0.43 0.06 0.001 0.001Isoleucine 1.10 1.14 1.18 1.14 1.18 1.15 0.03 2.49 2.60 2.73 2.40 2.82 2.61 0.10 0.83b 1.04a 1.15a 0.80b 1.03a 0.97 0.04 0.001 0.001Leucine 1.62 1.53 1.54 1.56 1.59 1.57 0.04 3.08b 3.28b 4.08a 3.40b 4.44a 3.65 0.15 0.53c 0.84bc 1.54a 0.93b 1.59a 1.08 0.09 0.001 0.001Lysine 9.02b 11.08a 9.93ab 10.16ab 9.57ab 9.95 0.22 6.20 7.52 7.34 6.75 7.45 7.05 0.28 2.37 3.18 3.82 2.49 2.97 2.97 0.22 0.001 0.001Methionine 1.68 0.72 0.73 0.64 0.70 .90 0.17 0 0.64 0.63 0.63 0.74 0.53 0.13 0.83 0 0.11 0.06 0.15 0.23 0.17 0.001 0.001Phenylalanine 0.25 0.50 0.41 0.51 0.20 .37 0.06 2.71 2.57 2.89 2.32 2.88 2.67 0.11 0.89b 0.83b 1.29a 0.80b 1.32a 1.03 0.07 NS 0.001Threonine 1.97b 2.72a 2.05b 1.83b 1.94b 2.10 0.07 3.69 3.80 3.86 3.54 4.13 3.81 0.11 0.72b 0.93ab 1.19a 0.91ab 1.21a 0.99 0.06 0.001 0.001Valine 2.08b 1.98b 2.32ab 2.42a 2.23ab 2.21 0.05 2.69b 3.13ab 3.33a 2.57b 3.57a 3.06 0.14 0.54b 0.93a 1.10a 0.51b 1.19a 0.85 0.06 0.001 0.001 Total essential 30.13b 31.06b 35.96a 30.00b 31.77b 31.78 0.63 24.15b 26.50ab 28.92ab 24.68b 30.57a 26.97 0.81 7.66b 8.90b 12.22a 6.94b 11.78a 9.50 0.58 0.001 0.001
Alanine 3.78c 4.64b 4.98b 4.67b 5.73a 4.76 0.17 7.38c 8.47b 8.90b 7.40c 10.36a 8.50 0.25 2.06d 2.81c 3.47b 2.45cd 4.38a 3.04 0.19 NS 0.001Aspartic acid 0.08 0.11 0 0 0 0.04 0.02 1.80b 2.07b 2.33ab 1.92b 2.74a 2.17 0.09 0.76b 1.03b 1.41a 0.99b 1.52a 1.14 0.06 0.001 0.001Glutamic acid 9.67a 7.39b 7.17b 8.32ab 7.57b 8.02 0.30 7.90ab 7.91ab 8.29ab 7.53b 9.87a 8.30 0.31 0.88b 2.84ab 3.97a 2.76ab 4.81a 3.05 0.41 0.001 0.001Glycine 2.02 2.03 2.45 2.04 2.59 2.23 0.06 4.45c 5.17c 7.77b 4.48c 11.42a 6.66 0.49 2.29c 2.80c 5.15b 2.23c 7.70a 4.03 0.38 0.001 0.001Proline 3.13c 3.23c 3.80b 3.23c 4.15a 3.51 0.11 3.28c 3.64c 6.05b 3.10c 8.75a 4.97 0.39 1.48c 1.79c 4.16b 1.49c 6.25a 3.03 0.34 0.001 0.001Serine 1.00 1.16 1.15 1.08 1.17 1.11 0.03 4.94c 5.41b 6.00a 4.97c 6.10a 5.48 0.14 1.04b 1.35b 1.96a 1.24b 2.04a 1.53 0.08 0.001 0.001Tyrosine 1.11 1.37 1.28 1.15 1.18 1.22 0.03 1.28 1.05 1.09 1.10 1.36 1.18 0.13 0.04 0 0.14 0.02 0.21 0.08 0.05 0.001 0.04 Total nonessential 20.80 19.93 20.83 20.50 22.39 20.89 0.49 31.04c 33.72c 40.44b 30.50c 50.60a 37.26 1.51 8.55d 12.61c 20.25b 11.19cd 26.91a 15.90 1.27 0.001 0.001
Total 50.93 b 50.98 b 56.78 a 50.50 b 54.16ab 52.67 1.01 55.01 c 60.22 c 69.36 b 55.18 c 81.18 a 64.19 2.13 16.20c 21.52c 32.47b 18.12c 38.69a 25.40 1.73 0.001 0.001
a,b,c,d Within a row and within a category, means lacking a common superscript letter differ (P<.01).e 1= free amino acids, 2 = peptide (total) amino acids, and 3 = peptide (<3,000 MW) amino acids.
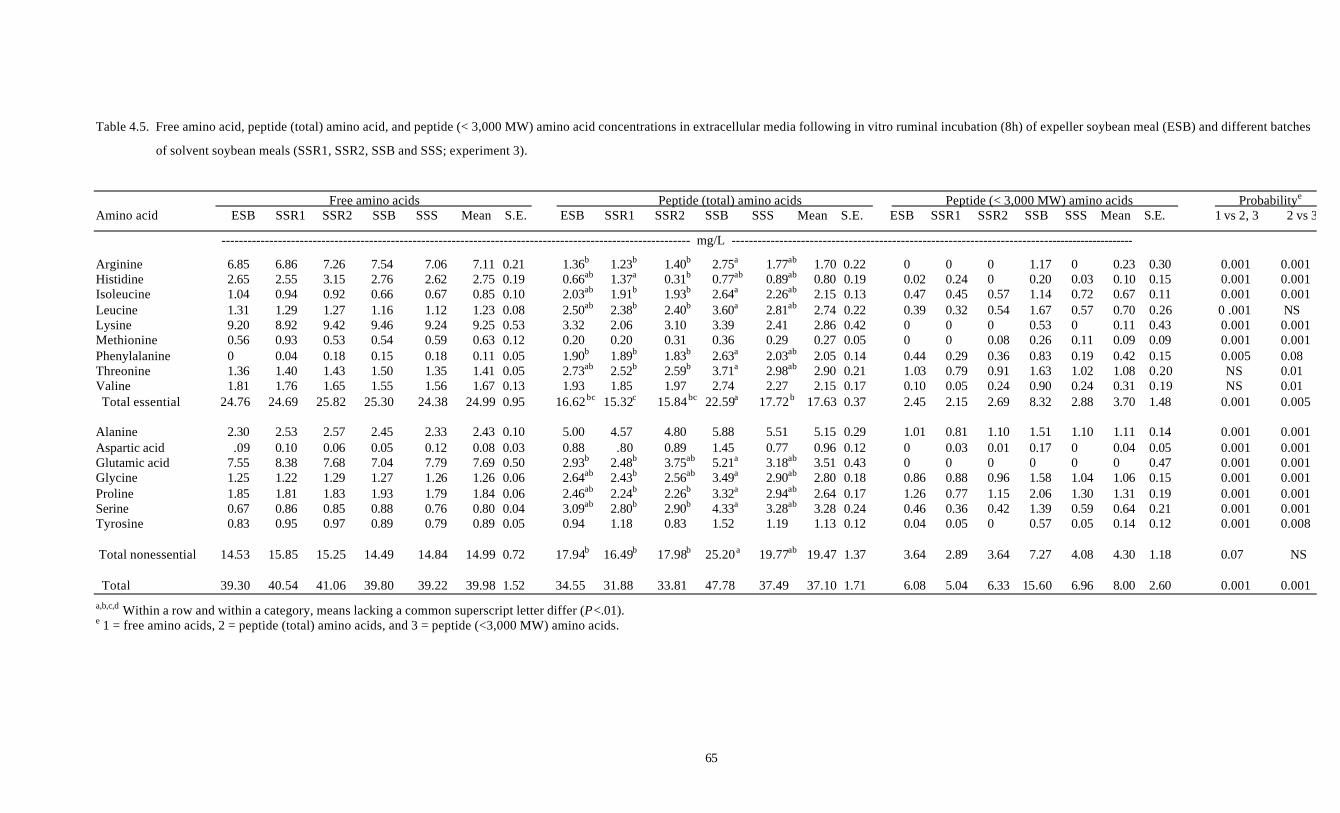
65
Table 4.5. Free amino acid, peptide (total) amino acid, and peptide (< 3,000 MW) amino acid concentrations in extracellular media following in vitro ruminal incubation (8h) of expeller soybean meal (ESB) and different batches
of solvent soybean meals (SSR1, SSR2, SSB and SSS; experiment 3).
Free amino acids Peptide (total) amino acids Peptide (< 3,000 MW) amino acids Probabilitye Amino acid ESB SSR1 SSR2 SSB SSS Mean S.E. ESB SSR1 SSR2 SSB SSS Mean S.E. ESB SSR1 SSR2 SSB SSS Mean S.E. 1 vs 2, 3 2 vs 3
------------------------------------------------------------------------------------------------------------ mg/L ----------------------------------------------------------------------------------------------
Arginine 6.85 6.86 7.26 7.54 7.06 7.11 0.21 1.36b 1.23b 1.40b 2.75a 1.77ab 1.70 0.22 0 0 0 1.17 0 0.23 0.30 0.001 0.001Histidine 2.65 2.55 3.15 2.76 2.62 2.75 0.19 0.66ab 1.37a 0.31b 0.77ab 0.89ab 0.80 0.19 0.02 0.24 0 0.20 0.03 0.10 0.15 0.001 0.001Isoleucine 1.04 0.94 0.92 0.66 0.67 0.85 0.10 2.03ab 1.91b 1.93b 2.64a 2.26ab 2.15 0.13 0.47 0.45 0.57 1.14 0.72 0.67 0.11 0.001 0.001Leucine 1.31 1.29 1.27 1.16 1.12 1.23 0.08 2.50ab 2.38b 2.40b 3.60a 2.81ab 2.74 0.22 0.39 0.32 0.54 1.67 0.57 0.70 0.26 0 .001 NSLysine 9.20 8.92 9.42 9.46 9.24 9.25 0.53 3.32 2.06 3.10 3.39 2.41 2.86 0.42 0 0 0 0.53 0 0.11 0.43 0.001 0.001Methionine 0.56 0.93 0.53 0.54 0.59 0.63 0.12 0.20 0.20 0.31 0.36 0.29 0.27 0.05 0 0 0.08 0.26 0.11 0.09 0.09 0.001 0.001Phenylalanine 0 0.04 0.18 0.15 0.18 0.11 0.05 1.90b 1.89b 1.83b 2.63a 2.03ab 2.05 0.14 0.44 0.29 0.36 0.83 0.19 0.42 0.15 0.005 0.08Threonine 1.36 1.40 1.43 1.50 1.35 1.41 0.05 2.73ab 2.52b 2.59b 3.71a 2.98ab 2.90 0.21 1.03 0.79 0.91 1.63 1.02 1.08 0.20 NS 0.01Valine 1.81 1.76 1.65 1.55 1.56 1.67 0.13 1.93 1.85 1.97 2.74 2.27 2.15 0.17 0.10 0.05 0.24 0.90 0.24 0.31 0.19 NS 0.01 Total essential 24.76 24.69 25.82 25.30 24.38 24.99 0.95 16.62 bc 15.32c 15.84 bc 22.59a 17.72 b 17.63 0.37 2.45 2.15 2.69 8.32 2.88 3.70 1.48 0.001 0.005
Alanine 2.30 2.53 2.57 2.45 2.33 2.43 0.10 5.00 4.57 4.80 5.88 5.51 5.15 0.29 1.01 0.81 1.10 1.51 1.10 1.11 0.14 0.001 0.001Aspartic acid .09 0.10 0.06 0.05 0.12 0.08 0.03 0.88 .80 0.89 1.45 0.77 0.96 0.12 0 0.03 0.01 0.17 0 0.04 0.05 0.001 0.001Glutamic acid 7.55 8.38 7.68 7.04 7.79 7.69 0.50 2.93b 2.48b 3.75ab 5.21a 3.18ab 3.51 0.43 0 0 0 0 0 0 0.47 0.001 0.001Glycine 1.25 1.22 1.29 1.27 1.26 1.26 0.06 2.64ab 2.43b 2.56ab 3.49a 2.90ab 2.80 0.18 0.86 0.88 0.96 1.58 1.04 1.06 0.15 0.001 0.001Proline 1.85 1.81 1.83 1.93 1.79 1.84 0.06 2.46ab 2.24b 2.26b 3.32a 2.94ab 2.64 0.17 1.26 0.77 1.15 2.06 1.30 1.31 0.19 0.001 0.001Serine 0.67 0.86 0.85 0.88 0.76 0.80 0.04 3.09ab 2.80b 2.90b 4.33a 3.28ab 3.28 0.24 0.46 0.36 0.42 1.39 0.59 0.64 0.21 0.001 0.001Tyrosine 0.83 0.95 0.97 0.89 0.79 0.89 0.05 0.94 1.18 0.83 1.52 1.19 1.13 0.12 0.04 0.05 0 0.57 0.05 0.14 0.12 0.001 0.008
Total nonessential 14.53 15.85 15.25 14.49 14.84 14.99 0.72 17.94b 16.49b 17.98b 25.20 a 19.77ab 19.47 1.37 3.64 2.89 3.64 7.27 4.08 4.30 1.18 0.07 NS
Total 39.30 40.54 41.06 39.80 39.22 39.98 1.52 34.55 31.88 33.81 47.78 37.49 37.10 1.71 6.08 5.04 6.33 15.60 6.96 8.00 2.60 0.001 0.001a,b,c,d Within a row and within a category, means lacking a common superscript letter differ (P<.01).e 1 = free amino acids, 2 = peptide (total) amino acids, and 3 = peptide (<3,000 MW) amino acids.
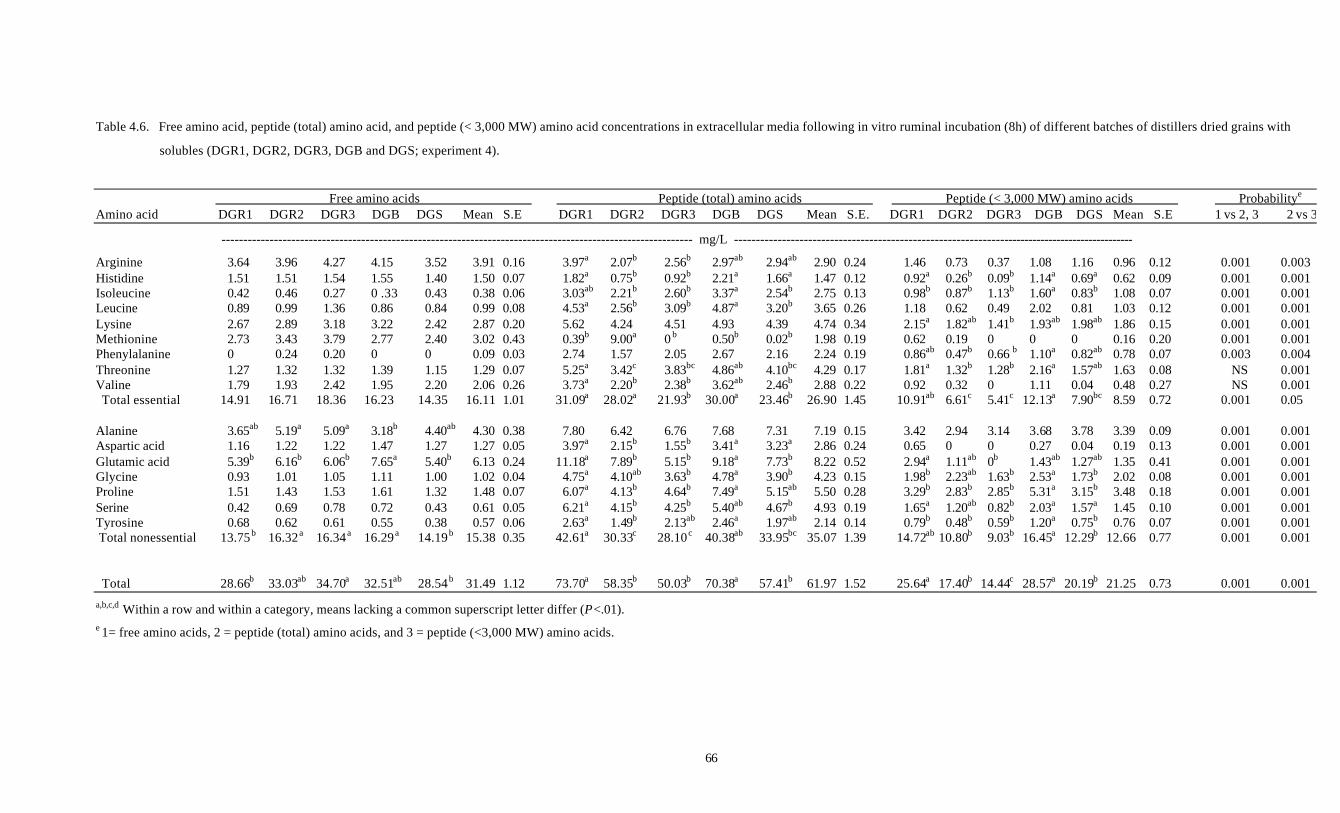
66
Table 4.6. Free amino acid, peptide (total) amino acid, and peptide (< 3,000 MW) amino acid concentrations in extracellular media following in vitro ruminal incubation (8h) of different batches of distillers dried grains with
solubles (DGR1, DGR2, DGR3, DGB and DGS; experiment 4).
Free amino acids Peptide (total) amino acids Peptide (< 3,000 MW) amino acids Probabilitye Amino acid DGR1 DGR2 DGR3 DGB DGS Mean S.E DGR1 DGR2 DGR3 DGB DGS Mean S.E. DGR1 DGR2 DGR3 DGB DGS Mean S.E 1 vs 2, 3 2 vs 3
------------------------------------------------------------------------------------------------------------ mg/L ----------------------------------------------------------------------------------------------
Arginine 3.64 3.96 4.27 4.15 3.52 3.91 0.16 3.97a 2.07b 2.56b 2.97ab 2.94ab 2.90 0.24 1.46 0.73 0.37 1.08 1.16 0.96 0.12 0.001 0.003Histidine 1.51 1.51 1.54 1.55 1.40 1.50 0.07 1.82a 0.75b 0.92b 2.21a 1.66a 1.47 0.12 0.92a 0.26b 0.09b 1.14a 0.69a 0.62 0.09 0.001 0.001Isoleucine 0.42 0.46 0.27 0 .33 0.43 0.38 0.06 3.03ab 2.21b 2.60b 3.37a 2.54b 2.75 0.13 0.98b 0.87b 1.13b 1.60a 0.83b 1.08 0.07 0.001 0.001Leucine 0.89 0.99 1.36 0.86 0.84 0.99 0.08 4.53a 2.56b 3.09b 4.87a 3.20b 3.65 0.26 1.18 0.62 0.49 2.02 0.81 1.03 0.12 0.001 0.001Lysine 2.67 2.89 3.18 3.22 2.42 2.87 0.20 5.62 4.24 4.51 4.93 4.39 4.74 0.34 2.15a 1.82ab 1.41b 1.93ab 1.98ab 1.86 0.15 0.001 0.001Methionine 2.73 3.43 3.79 2.77 2.40 3.02 0.43 0.39b 9.00a 0 b 0.50b 0.02b 1.98 0.19 0.62 0.19 0 0 0 0.16 0.20 0.001 0.001Phenylalanine 0 0.24 0.20 0 0 0.09 0.03 2.74 1.57 2.05 2.67 2.16 2.24 0.19 0.86ab 0.47b 0.66 b 1.10a 0.82ab 0.78 0.07 0.003 0.004Threonine 1.27 1.32 1.32 1.39 1.15 1.29 0.07 5.25a 3.42c 3.83bc 4.86ab 4.10bc 4.29 0.17 1.81a 1.32b 1.28b 2.16a 1.57ab 1.63 0.08 NS 0.001Valine 1.79 1.93 2.42 1.95 2.20 2.06 0.26 3.73a 2.20b 2.38b 3.62ab 2.46b 2.88 0.22 0.92 0.32 0 1.11 0.04 0.48 0.27 NS 0.001 Total essential 14.91 16.71 18.36 16.23 14.35 16.11 1.01 31.09a 28.02a 21.93b 30.00a 23.46b 26.90 1.45 10.91ab 6.61c 5.41c 12.13a 7.90bc 8.59 0.72 0.001 0.05
Alanine 3.65ab 5.19a 5.09a 3.18b 4.40ab 4.30 0.38 7.80 6.42 6.76 7.68 7.31 7.19 0.15 3.42 2.94 3.14 3.68 3.78 3.39 0.09 0.001 0.001Aspartic acid 1.16 1.22 1.22 1.47 1.27 1.27 0.05 3.97a 2.15b 1.55b 3.41a 3.23a 2.86 0.24 0.65 0 0 0.27 0.04 0.19 0.13 0.001 0.001Glutamic acid 5.39b 6.16b 6.06b 7.65a 5.40b 6.13 0.24 11.18a 7.89b 5.15b 9.18a 7.73b 8.22 0.52 2.94a 1.11ab 0b 1.43ab 1.27ab 1.35 0.41 0.001 0.001Glycine 0.93 1.01 1.05 1.11 1.00 1.02 0.04 4.75a 4.10ab 3.63b 4.78a 3.90b 4.23 0.15 1.98b 2.23ab 1.63b 2.53a 1.73b 2.02 0.08 0.001 0.001Proline 1.51 1.43 1.53 1.61 1.32 1.48 0.07 6.07a 4.13b 4.64b 7.49a 5.15ab 5.50 0.28 3.29b 2.83b 2.85b 5.31a 3.15b 3.48 0.18 0.001 0.001Serine 0.42 0.69 0.78 0.72 0.43 0.61 0.05 6.21a 4.15b 4.25b 5.40ab 4.67b 4.93 0.19 1.65a 1.20ab 0.82b 2.03a 1.57a 1.45 0.10 0.001 0.001Tyrosine 0.68 0.62 0.61 0.55 0.38 0.57 0.06 2.63a 1.49b 2.13ab 2.46a 1.97ab 2.14 0.14 0.79b 0.48b 0.59b 1.20a 0.75b 0.76 0.07 0.001 0.001 Total nonessential 13.75 b 16.32 a 16.34 a 16.29 a 14.19 b 15.38 0.35 42.61a 30.33c 28.10 c 40.38ab 33.95bc 35.07 1.39 14.72ab 10.80b 9.03b 16.45a 12.29b 12.66 0.77 0.001 0.001
Total 28.66b 33.03ab 34.70a 32.51ab 28.54 b 31.49 1.12 73.70a 58.35b 50.03b 70.38a 57.41b 61.97 1.52 25.64a 17.40b 14.44c 28.57a 20.19b 21.25 0.73 0.001 0.001
a,b,c,d Within a row and within a category, means lacking a common superscript letter differ (P<.01).e 1= free amino acids, 2 = peptide (total) amino acids, and 3 = peptide (<3,000 MW) amino acids.

67
Table 4.7. Concentrations of free amino acids, peptide (total) amino acids, and peptide (<3,000 MW) amino acids persisted in
the extracellular media following in vitro ruminal incubation (8 h) of casein (experiment 5).
Free AA Peptide (total) AA Peptide (<3,000 MW) AA ProbabilityaAmino acids
Mean SE Mean SE Mean SE 1 vs 2,3 2 vs 3
-----------------------------------------------mg/L--------------------------------------------
Arginine 2.76 0.09 2.90 0.18 1.26 0.11 0.001 0.001Histidine 13.18 0.59 - - - - 0.001 NSIsoleucine 15.36 0.77 5.57 0.56 2.48 0.59 0.001 0.001Leucine 25.17 1.29 6.53 0.87 2.38 0.88 0.001 0.001Lysine 12.09 1.28 10.20 0.84 4.35 1.18 0.001 0.001Methionine 0.72 0.16 0.19 0.26 - - 0.02 NSPhenylalanine 15.04 1.06 4.13 0.53 0.89 0.69 0.001 0.001Threonine 0.98 0.05 5.74 0.47 3.27 0.31 0.001 0.001Valine 16.95 0.70 4.70 0.61 1.87 0.45 0001 0.001
Total essential 102.25 5.70 33.32 4.58 7.15 3.71 0.001 0.001
Alanine 7.64 1.30 5.88 0.39 2.63 0.24 0.001 0.002Aspartate 1.35 0.07 3.30 0.37 2.85 0.42 0.001 NSGlutamate 20.85 1.56 11.80 1.91 10.86 1.99 0.001 NSGlycine 2.03 0.22 6.58 1.46 4.72 0.32 0.001 0.001Proline 1.19 0.06 6.83 0.36 4.50 0.26 0.001 0.001Serine 0.83 0.04 4.69 0.31 2.39 0.18 0.001 0.001Tyrosine 13.37 0.95 - - - - 0.001 0.05
Total nonessential 47.26 3.85 33.37 3.83 24.82 2.85 0.001 0.008
Total 149.51 9.45 66.69 8.23 31.97 5.85 0.001 0.001a 1= free amino acids, 2 = peptide (total) amino acids, and 3 = peptide (<3,000 MW) amino acids.
68
Chapter V
ABSORPTION OF RUMINALLY DERIVED PEPTIDES AND FREE AMINOACIDS VIA ISOLATED OVINE RUMINAL AND OMASAL EPITHELIA
ABSTRACT
Absorption of free and peptide-bound amino acids via ovine ruminal and omasal
epithelia was quantified using parabiotic chambers. Substrates consisted of cell-free
supernatants obtained following in vitro incubation (8 h) of either soybean meal (SBM),
casein (CAS), or distillers dried grains with solubles (DDG) in a buffered ruminal
inoculum. Amino acid concentrations in mucosal (0 h) and serosal (240 min) buffers
were measured by HPLC with and without filtration (through 3,000 MW filters). The
mucosal concentrations of total peptide amino acids in DDG, CAS and SBM were 178,
224 and 267 mg/L, respectively. Peptides (< 3,000 MW) contributed between 15 (SBM)
and 38% (DDG) of total peptide amino acids in mucosal fluid. The total free amino acid
concentrations of DDG, SBM and CAS in mucosal fluids (0 h) were 14, 28 and 113
mg/L, respectively. Total essential amino acids (EAA) consisted of 44, 46 and 54% of
total amino acids, respectively for peptide (< 3,000 MW), peptide (total) and free amino
acids. Serosal appearances of total amino acids were 391, 519 and 683 µg.L-1.mg-1 dry
tissue for SBM, DDG and CAS, respectively. Total amino acid appearances in serosal
fluids were 296, 444, and 853 µg.L-1.mg-1dry tissue for free amino acids, peptides (<
3,000 MW) and peptides (total), respectively. Serosal appearances of total amino acids
via ruminal and omasal tissues were 286 and 776 µg.L-1.mg-1dry tissue, respectively.
Total, EAA, total nonessential (NEAA) and individual amino acid appearances in serosal
fluids were varied (P < 0.05, amino acid form × protein source) among SBM, DDG and
CAS. The absorption of ruminally derived amino acids across ovine forestomach
epithelia are greater for peptides than for free amino acids, and greater via omasal than
via ruminal tissues. Dietary protein used for ruminal microbial degradation may
influence the amounts and types of free and peptide-bound amino acids absorbed via
forestomach epithelia.
Key Words: Rumen, Omasum, Amino acids, Peptides, Absorption

69
Introduction
During the degradation of proteins to ammonia in the rumen, peptides and amino
acids are produced as two inevitable products (Broderick and Wallace, 1988). Evidence
indicates that nutritionally significant quantities of peptides (Chen et al., 1987a) and
amino acids (Leibholz, 1969) can persist in the extracellular ruminal fluid for a period of
time post feeding. In our previous experiments, the accumulation of peptides (large
amounts) and free amino acids (small amounts) was demonstrated (in vitro) following
ruminal microbial fermentation of a variety of commonly fed dietary proteins (Chapter
IV). Though a substantial amount of these protein degradation products can accumulate
in the rumen, their exact fate is not clearly understood.
The duodenal flow of peptides and amino acids has been investigated (Broderick
and Wallace, 1988 Chen et al., 1987b). A considerable disagreement exists in the
duodenal flow of peptides and free amino acids estimated by different workers. The
ability of the ruminant forestomach epithelial tissues to absorb free and peptide bound
amino acids (Matthews and Webb, 1995) and some understanding on the mechanisms
involved in these processes (Matthews et al., 1996a) have also been demonstrated using
radio labeled and synthetic substrates. These workers emphasize that the transport of
peptides through the forestomach region could be an important route of their absorption.
If significant amounts of ruminally-produced peptides are transported across the
forestomach region, fundamental concepts of the protein nutrition of ruminants may need
to be altered. Therefore, the present study was designed to investigate the absorption
potential of ruminally-produced peptides and free amino acids via isolated ovine ruminal
and omasal epithelial tissues, and to determine the influence that different dietary
proteins may exert on this process.
Materials and Methods
Unless noted otherwise, all chemicals and reagents were prepared from Sigma
Chemical Company (St. Louis, MO). The Virginia Tech Animal Care Committee
approved protocol was used in the care and management of animals. Collection of
tissues and measurement of uptake were described previously (Matthews and Webb,
1995). A previous experiment conducted in this laboratory confirmed the ability of
70
experimental buffers to maintain tissue metabolism throughout a 240-min incubation
period in parabiotic chambers (Matthews and Webb, 1995).
In vitro Incubation of Dietary Proteins. Three proteins, soybean meal (solvent;
SBM), casein (CAS) and distillers dried grains with solubles (DDG), were selected for in
vitro ruminal incubation. The cell-free filtrates obtained following in vitro incubation of
the above proteins with a ruminal inoculant were used as mucosal substrates for the
uptake experiment. Preparation of buffer, inoculant medium and the incubation of
proteins were all done similar to those described previously during the ruminal incubation
experiment (Chapter IV) with some modifications. Incubation was performed in 250-ml
plastic centrifuge bottles sealed with rubber stoppers fitted with Bunsen valves.
Duplicate tubes containing protein plus inoculant were allowed to incubate (390C) for 8
h. At the end of incubation, the tubes were immediately centrifuged (27,000 x g, 25 min,
40C) to remove cellular and other insoluble matter. The supernatants containing peptides
and free amino acids produced due to the degradation of proteins were collected and were
filtered further through tissue culture filter units (0.2µ, NALGENE, Rochester, NY). The
filtrates were stored immediately at –200C. To obtain sufficient substrates, three
incubations were conducted on separate days. Filtrates obtained from different days were
composited for each protein, the pH was adjusted to 6.9 and were stored at –200C to be
used in the uptake experiment. The above filtrates (warmed to 390C) were used as
mucosal fluids of the parabiotic chambers to quantify serosal appearance of peptides and
amino acids across ruminal and omasal epithelia.
Animals, Feeding and Tissue Collection. Ruminal and omasal tissues were
obtained from two Dorset × Suffolk × Finn wethers (Mean BW 43.18 kg). Amino acid
uptake was quantified in two runs (on two separate days), and tissues used on a day were
collected from one wether. Wethers were housed with continuous access to water and
fed a mixed diet containing 50% ground shelled corn, 30% orchardgrass hay, 13.3%
soybean meal, 5% molasses, 0.5% limestone, 0.5% trace mineral salt and 0.42%
defluorinated rock phosphate (as-fed basis). Decoquinate (Cocci Control Crumbles
Medicated, Southern States, Inc., Richmond, VA) to supply 0.5 mg day-1 sheep-1 were
also added to the diet. The animals had been previously injected with vitamin A
(500,000 IU), vitamin D (75,000 IU), vitamin E (3.7 IU kg –1), and Se (55 µg.kg-1). At

71
the time of tissue collection, the selected wether was stunned with a captive-bolt pistol
(Super Cash Mark 2, Accles and Shelvoke LTD., Birmingham, England), and
exsanguinated. The abdominal cavity was opened and the stomach was removed quickly.
The reticulorumen was opened along the dorsal surface and digesta was removed by
rinsing with tap water. The omasum was opened through the omasal orifice and the
digesta was removed. Ruminal and omasal tissues were placed in 0.85% NaCl and
immediately transported to the laboratory. All rinsing solutions and buffers used were
maintained at 390C. Ruminal epithelial tissue was stripped from the underlying muscle
layer by careful dissection and then cut into pieces (≈ 4 cm x 4 cm). Omasal epithelial
tissue was prepared by peeling apart the opposing surfaces of individual plies. To
remove adhering digesta particles, the tissues were washed with gentle agitation first in
two baths of 0.85% NaCl then in four baths of Krebs Ringer Phosphate (KRP) buffer (pH
7.4, Umbreit et al., 1964). The tissues were finally held in oxygenated KRP buffer (pH
7.4).
Buffer Preparation. Krebs Ringer Phosphate buffer (pH 7.4) was used for tissue
preparation. This buffer was prepared on the day before the actual uptake measurement
and was stored at –40C overnight. The buffer was then warmed to 390C in a water bath
and gassed with 95% O2 / 5% CO2 for 1h before use. The KRP buffer used in the serosal
chambers of the parabiotic units contained 10 mM D-glucose and enough D-mannitol to
equalize osmolarity with the substrate used in the corresponding mucosal chamber.
Buffers used for uptake measurements were refrigerated (40C) overnight in 40-mL sealed
tubes. Two hours before the beginning of uptake measurements, these buffers were
aspirated into 20-mL syringes (Sherwood Medical, St. Louis, MO) that were capped with
25-gauge needles (Becton Dickinson and Co., Rutherford, NJ), inserted into neoprene
stoppers and placed into a 390C water bath.
Uptake Measurement. Parabiotic units consisting of two L-shaped glass
chambers of equal volume separated by a neoprene o-ring and held together by a clamp
were used. Epithelial tissues were mounted between the two chambers of the parabiotic
units. The chambers were designated as mucosal or serosal with reference to tissue
orientation. The area of exposed tissue was 1.77 cm2. Uptake measurements were
initiated by loading the appropriate substrates and buffers followed by inserting

72
gassing/sampling devices into mucosal and serosal chambers of each parabiotic unit
(Matthews and Webb, 1995). Mucosal chambers were filled with 15 mL of KRP buffer
(pH 6.9) as a control, or with a cell-free supernatant obtained following incubation of
soybean meal (SBM), casein (CAS) and distillers dried grains with solubles (DDG).
Serosal chambers were filled with 15 mL of KRP buffer (pH 7.4) containing 10 mM D-
glucose and enough D-mannitol to equalize osmolarity with the substrate used in the
corresponding mucosal chambers. For each of the two runs, 10 parabiotic units were
prepared for ruminal and ten for omasal tissues. For each tissue, three replicates of each
protein and a control were prepared. All chambers were gassed with 95% O2 / 5% CO2 at
a similar rate using polypropylene tubing. The mucosal buffer was sampled at 0 min and
the serosal buffer was sampled at 240 min. Sampling was performed by attaching a 1 mL
syringe to the luer stub adapter of the sampling line of each chamber and withdrawing .6
mL of buffer. After 240 min, tissues were removed and the area exposed to the buffer
was excised, blotted with absorbent paper, dried (1000C, 24h), and the dry weight was
recorded. Amount of free and peptide amino acids appearing in the serosal buffer were
quantified by HPLC using two procedures: without filtration or with a filtration step
using a Centricon-3-microconcentrator of 3,000 MW cut-off filter (Amicon, Beverly,
MA). The filtrates obtained after centrifugation (2,700 x g, 2 h) by both methods were
divided into two parts, one for the determination of free amino acids by immediate
analysis, the other for the determination of total amino acids after acid hydrolysis (6N
HCl at 1120C for 24 h). The individual amino acid concentrations were determined using
a Pico tag Amino Acid Analysis System (Waters Millipore Corp., Milford, MA). Peptide
amino acid concentrations were calculated as the difference between hydrolyzed and
nonhydrolyzed samples. The serosal appearance was expressed as µg. L-1.mg-1 dry tissue.
Statistical Analysis. The data were analyzed using the GLM procedure of SAS
(1988). Split-plot designs were used to analyze both mucosal concentrations and serosal
appearances. Animals (Runs) as main plots, and amino acid forms, tissue types and
protein sources as sub plots were used in 2 × 3 × 2 × 3 factorial combinations. Mucosal
concentration data were evaluated for the effect of animal, amino acid form, tissue type,
protein source, and amino acid form × protein source. Orthogonal contrasts were used to
partition the effects of amino acid form and protein source on mucosal concentration.

73
Serosal appearance data were evaluated for the effect of animal, amino acid form, tissue
type, protein source, amino acid form × protein source, amino acid form × tissue type,
protein source × tissue type and amino acid form × tissue type × protein source.
Orthogonal contrasts were used to partition the effect of amino acid form, tissue type and
protein source on serosal appearance. Student’s t test was employed to evaluate whether
serosal appearances (as a fraction of initial mucosal concentrations) differed from zero.
Results and Discussion
This experiment was designed to investigate the potential of ovine ruminal and
omasal epithelia to absorb free and peptide amino acids that are produced due to protein
degradation in the rumen. Cell-free supernatants obtained following in vitro ruminal
incubation of SBM, CAS, and DDG were used as mucosal substrates to simulate ruminal
fluid conditions with regard to free and peptide amino acid production during degradation
of these proteins in the rumen. The SBM was selected because of its common inclusion in
ruminant diets. The CAS and DDG were selected because of the relatively higher
peptide and free amino acid productions observed in previous incubation experiments.
Mucosal Concentrations. Table 5.1 shows the initial concentrations of free and
peptide amino acids among mucosal substrates. The mean mucosal concentrations of
EAA, NEAA, and total amino acids were greater (P < 0.001) for peptides than for free
amino acids. Total amino acid concentrations of peptides (total) were two (SBM) to 13
(DDG) times higher (P < 0.001) than the total free amino acid concentrations. Low
molecular weight (< 3,000 MW) peptides accounted for 15 (SBM) to 38% (DDG) of the
total peptide-bound amino acids. Greater concentrations (P < 0.05) of low molecular
weight (< 3,000 MW) peptides than free amino acids were observed with SBM and DDG.
The specific protein used for ruminal incubation influences the concentration of a
particular amino acid present in the ruminal fluid either in free or peptide form. Mucosal
concentrations of total, EAA, NEAA, and individual amino acids varied (P< 0.01, amino
acid form x protein interaction) among protein sources. Free amino acid concentrations
for total, EAA and NEAA were highest (P < 0.001) in CAS. Free amino acid
concentrations of SBM were greater (P < 0.05) than DDG for total, EAA, and NEAA.
The SBM exhibited the highest (P < 0.05) peptide (total) amino acid concentration for
74
total, EAA and NEAA. The highest (P < 0.05) concentrations of peptide (< 3,000 MW)
bound NEAA and total amino acids were found in DDG. The ratio of free amino acid
concentrations of EAA : NEAA ranged from 1:1 (SBM) to 1.7:1 (DDG). Ratios of EAA
and NEAA varied from 1:1.7(SBM) to 1.5:1 (CAS) for peptides (< 3,000 MW).
Thus, in this in vitro system, the concentration of peptide amino acids was greater
than the concentration of free amino acids. These concentrations are well within the
concentrations of free (7.2 to 60 mg/L) and peptide-bound (100 to 270 mg/L) amino N
reported to exist in the ruminal fluid of sheep and cows post feeding (Matthews et al.,
1996a). These observations emphasize that peptide accumulation in ruminal fluid can
exceed that of free amino acids following the degradation of proteins by microorganisms
in the rumen. As would be expected, the variations observed in the amino acid
concentrations among the different mucosal substrates indicate that dietary proteins can
influence the quantities of free and peptide amino acid produced in the rumen.
Serosal Appearances. The main effect means and the individual treatment effects
on the serosal appearance of free and peptide amino acids via ruminal and omasal
epithelia are presented in the Tables 5.2 and 5.3, respectively. Serosal appearances are
expressed as µg.L-1mg dry tissue-1 assuming that the surface area is different between
equal cross sections of ruminal and omasal epithelia and the mass of dry tissue is more
related to surface area than is cross sectional area (Stevens and Stetler, 1966). Matthews
and Webb (1995) also suggested that uptake expressed on a tissue dry weight basis is an
appropriate way of comparing translocation of free and peptide amino acids via ruminal
and omasal epithelia. The average tissue dry weights of ruminal and omasal epithelia
exposed to the buffers in the parabiotic chambers were 54.55 ± 4.71 and 20.82 ± 0.83 mg,
respectively. To account for residual free and peptide-bound amino acids of tissue origin
that may be transferred to serosal buffers from tissues directly, the serosal appearance
data for SBM, CAS, and DDG were corrected using controls that had only KRP buffers
as mucosal fluids. It is reasonable to assume then that, with the correction for the blank,
serosal appearance data of SBM, CAS, and DDG represent free and peptide amino acids
that were translocated from mucosal fluids.
75
Serosal appearances of EAA, NEAA, and total amino acids were greater (P <
0.001) for peptides than for free amino acids (Table 5.2). The serosal appearance of
amino acids in peptide form was nearly three times higher (P < 0.001) than free amino
acids. The uptake of aspartic acid, histidine, isoleucine, leucine, lysine, phenylalanine,
proline, serine, threonine, and valine were higher (P < 0.05) for peptides contributing
80% of the total peptide bound amino acid appearance. Conversely, the serosal
appearances of alanine, glutamic acid, glycine, and tyrosine were higher (P < 0.001) in
the free form than the peptide forms. In peptide form, the EAA accounted for about 82%
of the serosal appearance of amino acids. In contrast, only 24% of serosal appearance
was EAA in the free form. Low molecular weight (< 3,000 MW) peptides accounted for
a little more than half of the total peptide amino acids that appeared in the serosal fluid.
These results strongly support some previous research conducted in this
laboratory, which suggest that the forestomach can be an important site of peptide-bound
(relatively large) and free (relatively small) amino acid absorption in ruminants (Webb et
al., 1993; Matthews et al., 1996a). Those findings are in consistent with the observations
of Seal and Parker (1996), who reported a greater net appearance of peptide amino acids
than free amino acids across portal drained viscera than across mesenteric drained
viscera.
Serosal appearance of amino acids was greater (P < 0.01) across omasal than
across ruminal tissues (Table 5.2). The serosal appearance of total free amino acids
across omasal tissue was about 1.9 times greater than the total free amino acid uptake
across ruminal tissue. Meanwhile, peptide amino acid uptake was 2.7 (total) to 3.6 (<
3,000 MW) times greater across omasal tissues than via ruminal tissues. This accounts
for the amino acid form x tissue type interaction (P < 0.001) that was observed (Table
5.3). These observations support the concept that omasal epithelium has a greater ability
to translocate both free and peptide-bound amino acids than does the ruminal epithelial
tissues on a tissue dry weight basis. It appears also that omasal epithelium may have a
greater ability to translocate peptides than ruminal epithelium. Using carnosine,
methionine and methionylglycine, Matthews and Webb (1995) previously showed that
ovine omasal epithelium has a greater capacity to absorb free and peptide-bound amino
acids than does ruminal epithelium. This hypothesis is also supported by the

76
comparatively higher metabolic activity (Engelhardt and Hauffe, 1975), large numbers of
branching cells in the stratum basale (Steven and Marshall, 1970), greater potential
electrolyte flux (Martens and Gabel, 1988), and a greater blood supply (Engelhardt and
Hales, 1977) reported for the omasum. However, the actual amounts of total free and
peptide-bound amino acids absorbed via the rumen or the omasum under in vivo
conditions will also be influenced greatly by the retention time of protein digesta and the
overall surface area presented by the two organs.
When serosal appearance of amino acids were calculated as fractions of initial
mucosal concentrations, glutamic acid and tyrosine (free forms) had values greater than
1. Simultaneously, the serosal appearance of peptide-bound glutamic acid and tyrosine
were negligible though in combine they have contributed to >15% of the total amino
acids in mucosal fluids. The above observation possibly indicate that the peptides have
undergone hydrolysis during the passage through ruminal and omasal epithelia and the
corresponding free amino acids were released in to the serosal fluids. A considerable
hydrolysis of methionylglycine dipeptides during the transepithelial passage through
ruminal and omasal epithelia was reported using a similar in vitro system (Matthews and
Webb, 1995).
Translocation of free and peptide bound amino acids had not occurred in the same
proportions to their initial mucosal concentrations. Arginine, glycine, and tyrosine
showed a relatively high translocation (> 50% of the initial concentrations) though the
initial mucosal concentrations of these amino acids were very low (<10% of total free
amino acids). Meanwhile, the appearance of aspartic acid, histidine, isoleucine and
methionine were very low (<10%) or negligible though substantial amounts of these free
amino acids were present in the mucosal substrates. Meanwhile, the appearance of
peptide-bound arginine, isoleucine, and methionine was quite high (> 50% of initial
mucosal concentrations). Serosal appearance of peptide-bound aspartic acid and
glutamic acid were very low (<5% of initial mucosal concentrations) though these two
amino acids accounted for >25% of the total peptide-bound amino acids in the mucosal
fluids. These observations indicate that some selectivity may be present in the absorption
of both free and peptide amino acids via ruminal and omasal epithelia.

77
Multiple mechanisms could have been involved in the transport of free and
peptide amino acids via ruminal and omasal epithelia. In the first place, diffusion
appeared to play a major role in the absorption of peptides. The mucosal concentration
data of the present study along with previous observations (Broderick and Wallace,
1988), suggest greater concentrations of peptides than free amino acids in ruminal fluid
following protein degradation. Greater serosal appearance of peptide amino acids
observed across ruminal and omasal tissues probably reflects the concentration effect of
the mucosal substrates. The greater osmotic driving force created by relatively higher
peptide concentrations in mucosal substrates may have favored more peptide amino acid
absorption for transport via ruminal and omasal epithelial tissues by facilitated or simple
diffusion mechanisms. The present observations on selective absorption of peptide
amino acids indicate that processes other than simple diffusion may have been involved
in their transport. Therefore, facilitated diffusion could be a major mechanism involved
in the transport of peptides in the present study.
Carrier-mediated active absorption could also have been involved in the
absorption of peptide-bound amino acids via ruminal and omasal epithelia. Presence of
messenger RNA that encode for proteins capable of H+ dependent dipeptide transport
activity has been demonstrated in the omasal epithelia of sheep (Matthews et al., 1996b).
Also, the existence of a peptide transporter protein (Pep T1) in omasum and rumen of
sheep and cows was detected using a probe developed to detect Poly(A)+ RNA transcripts
(Chen et al., 1999). The other conditions (acidic pH levels to develop proton gradients,
H+ and Na+ ions, Na+/H+ exchangers and Na+/K+ ATPase) essential for carrier mediated
active absorption of peptides are also reported to present in the forestomach region of the
ruminants (Matthews et al., 1996a). The conditions favoring carrier-mediated active
absorption of peptides (H+ and Na+ ions and proton gradient) were maintained in the
experimental buffers. Therefore, carrier-mediated active absorption would have been
involved in the translocation of some peptide amino acids particularly those which were
present in low concentration in the mucosal fluid.
Paracellular absorption may also have been involved in the transport of peptides
via ruminal and omasal tissues. Paracellular transport has been suggested as a possible
mechanism of peptide absorption via forestomach epithelia (McCollum, 1997) whose
78
tight junctions are considered to be relatively loose than the enterocytes (fell and Weeks,
1975). Presence of high luminal concentrations and carrier-mediated mechanisms were
recognized as two prerequisites for the paracellular absorption of nutrients (Madara and
Pappenheimer, 1987). Relatively high concentrations of peptides in mucosal fluids and
the possible involvement of carrier-mediated mechanisms observed in the present study
support that paracellular absorption could be an important mechanism of peptide
transport via forestomach epithelia of ruminants.
Also, several mechanisms appeared to involve in the absorption of free amino
acids. Non-saturable absorption of free amino acids was reported in some previous
uptake studies (Leibholz, 1971; Matthews and Webb, 1995) to suggest that diffusion may
be involved in the transport of free amino acids via the forestomach. Carrier-mediated
facilitative transport was proposed in the transport of lysine and arginine across ruminal
tissues (Fejes et al., 1991). McCollum (1996) also demonstrated saturable uptake of
lysine via omasal tissues. But it was not certain if this occurred by carrier-mediated
active or facilitative transport. The present observations on relatively low concentrations
of free amino acids in the mucosal substrates suggest that simple and facilitated diffusion
mechanisms are of minor importance in the absorption of free amino acids via those
forestomach epithelial tissues. The present observations on low mucosal concentrations
along with selective absorption of free amino acids strongly support that carrier-mediated
active absorption could be involved to a greater in their transport.
Serosal appearances of amino acids were influenced by protein source (Table
5.2). There was a greater serosal appearance of amino acids from CAS than from SBM.
Differences between SBM and DDG were not significant. Uptake of lysine (P < 0.09),
methionine (P < 0.001), and glycine (P < 0.06) were greater for CAS than for SBM.
The above variations found in the serosal appearance of free and peptide-bound amino
acids among different mucosal treatments suggest that different proteins used for ruminal
incubation can influence amino acid absorption via the forestomach. Different proteins
used for in vitro ruminal incubations have created mucosal substrates of variable free and
peptide-bound amino acid concentrations, which appeared to influence absorption via
forestomach epithelial tissues. Therefore, dietary protein modifications in the rumen

79
seems to influence greatly on the absorption of free and peptide-bound amino acids via
the ruminant forestomach.
In summary, the results of this study provide evidences that peptides and free
amino acids resulting from the microbial degradation of proteins in the rumen can be
absorbed intact via ruminal and omasal epithelia. The absorption of peptides via
forestomach epithelia can usually exceed free amino acids. On tissue dry weight basis,
omasal epithelia could exhibit a greater capacity to translocate free and peptide-bound
amino acids than does ruminal epithelia. The dietary protein used for ruminal microbial
fermentation can manipulate the absorption of free and peptide-bound amino acids via
forestomach epithelia.
Implications
The results of this study indicate that the peptides and free amino acids produced
following the degradation of proteins by the microorganisms in the rumen can be
absorbed via ruminant forestomach. With more understanding on the magnitude and the
methods of manipulating this route of amino acid absorption, the information may be
incorporated in models that predict N supply to the ruminants. Also, supplementation of
amino acids via forestomach of ruminants would be of prime concern in future dietary
formulation efforts if the importance of this route of amino acid absorption were clearly
understood.

81
Table 5.1. The initial concentrations of free, peptide (total) and peptide (<3,000 MW) amino acids among mucosal substrates prepared from soybean meal (SBM), casein (CAS), and distillers dried grains with solubles (DDG).
Free amino acids Peptide (total) amino acids Peptide (<3,000 MW) amino acidsSE
Significance of contrasta
Amino acidSBM CAS DDG Mean SBM CAS DDG Mean SBM CAS DDG Mean 1 vs 2 1 vs 3 4 vs 5,6 5 vs 6
----------------------------------------------------------------------------------------------------------- mg/L -------------------------------------------------------------------------------------------
ArginineHistidineIsoleucineLeucineLysineMethioninePhenylalanineThreonineValine
Total essential
AlanineAspartic acidGlutamic acidGlycineProlineSerineTyrosine
Total nonessential
Total
2.232.711.321.550.901.241.160.792.18
14.08
4.940.001.963.052.380.141.35
13.82
27.90
1.702.54
10.9712.2211.161.917.232.71
10.11
60.55
10.916.31
18.015.043.041.218.19
52.71
113.26
2.222.390.110.510.601.460.000.920.53
8.74
1.580.041.290.630.660.300.55
5.05
13.79
2.052.554.134.764.221.542.801.474.27
27.79
5.812.127.092.912.030.553.36
23.87
51.66
13.734.02
13.1321.7319.485.61
15.1414.9613.09
120.89
15.8135.2743.9412.5412.6615.6110.58
146.41
267.30
10.223.30
12.7317.6925.815.99
12.9413.5711.00
113.25
13.1730.0626.3912.109.81
12.067.11
110.70
223.95
6.122.807.69
11.6913.821.168.14
11.658.94
72.01
14.3922.6428.0910.7512.3711.676.05
105.96
177.97
10.033.37
11.1917.0319.704.25
12.0713.3911.01
102.04
14.4629.3232.8011.8011.6213.117.91
121.02
223.06
1.320.001.442.263.281.981.711.781.43
15.20
2.446.588.322.392.832.470.85
25.88
41.08
2.551.533.093.616.663.702.472.852.22
28.68
2.395.301.953.773.122.580.00
19.11
47.79
1.901.472.373.184.153.322.183.503.03
25.10
5.738.17
11.344.617.283.341.64
42.11
67.21
1.921.002.303.014.703.002.122.712.23
22.99
3.526.687.203.594.412.800.83
29.03
52.02
0.440.190.500.730.830.100.510.540.46
3.91
0.531.221.380.410.430.560.43
4.75
8.55
0.035NS
0.0010.0010.0010.0010.0010.0720.001
0.001
0.001NS
0.0050.0010.0060.026
NS
0.001
0.001
0.001NS
0.0010.0010.001
NS0.001
NS0.001
0.001
NS0.0010.0010.0080.0010.0070.001
0.001
0.001
0.001NS
0.0010.0010.0010.0010.0010.0010.001
0.001
0.0010.0010.0010.0010.0010.0010.002
0.001
0.001
0.0010.0010.0010.0010.0010.0010.0010.0010.001
0.001
0.0010.0010.0010.0010.0010.0010.001
0.001
0.001a1 = SBM, 2 = CAS, 3 = DDG, 4 = Free amino acids, 5 = peptides (total) amino acids, 6 = peptides (< 3,000 MW) amino acids.

82
Table 5.2. Main effect means of protein source, amino acid form, and tissue type on serosal appearance of amino acids following 240 min of incubation with substrates prepared from soybean meal (SBM), casein (CAS), anddistillers dried grains with solubles (DDG).
Protein source Amino acid Form Tissue Significance of contrastAmino acid SBM CAS DDG Free Peptide
(total)Peptide
(<3,000MW)Ruminal Omasal SE SBM vs CAS SBM vs DDG Free vs
PeptideRuminal vs
Omasal------------------------------------------------------------------µg.L-1mg dry tissue-1------------------------------------------------
ArginineHistidineIsoleucineLeucineLysineMethioninePhenylalanineThreonineValine
Total essential
AlanineAspartic acidGlutamic acidGlycineProlineSerineTyrosine
Total nonessential
Total
32.9712.0016.8130.1215.41
101.3014.5516.6921.02
260.87
21.1111.9922.2220.0320.6210.8523.31
130.13
391.00
35.8314.0226.2231.7727.16
319.5717.3919.0328.68
519.67
27.5414.0423.6129.4725.75
9.8632.76
163.03
682.70
40.5013.0620.2035.1226.73
149.9919.0120.4426.11
351.26
25.0217.0526.2031.0227.4617.9823.10
167.84
519.10
35.350.750.386.99
12.080.990.007.576.16
70.27
38.960.19
72.0333.2311.60
2.9966.51
225.51
295.78
32.5636.8532.2164.2643.58
321.9151.0540.1151.28
673.81
26.7538.04
0.0023.7950.1427.1412.66
178.78
852.59
41.391.48
30.6325.7613.64
247.970.008.47
18.38
387.71
7.964.860.00
23.5012.09
8.300.00
56.72
444.43
18.679.67
10.9921.0516.5770.0313.8110.5516.82
188.16
16.729.57
20.0017.6415.22
5.8512.75
97.75
285.91
54.1916.3931.1643.6229.63
310.5520.2226.8833.72
566.33
32.3919.1528.0236.0434.0019.9440.03
209.57
775.90
3.132.104.004.30
14.2938.88
3.362.793.19
48.95
3.4112.49
5.802.883.152.818.17
25.66
58.47
NSNSNSNS0.09
0.001NSNS0.10
0.001
NSNSNS0.06NSNSNS
NS
0.001
NSNSNSNSNSNSNSNSNS
NS
NSNSNSNSNSNSNS
NS
NS
NS0.0010.0010.001
NS0.0010.0010.0010.001
0.001
0.001NS
0.0010.0010.001
0.050.001
0.001
0.001
0.0010.0030.0010.0010.100.0010.050.0010.001
0.001
0.0010.10NS0.030.0010.01NS
0.01
0.001
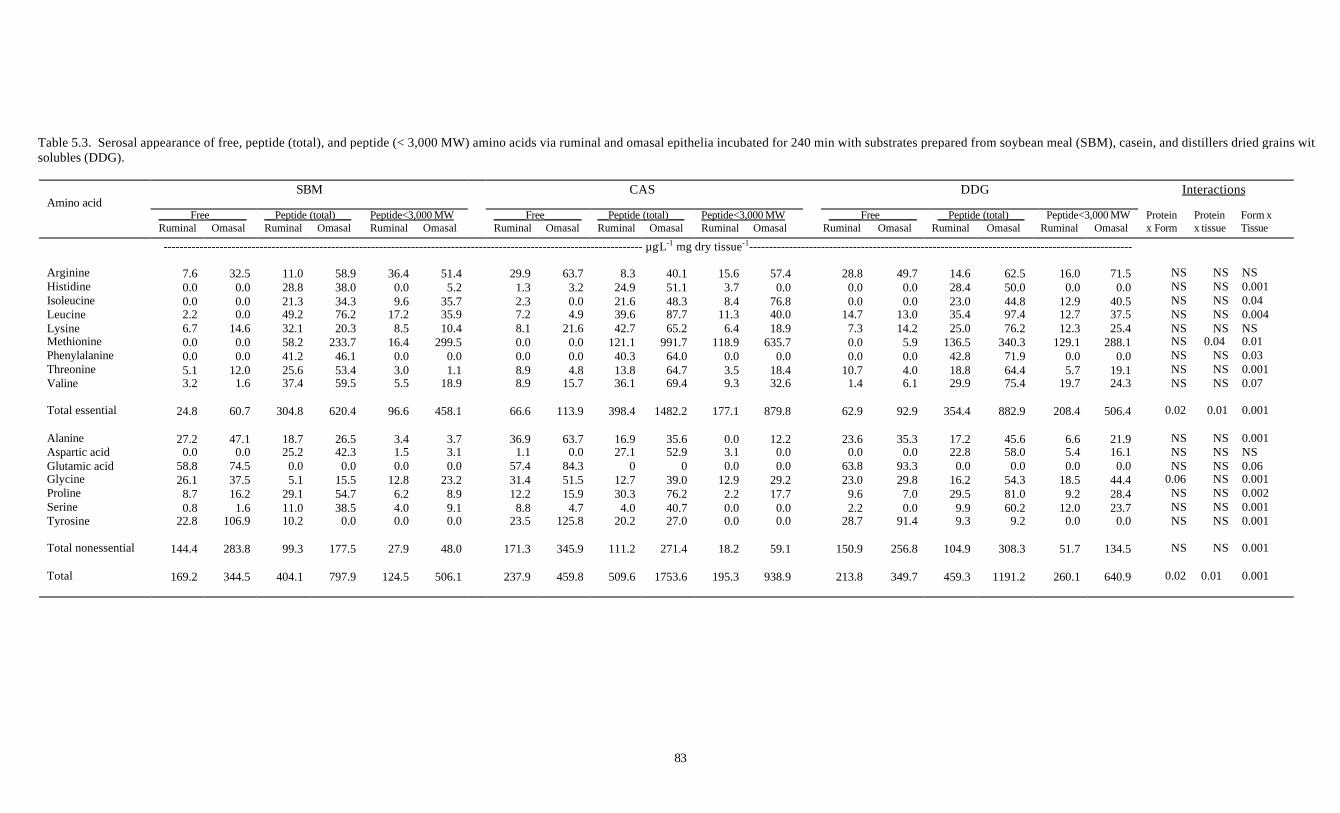
83
Table 5.3. Serosal appearance of free, peptide (total), and peptide (< 3,000 MW) amino acids via ruminal and omasal epithelia incubated for 240 min with substrates prepared from soybean meal (SBM), casein, and distillers dried grains withsolubles (DDG).
SBM CAS DDG InteractionsAmino acid
______Free_______ __Peptide (total)___ Peptide<3,000 MW ______Free_______ __Peptide (total)___ Peptide<3,000 MW ______Free_______ __Peptide (total)___ Peptide<3,000 MWRuminal Omasal Ruminal Omasal Ruminal Omasal Ruminal Omasal Ruminal Omasal Ruminal Omasal Ruminal Omasal Ruminal Omasal Ruminal Omasal
Proteinx Form
Proteinx tissue
Form xTissue
------------------------------------------------------------------------------------------------------------------------ µg.L-1 mg dry tissue-1------------------------------------------------------------------------------------------------
ArginineHistidineIsoleucineLeucineLysineMethioninePhenylalanineThreonineValine
Total essential
AlanineAspartic acidGlutamic acidGlycineProlineSerineTyrosine
Total nonessential
Total
7.60.00.02.26.70.00.05.13.2
24.8
27.20.0
58.826.18.70.8
22.8
144.4
169.2
32.50.00.00.0
14.60.00.0
12.01.6
60.7
47.10.0
74.537.516.21.6
106.9
283.8
344.5
11.028.821.349.232.158.241.225.637.4
304.8
18.725.20.05.1
29.111.010.2
99.3
404.1
58.938.034.376.220.3
233.746.153.459.5
620.4
26.542.30.0
15.554.738.50.0
177.5
797.9
36.40.09.6
17.28.5
16.40.03.05.5
96.6
3.41.50.0
12.86.24.00.0
27.9
124.5
51.45.2
35.735.910.4
299.50.01.1
18.9
458.1
3.73.10.0
23.28.99.10.0
48.0
506.1
29.91.32.37.28.10.00.08.98.9
66.6
36.91.1
57.431.412.28.8
23.5
171.3
237.9
63.73.20.04.9
21.60.00.04.8
15.7
113.9
63.70.0
84.351.515.94.7
125.8
345.9
459.8
8.324.921.639.642.7
121.140.313.836.1
398.4
16.927.1
012.730.34.0
20.2
111.2
509.6
40.151.148.387.765.2
991.764.064.769.4
1482.2
35.652.9
039.076.240.727.0
271.4
1753.6
15.63.78.4
11.36.4
118.90.03.59.3
177.1
0.03.10.0
12.92.20.00.0
18.2
195.3
57.40.0
76.840.018.9
635.70.0
18.432.6
879.8
12.20.00.0
29.217.70.00.0
59.1
938.9
28.80.00.0
14.77.30.00.0
10.71.4
62.9
23.60.0
63.823.09.62.2
28.7
150.9
213.8
49.70.00.0
13.014.25.90.04.06.1
92.9
35.30.0
93.329.87.00.0
91.4
256.8
349.7
14.628.423.035.425.0
136.542.818.829.9
354.4
17.222.80.0
16.229.59.99.3
104.9
459.3
62.550.044.897.476.2
340.371.964.475.4
882.9
45.658.00.0
54.381.060.29.2
308.3
1191.2
16.00.0
12.912.712.3
129.10.05.7
19.7
208.4
6.65.40.0
18.59.2
12.00.0
51.7
260.1
71.50.0
40.537.525.4
288.10.0
19.124.3
506.4
21.916.10.0
44.428.423.70.0
134.5
640.9
NSNSNSNSNSNSNSNSNS
0.02
NSNSNS
0.06NSNSNS
NS
0.02
NSNSNSNSNS
0.04NSNSNS
0.01
NSNSNSNSNSNSNS
NS
0.01
NS0.0010.040.004NS0.010.030.0010.07
0.001
0.001NS0.060.0010.0020.0010.001
0.001
0.001

83
Chapter VI
EPILOGUE
The present study provides further evidence to suggest that peptides and free
amino acids resulting from the microbial digestion of proteins in the rumen are
potentially absorbed via ruminal and omasal epithelia, and that the absorption of peptides
exceeds that of free amino acids. Results from this study further suggest that the amounts
and types of free and peptide amino acids absorbed via the forestomach of ruminants may
be influenced by dietary modifications. These results are complementary to previous
research conducted in this laboratory (Webb et al., 1993; Matthews et al., 1996a), which
provided substantial evidence for the presence of mechanisms involved in the absorption
of free and peptide amino acids via the ruminant forestomach. Yet, several questions
need to be resolved before this information is practically used in feeding strategies to
improve protein utilization of ruminants. These questions include: (1) to what extent are
free and peptide-bound amino acids absorbed via the forestomach, (2) how do the diet
and other factors influence this process, (3) will increasing the amount of peptide and free
amino acid absorption via the forestomach achieve a higher efficiency in nutrient
utilization, and (4) what dietary modifications can be used with greater economic
advantage to achieve a higher forestomach absorption of peptides and free amino acids.
Thus, future studies should be directed to understand the magnitude and the
nutritional significance of peptide and free amino acid absorption across forestomach
epithelia. To confirm the present findings and to gain more knowledge on the relative
amounts of free and peptide bound amino acids absorbed via the reticulorumen and
omasum, use of in vivo techniques will be most appropriate. Measurement of peptide
and free amino acid fluxes in the non-mesenteric drained viscera of catheterized
ruminants (of different species and stages of production) receiving a variety of diets
could provide a better understanding of the magnitude of forestomach absorption process
with dietary and animal conditions. Use of radiolabeled substrates in the diet or infused
into the rumen will also be helpful.
84
Also, a thorough understanding of the mechanisms involved in forestomach
absorption of free and peptide amino acids and means of regulating these events is of
fundamental importance. In vitro studies designed to measure serosal absorption of
amino acids using radiolabeled or fluorescent markers, and cloning experiments to
determine the nucleic acid sequences of peptide and amino acid transporters in the
forestomach epithelia will be useful to understand these mechanisms.
The studies on the nutritional significance of peptide absorption in ruminants are
also very exciting. Experiments conducted in this laboratory (Pan et al., 1996; Wang et
al., 1996) and elsewhere (Backwell et al., 1994) have demonstrated that the small
molecular weight peptides can be efficiently utilized as sources of amino acids for the
synthesis of milk and muscle proteins. Long-term experiments designed to measure
productivity (milk production, body weight gain etc.,) of animals, whose amino acid
requirements are met by supplying either peptide or free forms, could provide further
understanding of the nutritional significance of peptide absorption. The ability of
ruminants to absorb peptides for tissue protein utilization would allow us to consider
them as a more efficient group of animals than we thought before.
The traditional N balance schemes for ruminants (NRC, 1985; Sniffen et al.,
1992) have been based on several empirical equations to predict N inputs, production of
ammonia and microbial protein in the rumen, and availability of free amino acids in the
small intestine from microbial and undegraded dietary proteins. No allowance is made in
any of these schemes for the amino acids (free and peptide-bound) that can be available
from direct absorption through forestomach epithelia. If future research confirms
significant amino acid absorption across the forestomach, then this will become an
integral component in subsequent diet formulation efforts for ruminants.
Controlling the rate and extent of dietary protein degradation in the rumen is a
major consideration among ruminant nutritionists. Because, the degradation of dietary
protein in the rumen is often considered to be an inefficient process, particularly when a
higher level of production is sought. High quality protein supplements are frequently fed
under these circumstances to meet additional requirements of the animal. But, a
substantial amount of protein can be lost due to microbial fermentation as ammonia. This
ammonia is mostly diffused into the blood and is excreted as urea. Several techniques
85
have been proposed to control ruminal protein degradation, which include physical,
chemical and biological means to protect protein from microbial attack (Broderick et al.,
1991). If future research confirms a substantial absorption of peptides and free amino
acids via the forestomach, then the need for ‘by passing’ proteins from ruminal
degradation would become a less important activity. The investigations on controlling
the intermediate steps of ruminal protein degradation (e.g. peptide hydrolysis, peptide
uptake by bacteria and deamination) may be more useful in this context. The use of
ruminally-protected peptides and free amino acids (peptide and amino acid analogues,
acetylated peptides etc.) may be the preferred substrates for incorporation with ruminant
diets. These protected peptides or amino acids can be included to provide the most
limiting amino acids of host animals. Inclusion of compounds such as ionophores, which
cause peptide accumulation in the rumen (Whestone et al., 1981) and reduce the
deamination activity (Newbold et al., 1990) may also be beneficial. There appears to be
an unexplored potential for new microbial feed additives to inhibit peptidolytic or
deaminative activity of indigenous ruminal microorganisms. Genetic engineering and
molecular biological techniques can also provide important contributions to manipulate
ruminant N metabolism. There is much speculation on genetic manipulation of ruminant
microorganisms while the technique might be applied for the alteration of genes of
animals and in the manufacture of feeds. A recent study (Madeira et al., 1995) also
demonstrated a selective means of inhibiting the growth of peptide-degrading bacteria.
This novel approach (smugglin) allows inhibition of bacterial growth using peptide
mimetics that transport via the peptide permeases. All of the above methods offer
potential but require additional research before practical use will be realized. The
potential of using such methods will ultimately depend on how they influence host
animal nutrition.
The current feeding strategies to maximize production from ruminants has often resulted
in overfeeding of high quality proteins, the most costly ingredient in the diet. The
forestomach absorption of peptides and free amino acids can be very useful in finding a
suitable solution to achieve efficient N utilization by ruminants. The success of attempts
to control amino acid fermentation in the rumen or supplementation of limiting amino
acids in protected forms may be enhanced by the ability of forestomach epithelia to

86
absorb peptides and free amino acids. Adoption of such strategies in maximizing the
efficiency of N utilization by ruminants and minimizing wastage can have important
nutritional and environmental consequences.

87
LITERATURE CITED
Abe, M., and M. Kandatsu. 1969. Utilization of non-protein nitrogenous compounds in
ruminants III. Ingestion of bacteria by protozoa in the rumen. Jpn. J. Zootech.
Sci. 40:313-319.
Adibi, S. A. and E. Phillips. 1968. Evidence for greater absorption of amino acids from
peptide than from free form in human intestine. Clin. Res. 16:446.
Allen, S., and E. L. Miller. 1976. Determination of nitrogen requirements for microbial
growth from the effect of urea supplementation of a low-N diet on abomasal N
flow and N recycling in wethers and lambs. Br. J. Nutr. 36:353-368.
Annison, E. F. 1956. Nitrogen metabolism in the sheep. Biochem. J. 64:705-714.
AOAC. 1990. Official Methods of Analysis (15th Ed.). Association of Official
Analytical Chemists, Arlington, VA.
ARC. 1980. The Nutrient Requirements of Ruminant Livestock. Commonwealth
Agricultural Bureaux, Farnham Royal, Slough, U.K.
Argyle, J. L., and R. L. Baldwin. 1989. Effects of amino acids and peptides on rumen
microbial growth yield. J. Dairy Sci. 72: 2017-2027.
Armstrong, D.G., G. P. Savage, and D. C. Harrison. 1977. Digestion of nitrogenous
substances entering the small intestine with particular reference to amino acids in
ruminant livestock. Proc. Second Int. Symp. on Protein Metabolism and
Nutrition. pp 55-60. The Netherlands.
Backwell, F. R. C., B. J. Bequette, D. Wilson, A. G. Calder, J. A. Metcale, D. Wray-
Cahen, J. C. MacRae, D. E. Beever, and G. E. Lobley. 1994. The utilization of
88
dipeptides by the caprine mammary gland for milk protein synthesis. Am. J.
Physiol. 267:R1-R6.
Backwell, F. R. C., D. Wilson, and A. Schweizer. 1995. Evidence for a glycyl-proline
transport system in ovine enterocyte brush-border membrane vesicles. Biochem.
Biophysic. Res. Comm. 215:561-565.
Bailey, C. B., and C. C. Balch. 1961. Saliva secretion and its relation to feeding in
cattle. 2. The composition and rate of secretion of mixed saliva in the cow during
rest. Br. J. Nutr. 15:383-402.
Blackburn, T. H., and P. N. Hobson. 1962. Further studies on the isolation of proteolytic
bacteria from the sheep rumen. J. Gen. Microbiol. 29:69-81.
Bloomfield, R. A., E. O. Kearley, D. O. Creach, and M. E. Muhrer. 1963. Ruminal pH
and absorption of ammonia and VFA. J. Anim. Sci. 22:833. (Abstr.).
Brock, F. M., C. W. Forsberg, and J. G. Buchanan Smith. 1982. Proteolytic activity of
rumen microorganisms and effects of proteinase inhibitors. Appl. Environ.
Microbiol. 44:561-569.
Broderick, G. A. 1982. Estimation of protein degradation using in situ and in vitro
methods. In: Protein Requirements for cattle. Misc. Publ. No. 109. pp 72.
Oklahoma State Univ., Stillwater.
Broderick, G. A. 1987. Determination of protein degradation rates using a rumen in
vitro system containing inhibitors of microbial nitrogen metabolism. Br. J. Nutr.
58:463-475.
Broderick, G. A., and M. K. Clayton. 1992. Rumen protein degradation rates estimated
89
by non-linear regression analysis of Michaelis-Menten in vitro data. Br. J. Nutr.
67:27.
Broderick, G. A., and W. M. Craig. 1983. Mechanism of protein degradation by rumen
microbes. Fed. Proc. 42:532 (Abstr.).
Broderick, G. A., and W. M. Craig. 1989. Metabolism of peptides and amino acids
during in vitro protein degradation by mixed rumen organisms. J. Dairy Sci.
72:2540-2548.
Broderick, G. A., and J. H. Kang. 1980. Automated simultaneous determination of
ammonia and total amino acids in ruminal fluid and in vitro media. J. Dairy
Sci. 63:64-75.
Broderick, G. A., J. H. Kang, and W. M. Craig. 1981. Total and individual amino
acids in strained ruminal liquor from cows fed graded amounts of urea. J. Dairy
Sci. 64:1731-1734.
Broderick, G. A., D. B. Ricker, and L. S. Driver. 1990. Expeller soybean meal and corn
by products versus solvent soybean meal for lactating dairy cows fed alfalfa silage
as a sole forage. J. Dairy. Sci. 73:453-462.
Broderick, G. A., and R. J. Wallace. 1988. Effects of dietary nitrogen source on
concentration of ammonia, free amino acids and fluorescamine-reactive peptides
in the sheep rumen. J. Anim. Sci. 66:2233-2238.
Broderick, G. A., R. J. Wallace, and N. McKain. 1988. Uptake of small neutral peptides
by mixed rumen microorganisms in vitro. J. Sci. Food Agric. 42:109-118.
Broderick, G. A., R. J. Wallace, and E. R. Orskov. 1991. Control of rate and extent of
protein degradation. In: T. Tsuda, Y. Sasaki and R. Kawashima (Ed.)
90
Physiological aspects of digestion and metabolism in Ruminants. pp 541-592
Academic Press, London.
Brunner, J. R. 1977. Milk Proteins. In: J. R. Whitakar and S. R. Tannenbaum (Ed.)
Food Proteins. AVI Publishing Co. Inc., Wastport, Connecticut.
Burnell, T. W., G. L. Cromwell, and T. S. Stahly. 1989. Bioavailability of phosphorus in
triticale, hominy feed and corn gluten feed for pigs. J. Anim. Sci. 7(Suppl.1):262.
Burroughs, W., H. G. Headley, R. M. Bethke, and P. Gerlaugh. 1950. Cellulose
digestion in good and poor quality roughages using an artificial rumen. J. Anim.
Sci. 9:513-530.
Burroughs, W., D. K. Nelson, and D. R. Mertens. 1975. Protein physiology and its
application in the lactating cow: The metabolizable protein feeding standard. J.
Anim. Sci. 41:933-940.
Buttery, P. J. 1976. Aspects of the biochemistry of rumen fermentation and their
implication in ruminant productivity. In: H. Swan and W. H. Broster (Ed.)
Principles of cattle production. pp 140-156. Butterworths, London.
Chalupa, W. 1976. Degradation of amino acids by the mixed rumen microbial
population. J. Anim. Sci. 43:828-834.
Chamberlain, D. G., and P. C. Thomas. 1979. Prospective laboratory methods for
estimating the susceptibility of feed proteins to microbial breakdown in the
rumen. Proc. Nutr. Soc. 38:183A. (Abstr.)
Chaney, A. L., and E. P. Marbach. 1962. Modified reagents for determination of urea
and ammonia. Clin. Chem. 8:130-132.
91
Chen, G., and J. B. Rusell. 1991. Effect of monensin and a protonophore on protein
degradation, peptide accumulation, and deamination by mixed ruminal
microorganisms in vitro. J. Anim. Sci. 69:2196-2203.
Chen, G., J. B. Russell, and C. J. Sniffen. 1987a. A procedure for measuring peptides
in rumen fluid and data suggesting that peptide uptake is a rate-limiting step in
ruminal protein degradation. J. Dairy Sci. 70:1211-1219.
Chen, G., C. J. Sniffen, and J. B. Russell. 1987b. Concentration and estimated flow of
peptides from the rumen of dairy cattle: effects of protein quantity, protein
solubility, and feeding frequency. J. Dairy. Sci. 70:983-992.
Chen, G., J. Strobel, and J. B. Russel. 1987c. Effect of hydrophobicity on utilization of
peptides by ruminal bacteria in vitro. Appl. Environ. Micro. 53:2021-2025.
Chen, H., E. A. Wong, and K. E. Webb, Jr. 1999. Tissue distribution of a peptide
transporter mRNA in sheep, dairy cows, pigs, and chickens. J. Anim. Sci.
77:1277-1283.
Church, D. C. 1960. The Ruminant Animal. Digestive Physiology and Nutrition.
Prentice-Hall, Englewood Cliffs, NJ.
Church, D. C., and W. G. Pond. 1988. Basic Animal Nutrition and Feeding. (3rd Ed.).
John Wiley & Sons Inc., New York.
Citron, A., A. Breton, and G. Fonty. 1987. Rumen anaerobic fungi. Builetin Institute
Pasteur. 85:329.
Clark, J. H., T. H. Klusmeyer, and M. R. Cameron. 1992. Microbial protein synthesis
and flows of nitrogen fractions to the duodenum of dairy cows. J. Dairy Sci.
75:2304-2323.

92
Coleman, G. S. 1985. Possible causes of the high death rate of ciliate protozoa in the
rumen. J. Agric. Sci. (Camb.) 105:39-43.
Coleman, G. S. and Sandford, D. C. 1979. The engulfment and digestion of mixed
rumen bacteria and individual bacterial species by single and mixed species of
rumen ciliate protozoa. J. Agric. Sci. (Camb.) 92:729-742.
Cook, R. M., R. E. Brown, and C. L. Davis. 1965. Protein metabolism in the rumen 1.
Absorption of glycine and other amino acids. J. Dairy Sci. 48:475-483.
Cooper, P. B., and J. R. Ling. 1985. The uptake of peptides and amino acids by rumen
bacteria. Proc. Nutr. Soc. 44:144.
Cotta, M. A., and R. B. Hespell. 1986. Protein and amino acid metabolism of rumen
bacteria. In: L. P. Milligan, W. L. Growum, and A. Dobson (Eds.) Control of
Digestion and Metabolism in Ruminants. pp 122-136. Prentice-Hall, Englewood
Cliffs, NJ.
Cotta, M. A., and J. B. Russell. 1982. Effects of peptides and amino acids on efficiency
of rumen bacterial protein synthesis in continuous culture. J. Dairy. Sci. 65:226-
234.
Cottle, D. 1980. The synthesis, turnover and outflow of ruminal microorganisms, Ph.D.
thesis. Univ. New England, Armidale, Australia.
Crooker, B. A., C. J. Sniffen, W. H. Hoover, L. L. Johnson. 1978. Solvents for soluble
nitrogen measurements in feedstuffs. J. Dairy Sci. 61:437-447.
Czerkawski, J. W., and G. Breckenridge. 1977. Design and development of a long-term
rumen simulation technique (Rusitec). Br. J. Nutr. 38:371-384.

93
Daniel, H., M. Boll, and U. Wenzel. 1994. Physiological importance and characteristics
of peptide transport in intestinal epithelial cells. VIth International Symposium on
Digestive Physiology in Pigs, Vol. I. 80:1-7.
Demeyer, D. I., and C. J. Van Nevel. 1979. Effect of defaunation on the metabolism of
rumen microorganisms. Br. J. Nutr. 42:515-524.
Depardon, N., D. Debroas, and G. Blanchart. 1995. Breakdown of peptides from a soya
protein hydrolysate by rumen bacteria. Simultaneous study of enzyme activities
and of two physico-chemical parameters: Molecular weight and hydrophobicity.
J. Sci. Food Agric. 68:25-31.
DiRienzo, D. B. 1990. Free and peptide amino acid fluxes across the mesenteric and
nonmesenteric viscera of sheep and calves. Ph.D. Dissertation. Virginia
Polytechnic Inst. and State Univ., Blacksburg.
Egan, A. R., K. Boda, and J. Varady. 1986. Regulation of nitrogen metabolism and
recycling. In: L. P. Milligan, W. L. Grovum, and A. Dobson, (Eds.) Control of
Digestion and Metabolism in Ruminants. pp 386-402. Prentice Hall, NJ.
Engelhardt, W. V., and J. R. S. Hales. 1977. Partition of capillary blood flow in rumen,
reticulum and omasum of sheep. Am. J. Physiol. 232(1):E53-E56.
Englehardt, W. V., and R. Hauffe. 1975. Role of the omasum in absorption and
secretion of water and electrolytes in sheep and goats. In: I. W. McDonald and A.
C. I. Warner (Eds.) Digestion and Metabolism in the Ruminant. pp 216-230.
University of New England Publishing unit, Armidale, Australia.
Ensminger, M. E., and C. G. Olentine, Jr. 1978. Feeds and Nutrition – complete. The
Ensminger Publishing Co., Clovis, CA.
94
Fejes, J., Z. Faixova, J. Varady, and M. Cibula. 1991. In vitro transport of amino acids
across the rumen mucosa in sheep. Vet. Med. (Prague) 36(9):551-558.
Fell, B. F., and T. E. C. Weekes. 1975. Food intake as mediator of adaptation in the
ruminant epithelium. In: I. W. McDonald and A. C. I. Warner (Ed.) Digestion and
Metabolism in the Ruminant. Proceedings of the IV International symposium on
Ruminant physiology. pp 101-118. August 1974, Sydney, Australia, University
of New England Publishing Unit, Armidale.
Fonty, G., A. Breton, M. Fevre, A. Citron, M. Hebraud, and P. Gouet. 1987. Isolement
et caracterisation des champignon anaerobic stricts du rumen de moutons.
premiers resultats. Reprod. Nutr. Develop. 27:237.
Forsberg, C. W., L. K. A. Lovelock, L. Krumholz, and J. G. Buchanan-Smith. 1984.
Protease activities of rumen protozoa. Appl. Environ. Microbiol. 47:101-110.
Gabel, G., S. Volger, and H. Martens. 1993. Mechanism of sodium and chloride
transport across isolated sheep reticulum. Comp. Biochem. Physiol. 105A:1-10.
Ganapathy, V., M. Brandsch, and F. H. Leibach. 1994. Intestinal transport of amino
acids and peptides. In: L. R. Johnson (Ed.) Physiology of the Gastrointestinal
tract. pp 1773-1794. Raven Press, Inc., New York, NY.
Giesecke, D., and N. O. vanGylswyk. 1975. A study of feeding types and certain rumen
functions in six species of South African ruminants. J. Agric. Sci. (Camb.) 85:75-
83.
Grimble, G. K., and D. B. A. Silk. 1989. Peptides in human nutrition. Nutr. Res. Rev.
2:87-108.

95
Hammarkvist, F., J. A. R. Wernerman, A. von der Decken, and E. Vinnars. 1988.
Effects of glutamine supplementation to total parenteral nutrition after elective
abdominal surgery. Clin. Nutr. 7:36.
Hara, H., R. Funabiki, M. Iwata, and K. Yamazaki. 1984. Portal absorption of small
peptides in rats under unrestrained conditions. J. Nutr. 114:1122-1129.
Hart, F. J, and J. Leibholz. 1990. A note on the flow of endogenous protein to the
omasum and abomasum of steers. Anim. Prod. 51:217-219.
Henderickx, H., and J. Martin. 1963. In vitro study of the nitrogen metabolism in the
rumen. Compt. Rend. de. Recherches. 31:9-66.
Higgins, C. F., and M. M. Gibson. 1986. Peptide transport in bacteria. In.: S. Fleischer,
and B. Flericher. (Eds.) Methods in Enzymology. pp365-377. Academic Press,
New York, NY.
Hill, K. J. 1961. Digestive secretions in the ruminant. In: (Lewis, D., Ed.) Digestive
Physiology and Nutrition of the Ruminant. Butterworths, London.
Hino, T., and J. B. Russell. 1985. The effect of reducing equivalent disposal and
NADH/ NAD on the deamination of amino acids by intact and cell-free extracts
of rumen microorganisms. Appl. Environ. Microbiol. 50:1368-1374.
Hino, T., and J. B. Russell. 1986. Relative contribution of ruminal bacteria and protozoa
to the degradation of protein in vitro. J. Anim. Sci. 64:261-270.
Hoffman, R. R. 1973. The Ruminant Stomach. East African Literature Bureau, Nairobi,
Kenya.
Hogan, J. P. 1961. The absorption of ammonia through the rumen of sheep. Australian J.
96
Biol. Sci. 14:448.
Hogan, J. P. 1975. Quantitative aspects of nitrogen utilization in ruminants. J. Dairy Sci.
58:1164-1177.
Hogan, J. P., and R. H. Weston. 1970. Quantitative aspects of microbial synthesis in the
rumen. In: A. T. Phillipson (Ed.) Physiology of digestion and metabolism in the
ruminant. pp 474-485. Oriel Press, New Castle.
Holden, P. J. 1990. Corn Gluten Feed. In: P. A. Thacker and R. N. Kirkwood. (Eds.)
Nontraditional Feed Sources for Use in Swine Production. pp 131-138.
Butterworth Publishers, Stoneham, MA.
Hungate, R. E. 1966. The Rumen and its Microbes. Academic Press. London.
Jenkins, T. C. 1993. Lipid metabolism in the rumen. J. Dairy Sci. 76:3851-3863.
Johnson, R. R. 1963. Symposium on microbial digestion in ruminants: In vitro rumen
fermentation techniques. J. Anim. Sci. 22:792-800.
Johnson, R. R. 1966. Techniques and Procedures for in vitro and in vivo rumen studies.
J.Anim. Sci. 25:855-875.
Klieve, A. V., and T. Bauchop. 1988. Morphological diversity of ruminal
bacteriophages from sheep and cattle. Appl. Environ. Microbiol. 54:1637-1641.
Koeln, L. L., and K. E. Webb, Jr. 1982. Peptide, erythrocyte and plasma amino acid
transport across the gastrointestinal tract and liver of calves. Fed. Proc. 41:948.
Koeln, L. L., T. S. Schlagheck, and K. E. Webb, Jr. 1993. Amino acid flux across the
gastrointestinal tract and liver of calves. J. Dairy Sci. 76:2275-2285.
97
Kopency, J., and R. J. Wallace. 1982. Cellular location and some properties of
proteolytic enzymes of rumen bacteria. Appl. Environ. Microbiol. 43:1026-1033.
Korneygay, E. T., A. J. Clawson, F. H. Smith, and E. R. Barrick. 1961. Influence of
Protein source on toxicity of gossypol in swine rations. J. Anim. Sci. 20: 597-602.
Krishnamoorthy, U., V. T. Muscato, C. J. Sniffen, and P. J. Van Soest. 1982. Nitrogen
fractionations in selected feedstuffs. J. Dairy Sci. 65:217-225.
Krzysik, B. A. and S. A. Adibi. 1977. Cytoplasmic dipeptidase activities of kidney,
ileum, jejunum, liver, muscle and blood. Am. J. Physiol. 233:E450-E456.
Leamaster, B. R., P. R. Cheeke. 1979. Feed preferences of swine: Alfalfa meal, high and
low saponin alfalfa, and quinine sulfate. Can. J. Anim. Sci. 59:467-469.
Lechner-Doll, M., M. Kaske, and W. van Engelhardt. 1991. Factors affecting the mean
retention time of particles in the forestomach of ruminants and camelids. In:
Physiological aspects of digestion and metabolism in ruminants. pp 455-482.
Academic press, Inc., NY.
Leibach, F. H., and V. Ganapathy. 1996. Peptide transporters in the intestine and the
kidney. Annu. Rev. Nutr. 16:99-119.
Leibholz, J. 1969. Effect of diet on the concentration of free amino acids, ammonia, and
urea in the rumen liquor and blood plasma of sheep. J. Anim. Sci. 29:628-633.
Leibholz, J. 1971a. The absorption of amino acids from the rumen of the sheep. I. The
loss of amino acids from solutions placed in the washed rumen in vivo. Aust. J.
Agric. Res. 22:639-645.

98
Leibholz, J. 1971b. The absorption of amino acids from the rumen of the sheep. II. The
tranfer of histidine, glycine, and ammonia across the rumen epithelium in vitro.
Aust. J. Agric. Res. 22:647-653.
Leng, R. A. 1973. Salient features of the digestion of pasture by ruminants and other
herbivores. In: G. W. Butler and R. W. Baily (Ed.). Chemistry and
Biochemistry of Herbage. pp 81-90. Academic Press Inc., NY.
Leng, R. A. 1982. Modification of rumen fermentation. In: J. B. Hacker (Ed.)
Nutritional limits to animal production from pastures. pp 427-453.
Commonwealth Agriculture Bureau, Furnham Royal, U.K.
Leng, R. A., and J. V. Nolan. 1984. Symposium: Protein nutrition of the lactating cow.
J. Dairy. Sci. 67:1072-1089.
Lewis, D. 1957. Blood-urea concentration in relation to protein utilization in the
ruminant. J. Agric. Sci. 48:437.
Liener, I. E. 1969. Toxic Constituents of Plants Foodstuffs. Academic Press, New York.
Lindberg, J. E. 1985. Estimation of rumen degradability of feed proteins with the in
sacco technique and various in vitro methods: A review. Acta Agric. Scand.
Suppl. 25:64-88.
Lis, M. T., R. M. Crampton, and D. M. Matthews. 1971. Rates of absorption of a
dipeptide and the equivalent free amino acid in various mammalian species.
Biochim. Biophys. Acta. 233: 453.
Loosli, J. K., H. H. Williams, E. W. Thomas, F. H. Ferris, and L. A. Maynard. 1949.
Synthesis of amino acids in the rumen. Science. 110: 144-145.

99
Loper, D. C., C. O. Little, and G. E. Mitchell. Jr. 1966. In vitro procedure for studying
starch digestion by rumen microorganisms. J. Anim. Sci. 25:128-131.
Luchini, N. D., G. A. Broderick, and D. K. Combs. 1996. Preservation of ruminal
microorganisms for in vitro determination of ruminal protein degradation.
J. Anim. Sci. 74:1134-1143.
Madara, J. L., and J. R. Pappenheimer. 1987. Structural basis for physiological
regulation of paracellular pathways in intestinal epithelia. J. Membrane. Biol.
100:149-164.
Madeira, H. M. F., L. Zhang, and M. Morrison. 1995. Use of “smugglin concept” for
the study of peptide transport in Prvetolla ruminicola. Am. Soc. Microbiol.
K82:550.
Madsen, J. and T. Hvelplund. 1985. Protein degradation in the rumen. Acta Agric.
Scand. 25 (Suppl):103-124.
Mangan, J. L. 1972. Quantitative studies on nitrogen metabolism in bovine rumen. Br.
J. Nutr. 27:261-283.
Mahadevan, S., J. D. Erfle, and F. D. Sauer. 1979. A colorimetric method for the
determination of proteolytic degradation of feed proteins by rumen
microorganisms. J. Anim Sci. 48:947-953.
Mahadevan, S., J. D. Erfle, and F. D. Sauer. 1980. Degradation of soluble and insoluble
proteins by Bacteroides amylophilus protease and by rumen organisms. J. Anim.
Sci. 50:723-728.
Mahadevan, S., J. D. Erfle, and F. D. Sauer. 1987. Preparation of protease from mixed
rumen microorganisms and its use for the in vitro determination of the

100
degradability of true protein in feedstuffs. Can. J. Anim. Sci. 67:55-64.
Martens, H. and G. Gabel. 1988. Transport of Na and Cl across the epithelium of
ruminant forestomachs. Rumen and omasum: A review. Comp. Biochem.
Physiol. 90A:569-575.
Matthews, D. M. 1991. Protein Absorption. Development and Present State of the
Subject. Wiley-Lis, Inc., New York, NY.
Matthews, D. M., I. L. Craft, D. M. Geddes, I. J. Wise, and C. W. Hyde. 1968.
Absorption of glycine peptides from the small intestine of rat. Clin. Sci. 35:415-
424.
Matthews, J. C., Y. L. Pan, S. Wang, M.Q. McCollum, and K. E. Webb, Jr. 1996a.
Characterization of gastrointestinal amino acid and peptide transport proteins and
the utilization of peptides as amino acid substrates by cultured cells (myogenic
and mammary) and mammary tissue explants. In: E. T. Kornegay (Ed.) Nutrient
management of food animals to enhance ant protect the environment. pp 55-72.
CRC Press, Inc. Boca Raton, FL.
Matthews, J. M., E. A. Wong, P. K. Bender, J. R. Bloomquist, and K. E. Webb, Jr.
1996b. Demonstration and Characterization of dipeptide transport system activity
in sheep omasal epithelium by expression of mRNA in Xenopus laevis oocytes.
J. Anim. Sci. 74:1720-1727.
Matthews, J. C., and K. E. Webb, Jr. 1995. The absorption of L-carnosine, L-
methionine, and L-methionylglycine by isolated sheep ruminal and omasal
epithelial tissues. J. Anim. Sci. 73:3464-3475.
McCollum, M. Q. 1996. Lysine and glycyl-L-sarcosine absorption across ovine

101
forestomach epithelium in vitro. M.Sc. Theses. Virginia Polytechnic Inst. and
StateUniv., Blacksburg.
McDonald, I. W. 1948. The absorption of ammonia from the rumen of the sheep.
Biochem. J. 56:120.
McDonald, P., R. A. Edwards, and J. F. D. Greenhalgh. 1982. Animal Nutrition. (3rd
Ed.). Longman Inc., NY.
Meherez, A. Z., E. R. Orskov, and J. Opstvedt. 1980. Processing factors affecting
degradability of fishmeal in the rumen. J. Anim. Sci. 50:737-744.
Michel, V., G. Fonty, L. Millet, F. Bonnemoy, and P. Gouet. 1993. In vitro study of the
proteolytic activity of rumen anaerobic fungi. FEMS Microbiol. Lett. 110:5.
Miller, E. R. 1990. Blood Meal: Flash-Dried. In: P. A. Thacker and R. N. Kirkwood.
(Eds.) Nontraditional Feed Sources for Use in Swine Production. pp 53.
Butterworth Publishers, Stoneham, MA.
Millic, B. L., S. Stojanavic, and N. Vucurevic. 1972. Lucern tannins from lucern and
their nature and influence on the digestive enzymes in vitro. J. Sci. Food Agri.
23:157.
Morrison, F. B. 1950. Feeds and Feeding. The Morrison Publishiong Co., Ithaka, NY.
National Research Council. 1985. Ruminant nitrogen usage. National Academy Press,
Washington, DC.
National Research Council. 1988. Nutrient requirements of domestic animals No.2.
Nutrient requirements of swine. (9th ed.). National Academy of Sciences,
Washington, DC.
102
National Research Council. 1989. Nutrient Requirements of Dairy Cattle (6th Rev. Ed.).
National Academy Press, Washington, DC.
Newbold, C. J., R. J. Wallace, and N. McKain. 1990. Effect of the ionophore tetronasin
on nitrogen metabolism of ruminal microorganisms in vitro. J. Anim. Sci.
68:1103-1109.
Newland, H. W., and D. C. Mahan. 1990. Distillers By-Products. In: P. A. Thacker and
R. N. Kirkwood. (Eds.) Nontraditional Feed Sources for Use in Swine Production.
pp 53. Butterworth Publishers, Stoneham, MA.
Nikaido, H. 1979. Nonspecific transport through the outer membrane. In: M. Inouye.
(Ed.) Bacterial Outer Membranes. pp 361. Wiley, New York, NY.
Nocek, J. E. 1988. In situ and other methods to estimate ruminal protein and energy
digestibility: a review. J. Dairy Sci. 71:2051-2069.
Nocek, J. E., and J. B. Russell. 1988. Protein and carbohydrate as an intregated system.
Relationship of ruminal availability to microbial contribution and milk
production. J. Dairy Sci. 71:2070-2107.
Nolan, J. V. 1975. Quantitative models of nitrogen metabolism in sheep. In:
McDonald, I. W. and A. C. I. Warner, (Eds.) Digestion and Metrabolism in the
Ruminant. pp 416-431. University of New England, Armidale.
Nolan, J. V., and R. A. Leng. 1972. Dynamic aspects of ammonia and urea metabolism
in sheep. Br. J. Nutr. 27:177-194.
Nolan, J. V., and S. Stachiw. 1979. Fermentation and nitrogen dynamics in Merino
sheep given a low-quality roughage diet. Br. J. Nutr. 42:63-80.

103
Nugent, J. H. A., and J. L. Mangan. 1978. Rumen proteolysis of fraction 1 leaf protein,
casein and bovine serum albumin. Proc. Nutr. Soc. 37:48A.
Nugent, J. H. A., and J. L. Mangan. 1981. Characteristics of the rumen proteolysis of
Fraction I (18S) protein from lucerne (Medicago sativa L.). Br. J. Nutr. 46:39-58.
Oldham, J. D. 1981. Amino acid requirements for lactation in high-yielding dairy cows.
In: W. Haresign (Ed.) Recent advances in animal nutrition. pp 349-81.
Butterworths, London.
Opstvedt, J., R. Miller, R. W. Hardy, and J. Spinelli. 1984. Heat-induced changes in
sufhydril groups and disufide bonds in fish protein and their effect on protein and
amino acid digestibilty in rainbow trout. J. Agric. Food Chem. 32:929-934.
Orpin, C. G., K. N. Joblin. 1988. The rumen anaerobic fungi. In: P. N. Hobson
(Ed.) The Rumen Microbial Ecosystem. pp129. Elsevier Applied Science.
London.
Orskov, E. R., F. D. Hovell, and F. Mould. 1980. The use of nylon bag technique for
evaluation of feedstuffs. Trop. Anim. Prod. 5:195-213.
Orskov, E. R., and N. A. McLeod. 1982. The flow of N from the rumen of cows and
steers maintained by intraruminal infusion of volatile fatty acids. Proc. Nutr. Soc.
41:76A (Abstr.).
Pan, Y. X., E. A. Wong, J. R. Bloomquist, and K. E. Webb, Jr. 1997. Poly(A)+ RNA
from sheep omasal epithelium induces expression of a peptide transport protein(s)
in Xenopus laevis oocytes. J. Anim. Sci. 75:3323-3330.
Pan, Y., P. K. Bender, R. M. Akers, and K. E. Webb. Jr. 1996. Methionine-containing
104
peptides can be used as methionine sources for protein accretion in cultured
C2C12 and MAC-T cells. J. Nutr. 126:232.
Pittman, K. A., and M. P. Bryant. 1964. Peptides and other nitrogen sources for growth
of Bacteroides ruminicola. J. Bacteriol. 88:401-410.
Pittman, K. A., S. Lakshmanan, and M. P. Bryant. 1967. Oligopeptide uptake by
Bacteroides ruminicola. J. Bacteriol. 93:1499-1508.
Poos-Floyd, M., T. Klopfenstein, and R. A. Briton. 1985. Evaluation of laboratory
techniques for predicting ruminal protein degradation. J. Dairy Sci. 68:829-839.
Prins, R. A., J. C. Van Hal-Van Gestel, and G. H. M. Counotte. 1979. Degradation of
amino acids and peptides by mixed rumen microorganisms. Z. Tierphysiol.
Tierernahr. Futterm. 42:333-339.
Prins, R. A., D. L. vanRheenen, and A. T. van’t Klooster. 1983. Characterization of
microbial proteolytic enzymes in the rumen. J. Microbiol. Serol. 49:585-595.
Raab, L., B. cafantaris, T. Jilg, and K. H. Menke. 1983. Rumen protein degradation and
biosynthesis. 1. A new method for determination of protein degradation in rumen
fluid in vitro. Br. J. Nutr. 50:569-582.
Reid, R. L. 1994. Nitrogen components of forages and feedstuffs. In: J. M. Asplund
(Ed.) Principles of Protein Nutrition of Ruminants. pp 43-70. CRC Press. Inc.,
Boca Raton, FL.
Robinnson, J. P., and E. R. Hungate. 1973. Acholesplasma bactoclasticum sp., an
anaerobic mycoplasma from the bovine rumen. Int. J. Syst. Bacteriol. 23:171.
Russell, J. B., R. Onodera, and T. Hino. 1991. Ruminal Fermentation: New perspectives
105
on previous contradictions. In: T. Tsuda, Y. Sasaki, and R. Kawashima (Ed.)
Physiological aspects of Digestion and Metabolism in Ruminants. pp 681-697.
Academic Press, Inc. London.
Russell, J. B., C. J. Sniffen, and P. J. Vansoest. 1983. Effect of carbohydrate limitation
on degradation and utilization of casein by mixed rumen bacteria. J. Dairy Sci.
66: 763-775.
Russell, J. B., H. J. Strobel, and G. Chen. 1988. Enrichment and isolation of a ruminal
bacterium with a very high specific activity of ammonia production. Appl.
Environ. Microbiol. 54:872-877.
SAS. 1988. SAS/STAT User’s Guide: (Release 6.03). SAS Inst. Inc., Cary, NC.
Satter, L. D. 1986. Protein supply from undegraded dietary protein. J. Dairy Sci.
69:2734-2749.
Satter, L. D., and R. E. Roffler. 1975. Nitrogen requirement and utilization in dairy
cattle. J. Dairy Sci. 58:1219-1213.
Schaefer, D. M., C. L. Davis, and M. P. Bryant. 1980. Ammonia saturation constant for
predominant species of rumen bacteria. J. Dairy Sci. 63:1248-1263.
Seal, C. J., and D. S. Parker. 1991. Isolation and characterization of circulating low
molecular weight peptides in steer, sheep, and rat portal and peripheral blood.
Comp. Biochem. Physiol. 99B:679-685.
Silk, D. B. A., P. D. Fairclough, M. L. Clark, J. E. Hegarty, T. C. Marrs, J. M. Addison,
D. Burston, K. M. Clegg, and D. M. Matthews. 1980. Use of a peptide rather
than free amino acid nitrogen source in chemically defined ‘elemental’ diets. J.
Parenter. Enteral. Nutr. 4:548-553.
106
Singh, P. 1990. Fodder Shrubs and Trees for Livestock Production under harsh
Environment. Asian Livestock. XV: 4.
Sniffen, C. J., J. D. O’Connor, P. J. Van Soest, D. G. Fox, and J. B. Russell. 1992. A net
carbohydrate and protein system for evaluating cattle diets: II. Carbohydrate and
protein availability. J. Anim. Sci. 70:3652-3661.
Stern, M. D., and L. D. Satter. 1984. Evaluation of nitrogen solubility and the dacron
bag technique as methods for estimating protein degradation in the rumen. J.
Anim. Sci. 58:714-720.
Stern, M. D., G. A. Varga, J. H. Clark, J. T. Huber, and D. L. Palmquist. 1994.
Evaluation of chemical and physical properties of feeds that affect protein
metabolism in the rumen. J. Dairy Sci. 77:2762-2785.
Steven, D. H., and A. B. Marshall. 1970. Organization of the rumen epithelium. In: A.
T. Phillipson (Ed.) Physiology of digestion and metabolism in the ruminant.
pp 80-100. Oriel Press, Newcastle..
Stevens, C. E. and B. K. Stettler. 1966. Transport of fatty acid mixtures across rumen
epithelium. Am. J. Physiol. 211:264.
Tamminga, S. 1979. Protein degradation in the forestomachs of ruminants. J. Anim.
Sci. 49:1615-1630.
Tanksley, Jr. T. D. 1990. Cottonseed Meal. In: P. A. Thacker and R. N. Kirkwood.
(Eds.) Nontraditional Feed Sources for Use in Swine Production. pp 139-152.
Butterworth Publishers, Stoneham, MA.
Tilley, J. M. A. and R. A. Terry. 1963. A two stage technique for in vitro digestion of
107
forage crops. J. Br. Grassland Soc. 18:104-111.
Tillman, A. D., and K. S. Sidhu. 1969. Nitrogen metabolism in ruminants: Rate of
ruminal ammonia production and nitrogen utilization by ruminants- A review. J.
Anim. Sci. 28:689-697.
Umbreit, W. W., R. H. Burris, and J. F. Stauffer. 1964. Manometric Techniques. A
Manual Describing Methods Applicable to the Study of Tissue Metabolism.
pp 132. Burgress Publishing Co., Minneapolis, MN.
Van Soest, P. J. 1982. Nutritional Ecology of the Ruminants. O & B Books Inc.,
Corvallis, OR.
Viera, D. M. 1986. The role of celiate protozoa in the nutrion of the ruminant. J. Anim.
Sci. 63:1547-1560.
Visek, W. J. 1968. Some aspects of ammonia toxicity in animal cells. J. Dairy Sci.
51:286-295.
Waldo, D. R. 1968. Symposium: Nitrogen utilization by the ruminant nitrogen
metabolism in the ruminant. J. Dairy Sci. 51:265-275.
Wallace, R. J. 1983. Hydrolysis of 14C-labelled proteins by rumen microorganisms and
by proteolytic prepared from rumen bacteria. Br. J. Nutr. 50:345-355.
Wallace, R. J. 1994. Amino acid and protein synthesis, turnover, and breakdown by
ruminal microorganisms. In J. M. Asplund (Ed.) Principles of Protein Nutrition
of Ruminants. pp 71-111. CRC Press, Inc., Boca Raton, FL.
Wallace, R. J., and M. L. Brammall. 1985. The role of different species of bacteria in
the hydrolysis of protein in the rumen. J. Gen. Microbiol. 131:821-832.

108
Wallace, R. J., and K. N. Joblin. 1985. Proteolytic activity of a rumen anaerobic fungus.
FEMS Microbiol. Lett. 29:119.
Wallace, R. J., N. McKain, and C. J. Newbold. 1990a. Metabolism of small peptides in
rumen fluid. Accumulation of intermediates during hydrolysis of alanine
oligomers and comparison of peptidolytic activities of bacteria and protozoa. J.
Sci. Food Agric. 50:191-199.
Wallace, R. J., C. J. Newbold, and N. McKain. 1990b. Patterns of peptide metabolism
by rumen microorganisms. In: S. Hoshino, R. Onodera, H. Minato, and H.
Itabashi (eds.) The rumen ecosystem. pp 43-50. Japan Scientific Societies Press,
Tokyo.
Wallace, R. J., C. J. Newbold, N. D. Watt, V. Buchan, and D. S. Brown. 1993. Amino
acid composition of degradation-resistant peptides in extracellular rumen fluid of
sheep. J. agric. Sci. 120:129-133.
Wang, S., K. E. Webb. Jr., and M. R. Akers. 1996. Peptide-bound methionine can be a
source of methionine for the synthesis of secreted proteins by mammary tissue
explants from lactating mice. J. Nutr. 126:1662-1672.
Weakly, D. C., M. D. Stern, and L. D. Satter. 1983. Factors affecting disappearance of
feedstuffs from bags suspended in the rumen. J. Anim. Sci. 56: 493-507.
Webb, K. E., Jr., D. B. DiRienzo, and J. C. Matthews. 1993. Recent Developments in
gastrointestinal absorption and tissue utilization of peptides: A review. J. Dairy
Sci. 76:351-361.
Webb, K. E., Jr., J. C. Matthews, and D. B. DiRienzo. 1992. Peptide absorption: A
review of current concepts and future perspectives. J. Anim. Sci. 70:3248-3257.
109
Webb, K. E., Jr., and J. C. Matthews. 1994. The absorption of amino acids and peptides.
In: J. M. Asplund (Ed.) Principles of Protein Nutrition of Ruminants. pp127-146.
CRC Press, Inc., Boca Raton, FL.
Wells, J. E., and J. B. Russell. 1996. Why do many ruminal bacteria die and lyse so
quickly? J. Dairy Sci. 79:1487-1495.
Westlake, K., and R. I. Mackie. 1990. Peptide and amino acid transport in Streptococus
bovis. Appl. Microbiol. Biotechnol. 67:97-102.
Whestone, H. D., C. L. Davis, and P. J. Bryant. 1981. Effect of monensin on the
breakdown of protein by ruminal microorgainsms in vitro. J. Dairy. Sci. 53:803-
809.
Williams, A. P., and J. E. Cockburn. 1991. Effect of slowly and rapidly degraded
protein sources on the concentrations of amino acids and peptides in the rumen of
steers. J. Sci. Food Agric. 56:303-314.
Williams, A. P., and G. S. Coleman. 1992. The Rumen Protozoa. Springer-Verlag, NY.
Winter, K. A., and R. R. Johnson, and B. A. Dehority. 1964. Metabolism of urea
nitrogen by mixed cultures of rumen bacteria grown on cellulose. J. Dairy Sci.
47:793-797.
Wright, D. E., and R. E. Hungate. 1967. Amino acid concentration in rumen fluid.
Appl. Microbiol. 15:148-151.
Yang, C. M. J., and J. B. Russell. 1992. Resistance of proline-containing peptides to
ruminal degradation in vitro. Appl. Environ. Microbiol. 58:3954-3958.
110
Yoon, I. K., K. J. Lindquist, D. D. Hongerholt, M. D. Stern, B. A. Crooker, and K. D.
Short. 1996. Variation in menhaden fish meal characteristics and their effects
on ruminal protein degradation as assessed by various techniques. Anim. Feed
Sci. Technol. 60:13-18.
111
APPENDIX A
PREPARATION OF MIXED RUMINAL MICROBIAL CULTURE FOR INCUBATION
EXPERIMENTS
Procedure for the Collection of Whole Ruminal Contents
Modified from Tilley and Terry (1963).
1. Ruminally cannulated cows should be full fed common diet at least 7 days before first extraction of
ruminal contents.
2. Withhold feed and water from animals 2 h prior to the collection of ruminal contents.
3. Allow animals to calm down and be cooperative.
4. Open the cannula. Insert hand (with a shoulder length glove) deep into the rumen through the cannula
and mix ruminal contents thoroughly.
5. Collect whole ruminal contents carefully by hand, paying attention to get a representative sample from
various locations of the rumen.
6. Quickly transfer ruminal contents into preheated (380 to 390C) Styrofoam coolers. Always keep the
containers tightly closed except during transferring of ruminal contents.
7. Amount of whole ruminal contents required would be approximately double the amount of ruminal fluid
needed for incubation. Close the cannula after a sufficient quantity of ruminal contents is collected.
8. Immediately transfer ruminal contents to the laboratory.
9. Ruminal contents of individual animals will be collected and processed separately.
10. Following rules are to be adhered during the collection of ruminal contents-
(a) Use of same animals when collecting ruminal contents at different days.
(b) Collecting ruminal contents at a standard time and by same technique each day.
(c) Collecting and transporting ruminal contents quickly to prevent temperature shock.
Preparation of Buffer and Nutrient Medium
1. Buffer and nutrient medium should be prepared once for all runs prior to collection of ruminal fluid and
refrigerated until used.
2. Use each constituent according to the proportions given in the table below (Modified from Loper et al.,
1966).
3. Place these constituents (except CaCl2, cellulose and starch) into a liter beaker. Add about 500 mL of
deionized water and mix until completely dissolved. Then add CaCl 2 , cellulose and starch and mix
until completely dissolved.
4. Transfer this solution to a liter volumetric flask and dilute to volume with deionized water.
5. Transfer the solution back into the beaker. Measure the pH. Send CO2 to bubble through the solution
until pH 6.8 to 7.0 is reached.
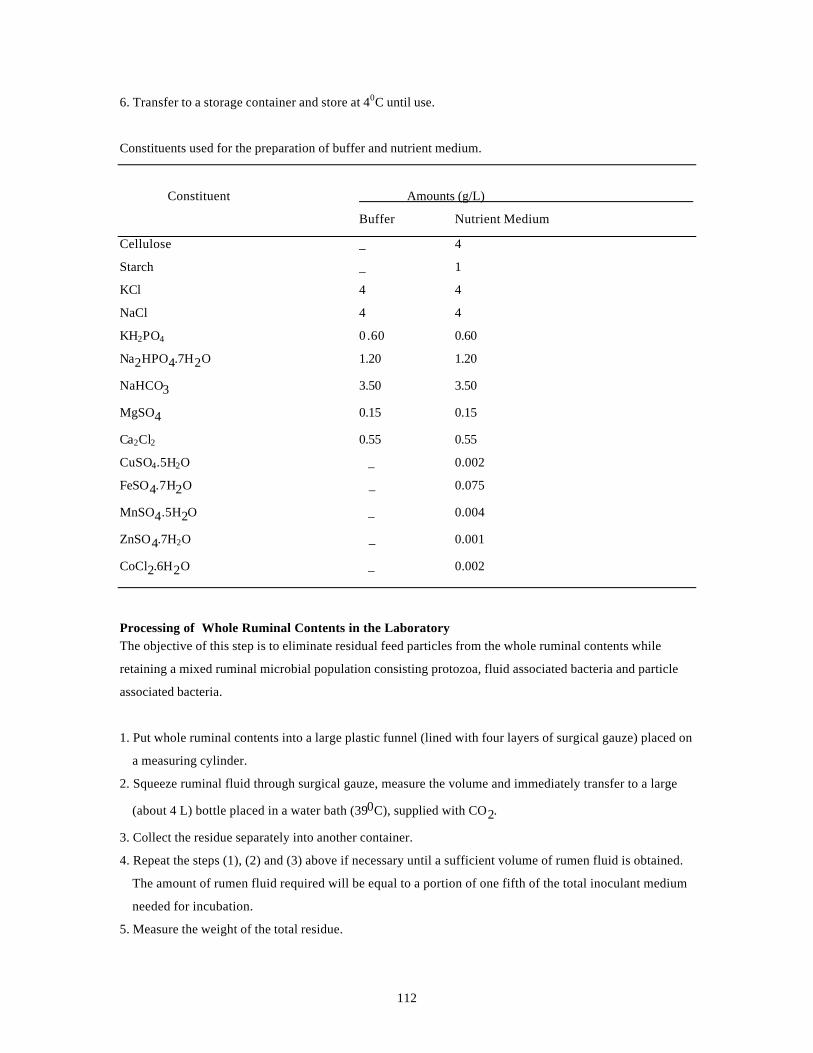
112
6. Transfer to a storage container and store at 40C until use.
Constituents used for the preparation of buffer and nutrient medium.
Constituent Amounts (g/L)
Buffer Nutrient Medium
Cellulose _ 4
Starch _ 1
KCl 4 4
NaCl 4 4
KH2PO4 0 .60 0.60
Na2HPO4.7H2O 1.20 1.20
NaHCO3 3.50 3.50
MgSO4 0.15 0.15
Ca2Cl2 0.55 0.55
CuSO4.5H2O _ 0.002
FeSO4.7H2O _ 0.075
MnSO4.5H2O _ 0.004
ZnSO4.7H2O _ 0.001
CoCl2.6H2O _ 0.002
Processing of Whole Ruminal Contents in the LaboratoryThe objective of this step is to eliminate residual feed particles from the whole ruminal contents while
retaining a mixed ruminal microbial population consisting protozoa, fluid associated bacteria and particle
associated bacteria.
1. Put whole ruminal contents into a large plastic funnel (lined with four layers of surgical gauze) placed on
a measuring cylinder.
2. Squeeze ruminal fluid through surgical gauze, measure the volume and immediately transfer to a large
(about 4 L) bottle placed in a water bath (390C), supplied with CO2.
3. Collect the residue separately into another container.
4. Repeat the steps (1), (2) and (3) above if necessary until a sufficient volume of rumen fluid is obtained.
The amount of rumen fluid required will be equal to a portion of one fifth of the total inoculant medium
needed for incubation.
5. Measure the weight of the total residue.
113
6. Add an equal weight of buffer solution (warmed to390C) to the residue. Supply CO2for 10 to15 s.
Close the container and shake well to resuspend the material. Squeeze the liquid through cheese cloth
into the measuring cylinder.
7. Repeat step (6) above three more times with the residue. Discard the residue. Immediately transfer the
washed suspension to the bottle containing the rumen fluid and shake the bottle well.
8. Add buffer to the above solution, if required until the ratio of ruminal fluid : buffer reaches 1 : 4.
9. Transfer the ruminal fluid-buffer mixture into 250-mL centrifugation bottles. Centrifuge the bottles at
5,000 X g for 30 min. at 40 C. Discard the supernatant and collect sediments into a blender.
10. Mix sediments with 750 mL of nutrient medium and blend for 30 sec.
11. Transfer the above mixture into a large (4L) bottle and add nutrient medium until the volume reaches
the amount of original ruminal fluid-buffer used.
12. Leave this medium at 390C in a constant temperature bath for 6 h with a CO2 supply.
Incubation of Feed Samples
1. Use air dried substrates (1 kg) ground to approximately 0.5 mm particle size using a Cyclotech mill.
2. Weigh triplicate samples from a particular substrate (equal to 0.35 g DM) into labeled 50 mL tubes and
stored at 380C until required.
3. Tubes should be fitted with stoppers equipped with Bunsen valves.
4. Pipette 35 mL of rumen fluid-buffer mixture into each of the incubation tubes.
5. Direct CO2 in the space above the liquid of each tube for 15 s before tightly stoppering. Mix contents
gently by a vortex mixer.
6. Incubate tubes in a water bath (at 390C). Run separate samples for 30, 60, 90 and 120 min of incubation.
7. Include triplicate blank tubes for each time interval that were treated in the same manner as with other
tubes. A blank contains only ruminal fluid and mineral solution in the 1 : 4 ratio, with no substrate
added.
8. Shake the contents in the tubes manually at 30, 60, 90 and 120 min of incubation.
9. After incubation, prepare the samples for the analysis of NH3, alpha amino and peptide-N. The samples
for NH3-N assay are prepared by adding two drops of conc. H2SO4 to each 10 mL of incubation mixture
and vortexing before storage at -20C. The samples for alpha amino and peptide-N assays are prepared by
adding 2 mL of 25% TCA to 8 mL of incubation mixture, vortexing and allowing to stand at 40C
overnight before storage at –200C.
114
APPENDIX B
Procedure for Amino Acid Uptake Experiment Using Parabiotic Chambers
1. Tissues are collected from one sheep for each run. A healthy and strong animal must be selected for
tissue collection.
2. Stun the animal with a captive bolt gun and record the time.
3. Open the abdominal cavity and remove the rumen and omasum. The rumen is opened along the dorsal
surface while the omasum is opened through the omasal orifice. Ruminal tissues will be collected
from all the compartments.
4. Wash the tissues by immersion in tap water (390 C) with gentle agitation.
5. Repeat until all the digesta is removed.
6. Immerse the washed tissues in 0.85% saline (390C) and immediately transfer the tissues to the
laboratory.
7. Remove the ruminal epithelium from the underline muscle layer by careful dissection, cut the ruminal
epithelium into sections 4cm x 4cm, and thoroughly clean by rinsing in succession; first twice with
saline solution, then four times with buffer solution. The omasal epithelium is prepared by peeling
apart opposing surfaces of the individual plies, followed by washing in the saline and buffer solutions.
8. Place the tissues in the holding buffer.
9. Mount the tissues between Ussing chamber halves. Place the o-ring on the serosal side and mount the
tissue on the chamber before placing mucosal side on top. Clamp the chambers tightly and place a
lead weight over the clamp.
10. Load 15 mL of mucosal fluid into the mucosal chamber then add 15 mL of serosal fluid into the
serosal chamber. Use the supernatants of incubated feed samples as the mucosal fluid and KRP buffer
(pH 7.4, osmolarity adjusted) as the serosal fluid. In the control treatment, use KRP buffer (pH 6.9) as
the mucosal fluid (instead of supernatant).
11. Place the unit in the water bath (390 C).
12. Insert the gassing+sampling device into each chamber and begin gassing. It is important to make sure
that O2 supply is not too strong and does not cause the fluids to bubble out of the chambers. Mark
time zero as soon as gassing + sampling device is attached to the first chamber.
13. As soon as the gassing + sampling device is attached to the chambers, draw out .6 mL of sample by
inserting 1-mL syringe into the luer stub of the sampling device from both chambers. Transfer the
sample into labeled 1.5-mL centrifuge tubes to be stored at -200C for future analysis.
14. Repeat the above steps 10, 11, 12 and 13 to set up all the other chamber units.
15. Do sampling at 30, 60, 120 and 240 min. after zero time.
16. At the end of sampling, stop O2 supply, disconnect gassing + sampling devices and take chambers out
of the water bath. Collect mucosal and serosal fluid into a container. Disconnect two halves of each
chamber and collect tissues separately into a tray.
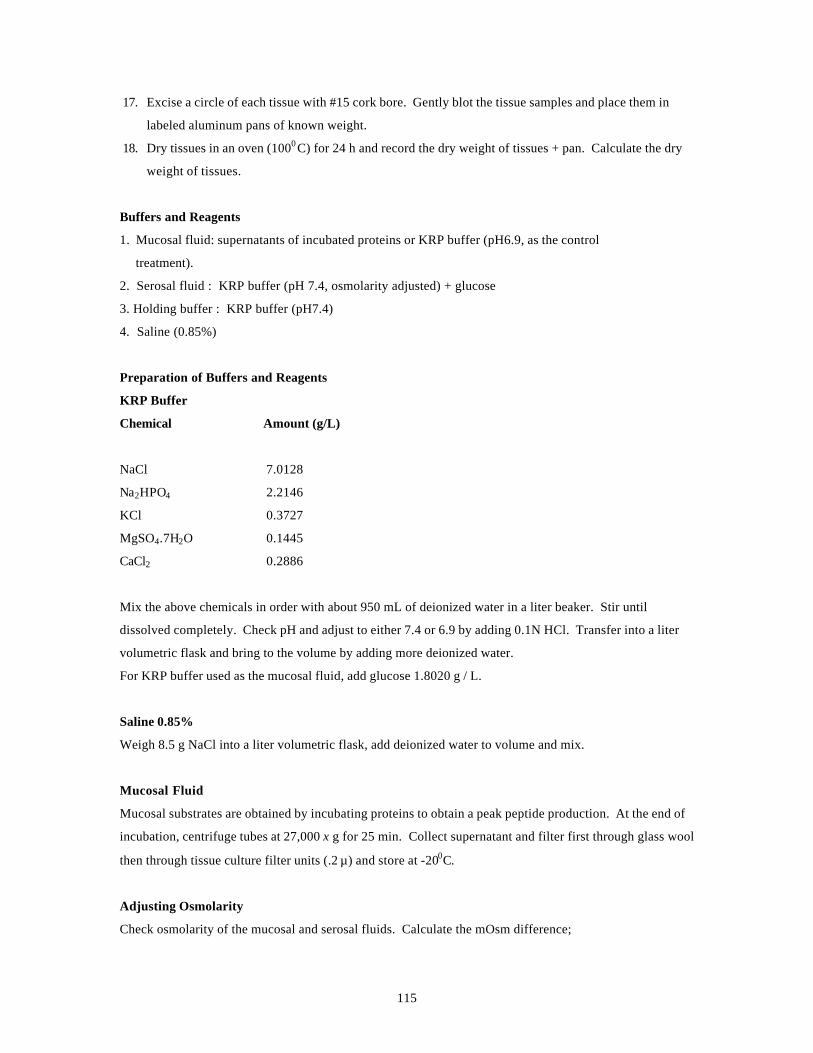
115
17. Excise a circle of each tissue with #15 cork bore. Gently blot the tissue samples and place them in
labeled aluminum pans of known weight.
18. Dry tissues in an oven (1000 C) for 24 h and record the dry weight of tissues + pan. Calculate the dry
weight of tissues.
Buffers and Reagents
1. Mucosal fluid: supernatants of incubated proteins or KRP buffer (pH6.9, as the control
treatment).
2. Serosal fluid : KRP buffer (pH 7.4, osmolarity adjusted) + glucose
3. Holding buffer : KRP buffer (pH7.4)
4. Saline (0.85%)
Preparation of Buffers and Reagents
KRP Buffer
Chemical Amount (g/L)
NaCl 7.0128
Na2HPO4 2.2146
KCl 0.3727
MgSO4.7H2O 0.1445
CaCl2 0.2886
Mix the above chemicals in order with about 950 mL of deionized water in a liter beaker. Stir until
dissolved completely. Check pH and adjust to either 7.4 or 6.9 by adding 0.1N HCl. Transfer into a liter
volumetric flask and bring to the volume by adding more deionized water.
For KRP buffer used as the mucosal fluid, add glucose 1.8020 g / L.
Saline 0.85%
Weigh 8.5 g NaCl into a liter volumetric flask, add deionized water to volume and mix.
Mucosal Fluid
Mucosal substrates are obtained by incubating proteins to obtain a peak peptide production. At the end of
incubation, centrifuge tubes at 27,000 x g for 25 min. Collect supernatant and filter first through glass wool
then through tissue culture filter units (.2 µ) and store at -200C.
Adjusting Osmolarity
Check osmolarity of the mucosal and serosal fluids. Calculate the mOsm difference;

116
mOsm difference = mOsm of mucosal fluid - mOsm of serosal fluid
Add mannitol to equalize osmolarity.
Amount (g) of mannitol to be added for each 100 mL of sample = 0.01822 x mOsm difference
Labeling (For six parabiotic units)
Chamber Mucosal fluid Tissue
A Soybean meal Omasal
B Fish meal Omasal
C KRP (pH6.9) Omasal
D Soybean meal Ruminal
E Fish meal Ruminal
F KRP (pH6.9) Ruminal
Color: Serosal - green; Mucosal - blue
*Six serosal syringes (20 mL)
Labeled: (green) AS, BS, CS, DS, ES, and FS
Loaded: 15 mL of KRP buffer (pH 7.4) + glucose (osmolarity adjusted)
to place in each appropriate serosal chamber.
*Six mucosal syringes (20 mL)
Labeled: (blue) AM, BM, CM, DM, EM and FM
Loaded: 15 mL of supernatants of incubated proteins or KRP buffer (pH6.9)
to place in each appropriate mucosal chamber.
*12 screw-top containers (20 mL)
Labeled: Mucosal (blue) AM, BM, CM, DM, EM and FM
Serosal (green) AS, BS, CS, DS, ES and FS
loaded with appropriate serosal and mucosal fluids in the night before.
*Six weighing pans
Labeled: A, B, C, D, E and F
*60 sampling syringes (1 mL)
Labeled: AM1, AM2, AM3, AM4, AM5, AS1, AS2, AS3, AS4, AS5
BM1, BM2, BM3, BM4, BM5 BS1, BS2, BS3, BS4, BS5
CM1, CM2, CM3, CM4, CM5, CS1, CS2, CS3, CS4, CS5
DM1, DM2, DM3, DM4, DM5, DS1, DS2, DS3, DS4, DS5
EM1, EM2, EM3, EM4, EM5, ES1, ES2, ES3, ES4, ES5
FM1, FM2, FM3, FM4, FM5, FS1, FS2, FS3, FS4, FS5
*60 centrifuge tubes (1.5 mL)
Labeled: as above correspond to each sampling syringe.
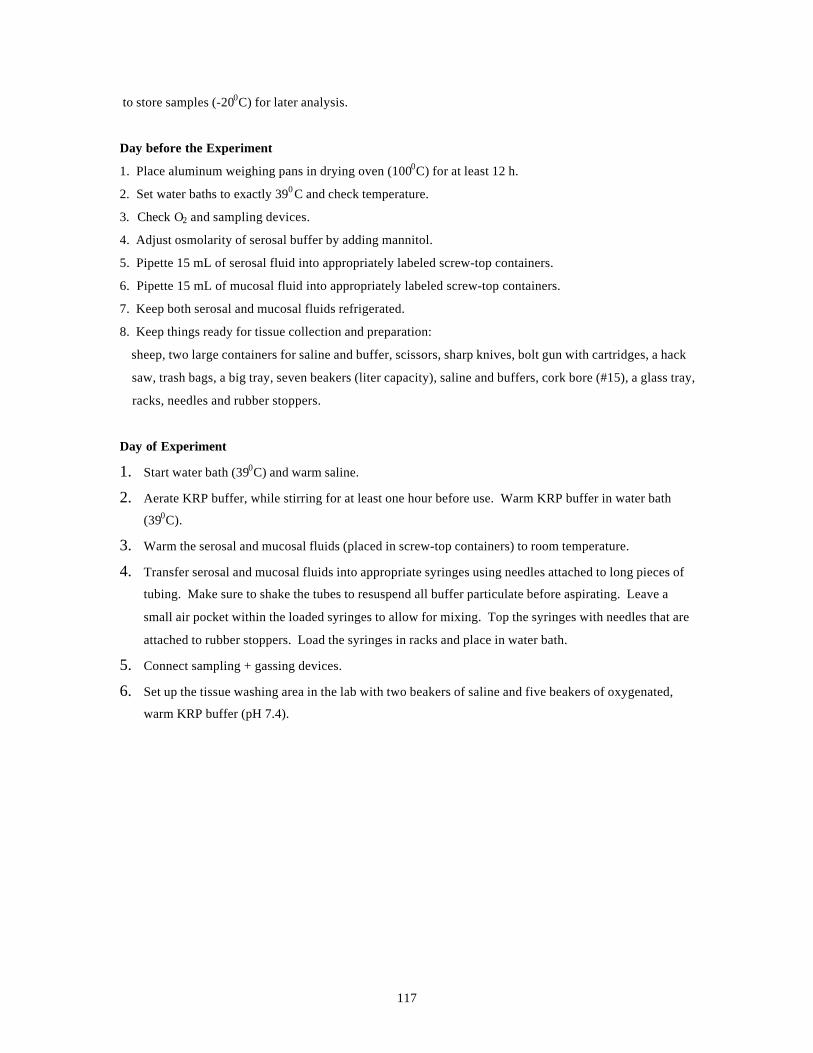
117
to store samples (-200C) for later analysis.
Day before the Experiment
1. Place aluminum weighing pans in drying oven (1000C) for at least 12 h.
2. Set water baths to exactly 390 C and check temperature.
3. Check O2 and sampling devices.
4. Adjust osmolarity of serosal buffer by adding mannitol.
5. Pipette 15 mL of serosal fluid into appropriately labeled screw-top containers.
6. Pipette 15 mL of mucosal fluid into appropriately labeled screw-top containers.
7. Keep both serosal and mucosal fluids refrigerated.
8. Keep things ready for tissue collection and preparation:
sheep, two large containers for saline and buffer, scissors, sharp knives, bolt gun with cartridges, a hack
saw, trash bags, a big tray, seven beakers (liter capacity), saline and buffers, cork bore (#15), a glass tray,
racks, needles and rubber stoppers.
Day of Experiment
1. Start water bath (390C) and warm saline.
2. Aerate KRP buffer, while stirring for at least one hour before use. Warm KRP buffer in water bath
(390C).
3. Warm the serosal and mucosal fluids (placed in screw-top containers) to room temperature.
4. Transfer serosal and mucosal fluids into appropriate syringes using needles attached to long pieces of
tubing. Make sure to shake the tubes to resuspend all buffer particulate before aspirating. Leave a
small air pocket within the loaded syringes to allow for mixing. Top the syringes with needles that are
attached to rubber stoppers. Load the syringes in racks and place in water bath.
5. Connect sampling + gassing devices.
6. Set up the tissue washing area in the lab with two beakers of saline and five beakers of oxygenated,
warm KRP buffer (pH 7.4).
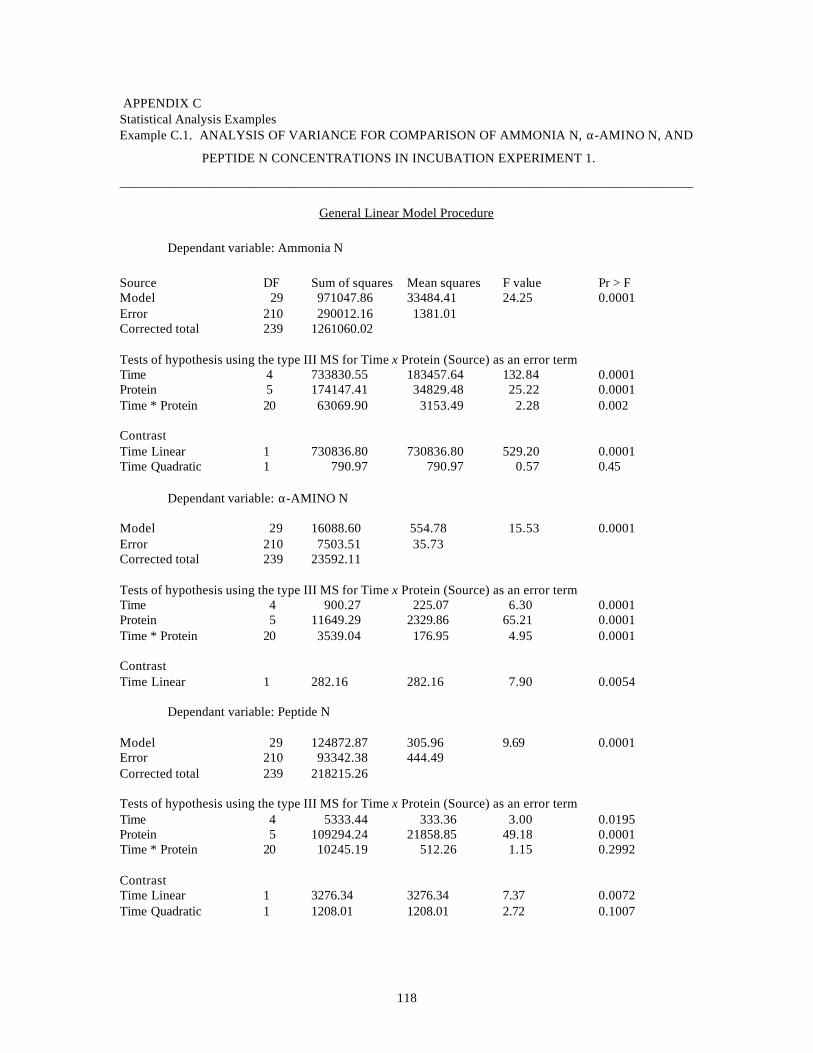
118
APPENDIX CStatistical Analysis ExamplesExample C.1. ANALYSIS OF VARIANCE FOR COMPARISON OF AMMONIA N, α-AMINO N, AND
PEPTIDE N CONCENTRATIONS IN INCUBATION EXPERIMENT 1.
______________________________________________________________________________________
General Linear Model Procedure
Dependant variable: Ammonia N
Source DF Sum of squares Mean squares F value Pr > FModel 29 971047.86 33484.41 24.25 0.0001Error 210 290012.16 1381.01Corrected total 239 1261060.02
Tests of hypothesis using the type III MS for Time x Protein (Source) as an error termTime 4 733830.55 183457.64 132.84 0.0001Protein 5 174147.41 34829.48 25.22 0.0001Time * Protein 20 63069.90 3153.49 2.28 0.002
ContrastTime Linear 1 730836.80 730836.80 529.20 0.0001Time Quadratic 1 790.97 790.97 0.57 0.45
Dependant variable: α-AMINO N
Model 29 16088.60 554.78 15.53 0.0001Error 210 7503.51 35.73Corrected total 239 23592.11
Tests of hypothesis using the type III MS for Time x Protein (Source) as an error termTime 4 900.27 225.07 6.30 0.0001Protein 5 11649.29 2329.86 65.21 0.0001Time * Protein 20 3539.04 176.95 4.95 0.0001
ContrastTime Linear 1 282.16 282.16 7.90 0.0054
Dependant variable: Peptide N
Model 29 124872.87 305.96 9.69 0.0001Error 210 93342.38 444.49Corrected total 239 218215.26
Tests of hypothesis using the type III MS for Time x Protein (Source) as an error termTime 4 5333.44 333.36 3.00 0.0195Protein 5 109294.24 21858.85 49.18 0.0001Time * Protein 20 10245.19 512.26 1.15 0.2992
ContrastTime Linear 1 3276.34 3276.34 7.37 0.0072Time Quadratic 1 1208.01 1208.01 2.72 0.1007

119
Example C.2. ANALYSIS OF VARIANCE FOR COMPARISON OF AMMONIA N, α-AMINO N, AND
PEPTIDE N CONCENTRATIONS IN INCUBATION EXPERIMENT 2.
______________________________________________________________________________________
General Linear Model Procedure
Dependant variable: Ammonia N
Source DF Sum of squares Mean squares F value Pr > F
Model 29 2317464.59 79912.57 38.69 0.0001Error 210 433792.10 2065.68Corrected total 239 2751256.69
Tests of hypothesis using the type III MS for Time x Protein (Source) as an error termTime 4 2050843.41 512710.85 248.20 0.0001Protein 5 174115.24 34823.05 16.86 0.0001Time * Protein 20 92505.94 4625.30 2.24 0.0025
ContrastTime Linear 1 2017966.04 2017966.04 976.90 0.0001Time Quadratic 1 7669.09 7669.09 3.71 0.0554
Dependant variable: α-AMINO N
Model 29 8734.91 301.20 1.22 0.2105Error 210 51726.95 246.32Corrected total 239 60461.86
Tests of hypothesis using the type III MS for Time x Protein (Source) as an error termTime 4 4910.79 1127.70 4.98 0.0007Protein 5 2727.21 545.44 2.21 0.0541Time * Protein 20 1096.91 54.85 0.22 0.9999
ContrastTime Linear 1 2744.77 2744.77 11.14 0.0010Time Quadratic 1 1911.06 1911.06 7.76 0.0058
Dependant variable: Peptide N
Model 29 39890.97 1375.55 7.38 0.0001Error 210 39115.52 186.26Corrected total 239 79006.49
Tests of hypothesis using the type III MS for Time x Protein (Source) as an error termTime 4 17186.90 4296.73 23.07 0.0001Protein 5 19121.49 3824.30 20.53 0.0001Time * Protein 20 3582.58 179.13 0.96 0.5102
ContrastTime Linear 1 15424.78 15424.78 82.81 0.0001

120
Example C.3. ANALYSIS OF VARIANCE FOR COMPARISON OF AMMONIA N, α-AMINO N, AND
PEPTIDE N CONCENTRATIONS IN INCUBATION EXPERIMENT 3.
______________________________________________________________________________________
General Linear Model Procedure
Dependant variable: Ammonia N
Source DF Sum of squares Mean squares F value Pr > F
Model 29 1025287.90 35354.75 5.82 0.0001Error 210 1275240.02 6072.57Corrected total 239 2300527.92
Tests of hypothesis using the type III MS for Time x Protein (Source) as an error termTime 4 884570.51 221142.63 36.42 0.0001Protein 5 92476.32 18495.26 3.05 0.0112Time * Protein 20 48241.07 2412.05 0.40 0.9910
ContrastTime Linear 1 872624.19 872624.19 143.70 0.0001Time Quadratic 1 10791.88 10791.88 1.78 0.1839
Dependant variable: α-AMINO N
Model 29 8310.47 286.57 8.05 0.0001Error 210 7475.36 35.60Corrected total 239 15785.83
Tests of hypothesis using the type III MS for Time x Protein (Source) as an error termTime 4 6426.81 1606.70 45.14 0.0001Protein 5 434.59 86.92 2.44 0.0355Time * Protein 20 1449.07 72.45 2.04 0.0071
ContrastTime Linear 1 4696.38 4696.38 131.93 0.0001Time Quadratic 1 1280.97 1280.97 35.99 0.0001
Dependant variable: Peptide N
Model 29 18662.16 643.52 4.12 0.0001Error 210 32761.21 156.01Corrected total 239 51423.37
Tests of hypothesis using the type III MS for Time x Protein (Source) as an error termTime 4 12726.65 3181.66 20.39 0.0001Protein 5 3896.44 779.29 5.00 0.0002Time * Protein 20 2039.07 101.95 0.65 0.8679
ContrastTime Linear 1 12269.80 12269.80 78.65 0.0001Time Quadratic 1 1.73 1.73 0.01 0.9162

121
Example C.4. ANALYSIS OF VARIANCE FOR COMPARISON OF AMMONIA N, α-AMINO N, AND
PEPTIDE N CONCENTRATIONS IN INCUBATION EXPERIMENT 4.
______________________________________________________________________________________
General Linear Model Procedure
Dependant variable: Ammonia N
Source DF Sum of squares Mean squares F value Pr > F
Model 29 108515.78 3741.92 5.65 0.0001Error 210 139170.84 662.72Corrected total 239 247686.62
Tests of hypothesis using the type III MS for Time x Protein (Source) as an error termTime 4 66556.07 16639.02 25.11 0.0001Protein 5 27611.95 5522.39 8.33 0.0001Time * Protein 20 14347.77 717.39 1.08 0.3697
ContrastTime Linear 1 60313.39 60313.39 91.01 0.0001Time Quadratic 1 3325.84 3325.84 5.02 0.0261
Dependant variable: α-AMINO N
Model 29 2067.91 71.31 1.68 0.0205Error 210 8903.45 42.40Corrected total 239 10971.36
Tests of hypothesis using the type III MS for Time x Protein (Source) as an error termTime 4 1192.75 298.19 7.03 0.0001Protein 5 239.60 47.92 1.13 0.3454Time * Protein 20 635.55 31.78 0.75 0.7712
ContrastTime Linear 1 1119.99 1119.93 26.42 0.0001Time Quadratic 1 52.04 52.04 1.23 0.2692
Dependant variable: Peptide N
Model 29 25793.66 889.44 6.05 0.0001Error 210 30884.66 147.07Corrected total 239 56678.32
Tests of hypothesis using the type III MS for Time x Protein (Source) as an error termTime 4 7504.20 1876.05 12.76 0.0001Protein 5 9317.80 1863.56 12.67 0.0001Time * Protein 20 8971.66 448.58 3.05 0.0001
ContrastTime Linear 1 6896.44 6896.44 46.89 0.0001Time Quadratic 1 286.53 286.53 1.95 0.1643
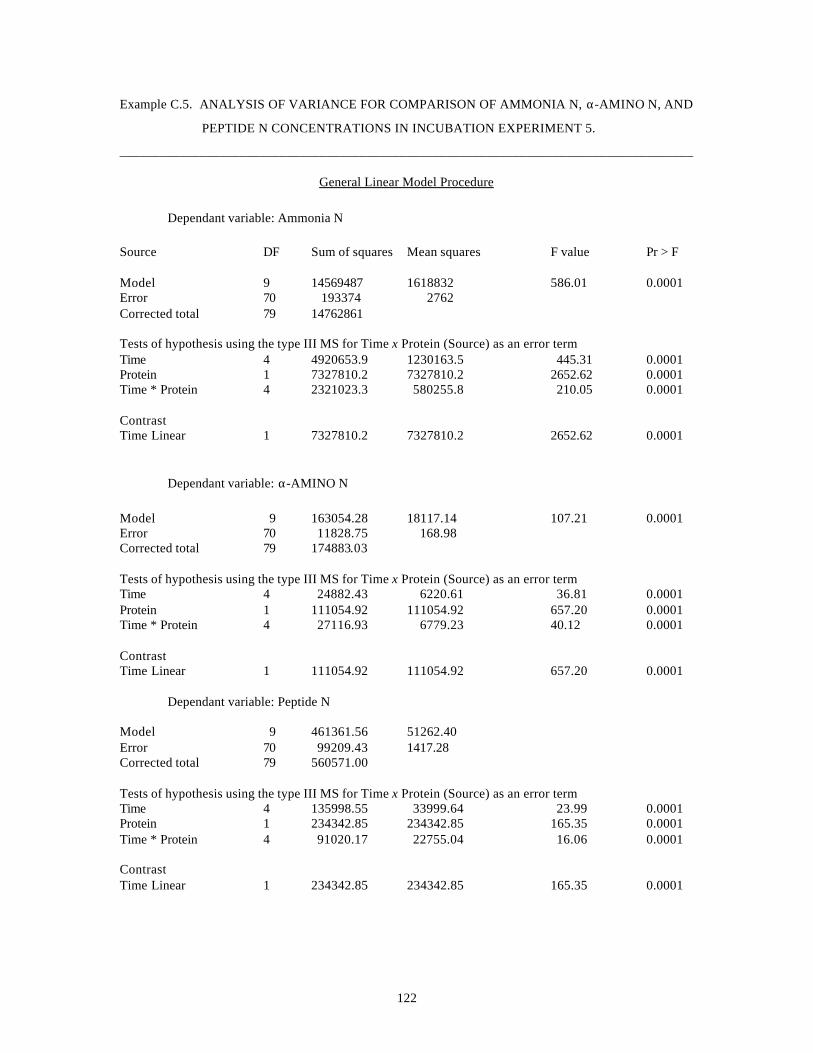
122
Example C.5. ANALYSIS OF VARIANCE FOR COMPARISON OF AMMONIA N, α-AMINO N, AND
PEPTIDE N CONCENTRATIONS IN INCUBATION EXPERIMENT 5.
______________________________________________________________________________________
General Linear Model Procedure
Dependant variable: Ammonia N
Source DF Sum of squares Mean squares F value Pr > F
Model 9 14569487 1618832 586.01 0.0001Error 70 193374 2762Corrected total 79 14762861
Tests of hypothesis using the type III MS for Time x Protein (Source) as an error termTime 4 4920653.9 1230163.5 445.31 0.0001Protein 1 7327810.2 7327810.2 2652.62 0.0001Time * Protein 4 2321023.3 580255.8 210.05 0.0001
ContrastTime Linear 1 7327810.2 7327810.2 2652.62 0.0001
Dependant variable: α-AMINO N
Model 9 163054.28 18117.14 107.21 0.0001Error 70 11828.75 168.98Corrected total 79 174883.03
Tests of hypothesis using the type III MS for Time x Protein (Source) as an error termTime 4 24882.43 6220.61 36.81 0.0001Protein 1 111054.92 111054.92 657.20 0.0001Time * Protein 4 27116.93 6779.23 40.12 0.0001
ContrastTime Linear 1 111054.92 111054.92 657.20 0.0001
Dependant variable: Peptide N
Model 9 461361.56 51262.40Error 70 99209.43 1417.28Corrected total 79 560571.00
Tests of hypothesis using the type III MS for Time x Protein (Source) as an error termTime 4 135998.55 33999.64 23.99 0.0001Protein 1 234342.85 234342.85 165.35 0.0001Time * Protein 4 91020.17 22755.04 16.06 0.0001
ContrastTime Linear 1 234342.85 234342.85 165.35 0.0001
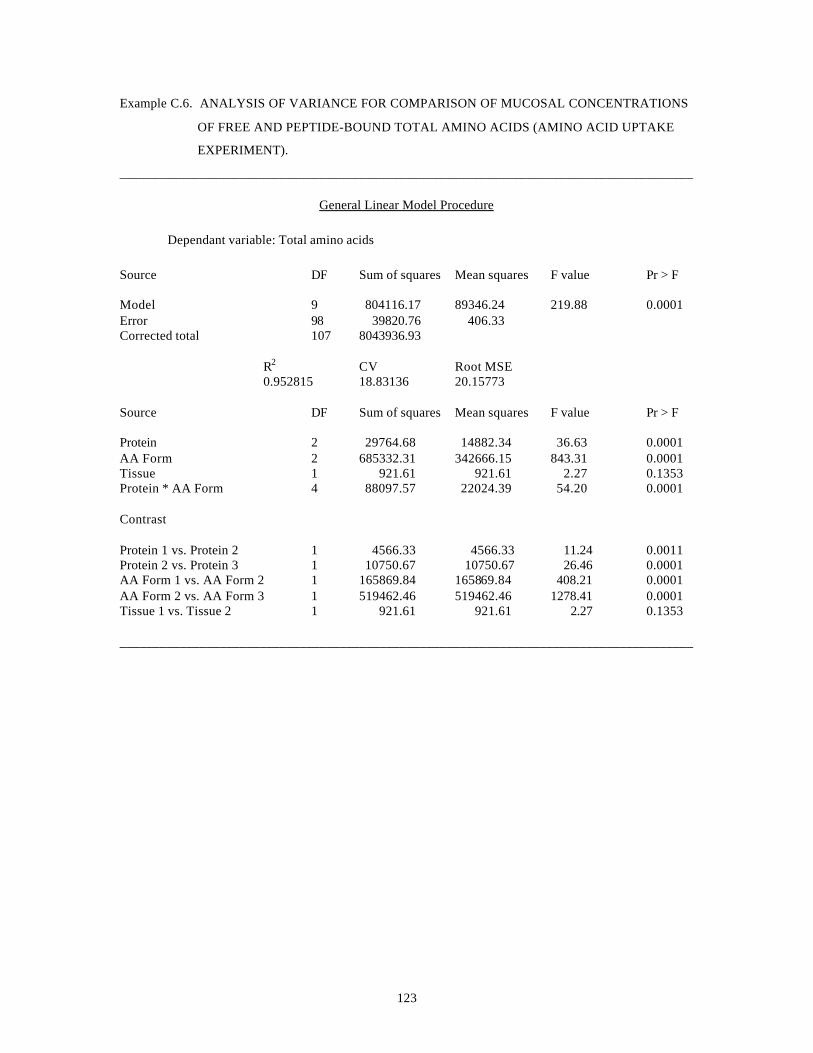
123
Example C.6. ANALYSIS OF VARIANCE FOR COMPARISON OF MUCOSAL CONCENTRATIONS
OF FREE AND PEPTIDE-BOUND TOTAL AMINO ACIDS (AMINO ACID UPTAKE
EXPERIMENT).
______________________________________________________________________________________
General Linear Model Procedure
Dependant variable: Total amino acids
Source DF Sum of squares Mean squares F value Pr > F
Model 9 804116.17 89346.24 219.88 0.0001Error 98 39820.76 406.33Corrected total 107 8043936.93
R2 CV Root MSE0.952815 18.83136 20.15773
Source DF Sum of squares Mean squares F value Pr > F
Protein 2 29764.68 14882.34 36.63 0.0001AA Form 2 685332.31 342666.15 843.31 0.0001Tissue 1 921.61 921.61 2.27 0.1353Protein * AA Form 4 88097.57 22024.39 54.20 0.0001
Contrast
Protein 1 vs. Protein 2 1 4566.33 4566.33 11.24 0.0011Protein 2 vs. Protein 3 1 10750.67 10750.67 26.46 0.0001AA Form 1 vs. AA Form 2 1 165869.84 165869.84 408.21 0.0001AA Form 2 vs. AA Form 3 1 519462.46 519462.46 1278.41 0.0001Tissue 1 vs. Tissue 2 1 921.61 921.61 2.27 0.1353
______________________________________________________________________________________

124
Example C.7. ANALYSIS OF VARIANCE FOR COMPARISON OF SEROSAL APPEARANCE OF
FREE AND PEPTIDE-BOUND TOTAL AMINO ACIDS VIA RUMINAL AND
OMASAL EPITHELIA (AMINO ACID UPTAKE EXPERIMENT).
______________________________________________________________________________________
General Linear Model Procedure
Dependant variable: Total amino acids
Source DF Sum of squares Mean squares F value Pr > F
Model 18 26767301.22 1487072.29 9.96 0.0001Error 89 13284778.50 149267.17Corrected total 107 40052079.72
R2 CV Root MSE0.6683 65.3849 386.35
Source DF Sum of squares Mean squares F value Pr > F
Animal 1 65911.95 65911.95 0.44 0.5081Protein 2 3552533.52 1776266.76 11.90 0.0001AA Form 2 7171072.72 358536.36 24.02 0.0001Tissue 1 7755603.82 7755603.82 51.96 0.0001Protein * AA Form 4 1826442.75 456610.69 3.06 0.0207Protein * Tissue 2 2170694.19 1085347.09 7.27 0.0012AA Form * Tissue 2 2741344.97 1370672.49 9.18 0.0002Protein * AA Form * Tissue 4 1483697.31 370924.33 2.48 0.0492
Contrast
Protein 1 vs. Protein 2 1 3367605.05 3367605.05 22.56 0.0001Protein 2 vs. Protein 3 1 297169.10 297169.10 1.99 0.1617AA Form 1 vs. AA Form 2 1 4482729.43 4482729.43 30.03 0.0001AA Form 2 vs. AA Form 3 1 2688343.29 2688343.29 18.01 0.0001Tissue 1 vs. Tissue 2 1 7755603.82 7755603.82 51.96 0.0001

125
VITA
Vajira Parakrama Jayawardena, son of late Daya and Somalatha Jayawardena,
was born on January 25, 1962 in Kandy, Sri Lanka. He received his secondary education
from Vidyartha College, Kandy and graduated in 1980. He received his B.Sc.
(Agriculture) degree from the University of Peradeniya in December 1985. He started his
career as an Assistant Lecturer at the University of Peradeniya in 1986 and obtained a
Masters degree in Animal Science from the same University in 1992. He was promoted
to a Senior Lecturer in 1994. His doctoral studies were initiated at Virginia Tech in
October 1994 with the financial support received from the John Lee Pratt Animal
Nutrition Program. He married Monica Fernando in 1991, and is a father of two children
(Nathashi and Nimesha). He is a member of Sri Lanka Association of Animal
Production.
_____________________________