Embed Size (px)
Citation preview
21
In depth First Quarter 2010
from the Observatory
MINISTERIODEL INTERIOR
Observatorio Nacional de Seguridad Vial
www.dgt.es
Measurement of free-flow speed on the spanish road network.
131
140
102
141
131
97
113
125
99
125
112
89
0
20
40
60
80
100
120
140
160
HEAVY VEHICLESLIGHT VEHICLESMOTORCYCLES
MOTORWAYS DUAL CARRIAGEWAYS
CONVENTIONAL AND REGIONAL ROADS (100 km/h) CONVENTIONAL AND REGIONAL ROADS (90 km/h)
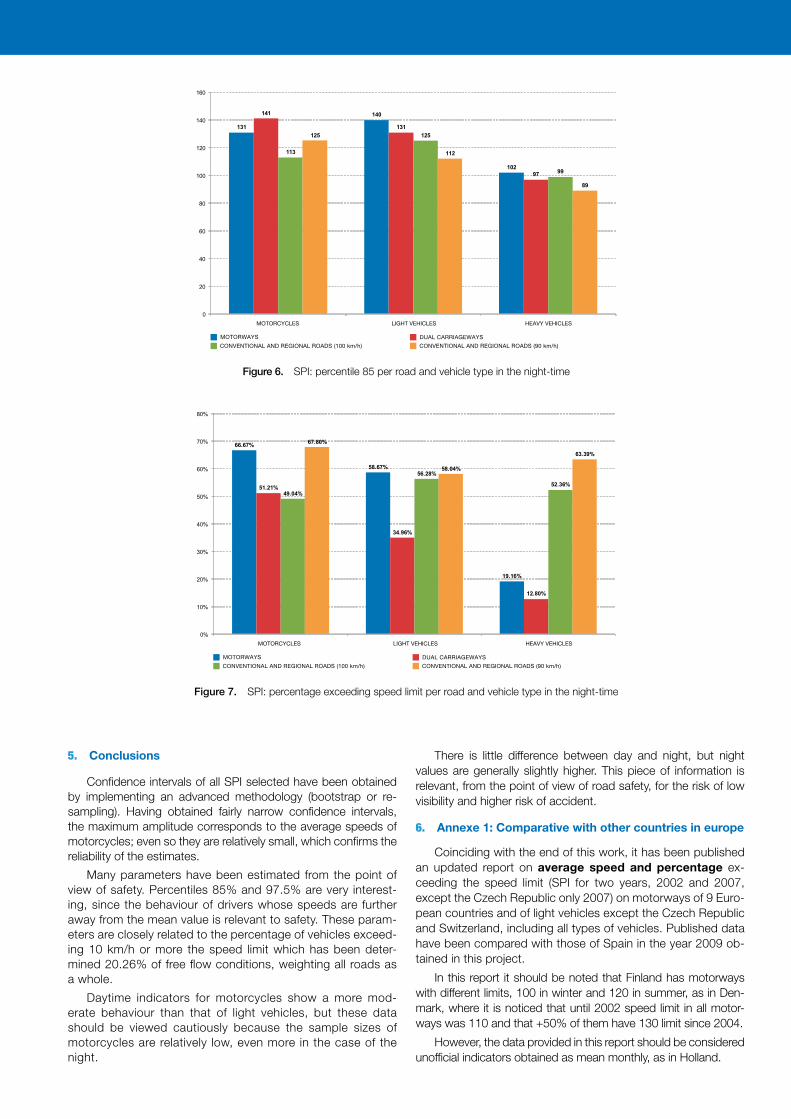
Figure 6. SPI: percentile 85 per road and vehicle type in the night-time
66.67%
58.67%
19.16%
51.21%
34.96%
12.80%
49.04%
56.28%
52.36%
67.80%
58.04%
63.39%
0%
10%
20%
30%
40%
50%
60%
70%
80%
HEAVY VEHICLESLIGHT VEHICLESMOTORCYCLES
MOTORWAYS DUAL CARRIAGEWAYS
CONVENTIONAL AND REGIONAL ROADS (100 km/h) CONVENTIONAL AND REGIONAL ROADS (90 km/h)
Figure 7. SPI: percentage exceeding speed limit per road and vehicle type in the night-time
AVERAGE SPEED LIGHT VEHICLES (except Czech Republic and Switzerland that include all vehicles).MOTORWAYS 2002-2007. Spain 2009 (free-flow condi�ons)
Average speed 2002 (km/h) 5.0215.5210219.4118.4114116017.2111.9111.201
Average speed 2007 (km/h) 103.1 117.7 112.7 110 107 115.1 114.3 122.51 105 122.2 119.4 119.9
0
20
40
60
80
100
120
140
Finland 100
km/h(winter)
Denmark(100
km/h)
UnitedKingdom Ireland
Finland(summer) Holland
CzechRepublic
Denmark(130 km/h)
FranceSwitzerland SPAIN Austria
Figure 8. Comparative of average speed in other European countries
60
0
24
3836.6
0
47
27.9
67.8
51
20 21
39.9
57.44
31
23
0
10
20
30
40
50
60
70
80
% LIGHT VEHICLES EXCEEDING SPEED LIMIT (except Czech Republic and Switzerland that includeall vehicles). MOTORWAYS. 2002-2007. SPAIN 2009 (free-flow conditions)
Finland (100 km/hin winter)
Percentage of offenders (%) 2002 Percentage of offenders (%) 2007
IrelandUnited Kingdom Switzerland Finland (summer) SPAIN France Austria
Figure 9. Comparative of percentage of offenders in other European countries
MINISTERIODEL INTERIOR
Observatorio Nacional de Seguridad VialJosefa Valcárcel, 4428071 Madridwww.dgt.es D.L.: M-25617-2010 Nipo: 128-10-015-6
Observatorio Nacional de Seguridad Vial
Introduction
This study was conducted by the University Institute of Au-tomobile Research, part of the Higher School of Industrial En-gineering. Technical University of Madrid. (UPM- INSIA) in the framework of the research project financed by the Directorate-General for Traffic in 2009. It presents the results of applying the recommendations of the European project SafetyNet on the esti-mate of SPIs (Safety Performance Indicators) for free-flow speed (FFS), that is, travelling along sections with road surface and vis-ibility in perfect condition and moderate volume of traffic, so that the only restriction that the driver has is the speed limit laid down by law in force, with a view to have a common framework for indicators (in this case, for FFS) in the European countries.
To this end, in Spain a stratified sampling has been designed by regions and road types (motorways, dual carriageways, state-owned conventional roads and regional roads —owned by the Autonomous regions— with two types of speed limit: 90 and 100 km/h.), dividing the territory into 8 regions: Andalusia (R-1); Cen-tral Plain excluding Madrid, that is, both Castillas and Extremadu-ra (R-2); Madrid (R-3); Valencia and Murcia (R-4); Catalonia (R-5); Galicia and Asturias (R-6); Basque Country, Navarre, Cantabria and La Rioja (R-7) and Aragón (R-8). 100 observation locations were chosen at random where very precise devices for measur-ing speed have been installed. The sections of the sample were subjected to two stages of verification of compliance with the SafetyNet recommendations for producing FFS indicators: a first desktop stage using IT tools and a second in situ stage, where minimal changes in the selection and replacement of the sections chosen in the desktop stage have been made. The integrated distribution of FFS of the 8 regions has been estimated in the four road types and three vehicle types (light vehicles, motorcycles and heavy vehicles).
1. Safetynet conditions for producing a SPI of FFS
The purpose of this Spanish pilot project is the estimate of Indicators (SPI – Safety Performance Indicators) of the distribu-tion of free-flow speed, in the framework of the SafetyNet Project recommendations. In order to assure reliability and to allow com-parison of the measures at European level, the SafetyNet manual recommends that the locations where the speed measurements are carried out are such that the vehicle speed is not altered by factors unrelated to the drivers. These locations must:
be in a straight and uniform road section•
be in a section where exceeding the speed limit is possible •
be in a section with slope under 5% in the 500 preceding •meters
be at least 500 meters away from intersections•
be at least 500 meters away from speed reduction devices•
be at least 500 meters away from road works•
be at least 500 meters away from pedestrian crossings•
be at least 1000 meters away from speed limit changing •
points or signs
be away from working or parking areas or other circum-•
stances close to the road, be in good pavement and
surface conditions
be at least 500 meters away from gradient changes•
Based on these conditions with the most restrictive assump-
tions, the code developed in MATLAB language pre-selects the
road sections among those measuring at least 5 km in length.
In every station and its observations the data quality has •
been monitored and a selection has been made by days
of the week (restricted to Tuesdays, Wednesdays and
Thursdays, that are neither a public holiday nor the day
before or after a public holiday) and by time slots (with
the aim of avoiding traffic jams and peak hours): from
10:00 to 10:59 and from 15:00 to 15:59 for daytime
From 22:00 to 22:59 for night-time•
The additional SafetyNet recommendation on separation
distance of at least 5 seconds between vehicles has also been
taken into account.
2. Desktop work and fieldwork
2.1 Desktop work. Stratified sampling. Software preparation.
Validation of the data
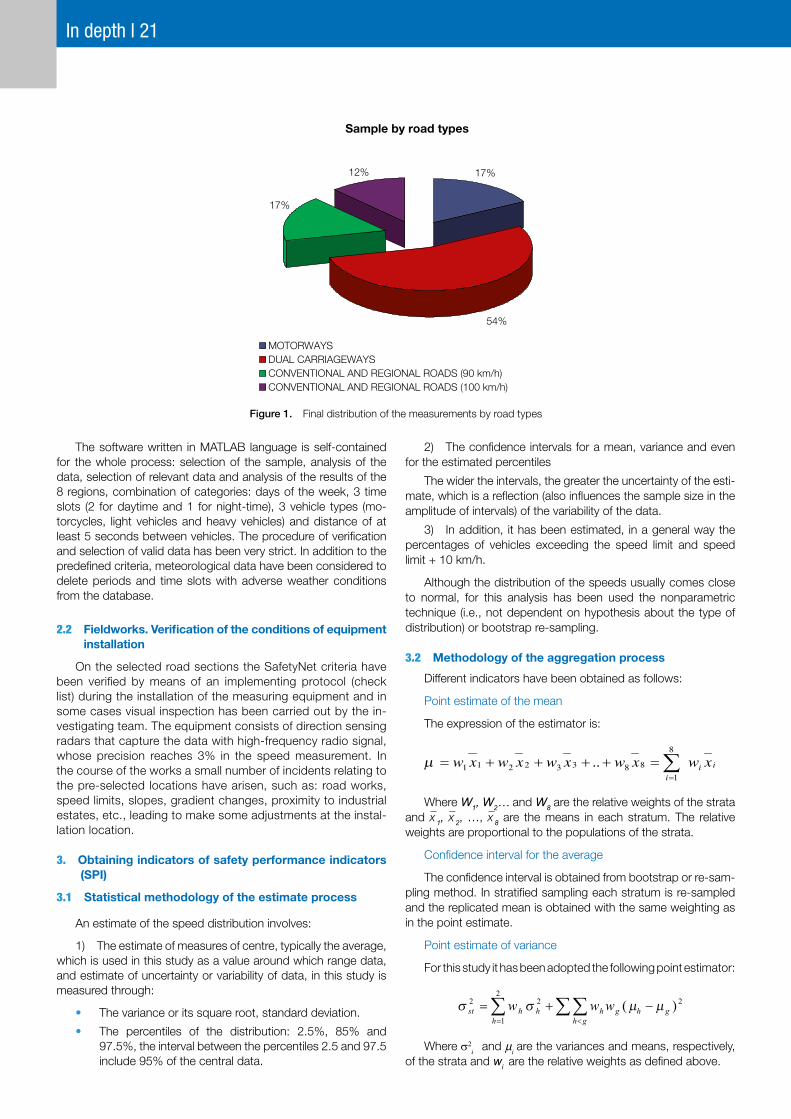
The sampling is stratified by regions and road types. The 8
regions defined confirm the hypothesis of an homogeneous be-
haviour in each stratum.
The final distribution by 4 road types: Motorways, Dual car-
riageways, Conventional and Regional roads with a speed limit
of 100 km/h, and Conventional and Regional roads with a speed
limit of 90 km/h, is shown in Figure 1.
5. Conclusions
Confidence intervals of all SPI selected have been obtained by implementing an advanced methodology (bootstrap or re-sampling). Having obtained fairly narrow confidence intervals, the maximum amplitude corresponds to the average speeds of motorcycles; even so they are relatively small, which confirms the reliability of the estimates.
Many parameters have been estimated from the point of view of safety. Percentiles 85% and 97.5% are very interest-ing, since the behaviour of drivers whose speeds are further away from the mean value is relevant to safety. These param-eters are closely related to the percentage of vehicles exceed-ing 10 km/h or more the speed limit which has been deter-mined 20.26% of free flow conditions, weighting all roads as a whole.
Daytime indicators for motorcycles show a more mod-erate behaviour than that of light vehicles, but these data should be viewed cautiously because the sample sizes of motorcycles are relatively low, even more in the case of the night.
There is little difference between day and night, but night values are generally slightly higher. This piece of information is relevant, from the point of view of road safety, for the risk of low visibility and higher risk of accident.
6. Annexe 1: Comparative with other countries in europe
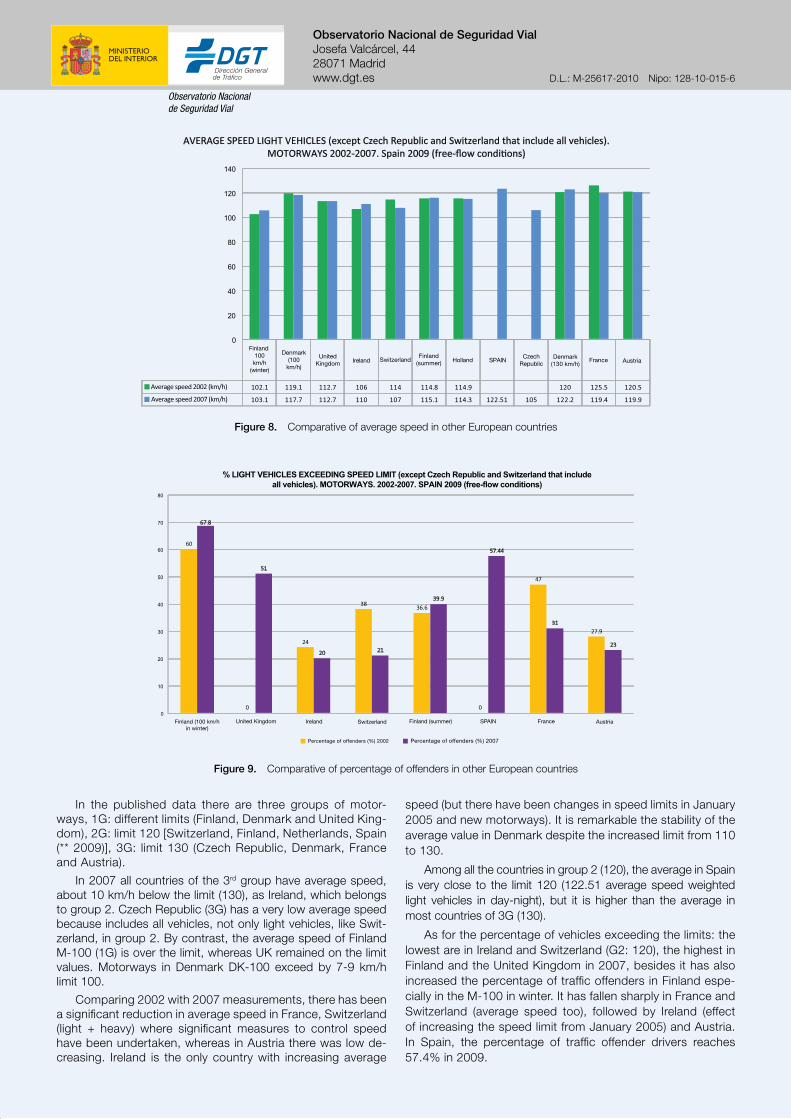
Coinciding with the end of this work, it has been published an updated report on average speed and percentage ex-ceeding the speed limit (SPI for two years, 2002 and 2007, except the Czech Republic only 2007) on motorways of 9 Euro-pean countries and of light vehicles except the Czech Republic and Switzerland, including all types of vehicles. Published data have been compared with those of Spain in the year 2009 ob-tained in this project.
In this report it should be noted that Finland has motorways with different limits, 100 in winter and 120 in summer, as in Den-mark, where it is noticed that until 2002 speed limit in all motor-ways was 110 and that +50% of them have 130 limit since 2004.
However, the data provided in this report should be considered unofficial indicators obtained as mean monthly, as in Holland.
In the published data there are three groups of motor-ways, 1G: different limits (Finland, Denmark and United King-dom), 2G: limit 120 [Switzerland, Finland, Netherlands, Spain (** 2009)], 3G: limit 130 (Czech Republic, Denmark, France and Austria).
In 2007 all countries of the 3rd group have average speed, about 10 km/h below the limit (130), as Ireland, which belongs to group 2. Czech Republic (3G) has a very low average speed because includes all vehicles, not only light vehicles, like Swit-zerland, in group 2. By contrast, the average speed of Finland M-100 (1G) is over the limit, whereas UK remained on the limit values. Motorways in Denmark DK-100 exceed by 7-9 km/h limit 100.
Comparing 2002 with 2007 measurements, there has been a significant reduction in average speed in France, Switzerland (light + heavy) where significant measures to control speed have been undertaken, whereas in Austria there was low de-creasing. Ireland is the only country with increasing average
speed (but there have been changes in speed limits in January 2005 and new motorways). It is remarkable the stability of the average value in Denmark despite the increased limit from 110 to 130.
Among all the countries in group 2 (120), the average in Spain is very close to the limit 120 (122.51 average speed weighted light vehicles in day-night), but it is higher than the average in most countries of 3G (130).
As for the percentage of vehicles exceeding the limits: the lowest are in Ireland and Switzerland (G2: 120), the highest in Finland and the United Kingdom in 2007, besides it has also increased the percentage of traffic offenders in Finland espe-cially in the M-100 in winter. It has fallen sharply in France and Switzerland (average speed too), followed by Ireland (effect of increasing the speed limit from January 2005) and Austria. In Spain, the percentage of traffic offender drivers reaches 57.4% in 2009.
In depth l 21 In depth l 21
Sample by road types
54%
17%
17%
12%
MOTORWAYSDUAL CARRIAGEWAYSCONVENTIONAL AND REGIONAL ROADS (90 km/h) CONVENTIONAL AND REGIONAL ROADS (100 km/h)
Figure 1. Final distribution of the measurements by road types
Confidence interval of variance
As in the case of the mean, replicated variances are obtained applying the point estimator to the replicas of the samples of the strata.
Point estimate of percentiles
This procedure applies to the estimated percentiles of 2.5%, 97.5% and 85%. The first two define the central 95% of the population and the last percentile is part of the requirements of SafetyNet. To that end, samples of strata are sorted, and then each element of the sample is given a relative weight propor-tional to the weight of the stratum in the population. Then, the point estimator of the percentile is obtained as corresponding percentile of the weighted sample, from the set of measures realized.
Confidence intervals of percentiles
As in the case of the mean and variance, we obtain the repli-cas of the variances applying the point estimate to the replicas of the samples of the strata.
Estimator of the distribution function
The application of this parameter is the proportion of vehicles exceeding the speed limit or this speed + 10 km/h.
The point estimator is obtained from the ordered and weight-ed sample, as discussed above, as the accumulated weight corresponding to the value for which is wanted to calculate the distribution function (speed limit or speed limit + 10 km/h).
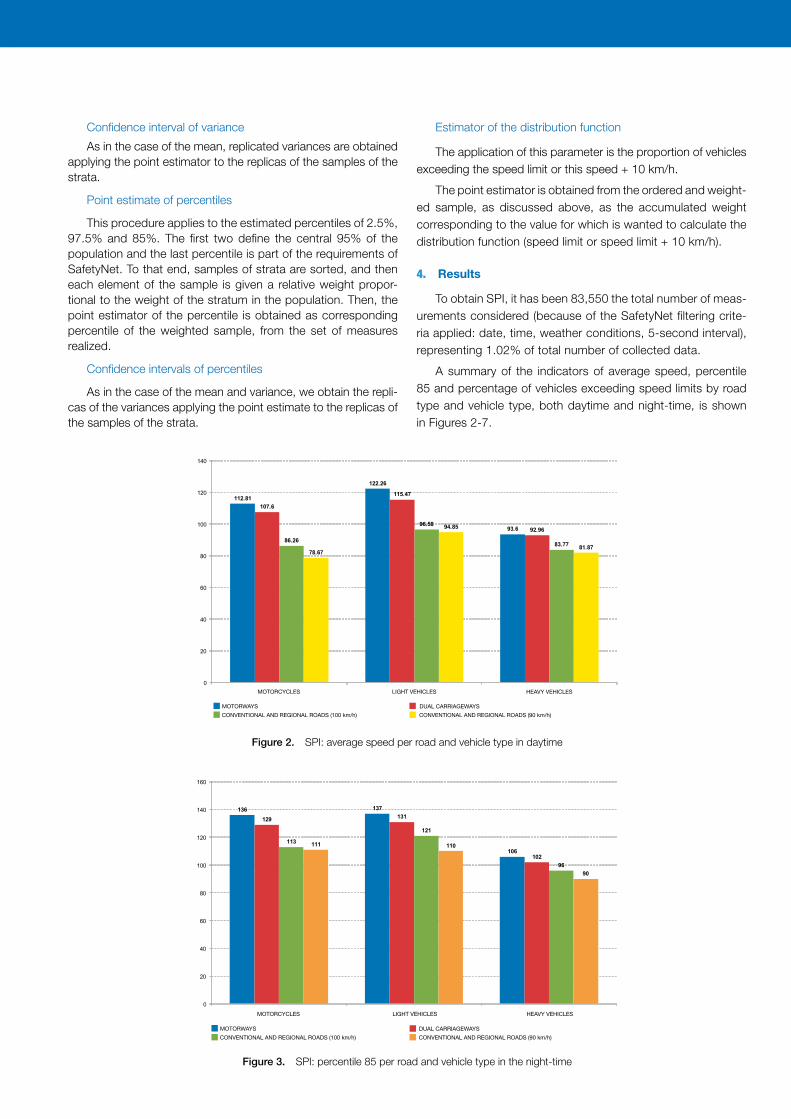
4. Results
To obtain SPI, it has been 83,550 the total number of meas-urements considered (because of the SafetyNet filtering crite-ria applied: date, time, weather conditions, 5-second interval), representing 1.02% of total number of collected data.
A summary of the indicators of average speed, percentile 85 and percentage of vehicles exceeding speed limits by road type and vehicle type, both daytime and night-time, is shown in Figures 2-7.
DUAL CARRIAGEWAYSMOTORWAYS
CONVENTIONAL AND REGIONAL ROADS (100 km/h) CONVENTIONAL AND REGIONAL ROADS (90 km/h)
MOTORCYCLES LIGHT VEHICLES HEAVY VEHICLES
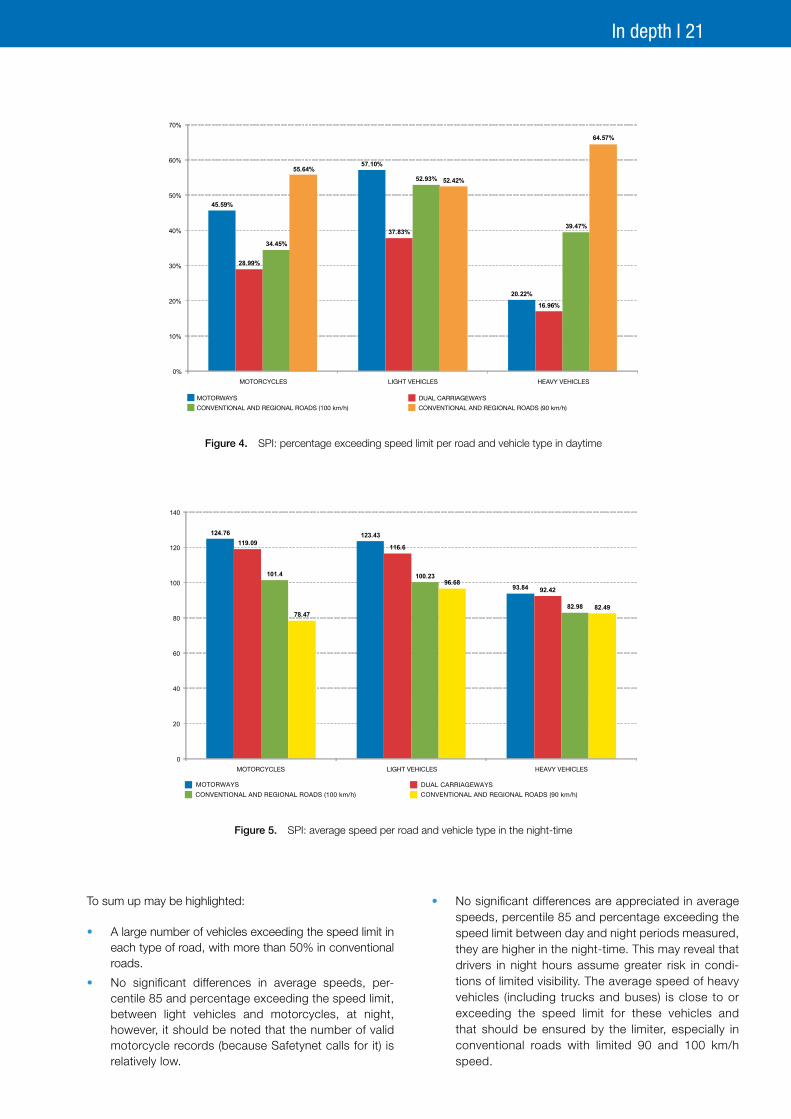
Figure 4. SPI: percentage exceeding speed limit per road and vehicle type in daytime
124.76 123.43
93.84
119.09 116.6
92.42
101.4 100.23
82.9878.47
96.68
82.49
0
20
40
60
80
100
120
140
HEAVY VEHICLESLIGHT VEHICLESMOTORCYCLES
MOTORWAYS DUAL CARRIAGEWAYS
CONVENTIONAL AND REGIONAL ROADS (100 km/h) CONVENTIONAL AND REGIONAL ROADS (90 km/h)
Figure 5. SPI: average speed per road and vehicle type in the night-time
The software written in MATLAB language is self-contained for the whole process: selection of the sample, analysis of the data, selection of relevant data and analysis of the results of the 8 regions, combination of categories: days of the week, 3 time slots (2 for daytime and 1 for night-time), 3 vehicle types (mo-torcycles, light vehicles and heavy vehicles) and distance of at least 5 seconds between vehicles. The procedure of verification and selection of valid data has been very strict. In addition to the predefined criteria, meteorological data have been considered to delete periods and time slots with adverse weather conditions from the database.
2.2 Fieldworks. Verification of the conditions of equipment installation
On the selected road sections the SafetyNet criteria have been verified by means of an implementing protocol (check list) during the installation of the measuring equipment and in some cases visual inspection has been carried out by the in-vestigating team. The equipment consists of direction sensing radars that capture the data with high-frequency radio signal, whose precision reaches 3% in the speed measurement. In the course of the works a small number of incidents relating to the pre-selected locations have arisen, such as: road works, speed limits, slopes, gradient changes, proximity to industrial estates, etc., leading to make some adjustments at the instal-lation location.
3. Obtaining indicators of safety performance indicators (SPI)
3.1 Statistical methodology of the estimate process
An estimate of the speed distribution involves:
1) The estimate of measures of centre, typically the average, which is used in this study as a value around which range data, and estimate of uncertainty or variability of data, in this study is measured through:
The variance or its square root, standard deviation.•
The percentiles of the distribution: 2.5%, 85% and •97.5%, the interval between the percentiles 2.5 and 97.5 include 95% of the central data.
2) The confidence intervals for a mean, variance and even for the estimated percentiles
The wider the intervals, the greater the uncertainty of the esti-mate, which is a reflection (also influences the sample size in the amplitude of intervals) of the variability of the data.
3) In addition, it has been estimated, in a general way the percentages of vehicles exceeding the speed limit and speed limit + 10 km/h.
Although the distribution of the speeds usually comes close to normal, for this analysis has been used the nonparametric technique (i.e., not dependent on hypothesis about the type of distribution) or bootstrap re-sampling.
3.2 Methodology of the aggregation process
Different indicators have been obtained as follows:
Point estimate of the mean
The expression of the estimator is:
iii
xwxwxwxwxw ∑=
=++++=8
1
88332211 ..µ
Where W1, W2… and W8 are the relative weights of the strata and x
_1, x_
2, …, x_
8 are the means in each stratum. The relative weights are proportional to the populations of the strata.
Confidence interval for the average
The confidence interval is obtained from bootstrap or re-sam-pling method. In stratified sampling each stratum is re-sampled and the replicated mean is obtained with the same weighting as in the point estimate.
Point estimate of variance
For this study it has been adopted the following point estimator:
∑ ∑∑= <
−+=2
1
222 )(h gh
ghghhhst www µµσσ
Where σ2i
and μi are the variances and means, respectively,
of the strata and wi are the relative weights as defined above.
DUAL CARRIAGEWAYSMOTORWAYS
CONVENTIONAL AND REGIONAL ROADS (100 km/h) CONVENTIONAL AND REGIONAL ROADS (90 km/h)
MOTORCYCLES LIGHT VEHICLES HEAVY VEHICLES
Figure 2. SPI: average speed per road and vehicle type in daytime
DUAL CARRIAGEWAYSMOTORWAYS
CONVENTIONAL AND REGIONAL ROADS (100 km/h) CONVENTIONAL AND REGIONAL ROADS (90 km/h)
MOTORCYCLES LIGHT VEHICLES HEAVY VEHICLES
Figure 3. SPI: percentile 85 per road and vehicle type in the night-time
To sum up may be highlighted:
A large number of vehicles exceeding the speed limit in •each type of road, with more than 50% in conventional roads.
No significant differences in average speeds, per-•centile 85 and percentage exceeding the speed limit, between light vehicles and motorcycles, at night, however, it should be noted that the number of valid motorcycle records (because Safetynet calls for it) is relatively low.
No significant differences are appreciated in average •speeds, percentile 85 and percentage exceeding the speed limit between day and night periods measured, they are higher in the night-time. This may reveal that drivers in night hours assume greater risk in condi-tions of limited visibility. The average speed of heavy vehicles (including trucks and buses) is close to or exceeding the speed limit for these vehicles and that should be ensured by the limiter, especially in conventional roads with limited 90 and 100 km/h speed.
In depth l 21 In depth l 21
Sample by road types
54%
17%
17%
12%
MOTORWAYSDUAL CARRIAGEWAYSCONVENTIONAL AND REGIONAL ROADS (90 km/h) CONVENTIONAL AND REGIONAL ROADS (100 km/h)
Figure 1. Final distribution of the measurements by road types
Confidence interval of variance
As in the case of the mean, replicated variances are obtained applying the point estimator to the replicas of the samples of the strata.
Point estimate of percentiles
This procedure applies to the estimated percentiles of 2.5%, 97.5% and 85%. The first two define the central 95% of the population and the last percentile is part of the requirements of SafetyNet. To that end, samples of strata are sorted, and then each element of the sample is given a relative weight propor-tional to the weight of the stratum in the population. Then, the point estimator of the percentile is obtained as corresponding percentile of the weighted sample, from the set of measures realized.
Confidence intervals of percentiles
As in the case of the mean and variance, we obtain the repli-cas of the variances applying the point estimate to the replicas of the samples of the strata.
Estimator of the distribution function
The application of this parameter is the proportion of vehicles exceeding the speed limit or this speed + 10 km/h.
The point estimator is obtained from the ordered and weight-ed sample, as discussed above, as the accumulated weight corresponding to the value for which is wanted to calculate the distribution function (speed limit or speed limit + 10 km/h).
4. Results
To obtain SPI, it has been 83,550 the total number of meas-urements considered (because of the SafetyNet filtering crite-ria applied: date, time, weather conditions, 5-second interval), representing 1.02% of total number of collected data.
A summary of the indicators of average speed, percentile 85 and percentage of vehicles exceeding speed limits by road type and vehicle type, both daytime and night-time, is shown in Figures 2-7.
DUAL CARRIAGEWAYSMOTORWAYS
CONVENTIONAL AND REGIONAL ROADS (100 km/h) CONVENTIONAL AND REGIONAL ROADS (90 km/h)
MOTORCYCLES LIGHT VEHICLES HEAVY VEHICLES
Figure 4. SPI: percentage exceeding speed limit per road and vehicle type in daytime
124.76 123.43
93.84
119.09 116.6
92.42
101.4 100.23
82.9878.47
96.68
82.49
0
20
40
60
80
100
120
140
HEAVY VEHICLESLIGHT VEHICLESMOTORCYCLES
MOTORWAYS DUAL CARRIAGEWAYS
CONVENTIONAL AND REGIONAL ROADS (100 km/h) CONVENTIONAL AND REGIONAL ROADS (90 km/h)
Figure 5. SPI: average speed per road and vehicle type in the night-time
The software written in MATLAB language is self-contained for the whole process: selection of the sample, analysis of the data, selection of relevant data and analysis of the results of the 8 regions, combination of categories: days of the week, 3 time slots (2 for daytime and 1 for night-time), 3 vehicle types (mo-torcycles, light vehicles and heavy vehicles) and distance of at least 5 seconds between vehicles. The procedure of verification and selection of valid data has been very strict. In addition to the predefined criteria, meteorological data have been considered to delete periods and time slots with adverse weather conditions from the database.
2.2 Fieldworks. Verification of the conditions of equipment installation
On the selected road sections the SafetyNet criteria have been verified by means of an implementing protocol (check list) during the installation of the measuring equipment and in some cases visual inspection has been carried out by the in-vestigating team. The equipment consists of direction sensing radars that capture the data with high-frequency radio signal, whose precision reaches 3% in the speed measurement. In the course of the works a small number of incidents relating to the pre-selected locations have arisen, such as: road works, speed limits, slopes, gradient changes, proximity to industrial estates, etc., leading to make some adjustments at the instal-lation location.
3. Obtaining indicators of safety performance indicators (SPI)
3.1 Statistical methodology of the estimate process
An estimate of the speed distribution involves:
1) The estimate of measures of centre, typically the average, which is used in this study as a value around which range data, and estimate of uncertainty or variability of data, in this study is measured through:
The variance or its square root, standard deviation.•
The percentiles of the distribution: 2.5%, 85% and •97.5%, the interval between the percentiles 2.5 and 97.5 include 95% of the central data.
2) The confidence intervals for a mean, variance and even for the estimated percentiles
The wider the intervals, the greater the uncertainty of the esti-mate, which is a reflection (also influences the sample size in the amplitude of intervals) of the variability of the data.
3) In addition, it has been estimated, in a general way the percentages of vehicles exceeding the speed limit and speed limit + 10 km/h.
Although the distribution of the speeds usually comes close to normal, for this analysis has been used the nonparametric technique (i.e., not dependent on hypothesis about the type of distribution) or bootstrap re-sampling.
3.2 Methodology of the aggregation process
Different indicators have been obtained as follows:
Point estimate of the mean
The expression of the estimator is:
iii
xwxwxwxwxw ∑=
=++++=8
1
88332211 ..µ
Where W1, W2… and W8 are the relative weights of the strata and x
_1, x_
2, …, x_
8 are the means in each stratum. The relative weights are proportional to the populations of the strata.
Confidence interval for the average
The confidence interval is obtained from bootstrap or re-sam-pling method. In stratified sampling each stratum is re-sampled and the replicated mean is obtained with the same weighting as in the point estimate.
Point estimate of variance
For this study it has been adopted the following point estimator:
∑ ∑∑= <
−+=2
1
222 )(h gh
ghghhhst www µµσσ
Where σ2i
and μi are the variances and means, respectively,
of the strata and wi are the relative weights as defined above.
DUAL CARRIAGEWAYSMOTORWAYS
CONVENTIONAL AND REGIONAL ROADS (100 km/h) CONVENTIONAL AND REGIONAL ROADS (90 km/h)
MOTORCYCLES LIGHT VEHICLES HEAVY VEHICLES
Figure 2. SPI: average speed per road and vehicle type in daytime
DUAL CARRIAGEWAYSMOTORWAYS
CONVENTIONAL AND REGIONAL ROADS (100 km/h) CONVENTIONAL AND REGIONAL ROADS (90 km/h)
MOTORCYCLES LIGHT VEHICLES HEAVY VEHICLES
Figure 3. SPI: percentile 85 per road and vehicle type in the night-time
To sum up may be highlighted:
A large number of vehicles exceeding the speed limit in •each type of road, with more than 50% in conventional roads.
No significant differences in average speeds, per-•centile 85 and percentage exceeding the speed limit, between light vehicles and motorcycles, at night, however, it should be noted that the number of valid motorcycle records (because Safetynet calls for it) is relatively low.
No significant differences are appreciated in average •speeds, percentile 85 and percentage exceeding the speed limit between day and night periods measured, they are higher in the night-time. This may reveal that drivers in night hours assume greater risk in condi-tions of limited visibility. The average speed of heavy vehicles (including trucks and buses) is close to or exceeding the speed limit for these vehicles and that should be ensured by the limiter, especially in conventional roads with limited 90 and 100 km/h speed.
21
In depth First Quarter 2010
from the Observatory
MINISTERIODEL INTERIOR
Observatorio Nacional de Seguridad Vial
www.dgt.es
Measurement of free-flow speed on the spanish road network.
131
140
102
141
131
97
113
125
99
125
112
89
0
20
40
60
80
100
120
140
160
HEAVY VEHICLESLIGHT VEHICLESMOTORCYCLES
MOTORWAYS DUAL CARRIAGEWAYS
CONVENTIONAL AND REGIONAL ROADS (100 km/h) CONVENTIONAL AND REGIONAL ROADS (90 km/h)
Figure 6. SPI: percentile 85 per road and vehicle type in the night-time
66.67%
58.67%
19.16%
51.21%
34.96%
12.80%
49.04%
56.28%
52.36%
67.80%
58.04%
63.39%
0%
10%
20%
30%
40%
50%
60%
70%
80%
HEAVY VEHICLESLIGHT VEHICLESMOTORCYCLES
MOTORWAYS DUAL CARRIAGEWAYS
CONVENTIONAL AND REGIONAL ROADS (100 km/h) CONVENTIONAL AND REGIONAL ROADS (90 km/h)
Figure 7. SPI: percentage exceeding speed limit per road and vehicle type in the night-time
AVERAGE SPEED LIGHT VEHICLES (except Czech Republic and Switzerland that include all vehicles).MOTORWAYS 2002-2007. Spain 2009 (free-flow condi�ons)
Average speed 2002 (km/h) 5.0215.5210219.4118.4114116017.2111.9111.201
Average speed 2007 (km/h) 103.1 117.7 112.7 110 107 115.1 114.3 122.51 105 122.2 119.4 119.9
0
20
40
60
80
100
120
140
Finland 100
km/h(winter)
Denmark(100
km/h)
UnitedKingdom Ireland
Finland(summer) Holland
CzechRepublic
Denmark(130 km/h)
FranceSwitzerland SPAIN Austria
Figure 8. Comparative of average speed in other European countries
60
0
24
3836.6
0
47
27.9
67.8
51
20 21
39.9
57.44
31
23
0
10
20
30
40
50
60
70
80
% LIGHT VEHICLES EXCEEDING SPEED LIMIT (except Czech Republic and Switzerland that includeall vehicles). MOTORWAYS. 2002-2007. SPAIN 2009 (free-flow conditions)
Finland (100 km/hin winter)
Percentage of offenders (%) 2002 Percentage of offenders (%) 2007
IrelandUnited Kingdom Switzerland Finland (summer) SPAIN France Austria
Figure 9. Comparative of percentage of offenders in other European countries
MINISTERIODEL INTERIOR
Observatorio Nacional de Seguridad VialJosefa Valcárcel, 4428071 Madridwww.dgt.es D.L.: M-25617-2010 Nipo: 128-10-015-6
Observatorio Nacional de Seguridad Vial
Introduction
This study was conducted by the University Institute of Au-tomobile Research, part of the Higher School of Industrial En-gineering. Technical University of Madrid. (UPM- INSIA) in the framework of the research project financed by the Directorate-General for Traffic in 2009. It presents the results of applying the recommendations of the European project SafetyNet on the esti-mate of SPIs (Safety Performance Indicators) for free-flow speed (FFS), that is, travelling along sections with road surface and vis-ibility in perfect condition and moderate volume of traffic, so that the only restriction that the driver has is the speed limit laid down by law in force, with a view to have a common framework for indicators (in this case, for FFS) in the European countries.
To this end, in Spain a stratified sampling has been designed by regions and road types (motorways, dual carriageways, state-owned conventional roads and regional roads —owned by the Autonomous regions— with two types of speed limit: 90 and 100 km/h.), dividing the territory into 8 regions: Andalusia (R-1); Cen-tral Plain excluding Madrid, that is, both Castillas and Extremadu-ra (R-2); Madrid (R-3); Valencia and Murcia (R-4); Catalonia (R-5); Galicia and Asturias (R-6); Basque Country, Navarre, Cantabria and La Rioja (R-7) and Aragón (R-8). 100 observation locations were chosen at random where very precise devices for measur-ing speed have been installed. The sections of the sample were subjected to two stages of verification of compliance with the SafetyNet recommendations for producing FFS indicators: a first desktop stage using IT tools and a second in situ stage, where minimal changes in the selection and replacement of the sections chosen in the desktop stage have been made. The integrated distribution of FFS of the 8 regions has been estimated in the four road types and three vehicle types (light vehicles, motorcycles and heavy vehicles).
1. Safetynet conditions for producing a SPI of FFS
The purpose of this Spanish pilot project is the estimate of Indicators (SPI – Safety Performance Indicators) of the distribu-tion of free-flow speed, in the framework of the SafetyNet Project recommendations. In order to assure reliability and to allow com-parison of the measures at European level, the SafetyNet manual recommends that the locations where the speed measurements are carried out are such that the vehicle speed is not altered by factors unrelated to the drivers. These locations must:
be in a straight and uniform road section•
be in a section where exceeding the speed limit is possible •
be in a section with slope under 5% in the 500 preceding •meters
be at least 500 meters away from intersections•
be at least 500 meters away from speed reduction devices•
be at least 500 meters away from road works•
be at least 500 meters away from pedestrian crossings•
be at least 1000 meters away from speed limit changing •
points or signs
be away from working or parking areas or other circum-•
stances close to the road, be in good pavement and
surface conditions
be at least 500 meters away from gradient changes•
Based on these conditions with the most restrictive assump-
tions, the code developed in MATLAB language pre-selects the
road sections among those measuring at least 5 km in length.
In every station and its observations the data quality has •
been monitored and a selection has been made by days
of the week (restricted to Tuesdays, Wednesdays and
Thursdays, that are neither a public holiday nor the day
before or after a public holiday) and by time slots (with
the aim of avoiding traffic jams and peak hours): from
10:00 to 10:59 and from 15:00 to 15:59 for daytime
From 22:00 to 22:59 for night-time•
The additional SafetyNet recommendation on separation
distance of at least 5 seconds between vehicles has also been
taken into account.
2. Desktop work and fieldwork
2.1 Desktop work. Stratified sampling. Software preparation.
Validation of the data
The sampling is stratified by regions and road types. The 8
regions defined confirm the hypothesis of an homogeneous be-
haviour in each stratum.
The final distribution by 4 road types: Motorways, Dual car-
riageways, Conventional and Regional roads with a speed limit
of 100 km/h, and Conventional and Regional roads with a speed
limit of 90 km/h, is shown in Figure 1.
5. Conclusions
Confidence intervals of all SPI selected have been obtained by implementing an advanced methodology (bootstrap or re-sampling). Having obtained fairly narrow confidence intervals, the maximum amplitude corresponds to the average speeds of motorcycles; even so they are relatively small, which confirms the reliability of the estimates.
Many parameters have been estimated from the point of view of safety. Percentiles 85% and 97.5% are very interest-ing, since the behaviour of drivers whose speeds are further away from the mean value is relevant to safety. These param-eters are closely related to the percentage of vehicles exceed-ing 10 km/h or more the speed limit which has been deter-mined 20.26% of free flow conditions, weighting all roads as a whole.
Daytime indicators for motorcycles show a more mod-erate behaviour than that of light vehicles, but these data should be viewed cautiously because the sample sizes of motorcycles are relatively low, even more in the case of the night.
There is little difference between day and night, but night values are generally slightly higher. This piece of information is relevant, from the point of view of road safety, for the risk of low visibility and higher risk of accident.
6. Annexe 1: Comparative with other countries in europe
Coinciding with the end of this work, it has been published an updated report on average speed and percentage ex-ceeding the speed limit (SPI for two years, 2002 and 2007, except the Czech Republic only 2007) on motorways of 9 Euro-pean countries and of light vehicles except the Czech Republic and Switzerland, including all types of vehicles. Published data have been compared with those of Spain in the year 2009 ob-tained in this project.
In this report it should be noted that Finland has motorways with different limits, 100 in winter and 120 in summer, as in Den-mark, where it is noticed that until 2002 speed limit in all motor-ways was 110 and that +50% of them have 130 limit since 2004.
However, the data provided in this report should be considered unofficial indicators obtained as mean monthly, as in Holland.
In the published data there are three groups of motor-ways, 1G: different limits (Finland, Denmark and United King-dom), 2G: limit 120 [Switzerland, Finland, Netherlands, Spain (** 2009)], 3G: limit 130 (Czech Republic, Denmark, France and Austria).
In 2007 all countries of the 3rd group have average speed, about 10 km/h below the limit (130), as Ireland, which belongs to group 2. Czech Republic (3G) has a very low average speed because includes all vehicles, not only light vehicles, like Swit-zerland, in group 2. By contrast, the average speed of Finland M-100 (1G) is over the limit, whereas UK remained on the limit values. Motorways in Denmark DK-100 exceed by 7-9 km/h limit 100.
Comparing 2002 with 2007 measurements, there has been a significant reduction in average speed in France, Switzerland (light + heavy) where significant measures to control speed have been undertaken, whereas in Austria there was low de-creasing. Ireland is the only country with increasing average
speed (but there have been changes in speed limits in January 2005 and new motorways). It is remarkable the stability of the average value in Denmark despite the increased limit from 110 to 130.
Among all the countries in group 2 (120), the average in Spain is very close to the limit 120 (122.51 average speed weighted light vehicles in day-night), but it is higher than the average in most countries of 3G (130).
As for the percentage of vehicles exceeding the limits: the lowest are in Ireland and Switzerland (G2: 120), the highest in Finland and the United Kingdom in 2007, besides it has also increased the percentage of traffic offenders in Finland espe-cially in the M-100 in winter. It has fallen sharply in France and Switzerland (average speed too), followed by Ireland (effect of increasing the speed limit from January 2005) and Austria. In Spain, the percentage of traffic offender drivers reaches 57.4% in 2009.