Embed Size (px)
Citation preview
RSC Advances
PAPER
Ope
n A
cces
s A
rtic
le. P
ublis
hed
on 1
0 M
ay 2
017.
Dow
nloa
ded
on 2
/19/
2022
7:5
1:27
AM
. T
his
artic
le is
lice
nsed
und
er a
Cre
ativ
e C
omm
ons
Attr
ibut
ion
3.0
Unp
orte
d L
icen
ce.
View Article OnlineView Journal | View Issue
Observing differe
aInstitute of Energy and Climate Research (
Julich, Germany. E-mail: j.granwehr@fz-juebLehrstuhl fur Theoretische Chemie, Tech
GermanycRWTH Aachen University, Institute of PhysidJulich Aachen Research Alliance (JARA), SeceRWTH Aachen University, Institute of Te
Aachen, Germany
Cite this: RSC Adv., 2017, 7, 25276
Received 8th February 2017Accepted 30th April 2017
DOI: 10.1039/c7ra01622k
rsc.li/rsc-advances
25276 | RSC Adv., 2017, 7, 25276–2528
nt modes of mobility in lithiumtitanate spinel by nuclear magnetic resonance
Magnus F. Graf, *a Hermann Tempel, a Simone S. Kocher, ab
Roland Schierholz, a Christoph Scheurer,b Hans Kungl,a Rudiger-A. Eichel acd
and Josef Granwehr ae
Lithium titanate (LTO) is a spinel material that is able to reversibly intercalate Li ions with minimal changes of
the unit cell dimensions (“zero-strain”), making it an attractive choice as anode material for Li ion batteries.
However, the nature of the Li transport in this material is still not fully understood. Here, the Li mobility in
Li4+xTi5O12 with x ¼ 0 and x z 1.6 is investigated. By regularized inversion of nuclear magnetic resonance
(NMR) relaxation and spin alignment echo (SAE) data and supported by DFT simulations, solid-state NMR
spectra were analyzed as a function of the respective relaxation times and correlation time constants. A
clear correlation between mobility and NMR spectral features was observed, suggesting the presence of
local domains with high Li ion mobility. The long-range mobility is limited by the much slower hopping
between such domains and appears to be faster for either larger or less ordered local domains. For x z
1.6, spectral features indicate the formation of separate stoichiometric and overlithiated phases rather than
a solid solution, yet no segregation into a fast and a slow component was observed in the relaxation and in
the SAE dimension, which points towards an entangling of the two phases on a microscopic scale.
1 Introduction
Major challenges for future battery generations are theimprovement of cycle life and the reduction of the total cost ofownership. Many promising materials with potential use asanodes or solid electrolytes belong to the spinel family(AB2O4).1–5 One of them is lithium titanate (LTO, Li4Ti5O12),6
a “zero-strain” Li host with a at and relatively high potential of�1.55 V vs. Li/Li+ for reversible Li intercalation and a bettercyclability than graphite.7,8 The stoichiometric compound hasthe chemical formula (Li3)
8a(LiTi5)16d(O12)
32e with the 16d sitesrandomly occupied by Ti (5/6th) and Li (1/6th).9 Altering thestructure, e.g. by changing the defect chemistry, by raising thetemperature, or by overlithiation to form Li4+xTi5O12 (x # 3)signicantly inuences the ionic and electronic conduc-tivity.10–13 Upon electrochemical overlithiation, Li is insertedinto 16c positions with additional Li in equivalent numbermoving into 16c from 8a to form a rocksalt structure.9 Duringthis process, two-phase separation is observed,14,15 with onlya small fraction of solid solution forming.16 On the other hand,
IEK-9), Forschungszentrum Julich, 52425
lich.de
nische Universitat Munchen, Garching,
cal Chemistry, Aachen, Germany
tion JARA-Energy, Aachen, Germany
chnical and Macromolecular Chemistry,
4
chemical overlithiation was reported to form an inserted spinelstructure,17,18 with chemically inserted Li ions found to betrapped in 48f sites. Furthermore, different site occupationratios for Li have been reported for different synthesis routes ofLTO and overlithiated LTO (e.g. ref. 19–22).
For rational materials design the understanding of dynam-ical and electrochemical processes taking place in LTO is ofutmost importance to establish structure–property relation-ships by complementing the static structural picture withdynamic information. Initial models of dynamic processes weremade based on structural changes.9 Li diffusion in LTOdepends on the size of LTO particles, with evidence for kinetic23
as well as surface equilibrium causes.24 Li diffusion has beenstudied by neutron diffraction,23,25 impedance spectroscopy18
and chronoamperometry.26 The “ultra slow” regime wasanalyzed via spin alignment echo (SAE) nuclear magneticresonance (NMR), where changes of the electric eld gradient(EFG) seen by a nucleus via its quadrupolar coupling constantCQ are probed.27 The echo decay is characterized by a correlationtime constant sC that may be identied as a hopping timebetween sites, provided that the origin and the destination ofa jump are not electrically equivalent. In LTO all jumps occurbetween inequivalent sites with different EFGs and are there-fore contributing to the SAE decay.12 Furthermore, due to therandom occupancy of 16d sites by Ti and Li ions (Fig. 1), evennominally identical sites show a distribution of EFG values. Thecomplete intensity decay curve as a function of mixing time tmin an SAE experiment is usually described by one or the sum of
This journal is © The Royal Society of Chemistry 2017
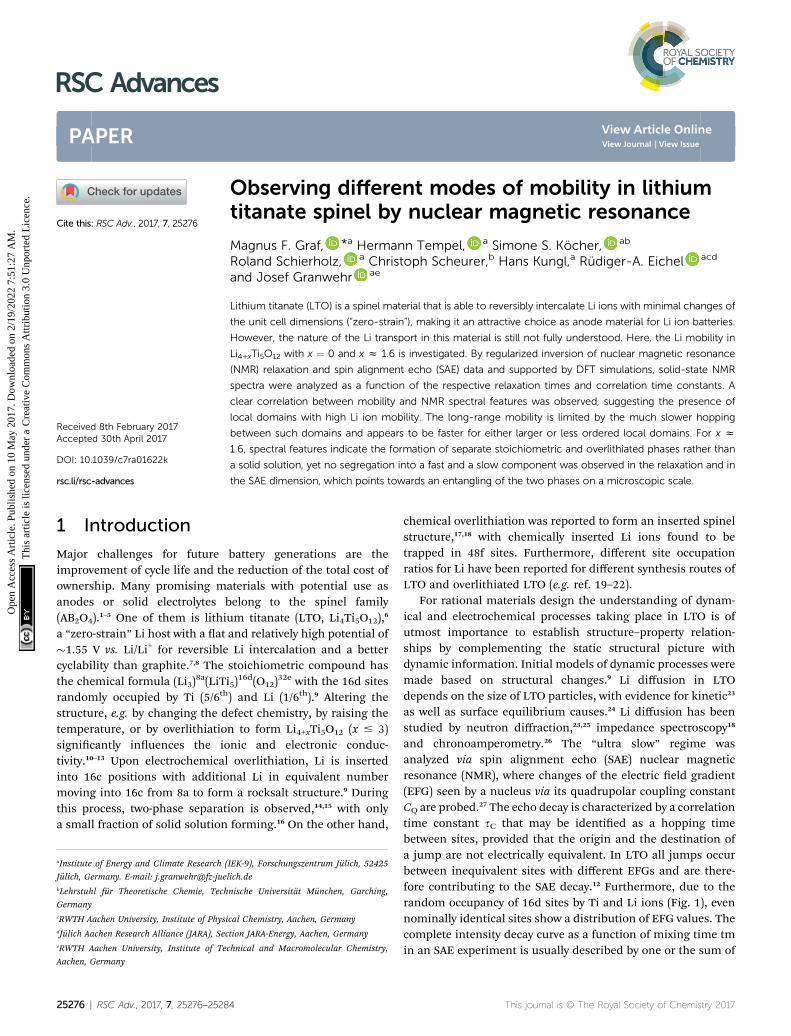
Fig. 1 Six symmetry-inequivalent stoichiometric Li8Ti10O24 unit cells (idealized space group R3�m) used for ab initio calculation of quadrupolarcoupling constants. The oxygen (O2�) lattice is shown in red, blue octahedrons denote titanium (Ti4+) in 16d sites, brown octahedrons and greentetrahedrons represent lithium (Li+) in 16d and 8a sites, respectively.
Paper RSC Advances
Ope
n A
cces
s A
rtic
le. P
ublis
hed
on 1
0 M
ay 2
017.
Dow
nloa
ded
on 2
/19/
2022
7:5
1:27
AM
. T
his
artic
le is
lice
nsed
und
er a
Cre
ativ
e C
omm
ons
Attr
ibut
ion
3.0
Unp
orte
d L
icen
ce.
View Article Online
several stretched exponential functions. The stretched nature ofthese functions is generally believed to result from a distribu-tion of time constants with an underlying exponential kernel.28
Temperature dependent measurements of conductivity29 orNMR relaxation times12 were used to obtain activation energiesEa for jumps of Li ions. So far the mechanism of Li conductivitycould not be fully resolved.30,31 One reason was provided bya recent theoretical study where it was concluded that jumprates are not primarily limited by activation energies, buta combination of Ea and the availability of jump targets.32 Thus,Ea derived in temperature dependent experiments are merelyeffective parameters and cannot generally be interpreted asactual physical barriers of ion motion.
Inverting relaxation and diffusion data using an exponentialkernel instead of tting it with a particular model has becomea routine tool in NMR.33–35 However, the common regularizationwith a non-negativity constraint is not physically justied onceexchange processes become relevant for the dynamics of a spinsystem.36–40 Amorphous and multisite crystalline solid-statesystems are affected in particular due to their highly branchedinteraction network,28 which requires a different approach fordata inversion. One suggestion was to analyze the data in thetime domain, without actually inverting it.40 Here, the applica-bility of uniform penalty (UP) regularization in combinationwith a penalty to prevent unnecessary oscillations41 is demon-strated for the inversion of solid-state NMR data. The suitabilityof the algorithm for averaging in a non-inverted dimension isshown, facilitating spectral separation of the static NMR spec-trum with respect to the SAE time constant. Using this tech-nique and supported by ab initio density functional theory (DFT)calculations, the dynamics of stoichiometric and chemicallyoverlithiated LTO is investigated.
2 Methods2.1 Sample preparation and characterization
Stoichiometric Li4Ti5O12 was purchased from Sigma-Aldrich(>99%). Li4+xTi5O12 with x z 1.6 was prepared by dispersing10 mmol of the commercial Li4Ti5O12 in 30 ml hexane withsubsequent slow addition of 2 ml of 11 M butyllithium (3mmol). The color of the dispersion changed immediately fromwhite to dark blue when adding the butyllithium. The disper-sion was stirred for at least 24 hours, dried under vacuum,
This journal is © The Royal Society of Chemistry 2017
washed three times with fresh hexane and then dried again.Complete transition of the Li from the butyllithium to thelithium titanate results in formation of Li4+xTi5O12 with xz 1.6.All sample preparation steps were done in a glove box underargon. A sample with a lower degree of lithiation (x z 0.2) wasprepared in the same way, using 0.4 mmol butyllithium.
X-ray diffraction was measured in transmission mode withCu K-alpha radiation (40 kV, 40 mA) with an Empyreandiffractometer (Panalytical, Netherlands) with the powderplaced between two mylar foils. Microscopy was performed witha CM 20 transmission electron microscope (Philips, Nether-lands) operated at 200 kV. In the glovebox the powder wasplaced on lacey carbon grids which were sealed in aluminiumfoil for transport. The bags were opened, the grids were placedin the holder and the holder was inserted into the TEM tominimize the exposure of the samples to air (max. 1 minute).PowderCell (Bundesanstalt fur Materialforschung undprufung)42 was used to simulate diffraction patterns for stoi-chiometric LTO (ICSD 160655) and fully overlithiated LTO (x ¼3, ICSD 160655 but Li on 16c).
2.2 NMR spectroscopy
All NMR measurements were recorded on a Bruker AVANCE IIIHD 400 spectrometer at a 7Li frequency of u0/2p ¼ 155.5 MHz.
SAE NMR employs the Jeener–Broekaert pulse sequence b1 �tp � b2 � tm � b3 � td, where b represents radio frequencypulses, tp is the evolution time, tm the mixing time and td thedetection transient.43 It results in an echo with an intensityrelative to the correlation between the quadrupolar precessionfrequency uQ during the evolution time and during the detec-tion transient at time tm later. A correlation function can bemapped directly by repeating this sequence with variable tm ifthe correlation time constant, sC, is shorter than the spin–latticerelaxation with time constant T1, the decay of quadrupolar orderwith time constant T1Q, and temperature-independent spindiffusion processes.27 SAE NMR measurements of stoichio-metric and overlithiated LTO were recorded at differenttemperatures between 10 �C and 45 �C using a 32 step phasecycle44 and a xed evolution time tp of 10 ms. A saturation pulsetrain and a suitable delay time were used between measure-ments to ensure consistent initial conditions. In all the exper-iments with a static sample, 90�-pulse lengths were around 6.5ms. The sample temperature was controlled by a Bruker BCU-20
RSC Adv., 2017, 7, 25276–25284 | 25277
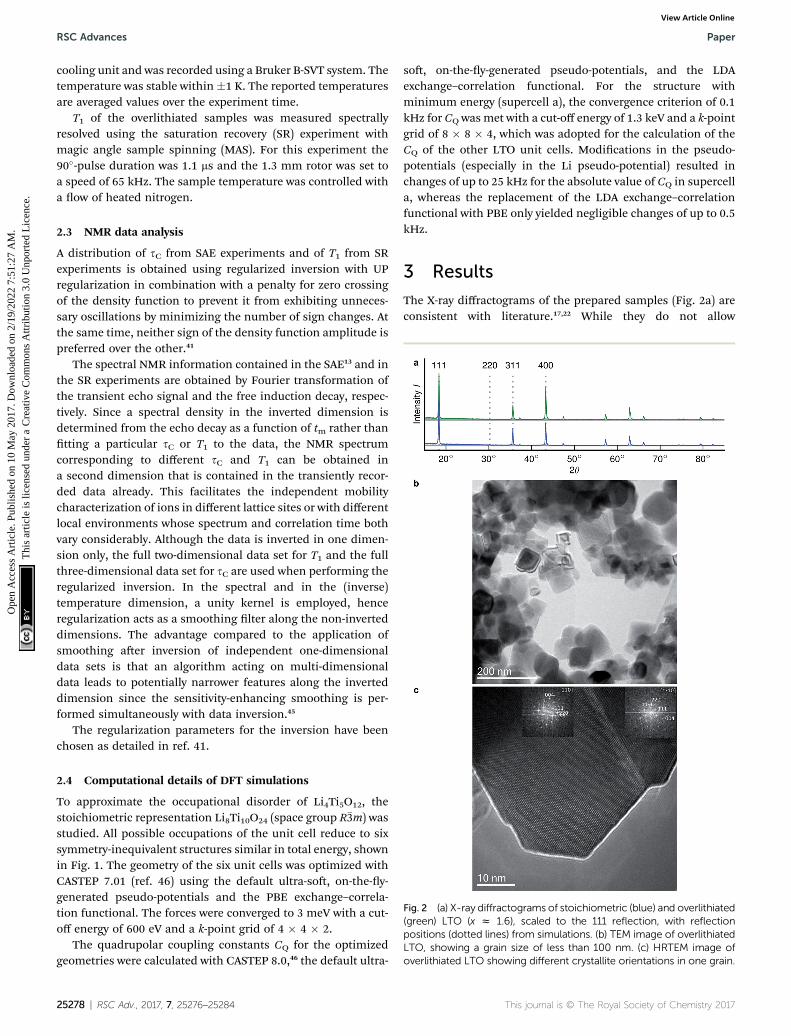
Fig. 2 (a) X-ray diffractograms of stoichiometric (blue) and overlithiated(green) LTO (x z 1.6), scaled to the 111 reflection, with reflectionpositions (dotted lines) from simulations. (b) TEM image of overlithiatedLTO, showing a grain size of less than 100 nm. (c) HRTEM image ofoverlithiated LTO showing different crystallite orientations in one grain.
RSC Advances Paper
Ope
n A
cces
s A
rtic
le. P
ublis
hed
on 1
0 M
ay 2
017.
Dow
nloa
ded
on 2
/19/
2022
7:5
1:27
AM
. T
his
artic
le is
lice
nsed
und
er a
Cre
ativ
e C
omm
ons
Attr
ibut
ion
3.0
Unp
orte
d L
icen
ce.
View Article Online
cooling unit and was recorded using a Bruker B-SVT system. Thetemperature was stable within�1 K. The reported temperaturesare averaged values over the experiment time.
T1 of the overlithiated samples was measured spectrallyresolved using the saturation recovery (SR) experiment withmagic angle sample spinning (MAS). For this experiment the90�-pulse duration was 1.1 ms and the 1.3 mm rotor was set toa speed of 65 kHz. The sample temperature was controlled witha ow of heated nitrogen.
2.3 NMR data analysis
A distribution of sC from SAE experiments and of T1 from SRexperiments is obtained using regularized inversion with UPregularization in combination with a penalty for zero crossingof the density function to prevent it from exhibiting unneces-sary oscillations by minimizing the number of sign changes. Atthe same time, neither sign of the density function amplitude ispreferred over the other.41
The spectral NMR information contained in the SAE13 and inthe SR experiments are obtained by Fourier transformation ofthe transient echo signal and the free induction decay, respec-tively. Since a spectral density in the inverted dimension isdetermined from the echo decay as a function of tm rather thantting a particular sC or T1 to the data, the NMR spectrumcorresponding to different sC and T1 can be obtained ina second dimension that is contained in the transiently recor-ded data already. This facilitates the independent mobilitycharacterization of ions in different lattice sites or with differentlocal environments whose spectrum and correlation time bothvary considerably. Although the data is inverted in one dimen-sion only, the full two-dimensional data set for T1 and the fullthree-dimensional data set for sC are used when performing theregularized inversion. In the spectral and in the (inverse)temperature dimension, a unity kernel is employed, henceregularization acts as a smoothing lter along the non-inverteddimensions. The advantage compared to the application ofsmoothing aer inversion of independent one-dimensionaldata sets is that an algorithm acting on multi-dimensionaldata leads to potentially narrower features along the inverteddimension since the sensitivity-enhancing smoothing is per-formed simultaneously with data inversion.45
The regularization parameters for the inversion have beenchosen as detailed in ref. 41.
2.4 Computational details of DFT simulations
To approximate the occupational disorder of Li4Ti5O12, thestoichiometric representation Li8Ti10O24 (space group R�3m) wasstudied. All possible occupations of the unit cell reduce to sixsymmetry-inequivalent structures similar in total energy, shownin Fig. 1. The geometry of the six unit cells was optimized withCASTEP 7.01 (ref. 46) using the default ultra-so, on-the-y-generated pseudo-potentials and the PBE exchange–correla-tion functional. The forces were converged to 3 meV with a cut-off energy of 600 eV and a k-point grid of 4 � 4 � 2.
The quadrupolar coupling constants CQ for the optimizedgeometries were calculated with CASTEP 8.0,46 the default ultra-
25278 | RSC Adv., 2017, 7, 25276–25284
so, on-the-y-generated pseudo-potentials, and the LDAexchange–correlation functional. For the structure withminimum energy (supercell a), the convergence criterion of 0.1kHz for CQ was met with a cut-off energy of 1.3 keV and a k-pointgrid of 8 � 8 � 4, which was adopted for the calculation of theCQ of the other LTO unit cells. Modications in the pseudo-potentials (especially in the Li pseudo-potential) resulted inchanges of up to 25 kHz for the absolute value of CQ in supercella, whereas the replacement of the LDA exchange–correlationfunctional with PBE only yielded negligible changes of up to 0.5kHz.
3 Results
The X-ray diffractograms of the prepared samples (Fig. 2a) areconsistent with literature.17,22 While they do not allow
This journal is © The Royal Society of Chemistry 2017
Paper RSC Advances
Ope
n A
cces
s A
rtic
le. P
ublis
hed
on 1
0 M
ay 2
017.
Dow
nloa
ded
on 2
/19/
2022
7:5
1:27
AM
. T
his
artic
le is
lice
nsed
und
er a
Cre
ativ
e C
omm
ons
Attr
ibut
ion
3.0
Unp
orte
d L
icen
ce.
View Article Online
a quantication of Li content, they are qualitatively in agree-ment with simulations as I311/I111 increases, I400/I111 decreasesand I220 almost disappears with overlithiation. The averagegrain sizes of the product as well as the educt are below 100 nm(Fig. 2b) with different crystallite orientations per grain (Fig. 2c).
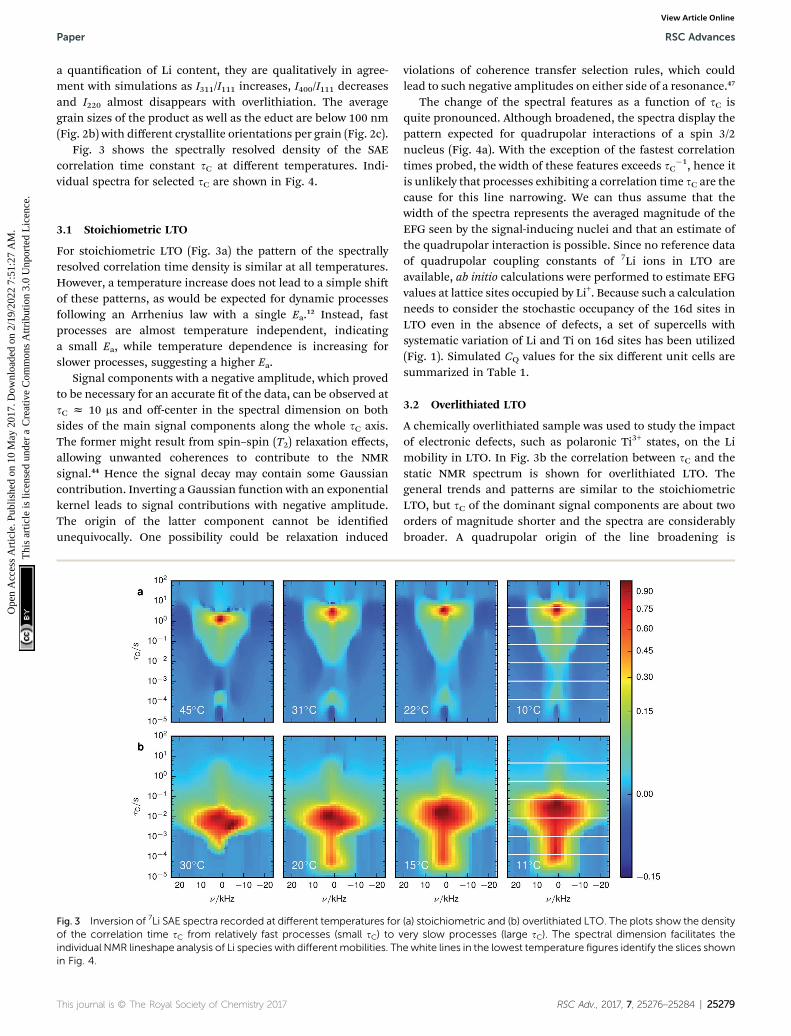
Fig. 3 shows the spectrally resolved density of the SAEcorrelation time constant sC at different temperatures. Indi-vidual spectra for selected sC are shown in Fig. 4.
3.1 Stoichiometric LTO
For stoichiometric LTO (Fig. 3a) the pattern of the spectrallyresolved correlation time density is similar at all temperatures.However, a temperature increase does not lead to a simple shiof these patterns, as would be expected for dynamic processesfollowing an Arrhenius law with a single Ea.12 Instead, fastprocesses are almost temperature independent, indicatinga small Ea, while temperature dependence is increasing forslower processes, suggesting a higher Ea.
Signal components with a negative amplitude, which provedto be necessary for an accurate t of the data, can be observed atsC z 10 ms and off-center in the spectral dimension on bothsides of the main signal components along the whole sC axis.The former might result from spin–spin (T2) relaxation effects,allowing unwanted coherences to contribute to the NMRsignal.44 Hence the signal decay may contain some Gaussiancontribution. Inverting a Gaussian function with an exponentialkernel leads to signal contributions with negative amplitude.The origin of the latter component cannot be identiedunequivocally. One possibility could be relaxation induced
Fig. 3 Inversion of 7Li SAE spectra recorded at different temperatures forof the correlation time sC from relatively fast processes (small sC) to vindividual NMR lineshape analysis of Li species with differentmobilities. Thin Fig. 4.
This journal is © The Royal Society of Chemistry 2017
violations of coherence transfer selection rules, which couldlead to such negative amplitudes on either side of a resonance.47
The change of the spectral features as a function of sC isquite pronounced. Although broadened, the spectra display thepattern expected for quadrupolar interactions of a spin 3/2nucleus (Fig. 4a). With the exception of the fastest correlationtimes probed, the width of these features exceeds sC
�1, hence itis unlikely that processes exhibiting a correlation time sC are thecause for this line narrowing. We can thus assume that thewidth of the spectra represents the averaged magnitude of theEFG seen by the signal-inducing nuclei and that an estimate ofthe quadrupolar interaction is possible. Since no reference dataof quadrupolar coupling constants of 7Li ions in LTO areavailable, ab initio calculations were performed to estimate EFGvalues at lattice sites occupied by Li+. Because such a calculationneeds to consider the stochastic occupancy of the 16d sites inLTO even in the absence of defects, a set of supercells withsystematic variation of Li and Ti on 16d sites has been utilized(Fig. 1). Simulated CQ values for the six different unit cells aresummarized in Table 1.
3.2 Overlithiated LTO
A chemically overlithiated sample was used to study the impactof electronic defects, such as polaronic Ti3+ states, on the Limobility in LTO. In Fig. 3b the correlation between sC and thestatic NMR spectrum is shown for overlithiated LTO. Thegeneral trends and patterns are similar to the stoichiometricLTO, but sC of the dominant signal components are about twoorders of magnitude shorter and the spectra are considerablybroader. A quadrupolar origin of the line broadening is
(a) stoichiometric and (b) overlithiated LTO. The plots show the densityery slow processes (large sC). The spectral dimension facilitates theewhite lines in the lowest temperature figures identify the slices shown
RSC Adv., 2017, 7, 25276–25284 | 25279
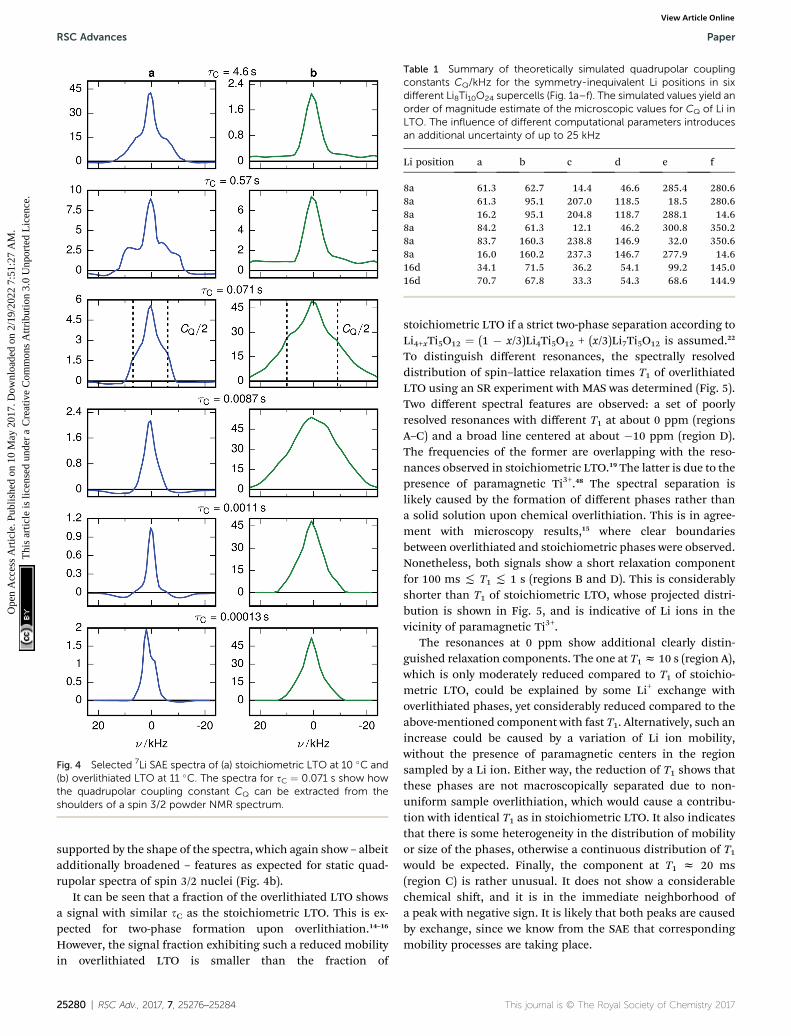
Fig. 4 Selected 7Li SAE spectra of (a) stoichiometric LTO at 10 �C and(b) overlithiated LTO at 11 �C. The spectra for sC ¼ 0.071 s show howthe quadrupolar coupling constant CQ can be extracted from theshoulders of a spin 3/2 powder NMR spectrum.
Table 1 Summary of theoretically simulated quadrupolar couplingconstants CQ/kHz for the symmetry-inequivalent Li positions in sixdifferent Li8Ti10O24 supercells (Fig. 1a–f). The simulated values yield anorder of magnitude estimate of the microscopic values for CQ of Li inLTO. The influence of different computational parameters introducesan additional uncertainty of up to 25 kHz
Li position a b c d e f
8a 61.3 62.7 14.4 46.6 285.4 280.68a 61.3 95.1 207.0 118.5 18.5 280.68a 16.2 95.1 204.8 118.7 288.1 14.68a 84.2 61.3 12.1 46.2 300.8 350.28a 83.7 160.3 238.8 146.9 32.0 350.68a 16.0 160.2 237.3 146.7 277.9 14.616d 34.1 71.5 36.2 54.1 99.2 145.016d 70.7 67.8 33.3 54.3 68.6 144.9
RSC Advances Paper
Ope
n A
cces
s A
rtic
le. P
ublis
hed
on 1
0 M
ay 2
017.
Dow
nloa
ded
on 2
/19/
2022
7:5
1:27
AM
. T
his
artic
le is
lice
nsed
und
er a
Cre
ativ
e C
omm
ons
Attr
ibut
ion
3.0
Unp
orte
d L
icen
ce.
View Article Online
supported by the shape of the spectra, which again show – albeitadditionally broadened – features as expected for static quad-rupolar spectra of spin 3/2 nuclei (Fig. 4b).
It can be seen that a fraction of the overlithiated LTO showsa signal with similar sC as the stoichiometric LTO. This is ex-pected for two-phase formation upon overlithiation.14–16
However, the signal fraction exhibiting such a reduced mobilityin overlithiated LTO is smaller than the fraction of
25280 | RSC Adv., 2017, 7, 25276–25284
stoichiometric LTO if a strict two-phase separation according toLi4+xTi5O12 ¼ (1 � x/3)Li4Ti5O12 + (x/3)Li7Ti5O12 is assumed.22
To distinguish different resonances, the spectrally resolveddistribution of spin–lattice relaxation times T1 of overlithiatedLTO using an SR experiment with MAS was determined (Fig. 5).Two different spectral features are observed: a set of poorlyresolved resonances with different T1 at about 0 ppm (regionsA–C) and a broad line centered at about �10 ppm (region D).The frequencies of the former are overlapping with the reso-nances observed in stoichiometric LTO.19 The latter is due to thepresence of paramagnetic Ti3+.48 The spectral separation islikely caused by the formation of different phases rather thana solid solution upon chemical overlithiation. This is in agree-ment with microscopy results,15 where clear boundariesbetween overlithiated and stoichiometric phases were observed.Nonetheless, both signals show a short relaxation componentfor 100 ms ( T1 ( 1 s (regions B and D). This is considerablyshorter than T1 of stoichiometric LTO, whose projected distri-bution is shown in Fig. 5, and is indicative of Li ions in thevicinity of paramagnetic Ti3+.
The resonances at 0 ppm show additional clearly distin-guished relaxation components. The one at T1z 10 s (region A),which is only moderately reduced compared to T1 of stoichio-metric LTO, could be explained by some Li+ exchange withoverlithiated phases, yet considerably reduced compared to theabove-mentioned component with fast T1. Alternatively, such anincrease could be caused by a variation of Li ion mobility,without the presence of paramagnetic centers in the regionsampled by a Li ion. Either way, the reduction of T1 shows thatthese phases are not macroscopically separated due to non-uniform sample overlithiation, which would cause a contribu-tion with identical T1 as in stoichiometric LTO. It also indicatesthat there is some heterogeneity in the distribution of mobilityor size of the phases, otherwise a continuous distribution of T1would be expected. Finally, the component at T1 z 20 ms(region C) is rather unusual. It does not show a considerablechemical shi, and it is in the immediate neighborhood ofa peak with negative sign. It is likely that both peaks are causedby exchange, since we know from the SAE that correspondingmobility processes are taking place.
This journal is © The Royal Society of Chemistry 2017
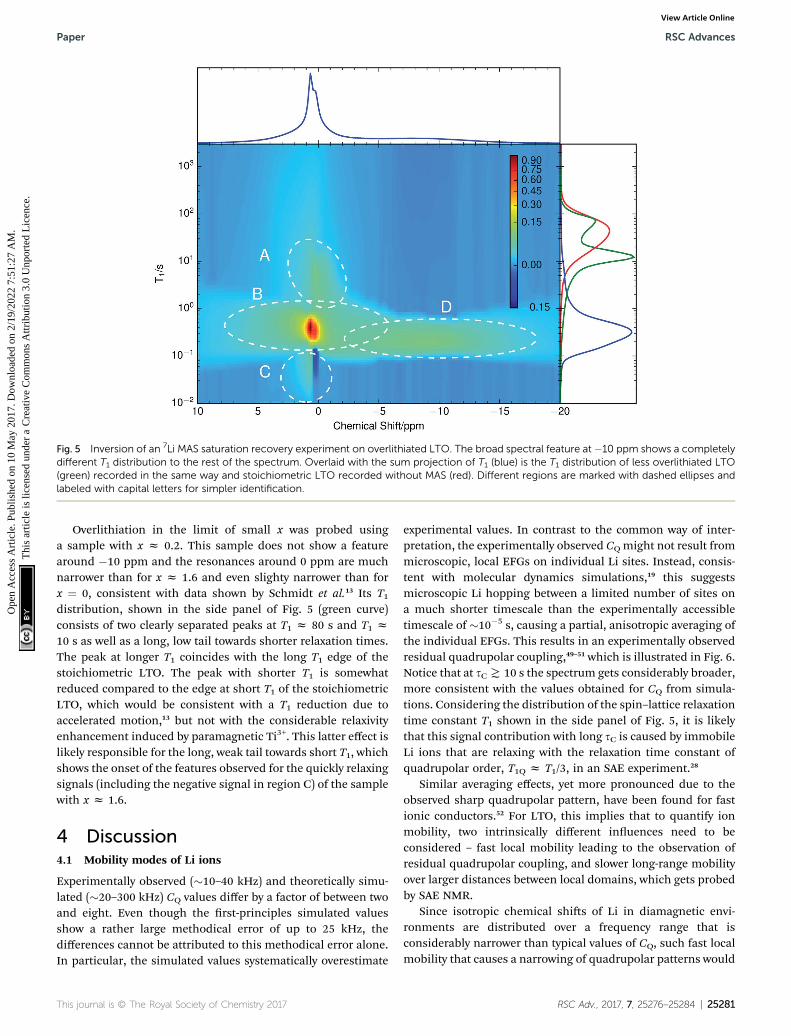
Fig. 5 Inversion of an 7Li MAS saturation recovery experiment on overlithiated LTO. The broad spectral feature at �10 ppm shows a completelydifferent T1 distribution to the rest of the spectrum. Overlaid with the sum projection of T1 (blue) is the T1 distribution of less overlithiated LTO(green) recorded in the same way and stoichiometric LTO recorded without MAS (red). Different regions are marked with dashed ellipses andlabeled with capital letters for simpler identification.
Paper RSC Advances
Ope
n A
cces
s A
rtic
le. P
ublis
hed
on 1
0 M
ay 2
017.
Dow
nloa
ded
on 2
/19/
2022
7:5
1:27
AM
. T
his
artic
le is
lice
nsed
und
er a
Cre
ativ
e C
omm
ons
Attr
ibut
ion
3.0
Unp
orte
d L
icen
ce.
View Article Online
Overlithiation in the limit of small x was probed usinga sample with x z 0.2. This sample does not show a featurearound �10 ppm and the resonances around 0 ppm are muchnarrower than for x z 1.6 and even slighty narrower than forx ¼ 0, consistent with data shown by Schmidt et al.13 Its T1distribution, shown in the side panel of Fig. 5 (green curve)consists of two clearly separated peaks at T1 z 80 s and T1 z10 s as well as a long, low tail towards shorter relaxation times.The peak at longer T1 coincides with the long T1 edge of thestoichiometric LTO. The peak with shorter T1 is somewhatreduced compared to the edge at short T1 of the stoichiometricLTO, which would be consistent with a T1 reduction due toaccelerated motion,13 but not with the considerable relaxivityenhancement induced by paramagnetic Ti3+. This latter effect islikely responsible for the long, weak tail towards short T1, whichshows the onset of the features observed for the quickly relaxingsignals (including the negative signal in region C) of the samplewith x z 1.6.
4 Discussion4.1 Mobility modes of Li ions
Experimentally observed (�10–40 kHz) and theoretically simu-lated (�20–300 kHz) CQ values differ by a factor of between twoand eight. Even though the rst-principles simulated valuesshow a rather large methodical error of up to 25 kHz, thedifferences cannot be attributed to this methodical error alone.In particular, the simulated values systematically overestimate
This journal is © The Royal Society of Chemistry 2017
experimental values. In contrast to the common way of inter-pretation, the experimentally observed CQmight not result frommicroscopic, local EFGs on individual Li sites. Instead, consis-tent with molecular dynamics simulations,19 this suggestsmicroscopic Li hopping between a limited number of sites ona much shorter timescale than the experimentally accessibletimescale of �10�5 s, causing a partial, anisotropic averaging ofthe individual EFGs. This results in an experimentally observedresidual quadrupolar coupling,49–51 which is illustrated in Fig. 6.Notice that at sCT 10 s the spectrum gets considerably broader,more consistent with the values obtained for CQ from simula-tions. Considering the distribution of the spin–lattice relaxationtime constant T1 shown in the side panel of Fig. 5, it is likelythat this signal contribution with long sC is caused by immobileLi ions that are relaxing with the relaxation time constant ofquadrupolar order, T1Q z T1/3, in an SAE experiment.28
Similar averaging effects, yet more pronounced due to theobserved sharp quadrupolar pattern, have been found for fastionic conductors.52 For LTO, this implies that to quantify ionmobility, two intrinsically different inuences need to beconsidered – fast local mobility leading to the observation ofresidual quadrupolar coupling, and slower long-range mobilityover larger distances between local domains, which gets probedby SAE NMR.
Since isotropic chemical shis of Li in diamagnetic envi-ronments are distributed over a frequency range that isconsiderably narrower than typical values of CQ, such fast localmobility that causes a narrowing of quadrupolar patterns would
RSC Adv., 2017, 7, 25276–25284 | 25281
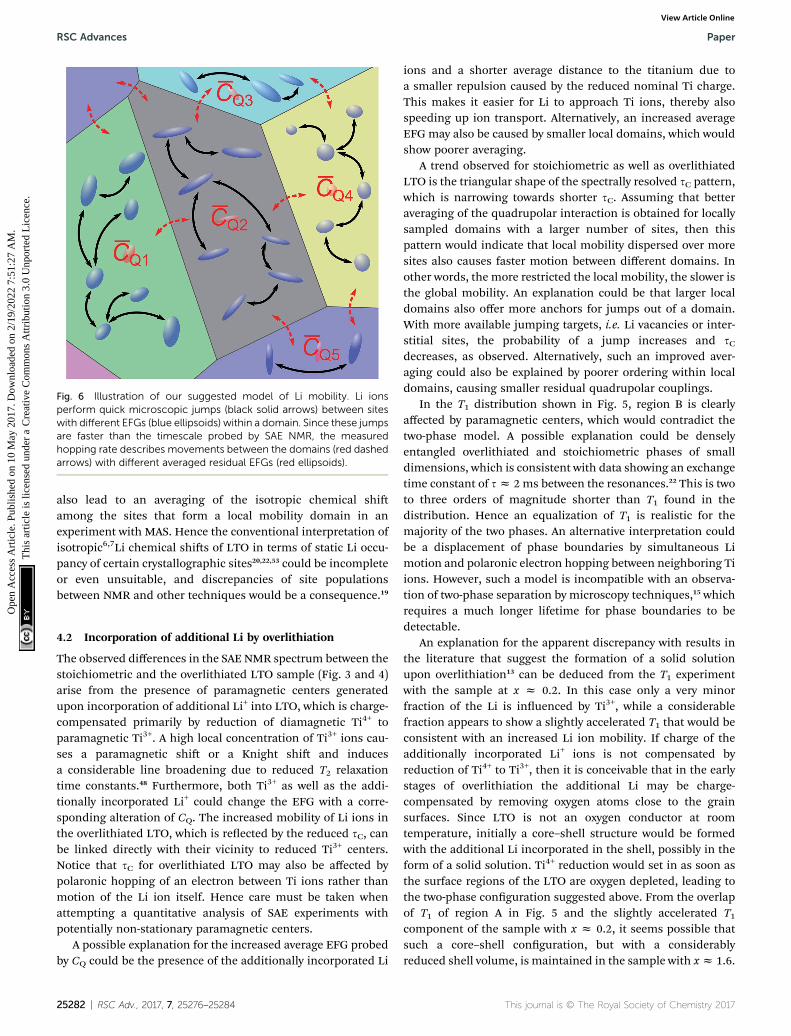
Fig. 6 Illustration of our suggested model of Li mobility. Li ionsperform quick microscopic jumps (black solid arrows) between siteswith different EFGs (blue ellipsoids) within a domain. Since these jumpsare faster than the timescale probed by SAE NMR, the measuredhopping rate describes movements between the domains (red dashedarrows) with different averaged residual EFGs (red ellipsoids).
RSC Advances Paper
Ope
n A
cces
s A
rtic
le. P
ublis
hed
on 1
0 M
ay 2
017.
Dow
nloa
ded
on 2
/19/
2022
7:5
1:27
AM
. T
his
artic
le is
lice
nsed
und
er a
Cre
ativ
e C
omm
ons
Attr
ibut
ion
3.0
Unp
orte
d L
icen
ce.
View Article Online
also lead to an averaging of the isotropic chemical shiamong the sites that form a local mobility domain in anexperiment with MAS. Hence the conventional interpretation ofisotropic6,7Li chemical shis of LTO in terms of static Li occu-pancy of certain crystallographic sites20,22,53 could be incompleteor even unsuitable, and discrepancies of site populationsbetween NMR and other techniques would be a consequence.19
4.2 Incorporation of additional Li by overlithiation
The observed differences in the SAE NMR spectrum between thestoichiometric and the overlithiated LTO sample (Fig. 3 and 4)arise from the presence of paramagnetic centers generatedupon incorporation of additional Li+ into LTO, which is charge-compensated primarily by reduction of diamagnetic Ti4+ toparamagnetic Ti3+. A high local concentration of Ti3+ ions cau-ses a paramagnetic shi or a Knight shi and inducesa considerable line broadening due to reduced T2 relaxationtime constants.48 Furthermore, both Ti3+ as well as the addi-tionally incorporated Li+ could change the EFG with a corre-sponding alteration of CQ. The increased mobility of Li ions inthe overlithiated LTO, which is reected by the reduced sC, canbe linked directly with their vicinity to reduced Ti3+ centers.Notice that sC for overlithiated LTO may also be affected bypolaronic hopping of an electron between Ti ions rather thanmotion of the Li ion itself. Hence care must be taken whenattempting a quantitative analysis of SAE experiments withpotentially non-stationary paramagnetic centers.
A possible explanation for the increased average EFG probedby CQ could be the presence of the additionally incorporated Li
25282 | RSC Adv., 2017, 7, 25276–25284
ions and a shorter average distance to the titanium due toa smaller repulsion caused by the reduced nominal Ti charge.This makes it easier for Li to approach Ti ions, thereby alsospeeding up ion transport. Alternatively, an increased averageEFG may also be caused by smaller local domains, which wouldshow poorer averaging.
A trend observed for stoichiometric as well as overlithiatedLTO is the triangular shape of the spectrally resolved sC pattern,which is narrowing towards shorter sC. Assuming that betteraveraging of the quadrupolar interaction is obtained for locallysampled domains with a larger number of sites, then thispattern would indicate that local mobility dispersed over moresites also causes faster motion between different domains. Inother words, the more restricted the local mobility, the slower isthe global mobility. An explanation could be that larger localdomains also offer more anchors for jumps out of a domain.With more available jumping targets, i.e. Li vacancies or inter-stitial sites, the probability of a jump increases and sCdecreases, as observed. Alternatively, such an improved aver-aging could also be explained by poorer ordering within localdomains, causing smaller residual quadrupolar couplings.
In the T1 distribution shown in Fig. 5, region B is clearlyaffected by paramagnetic centers, which would contradict thetwo-phase model. A possible explanation could be denselyentangled overlithiated and stoichiometric phases of smalldimensions, which is consistent with data showing an exchangetime constant of sz 2 ms between the resonances.22 This is twoto three orders of magnitude shorter than T1 found in thedistribution. Hence an equalization of T1 is realistic for themajority of the two phases. An alternative interpretation couldbe a displacement of phase boundaries by simultaneous Limotion and polaronic electron hopping between neighboring Tiions. However, such a model is incompatible with an observa-tion of two-phase separation by microscopy techniques,15 whichrequires a much longer lifetime for phase boundaries to bedetectable.
An explanation for the apparent discrepancy with results inthe literature that suggest the formation of a solid solutionupon overlithiation13 can be deduced from the T1 experimentwith the sample at x z 0.2. In this case only a very minorfraction of the Li is inuenced by Ti3+, while a considerablefraction appears to show a slightly accelerated T1 that would beconsistent with an increased Li ion mobility. If charge of theadditionally incorporated Li+ ions is not compensated byreduction of Ti4+ to Ti3+, then it is conceivable that in the earlystages of overlithiation the additional Li may be charge-compensated by removing oxygen atoms close to the grainsurfaces. Since LTO is not an oxygen conductor at roomtemperature, initially a core–shell structure would be formedwith the additional Li incorporated in the shell, possibly in theform of a solid solution. Ti4+ reduction would set in as soon asthe surface regions of the LTO are oxygen depleted, leading tothe two-phase conguration suggested above. From the overlapof T1 of region A in Fig. 5 and the slightly accelerated T1component of the sample with x z 0.2, it seems possible thatsuch a core–shell conguration, but with a considerablyreduced shell volume, is maintained in the sample with xz 1.6.
This journal is © The Royal Society of Chemistry 2017
Paper RSC Advances
Ope
n A
cces
s A
rtic
le. P
ublis
hed
on 1
0 M
ay 2
017.
Dow
nloa
ded
on 2
/19/
2022
7:5
1:27
AM
. T
his
artic
le is
lice
nsed
und
er a
Cre
ativ
e C
omm
ons
Attr
ibut
ion
3.0
Unp
orte
d L
icen
ce.
View Article Online
To quantitatively understand the evolution of the T1 distribu-tion, further experiments with a larger number of differentoverlithiation steps and a direct quantication of Ti3+ by elec-tron paramagnetic resonance10 will be necessary.
5 Conclusions
A novel analysis technique for the inversion of solid-state NMRrelaxation and SAE data was used to qualitatively study themobility of Li ions in stoichiometric and chemically over-lithiated LTO. Such an analysis facilitates, in analogy to estab-lished liquid-state NMR techniques, the separation of static orMAS NMR spectra into different components according to theirT1 or their sC. By employing an algorithm that does not dependon a non-negativity constraint, it is not necessary to assumethat, for example, no exchange is taking place between differentsignal contributions. For the datasets shown in this work, thenegative components proved to be necessary for a good t to theexperimental data. Although this method cannot be imple-mented as computationally efficient as the non-negativity con-strained Tikhonov regularization,36 it is still possible to use itfor two- and even three-dimensional inversion problems.
For LTO it was found that the 7Li NMR spectra showa pronounced sC dependence. From the discrepancy betweenexperimentally observed quadrupolar couplings and numericalsimulations it was concluded that fast local mobility of lithiumions between a limited number of sites is taking place and thatthe observed coupling constants represent residual quad-rupolar couplings. Such a hypothesis also implies that reso-nances at different isotropic chemical shis, as observed byMAS NMR experiments, may not be caused by static occupationof certain crystallographic sites. Furthermore, this means thatSAE NMR is not suitable to directly quantify long-range ionmotion in LTO as long as the size of the local domains is notknown. Even NMR relaxation time measurements need to beassessed critically for their suitability for such a quantication,since multiple relaxation modes can be expected, which arepotentially difficult to disentangle or for which it is not neces-sarily clear whether relaxation is dominated by long-range orshort-range motion. However, effective parameters from NMRrelaxation or SAE experiments may be well suited to comparedifferently synthesized samples of the same material orsystematic material variations, for example by doping or varia-tion of the stoichiometry.
Different contributions to the spectrally resolved SAEdistribution show different temperature dependence, hence Limobility cannot be described by a single activation energy ora small number of activation energies for jumps betweenparticular crystallographic sites. Instead it is necessary toconsider the stochastically occupied local environment of ions,as was predicted theoretically by DFT simulations.32 Our resultsindicate that it is not sufficient to simulate unit cells or smallsupercells with periodic boundary conditions accessible by DFTcalculations, but that an intrinsically multiscalar simulationapproach is required to cover local domains showing enhancedLi mobility as well as jumps between such domains.
This journal is © The Royal Society of Chemistry 2017
For a more conclusive interpretation of the observed chem-ical shi values and time constant distributions, a renementof simulations as well as additional spectroscopic and imagingexperiments will be needed. In particular, atomistic as well assystematically coarse-grained simulations capable of capturingthe essential dynamical processes of extended sample volumesappear promising, since the observed features in the relaxationtime distribution indicate that relevant volume sizes even forthe description of the two-phase behavior of overlithiated LTOcould be within reach of current multiscale simulationmethods. Preliminary results from simple kinetic Monte Carlosimulations with a single rate constant32 and randomizedquadrupolar frequency distribution support the hypothesis ofan averaging process on a timescale smaller than experimen-tally accessible (approx. 10�5 s). Expanding the congurations(Fig. 1) sampled for quadrupolar frequencies by Li-16c defectstructures results in a kinetically averaged CQ much closer toexperimental values.
Acknowledgements
We are grateful to Dr Peter Jakes and Steffen Kayser, M.Sc. ofForschungszentrum Julich, Andreas Garhammer, B.Sc. andHendrik Heenen, M.Sc. of Technische Universitat Munchen, andDr Saskia Stegmaier of SUNCAT, SLAC for their technical assis-tance and fruitful discussions. Funding from the German FederalMinistry of Education and Research (BMBF project DESIREE,grant number 03SF0477A) is gratefully acknowledged.
References
1 M. V. Reddy, G. V. Subba Rao and B. V. R. Chowdari, Chem.Rev., 2013, 113, 5364–5457.
2 X. Sun, P. V. Radovanovic and B. Cui, New J. Chem., 2015, 39,38–63.
3 Z. Yang, D. Choi, S. Kerisit, K. M. Rosso, D. Wang, J. Zhang,G. Graff and J. Liu, J. Power Sources, 2009, 192, 588–598.
4 C. Sandhya, B. John and C. Gouri, Ionics, 2014, 20, 601–620.5 C. P. Grey and N. Dupre, Chem. Rev., 2004, 104, 4493–4512.6 A. Deschanvres, B. Raveau and Z. Sekkal, Mater. Res. Bull.,1971, 6, 699–704.
7 Y.-B. He, M. Liu, Z.-D. Huang, B. Zhang, Y. Yu, B. Li, F. Kangand J.-K. Kim, J. Power Sources, 2013, 239, 269–276.
8 Z. Chen, I. Belharouak, Y.-K. Sun and K. Amine, Adv. Funct.Mater., 2012, 23, 959–969.
9 T. Ohzuku, A. Ueda and N. Yamamoto, J. Electrochem. Soc.,1995, 142, 1431–1435.
10 P. Jakes, J. Granwehr, H. Kungl and R.-A. Eichel, Z. Phys.Chem., 2015, 229, 1439–1450.
11 I. Leonidov, O. Leonidova, L. Perelyaeva, R. Samigullina,S. Kovyazina and M. Patrakeev, Phys. Solid State, 2003, 45,2183–2188.
12 M. Wilkening, R. Amade, W. Iwaniak and P. Heitjans, Phys.Chem. Chem. Phys., 2007, 9, 1239.
13 W. Schmidt, P. Bottke, M. Sternad, P. Gollob, V. Hennige andM. Wilkening, Chem. Mater., 2015, 27, 1740–1750.
RSC Adv., 2017, 7, 25276–25284 | 25283
RSC Advances Paper
Ope
n A
cces
s A
rtic
le. P
ublis
hed
on 1
0 M
ay 2
017.
Dow
nloa
ded
on 2
/19/
2022
7:5
1:27
AM
. T
his
artic
le is
lice
nsed
und
er a
Cre
ativ
e C
omm
ons
Attr
ibut
ion
3.0
Unp
orte
d L
icen
ce.
View Article Online
14 S. Scharner, W. Weppner and P. Schmid-Beurmann, J.Electrochem. Soc., 1999, 146, 857–861.
15 M. Kitta, T. Akita, S. Tanaka and M. Kohyama, J. PowerSources, 2014, 257, 120–125.
16 D. Safronov, S. Novikova, A. Skundin and A. Yaroslavtsev,Inorg. Mater., 2012, 48, 57–61.
17 L. Aldon, P. Kubiak, M.Womes, J. Jumas, J. Olivier-Fourcade,J. Tirado, J. Corredor and C. Perez Vicente, Chem. Mater.,2004, 16, 5721–5725.
18 J. Qiu, C. Lai, E. Gray, S. Li, S. Qiu, E. Strounina, C. Sun,H. Zhao and S. Zhang, J. Mater. Chem. A, 2014, 2, 6353–6358.
19 M. Vijayakumar, S. Kerisit, K. M. Rosso, S. D. Burton,J. A. Sears, Z. Yang, G. L. Graff, J. Liu and J. Hu, J. PowerSources, 2011, 196, 2211–2220.
20 P. Krtil, J. Dedecek, T. Kostlanova and J. Brus, Electrochem.Solid-State Lett., 2004, 7, A163–A166.
21 W. Schmidt and M. Wilkening, J. Phys. Chem. C, 2016, 120,11372–11381.
22 H. Hain, M. Scheuermann, R. Heinzmann, L. Wunsche,H. Hahn and S. Indris, Solid State Nucl. Magn. Reson.,2012, 42, 9–16.
23 W. K. Pang, V. K. Peterson, N. Sharma, J.-J. Shiu andS.-h. Wu, Chem. Mater., 2014, 26, 2318–2326.
24 X. Lu, L. Gu, Y.-S. Hu, H.-C. Chiu, H. Li, G. P. Demopoulosand L. Chen, J. Am. Chem. Soc., 2015, 137, 1581–1586.
25 A. Laumann, H. Boysen, M. Bremholm, K. T. Fehr,M. Hoelzel and M. Holzapfel, Chem. Mater., 2011, 23,2753–2759.
26 N. Takami, K. Hoshina and H. Inagaki, J. Electrochem. Soc.,2011, 158, A725–A730.
27 A. Kuhn, V. Epp, G. Schmidt, S. Narayanan, V. Thangaduraiand M. Wilkening, J. Phys.: Condens. Matter, 2012, 24,035901.
28 R. Bohmer, K. Jeffrey and M. Vogel, Prog. Nucl. Magn. Reson.Spectrosc., 2007, 50, 87–174.
29 G. Vitins, G. Kizane, A. Lusis and J. Tiliks, J. Solid StateElectrochem., 2002, 6, 311–319.
30 B. Ruprecht, M. Wilkening, R. Uecker and P. Heitjans, Phys.Chem. Chem. Phys., 2012, 14, 11974.
31 M. Vijayakumar, S. Kerisit, Z. Yang, G. L. Graff, J. Liu,J. A. Sears, S. D. Burton, K. M. Rosso and J. Hu, J. Phys.Chem. C, 2009, 113, 20108–20116.
25284 | RSC Adv., 2017, 7, 25276–25284
32 B. Ziebarth, M. Klinsmann, T. Eckl and C. Elsasser, Phys. Rev.B: Condens. Matter Mater. Phys., 2014, 89, 174301.
33 G. Borgia, R. Brown and P. Fantazzini, J. Magn. Reson., 1998,132, 65–77.
34 P. T. Callaghan, C. H. Arns, P. Galvosas, M. W. Hunter,Y. Qiao and K. E. Washburn, Magn. Reson. Imaging, 2007,25, 441–444.
35 A. Lupulescu, M. Kotecha and L. Frydman, J. Am. Chem. Soc.,2003, 125, 3376–3383.
36 L. Venkataramanan, Y. Song and M. Hurlimann, IEEE Trans.Acoust., Speech, Signal Process., 2002, 50, 1017–1026.
37 G. Bodenhausen and R. R. Ernst, Mol. Phys., 1982, 47, 319–328.
38 S. Rodts and D. Bytchenkoff, J. Magn. Reson., 2010, 205, 315–318.
39 P. Fantazzini, F. Galassi, V. Bortolotti, R. Brown andF. Vittur, New J. Phys., 2011, 13, 065007.
40 Y.-Q. Song, G. Carneiro, L. M. Schwartz and D. L. Johnson,Phys. Rev. Lett., 2014, 113, 235503.
41 J. Granwehr and P. J. Roberts, J. Chem. Theory Comput., 2012,8, 3473–3482.
42 W. Kraus and G. Nolze, J. Appl. Crystallogr., 1996, 29, 301–303.
43 J. Jeener and P. Broekaert, Phys. Rev., 1967, 157, 232–240.44 F. Qi, G. Diezemann, H. Bohm, J. Lambert and R. Bohmer, J.
Magn. Reson., 2004, 169, 225–239.45 M. Levitt, G. Bodenhausen and R. Ernst, J. Magn. Reson.,
1984, 58, 462–472.46 S. Clark, M. Segall, C. Pickard, P. Hasnip, M. Probert,
K. Refson and M. Payne, Z. Kristallogr., 2005, 220, 567–570.47 N. Muller, G. Bodenhausen and R. R. Ernst, J. Magn. Reson.,
1987, 75, 297–334.48 T. Kostlanova, J. Dedecek and P. Krtil, Electrochim. Acta,
2007, 52, 1847–1856.49 M. Vogel and E. Rossler, J. Magn. Reson., 2000, 147, 43–58.50 M. Vogel, C. Brinkmann, H. Eckert and A. Heuer, Solid State
Nucl. Magn. Reson., 2002, 22, 344–362.51 S. C. Shekar, J. A. Tang and A. Jerschow, Concepts Magn.
Reson., Part A, 2010, 36, 362–387.52 R. Bertermann and W. Muller-Warmuth, Z. Naturforsch., A:
Phys. Sci., 1998, 53, 863–873.53 M. Wagemaker, E. R. H. van Eck, A. P. M. Kentgens and
F. M. Mulder, J. Phys. Chem. B, 2009, 113, 224–230.
This journal is © The Royal Society of Chemistry 2017


![Materials Chemistry and Physics · 2020. 3. 5. · ferent natural or synthetic piezoelectric ceramics (e.g. calcium titanate, barium titanate and lead zirconate titanate (PZT)) [2]](https://img.pdfslide.net/doc/110x75/60b88a1c38582264692512fa/materials-chemistry-and-physics-2020-3-5-ferent-natural-or-synthetic-piezoelectric.jpg)