Embed Size (px)
Citation preview

Observing the solar corona with a tunableFabry–Perot filter
Matthew W. Noble,1 David M. Rust,1,* Pietro N. Bernasconi,1 Jay M. Pasachoff,2,3
Bryce A. Babcock,2 and Megan A. Bruck2,4
1Johns Hopkins University Applied Physics Laboratory, 11100 Johns Hopkins Road, Laurel, Maryland 20723, USA2Hopkins Observatory, Williams College, Williamstown, Massachusetts 01267, USA
3California Institute of Technology 150-21, Pasadena, California 91125, USA4Harvard-Smithsonian Center for Astrophysics, Cambridge, Massachusetts 02138, USA
*Corresponding author: [email protected]
Received 22 July 2008; accepted 24 August 2008;posted 5 September 2008 (Doc. ID 99216); published 21 October 2008
A solid Fabry–Perot etalon with a 0:16Å passband was used during the 180 s solar eclipse of 2006 forrapid scans of an emission line of the solar corona. The etalon was a Y-cut lithium niobate wafer coatedwith reflective and conductive (ITO) layers. Voltage applied perpendicular to the etalon face produced apassband shift of 0:0011ÅV−1. During the eclipse, 18 filtergrams were obtained at six 0:22Å steps acrossthe profile of the forbidden [Fe X] spectral emission line at 6374:4Å, which results from the 106 K coronalplasma. The 9:3 × 9:3 arcmin field of view showed the structure of the corona above a newly emergedsunspot region. We discuss tests performed on the etalon before and after the eclipse. We also discussthe coronal observations, which show some features with 10kms−1 velocities in the line of sight. © 2008Optical Society of America
OCIS codes: 120.2230, 120.2440, 160.3730, 230.2090, 350.1270.
1. Introduction
Total eclipses of the Sun present opportunities tostudy the distribution of emission in the solar corona,which is heated to 1 − 4 × 10⁶ K by mechanismscontroversially explained by magnetohydrodynamicwaves or nanoflares [1]. Most of the faint, forbiddenemission lines in the visible spectrum of the coronacome from highly ionized iron, and they must bestudied with either a spectrograph or a narrow-bandpass filter. Because eclipses last only a few min-utes, any filter must have a high throughput toenable exposure times of a few seconds despite thefaintness of the corona (∼10−5 relative to the solardisk) [2,3]. It is also important to be able to tunethe filter through a spectral line—most are onlyabout 1Å wide—to measure turbulent broadening
and Doppler shifts [4]. During the 29 March 2006eclipse, we used a telescope with a 35 cm apertureand a tunable 0:16Å Fabry–Perot (F-P) etalon tostudy the emission from the forbidden [Fe X] lineat 6374:4Å. Observations were made from the GreekIsland of Kastellorizo, just off the Turkish coast nearthe city of Kas. The duration of totality was only3 min, and although the observations encounteredsome clouds, we obtained usable data on the struc-ture of the corona above a newly emerged sunspotregion [5–7]. We describe the optical system, espe-cially the F-P filter and its wavelength calibration,our analysis of the coronal observations, and sometests of the etalon.
One of our objectives in undertaking the eclipse ex-periment was to test a solar filtergraph based on alithium niobate (LiNbO3) F-P etalon filter in a chal-lenging environment. Subsequent to the eclipse, weperformed a number of tests to qualify such a filterfor operation in a space telescope.
0003-6935/08/315744-06$15.00/0© 2008 Optical Society of America
5744 APPLIED OPTICS / Vol. 47, No. 31 / 1 November 2008
2. Instrumentation
A. Telescope and Relay Optics
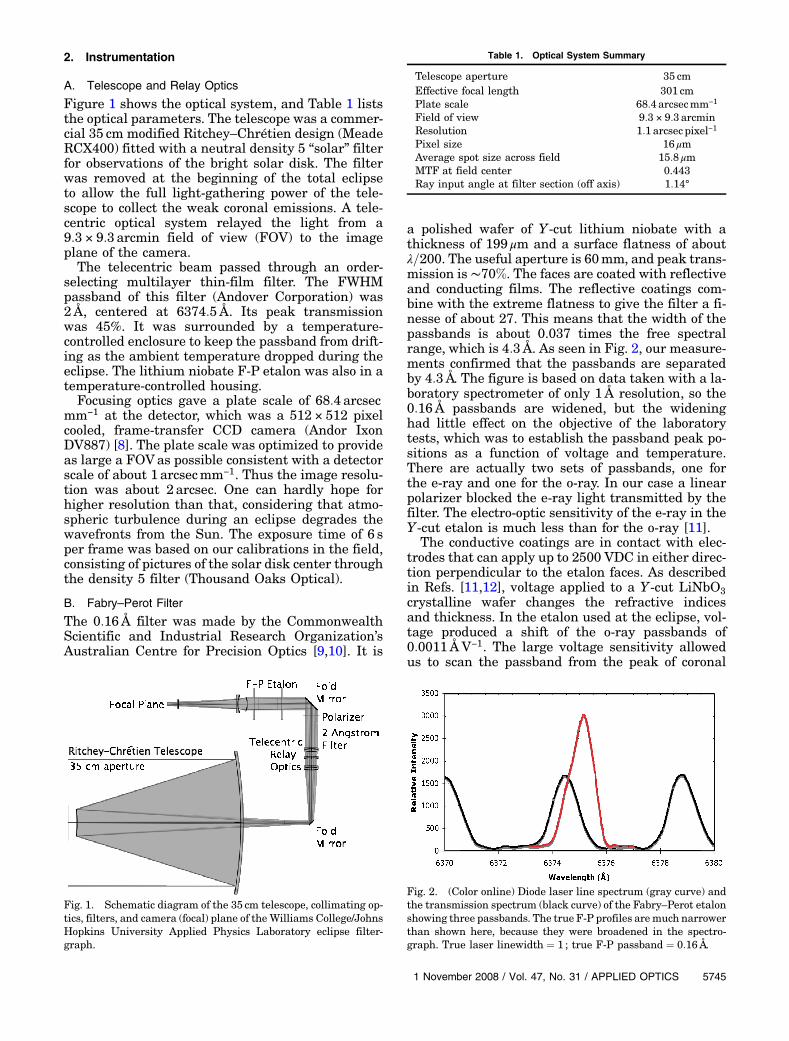
Figure 1 shows the optical system, and Table 1 liststhe optical parameters. The telescope was a commer-cial 35 cm modified Ritchey–Chrétien design (MeadeRCX400) fitted with a neutral density 5 “solar” filterfor observations of the bright solar disk. The filterwas removed at the beginning of the total eclipseto allow the full light-gathering power of the tele-scope to collect the weak coronal emissions. A tele-centric optical system relayed the light from a9:3 × 9:3 arcmin field of view (FOV) to the imageplane of the camera.The telecentric beam passed through an order-
selecting multilayer thin-film filter. The FWHMpassband of this filter (Andover Corporation) was2Å, centered at 6374:5Å. Its peak transmissionwas 45%. It was surrounded by a temperature-controlled enclosure to keep the passband from drift-ing as the ambient temperature dropped during theeclipse. The lithium niobate F-P etalon was also in atemperature-controlled housing.Focusing optics gave a plate scale of 68:4 arcsec
mm−1 at the detector, which was a 512 × 512 pixelcooled, frame-transfer CCD camera (Andor IxonDV887) [8]. The plate scale was optimized to provideas large a FOVas possible consistent with a detectorscale of about 1 arcsecmm−1. Thus the image resolu-tion was about 2arcsec. One can hardly hope forhigher resolution than that, considering that atmo-spheric turbulence during an eclipse degrades thewavefronts from the Sun. The exposure time of 6 sper frame was based on our calibrations in the field,consisting of pictures of the solar disk center throughthe density 5 filter (Thousand Oaks Optical).
B. Fabry–Perot Filter
The 0:16Å filter was made by the CommonwealthScientific and Industrial Research Organization’sAustralian Centre for Precision Optics [9,10]. It is
a polished wafer of Y-cut lithium niobate with athickness of 199 μm and a surface flatness of aboutλ=200. The useful aperture is 60mm, and peak trans-mission is ∼70%. The faces are coated with reflectiveand conducting films. The reflective coatings com-bine with the extreme flatness to give the filter a fi-nesse of about 27. This means that the width of thepassbands is about 0.037 times the free spectralrange, which is 4:3Å. As seen in Fig. 2, our measure-ments confirmed that the passbands are separatedby 4:3Å. The figure is based on data taken with a la-boratory spectrometer of only 1Å resolution, so the0:16Å passbands are widened, but the wideninghad little effect on the objective of the laboratorytests, which was to establish the passband peak po-sitions as a function of voltage and temperature.There are actually two sets of passbands, one forthe e-ray and one for the o-ray. In our case a linearpolarizer blocked the e-ray light transmitted by thefilter. The electro-optic sensitivity of the e-ray in theY-cut etalon is much less than for the o-ray [11].
The conductive coatings are in contact with elec-trodes that can apply up to 2500 VDC in either direc-tion perpendicular to the etalon faces. As describedin Refs. [11,12], voltage applied to a Y-cut LiNbO3crystalline wafer changes the refractive indicesand thickness. In the etalon used at the eclipse, vol-tage produced a shift of the o-ray passbands of0:0011ÅV−1. The large voltage sensitivity allowedus to scan the passband from the peak of coronal
Table 1. Optical System Summary
Telescope aperture 35 cmEffective focal length 301 cmPlate scale 68:4arcsecmm−1
Field of view 9:3 × 9:3arcminResolution 1:1arcsec pixel−1
Pixel size 16 μmAverage spot size across field 15:8 μmMTF at field center 0.443Ray input angle at filter section (off axis) 1:14°
Fig. 1. Schematic diagram of the 35 cm telescope, collimating op-tics, filters, and camera (focal) plane of the Williams College/JohnsHopkins University Applied Physics Laboratory eclipse filter-graph.
Fig. 2. (Color online) Diode laser line spectrum (gray curve) andthe transmission spectrum (black curve) of the Fabry–Perot etalonshowing three passbands. The true F-P profiles aremuch narrowerthan shown here, because they were broadened in the spectro-graph. True laser linewidth ¼ 1 ; true F-P passband ¼ 0:16Å.
1 November 2008 / Vol. 47, No. 31 / APPLIED OPTICS 5745
forbidden Fe X line at 6374:4Å into the nearby con-tinuum, which can be subtracted from the on-bandobservations to produce high-purity images of the6374:4Å line. All the images shown in this paperhave had the continuum contribution subtracted out.Figure 2 shows the etalon filter’s passbands rela-
tive to a thermoelectrically cooled diode laser (WorldStar) tuned to 6375:16Å. The power output stabilityof the laser module is better than 1%, so it provides agood reference to check the etalon’s passband posi-tion in the field and in the laboratory. In the daysand hours before the eclipse, we pointed the telescopeat the laser and adjusted the temperature and vol-tage on the etalon until we could be sure of tuningto the coronal line, which is 0:76Å from the laserwavelength. It was a great advantage to have thiscapability at the eclipse site, because the tempera-ture sensitivity of the passbands in the Y-cut etalonis quite high, 0:19Å °C−1, and we could not be surethat the actual temperature of the etalon was equalto the indicated filter housing temperature. We esti-mate that any change in filter temperature duringthe 3 min of observations was <0:05 °C, which trans-lates to a wavelength uncertainty of <0:01Å.During the eclipse, we could tune the LiNbO3 filter
over only a 1000V range because of the failure on thesite of the primary 2500V power supply. As shown inthe next section, however, this voltage range was en-ough to sweep from the line center at 6374:4Å to thenearby continuum at 6375:5Å. Exposures were madeat 200V steps from 1000 to 0V at a cadence of 10 sper step. We obtained the most useful data duringthe first series of exposures, which were not degradedby clouds. Eighteen exposures were obtained duringthe 180 s duration of totality.
3. Results
A. Fe X Emission in Active Region 10866
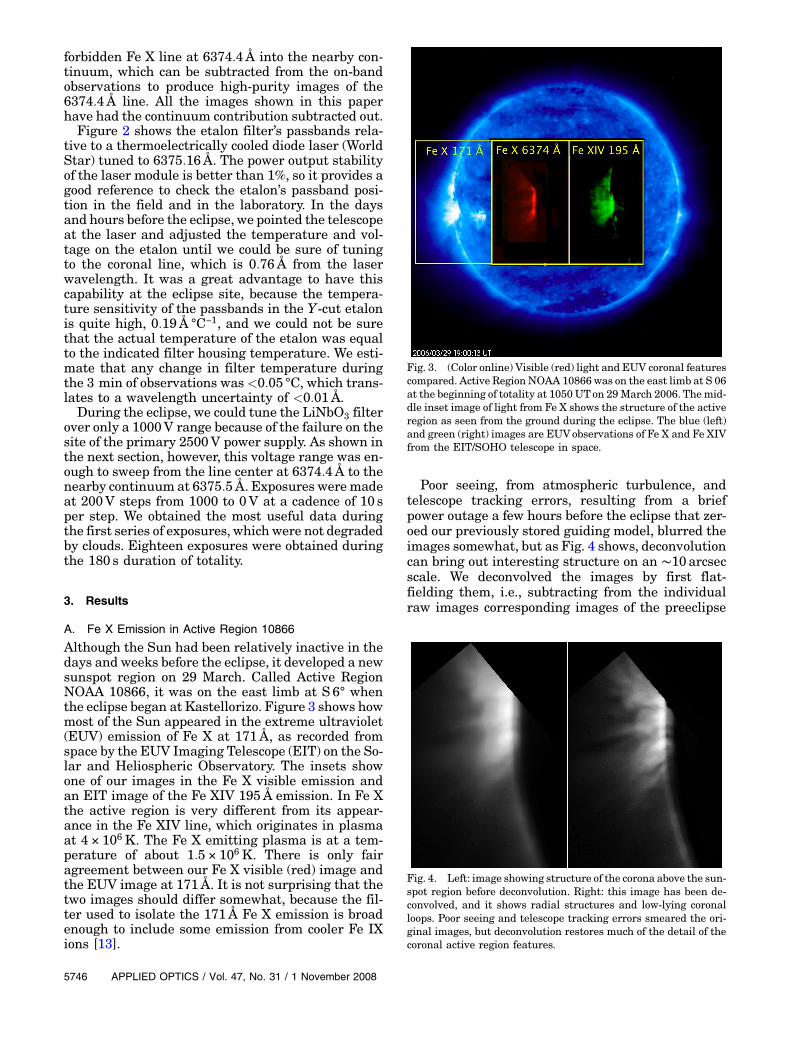
Although the Sun had been relatively inactive in thedays and weeks before the eclipse, it developed a newsunspot region on 29 March. Called Active RegionNOAA 10866, it was on the east limb at S 6° whenthe eclipse began at Kastellorizo. Figure 3 shows howmost of the Sun appeared in the extreme ultraviolet(EUV) emission of Fe X at 171Å, as recorded fromspace by the EUV Imaging Telescope (EIT) on the So-lar and Heliospheric Observatory. The insets showone of our images in the Fe X visible emission andan EIT image of the Fe XIV 195Å emission. In Fe Xthe active region is very different from its appear-ance in the Fe XIV line, which originates in plasmaat 4 × 10⁶ K. The Fe X emitting plasma is at a tem-perature of about 1:5 × 10⁶ K. There is only fairagreement between our Fe X visible (red) image andthe EUV image at 171Å. It is not surprising that thetwo images should differ somewhat, because the fil-ter used to isolate the 171Å Fe X emission is broadenough to include some emission from cooler Fe IXions [13].
Poor seeing, from atmospheric turbulence, andtelescope tracking errors, resulting from a briefpower outage a few hours before the eclipse that zer-oed our previously stored guiding model, blurred theimages somewhat, but as Fig. 4 shows, deconvolutioncan bring out interesting structure on an ∼10 arcsecscale. We deconvolved the images by first flat-fielding them, i.e., subtracting from the individualraw images corresponding images of the preeclipse
Fig. 3. (Color online) Visible (red) light and EUV coronal featurescompared. Active RegionNOAA 10866 was on the east limb at S 06at the beginning of totality at 1050 UTon 29March 2006. Themid-dle inset image of light from Fe X shows the structure of the activeregion as seen from the ground during the eclipse. The blue (left)and green (right) images are EUVobservations of Fe X and Fe XIVfrom the EIT/SOHO telescope in space.
Fig. 4. Left: image showing structure of the corona above the sun-spot region before deconvolution. Right: this image has been de-convolved, and it shows radial structures and low-lying coronalloops. Poor seeing and telescope tracking errors smeared the ori-ginal images, but deconvolution restores much of the detail of thecoronal active region features.
5746 APPLIED OPTICS / Vol. 47, No. 31 / 1 November 2008

sky taken of each of the six discrete F-P voltage set-tings used during the observations. Point spreadfunctions (PSFs) from four regions of interest werethen generated from the system optical model. Theregions correspond to a rectangular subset ofpixels along the solar limb and upper and lower cen-ters of the full raw image. The flat-fielded imageswere then iteratively deconvolved with the four PSFsand normalized.To correct for tracking errors, the solar center in
pixel space of each image was found through limbidentification and knowledge of the image platescale. Then, fourth-order polynomials were fittedto the horizontal and vertical motions of the sequenceof images. The appropriate shifts were then appliedto remove the apparent motion of the PSF decon-volved images. A small correction in image rotationwas also made based on apparent motion of the ob-served active region and computed image rotationduring the 3 min of the observations. The final co-registered, deconvolved images were then stackedfor convenient viewing. The registration error is onthe order of �4 pixels.
B. Spectral Line Variations
There are many reports of motions in the corona[14,15] ranging from < 10kms−1 up to ∼100kms−1.Figure 5 is our velocitygram of the coronal featuresabove the sunspot region. The right-hand side of thefigure shows a subtraction of the image with the fil-ter tuned at 400V ¼ Δλ ≈ −0:44Å relative to linecenter from the image with the filter tuned to thecenter of the line. The variations in brightness revealseveral interesting features moving in the line ofsight. In this Doppler image, the coronal plasma inthe dark parts was moving toward the observer.To have a closer look at the spectral line profiles in
the various features, we sampled the mean intensity
in the boxes shown and plotted the results as a func-tion of filter-offset voltage. The results are shown inFig. 6. Most of the line profiles have a half-width athalf-maximum of about 400V ¼ 0:44Å, so the fullwidth is nearly an a ngstrom. However, the mean pro-files in boxes 7 and 8 are shifted to shorter wave-lengths by about 0:2Å. Assuming that these profilesare Doppler shifted and the others are not, our re-sults imply a near zero line-of-sight velocity in mostfeatures and only 10kms−1 toward the observer inthe coronal features labeled 7 and 8. In other words,we do not detect velocities >10kms−1, as found bysome observers [16].
We conclude that the 0:16Å LiNbO3 filter is a use-ful tool for rapidly obtaining coronal spectral-lineprofiles during the short-lived opportunities offeredby solar eclipses. The filter operated well underthe difficult field conditions that prevailed in Kastel-lorizo, and can be expected on any eclipse expedition.Eclipse expeditions are like space missions in someways, which is why we took the LiNbO3 filter to Kas-tellorizo. However, space missions present differentunique challenges, so we performed some laboratorytests on the filter that are appropriate to qualify it foruse in space.
4. Tests for Energetic Proton or γ Ray Damage
Subsequent to the eclipse, we tested the capability oftwo LiNbO3 wafers similar to the one used for eclipseobservations to withstand conditions frequently en-countered in space. One hazard is bombardment bysolar flare-produced high-energy ions. We bom-barded the etalons with a high-energy proton beam.One wafer was subjected to a fluence of 10krad andthe other to 20krad. To gauge the effect, we mea-sured the second wafer’s spectral transmission forall wavelengths between 4500 and 11500Å beforeand after the 20 krad exposure. There was no detect-able change (<1%) in light transmission through thewafer at any wavelength. We conclude that a LiNbO3
Fig. 5. The grayscale in the right-side image represents Dopplershifts that result from solar plasmamotions along the line of sight.This velocitygram reveals several places in the coronal structureswhere the hot plasma has a velocity component of ∼10km−1 to-ward the observer. The image on the left shows the locations ofthe areas sampled to produce the line profiles shown in Fig. 6.
Fig. 6. Normalized profiles of the Fe X 6374Å line in the boxedareas shown in Fig. 5. The numbers in the plot area refer to the 8boxes in Fig. 5. The profiles in boxes 7 and 8 are blueshifted byabout 0:22Å relative to the others. The conversion factor from vol-tage applied to the F-P filter to wavelength change is 1Å=900V.
1 November 2008 / Vol. 47, No. 31 / APPLIED OPTICS 5747
filter will not be damaged even in a solar flare-produced proton shower.To test for changes in the index of refraction of a
LiNbO3 filter subjected to gamma radiation, weopted to use a working F-P etalon with optical-quality surfaces. This etalon was previously usedin the Flare Genesis Solar Vector Magnetograph thatwas flown over Antarctica in January 2000 in a bal-loon gondola [17]. The flight achieved its objective tomeasure Doppler shifts and Zeeman shifts in grow-ing sunspot regions.While there is usually no radiation hazard on a
stratospheric balloon flight, the radiation hazardon space missions is significant. Any changes inthe F-P filter’s index of refraction, i.e., optical da-mage resulting from exposure to radiation, will alsochange the optical path within the F-P etalon andthus change the wavelengths of the passbands. Forour laboratory tests of the etalon, we tuned one pass-band to near the wavelength of a He–Ne laser andbeamed the laser through the etalon. Tuning was ac-complished by varying the high voltage just as dur-ing the eclipse observations. A photodetector behindthe etalon measured the transmitted laser beam in-tensity. Any change in the F-P etalon index of refrac-tion due to the gamma radiation would shift itspassband and change the transmission of the la-ser light.We recorded the transmission versus voltage be-
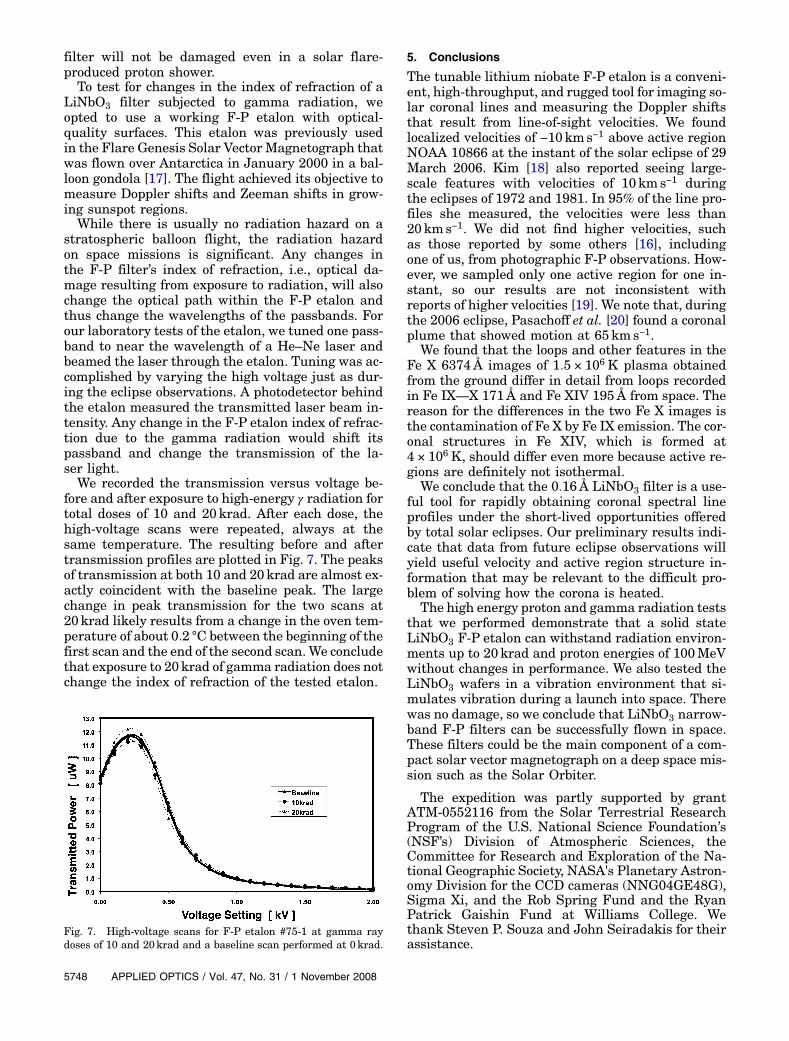
fore and after exposure to high-energy γ radiation fortotal doses of 10 and 20krad. After each dose, thehigh-voltage scans were repeated, always at thesame temperature. The resulting before and aftertransmission profiles are plotted in Fig. 7. The peaksof transmission at both 10 and 20krad are almost ex-actly coincident with the baseline peak. The largechange in peak transmission for the two scans at20krad likely results from a change in the oven tem-perature of about 0:2 °C between the beginning of thefirst scan and the end of the second scan.We concludethat exposure to 20krad of gamma radiation does notchange the index of refraction of the tested etalon.
5. Conclusions
The tunable lithium niobate F-P etalon is a conveni-ent, high-throughput, and rugged tool for imaging so-lar coronal lines and measuring the Doppler shiftsthat result from line-of-sight velocities. We foundlocalized velocities of −10kms−1 above active regionNOAA 10866 at the instant of the solar eclipse of 29March 2006. Kim [18] also reported seeing large-scale features with velocities of 10kms−1 duringthe eclipses of 1972 and 1981. In 95% of the line pro-files she measured, the velocities were less than20kms−1. We did not find higher velocities, suchas those reported by some others [16], includingone of us, from photographic F-P observations. How-ever, we sampled only one active region for one in-stant, so our results are not inconsistent withreports of higher velocities [19]. We note that, duringthe 2006 eclipse, Pasachoff et al. [20] found a coronalplume that showed motion at 65kms−1.
We found that the loops and other features in theFe X 6374Å images of 1:5 × 10⁶ K plasma obtainedfrom the ground differ in detail from loops recordedin Fe IX—X 171Å and Fe XIV 195Å from space. Thereason for the differences in the two Fe X images isthe contamination of Fe X by Fe IX emission. The cor-onal structures in Fe XIV, which is formed at4 × 106 K, should differ even more because active re-gions are definitely not isothermal.
We conclude that the 0:16Å LiNbO3 filter is a use-ful tool for rapidly obtaining coronal spectral lineprofiles under the short-lived opportunities offeredby total solar eclipses. Our preliminary results indi-cate that data from future eclipse observations willyield useful velocity and active region structure in-formation that may be relevant to the difficult pro-blem of solving how the corona is heated.
The high energy proton and gamma radiation teststhat we performed demonstrate that a solid stateLiNbO3 F-P etalon can withstand radiation environ-ments up to 20krad and proton energies of 100MeVwithout changes in performance. We also tested theLiNbO3 wafers in a vibration environment that si-mulates vibration during a launch into space. Therewas no damage, so we conclude that LiNbO3 narrow-band F-P filters can be successfully flown in space.These filters could be the main component of a com-pact solar vector magnetograph on a deep space mis-sion such as the Solar Orbiter.
The expedition was partly supported by grantATM-0552116 from the Solar Terrestrial ResearchProgram of the U.S. National Science Foundation’s(NSF’s) Division of Atmospheric Sciences, theCommittee for Research and Exploration of the Na-tional Geographic Society, NASA's Planetary Astron-omy Division for the CCD cameras (NNG04GE48G),Sigma Xi, and the Rob Spring Fund and the RyanPatrick Gaishin Fund at Williams College. Wethank Steven P. Souza and John Seiradakis for theirassistance.
Fig. 7. High-voltage scans for F-P etalon #75-1 at gamma raydoses of 10 and 20krad and a baseline scan performed at 0krad.
5748 APPLIED OPTICS / Vol. 47, No. 31 / 1 November 2008

References
1. J. A. Klimchuk, “On solving the coronal heating problem,” Sol.Phys. 234, 41–77 (2006).
2. L. Golub and J. M. Pasachoff, Nearest Star: the SurprisingScience of Our Sun (Harvard University, 2001), p. 267.
3. T. Chandrasekhar, N. M. Ashok, J. N. Desai, J. M. Pasachoff,and K. R. Sivaraman, “Fabry–Perot interferometric observa-tions of the coronal red and green lines during the 1983 Indo-nesian eclipse,” Appl. Opt. 23, 508–511 (1984).
4. T. Chandrasekhar, N. M. Ashok, B. G. A. Rao, J. M. Pasachoff,and T.-A. Suer, “Fabry–Perot interferometric study of thegreen coronal line during the total eclipse of 2001 from Zam-bia,” presented at the 26th Meeting of the IAU, Solar ActiveRegions and 3D Magnetic Structure, Prague, Czech Republic,16–17 August 2006, paper JD03 #2.
5. J. M. Pasachoff andM. A. Bruck, “High-spectral-resolution ob-servations of the solar chromosphere and corona,” Bull. Am.Astron. Soc. 39, 224 (2007).
6. D. M. Rust, M. W. Noble, J. M. Pasachoff, B. A. Babcock,M. A. Bruck, and R. A.Wittenmyer, “Narrow-band filter obser-vations of the red-line corona at the 29 March 2006 eclipse,”Bull. Am. Astron. Soc. 38, 217 (2006).
7. J. M. Pasachoff, B. A. Babcock, S. P. Souza, M. A. Bruck,P. W. Hess, S. B. Kimmel, J. S. Levitt, A. S. Steele,A. E. Tsykalova, D. M. Rust, M. W. Noble, R. Wittenmyer,J. H. R. L. Kern, J. H. Seiradakis, A. Voulgaris, G. Pistikoudis,J. Nestoras, and M. Demianski, “Coronal observations at the29 March 2006 total solar eclipse,” Bull. Am. Astron. Soc. 37,216 (2006).
8. S. P. Souza, B. A. Babcock, J. M. Pasachoff, A. A. S. Gulbis,J. L. Elliot, M. J. Person, and J. W. Gangestad, “POETS: Por-table Occultation, Eclipse, and Transit System,” Publ. Astron.Soc. Pac. 118, 1550–1557 (2006).
9. C. H. Burton, A. J. Leistner, and D. M. Rust, “ElectroopticFabry–Perot filter: development for the study of solar oscilla-tions,” Appl. Opt. 26, 2637–2642 (1987).
10. R. P. Netterfield, C. H. Freund, J. A. Seckold, and C. J. Walsh,“Design of a lithium niobate Fabry–Perot etalon-based spec-trometer,” Appl. Opt. 36, 4556–4561 (1997).
11. D. Bonaccini and R. N. Smartt, “Lithium niobate double chan-nel Fabry–Perot interferometer for solar corona uses,” Appl.Opt. 27, 5095–5102 (1988).
12. D. M. Rust, “Etalon filters,” Opt. Eng. 33, 3342–3348 (1994).13. J. P. Delaboudiniere, G. E. Artzner, J. Brunaud, A. H. Gabriel,
J. F. Hochedez, F. Millier, X. Y. Song, B. Au, K. P. Dere,R. A. Howard, R. Kreplin, D. J. Michels, J. D. Moses,J. M. Defise, C. Jamar, P. Rochus, J. P. Chauvineau,J. P. Marioge, R. C. Catura, J. R. Lemen, L. Shing, R. A. Stern,J. B. Gurman, W. M. Neupert, A. Maucherat, F. Clette,P. Cugnon, and E. L. Van Dessel, “EIT: Extreme-UltravioletImaging Telescope for the SOHO Mission,” Sol. Phys. 162,291–312 (1995).
14. A. B. Delone and E. A. Makarova, “Interferometric investiga-tion of the red and green coronal lines during the totalsolar eclipse of May 30, 1965,” Sol. Phys. 9, 116–130(1969).
15. D. H. Liebenberg, R. J. Bessey, and B. Watson, “Observed cor-onal temperatures at 1.37 solar radii in the region of a helmetstructure,” Sol. Phys. 40, 387–396 (1975).
16. T. Chandrasekhar, J. N. Desai, N. M. Ashok, and J. M. Pasach-off, “Fabry–Perot line profiles in the 5303Å and 6374Å coro-nal lines obtained during the 1983 Indonesian eclipse,” Sol.Phys. 131, 25–39 (1991).
17. P. Bernasconi, D. M. Rust, and H. A. C. Eaton, “High resolu-tion vector magnetograms with the Flare Genesis vectorpolarimeter,” in Advanced Solar Polarimetry—Theory, Obser-vation, and Instrumentation, Astron. Soc. Pac. Conf. Ser. 236,399–406 (2001).
18. I. S. Kim, “On the Fabry–Perot investigations of the solar cor-ona: eclipse observations of large-scale dynamics,” Adv. SpaceRes. 14, 45–48 (1994).
19. I. S. Kim, “Eclipse spectra of the coronal velocity field (invitedreview),” in Last Total Solar Eclipse of the Millennium in Tur-key, Astron. Soc. Pac. Conf. Ser. 205, 69–82 (2000).
20. J. M. Pasachoff, V. Rusin, M. Druckmüller, H. Druckmüllero-vá, M. Bělík, M. Saniga, M. Minarovjech, E. Markova,B. A. Babcock, S. P. Souza, and J. S. Levitt, “Polar plumebrightening during the 29 March 2006 total eclipse,” Astro-phys. J. 682, 638–643 (2008).
1 November 2008 / Vol. 47, No. 31 / APPLIED OPTICS 5749