Embed Size (px)
Citation preview

University of Central Florida University of Central Florida
STARS STARS
Honors Undergraduate Theses UCF Theses and Dissertations
2018
Obsidian Sourcing Analysis from Chiquiuitan, Guatemala Obsidian Sourcing Analysis from Chiquiuitan, Guatemala
Sutherland X. Fertig University of Central Florida
Part of the Other History of Art, Architecture, and Archaeology Commons
Find similar works at: https://stars.library.ucf.edu/honorstheses
University of Central Florida Libraries http://library.ucf.edu
This Open Access is brought to you for free and open access by the UCF Theses and Dissertations at STARS. It has
been accepted for inclusion in Honors Undergraduate Theses by an authorized administrator of STARS. For more
information, please contact [email protected].
Recommended Citation Recommended Citation Fertig, Sutherland X., "Obsidian Sourcing Analysis from Chiquiuitan, Guatemala" (2018). Honors Undergraduate Theses. 298. https://stars.library.ucf.edu/honorstheses/298

OBSIDIAN SOURCING ANALYSIS FROM CHIQUIUITAN, GUATEMALA
by
SUTHERLAND X. FERTIG
A thesis submitted in partial fulfillment of the requirements for the Honors in the Major Program in Anthropology
in the College of Sciences and in the Burnett Honors College at the University of Central Florida
Orlando, Florida
Spring Term, 2018
Thesis Chair: Brigitte Kovacevich, PhD.

ii
ABSTRACT
The intent of this thesis is to analyze obsidian artifacts from Chiquiuitan, Guatemala to see if the
samples can be traced to known obsidian sources in the Maya region based on their unique
chemical elements. Another aspect of this analysis is to determine the accuracy and validity of
the Handheld XRF instrument on small and irregular obsidian samples. Furthermore, sourcing
analysis allows researchers to acquire information about trade, exchange, and acquisition
patterns of the material and gives researchers indications to prehistoric, social, and economic
features.

iii
ACKNOWLEDGEMENTS
I would like to thank Dr. Brigitte Kovacevich and Dr. Michael Callaghan for granting me this incredible opportunity, for taking me on as their student, and for guiding me in the process. I
would also like to thank Dawn Crawford for supervising me and helping me out when I encountered hurdles. Lastly, thanks to my friends and family who continuously supported me
throughout this process.

iv
TABLE OF CONTENTS
CHAPTER ONE: INTRODUCTION ............................................................................................. 1
CHAPTER TWO: METHODS ....................................................................................................... 4
History of X-Ray Fluorescence ....................................................................................................................... 7
Literature Review ................................................................................................................................................ 7
Site Location and the LA-ICP-MS Analysis ............................................................................................. 11
Research Purpose ............................................................................................................................................. 14
Methodology ....................................................................................................................................................... 15
CHAPTER THREE: RESULTS ................................................................................................... 18
CHAPTER FOUR: CONCLUSION ............................................................................................. 27
WORKS CITED ........................................................................................................................... 29

v
LIST OF FIGURES
Figure 1: Obsidian Sources in the Maya region of Mesoamerica ......................................................... 3
Figure 2: Site of Chiquiquitan, Guatemala (from Kovacevich et al. 2010. Fig. 1) ....................... 13
Figure 3: Handheld XRF Bruker Tracer III SD of University of Central Florida (Fertig, 2018)
............................................................................................................................................................................. 17
Figure 4 Caliper used to measure each obsidian sample (Fertig, 2018) ....................................... 21
Figure 5 scale used to measure the obsidian samples (Fertig, 2018) ............................................ 21
Figure 6 Handheld XRF setup (Fertig, 2018) ............................................................................................ 22
Figure 7 S1PXRF program listing the elements in one sample (Fertig, 2018) ........................... 22
Figure 8 Total Sample Size: twenty obsidian samples (Fertig, 2018) ............................................ 23
Figure 9 irregular shaped obsidian (Fertig, 2018) ................................................................................. 23
Figure 10 smallest obsidian piece (Fertig, 2018) .................................................................................... 24
Figure 11 irregular shaped obsidian (Fertig, 2018) ............................................................................... 24
Figure 12 Bivaraite Fit of FeKa1 By RbKa1 (Crawford, 2018) .......................................................... 25
Figure 13 Bivariate Fit of ZrKa1 By RbKa1 (Crawford, 2018) ........................................................... 26

vi
LIST OF TABLES
Table 1 Results Presented by sample number, length, width, thickness, weight, and
assigned source. ........................................................................................................................................... 20

1
CHAPTER ONE: INTRODUCTION
Throughout early human history, stone tools were an important part of daily life in
processing food, cutting up plants, and chopping wood. These tools were made from many
different materials such as chert and quartz and belonged to characteristic stone tool technologies
such as the Oldowan and Acheulean industries. In regions with active volcanoes, most
individuals chose obsidian over other geological materials for their stone tool manufacturing
processes because of its remarkable properties. For this reason, obsidian was often traded and
exchanged over vast distances allowing researchers to acquire information about the social and
economic networks in the process.
Whittaker (2009, p. 69) defines obsidian as, “a natural glass produced by volcanic
action.” The rate at which the molten rock solidifies plays an important part in forming distinct
crystals and the overall texture of the stone (Whittaker, 2009). Obsidian has a high silica
composition and is homogenous (meaning the same throughout, lacking crystals, fibers or
layers). Because of its composition, obsidian can flake easily, predictably, and requires low
energy force. Also, obsidian comes in different colors: red, brown, green, blue, purple, gray, and
black. Furthermore, “obsidian forms in huge massive flows or as lumps and beds in rhyolite
flows” (Whittaker, 2009, p. 69). After eroding out of the primary deposits, prehistoric people
usually gathered obsidian from secondary deposits such as talus slopes and streambeds
(Whittaker, 2009).
Many prehistoric civilizations, including the Maya, favored obsidian, although chert was
also used for stone tool production. The Maya used obsidian to produce tools: knives, projectile

2
points, and prismatic blades and could be used for everyday activities like shaving, cooking, and
cutting hair. Additionally, the Maya utilized obsidian for other purposes: human effigies, ear
spools, animal figures, beads, etc. (Taube, 1991, p.61-70). Most importantly the Maya elites used
obsidian in ritual bloodletting that established reciprocal relationships with gods and ancestors.
Also, the Maya flung obsidian artifacts into cenotes (sacred sink holes representing portals to the
underworld) as offerings to gods and ancestors, and also placed these blades in ceremonial
caches sites like Copan and Altar de Sacrificios (Whittaker, 2009). These examples demonstrate
that the Maya used obsidian for both practical and ritual purposes; therefore obsidian can provide
a great deal of evidence about social patterns.
Recently, sourcing analysis has become a useful tool in archaeological studies. Sourcing
analysis allows the chemical compositions of the geological sources to be known, and
archaeologists to match the artifacts to known sources (Shugar and Mass, 2012). In this way,
researchers can understand the trade and exchange of material artifacts, document migrations of
people, and understand the tool production process (Shugar and Mass, 2012). As previously
mentioned, obsidian occurs in limited geological conditions near a volcanic region and exhibits
distinct characteristics of trace elements based on the conditions of its formation, usually unique
to each flow. This makes obsidian a suitable choice for sourcing studies, as opposed to other
types of stone that are less homogenous within sources, such as chert. Sugar and Mass (2012, p.
410) state that the “goal of archaeological obsidian provenance studies is to match obsidian
artifacts to specific geological sources of obsidian.” In the Maya region of Mesoamerica, known
obsidian sources are located in El Chayal, Ixtepeque, and San Martin Jilotepeque (SMJ) and
minor sources at San Bartolome Milpas Altas, Guatemala with some obsidian coming from

3
central Mexican sources like Pachuca, Zaragoza, and Otumba (Nazaroff, Prufer, and Drake,
2010). Sourcing analysis can be accomplished with many different techniques (further described
below). This allows researchers to get information about trade, exchange, and acquisition
patterns, and give researchers indications to prehistoric, social, and economic features. For this
reason, the purpose of this research is to analyze obsidian artifacts from Chiquiuitan, Guatemala
to see if the samples can be traced to known obsidian sources in the Maya region based on their
distinct chemical elements. Furthermore, the goal of this analysis is to determine the accuracy
and validity of the Handheld XRF technology on small and irregular obsidian samples, which
have traditionally presented challenges.
Figure 1: Obsidian Sources in the Maya region of Mesoamerica
(modified from Kovacevich 2006: Fig. 7.1)

4
CHAPTER TWO: METHODS
Chemical compositional studies of stone tools can be done using methods such as:
Particle Induced X-Ray Emission Analysis (PIXE), Electron Microprobe Analysis (EMPA),
Instrumental Neutron Activation Analysis (INAA), Inductively Coupled Plasma Emission
Spectroscopy (ICP), Atomic Absorption Spectroscopy (AAS), and X-Ray Fluorescence
Spectrometry (XRF). Each method has advantages and disadvantages.
Particle Induced X-Ray Emission Analysis uses a particle or proton x-ray emission and
has the same electron excitement and emission process. The benefits of Particle Induced X-Ray
Emission Analysis allow the beam to focus on a small area of the sample, measuring different
areas. Disadvantages of Particle Induced X-Ray Emission Analysis rest in the high cost of the
instrument, the high quality of surface polish needed, and the damage to the surface of the
sample based on polishing (Andrefsky, 2010).
The Electron Microprobe Analysis method allows for the analysis of single crystals
within the sample without damaging their relationship to the texture of the rock (Andrefsky,
2010). In this technique, an electron beam scans the sample causing the elements to emit a
secondary x-ray that can be measured (Andrefsky, 2010). Andrefsky (2010) states that Electron
Microprobe Analysis allows the use of whole artifacts or sections of a sample, but works best on
homogenous rocks.
The Instrumental Neutron Activation Analysis “requires irradiation of a sample in a
nuclear reactor by a prolonged neutron bombardment” (Andrefsky, 2010, p. 43). For this reason,
certain elements undergo nuclear reaction to create radioactive isotopes (Andrefsky, 2010).
When the isotopes decay, gamma photons are produced; the amount of the gamma photons is

5
proportional to their concentration (Andrefsky, 2010). Instrumental Neutron Activation Analysis
can either use a small section of the sample or the entire artifact without destruction to the
sample (the sample will remain radioactive for sometime after analysis and cannot be handled, so
samples are often taken). Instrumental Neutron Activation Analysis allows the precise
determination of a wide range of elements (Shugar, 2013). Shugar (2013) also describes
disadvantages: the expensive cost, the large sample preparation time, and the high cost of
irradiation and high-purity sample containers.
Inductively Coupled Plasma Emission Spectroscopy uses a solution that is heated to
become a plasma flame, and is then injected into an argon stream (Andrefsky, 2010). The
emission spectrum is then analyzed to indicate the concentrations of elements present
(Andrefsky, 2010). The advantages rest in the high accuracy in determining the origin of silicates
and provide data on a large range of elemental compositions (Shugar, 2013). The disadvantages
are the difficulties with maintaining a consistent calibration, and the removal of a piece from the
artifact to fit inside the laser chamber (Shugar, 2013), although some of the new technology is
capable of overcoming the limitations of chamber size.
Atomic Absorption Spectroscopy involves crushing 1g of the sample, placing it into a
solution, and spraying this into a flame, which causes the compounds inside the specimen to
dissociate into their constituent atoms (Andrefsky, 2010). Andrefsky (2010) says a light is then
shown into the element’s wavelength; the amount of light the atoms absorb is calculated to
determine the concentration of each element. The advantages of Atomic Absorption
Spectroscopy are the easiness of use, the high precision, and the low cost; on the other hand, the

6
disadvantages are the large sample quantities and the analysis of only solutions (“Advantages
and Disadvantages of Atomic Absorption Spectrometry,” n.d.).
X-Ray Fluorescence Spectrometry consists of a beam of x-rays hitting the sample and
exciting the electrons into higher energy levels (Andrefsky, 2010) and can be accomplished in
benchtop laboratory or handheld models. After the electrons settle down, they emit secondary,
fluorescent x-rays, which have characteristic wavelengths of the element from which they came
from (Andrefsky, 2010). Measuring the x-rays at different wavelengths determines the
composition of the elements in the sample (Andrefsky, 2010). The laboratory X-Ray
Fluorescence Spectrometry instrument contains a chamber to fit a small sample inside and
provides more accuracy than the Handheld XRF based on its destructive technique (Guthrie and
Ferguson, 2017). The disadvantages of benchtop laboratory instruments “require the ideal
specimen to be polished flat or ground into a powder and fused” (Frahm, 2013). On the other
hand, the benefits of Handheld X-Ray Fluorescence Spectrometry include the non-destructive
technique, low equipment and analysis cost, rapid results, and in field analysis (Shugar, 2013).
The disadvantages of the Handheld X-Ray Fluorescence Spectrometry are that it requires an
understanding of X-ray physics, igneous petrology, calibration process, and testing a variety of
homogeneous reference materials (Shugar, 2013). By focusing on the advantages of the
Handheld XRF in allowing in field analysis and in the nondestructive technique, this study tests
the accuracy and validity of the Handheld XRF on small, irregularly shaped obsidian samples by
comparing it to a previous LA-ICP-MS analysis (Kovacevich et al., 2010).

7
History of X-Ray Fluorescence
The German physicist, Wilhelm K. Rontgen, discovered x-rays; Charles Barkla was the
first person in 1909 to find “a connection between x-rays radiating from a sample and the atomic
weight of the sample” (Shackley, 2011). To add, Henry Moseley created an x-ray tube in which
he blasted samples with high-energy electrons (Guthrie and Ferguson, 2017). In 1912, Moseley
identified a relationship between the element’s emitted x-ray frequency and its atomic number
(Guthrie and Ferguson, 2017). Because of this, entire periodic tables were based on an element’s
atomic number instead of its increasing atomic weight (Shackley, 2011). In 1925, Coaster and
Nishina excited a sample using x-rays, and Glocker and Schreiber in 1928 conducted a
quantitative analysis using X-ray fluorescence (Guthrie and Ferguson, 2017). Guthrie and
Ferguson (2017) describe the commercial availability of x-ray spectrometers in the 1950’s.
Today, devices like the Bruker Tracer III-V handheld instruments and an Elva-X benchtop
instrument are primarily used for the sourcing analysis regarding obsidian artifacts around the
world in the laboratory and in the field when samples cannot be exported from their country of
origin (Guthrie and Ferguson, 2017). For these reasons, this study using the Handheld XRF tests
the accuracy and validity of the instrument on small obsidian samples, which is beneficial to
researchers in the field using this technique on small samples.
Literature Review
Analysis of sourcing by Handheld XRF requires five parameters: the same energy in
KeV, the same current in μA, the same filter, the same duration of time, and the same
atmosphere (Drake, n.d.). All published studies using Handheld XRF use these parameters as
8
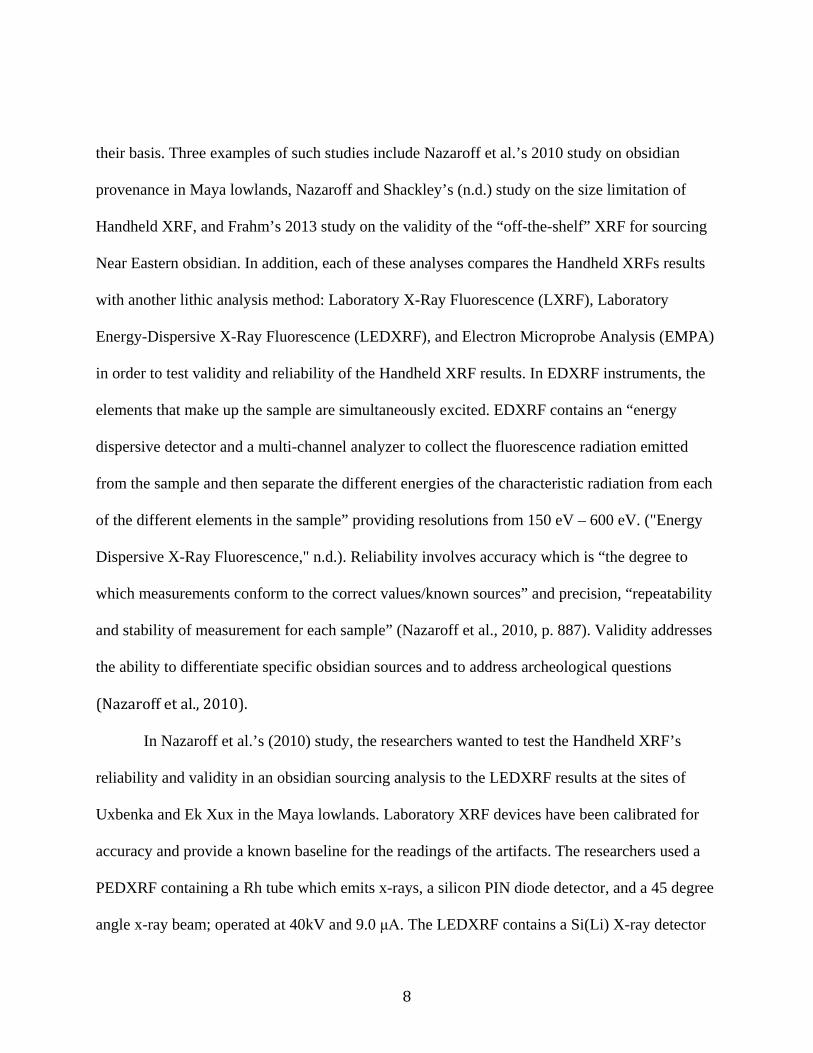
their basis. Three examples of such studies include Nazaroff et al.’s 2010 study on obsidian
provenance in Maya lowlands, Nazaroff and Shackley’s (n.d.) study on the size limitation of
Handheld XRF, and Frahm’s 2013 study on the validity of the “off-the-shelf” XRF for sourcing
Near Eastern obsidian. In addition, each of these analyses compares the Handheld XRFs results
with another lithic analysis method: Laboratory X-Ray Fluorescence (LXRF), Laboratory
Energy-Dispersive X-Ray Fluorescence (LEDXRF), and Electron Microprobe Analysis (EMPA)
in order to test validity and reliability of the Handheld XRF results. In EDXRF instruments, the
elements that make up the sample are simultaneously excited. EDXRF contains an “energy
dispersive detector and a multi-channel analyzer to collect the fluorescence radiation emitted
from the sample and then separate the different energies of the characteristic radiation from each
of the different elements in the sample” providing resolutions from 150 eV – 600 eV. ("Energy
Dispersive X-Ray Fluorescence," n.d.). Reliability involves accuracy which is “the degree to
which measurements conform to the correct values/known sources” and precision, “repeatability
and stability of measurement for each sample” (Nazaroff et al., 2010, p. 887). Validity addresses
the ability to differentiate specific obsidian sources and to address archeological questions
(Nazaroff et al., 2010).
In Nazaroff et al.’s (2010) study, the researchers wanted to test the Handheld XRF’s
reliability and validity in an obsidian sourcing analysis to the LEDXRF results at the sites of
Uxbenka and Ek Xux in the Maya lowlands. Laboratory XRF devices have been calibrated for
accuracy and provide a known baseline for the readings of the artifacts. The researchers used a
PEDXRF containing a Rh tube which emits x-rays, a silicon PIN diode detector, and a 45 degree
angle x-ray beam; operated at 40kV and 9.0 μA. The LEDXRF contains a Si(Li) X-ray detector

9
with a Rh x-ray target and uses a WinTrace 4.1 software; operated at 30kV for 200 live seconds
using a 0.05mm Pd beam filter to detect elements Ti-Th (Nazaroff et al., 2010). Nazaroff et al.
(2010) analyzed 56 samples (32 from Uxbenka and 24 from Ex Xux). In the Maya lowlands,
three Highland Guatemalan sources exist in obsidian assemblages from El Chayal, Ixtepeque,
and San Martin Jilotepeque; minor sources exist at San Bartolome Milpas Altas, Guatemala and
Pachuca, central Mexico (Nazaroff et al., 2010). The results showed that the Handheld XRF
could differentiate the obsidian sources from El Chayal, Ixtepeque, and Pachuca. Regarding
reliability, precise results were generated when the researchers used a known sample to ensure
consistency of the readings in the instrument over a period of six analyses with minor
fluctuations of Fe, Rf, Sr, Zr, and Nb (Nazaroff et al, 2010). On the other hand, Nazaroff et al.
(2010) found the Handheld XRF instrument is not statistically accurate for each element within
each obsidian geochemical group regarding the two-sample t-test results when compared to the
LXRF instrument. The differences exist “at the 95% confidence level in FE, Rb, Sr, Zr, and NB
concentrations for the El Chayal group and in the Rb and Zr for Ixtepeque group” (Nazaroff et al,
2010, p. 893). The differences between the data from Handheld XRF and LXRF show that the
Handheld XRF causes systematic error. By using the k-means cluster analysis, this error can be
corrected (Nazaroff et al., 2010). With correction, the analysis showed Handheld XRF’s validity
in being able to distinguish different obsidian sources at Ixtepeque, El Chayal, and the Pachuca,
and highlighting the interactions of regional trade in southern Belize (Nazaroff et al., 2010).
In Nazaroff and Shackley’s (n.d.) study, the researchers wished to test the validity and
reliability of Handheld XRFs in finding the minimum size needed for obsidian provenance
studies. After collecting fifteen large obsidian marekenites (eroded nodules of unhydrated

10
obsidian) at Antelope Creek, Nazaroff and Shackley knapped the fifteen samples (as a control
group) and created seventy-eight samples ranging in smaller sizes for further analysis. The
researchers used the Bruker AXS Tracer 3-V Portable EDXRF analyzer composed of a Rhodium
tube where x-rays are emitted at a 45 degree angle, silicon PIN diode detector operating at
40keV and 9.0μA, for 300 seconds using a filter made of 6 mil copper, 1 mil titanium, and 12
mil aluminum (Nazaroff and Shackley, n.d.). To get the best readings, Nazaroff and Shackley
(n.d.) analyzed the smoothest obsidian surface, and the Bruker was placed in a holder to form a
standardized distance for analysis. In addition, seventeen obsidian samples of trace-element
concentrations from previous laboratory EDXRF analysis were used to calibrate this instrument;
an “obsidian sample of known geochemistry was run everyday to ensure instrument stability”
(Nazaroff and Shackley, n.d., p. 5). Nazaroff and Shackley (n.d.) conducted the analysis at the
Kα1-line for Sn, Mg, Fe, Rb Zn, Y,Nb,Ba, Sr and Zr; the majority of mid-Z elements’ elemental
concentrations were standardized between 8-10mm in length and 10mm in width. They found
that the minimum sample size that can be analyzed using the Handheld XRF is between 8-10mm.
As in their study, this analysis uses very small obsidian samples ranging in the lengths from
6.6mm-26.0mm, widths from 5.3mm to 17.1mm, and thicknesses from 1.6mm-5.3mm to see if
the Handheld XRF is an accurate and valid instrument for sourcing analyses on small obsidian
sizes.
Lastly, Frahm’s (2013) study revolves around the validity of “off-the-shelf” XRF (as
opposed to the Handheld XRF) in Near Eastern obsidian sourcing analysis. “Off-the-shelf” refers
to the lack of the ability of the researcher to calibrate the instrument or change factory settings in
order to accommodate challenges posed by archaeological samples and conditions differing from

11
industrial settings such as engineering in which these devices are normally used. Frahm describes
the main concerns with off-the-shelf XRF: “low accuracy and precision, data correction schemes
and instrument calibration, and ignorance of fundamental XRF problems (minimum size limits
and surface morphology effects)” (2013, p. 1080). However, the researcher didn’t adhere too
closely to these concerns in order to test their impact on accuracy and validity. Frahm (2013)
used sub-optimal conditions: simple data correction plan, the default soil calibration mode, and
small obsidian debitage near or below the minimum size need in a off-the-shelf XRF’s analysis.
He used an off-the-shelf XRF and compared the results to the EMPA analysis to test for validity.
Frahm (2013) used a Thermo Scientific NITON XLt analyzer made of a 40Kv tube with Ag
anode target and the 20mm detector window composed of a Si-PiN diode; whereas the EMPA
analysis used a JEOL JXA-8900 SuperProbe. The researcher measured the samples for 300
seconds. The results showed that 47 out of 50 sources have the same sample sources between the
off-the-shelf XRF and the EMPA making the success rate between 94-100% (Frahm, 2013). This
shows the off-the-shelf XRF can be a valid instrument in assigning the artifacts to specific
sources, although quantitative measurements may not be as accurate in comparison with EMPA.
Site Location and the LA-ICP-MS Analysis
Since obsidian has distinct characteristics of trace elements based on its unique
formation, sourcing analysis allows obsidian artifacts to be matched to known sources of
obsidian. Major obsidian sources in the Maya region occur at El Chayal, Ixtepeque, and San
Martin Jilotepeque. Obsidian found at certain archeological sites can help the researchers
understand the trade and exchange of material artifacts, document the migrations of people, and

12
understand the tool production process (Shugar and Mass, 2012). For this reason, the site and
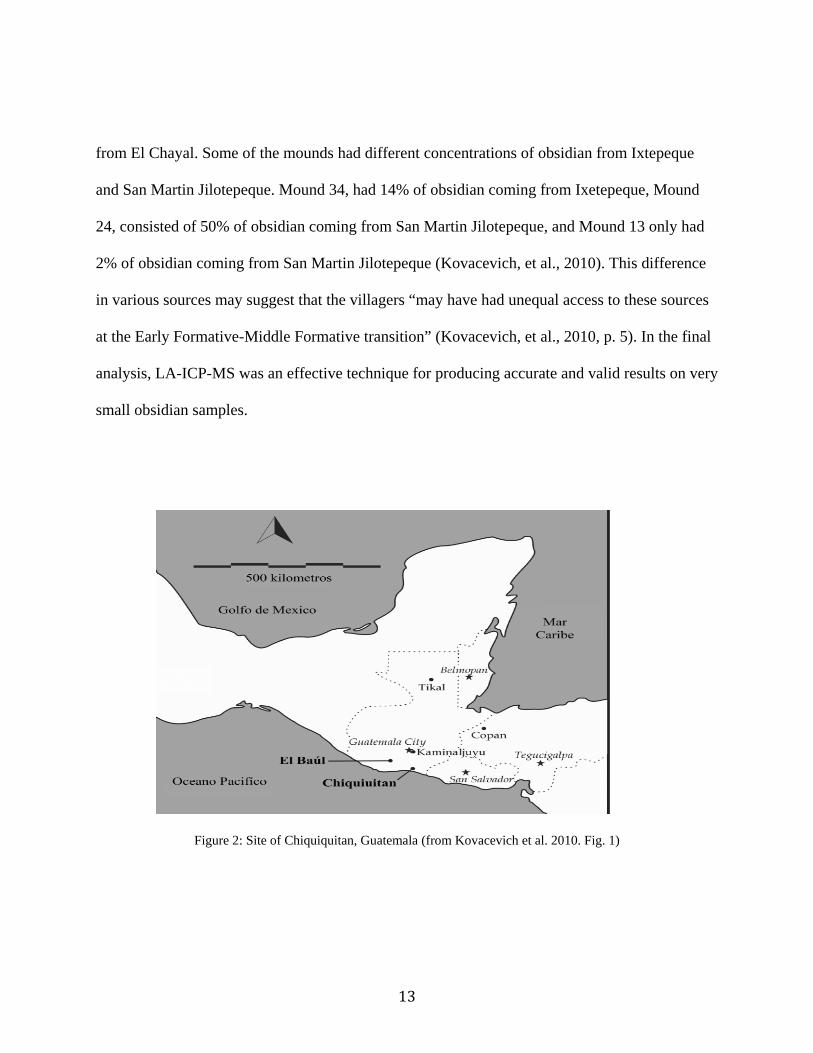
region of focus for this study is the early Mesoamerican site of Chiquiuitan. Dating to the Early
and Middle Formative era, Chiquiuitan is located one kilometer off the Pacific coast of
Guatemala (Kovacevich, et al., 2010). Proyecto Arqueologico Chiquiuitan field supervisors,
Molly Morgan and Judith Valle, led the excavations examining the domestic contexts at four
residential mounds (Kovacevich, et al., 2010). After screening the dirt floors, the archaeologists
found refuse along with 38 small obsidian flakes. Part of the research questions included the
determination of access to exotic resources and changes in trade routes through time. For this
reason, the investigators carried out sourcing analysis of obsidian artifacts. The technique of
Inductively Coupled Plasma Mass Spectrometry with a Laser Ablation introduction system (LA-
ICP-MS) was used especially to test its efficiency on small obsidian samples, as many of the
flakes and fragments were too small for traditional analysis with other instruments. This
technique is very similar to the ICP technique discussed above, but the use of the laser allows
researchers to target very small samples.
The researchers analyzed 63 samples from Chiquiuitan ranging from 2cm to 1.0mm,
which were placed into slides that were inserted into the LA chamber (Kovacevich, et al., 2010).
To detect the various chemical compositions, the LA-ICP-MS gathered the averages of counts
taken at various atomic masses in five integrations; Si was used as the standard for the
calibration (Kovacevich, et al., 2010). In addition, certain elements in obsidian play a role in
detecting obsidian from various sources. Kovacevich et al. (2010) focused on the elements As
and Cs as discriminators in the samples; these elements showed three obsidian source groups
from El Chayal, Ixtepeque, and San Martin Jilotepeque. 57 of the 63 obsidian samples came
13
from El Chayal. Some of the mounds had different concentrations of obsidian from Ixtepeque
and San Martin Jilotepeque. Mound 34, had 14% of obsidian coming from Ixetepeque, Mound
24, consisted of 50% of obsidian coming from San Martin Jilotepeque, and Mound 13 only had
2% of obsidian coming from San Martin Jilotepeque (Kovacevich, et al., 2010). This difference
in various sources may suggest that the villagers “may have had unequal access to these sources
at the Early Formative-Middle Formative transition” (Kovacevich, et al., 2010, p. 5). In the final
analysis, LA-ICP-MS was an effective technique for producing accurate and valid results on very
small obsidian samples.
Figure 2: Site of Chiquiquitan, Guatemala (from Kovacevich et al. 2010. Fig. 1)

14
Research Purpose
The purpose of this research is to analyze obsidian artifacts from Chiquiuitan, Guatemala
to see if these same samples from the LA-ICP-MS analysis can be traced to known obsidian
sources in the Maya region based on their distinct chemical elements using the Handheld XRF.
In addition, this study tests the accuracy and validity of the Handheld XRF on small samples by
comparing them to the LA-ICP-MS data collected by Kovacevich and colleagues (2010).
Because fewer than twenty-four obsidian provenance studies have been published using
Handheld XRFs, this study provides more information on obsidian sourcing using this method
(Frahm, 2013). This study can highlight the trade and exchange of obsidian artifacts, document
migrations of people, and add to the understanding of tool production processes (Shugar and
Mass, 2012).
Current issues using the Handheld XRF center on the minimum sample size needed and
small obsidian samples can be hard to analyze accurately. In addition, the morphology of the
artifact affects the accuracy of the data. Specifically, “surface irregularities can introduce
additional error into the measurements” (Frahm, 2013, p. 1083). For this reason, the ideal
specimen to analyze consists of a flat surface large enough to cover the Handheld XRF’s detector
window (Frahm, 2013).
Furthermore, thickness of the sample can play a role in the analysis of the study. Drake
(2014) states “elements that fluoresce with low energy, such as silica at 1.7 keV, will only return
photons from 20 μm deep into a SiO2 matrix, while elements that fluoresce at higher energies,
such as Zirconium at 15.77 keV, will return photons from as deep as 3.4 mm.” This means that
heavier elements that fluoresce at higher energies penetrate more deeply and are detected more

15
easily than elements that fluoresce at lower energies and penetrate less deeply (Drake, 2014). For
this reason, the minimum thickness for each sample is 2mm or greater (Frahm, 2013). Frahm
(2013) hypothesized that the thickness of the sample may impact photon readings, and therefore
parts per million readings for specific elements, but that it may not impact assignation to a
specific source. This research attempts to replicate those findings.
Frahm (2013)’s study tested the accuracy and validity of the PXRF on small, irregular
obsidian debitage (flaking debris or other non-diagnostic fragments) at the Tell Mozan. Most of
the artifacts were less than 20mm. His study resulted in 47 of the 50 artifacts matching the same
source assignment between the off-the-shelf XRF and the EMPA; making the “success rate 94%
with valid source patterns with statistically significant samples” (Frahm, 2013, p. 1086). Like
Frahm, this study analyzes 20 small obsidian samples but the researcher uses the Handheld XRF
instead of the off-the-shelf XRF and compares the results with the LA-ICP-MS data to evaluate
the accuracy and validity of this instrument in this obsidian provenance study. This study differs
from Frahm (2013) in that the researcher uses a Handheld XRF instrument that is calibrated and
controlled by the researcher and produces more accurate results than off-the-shelf models.
Methodology
The researcher used the same methodology and parameters that Dawn Crawford and
Brigitte Kovacevich used in their Handheld XRF obsidian analysis at Holtun, Petén, Guatemala
(Crawford and Kovacevich, 2016). To avoid contamination, gloves were worn. The artifacts
were washed in water and a section of the obsidian was wiped using a dry wipe (Crawford and
Kovacevich, 2016). The researcher measured the maximum flake length, the maximum flake

16
width, and the maximum flake thickness using electronic calipers measured in mm. “The
maximum flake length is measured to the distal end of the flake as a line perpendicular to the
flake length at the most remote point on the distal end,” while the maximum flake length
measures a “a straight line distance perpendicular to the flake length line” intersecting the flake
at the widest point. (Andrefsky, 2010, p.97). Lastly, the maximum flake thickness measures the
distance form the dorsal side to the ventral side of the flake which is perpendicular to the flake
length line (Andrefsky, 2010). After taking the three measurements of each sample, the
researcher then measured the obsidian flakes on a scale measured in grams.
The researcher used the Bruker Tracer III SD owned by University of Central Florida.
The Handheld XRF was set to the heavy element mode (to 40 KeV, 25μA) using a green filter to
detect elements K, CA, Ti, Mn, Fe, Zn, Rb, Sr, Zr, and Nb (Crawford and Kovacevich, 2016).
On each sample, the flattest surface was analyzed for 90 seconds. To test the accuracy and
precision of the Handheld XRF, each day the researcher used a check standard for the obsidian
samples (Crawford and Kovacevich, 2016). The check standard used the U.S. Geological Survey
Rhyolite, glass mountain RGM-2. Also, the calibration of the instrument included the University
of Missouri Research Reactor Center (MURR) data of known obsidian sources. Furthermore, the
use of the cluster analysis converted the Handheld XRF data into parts per million (ppm) through
the statistical program JMP and assigned specific sources to the samples.

17
Figure 3: Handheld XRF Bruker Tracer III SD of University of Central Florida (Fertig, 2018)

18
CHAPTER THREE: RESULTS
The measurements and weights of the twenty obsidian samples are presented in Table 1.1
The calibration of the instrument used the University of Missouri Research Reactor Center
(MURR) data of known obsidian sources. The cluster analysis converted the Handheld XRF data
into parts per million (ppm). Based off of the Handheld XRF analysis and using the MURR data
sets, clusters were created around known ppm data for El Chayal, San Martín Jilotepeque, and
Ixtepeque (D. Crawford personal communication). Most of the obsidian analyzed fit within El
Chayal and some fit within the range of San Martín Jilotepeque and Ixtepeque. Specifically,
fourteen of the twenty obsidian samples fit within the range of El Chayal. Three of the twenty
obsidian samples fit within the range of San Martin Jilotepeque, while the other three of the
twenty obsidian samples fit within the range of Ixtepeque.
These clusters were formed using the elements: Fe, Zr, and Rb. Also, X by Y plots were
made for the Fe by Rb and Zr by Rb in order to form these clusters. The obsidian sample was
assigned a source based on the known sources. The X by Y plots contained all the obsidian
analyzed and had no outliers.
1 In the earlier study of the LA-ICP-MS analysis the samples CHI6-2-7_01 and CHI6-2-7-_02
represented one sample, but when the researcher acquired the artifacts the two pieces were
broken. Furthermore, a mislabeling of two samples occurred: CHI6-1-3_01a and CHI6-1-3-_01b.
At a later time, the two samples will be revisited and reshot to check the photon counts to
correctly label them.

19
In the first Fe by Rb plot, one outlier was outside the Ixtepeque cluster and two outliers
were outside the El Chayal cluster, but in the Zr by Rb plot these outliers fell within the
Ixtepeque and El Chayal clusters. The Ixtepeque outlier was CHI6-2-4_01 (thickness of 5.3mm)
while the El Chayal outliers in the Fe plot were CHI6-2-1_01 (thickness of 1.7mm) and CHI7-4-
2_01 (thickness 2.1mm). Their range of thicknesses for the outliers means that thickness may not
be the reason they were outliners, but it is remotely possible. Also, in the X by Y plots one
sample looks like an outlier to the right and above the El Chayal cluster, but it falls within a
linear relationship to El Chayal. For this reason, this obsidian was considered part of the El
Chayal cluster.
When compared to the LA-ICP-MS data collected by Kovacevich, each of the sources
from the Handheld XRF resulted in the same source origin as the LA-ICP-MS analysis on these
obsidian samples. For this reason, the Handheld XRF is an accurate instrument for assigning the
artifacts to specific sources. Regardless of the correct source assignation, the small, irregular
shaped obsidian samples can affect the validity of the Handheld XRF instrument. Although the
instrument assigned the obsidian samples to the known obsidian sources, the thickness of the
samples could affect the results in terms of photon counts and parts per million readings. Heavier
elements that fluoresce at higher energies penetrate more deeply and are detected more easily
than elements that fluoresce at lower energies and penetrate less deeply (Drake, 2014). During
the cluster analysis, San Bartolome Milpas Altas and San Martin were very close to each other,
which could make it more difficult to tell the difference between the two sources.

20
Table 1 Results Presented by sample number, length, width, thickness, weight, and assigned source.
Sample
Maximum
Length (mm)
Maximum
Width (mm)
Maximum Thickness
(mm)
Weight
(g)
Assigned Source
CHI4-1-7_01 26.0 11.5 4.3 1.3 SMJ CHI6-1-2_01 23.1 10.0 2.3 0.6 EC CHI6-1-3_01a 17.0 15.2 4.4 1.2 EC CHI6-1-3_02 12.9 8.9 3.4 0.4 EC CHI6-1-3_01b 10.2 6.5 1.6 0.2 EC CHI6-2-1_01 12.0 8.0 1.7 0.1 EC CHI6-2-2_01 11.6 5.3 3.3 0.2 EC CHI6-2-4_01 20.9 5.7 5.3 0.7 IX CHI6-2-7_01 10.7 8.6 2.6 0.3 IX CHI6-2-7_02 6.6 5.7 2.0 0.1 IX CHI6-2-8_01 19.2 13.1 2.8 0.6 EC
CHI7-1-2E_01 25.2 11.7 5.3 1.6 EC CHI7-2-9_01 25.9 12.1 3.1 1.1 EC CHI7-4-2_01 17.5 7.8 2.1 0.2 EC
CHI7-4-2A_01 10.3 8.4 5.3 0.4 EC CHI7-4-5_01 15.6 8.6 3.3 0.4 EC CHI7-5-2_01 21.8 17.1 4.5 1.3 EC CHI7-5-4_01 18.5 11.1 3.0 0.8 SMJ CHI7-5-8_01 12.6 6.6 3.1 0.4 EC
CHI8-22-201_01 22.2 12.6 4.1 1.1 SMJ

21
Figure 4 Caliper used to measure each obsidian sample (Fertig, 2018)
Figure 5 scale used to measure the obsidian samples (Fertig, 2018)

22
Figure 6 Handheld XRF setup (Fertig, 2018)
Figure 7 S1PXRF program listing the elements in one sample (Fertig, 2018)

23
Figure 8 Total Sample Size: twenty obsidian samples (Fertig, 2018)
Figure 9 irregular shaped obsidian (Fertig, 2018)

24
Figure 10 smallest obsidian piece (Fertig, 2018)
Figure 11 irregular shaped obsidian (Fertig, 2018)

25
Figure 12 Bivaraite Fit of FeKa1 By RbKa1 (Crawford, 2018)
+ symbol indicates known obsidian sources from MURR Data sets. Blue indicates San Martin
Jilotepeque. Purple indicates San Bartolomé Milpas Altas. Green indicates El Chayal.
Red indicates Ixtepeque.

26
Figure 13 Bivariate Fit of ZrKa1 By RbKa1 (Crawford, 2018)
+ symbol indicates known obsidian sources from MURR Data sets.
Blue indicates San Martin Jilotepeque. Purple indicates San Bartolomé Milpas Altas.
Green indicates El Chayal. Red indicates Ixtepeque

27
CHAPTER FOUR: CONCLUSION
Obsidian souring analysis allows the researchers to recognize the elemental compositions
of obsidian and to assign obsidian artifacts to known sources. Specifically, the Maya region of
Mesoamerica has primary obsidian sources at El Chayal, Ixtepeque, and San Martin Jilotepeque
and a secondary source at San Bartolome Milpas Altas. This study analyzed twenty obsidian
artifacts from Chiquiuitan, Guatemala, sourced them to known obsidian sources in the Maya
region based on their unique chemical elements. In addition, this study intended to determine the
accuracy and validity of the Handheld XRF technology on small, irregular shaped obsidian
samples by comparing the results to the LA-ICP-MS data collected by Dr. Brigitte Kovacevich.
The maximum lengths ranged from 6.6mm to 26.0 mm, the maximum widths ranged from
5.3mm to 17.1mm, and the maximum thicknesses ranged from 1.6mm to 5.3mm. This study
resulted in sourcing the obsidian artifacts to obsidian sources at El Chayal, Ixtepeque, and San
Martin Jilotepeque. Out of the twenty samples, fourteen came from El Chayal, three came from
San Martin Jilotepeque, and the other three came from Ixtepeque. Each of the sources from the
Handheld XRF resulted in the same source origin as the LA-ICP-MS analysis. The Handheld
instrument is an accurate instrument for assigning sources. Regarding validity, the instrument
was able to source the obsidian samples to major sources and differentiate the sources from each
other. Even if parts per million measurements were not completely accurate when compared with
other techniques, Handheld XRF analysis still allows small pieces of obsidian to be sourced
accurately in the field and in the laboratory. For example, when small obsidian artifacts are
found embedded in household floors, researchers will be able to source them using the Handheld

28
XRF. These small fragments often represent primary deposition contexts, instead of secondary
deposition contexts like middens and fill where obsidian artifacts are usually found that can be
mixed and provide unclear contexts. Knowing that researchers can quickly and accurately assign
sources to these valuable artifacts can help to further guide research strategy and make
interpretations at a higher level. Directions for future research include, more studies with larger
sample sizes of smaller and/or irregular shaped obsidian artifacts to continue to test the accuracy
and validity of the Handheld XRF, as well as comparisons of parts per million readings of
elements between techniques.
29
WORKS CITED
Advantages and Disadvantages of Atomic Absorption Spectrometry and Graphite Furnace-Chemistry Net. (2016, April 18). Retrieved October 15, 2017, from http://chem-net.blogspot.com/2013/12/advantages-disadvantages-atomic-absorption-graphite-furnace.html
Andrefsky, W. (2010). Lithic raw materials. In D. Brothwell, G. Barker. D. Dincauze. & P.
Renouf (Eds.), Lithics: macroscopic approaches to analysis (42-44, 97-100). Cambridge: Cambridge Univ. Press.
Caliper used to measure each obsidian sample [Personal photograph taken in Chemistry Building
at University of Central Florida]. (2018, March 6). Crawford, Dawn (2018). Chiquiuitan Stats Methods [Methods]. Crawford, D. (2018, March 24). Bivariate Fit of FeKa1 By RbKa1 [Digital image]. Retrieved
March 25, 2018. Crawford, D. (2018, March 24). Bivariate Fit of ZrKa1 By RbKa1 [Digital image]. Retrieved
March 25, 2018. Crawford, Dawn and Kovacevich, Brigitte 2016. Preliminary Obsidian Analysis for the site of
Holtun, Petén, Guatemala. Poster presented at the 81st Annual Meeting of the Society for American Archaeology in Orlando, FL, April 9, 2014
Drake, L. (2014). XRF User Guide. Retrieved April 05, 2018, from http://www.xrf.guru/styled-
12/page40/index.html Drake, L. (n.d.). XRF User Guide-XRF Physics Tutorial. Retrieved October 16, 2017, from
http://www.xrf.guru/styled-2/page64/index.html Energy Dispersive X-Ray Fluorescence (EDXRF). (n.d.). Retrieved November 08, 2017, from
https://www.xos.com/EDXRF Frahm, E. (2013). Validity of “off-the-shelf” handheld portable XRF for sourcing Near Eastern
obsidian chip debris. Journal of Archaeological Science, 40(2), 1080-1092. doi:10.1016/j.jas.2012.06.038
Guthrie, J. M., & Ferguson, J. R. (2017, June 2). Overview of X-ray Fluorescence. Retrieved
October 12, 2017, from http://archaeometry.missouri.edu/xrf_overview.html Handheld XRF Bruker Tracer III SD of University of Central Florida [Personal photograph taken
in Chemistry Building at University of Central Florida]. (2018, February 22).

30
Handheld XRF setup [Personal photograph taken in Chemistry Building at the University of
Central Florida]. (2018, February 22). Irregular shaped obsidian [Personal photograph taken in Chemistry Building at the University of
Central Florida]. (2018, February 22). Kovacevich, B. (2006). Reconstruction Classic Maya Economic Systems: Production and
Exchange at Cancuen, Guatemala (unpublished doctoral dissertation). Vanderbilt University, Nashville.
Kovacevich, Brigitte, Molly Morgan, Hector Neff, and Oswaldo Chinchilla 2010. The Use
of Laser Ablation Inductively Coupled Plasma Mass Spectrometry (LA-ICP MS) on Obsidian Microdebitage: Case Studies from Chiquiuitan and El Baúl, Guatemala. Society for Archaeological Sciences Bulletin 33(1): 2-6.
Nazaroff, A. J., Prufer, K. M., & Drake, B. L. (2010). Assessing the applicability of portable X-
ray fluorescence spectrometry for obsidian provenance research in the Maya lowlands. Journal of Archaeological Science, 37(4), 885-895. Retrieved October 8, 2017, from http://www.sciencedirect.com/science/article/pii/S0305440309004373
Nazaroff, A., & Shackley, S. (n.d.). Testing the Size Dimension Limitation of Portable XRF
Instrumentation for Obsidian Provenance. Lecture presented at Poster presented at the Geological Society of American Annual Meeting in Oregon , Portland.
Scale used to measure the obsidian samples [Personal photograph taken in Chemistry Building at
the University of Central Florida]. (2018, March 6). Shugar, A. N., & Mass, J. L. (2013). Ch. 12 X-Ray fluorescence of obsidian: approaches to
calibration and the analysis of small samples. In A. N. Shugar., & J.L. Mass (Eds.), Studies in Archaeological Sciences: Handheld XRF for Art and Archaeology (401-422). Leuven: Leuven University Press.
Smallest obsidian piece [Personal photograph taken in Chemistry Building at the University of
Central Florida]. (2018, February 22). S1PXRF program listing the elements in one sample [Personal photograph taken in Chemistry
Building at the University of Central Florida]. (2018, March 6). Total Sample Size: twenty obsidian samples [Personal photograph taken in Chemistry Building
at the University of Central Florida]. (2018, February 22). Taube, Karl A. "Obsidian polyhedral cores and prismatic blades in the writing and art of ancient
Mexico." Ancient Mesoamerica 2.1 (1991): 61-70.

31
Whittaker, J. C. (2009). Flintknapping: making and understanding stone tools. Austin:
University of Texas Press.