Embed Size (px)
Citation preview

Obstructive Sleep Apnea Risk in Abdominal Aortic Aneurysm Disease Patients:
Associations with Physical Activity Status, Metabolic Syndrome, and Exercise Tolerance
Jessica Erin Mabry
Dissertation submitted to the faculty of the Virginia Polytechnic Institute and State University
in partial fulfillment of the requirements for the degree of
Doctor of Philosophy
In
Human Nutrition, Foods, and Exercise
William G. Herbert, Committee Chair
Jonathan N. Myers
Kathryn W. Hosig
Richard J. Hanowski
Donald Zedalis
John M. Gregg
Jay H. Williams
Matthew W. Hulver
March 21, 2013
Blacksburg, VA
Keywords: Obstructive sleep apnea, elderly, abdominal aortic aneurysm disease, physical
activity, metabolic syndrome, exercise capacity

Obstructive Sleep Apnea Risk in Abdominal Aortic Aneurysm Disease Patients:
Associations with Physical Activity Status, Metabolic Syndrome, and Exercise Tolerance
Jessica Erin Mabry
ABSTRACT
Obstructive sleep apnea (OSA) is common in older U.S. adults and the prevalence is
anticipated to rise in this age group along with obesity, a prominent risk factor for OSA.
Recently, OSA was determined to be highly prevalent among patients with abdominal aortic
aneurysm (AAA) disease. Objectives: Examine associations between OSA risk and
physical activity (PA), metabolic syndrome (MetSyn), and exercise responses to
cardiopulmonary exercise testing (CPET) in elderly patients with AAA disease. Methods:
Elderly patients (n=326 for Studies 1 and 2; n=114 for Study 3) newly diagnosed with small
AAAs (aortic diameter ≥2.5 and < 5.5 cm) were recruited. Data collection for all
participants included: extraction of medical history and drug information from medical
records; completion of a physical examination to assess resting vital signs and
anthropometrics; fasting blood draw for several biochemical analyses; completion of a
cardiopulmonary exercise test (CPET); and completion of interviews and questionnaires for
health history, PA, and OSA risk. Results: 57% of subjects were High-risk for OSA and
17% were classified in the highest-risk Berlin Risk Score (BRS) 3 group; these subjects
reported fewer blocks walked/day, flights of stairs climbed/day, and expended fewer
Calories when engaged in these activities compared to Low-risk counterparts, independent
of obesity. Among those at High-risk for OSA, 45% had MetSyn. Subjects with the highest
BRS also had the highest prevalence of MetSyn and values for the MetSyn component
biomarkers. Exercise capacity and physiological responses at rest, during exercise, and
recovery were similar between groups at High- and Low-risk for OSA. Conclusions:
Reduced levels of PA among elderly AAA patients at High-risk for OSA could have
unfavorable implications for cardiovascular disease (CVD) risk and all-cause and CVD
mortality. Subjects demonstrating the most clinical symptoms of OSA showed a
significantly higher prevalence for MetSyn and several of the biomarkers that determine
MetSyn. In clinical practice, the BRS may be useful for identifying those AAA patients at
increased risk for both OSA and MetSyn.

iii
ACKNOWLEDGEMENTS
The support and encouragement of many people have helped me to achieve my academic
and professional goals. My family, most notably my mother and father, has always supported me
and my decisions regarding my academic and professional endeavors. They have been a source
of constant encouragement.
The guidance and mentoring of Dr. Bill Herbert has been truly valuable. I could not have
asked for a better academic advisor to support me throughout my graduate career. His confidence
and support has been a treasure. I respect him as a friend, mentor, and colleague and look forward
to continued collaboration in the future.
I also greatly appreciate the members of my dissertation committee whose expertise and
support has enriched my academic and research experiences. Dr. Myers provided me with a
unique and rich dataset which to work with and crucial expertise in the area of clinical
physiology. Dr. Hosig’s expertise in community health has enriched my project immensely. Dr.
Hanowski’s support and understanding as both my professional Director at VTTI and a
committee member has been greatly appreciated. Dr. Zedalis and Dr. Gregg have provided
crucial expertise and guidance in the area of sleep apnea. The contributions of Dr. Williams and
Dr. Hulver were critical to this project and their support is greatly appreciated.

iv
TABLE OF CONTENTS
ACKNOWLEDGEMENTS….…………………..………….…………………………………….iii
TABLE OF CONTENTS…………………………………...…….……………………………….iv
TABLE OF TABLES……………..…………………….………………………………………....vi
TABLE OF FIGURES…………….……………………………………….………………..……vii
CHAPTER ONE………………………………………………………..…………...……………..1
INTRODUCTION……………….………………………………….……………………..1
LITERATURE REVIEW…………….…………………………………………………….4
RESEARCH AIMS……………………………………………………………...………...25
METHODS…………………………………………………………………………….…..26
DELIMITATIONS AND LIMITATIONS…………………………………..…………..32
DEFINITIONS………………………………………...…………………………………..35
ABBREVIATIONS OF TERMS…………………………...…………………………….38
REFERENCES…………...……………………………………………………………..…40
CHAPTER TWO………………………………………………………………………………….54
ABSTRACT…………………….………………………………………………………….54
INTRODUCTION …………………………………………………………………...……56
OBJECTIVES……………………………………………………………………………..59
METHODS………………………………………………………………………………...60
RESULTS……………………………………………………………………….…………63
DISCUSSION……………………………………………………………………….……..76
REFERENCES…………………………………………………………...………………..85
CHAPTER 3……………………………………...……………………………………………….91
ABSTRACT………………………………………………………………………………..91
INTRODUCTION…………………………………………………………………………93
OBJECTIVES.………………………………………………………………………….…96
METHODS.………………………………………………………………………………..97
RESULTS.………………………………………………………………………………..100
DISCUSSION.……………………………………………………………………………104
TABLES……………………………………………………………………………..……114
REFERENCES………….………………………………………………………..………130
CHAPTER FOUR……………………………………………………………………………...136
ABSTRACT……………………………………………………………………………..136
INTRODUCTION………………………………………………………………………137
RESEARCH AIM AND HYPOTHESIS……………………………………………….143
METHODS……………………………………………………………………….………143
RESULTS……………………………………………………………….………………..147
DISCUSSION………………………………………………………………………....….162

v
REFERENCES…………………………………………………………………...……....166
CHAPTER FIVE………………………………………………………………………………...175
SUMMARY AND RECOMMENDATIONS………………………………………..…175
CLINICAL IMPLICATIONS………………………………………………………..…179
RECOMMENDATIONS FOR FUTURE RESEARCH……………………….……...180
REFERENCES……………………………………………...……………………………182 APPENDIX A………………………………………………………………………………….....186
DETAILED METHODOLOGY………………………………………...……………...186
APPENDIX B……………………………………………………………………………………...195
INSTITUTIONAL REVIEW BOARD APPROVAL…………………………...………195
APPENDIX C……………………………………………………………………………………198
DATA COLLECTION QUESTIONNAIRES……………………………………...….198
APPENDIX D………………………………………………………………………………….…205
ADDITIONAL DATA TABLES………………………………………………………..205
Chapters 2 and 3 Additional Data Tables……………………………………...206
Chapter 4 Additional Data Tables……………………………….……………..210
APPENDIX E…………………………………………………………………………………….211
RAW DATA………………………………………………………………...……………211
Chapters 2 and 3 Raw Data………………………………………………..……212
Chapter 4 Raw Data………………………………………………………..........246
APPENDIX F………………………………………………………………………………..……255
STATISTICAL OUTPUT TABLES……………………………………………………255
Chapters 2 and 3 Statistical Output Tables……………………………….……256
Chapter 4 Statistical Output Tables……………………………………….........264
REFERENCES…………………………………………………………………………………...276

vi
TABLE OF TABLES
CHAPTER ONE Table 1. Common Definitions and Criteria of the Metabolic Syndrome……..…………….17
CHAPTER TWO Table 1. Subject Characteristics by Clinical Berlin OSA Risk………………..…………....65
Table 2. Subject Characteristics by Berlin Risk Score…………………...............................68
Table 3. Physical Activity by Clinical Berlin Risk…………………....................................72
Table 4. Physical Activity by Berlin Risk Score…………………........................................74
CHAPTER THREE Table 1. NCEP ATP III Clinical Identification of the Metabolic Syndrome…………..….114
Table 2. Subject Characteristics and Cardio-metabolic Risk Factors…………………......115
Table 3. Prevalence of Metsyn Components and MetSyn Among SubjectS……...……....116
Table 4. Subject Characteristics and Cardiovascular and Metabolic Biomarkers by BQ
OSA-Risk…………………………………………………………………….….117
Table 5. MetSyn Components and Status by BQ OSA-Risk…………………………..….120 Table 6. Cardiovascular and Metabolic Biomarkers by Berlin Risk Score…………...…...121
Table 7. MetSyn Components and Status by Berlin Risk Score…………………..………124
CHAPTER FOUR Table 1. Subject Characteristics by OSA-Risk……………………………………..……..148
Table 2. Subject Characteristics by Berlin Risk Score…………………………………….150
Table 3. CPET Variables by Clinical Berlin OSA-Risk………………..…………………152
Table 4. CPET Variables by Berlin Risk Score……………………………………..…….157
APPENDIX A Table 1. NCEP ATP III Clinical Identification of the Metabolic Syndrome…………..….193
APPENDIX D Table 1. Subject Characteristics and by Gender…………………………………………...206
Table 2. OSA Risk Classification by Gender………………………...………....................207
Table 3. Additional Cardio-metabolic Risk Factors by Gender………………………...…208
Table 4. Prevalence of MetSyn Components and MetSyn Among Subjects and by
Gender………………………………....................................................................209
Table 5. Subject Characteristics and by Gender………………………………...…………210 APPENDIX E
Table 1. Subject Characteristics…………………………………..……………………….213
Table 2. Indices of Physical Activity from Veterans Affairs Physical Activity
Questionnaire……………………………………………………………..……...224
Table 3. Cardiovascular and Metabolic Biomarkers………………………………..……..235
Table 4. Subject Characteristics………………………………………………………..….247
Table 5. Cardiopulmonary Exercise Test Variables at Rest, Ventilatory Threshold, Peak
Exercise, and Recovery…………………………………………………...……...251

vii
APPENDIX F Table 1. Independent Samples Test for Subject Characteristics and VAPAQ by Clinical
Berlin OSA Risk………………………………………………………………....257
Table 2. Analysis of Variance for Subject Characteristics and VAPAQ by Berlin Risk
Score………………………………………………………………………...……258
Table 3. Bonferroni Post Hoc Test for Subject Characteristics and VAPAQ by Berlin Risk
Score………………………………………………………………...……………259
Table 4. Independent Samples Test for Cardiovascular and Metabolic Biomarkers by
Clinical Berlin OSA Risk……………………………………………………..….261
Table 5. Analysis of Variance for Cardiovascular and Metabolic Biomarkers by Berlin
Risk Score…………………………………………………..……………………262
Table 6. Bonferroni Post Hoc Test for Cardiovascular and Metabolic Biomarkers by Berlin
Risk Score……………………………………………………………..…………263
Table 7. Independent Samples Test for Subject Characteristics by Clinical Berlin OSA
Risk……………………………………………………………………….…..…265
Table 8. Analysis of Variance for Subject Characteristics by Berlin Risk Score……..…..266
Table 9. Bonferroni Post Hoc Tests for Subject Characteristics by Berlin Risk Score…...267
Table 10. Independent Samples Test for CPET Variables at Rest and the Ventilatory
Threshold by Clinical Berlin OSA Risk……………………………………….....269
Table 11. Independent Samples Test for CPET Variables at Peak Exercise and Recovery by
Clinical Berlin OSA Risk…………………………………………………..…….270
Table 12. Analysis of Variance for CPET Variables at Rest and the Ventilatory Threshold
by Berlin Risk Score……………………………………………………….……271
Table 13. Bonferroni Post Hoc Tests for CPET Variables at Rest and the Ventilatory
Threshold by Berlin Risk Score…………………………………………..……...272
Table 14. Analysis of Variance for CPET Variables at Peak Exercise and Recovery by
Berlin Risk Score…………………………………………………..…………….273
Table 15. Bonferroni Post Hoc Test for CPET Variables at Peak Exercise and Recovery
by Berlin Risk Score……………………………………………………….…….274

viii
TABLE OF FIGURES
CHAPTER THREE Figure 1. Prevalence of MetSyn Components and MetSyn among the Subject Sample...126
Figure 2. MetSyn Components and Status by BQ OSA-Risk………………………...….127
Figure 3. MetSyn Components and Status by Berlin Risk Score……………………..…128
.
CHAPTER FOUR Figure 1. HR Slope During Post-Exercise Recovery by Clinical Berlin OSA-Risk…….154
Figure 2. SBP Slope During Post-Exercise Recovery by Clinical Berlin OSA-Risk……155
Figure 3. HR Slope During Post-Exercise Recovery by Berlin Risk Score……………..160
Figure 4. SBP Slope During Post-Exercise Recovery by Berlin Risk Score………….....161

1
CHAPTER ONE
INTRODUCTION
The prevalence of obesity is increasing in the U.S., with more than one-third of adults
qualifying as obese in 2009-2010 [1]; by the year 2030, it is projected that 42% of Americans
will be obese [2]. Due to the physiological effects of aging on body weight and body
composition, in addition to potential declines in the activity habits of older adults, it is not
surprising that a greater percentage of adults age 60 and over are obese in comparison to younger
adults, with nearly 40% of older adults qualifying as obese [1, 3]. Greater attention to positive
health culture and advances in medical care has contributed to an increasing elderly population
as people are living longer. By 2030, the number of U.S. adults age 65 and older is anticipated to
double to about 71 million [4].
Abdominal aortic aneurysm (AAA) disease is prevalent in the elderly, most often
occurring in people age 60 years and old. AAA disease is a common and morbid disease in
which the lower part of the aorta is weakened and bulging. Risk factors for AAA disease include
advancing age, history of cigarette smoking, male gender and family history. Recently,
obstructive sleep apnea (OSA), the most common sleep related breathing disorder that affects an
estimated 20% of the U.S. adult population [5], was determined to be highly prevalent among
patients with AAA disease [6] and may not only be a risk for factor for aortic disease [7], but a
causal factor for advanced AAA expansion [6]. Surgical repair is currently the only effective
method of AAA treatment and is usually recommended when the aneurysm is large enough that
the risk of surgery is less than the risk of rupture; however, participation in regular exercise has
been shown to reduce the risk of developing AAA disease [8] and may limit progression of early
AAA disease [9].

2
OSA is characterized by repetitive bouts of upper airway occlusion or collapse during
sleep, resulting in intermittent periods of hypoxia, hypercapnia, and fragmented sleep [10]. OSA
is diagnosed in individuals who have at least 5 apnea or hypopnea events per hour of sleep
(Apnea/Hypopnea Index, AHI). OSA is prevalent in older adults with at least 1 in 10 people
older than 65 years of age having diagnosed OSA (compared to 1 in 20 adults in the general
population) and the prevalence of the disorder is anticipated to rise as an increasing proportion of
Americans are obese and elderly, both of which are risk factors for OSA [5, 11]. It is estimated
that up to 90% of people with OSA remain undiagnosed, likely due to poor awareness of the
disorder, lack of routine screening, and limited diagnostic sleep study facilities. A hallmark
symptom of OSA is excessive daytime sleepiness (EDS), which may reduce physical activity
(PA) due to fatigue and sleepiness during the day. Consequently, reduced PA may further
exacerbate OSA through its influence on obesity, a major correlate of OSA (approximately 80%
of people suffering from OSA are obese) [12]. Untreated OSA can increase risk for several
chronic diseases and disorders including obesity, hypertension (HTN) and cardiovascular disease
(CVD), metabolic disorders, depression, and aortic disease [7, 13-20].
Metabolic syndrome (MetSyn) is the clustering of central obesity, insulin resistance (IR)
or glucose intolerance, HTN, and dyslipidemia; important consequences of MetSyn include
increased risk of CVD and type II diabetes [21, 22]. OSA may contribute to development of
MetSyn and subsequently to type II diabetes through inflammation exacerbated by chronic
intermittent hypoxia and sleep fragmentation associated with OSA [22, 23]. Repetitive episodes
of intermittent hypoxia followed by re-oxygenation, as seen in OSA, may result in the generation
of reactive oxygen species which can up-regulate transcription factors that control inflammatory
pathways that have downstream effects on the cardio-metabolic factors in MetSyn [24-27].

3
Furthermore, sleep deprivation may modulate neuro-humoral pathways [28, 29], activate
systemic inflammation [30], and increase susceptibility to oxidative stress [31], thereby
potentially encouraging the development of metabolic abnormalities through multiple feedback
mechanisms [32]. While the exact pathophysiology remains unclear, untreated OSA in
association with obesity, is linked to impaired glucose regulation, HTN, and increased
cardiovascular mortality in adults [33]. Age is a risk factor for both OSA and MetSyn, with OSA
occurring 2-3 times more often in older adults and MetSyn affecting 20% of people in their 60s
[34]. Studies suggest that the clinical implications of OSA differ in the elderly. Follow-up studies
of middle-aged cohorts have shown that OSA severity worsens over time and increases risk for
associated comorbidities [35]; however, in the elderly, OSA severity appears to decrease with
age [36] and presence of comorbidities may not be associated as strongly with OSA [37-39].
Furthermore, markers that are strong predictors of OSA in middle-aged adults, such as increased
body anthropometrics and snoring, are less strongly associated with OSA in the elderly [40]. The
untoward associations between OSA and clinical risk of MetSyn has been elucidated in pre-
elderly populations [41, 42], but not systematically examined in the elderly [32].
Physical activity has significant health benefits on not only weight control, but also
independently reduces risk for chronic health diseases and disorders including type II diabetes,
HTN, CVD, OSA, depression and osteoporosis [43, 44]. Consequently, a sedentary lifestyle
often accompanies and promotes obesity, further increasing risk for developing chronic illnesses.
EDS, a consequence of untreated OSA, may further limit PA behavior beyond the influence of
obesity alone. Findings from several studies indicate that OSA is associated with decreased PA
in young and pre-elderly populations [45-47]; however, upon review of the literature, this has not

4
been systematically examined in an elderly population with diagnosed small AAA disease who
may already demonstrate lower levels of PA due to aging and AAA disease.
Activities of daily living (ADLs) refer to daily self-care activities performed within an
individual’s daily environment, and include activities such as bathing, dressing and feeding one’s
self, homemaking, functional mobility, and leisure activities [48]. A fundamental requirement for
many ADLs is the ability to perform aerobic work, requiring the efforts of the heart, lungs, and
circulation to deliver oxygen to metabolically active muscles. The assessment of exercise
capacity and tolerance also provides important diagnostic and prognostic information in a
clinical setting [49]; exercise capacity and PA status are well- established predictors of
cardiovascular and overall mortality [50, 51], supporting the value of cardiopulmonary
exercise testing (CPET) as a clinical tool that provides clinically relevant diagnostic and
prognostic information in both healthy persons and those with chronic health conditions,
including OSA [52].
LITERATURE REVIEW
Aging in the United States
Improved medical care and prevention efforts have contributed to dramatic increases in
life expectancy and population rates of older adults in the United States over the past century.
The life expectancy for adults in the U.S. increased from 68.2 yrs in 1950, to 73.7 yrs in 1980,
and reached 78.5 yrs in 2009 [53]. Longer life spans and aging baby boomers are anticipated to
double the population of older Americans (age 65 years and older) during the next quarter
century. By 2030, there will be more than 70 million older adults, accounting for about 20% of
the U.S. population [54]. Longer life expectancy is accompanied by increases in chronic disease

5
development in older adults. Approximately 80% of older Americans have at least one chronic
condition and 50% have at least two chronic conditions, such as CVD, type II diabetes, or cancer
[4]. People living longer have also resulted in a shift in the leading cause of death for all age
groups, including older adults, from infectious diseases and acute illnesses to chronic and
degenerative illnesses. In 2011 the leading cause of death was heart disease, while respiratory
diseases, cerebrovascular diseases, and diabetes were among the top ten leading causes of death
in the U.S [55].
Abdominal Aortic Aneurysm (AAA) Disease
AAA disease is a common and morbid condition of older adults in which the lower part
of the aorta is weakened and bulging. AAA disease is prevalent in the elderly, most often
occurring in people age 60 years and older, and AAA presence is associated with overweight and
obesity [56]. AAAs tend to cause no symptoms, though occasionally pain in the abdomen and
back, due to pressure on surrounding tissues, or leg discomfort, due to reduced blood flow, may
be experienced. Most small and slow-growing AAAs don’t rupture, but size and rate of growth
should be watched carefully. The aorta enlarges with age normally, but is considered aneurysmal
when the diameter exceeds 3cm (normal diameter of the aorta is approximately 2cm). Risk
factors for AAA include advancing age, history of cigarette smoking, male gender and family
history. Risk of AAA rupture is significant for AAAs with diameters greater than 6cm. Surgical
repair is currently the only effective method of AAA treatment and is usually recommended
when the aneurysm is large enough that the risk of surgery is less than the risk of rupture. The
major complication of AAAs is rupture, in which large amounts of blood spill into the abdominal
cavity and can result in death within minutes.

6
The pathophysiology of AAA formation is complex and not fully understood. Currently,
there are thought to be four mechanisms relevant to AAA formation, including: 1) proteolytic
degradation of aortic wall connective tissue; 2) inflammation and immune responses; 3)
biochemical wall stress; and 4) molecular genetics [57]. Aneurysm formation involves a complex
process of destruction of the aortic wall through degradation of elastin and collagen. This leads
to a decrease in tensile strength in the aortic wall which can lead to formation of an aneurysm.
Differences in aortic structure, biology, and stress along the length of the aorta can also make
sites more susceptible to AAA formation. Animal and human models suggest a critical role for
the matrix metalloproteinase proteinases (MMPs) in aneurysm formation [58]. The MMPs play a
role in the control of inflammation, as well as breakdown of the aortic wall. MMP9 appears to
play a particularly critical role in AAA formation, expansion, and rupture. Family history also
plays a role in predisposition to AAA disease. It is estimated that approximately 15% of patients
with AAA disease have a positive family history. There are many candidate genes that could be
linked to AAA formation; however, no single genetic polymorphism or defect has been
identified as positively being linked with AAA formation. Obesity
Obesity is becoming a global epidemic and in the past 10 years in the United States,
dramatic increases in obesity have occurred in all demographics. Overweight and obesity are
classified by body mass index (BMI), a factor of weight for height. In adults, overweight is
defined by a BMI of 25.0 to 29.9 kg/m2; obesity is defined as a BMI ≥ 30.0 kg/m
2. The
prevalence of obesity is increasing in the U.S for older adults, age 60 years and over, of which
40% are obese [3] compared to the 35.7% of all American adults age 20 years and older who are
7
considered obese according to data from the National Center for Health Statistics from the
2009/2010 National Health and Nutrition Examination Survey (NHANES) [1]. Older women
have higher obesity rates compared to men, with 42.3% of women age 60 years and older
meeting or exceeding obesity thresholds compared to 36.6% of older men. The prevalence of
obesity in the U.S. has increased over the past several decades. From the 1988-1994 NHANES
report to the 1999-2000 report, the prevalence of obesity increased from 22.9% to 30.5% among
adult men and women. Prevalence of obesity continued to rise and by 2010 the prevalence of
obesity increased to 35% among men and 35.8% among women. By the year 2030, it is projected
that 42% of Americans will be obese and this proportion will likely be even greater for older
adults considering the trends of obesity [59].
Obesity and Chronic Diseases
The health consequences of obesity are significant and include cardiovascular diseases,
metabolic diseases, cancers, dyslipidemia, sleep apnea and respiratory disorders, and mental
health conditions [60]. Obesity increases the risk of CVD due to negative effects on blood lipids,
blood pressure (BP), atherosclerosis and inflammation. Metabolic consequences of obesity
include development of type II diabetes, insulin resistance (IR), and impaired glucose tolerance,
in response to the inability of the body to produce enough insulin in the blood or resistance to the
insulin produced. Body mass and type II diabetes are highly associated, as more than 80% of
people with diabetes are obese or overweight (CDC). Obesity is the strongest risk factors for
development of OSA, a common chronic sleep disorder characterized by recurrent occlusion of
the upper airway during sleep. It is estimated that 80% of OSA patients are obese [12]. Obesity is
also strongly associated with poor mental health, particularly depression. Adults with depression

8
or with a history of depression are 60% more likely to be obese than those with positive mental
health. One study concluded that clinically significant depression is up to four times higher in
severely obese individuals than in similar, non-obese individuals [61]. Sixty percent of the
nation’s obese population reported having at least one of these chronic conditions compared to
33% of normal-weight adults [62]. Excess weight is also associated with increased early
mortality, as shown in follow-up studies from the Framingham Heart Study and the NHANES III
cohort [63, 64] and it is well documented that all-cause mortality is increased in overweight and
obese individuals [65-67]. Obesity is also a financially costly disorder. In 2008, overall medical
care costs related to obesity for U.S. adults were estimated to be approximately $147 billion [68].
Additional costs related to obesity include loss of worker productivity due to absenteeism,
disability, and death. Researchers have estimated that if U.S. obesity trends continue, obesity-
related medical costs alone could increase by as much as $66 billion annually by the year 2030
[69].
Aging and Obesity
Due to the physiological effects of aging on body weight and body composition, in
addition to potential declines in the activity habits of older adults, it is not surprising that a
greater percentage of adults age 60 and over are obese in comparison to younger adults, with
nearly 40% of older adults qualifying as obese [1, 3]. Aging is associated with changes in body
composition, whereby fat-free mass progressively decreases and fat mass increases. Body fat
mass is determined by relation between energy intake and expenditure. Studies suggest that
energy intake does not change or may decline with advancing age, proposing that a decrease in
energy expenditure is a primary contributor to the gradual increase in body fat with advancing
9
age [70, 71]. Aging is associated with a decrease in all the major components of total energy
expenditure, including resting metabolic rate and thermic effect of food, along with PA which
accounts for about half of the decrease in the total energy expenditure that occurs with aging
[72]. Hormonal changes that accompany aging may also contribute to alterations in fat
distribution, favoring increased fat mass in the elderly. These include, but are not limited to,
thyroid hormones, insulin, glucose, and reproductive hormones including estrogen, progesterone,
and testosterone. Serum thyroid stimulating hormones decrease in healthy elderly subjects due to
age-related decreases in the secretion of these hormones by the pituitary [73]. Thyroid hormones
influence body metabolism, thereby slowing metabolism as secretion of thyroid hormones
declines with age. Glucose tolerance progressively declines with age, potentially leading to IR in
older adults [74]. Age-related insulin secretory dysfunction may have play a role in the
alterations in glucose metabolism with age, contributing to the high rates of impaired glucose
tolerance in older adults (more than 40% of Americans age 65 years and older meet the
diagnostic criteria for type II diabetes or impaired glucose tolerance) [75]. Additionally, aging is
accompanied by a decrease in testosterone, estrogen, and progesterone, all of which can
contribute to fat gain with age due to influences on muscle mass, metabolic rate, fat
synthesization, and fluid retention, respectively.
Aging and Chronic Diseases
Increases in chronic diseases and disabilities that often accompany aging may limit the
daily activities of older adults and reduce health-related quality of life. Chronic illness may also
attribute to the reductions in PA and exercise capacity seen in older adults. A 2003 study found
that nearly 57% of older adults did not meet the recommended guidelines for PA [76]. The

10
Centers for Disease Control and Prevention (CDC) recommends that older adults who are
generally fit and have no limiting health conditions engage in 150 minutes of moderate intensity
aerobic activity each week, or 75 minutes of vigorous intensity aerobic activity, in addition to
two days each week of muscle-strengthening activities that work all major muscle groups [77].
Conversely, physical inactivity and a sedentary lifestyle contribute to and exacerbate many
chronic diseases that are the leading causes of death in the U.S, including cardiovascular and
metabolic diseases. In 2002, the primary causes of death for older adults in the U.S. included
heart disease (accounting for 32% of all deaths), cancer (accounting for 22% of all deaths), and
stroke (accounting for 8% of all deaths). These accounted for 61% of all deaths in American
adults, age 65 years and older [2]. A study published in 1993 demonstrated that 14% of deaths in
the U.S. were attributed to activity patterns and diet [78] while another study linked sedentary
lifestyles to 23% of deaths from major chronic diseases [79]. In 2007, three negative health
behaviors, including smoking, poor diet, and physical inactivity, were the root cause of nearly
35% of deaths in the U.S [54]. These negative health behaviors primarily attribute to the
development of obesity, heart disease, cancer, stroke, and diabetes, which are the nation’s
leading chronic disease killers.
Obstructive Sleep Apnea
OSA is the most common sleep related breathing disorder, affecting an estimated 20% of
the U.S. adult population [5]. The prevalence of OSA is anticipated to rise as an increasing
proportion of Americans are obese and elderly, both of which are risk factors for OSA. OSA is
prevalent in older adults; the Sleep Heart Health Study found that among 6,400 older adults,
sleep disordered breathing (SDB) prevalence rates for mild to severe SDB ranged from 19-36%

11
for adults 60-98 years old [40]. These rates far outpace those for middle aged adults, age 30-60
years old, whose SDB rates were 2-4% for women and men [11]. In a large population-based
study of older adults (65 to 95 years of age), Ancoli-Israel and colleagues [38] found that 70% of
the men and 56% of the women had OSA as defined by an AHI of 10 or more. Bixler and
colleagues [36] found that men and women 65 to 100 years of age had a prevalence of OSA that
was twice as high as the OSA prevalence among middle age persons. Both of these studies,
however, suggest that most of the age-related prevalence increase occurs before age 65 and
plateaus at some point after age 65. Obesity is the primary risk factor for OSA and is reported in
more than 40% of OSA cases; furthermore, more than 80% of individuals with OSA are also
obese [12]. Body mass directly influences OSA risk, as one study suggests a 10% increase in
body weight increases risk for OSA 6-fold [17]. In addition to obesity, several anthropometric
and physical features are indicative of OSA, including a large neck circumference and
retrognathia, or a small or recessed jaw. A large neck circumference can indicate excess adipose
tissue around the upper airway which can reduce the patency of the airway during sleep. Some
studies have concluded that neck circumference is a more useful predictor for OSA than general
obesity [80]. Craniofacial abnormalities, such as a small jaw or recessed chin, can also affect the
affect the airway and result in SDB. Major signs and symptoms of OSA include loud and chronic
snoring, choking or gasping during sleep, and EDS due to poor sleep quality and quantity. One
retrospective, cross-sectional study found that EDS was demonstrated in 87.2% of patients with
OSA [81]. It is estimated that up to 90% of people with OSA remain undiagnosed, likely due to
poor awareness of OSA, lack of routine screening, and limited diagnostic sleep study facilities.
The “gold standard” for diagnosing OSA is laboratory polysomnography (PSG);
however, sleep health questionnaires that stratify patients based on clinical symptoms, physical

12
examinations, and risk factors, are often employed as a first step assessment to screen for OSA.
Questionnaires that are commonly used to screen for OSA and have been validated against PSG,
include the Epworth Sleepiness Scale (ESS), Pittsburgh Sleep Quality Index (PSQI), Berlin
Questionnaire (BQ), and most recently, the STOP-Bang questionnaire. Sleep screening
questionnaires do not require complicated calculations to identify high risk patients, and they are
relatively easy and cost-effective to apply clinically; however, there are also limitations. Sleep
questionnaires rely on self-report and disclosure of signs and symptoms, as well as the patient’s
memory and ability and willingness to follow instructions. Additionally, many of the signs and
symptoms of OSA may be difficult for the patient to self-identify, such as snoring and choking
during sleep, and can be misinterpreted as other conditions. A recent review and meta-analysis of
OSA screening questionnaires concluded that the BQ had the highest specificity for predicting
the existence of OSA and the BQ and STOP Bang questionnaire had the highest specificity and
sensitivity, respectively, for predicting moderate or severe OSA [82]. Another meta-analysis also
concluded that BQ was among the most accurate questionnaires overall to screen for SDB, and
that the ESS was the least accurate [83].
Untreated OSA can increase risk for several chronic diseases and disorders including
obesity, HTN and CVD, metabolic disorders, depression, and aortic disease [7, 13-20]; however,
the mechanism linking OSA to HTN and CVD remains undetermined. Repetitive nighttime
apneas and hypopneas (cessations and pauses in breathing) result in activation of the sympathetic
nervous system (SNS) and stressful arousals to reestablish breathing. It has been determined that
OSA patients demonstrate an exaggerated activation of the SNS that persists into waking hours
that can lead to elevations in HR and BP [84]. Over time, activation of the baroreceptors, which
respond to normalize these HR and BP oscillations, become altered and depressed in OSA

13
patients [85], suggesting an impairment of the cardiovascular autonomic system, thereby
increasing risk for HTN and CVD.
OSA is an independent risk factor for HTN and CVD [86] and has been associated with
endothelial dysfunction and increases in inflammatory markers associated with the development
of atherosclerosis [25, 87, 88]. OSA has also been associated with IR and altered glucose
metabolism [41, 89]. OSA is also linked with depression; a European study concluded that
people with depression were five times more likely to suffer from sleep disordered breathing,
including OSA [15]. Recently, OSA was determined to be highly prevalent among patients with
AAA disease [6] and may not only be a risk for factor for aortic disease [7], but a causal factor
for faster AAA expansion [6]. EDS caused by OSA may reduce PA due to fatigue and sleepiness
during the day. Findings from several studies using subjective measures of activity indicate that
increased OSA severity is associated with decreased PA in young and pre-elderly populations
[45-47]. A recent cross-sectional study by Chasens and colleagues is consistent with previous
research, finding that OSA severity is associated with decreased objective PA in middle-aged
adults and that subjective sleepiness is associated with perceived difficulty of activity.
Consequently, reduced PA may further exacerbate OSA through its influence on obesity, a major
correlate of OSA [90].
Some data suggest that OSA in older age may be a condition distinct from that of middle
age. Follow-up studies of middle-aged cohorts have shown that OSA severity worsens with time
[35]; however, in the elderly, associations of these comorbidities may not be linked to severity of
OSA, but may actually decrease with age [39]. The authors found that although mild SDB is
exceptionally prevalent among elderly adults, the disorder in this population is weakly associated
with common signs and symptoms and may be difficult to detect. Furthermore, markers that are

14
strong predictors of OSA in middle-aged adults, such as increased body anthropometrics and
snoring, are less strongly associated with OSA in the elderly [40]. Studies of OSA in older
populations report little or no association of OSA with sleepiness, HTN, or declines in cognitive
function, all of which are common correlates of OSA in middle age adults [37, 91-94]. The
association of obesity with OSA severity is weaker in older compared to middle-aged adults and
the prevalence of snoring, a strong marker for OSA, decreases beyond middle aged. The
untoward associations between OSA and risk of MetSyn has been elucidated in pre-elderly
populations [41, 42] but not systematically examined in the elderly [32].
Physical Activity
Regular PA is important for improving the health and wellbeing of people of all ages. PA,
defined as any movement that involves physical effort and increased metabolic demand for
energy, is not synonymous with exercise but also includes lifestyle activity. Unfortunately, few
older adults achieve the minimum recommendation for PA; up to 34% of adults age 65-74 years
and up to 44% of adults ages 75 years and older are inactive [76]. Physical inactivity and
cardiovascular mortality are directly related and physical inactivity is an independent risk factor
for the development of coronary artery disease [95, 96]. Research has demonstrated that all
individuals benefit from regular PA, whether it be vigorous exercise or mild-level exertion
activities. PA increases cardiovascular functional capacity and decreases myocardial oxygen
demand at any level of exertion by increasing both maximum cardiac output and the ability of
muscles to extract and utilize oxygen from the blood [97]. Beneficial changes in hemodynamic,
hormonal, metabolic, neurological, and respiratory function also occur with increased exercise
capacity [98-101]. Regular PA also helps to control blood lipid and carbohydrate metabolisms,

15
blood sugar regulation, insulin sensitivity, BP, and is recommended to prevent and treat
osteoporosis [102-104]. Developing and maintaining aerobic endurance, joint flexibility, and
muscle strength is especially important for aging individuals [105]. Resistance training aids
carbohydrate metabolism through the development or maintenance of muscle mass and effects on
basal metabolism [106, 107]. Resistance training is also of critical importance for the elderly due
to its beneficial effects on strength and flexibility, bone mineral density, functional capacity, and
musculoskeletal benefits [108, 109]. For older adults, PA can improve mobility and physical
functioning and ability to complete ADLs, in addition to having mental health benefits and
improving quality of life. On average, people who are physically active outlive their inactive
counterparts [110]. PA reduces the risk of developing or dying from a host of chronic diseases,
including heart disease, diabetes, colon cancer, and high BP [43, 44]. There is an inverse dose-
response relationship between the amount of energy expended through PA and all-cause mortality
and CVD mortality in middle-aged and elderly populations [111, 112]. Participation in regular
exercise also has been shown to reduce the risk of developing AAA disease [8] and may limit
progression of early AAA disease [9].
Epidemiological cross-sectional studies have shown that increased PA is associated with
better sleep [113-115] and a lower prevalence of sleep disorders [116]. A recent study that
involved a nationally representative sample of more than 2,600 men and women, age 18-85
years, found that individuals who participated in at least 150 minutes of moderate to vigorous
activity a week, improved their sleep quality by 65% and reported feeling less sleepy during the
day [117]. Recently, cross-sectional studies have shown reduced odds of SDB with increasing
PA independent of body habitus [46]. Additionally, PA, particularly vigorous PA, appears to be
protective against the presences of SDB; researchers found that increasing amounts of PA were
associated with less severe SDB [46, 118]. Findings from several studies using subjective

16
measures of activity indicate that increased OSA severity is associated with decreased PA in
young and pre-elderly populations [45-47]. Additionally, EDS, a frequent symptom of OSA, has
been associated with both obesity and decreased functional activity in areas sensitive to sleep
disruption [119]. A recent cross-sectional study by Chasens and colleagues is consistent with
previous research, also finding that OSA severity is associated with decreased objective PA in
middle-aged adults; however, this group also found that subjective sleepiness is associated with
perceived difficulty in activity, but not with objectively measured activity [120]. Upon review of
the literature, associations between OSA and PA have not been systematically examined in an
elderly population who may already demonstrate lower levels of PA due to aging and AAA
disease.
Metabolic Syndrome
The term “metabolic syndrome” (MetSyn) was first coined in the late 1960’s by Avogaro
and colleagues [121] and described the frequent simultaneous presence of obesity,
hyperlipidemia, type II diabetes, and HTN. Since the identification of MetSyn, several other
terms and similar but slightly varying definitions have been proposed, including “Syndrome X”
and “insulin resistance syndrome.” The most commonly used definitions are those of the World
Health Organization (WHO) and the National Cholesterol Education Program Adult Treatment
Panel (NCEP ATP) III) [21, 22], though several other definitions are recognized (Table 1).

17
Table 1. Common Definitions and Criteria of the Metabolic Syndrome Component
WHO (1999)
NCEP ATP III
(2001)
AACE (2003)
AHA/NHLBI
(2005)
ADF (2006)
IR
(pres ence)
Yes
_
_
_
_
IGT (mmol/L)
≥ 6.1
_
≥ 6.9
_
_
Fas ting Plas ma Glucos
e
(mmol/L)
≥ 5.6 or Type
II Diabetes
≥ 6.1/5.6
≥ 6.1
≥ 5.6 or Rx
≥ 5.6 or Rx
BMI (kg/m2)
≥ 30
_
_
_
_
WC (cm)
Male; Female
WHR > 0.90;
> 0.85
> 102; > 88
_
> 102; > 88
Ethnicity
s pecific Blood Pres s ure (mm
Hg)
≥ 140/90
≥ 130/85
≥ 130/85 or Rx
≥ 130/85 or Rx
≥ 130/85 or Rx
Triglycerides (mmol/L)
≥ 1.7
≥1.7
≥1.7
≥1.7
≥1.7 or Rx
HDL-C
(mmol/L) Male; Female
< 0.9; <1.0
<1.03; <1.3
<1.03; <1.3
<1.03; <1.3 or Rx
<1.03; <1.3 or Rx
Microalbuminuria *
≥ 20 mg/min;
≥ 30 mg/g
_
_
_
_
Required number of
components for
MetSyn diagnos is
IR or IGT plus
≥ 2 other
components
≥ 3
Diagnos is dependent
on clinical judgment
≥ 3
WC plus ≥ 2 other
components
* Indicates urinary albumin excretion rate or albumin/creatinin ratio. Abbreviations: IR-insulin resistance; IGT-impaired glucose
tolerance; BMI-body mass index; WC-waist circumference; WHR-waist/hip ratio; HDL-C-high density lipoprotein cholesterol; Rx-
prescription.

18
Based on the NCEP ATP III guidelines, more than one-third of American adults
may have MetSyn, characterized by the presence of at least three of the following risk
factors: waist circumference ≥ 102 cm in males and ≥ 88 cm in females; BP levels ≥ 130/ ≥
85 mmHg; serum TG levels ≥ 150 mg/dl; fasting blood glucose ≥ 110 mg/dl; and serum
HDL-C levels < 40 mg/dl in males and < 50 mg/dl in females. The National Health
Statistics Reports examined the prevalence of the individual risk factors for MetSyn, as well
as the prevalence of MetSyn using the NHANES 2003-2006. NHANES is a cross-sectional
nationally representative health and nutrition examination survey conducted by the Center
for Disease Prevention and Control (CDC)’s National Center for Health Statistics [21].
Age-adjusted estimates indicate that 34% of the U.S. population 20 years of age and over
meets the NCEP ATP III criteria for MetSyn. This survey also found that abdominal
obesity, HTN, and hyperglycemia are the most frequently occurring risk factors for MetSyn,
with prevalence rates of 53%, 40%, and 39%, respectively. Elevated TG and low HDL-C
were noted less frequently in the NHANES report, with U.S. prevalence rates of 31% and
25%, respectively. These findings also indicate that MetSyn increases with age and BMI.
Males and females 60 years of age and over were more than four times and six times as
likely as the youngest group (20-39 years) to meet the criteria for MetSyn, respectively.
Obese male and female adults, regardless of age, were about 32 and 17 times as likely as
their normal weight counterparts to meet the criteria for MetSyn, respectively [21].
The pathogenesis of the MetSyn is complex and not yet fully elucidated but appears
to have two primary points of origin that include obesity and IR. Other factors that have
been implicated as contributors to the development of MetSyn include age, pro-
inflammatory state, and abnormalities in hormones such as C-reactive protein (CRP). The

19
NCEP ATP III considers obesity the main contributing factor for the development of
MetSyn. Obesity contributes to HTN, dyslipidemia, hyperglycemia, and is associated with
risk for CVD. Abdominal obesity, specifically, is associated with metabolic dysregulation,
as excess adipose tissue in the abdominal region releases adipocytokines that can intensify
metabolic risk factors, causing IR, which in turn exacerbates these metabolic risk factors,
thereby promoting a continuous cycle of metabolic dysregulation [122]. IR is also prevalent
in people with MetSyn and is strongly associated with risk for DM and CVD, independent
of obesity [23].
Individuals with MetSyn are at increased risk for CVD; researchers found that
the MetSyn alone predicted 25% of all new-onset CVD [123]. Additionally, the
primary outcome of MetSyn is CVD, according to the NCEP ATP III [22]. This is not
surprising considering the components that comprise the MetSyn also are cardinal risk
factors for CVD; however, research supports that it is the clustering of several of these
cardiovascular risk factors, or MetSyn, that further increases risk for CVD, beyond that
of the individual risk factors alone. Golden and colleagues [124] concluded that
having several combinations of risk factors associated with MetSyn puts individuals at
greater risk for CVD beyond the risk associated with singular risk factors that are
MetSyn components. Furthermore, as the number of MetSyn components increases,
CVD risk also increases.
Many predisposing conditions which increased in prevalence with age, such as
obesity, IR, inflammation, and HTN, contribute to the increase prevalence of MetSyn that
accompanies aging. MetSyn in an elderly population is a risk factor for cardiovascular
morbidity, especially stroke and coronary heart disease, and mortality [125]. Inflammation is
one of the main mechanisms underlying endothelial dysfunction and, therefore, plays an

20
important role in atherosclerosis and other metabolic and cardiovascular disorders, including
HTN, IR, dyslipidemia, and obesity [126-129]. Inflammation is also a key factor in the
progressive loss of lean tissue and impaired immune function observed in aging. Aging in
adults is associated with marked and sustained increases in sympathetic nervous system
(SNS) activity to peripheral tissues. This stimulates thermogenesis and prevents further fat
storage in response to increasing adiposity that accompanies aging; however, this chronic
activation of the peripheral SNS has adverse consequences to the cardiovascular system and
increases risk of developing clinical cardiovascular and metabolic diseases in older adults
[130].
OSA and MetSyn
Studies indicate that OSA may be a manifestation of the MetSyn [131, 132], in fact,
individuals with OSA are more than twice as likely to have MetSyn as compared to obese
controls [41]. It appears that OSA and the MetSyn are characterized by the same
pathophysiologic environment, which increases risk for developing CVD [133]. Increased
visceral fat and the IR that accompanies it seem to be the main characteristics responsible for
the development of OSA and the MetSyn [5, 134]. OSA is often accompanied by the same
disorders which characterize the MetSyn, including HTN, elevated fasting blood glucose, IR,
abdominal obesity, and dyslipidemia. Other characteristics shared between OSA and MetSyn,
include increased SNS activation, endothelial dysfunction, and systemic inflammation [5,
135]. Elevated levels of inflammatory cytokines, such as interleukin-6 and tumor necrosis
factor-alpha, which also increase with age, are common features of both OSA and MetSyn
[135-137]. One study found that the prevalence of MetSyn (according to the ATP-III criteria)

21
is almost 40% greater in patients with OSA [41]. It is unclear whether OSA is observed as
part of the basic pathophysiology of the MetSyn or whether OSA, through repetitive
hypoxemia events during apneas and other mechanisms, induces the derangements that
constitute the MetSyn.
Exercise Capacity
A fundamental requirement for many ADLs is the ability to perform aerobic work,
requiring the efforts of the heart, lungs, and circulation to deliver oxygen to metabolically
active muscles. The maximal capacity to perform aerobic work is defined by the maximal
oxygen consumption (V02max), which is the product of cardiac output (Q) and arterio-
venous oxygen (a-vO2) difference at maximal exercise. Q is the volume of blood being
pumped by the heart per minute and is indicative of the health of the heart. CVDs, including
HTN and congestive
heart failure, can result in low Q. a-vO2 difference is the difference in the oxygen content of
the blood between the arterial blood and the venous blood and is indicative of how much
oxygen is removed from the blood as it circulates the body. a-vO2 difference increases with
PA and training. A more realistic variable achieved during CPET in most populations is peak
VO2, rather than VO2max [49]. VO2peak is measured in liters per minute, but is usually
expressed as a function of body weight. Functional capacity is often expressed in metabolic
equivalents (METs), where one MET represents resting energy expenditure and 3.5 ml O2 per
kilogram body weight per minute.
Exercise capacity is affected by age, sex, conditioning status, presence of diseases, or
medications that can influence VO2peak [49]. Aerobic capacity declines approximately 10%
per decade in nonathletic persons, largely due to attenuations in maximal heart rate and a-vO2

22
difference [138]. This rate may decrease to approximately 5% per decade in persons who
endurance train and exercise vigorously, due to augmentations in maximal stroke volume and
AVO2 difference [139]. Stroke volume is a measure of the blood pumped from one ventricle
of the heart with each beat. Stroke volume is an important determinant of Q, along with heart
rate (HR), and correlates with Q, decreasing in certain conditions and disease states. Exercise
capacity is 10-20% greater in men than women at any age due to muscle mass, greater stroke
volume, and higher hemoglobin concentrations [49]. Previous studies have shown that
elderly individuals experience changes in the cardiac autonomic control, due to aging,
demonstrating a marked reduction in parasympathetic modulation [140]; therefore, this
population demonstrates a reduction in Q, peripheral blood flow, and muscle metabolism,
which can promote changes related to the transport and use of oxygen in the body [141].
During CPET, elderly persons demonstrate lower values for maximal power (cycle
ergometry), and peak HR, as well as ventilatory and metabolic variables, compared to
younger populations; this is primarily due to muscular and cardiorespiratory changes caused
by aging [141].
Cardiopulmonary Exercise Testing (CPET)
The assessment of exercise capacity and physiological responses during CPET
provides important diagnostic and prognostic information in a clinical setting [49] and is an
effective tool for identifying those at high risk for CVD [142]. Exercise capacity and PA
status are well- established predictors of cardiovascular and overall mortality [50-52],
supporting the value of CPET as a clinical tool that provides clinically relevant diagnostic
and prognostic information in both healthy persons and those with cardiovascular conditions
[52]. Researchers found that having an exercise capacity of less than 4 METs was an

23
important predictor for increased cardiovascular morbidity and mortality among a cohort of
patients with coronary artery disease [143]. CPET is frequently used to assess integrated
response of cardiovascular, respiratory, and muscular systems to graded physical exercise. In
addition to exercise capacity, other physiological responses during CPET are of clinical
utility, including responses at the ventilatory threshold (VT) and during exercise recovery.
The VT, defined by the exercise level at which ventilation begins to increase exponentially
for a given increment in oxygen consumption (V02), can predict exercise performance and
intensity. Recently, researchers identified VO2 at the VT as a comparable parameter to
VO2peak for identifying patients at increased mortality risk [144]. Ventilatory efficiency
(VE/VCO2) demonstrates the relationship between minute ventilation and carbon dioxide
production and also appears to have clinical value for predicting mortality [145,
146]. Additionally, recovery responses after exercise are markers of autonomic function;
abnormal HR or BP responses during exercise recovery may indicate impairment in
autonomic regulation and have been shown to predict future CVD [147] and mortality [148,
149]. CPET has been shown to be safe and effective for evaluating AAA patients [150].
Patients with OSA are also characterized by excessive daytime sleepiness (EDS),
fatigue, and decreased daily PA which may also impair muscle energy metabolism and
decrease exercise tolerance [151]. Obesity is often a co-morbid condition in individuals with
OSA and may also influence exercise capacity through abnormalities in lung function and
increases in ventilatory stress [152]. Decreased exercise capacity, an independent predictor
for all-cause mortality in older men [52], has been demonstrated in middle-aged adults with
OSA [153-155]; however, the mechanisms by which have not been determined. Possible
causes include cardiovascular [86], respiratory [156], and peripheral muscular abnormalities

24
[151]. Autonomic nervous system dysfunction has been hypothesized to link OSA to CVDs
such as HTN, heart failure, myocardial infarction, and stroke [157]. Przybylowski and
colleagues found that exercise capacity can be limited due to HTN response during exercise
in middle-age OSA patients; they also found that those with severe OSA have exaggerated
hemodynamic response to exercise and delayed post- exercise BP recovery [152]. Kaleth and
colleagues found that middle-age OSA patients have a distinctive response to CPET,
characterized by a blunted HR response, delayed systolic BP recovery, and elevated diastolic
BP in both exercise and early recovery [158]. Hargens and colleagues determined that OSA
elicits alterations in cardiovascular responses post exercise in young adult men, reflected by
an attenuated HR recovery, which may indicate an autonomic regulation imbalance [159].
Aron et al. [155] published a review of the literature examining exercise testing in OSA
patients and reported that several studies found that patients with OSA have a reduced
exercise capacity, blunted HR response during exercise, and atypical BP response during
exercise and recovery. Aron highlighted possible explanations for these responses, including
cardiac dysfunction, impaired muscle metabolism, chronic sympathetic over-activation, and
endothelial dysfunction [155]. Exercise capacity may also be influenced by presence of
AAAs in this subject sample, as physical inactivity, a correlate of exercise capacity, is a risk
factor for the development of AAAs. Myers and colleagues evaluated exercise capacity and
responses to CPET in elderly patients with small AAAs and found that they demonstrate
similar exercise capacities, as assessed by peak V02, as the age-matched referral group;
however AAA patients demonstrated a slightly higher incidence of hyper- and hypotensive
responses to exercise than the referral group, suggestive of potential autonomic imbalance
[150]. Myers et al. concluded that AAA patients can safely undergo maximal CPET and
supports its routine use for risk evaluation and functional assessment of patients with AAA.

25
The relationship between exercise capacity and mortality has yet to be established in the
elderly at risk for OSA. Furthermore, the influence of OSA risk on exercise capacity and
physiological responses during exercise has been examined in pre-elderly populations with
OSA [152, 158, 159] but not systematically examined in an elderly population at risk for
OSA with newly diagnosed AAAs.
RESEARCH AIMS
Study 1
An aim of Study 1 was to evaluate the risk of OSA, as assessed from the clinical
interpretation of the BQ, among elderly patients with newly diagnosed AAA disease. To
further examine gradations in OSA risk, subjects were also classified by their Berlin Risk
Score (BRS), the sum of the three categorical scores from the BQ. Subjects were grouped into
one of four BRS groups which equated to the number of categories that were scored positive
from their BQ (BRS 0, 1, 2, or 3). OSA risk among the elderly AAA subjects was then
compared to OSA risk reported for younger and middle-age groups, as well as elderly
populations without AAA disease. The primary aim of Study 1 was to examine associations
between OSA risk and self-report PA behavior in our subject sample. I hypothesized older
adults at High- risk for OSA from the BQ and with higher BRS would report engaging in less
PA than their lower-risk counterparts.
Study 2
An aim of Study 2 was to examine the cardio-metabolic profile related to MetSyn and
the constituent markers of MetSyn, as defined by the NCEP ATP III criteria, among elderly
patients with newly diagnosed AAA disease. The primary aim of Study 2 was to assess how
biomarkers of MetSyn and MetSyn status may be associated with risk for OSA (High- vs.

26
Low- OSA Risk; Berlin Risk Score classifications), as assessed by the Berlin Questionnaire. I
hypothesized that subjects at High-risk for OSA and those with higher BRS would have more
features of MetSyn and higher rates of MetSyn compared to lower risk counterparts.
Study 3
The aim of Study 3 was to examine and compare and contrast exercise capacity
and physiological responses to CPET in elderly patients with AAA disease relative to
OSA risk as assessed from the clinical BQ and BRS classifications. I hypothesized that
OSA risk would be associated with reduced exercise capacity and with physiological
responses to exercise suggestive of autonomic imbalance during exercise and recovery.
METHODS
A total of 396 subjects (n=326 for Studies 1 and 2; n=114 for Study 3) with newly
diagnosed small AAAs (aortic diameter ≥2.5 and < 5.5 cm) were recruited from Stanford
University Medical Center, the Veterans Affairs Palo Alto Health Care System (VAPAHCS)
and Kaiser Permanente of Northern California. Recruitment procedures and all study-related
activities were reviewed and approved in advance by Institutional Review Boards (IRBs) at
Stanford University (including VAPAHCS) as well as the Kaiser Permanente Division of
Research and an independent Data Safety Monitoring Board (DSMB) organized by the
NHLBI and are discussed in greater detail in Appendix A. The ancillary study for the
analyses pertaining to this dissertation was approved by the IRB at Virginia Tech (Appendix
B). Study methods for all participants included extraction of medical history and drug
information from medical records; completion of a physical examination with study
personnel to assess resting systolic and diastolic BP, as well as anthropometrics including

27
height and weight for body mass index (BMI) calculation and waist and hip circumference
measurements; fasting blood draw and analysis for complete lipid panel and fasting insulin
and glucose levels (serum); and completion of questionnaires with verification of responses
completed by interviews with study staff to assess health history, PA behavior and habits, and
OSA risk. In addition, subjects included in Study 3 completed a symptom-limited CPET with
gas exchange using an individualized ramp treadmill protocol, as previously described by
Myers et al. [160] and according to standard protocols and recommended procedures as
outlined by the American College of Sports Medicine’s Guidelines for Exercise Testing and
Prescription to assess exercise capacity and physiological responses during CPET [142].
Additional details regarding the methodology utilized in this dissertation is included in
Appendix A. This dissertation was derived from an ancillary research project that is part of a
large National Heart, Lung and Blood Institute (NHLBI) sponsored study, conducted at the
Specialized Center of Clinically Oriented Research Program (SCCOR) in AAA disease at
Stanford University and the VA Palo Alto Health Care System (VAPAHCS), titled
“Evaluation of Exercise Therapy for Small Abdominal Aortic Aneurysms.”
Berlin Questionnaire
The modified Berlin Questionnaire (BQ) is a 12-item self-report questionnaire that
includes questions about risk factors for OSA that can be identified with three discrete
sign/symptom categories of 1) snoring behavior, 2) wake time sleepiness and fatigue, and 3)
obesity and HTN. The modified BQ, an extension of the original BQ, includes three
additional questions regarding choking behavior and wake-time sleepiness. The modified BQ
is a validated instrument used to identify individuals who are at risk for OSA with a

28
sensitivity (86%) and specificity (95%) comparable to the original BQ [161-164]; positive
and negative predictive values of 96% and 82%, respectively, were reported for the modified
BQ [164].
Veterans Affairs Physical Activity Questionnaire
The quantification of PA was recorded by use of the Veterans Affairs Physical
Activity Questionnaire (VAPAQ), modeled after the Harvard Alumni studies of
Paffenbarger and colleagues [165]. A copy of the VAPAQ is included in Appendix C.
The VAPAQ has been validated and successfully used in large numbers of veteran
patients and others as reported in previous publications and has been useful in
predicting all-cause mortality [9,168].
Physical Examination
Subjects underwent a clinical and physical examination with study personnel
to assess resting systolic and diastolic BP, as well as measures of body habitus,
including height and weight for BMI calculation and waist (WC) and hip
circumference (HC) measurements, which were also used to calculate waist/hip
(W/H) ratio. Detailed assessment protocols for these measures are included in
Appendix A. Subjects also completed a health history questionnaire which included
self-report medication use to assess medically controlled HTN, dyslipidemia, type II
diabetes, and other diseases and disorders.
Metabolic and Cardiovascular Biomarkers
Fasting serum blood was collected from participants and evaluated for biomarkers of

29
metabolic and cardiovascular diseases, including serum insulin and glucose, and lipid profile,
including total cholesterol (TC), high-density lipoprotein cholesterol (HDL-C), low-density
lipoprotein cholesterol (LDL-C), and triglycerides (TG). Detailed collection procedures for
these measures are included in Appendix A.
Metabolic Syndrome
Presence of MetSyn among the subject sample was determined based on the NCEP
ATP III guidelines [22], characterized by presence of at least three of the five risk factors
outlined in Chapter 3. Prescription medication use was also taken into consideration when
identifying the presence or absence of each of the MetSyn risk factors. Detailed procedures
for assessment of MetSyn are included in Appendix A.
Cardiopulmonary Exercise Testing
Participants completed a symptom-limited CPET with gas exchange using an
individualized ramp treadmill protocol, as previously described by Myers et al. [160] and
according to standard protocols and recommended procedures as outlined by the American
College of Sports Medicine’s Guidelines for Exercise Testing and Prescription to assess
exercise capacity and physiological responses during CPET [142]. Detailed protocols and
procedures for these measures are discussed by Myers et.al in a previous publication that
evaluated exercise training in patients with AAA disease [9] and are discussed in Appendix
A.
Statistical Analyses
Data were stored electronically in a SPSS® (SPSS, Inc., Chicago, IL) database

30
(Version 20.0). Statistical significance was determined a priori for all experimental analyses as
a p value < 0.05. Missing data points were excluded on a case by case basis for all analyses.
Study 1
The subject sample for Study 1 includes 326 patients from the larger AAA study and
subjects were similar based on diagnosed small AAAs. To address the research question,
“What fraction of these elderly AAA patients are at risk for OSA, as assessed by the Berlin
Questionnaire?”, responses to the BQ were scored for subjects using the instructions
adapted from Netzer and colleagues [162] and subjects were classified as High-Risk or Low-
Risk for OSA, using the clinical interpretation of the BQ. To further stratify subjects by
OSA-risk, they also were assigned a BRS, which was determined by summing the number of
sub-scores for each of the three categories (snoring, EDS, and HTN/BMI) of the BQ.
Subjects thus were grouped into one of four BRS groups for further analyses (BRS 0-3).
To address the primary research question, “Is OSA risk in the elderly with AAA
disease associated with recent and lifetime physical activity behavior?” descriptive statistics
were assessed to observe means, standard deviations, and ranges for variables by group (BQ
High- vs. Low-Risk and BRS classifications). An independent sample t-test was used to
compare means between High- vs. Low-Risk groups for all dependent variables of interest
related to self-report recreational and occupational PA. To compare means between and
within BRS groups, a one- way analysis of variance (ANOVA) was performed; Bonferroni
post hoc analysis was performed to further examine differences between groups for all
dependent variables of interest related to self-report recreational and occupational PA.
Although the subject sample was similar, group differences existed for BMI that may affect
relationships between dependent variables of interest related to PA and OSA risk; therefore,

31
when appropriate, a general linear model univariate procedure was performed, controlling for
BMI as a covariate.
Study 2
The subject sample for Study 2 includes 326 patients from the larger AAA study and
subjects were similar based on diagnosed small AAAs. To address the primary research
question, “how is MetSyn and the constituent biomarkers of MetSyn associated with risk for
OSA, as assessed by the Berlin Questionnaire?”, subjects were classified as High-Risk or
Low-Risk for OSA, using the clinical interpretation of the BQ [162].To further examine
gradations in OSA risk, subjects were also classified by their BRS, the sum of the three
categorical scores from the BQ. Descriptive statistics were assessed to observe means,
standard deviations, and ranges for variables of interest by group. To compare means between
and within groups, independent sample t-tests and ANOVA were performed, for two- and
four-group comparisons, respectively; Bonferroni post hoc analysis were used to further
examine differences between four-group comparisons for all dependent variables of interest
related to metabolic and cardiovascular biomarkers. Although the subject sample was similar,
group differences existed for BMI that may affect relationships between dependent variables
of interest related to MetSyn constituents and OSA risk; therefore, when statistically
significant differences between groups were observed for variables of interest related to
biomarkers of the MetSyn, a general linear model univariate procedure was performed,
controlling for BMI as a covariate.
Study 3
The subject sample includes 114 patients from the larger AAA study and subjects

32
were similar based on diagnosed small AAAs. To examine the research question, “Is OSA
risk in the elderly with AAA disease associated with reduced exercise capacity and unique
physiological responses during CPET?” subjects were classified as High-Risk or Low-Risk
for OSA using the clinical interpretation of the BQ [162] and by their BRS. Descriptive
statistics were assessed for each group to observe means, standard deviations, and ranges for
variables of interest related to physiological responses at rest, during exercise, at peak
exercise, and during recovery. To compare means between groups, independent student t-
tests and ANOVA were performed, for two- and four-group comparisons, respectively;
Bonferroni post hoc analysis were used to further examine differences between four-group
comparisons for all dependent variables of interest. Although the subject sample was similar,
group differences existed for BMI that may affect relationships between dependent variables
of interest related to exercise capacity or physiological exercise responses, a general linear
model univariate procedure was performed, controlling for BMI as a covariate.
DELIMITATIONS AND LIMITATIONS
Delimitations
1. The AAA study provides a large sample of middle-aged and elderly patients, both male
and female, constituting a rich and unique resource for conducting cross-sectional
studies representative of the older adult population.
2. The Berlin Questionnaire is the most widely used questionnaire for assessing OSA
risk. The sensitivity and specificity of the BQ ranges from 54-86% and 43-87% among
primary care patients, respectively [161-163]. Subjects completed the BQ and responses
were confirmed and clarified by one-on-one interview between subject and study
personnel. To further examine gradations in OSA risk, subjects were also classified by

33
their Berlin Risk Score (BRS), the sum of the three categorical scores from the BQ.
Subjects were grouped into one of four BRS groups which equated to the number of
categories that were scored positive from their BQ (BRS 0, 1, 2, or 3). It should be
noted that this is not a validated interpretation of the BQ, but simply an approach to
examine a more detailed analysis of risk for OSA from patient responses to the
individual questions and risk factor categories that comprise the BQ.
3. Study participants completed a detailed self-report of their recent and lifetime PA
habits using the VAPAQ. Standard parameters include: number of blocks walked/day;
number of stair flights climbed/day; blocks walked/stairs climbed/day (kcals);
occupational activity/week (kcals); combined occupational and recreational
activities/week (kcals); recreational activity/week, last year; and recreational
activity/week, lifetime. Activity type, frequency and duration were recorded for their
participation in sports and recreational activities. Activities were further classified
according to intensity and duration. The VAPAQ has been validated and successfully
used in large numbers of veteran patients and others [168].
4. Study participants completed a physical examination with study personnel to evaluate
vitals and anthropometric information; a fasting blood draw was also processed and
analyzed to evaluate metabolic and cardiovascular biomarkers. Additionally,
participants completed a detailed health status questionnaire which included
information on their medication use, including anti-hypertensives, statins, fibrates,
niacins, and medications to control diabetes, and other disorders.
5. Participants completed a symptom-limited CPET with gas exchange using an
individualized ramp treadmill protocol, as previously described by Myers et al. [160]
and according to standard protocols and recommended procedures as outlined by the

34
American College of Sports Medicine’s Guidelines for Exercise Testing and
Prescription to assess exercise capacity and physiological responses during CPET
[142]. Myers et al. concluded that AAA patients can safely undergo maximal CPET
and supports its routine use for risk evaluation and functional assessment of patients
with AAA [150].
Limitations
1. OSA was not clinically diagnosed but rather risk of the disorder was determined
by interview and self-reports, using the BQ, the most widely used questionnaire
for assessing OSA risk. The sensitivity and specificity of the BQ ranges from 54-
86% and 43-87% among primary care patients, respectively [161-163]. Despite
these limitations, a strength of our methodology is that study staff administered the
BQ to participants via interview rather than the participants completing them
alone. This allowed participants to ask questions or clarify statements with
research staff, if needed, and reduced individual interpretation that can be a
limitation with self-report assessments.
2. The Berlin Questionnaire may not provide a high level of diagnostic specificity to
discriminate OSA in an elderly population. One group that assessed the accuracy of
the Berlin to diagnose OSA in a large healthy elderly population found that the
Berlin had a sensitivity of 77% and a specificity of 39% for predicting moderate and
severe OSA and a positive and negative predictive value of 63% and 55%,
respectively [170].
3. Participation in PA was assessed through self-report questionnaire, one of the most

35
practical and widely used methods for assessing PA; however, a limitation is that
subjects may misclassify and over report PA behavior due to recall and social
desirability biases (Sallis and Saelens 2000; Aadahl, Kjaer et al. 2007). Klesges and
colleagues investigated the accuracy of self-report PA compared to observational
activity and found that subjects underestimate sedentary activities and overestimate
aerobic activities by over 300% (Klesges, Eck et al. 1990). This limitation was
addressed by having study staff administer the BQ to participants via interview rather
than the participants completing them independently. This allowed participants to ask
questions or clarify statements with research staff, if needed, and reduced individual
interpretation that can be a limitation with self-report assessments. PA habits were
self-reported from study participants, posing concerns about the accuracy of the PA
variables.
4. Because this study included a convenience sample of subjects with AAA disease,
results may not be generalizable to an elderly population; however, due to the high
prevalence of undiagnosed AAA disease in the elderly observed by Singh and
colleagues, who found a prevalence rate of nearly 34% for AAA disease among
adults 65-84 years of age [171], the findings of this dissertation may be more
generalizable to the elderly population than originally thought.
DEFINITIONS
Abdominal Aortic Aneurysm (AAA) – a bulging or weakened area in the wall of the aorta,
resulting in an abnormal widening or ballooning greater than 50% of the normal diameter.
Activities of Daily Living (ADL) – daily self-care activities, such as feeding and grooming
oneself, work and leisure activities. Often used as a measurement of a person’s functional

36
status, particularly in regards to people with disabilities and the elderly [172].
Apnea – the cessation of airflow at the nostrils and mouth for at least 10 seconds [173].
Apnea/Hypopnea Index (AHI) – the number of apneas and hypopneas per hour [173].
Berlin Questionnaire – a sleep apnea screening questionnaire used to identify the risk of
sleep disordered breathing.
Body Mass Index (BMI) – indice of body habitus calculated from weight and height
Cardiac output (CO) – the volume of blood pumped by the heart in one minute [142].
Cytokine – a chemical messenger that can induce or inhibit a variety of local and
systemic physiological processes, e.g. inflammation.
Exercise Capacity – the maximum amount of physical exertion that a patient can sustain
[174].
Heart Rate (HR) – number of heart beats per minute [142].
Homeostasis Model of Assessment (HOMA) – a calculated index of insulin resistance
typically used in non-invasive studies, defined as the product of fasting insulin and glucose
divided by a constant (22.5) [175].
Hypercapnia – increased levels of carbon dioxide in arterial blood [173].
Hypopnea – a significant reduction in airflow characterized by 50% reduction in airflow;
<50% reduction in airflow coupled with a >4% reduction in oxygen saturation; OR 50%
reduction in airflow coupled by EEG evidence of arousal [173].
Insulin Resistance (IR) – impaired biological response to insulin, causing a subsequent
decrease in insulin mediated disposal of glucose and desensitization of peripheral tissues to
insulin [176].
Metabolic Syndrome (MetSyn) – clustering of traditional cardiovascular risk factors which

37
increases risk for cardiovascular morbidity and mortality, and is present in individuals who
have three or more of the following risk factors according to the NCEP ATP III definition:
waist circumference of ≥ 102 cm in males and ≥ 88 cm in females, BP levels of ≥ 130/ ≥ 85
mmHg, TG levels of ≥ 150 mg/dl, fasting blood glucose of ≥ 100mg/dl, and HDL-C levels <
40mg/dl in males and <50 mg/dl in females [22].
Metabolic Equivalent of Task (MET) – a physiological measure of the energy cost of
physical activities; used as a means of expressing the intensity and energy expenditure of
activities without considering individual body mass [142].
Obstructive Sleep Apnea (OSA) – a sleep disorder characterized by periodic complete or
partial obstructions of the upper airway during sleep, leading to intermittent cessations of
breathing or reductions in airflow to the lungs despite ongoing respiratory effort [173].
Polysomnogram (PSG) – the gold standard test used to diagnose sleep disorders that
involves continuous recording and monitoring of physiological variables during sleep,
including brain activity, cardiac activity, respiratory activity, lower limb movement, and
other physiological variables.
Respiratory Exchange Ratio (RER) – ratio between the amount of CO2 exhaled and O2
inhaled in one breath
Stroke Volume (SV) – volume of blood pumped from the left ventricle of the heart with
each beat [142].
Ventilatory Threshold (VT) – the peak oxygen consumption at which the energy
demands exceed circulatory ability to sustain aerobic metabolism [142].
Veterans Affairs Physical Activity Questionnaire (VAPAQ) – validated questionnaire
for quantifying physical activity

38
Peak oxygen consumption (VO2peak) – the maximum capacity of an individual’s body to
transport and use oxygen during exercise [142].
ABBREVIATIONS OF TERMS
AAA – Abdominal Aortic Aneurysm
AHI – Apnea/Hypopnea Index
ANOVA – Analysis of Variance
BMI – Body Mass Index
BRS – Berlin Risk Score
BQ – Berlin Questionnaire
CDC – Centers for Disease Control and Prevention
CPET – Cardiopulmonary Exercise Testing
CVD – Cardiovascular Disease
DBP – Diastolic Blood Pressure
EDS – Excessive Daytime Sleepiness
HC – Hip circumference
HDL-C – High Density Lipoprotein-Cholesterol
HOMA – Homeostasis Model of Assessment
HR – Heart rate
HRR – Heart rate recovery
HTN – Hypertension
LDL-C – Low Density Lipoprotein – Cholesterol
MetSyn – Metabolic Syndrome
MET – Metabolic Equivalent

39
NCEP ATP – National Cholesterol Education Program Adult Treatment Panel
NHANES – National Health and Nutrition Examination Survey
OSA – Obstructive Sleep Apnea
PA - Physical Activity
RER – Respiratory Exchange Ratio
ROS – Reactive Oxygen Species
Rx – Prescription
SDB – Sleep Disordered Breathing
SBP – Systolic Blood Pressure
SBPR – Systolic Blood Pressure Recovery
TC – Total Cholesterol
TEE – Total Energy Expenditure
TG – Triglycerides
VAPAQ – Veterans Affairs Physical Activity Questionnaire
VCO2 – carbon dioxide production
VO2 – Oxygen consumption
VT – Ventilatory Threshold
WC – Waist Circumference
W/H Ratio – Waist to Hip Ratio

40
REFERENCES 1. Ogden, C.L., et al., Prevalence of obesity and trends in body mass index among US
children and adolescents, 1999-2010. JAMA, 2012. 307(5): p. 483-90.
2. CDC, National Center for Health Statistics, National Vital Statistics System, 2006.
3. Villareal, D.T., et al., Obesity in older adults: technical review and position statement of
the American Society for Nutrition and NAASO, The Obesity Society. Obes Res, 2005.
13(11): p. 1849-63.
4. CDC. Healthy Aging. Helping People to Live Long and Productive Lives and Enjoy a
Good Quality of Life 2011 [cited 2012 September 21]; Available from:
http://www.cdc.gov/chronicdisease/resources/publications/aag/aging.htm.
5. Shamsuzzaman, A.S., B.J. Gersh, and V.K. Somers, Obstructive sleep apnea:
implications for cardiac and vascular disease. JAMA, 2003. 290(14): p. 1906-14.
6. Mason, R.H., et al., Obstructive sleep apnea in patients with abdominal aortic
aneurysms: highly prevalent and associated with aneurysm expansion. Am J Respir Crit
Care Med, 2011. 183(5): p. 668-74.
7. Saruhara, H., et al., Obstructive sleep apnea as a potential risk factor for aortic disease.
Heart Vessels, 2012. 27(2): p. 166-73.
8. Kent, K.C., et al., Analysis of risk factors for abdominal aortic aneurysm in a cohort of
more than 3 million individuals. J Vasc Surg, 2010. 52(3): p. 539-48.
9. Myers, J.N., et al., Effects of exercise training in patients with abdominal aortic
aneurysm: preliminary results from a randomized trial. J Cardiopulm Rehabil Prev,
2010. 30(6): p. 374-83.
10. White, D.P., The pathogenesis of obstructive sleep apnea: advances in the past 100
years. Am J Respir Cell Mol Biol, 2006. 34(1): p. 1-6.
11. Young, T., et al., The occurrence of sleep-disordered breathing among middle-aged
adults. N Engl J Med, 1993. 328(17): p. 1230-5.
12. Vgontzas, A.N., et al., Sleep apnea and sleep disruption in obese patients. Arch Intern
Med, 1994. 154(15): p. 1705-11.

41
13. Fischer, J. and F. Raschke, [Glucose tolerance, insulin resistance and arterial
hypertension in patients with obstructive sleep apnea syndrome]. Pneumologie, 1995. 49
Suppl 1: p. 131-5.
14. Nieto, F.J., et al., Association of sleep-disordered breathing, sleep apnea, and
hypertension in a large community-based study. Sleep Heart Health Study. JAMA, 2000.
283(14): p. 1829-36.
15. Ohayon, M.M., The effects of breathing-related sleep disorders on mood disturbances in
the general population. J Clin Psychiatry, 2003. 64(10): p. 1195-200; quiz, 1274-6.
16. Peker, Y., et al., Increased incidence of cardiovascular disease in middle-aged men with
obstructive sleep apnea: a 7-year follow-up. Am J Respir Crit Care Med, 2002. 166(2): p.
159-65.
17. Peppard, P.E., et al., Prospective study of the association between sleep-disordered
breathing and hypertension. N Engl J Med, 2000. 342(19): p. 1378-84.
18. Spiegel, K., R. Leproult, and E. Van Cauter, Impact of sleep debt on metabolic and
endocrine function. Lancet, 1999. 354(9188): p. 1435-9.
19. Strohl, K.P., et al., Insulin levels, blood pressure and sleep apnea. Sleep, 1994. 17(7): p.
614-8.
20. Wolk, R., A.S. Shamsuzzaman, and V.K. Somers, Obesity, sleep apnea, and
hypertension. Hypertension, 2003. 42(6): p. 1067-74.
21. Ervin, R.B., Prevalence of metabolic syndrome among adults 20 years of age and over,
by sex, age, race and ethnicity, and body mass index: United States, 2003-2006. Natl
Health Stat Report, 2009(13): p. 1-7.
22. Grundy, S.M., et al., Definition of metabolic syndrome: report of the National Heart,
Lung, and Blood Institute/American Heart Association conference on scientific issues
related to definition. Arterioscler Thromb Vasc Biol, 2004. 24(2): p. e13-8.
23. Abbasi, F., et al., Relationship between obesity, insulin resistance, and coronary heart
disease risk. J Am Coll Cardiol, 2002. 40(5): p. 937-43.
24. Foster, G.E., M.J. Poulin, and P.J. Hanly, Intermittent hypoxia and vascular function:
implications for obstructive sleep apnoea. Exp Physiol, 2007. 92(1): p. 51-65.
25. Lavie, L., Obstructive sleep apnoea syndrome--an oxidative stress disorder. Sleep Med
Rev, 2003. 7(1): p. 35-51.

42
26. Suzuki, Y.J., et al., Oxidative stress and oxidant signaling in obstructive sleep apnea and
associated cardiovascular diseases. Free Radic Biol Med, 2006. 40(10): p. 1683-92.
27. Yamauchi, M., et al., Oxidative stress in obstructive sleep apnea. Chest, 2005. 127(5): p.
1674-9.
28. Knutson, K.L., et al., The metabolic consequences of sleep deprivation. Sleep Med Rev,
2007. 11(3): p. 163-78.
29. Spiegel, K., et al., Brief communication: Sleep curtailment in healthy young men is
associated with decreased leptin levels, elevated ghrelin levels, and increased hunger
and appetite. Ann Intern Med, 2004. 141(11): p. 846-50.
30. Meier-Ewert, H.K., et al., Effect of sleep loss on C-reactive protein, an inflammatory
marker of cardiovascular risk. J Am Coll Cardiol, 2004. 43(4): p. 678-83.
31. Everson, C.A., C.D. Laatsch, and N. Hogg, Antioxidant defense responses to sleep loss
and sleep recovery. Am J Physiol Regul Integr Comp Physiol, 2005. 288(2): p. R374-83.
32. Tasali, E. and M.S. Ip, Obstructive sleep apnea and metabolic syndrome: alterations in
glucose metabolism and inflammation. Proc Am Thorac Soc, 2008. 5(2): p. 207-17.
33. Golbin, J.M., V.K. Somers, and S.M. Caples, Obstructive sleep apnea, cardiovascular
disease, and pulmonary hypertension. Proc Am Thorac Soc, 2008. 5(2): p. 200-6.
34. Ford, E.S., W.H. Giles, and W.H. Dietz, Prevalence of the metabolic syndrome among
US adults: findings from the third National Health and Nutrition Examination Survey.
JAMA, 2002. 287(3): p. 356-9.
35. Punjabi, N.M., The epidemiology of adult obstructive sleep apnea. Proc Am Thorac Soc,
2008. 5(2): p. 136-43.
36. Bixler, E.O., et al., Effects of age on sleep apnea in men: I. Prevalence and severity. Am
J Respir Crit Care Med, 1998. 157(1): p. 144-8.
37. Ancoli-Israel, S. and T. Coy, Are breathing disturbances in elderly equivalent to sleep
apnea syndrome? Sleep, 1994. 17(1): p. 77-83.
38. Ancoli-Israel, S., et al., Sleep-disordered breathing in community-dwelling elderly. Sleep,
1991. 14(6): p. 486-95.
39. Ancoli-Israel, S., et al., Natural history of sleep disordered breathing in community

43
dwelling elderly. Sleep, 1993. 16(8 Suppl): p. S25-9.
40. Young, T., et al., Predictors of sleep-disordered breathing in community-dwelling adults:
the Sleep Heart Health Study. Arch Intern Med, 2002. 162(8): p. 893-900.
41. Coughlin, S.R., et al., Obstructive sleep apnoea is independently associated with an
increased prevalence of metabolic syndrome. Eur Heart J, 2004. 25(9): p. 735-41.
42. Peled, N., et al., Association of elevated levels of vascular endothelial growth factor in
obstructive sleep apnea syndrome with patient age rather than with obstructive sleep
apnea syndrome severity. Respiration, 2007. 74(1): p. 50-5.
43. Hu, F.B., et al., Physical activity and risk for cardiovascular events in diabetic women.
Ann Intern Med, 2001. 134(2): p. 96-105.
44. Kriska, A., Physical activity and the prevention of type 2 diabetes mellitus: how much for
how long? Sports Med, 2000. 29(3): p. 147-51.
45. Chasens, E.R., M.G. Umlauf, and T.E. Weaver, Sleepiness, physical activity, and
functional outcomes in veterans with type 2 diabetes. Appl Nurs Res, 2009. 22(3): p. 176-
82.
46. Quan, S.F., et al., Association of physical activity with sleep-disordered breathing. Sleep
Breath, 2007. 11(3): p. 149-57.
47. Vasquez, M.M., et al., Associations of dietary intake and physical activity with sleep
disordered breathing in the Apnea Positive Pressure Long-Term Efficacy Study
(APPLES). J Clin Sleep Med, 2008. 4(5): p. 411-8.
48. Roley, S.S., et al., Occupational therapy practice framework: domain & practice, 2nd
edition. Am J Occup Ther, 2008. 62(6): p. 625-83.
49. Fleg, J.L., et al., Assessment of functional capacity in clinical and research applications:
An advisory from the Committee on Exercise, Rehabilitation, and Prevention, Council on
Clinical Cardiology, American Heart Association. Circulation, 2000. 102(13): p. 1591-7.
50. Chang, J.A. and V.F. Froelicher, Clinical and exercise test markers of prognosis in
patients with stable coronary artery disease. Curr Probl Cardiol, 1994. 19(9): p. 533-87.
51. Pate, R.R., et al., Physical activity and public health. A recommendation from the Centers
for Disease Control and Prevention and the American College of Sports Medicine.
JAMA, 1995. 273(5): p. 402-7.

44
52. Myers, J., et al., Exercise capacity and mortality among men referred for exercise testing.
N Engl J Med, 2002. 346(11): p. 793-801.
53. Miniño AM, X.J., Kochanek KD, and Murphy SL, National Vital Statistics Report: Life
expectancy at birth, at 65 years of age, and at 75 years of age, by sex, race, and Hispanic
origin: United States, selected years 1900–2009, C.f.D.C.a. Prevention, Editor 2011:
Hyattsville, MD.
54. Anderson, L., The State of Aging and Health in America, 2007, CDC
55. Hoyert, D.L.a.J.X., National Vital Statistics Reports: Deaths: Preliminary Data for 2011.
2012. 61(6).
56. Cronin, O., P.J. Walker, and J. Golledge, The association of obesity with abdominal
aortic aneurysm presence and growth. Atherosclerosis, 2012.
57. Ailawadi, G., J.L. Eliason, and G.R. Upchurch, Jr., Current concepts in the pathogenesis
of abdominal aortic aneurysm. J Vasc Surg, 2003. 38(3): p. 584-8.
58. Ailawadi, G., et al., A nonintrinsic regional basis for increased infrarenal aortic MMP-9
expression and activity. J Vasc Surg, 2003. 37(5): p. 1059-66.
59. CDC, The State of Aging and Health in America 2007, 2007, The Merck Company
Foundation: Whitehouse Station, NJ.
60. CDC. Obesity: Halting the Epidemic By Making Health Easier. 2011 [cited 2012;
Available from:
http://www.cdc.gov/chronicdisease/resources/publications/aag/obesity.htm.
61. Sullivan, M., et al., Swedish obese subjects (SOS)--an intervention study of obesity.
Baseline evaluation of health and psychosocial functioning in the first 1743 subjects
examined. Int J Obes Relat Metab Disord, 1993. 17(9): p. 503-12.
62. Stagnitti, M., Trends in Health Care Expenditures by Body Mass Index (BMI) Category
for Adults in the U.S. Civilian Noninstitutionalized Population, 2001 and 2006., 2009,
Agency for Healthcare Research and Quality.
63. Fontaine, K.R., et al., Years of life lost due to obesity. JAMA, 2003. 289(2): p. 187-93.
64. Peeters, A., et al., Improvements in treatment of coronary heart disease and cessation of
stroke mortality rate decline. Stroke, 2003. 34(7): p. 1610-4.
65. Adams, K.F., et al., Overweight, obesity, and mortality in a large prospective cohort of

45
persons 50 to 71 years old. N Engl J Med, 2006. 355(8): p. 763-78.
66. Calle, E.E., et al., Overweight, obesity, and mortality from cancer in a prospectively
studied cohort of U.S. adults. N Engl J Med, 2003. 348(17): p. 1625-38.
67. Rogers, R.G., R.A. Hummer, and P.M. Krueger, The effect of obesity on overall,
circulatory disease- and diabetes-specific mortality. J Biosoc Sci, 2003. 35(1): p. 107-29.
68. Finkelstein, E.A., et al., Annual medical spending attributable to obesity: payer-and
service-specific estimates. Health Aff (Millwood), 2009. 28(5): p. w822-31.
69. Wang, Y.C., et al., Health and economic burden of the projected obesity trends in the
USA and the UK. Lancet, 2011. 378(9793): p. 815-25.
70. Garry, P.J., et al., Longitudinal study of dietary intakes and plasma lipids in healthy
elderly men and women. Am J Clin Nutr, 1992. 55(3): p. 682-8.
71. Hallfrisch, J., et al., Continuing diet trends in men: the Baltimore Longitudinal Study of
Aging (1961-1987). J Gerontol, 1990. 45(6): p. M186-91.
72. Elia, M., P. Ritz, and R.J. Stubbs, Total energy expenditure in the elderly. Eur J Clin
Nutr, 2000. 54 Suppl 3: p. S92-103.
73. van Coevorden, A., et al., Decreased basal and stimulated thyrotropin secretion in
healthy elderly men. J Clin Endocrinol Metab, 1989. 69(1): p. 177-85.
74. Halter, J.B., Carbohydrate Metabolism, in Handbook of Physiology and Aging1995:
Bethesday, MD. p. 119-145.
75. Harris, M.I., et al., Prevalence of diabetes, impaired fasting glucose, and impaired
glucose tolerance in U.S. adults. The Third National Health and Nutrition Examination
Survey, 1988-1994. Diabetes Care, 1998. 21(4): p. 518-24.
76. CDC. Behavioral Risk Factor Surveillance System (Prevalence Data). [cited 2012
August 8]; Available from: http://www.cdc.gov/brfss
77. CDC. Physical Activity. Healthy Places 2012 [cited 2012 September 21]; Available
from: http://www.cdc.gov/healthyplaces/healthtopics/physactivity.htm.
78. McGinnis, J.M. and W.H. Foege, Actual causes of death in the United States. JAMA,
1993. 270(18): p. 2207-12.

46
79. Hahn, R.A., et al., Excess deaths from nine chronic diseases in the United States, 1986.
JAMA, 1990. 264(20): p. 2654-9.
80. Davies, R.J., N.J. Ali, and J.R. Stradling, Neck circumference and other clinical features
in the diagnosis of the obstructive sleep apnoea syndrome. Thorax, 1992. 47(2): p. 101-5.
81. Seneviratne, U. and K. Puvanendran, Excessive daytime sleepiness in obstructive sleep
apnea: prevalence, severity, and predictors. Sleep Med, 2004. 5(4): p. 339-43.
82. Abrishami, A., A. Khajehdehi, and F. Chung, A systematic review of screening
questionnaires for obstructive sleep apnea. Can J Anaesth, 2010. 57(5): p. 423-38.
83. Ramachandran, S.K. and L.A. Josephs, A meta-analysis of clinical screening tests for
obstructive sleep apnea. Anesthesiology, 2009. 110(4): p. 928-39.
84. Somers, V.K., et al., Sympathetic neural mechanisms in obstructive sleep apnea. J Clin
Invest, 1995. 96(4): p. 1897-904.
85. Narkiewicz, K., et al., Baroreflex control of sympathetic nerve activity and heart rate in
obstructive sleep apnea. Hypertension, 1998. 32(6): p. 1039-43.
86. Shahar, E., et al., Sleep-disordered breathing and cardiovascular disease: cross-sectional
results of the Sleep Heart Health Study. Am J Respir Crit Care Med, 2001. 163(1): p. 19-
25.
87. Kraiczi, H., et al., Impairment of vascular endothelial function and left ventricular filling
: association with the severity of apnea-induced hypoxemia during sleep. Chest, 2001.
119(4): p. 1085-91.
88. Nieto, F.J., et al., Sleep apnea and markers of vascular endothelial function in a large
community sample of older adults. Am J Respir Crit Care Med, 2004. 169(3): p. 354-60.
89. Ip, M.S., et al., Obstructive sleep apnea is independently associated with insulin
resistance. Am J Respir Crit Care Med, 2002. 165(5): p. 670-6.
90. Millman, R.P., et al., Daytime hypertension in obstructive sleep apnea. Prevalence and
contributing risk factors. Chest, 1991. 99(4): p. 861-6.
91. Enright, P.L., et al., Prevalence and correlates of snoring and observed apneas in 5,201
older adults. Sleep, 1996. 19(7): p. 531-8.
92. Foley, D.J., et al., Associations of symptoms of sleep apnea with cardiovascular disease,
cognitive impairment, and mortality among older Japanese-American men. J Am Geriatr

47
Soc, 1999. 47(5): p. 524-8.
93. Ingram, F., et al., Sleep apnea and vigilance performance in a community-dwelling older
sample. Sleep, 1994. 17(3): p. 248-52.
94. Young, T., Sleep-disordered breathing in older adults: is it a condition distinct from that
in middle-aged adults? Sleep, 1996. 19(7): p. 529-30.
95. Morris, J.N., et al., Exercise in leisure time: coronary attack and death rates. Br Heart J,
1990. 63(6): p. 325-34.
96. Powell, K.E., et al., Physical activity and the incidence of coronary heart disease. Annu
Rev Public Health, 1987. 8: p. 253-87.
97. Fletcher, G.F., et al., Statement on exercise: benefits and recommendations for physical
activity programs for all Americans. A statement for health professionals by the
Committee on Exercise and Cardiac Rehabilitation of the Council on Clinical
Cardiology, American Heart Association. Circulation, 1996. 94(4): p. 857-62.
98. Adamopoulos, S., et al., Physical training improves skeletal muscle metabolism in
patients with chronic heart failure. J Am Coll Cardiol, 1993. 21(5): p. 1101-6.
99. Coats, A.J., et al., Controlled trial of physical training in chronic heart failure. Exercise
performance, hemodynamics, ventilation, and autonomic function. Circulation, 1992.
85(6): p. 2119-31.
100. Hambrecht, R., et al., Physical training in patients with stable chronic heart failure:
effects on cardiorespiratory fitness and ultrastructural abnormalities of leg muscles. J
Am Coll Cardiol, 1995. 25(6): p. 1239-49.
101. Sullivan, M.J., M.B. Higginbotham, and F.R. Cobb, Exercise training in patients with
chronic heart failure delays ventilatory anaerobic threshold and improves submaximal
exercise performance. Circulation, 1989. 79(2): p. 324-9.
102. King, D.S., et al., Effects of exercise and lack of exercise on insulin sensitivity and
responsiveness. J Appl Physiol, 1988. 64(5): p. 1942-6.
103. Rosenthal, M., et al., Demonstration of a relationship between level of physical training
and insulin-stimulated glucose utilization in normal humans. Diabetes, 1983. 32(5): p.
408-11.
104. Tran, Z.V. and A. Weltman, Differential effects of exercise on serum lipid and
lipoprotein levels seen with changes in body weight. A meta-analysis. JAMA, 1985.

48
254(7): p. 919-24.
105. Ades, P.A., et al., Exercise conditioning in the elderly coronary patient. J Am Geriatr
Soc, 1987. 35(2): p. 121-4.
106. Evans, W.J., Effects of exercise on body composition and functional capacity of the
elderly. J Gerontol A Biol Sci Med Sci, 1995. 50 Spec No: p. 147-50.
107. Kohrt, W.M. and J.O. Holloszy, Loss of skeletal muscle mass with aging: effect on
glucose tolerance. J Gerontol A Biol Sci Med Sci, 1995. 50 Spec No: p. 68-72.
108. Ghilarducci, L.E., R.G. Holly, and E.A. Amsterdam, Effects of high resistance training in
coronary artery disease. Am J Cardiol, 1989. 64(14): p. 866-70.
109. Sparling, P.B., et al., Strength training in a cardiac rehabilitation program: a six-month
follow-up. Arch Phys Med Rehabil, 1990. 71(2): p. 148-52.
110. Butler, R.N., et al., Physical fitness: benefits of exercise for the older patient. 2.
Geriatrics, 1998. 53(10): p. 46, 49-52, 61-2.
111. Blair, S.N., et al., Changes in physical fitness and all-cause mortality. A prospective
study of healthy and unhealthy men. JAMA, 1995. 273(14): p. 1093-8.
112. Lee, I.M., C.C. Hsieh, and R.S. Paffenbarger, Jr., Exercise intensity and longevity in men.
The Harvard Alumni Health Study. JAMA, 1995. 273(15): p. 1179-84.
113. Hasan, J., et al., Exercise habits and sleep in a middle-aged Finnish population. Acta
Physiol Scand Suppl, 1988. 574: p. 33-5.
114. Urponen, H., et al., Self-evaluations of factors promoting and disturbing sleep: an
epidemiological survey in Finland. Soc Sci Med, 1988. 26(4): p. 443-50.
115. Vuori, I., et al., Epidemiology of exercise effects on sleep. Acta Physiol Scand Suppl,
1988. 574: p. 3-7.
116. Sherrill, D.L., K. Kotchou, and S.F. Quan, Association of physical activity and human
sleep disorders. Arch Intern Med, 1998. 158(17): p. 1894-8.
117. Loprinzi, P.D.a.B.J.C., Association between objectively-measured physical activity and
sleep, NHANES 2005–2006. Mental Health and Physical Activity, 2011. 4(2): p. 65-69.
118. Peppard, P.E. and T. Young, Exercise and sleep-disordered breathing: an association

49
independent of body habitus. Sleep, 2004. 27(3): p. 480-4.
119. Chasens, E.R., Obstructive sleep apnea, daytime sleepiness, and type 2 diabetes. Diabetes
Educ, 2007. 33(3): p. 475-82.
120. Chasens, E.R., et al., Subjective and objective appraisal of activity in adults with
obstructive sleep apnea. J Aging Res, 2011. 2011: p. 751819.
121. Avogaro P, C.G., Enzi G, Tiengo A, Associazione di iperlipidemia, diabete mellito e
obesità di medio grado. Acta Diabetol Lat, 1967. 4: p. 36-41.
122. Grundy, S.M., Metabolic syndrome: a multiplex cardiovascular risk factor. J Clin
Endocrinol Metab, 2007. 92(2): p. 399-404.
123. Lakka, H.M., et al., Abdominal obesity is associated with increased risk of acute
coronary events in men. Eur Heart J, 2002. 23(9): p. 706-13.
124. Golden, S.H., et al., Risk factor groupings related to insulin resistance and their
synergistic effects on subclinical atherosclerosis: the atherosclerosis risk in communities
study. Diabetes, 2002. 51(10): p. 3069-76.
125. Veronica, G. and R.R. Esther, Aging, metabolic syndrome and the heart. Aging Dis,
2012. 3(3): p. 269-79.
126. Das, U.N., Is metabolic syndrome X an inflammatory condition? Exp Biol Med
(Maywood), 2002. 227(11): p. 989-97.
127. Intengan, H.D. and E.L. Schiffrin, Vascular remodeling in hypertension: roles of
apoptosis, inflammation, and fibrosis. Hypertension, 2001. 38(3 Pt 2): p. 581-7.
128. Lyon, C.J., R.E. Law, and W.A. Hsueh, Minireview: adiposity, inflammation, and
atherogenesis. Endocrinology, 2003. 144(6): p. 2195-200.
129. Wu, D., et al., Aging up-regulates expression of inflammatory mediators in mouse
adipose tissue. J Immunol, 2007. 179(7): p. 4829-39.
130. Fliers, E., et al., White adipose tissue: getting nervous. J Neuroendocrinol, 2003. 15(11):
p. 1005-10.
131. Coughlin, S., P. Calverley, and J. Wilding, Sleep disordered breathing--a new component
of syndrome x? Obes Rev, 2001. 2(4): p. 267-74.

50
132. Vgontzas, A.N., E.O. Bixler, and G.P. Chrousos, Sleep apnea is a manifestation of the
metabolic syndrome. Sleep Med Rev, 2005. 9(3): p. 211-24.
133. Kostoglou-Athanassiou, I. and P. Athanassiou, Metabolic syndrome and sleep apnea.
Hippokratia, 2008. 12(2): p. 81-6.
134. Gami, A.S. and V.K. Somers, Obstructive sleep apnoea, metabolic syndrome, and
cardiovascular outcomes. Eur Heart J, 2004. 25(9): p. 709-11.
135. Vgontzas, A.N., et al., Sleep apnea and daytime sleepiness and fatigue: relation to
visceral obesity, insulin resistance, and hypercytokinemia. J Clin Endocrinol Metab,
2000. 85(3): p. 1151-8.
136. Vgontzas, A.N., et al., Elevation of plasma cytokines in disorders of excessive daytime
sleepiness: role of sleep disturbance and obesity. J Clin Endocrinol Metab, 1997. 82(5):
p. 1313-6.
137. Vgontzas, A.N., et al., Marked decrease in sleepiness in patients with sleep apnea by
etanercept, a tumor necrosis factor-alpha antagonist. J Clin Endocrinol Metab, 2004.
89(9): p. 4409-13.
138. Fleg, J.L. and E.G. Lakatta, Role of muscle loss in the age-associated reduction in VO2
max. J Appl Physiol, 1988. 65(3): p. 1147-51.
139. Schulman, S.P., et al., Continuum of cardiovascular performance across a broad range
of fitness levels in healthy older men. Circulation, 1996. 94(3): p. 359-67.
140. Melo, R.C., et al., Effects of age and physical activity on the autonomic control of heart
rate in healthy men. Braz J Med Biol Res, 2005. 38(9): p. 1331-8.
141. Lauretani, F., et al., Age-associated changes in skeletal muscles and their effect on
mobility: an operational diagnosis of sarcopenia. J Appl Physiol, 2003. 95(5): p. 1851-
60.
142. Prescription, A.s.G.f.E.T.a., ACSM’s Guidelines for Exercise Testing and Prescription.
8th ed. ed2009, Baltimore, MD: Lippincott Williams & Wilkins.
143. Yu, C.M., et al., Clinical predictors of morbidity and mortality in patients with
myocardial infarction or revascularization who underwent cardiac rehabilitation, and
importance of diabetes mellitus and exercise capacity. Am J Cardiol, 2000. 85(3): p. 344-
9.
144. Gitt, A.K., et al., Exercise anaerobic threshold and ventilatory efficiency identify heart

51
failure patients for high risk of early death. Circulation, 2002. 106(24): p. 3079-84.
145. Chua, T.P., et al., Clinical correlates and prognostic significance of the ventilatory
response to exercise in chronic heart failure. J Am Coll Cardiol, 1997. 29(7): p. 1585-90.
146. Kleber, F.X., et al., Impairment of ventilatory efficiency in heart failure: prognostic
impact. Circulation, 2000. 101(24): p. 2803-9.
147. Kravariti, M., et al., Predictors of endothelial dysfunction in young women with
polycystic ovary syndrome. J Clin Endocrinol Metab, 2005. 90(9): p. 5088-95.
148. Cole, C.R., et al., Heart rate recovery after submaximal exercise testing as a predictor of
mortality in a cardiovascularly healthy cohort. Ann Intern Med, 2000. 132(7): p. 552-5.
149. Nishime, E.O., et al., Heart rate recovery and treadmill exercise score as predictors of
mortality in patients referred for exercise ECG. JAMA, 2000. 284(11): p. 1392-8.
150. Myers, J., et al., Cardiopulmonary exercise testing in small abdominal aortic aneurysm:
profile, safety, and mortality estimates. Eur J Cardiovasc Prev Rehabil, 2011. 18(3): p.
459-66.
151. Vanuxem, D., et al., Impairment of muscle energy metabolism in patients with sleep
apnoea syndrome. Respir Med, 1997. 91(9): p. 551-7.
152. Przybylowski, T., et al., Exercise capacity in patients with obstructive sleep apnea
syndrome. J Physiol Pharmacol, 2007. 58 Suppl 5(Pt 2): p. 563-74.
153. Nanas, S., et al., Heart rate recovery and oxygen kinetics after exercise in obstructive
sleep apnea syndrome. Clin Cardiol, 2010. 33(1): p. 46-51.
154. Ching-Chi L, C.-K.L., Kun-Ming W, Effect of treatment by nasal CPAP on
cardiopulmonary exercise test in obstructive sleep apnea syndrome. Lung 2004(182): p.
199-212.
155. Aron, A., et al., Potential clinical use of cardiopulmonary exercise testing in obstructive
sleep apnea hypopnea syndrome. Int J Cardiol, 2009. 132(2): p. 176-86.
156. Robinson, G.V., J.R. Stradling, and R.J. Davies, Sleep . 6: obstructive sleep
apnoea/hypopnoea syndrome and hypertension. Thorax, 2004. 59(12): p. 1089-94.
157. Aydin, M., et al., Cardiac autonomic activity in obstructive sleep apnea: time-dependent
and spectral analysis of heart rate variability using 24-hour Holter electrocardiograms.

52
Tex Heart Inst J, 2004. 31(2): p. 132-6.
158. Kaleth, A.S., et al., Unique cardiopulmonary exercise test responses in overweight
middle-aged adults with obstructive sleep apnea. Sleep Med, 2007. 8(2): p. 160-8.
159. Hargens, T.A., et al., Attenuated heart rate recovery following exercise testing in
overweight young men with untreated obstructive sleep apnea. Sleep, 2008. 31(1): p.
104-10.
160. Myers, J., et al., Comparison of the ramp versus standard exercise protocols. J Am Coll
Cardiol, 1991. 17(6): p. 1334-42.
161. Ahmadi, N., et al., The Berlin questionnaire for sleep apnea in a sleep clinic population:
relationship to polysomnographic measurement of respiratory disturbance. Sleep Breath,
2008. 12(1): p. 39-45.
162. Netzer, N.C., et al., Using the Berlin Questionnaire to identify patients at risk for the
sleep apnea syndrome. Ann Intern Med, 1999. 131(7): p. 485-91.
163. Weinreich, G., et al., [Is the Berlin questionnaire an appropriate diagnostic tool for sleep
medicine in pneumological rehabilitation?]. Pneumologie, 2006. 60(12): p. 737-42.
164. Sharma, S.K., et al., Validation of the modified Berlin questionnaire to identify patients at
risk for the obstructive sleep apnoea syndrome. Indian J Med Res, 2006. 124(3): p. 281-
90.
165. Paffenbarger, R.S., Jr., et al., Physical activity, all-cause mortality, and longevity of
college alumni. N Engl J Med, 1986. 314(10): p. 605-13.
166. Bassett, D.R., et al., Energy cost of stair climbing and descending on the college alumnus
questionnaire. Med Sci Sports Exerc, 1997. 29(9): p. 1250-4.
167. Ainsworth, B.E., et al., Compendium of physical activities: classification of energy costs
of human physical activities. Med Sci Sports Exerc, 1993. 25(1): p. 71-80.
168. Myers, J., et al., Fitness versus physical activity patterns in predicting mortality in men.
Am J Med, 2004. 117(12): p. 912-8.
169. Borg, G., Borg’s Perceived Exertion Scales1998, Champaign, IL: Human Kinetics
Publishers.
170. Sforza, E., et al., Is the Berlin questionnaire a useful tool to diagnose obstructive sleep
apnea in the elderly? Sleep Med, 2011. 12(2): p. 142-6.

53
171. Singh, K., et al., Prevalence of and risk factors for abdominal aortic aneurysms in a
population-based study : The Tromso Study. Am J Epidemiol, 2001. 154(3): p. 236-44.
172. Activities of Daily Living Evaluation, in Encyclopedia of Nursing & Allied Health, I.
Kristine Krapp. Gale Group, Editor 2002.
173. Malhotra, A. and D.P. White, Obstructive sleep apnoea. Lancet, 2002. 360(9328): p. 237-
45.
174. Walker HK, H.W., Hurst JW, Clinical Methods: The History, Physical, and Laboratory
Examinations. 3rd ed1990, Boston, MA: Butterworths.
175. Matthews, D.R., et al., Homeostasis model assessment: insulin resistance and beta-cell
function from fasting plasma glucose and insulin concentrations in man. Diabetologia,
1985. 28(7): p. 412-9.
176. Arner, P., The adipocyte in insulin resistance: key molecules and the impact of the
thiazolidinediones. Trends Endocrinol Metab, 2003. 14(3): p. 137-45.

54
CHAPTER TWO
OBSTRUCTIVE SLEEP APNEA RISK IN ABDOMINAL AORTIC ANEURYSM
DISEASE PATIENTS: ASSOCIATIONS WITH PHYSICAL ACTIVITY STATUS
ABSTRACT
Objectives: Evaluate risk of obstructive sleep apnea (OSA) in a sample of elderly adults with
abdominal aortic aneurysm (AAA) disease and examine associations between OSA risk and self-
report physical activity (PA). Methods: 326 elderly volunteer subjects with newly diagnosed
small AAAs participated. Study methods for all participants included extraction of medical
history and drug information from medical records; completion of a physical examination with
study personnel to assess resting vitals and measures of body habitus including body mass index
(BMI) calculation; and completion of questionnaires with verification of responses completed by
interviews with study staff, to assess PA behavior and OSA risk. Subjects were classified as
High-Risk or Low-Risk for OSA, using the Berlin Questionnaire (BQ); to further examine
gradations in OSA risk, subjects were also classified by their Berlin Risk Score (BRS), as
determined by summing the three categorical scores from the BQ (BRS 0, 1, 2, or 3).
Results: A high proportion of study patients (57%) were at increased risk for OSA; these
subjects had higher body mass indexes (BMIs) and measures of body habitus (waist and hip
circumferences and waist/hip ratio) and a higher proportion were taking anti-hypertensive
medications than Low-risk subjects. Subjects at High- Risk for OSA reported fewer blocks
walked/day, flights of stairs climbed/day, and expended fewer kilo-calories engaging in these
activities compared to their Low-risk counterparts, independent of obesity. Discussion: Elderly
AAA patients at High-risk for OSA demonstrated higher measures of body habitus and
controlled HTN and report engaging in less daily moderate and vigorous PA, compared to their
low-risk counterparts, independent of obesity. These findings may have important implications

55
for cardiovascular fitness and mortality, as well as all-cause mortality for elderly AAA disease
patients at risk for OSA. The importance of daily moderate to vigorous PA should be stressed
to elderly patients at risk for OSA and they should strive to meet the recommended levels for
daily PA.

56
INTRODUCTION
Obstructive sleep apnea (OSA) is characterized by repetitive bouts of upper airway
occlusion or collapse during sleep, resulting in intermittent periods of hypoxia, hypercapnia, and
fragmented sleep [1]. OSA is the most common sleep related breathing disorder, affecting an
estimated 20% of the U.S. adult population [2]; Prevalence of OSA is difficult to quantify, as up
to 90% of people with the disorder remain undiagnosed [3], though it is anticipated to rise as an
increasing proportion of Americans are obese and elderly, both of which are risk factors for
OSA. Obesity is the primary risk factor for OSA; OSA is present in 40% of obese persons and
more than 80% of individuals with OSA are also obese [4]. Untreated OSA can increase risk for
several chronic diseases and disorders including obesity, hypertension (HTN) and cardiovascular
disease (CVD), metabolic disorders, depression, and aortic disease [5-13]; however, the
mechanism(s) linking OSA to HTN and CVD remains undetermined. Repetitive nighttime apneas
and hypopneas (cessations and pauses in breathing) result in activation of the sympathetic
nervous system (SNS) and stressful arousals to reestablish breathing. It has been determined that
OSA patients demonstrate an exaggerated activation of the SNS that persists into waking hours
that can lead to elevations in HR and BP [14]. Over time, activation of the baroreceptors, which
respond to normalize these HR and BP oscillations, become altered and depressed in OSA
patients [15], suggesting an impairment of the cardiovascular autonomic system, thereby
increasing risk for HTN and CVD.
The “gold standard” for diagnosing OSA is laboratory polysomnography (PSG);
however, sleep health questionnaires that stratify patients based on clinical symptoms, physical
examinations, and risk factors, are often employed as a first step assessment to screen for OSA.
Questionnaires that are commonly used to screen for OSA and have been validated against PSG,

57
include the Epworth Sleepiness Scale (ESS), Pittsburgh Sleep Quality Index (PSQI), Berlin
Questionnaire (BQ), and most recently, the STOP-Bang questionnaire. Sleep screening
questionnaires do not require complicated calculations to identify high risk patients, and they are
relatively easy and cost-effective to apply clinically; however, there are also limitations. Sleep
questionnaires rely on self-report and disclosure of signs and symptoms, as well as the patient’s
memory and ability and willingness to follow instructions. Additionally, many of the signs and
symptoms of OSA may be difficult for the patient to self-identify, such as snoring and choking
during sleep, and can be misinterpreted as other conditions; however, the BQ is regarded for its
high specificity and sensitivity for predicting moderate to severe OSA [16] and is also among the
most accurate screening questionnaires for OSA [17].
Sleep disorders, specifically OSA, are highly prevalent in older adults; the Sleep Heart
Health Study found that among 6,400 older adults, sleep disordered breathing (SDB) prevalence
rates for mild to severe SDB ranged from 19-36% for adults 60-98 years old [18]. These rates far
outpace those for middle aged adults, age 30-60 years old, whose SDB rates were 2-4% for
women and men [19]. One cohort study found that for adults 71-100 years, the prevalence of
mild OSA was 80% and moderate OSA was 49% for women and 57% for men [20, 21]. Despite
these high prevalence rates, studies have suggested that most of the age-related increase in
prevalence of OSA occurs before age 65 and plateaus at some point after age 65 [22, 23].
Recently, OSA was determined to be highly prevalent among patients with AAA disease,
a disease of the elderly in which the lower part of the aorta is weakened and bulging. Moderate
or severe OSA was present in 42% of subjects with AAA disease [24]. One very recent report
suggests that OSA may not only be a risk for factor for aortic disease [10], but a causal factor
for AAA expansion [24]. AAA disease is prevalent in the elderly, most often

58
occurring in people age 60 years and older, and AAA presence is associated with overweight and
obesity [25].
Increases in chronic diseases and disabilities that often accompany aging, in addition to
AAA disease, may limit the daily activities of older adults and reduce health-related quality of
life. Approximately 80% of older Americans have at least one and 50% have at least two chronic
conditions, such as obesity, cardiovascular disease (CVD), type II diabetes, or cancer [26].
Chronic diseases and disabilities that often accompany aging may limit the daily activities of
older adults, reduce health-related quality of life and attribute to the reductions in physical
activity (PA) seen in older adults. A 2003 study found that nearly 57% of older adults did not
meet the guidelines for PA recommended by the Centers for Disease Control and Prevention [27]
for older adults, which includes 150 minutes of moderate intensity aerobic activity each week, or
75 minutes of vigorous intensity aerobic activity, in addition to two days each week of muscle-
strengthening activities that work all major muscle groups [28]. Conversely, physical inactivity
and a sedentary lifestyle contribute to and exacerbate many chronic diseases that are the leading
causes of death in the U.S [29]. Three studies from the last two decades clearly point to poor
health behaviors, including diet, physical inactivity, and smoking, as accountable for somewhere
between 14-35% of the deaths each year that are attributable chronic diseases [30-32].
Regular PA is important for improving the health and wellbeing of people of all ages.
PA, defined as any movement that involves physical effort, is not synonymous with exercise but
also includes lifestyle activity. Physical inactivity and cardiovascular mortality are directly
related and physical inactivity is an independent risk factor for the development of coronary
artery disease [33, 34]. Research has demonstrated that all individuals benefit from regular PA,
whether it be vigorous exercise or mild-level exertion activities. For older adults, PA can

59
improve mobility and physical functioning and ability to complete activities of daily living
(ADLs), in addition to having mental health benefits and improving quality of life. PA reduces
the risk of developing or dying from a host of chronic diseases, including CVD, diabetes, colon
cancer, and HTN [35, 36] and a dose-response relationship exists between the energy expended
through PA and all-cause mortality and CVD mortality in middle-aged and elderly populations
[37, 38]. Participation in regular exercise also has been shown to reduce the risk of developing
AAA disease [39] and may limit progression of early AAA disease [40].
Epidemiological cross-sectional studies have shown that increased PA is associated with
better sleep [41-43] and a lower prevalence of sleep disorders [44]. Cross-sectional studies have
shown reduced odds of sleep disordered breathing (SDB) with increasing PA independent of
body habitus [45]. Additionally, PA, particularly vigorous PA, appears to be protective against
the presence of SDB [45, 46]. Findings from several studies using subjective measures of activity
indicate that increased OSA severity is associated with decreased PA in young and pre-elderly
populations [45, 47, 48]. Thus far, associations between OSA and PA have not been
systematically studied in an elderly population, particularly not among those expected to be
habitually less active due to influences of aging and AAA disease.
OBJECTIVES
The purpose of this study was two-fold: to determine the proportion of patients at risk
for OSA, as assessed from the Berlin Questionnaire (BQ), in a convenience sample of elderly
patients with newly diagnosed AAA disease and; to examine the possible associations between
OSA risk and self-report PA behavior in this group.

60
METHODS
Subjects
Patients (n=326) with newly diagnosed small AAAs (aortic diameter ≥2.5 and < 5.5 cm)
were recruited from Stanford University Medical Center, the Veterans Affairs Palo Alto Health
Care System (VAPAHCS) and Kaiser Permanente of Northern California. Subjects were 50
years of age or older, agreed to comply with study protocols and procedures, and provided
voluntary consent to participate. Recruitment procedures and all study-related activities were
reviewed and approved in advance by Institutional Review Boards (IRBs) at Stanford University
(including VAPAHCS), Kaiser Permanente Division of Research, Virginia Polytechnic Institute
and State University (VPISU), and an independent Data Safety Monitoring Board (DSMB)
organized by the National Heart, Lung and Blood Institute (NHLBI). Additional details on
recruitment procedures can be found in Appendix A. Study methods for all participants included
extraction of medical history and drug information from medical records; physical assessment to
collect body habitus and resting BP measurements; completion of questionnaires, with
verification of subject answers completed by interview with study staff, for health history,
lifetime and recent occupational and recreational PA, and OSA risk.
Physical Examination and Health History
Subjects underwent a physical examination and medical history with study personnel to
assess resting systolic and diastolic blood pressure (BP), as well as measures of body habitus,
including height and weight for body mass index (BMI) calculation and waist (WC) and hip
circumference (HC) measurements, which were also used to calculate waist/hip (W/H) ratio.
Detailed assessment protocols for these measures are included in Appendix A. Subjects also

61
provided information on prescriptive medications they were receiving to determine the extent of
medically managed HTN, dyslipidemia, type II diabetes, and other diseases and disorders in the
sample.
Berlin Questionnaire
The modified Berlin Questionnaire (BQ) is a 12-item self-report questionnaire that
includes questions about risk factors for OSA that can be identified with three discrete
sign/symptom categories of 1.) snoring behavior, 2.) wake time sleepiness and fatigue, and 3.)
obesity and HTN. The modified BQ, an extension of the original BQ, includes three additional
questions regarding choking behavior and wake-time sleepiness. The modified BQ is a validated
instrument used to identify individuals who are at risk for OSA with a sensitivity (86%) and
specificity (95%) comparable to the original BQ [49-52]; positive and negative predictive values
of 96% and 82%, respectively, were reported for the modified BQ [52]. Subjects completed the
BQ and responses were confirmed and clarified by one-on-one interview between subject and
study personnel.
Patients were classified as Low- or High -Risk for OSA based on their responses to the
individual items on the BQ and their overall scores in the three symptom categories, according to
the scoring instructions detailed by Netzer and colleagues [50]. To further examine gradations in
OSA risk, subjects were also classified by their Berlin Risk Score (BRS), the sum of the three
categorical scores from the BQ. Subjects were grouped into one of four BRS groups which
equated to the number of categories that were scored positive from their BQ (BRS 0, 1, 2, or 3).
It should be noted that this is not a validated interpretation of the BQ, but simply an approach to

62
examine a more detailed analysis of risk for OSA from patient responses to the individual
questions and risk factor categories that comprise the BQ.
Veterans Affairs Physical Activity Questionnaire
The quantification of PA was recorded by use of the Veterans Affairs Physical Activity
Questionnaire (VAPAQ), modeled after the Harvard Alumni studies of Paffenbarger and
colleagues [34]. Respondents were asked to self-report the number of city blocks they walk and
the number of flights of stairs they climb on a typical day, as well as the occupational and
recreational activities they regularly participate in and responses were confirmed and clarified by
one-on-one interview between subject and study personnel. Energy cost of stairs climbed per
week was calculated using the estimation of Basset and associates [53]. One flight of stairs
equals 10 steps, and 12 blocks is considered 1 mile. Energy costs of activities were estimated
from the compendium of activities developed by Ainsworth and associates [54]. Energy
expenditure is expressed in terms of lifetime adulthood recreational and occupational PA.
Recreational PA is also expressed separately as energy expended during the previous year
(recent activity). The VAPAQ has been validated and successfully used in large numbers of
veteran patients and others as reported in previous publications and has been useful in predicting
all-cause mortality [40, 55].
Statistical Analyses
Data were stored electronically in a SPSS® (SPSS, Inc., Chicago, IL) database (Version
20.0). Statistical significance was determined a priori for all experimental analyses as a p value
< 0.05. Subject responses to the BQ were scored for subjects using the instructions adapted from

63
Netzer and colleagues [50] and used to classify subjects as High-Risk or Low-Risk for OSA,
using the clinical interpretation of the BQ. To further stratify subjects by OSA-risk, they also
were assigned a BRS, which was determined by summing the number of sub-scores for each of
the three categories (snoring, EDS, and HTN/BMI) of the BQ. Subjects thus were grouped into
one of four BRS groups for further analyses (BRS 0-3). Descriptive statistics were assessed to
observe means, standard deviations, and ranges for variables by group (BQ High- vs. Low-Risk
and BRS classifications) and independent sample t-test and one-way analysis of variance
(ANOVA) were used to compare means between two and four group comparisons, respectively,
for all dependent variables of interest related to self-report recreational and occupational PA.
Bonferroni post hoc analysis was performed to further examine differences between BRS groups
for all dependent variables of interest related to self-report recreational and occupational PA.
Although the subject sample was similar, group differences existed for BMI that may affect
relationships between dependent variables of interest related to PA and OSA risk; therefore,
when appropriate, a general linear model univariate procedure was performed, controlling for
BMI as a covariate.
RESULTS
Characteristics of Study Participants
Characteristics of the subject sample are displayed in Table 1. Characteristics by gender
can be found in Appendix D but are not presented here since characteristics were similar
between men and women, other than body habitus characteristics influenced by gender
differences. The majority of the subject sample was male (83%), mean age was 73.3 (8.5) yr, and
the group was overweight with a BMI of 29.3 (6.1) kg/m2
and demonstrated high values for

64
additional indices of body habitus, including WC, HC, and W/H ratio. Participants demonstrated
a slightly elevated systolic BP and a significant proportion of the subject sample was taking anti-
hypertensive medications (89%) and anti-lipemic medications (79%), respectively. Fewer
subjects were taking medications to control diabetes (21%).
OSA Risk and Characteristics of Study Participants by OSA Risk
Table 1 demonstrates the OSA risk classifications for the subject sample according to the
clinical interpretation of the BQ (Low- vs. High-risk for OSA). Men and women demonstrated
similar risk rates for OSA Risk Classification; a table detailing these proportions can be found in
Appendix D. A high proportion of the study sample was considered High-risk for OSA
according to the criteria for a clinically positive BQ score (57%).
The characteristics of the subject sample by High- and Low-risk for OSA as determined
from the clinical interpretation of the BQ are shown in Table 1. AAA size was similar between
BQ OSA-risk groups. The BQ High-risk group was younger and had an increased BMI
compared to the Low-risk group; additional indices of body habitus, including WC, HC, and
W/H ratio were higher in the BQ High-risk group compared to the BQ Low-risk group
(p<0.01). There was a significant relationship and correlation between age and BMI (F=13.5,
p<0.01; r=-0.20, p<0.01)); therefore, BMI was selected as the covariate and controlled for in
the analyses of PA, where appropriate. Resting BP was similar between groups, although a
higher proportion of the BQ High-risk OSA group was taking anti-hypertensive medications to
control BP (92% vs. 84%; p=0.05). Other classes of medications including anti-lipemics and
diabetic medications were similar between BQ High- and Low-risk OSA groups, respectively.

65
Table 1. Subject Characteristics by Clinical Berlin OSA Risk
Characteristic
Subject Sample,
n=326
BQ Low-Risk,
n=139
BQ High- Risk,
n=187
t
statistic
Pearson
Chi-Square
p value
Proportion (%)
_
43
57
_
7.07
<0.01
Age (yr)
73.3 (8.5)
74.5 (8.6)
72.3 (8.3)
2.30
_
<0.01
AAA size (cm)
3.5 (0.8)
3.5 (0.7)
3.5 (0.8)
-0.69
_
0.49
BMI (kg/m2)
29.3 (6.1)
27.6 (5.1)
30.5 (6.5)
-4.35
_
<0.01
WC (cm)
100.7 (15.2)
97.0 (14.2)
103.4 (15.2)
-3.69
_
<0.01
HC (cm)
105.4 (12.2)
102.8 (10.2)
107.2 (13.0)
-3.13
_
<0.01
W/H Ratio
0.95 (0.08)
0.94 (0.07)
0.96 (0.08)
-2.68
_
<0.01

66
SBP rest (mmHg)
142.3 (17.5)
143.3 (17.5)
141.6 (17.6)
0.83
_
0.41
DBP rest (mmHg)
76.6 (10.4)
76.3 (9.8)
76.8 (10.8)
-0.39
_
0.69
Anti-HTN Med (%)
89
84
92
-2.30
5.2
0.02
Anti-lipemic Med (%)
79
79
80
-3.32
0.11
0.74
Diabetic Med (%)
21
17
24
-1.43
2.03
0.15
Data are expressed as group Mean (Standard Deviation-SD). p values and t statistics for statistical differences between groups are
expressed. Medication data is presented as a group percentage (%) taking each class of medication. Abbreviations: AAA-abdominal
aortic aneurysm; BMI-body mass index; WC-waist circumference; HC-hip circumference; W/H-waist/hip; SBP-systolic blood
pressure; DBP-diastolic blood pressure; HTN-hypertension; Med-medication.

67
Table 2 demonstrates the stratification of the subject sample by BRS, a function of the
sum of the three categorical scores from the BQ. Subjects were grouped into one of four BRS
groups which equated to the number of categories that were scored positive from their BQ (BRS
0, 1, 2, or 3). Men and women demonstrated similar risk rates for each OSA Risk Classification;
a table detailing these proportions can be found in Appendix D. Few subjects were classified in
BRS 0 group (6%), while a moderate proportion of subjects were classified as BRS 1 or 2 (37%
and 41%), respectively. Approximately 17% of subjects were classified in the BRS 3 group. The
characteristics of the subject sample by BRS for OSA are also shown in Table 2. Age and AAA
size did not differ across the four BRS groups. BMI was higher among the BRS 3 group vs.
Berlin Risk Score 0, 1 and 2 groups, and was controlled for in the analyses of PA (p<0.01).
Additional indices of body habitus, including WC, HC, and W/H ratio were also higher among
the BRS 3 group (p<0.01). Resting BP did not differ across the four BRS groups; though
a lesser proportion of the BRS 0 group was taking anti-hypertensive medications to control BP
compared to the all other group (p<0.01). Use of medications to control diabetes and lipids
increased with BRS; diabetic medication use was significantly higher for the BRS 3 group
(p=0.02), but anti-lipemics was non-significant.

68
Table 2. Subject Characteristics by Berlin Risk Score
Characteristic
BRS 0, n=18
BRS 1, n=121
BRS 2, n=133
BRS 3, n=54
F ratio
Pearson
Chi Square
p value
Proportion (%)
6
37
41
17
110.4
<0.01
Age (yrs)
72.6 (9.5)
74.8 (8.5)
72.3 (7.9)
72.4 (9.4)
2.10
_
0.10
AAA size (cm)
3.2 (0.8)
3.5 (0.7)
3.6 (0.7)
3.4 (0.9)
1.32
_
0.27
BMI (kg/m
2)
24.4 (3.2) d
28.1 (5.2)
29.8 (6.3) ab
32.5 (6.6) e
11.5
_
<0.01
WC (cm)
89.6 (12.1) d
98.2 (14.2) b
101.8 (15.8) a
107.2 (13.2) c
8.05
_
<0.01
HC (cm)
97.8 (9.8) d
103.7 (10.1)
106.5 (13.6) a
109.0 (11.5) a
5.10
_
<0.01

69
W/H Ratio
0.91 (0.06) b
0.95 (0.08) b
0.96 (0.07)
0.99 (0.09) c
8.05
_
<0.01
SBP rest (mmHg)
144.7 (17.4)
143.1 (17.6)
140.5 (15.7)
144.3 (21.4)
0.82
_
0.48
DBP rest (mmHg)
77.8 (11.8)
76.1 (9.4)
76.6 (11.0)
77.2 (10.4)
0.23
_
0.88
Anti-HTN Med (%)
50
90 a
92 a
94 a
3.0
31.1
<0.01
Anti-lipemic Med (%)
72
80
77
88
0.95
2.88
0.41
Diabetic Med(%)
11b
18 b
18 b
38 e
3.47
10.2
0.02
Data are expressed as group Mean (SD). Medication data is presented as a group percentage (%) taking each class of medication. p
values and F ratios for statistical differences between groups are expressed. Bonferroni post-hoc comparisons were used to investigate
differences between BRS groups. a =different from BRS 0,
b =different from BRS 3,
c =different from BRS 0 and 1,
d =different from
70
BRS 2 and 3, and e
=different from BRS 0, 1 and 2. Abbreviations: AAA-abdominal aortic aneurysm; BMI-body mass index; WC-
waist circumference; HC-hip circumference; W/H-waist/hip; SBP-systolic blood pressure; DBP-diastolic blood pressure; HTN-
hypertension; Med-medication.

Physical Activity by OSA Risk
Tables 3 and 4 show the PA indices by Clinical BQ and BRS, respectively. After
controlling for group differences in BMI, High-Risk OSA subjects, as indicated from the clinical
interpretation of the BQ, demonstrated fewer blocks walked/day (p<0.02), flights of stairs
climbed/day (p=0.03), and expended fewer daily kcals (p<0.01) engaging in these activities
compared to their Low-risk counterparts. BQ High- and Low-risk OSA groups did not differ on
other indices of occupational or recreational PA. Although use of anti-HTN medications was
higher among the BQ High-Risk OSA group, it was not a significant predictor of OSA-risk
group assignment (p=0.12) and was therefore not controlled for in these analyses.
After controlling for group differences in BMI, subjects classified in the BRS 3
group demonstrated significantly fewer blocks walked/day (p<0.03), flights of stairs
climbed/day (p=0.02), and expended fewer daily kcals (p=0.02) engaging in these activities
compared to participants in the BRS 0 and 1 groups, respectively. Group classification by
BRS did not influence other indices of occupational and recreational PA. Although use of
diabetic medications differed among BRS groups, it was not a significant predictor of BRS
group assignment (p=0.26) and was therefore not controlled for in these analyses.
71

72
Table 3. Physical Activity by Clinical Berlin Risk
VAPAQ Variable
BQ Low-Risk, n=139
BQ High- Risk, n=187
t statistic/F
ratio
p value
Blocks Walked/Day
7.5 (11.3)
4.9 (7.9)
2.34 / 5.59
0.02 / 0.02
Stair Flights Climbed/Day
2.8 (6.4)
1.4 (2.8)
2.14 / 4.53
0.03 / 0.03
Blocks and Stairs/Day
(kcals)
82 (102)
49 (69)
2.39 / 8.70
<0.01 / <0.01
Occupational Activity/Week
(kcals)
7400 (3136)
7618 (3015)
-0.56
0.59
Occupational and
Recreational Activity/Week
(kcals)
8251 (3301)
8509 (3162)
-0.62
0.53

73
Last Year Recreational
Activity (kcals/week)
1272 (1035)
1150 (1018)
0.89
0.38
Lifetime Recreational
Activity (kcals/week)
933 (878)
914 (985)
0.15
0.88
Data are expressed as group Mean and Standard Deviation (SD). BMI was controlled for in the analyses; p values and F ratios for
statistical significance between groups are expressed as without the covariate / with the covariate, where appropriate. Abbreviations:
VAPAQ-Veterans Affairs Physical Activity Questionnaire; BQ-Berlin Questionnaire; kcals-kilocalories.
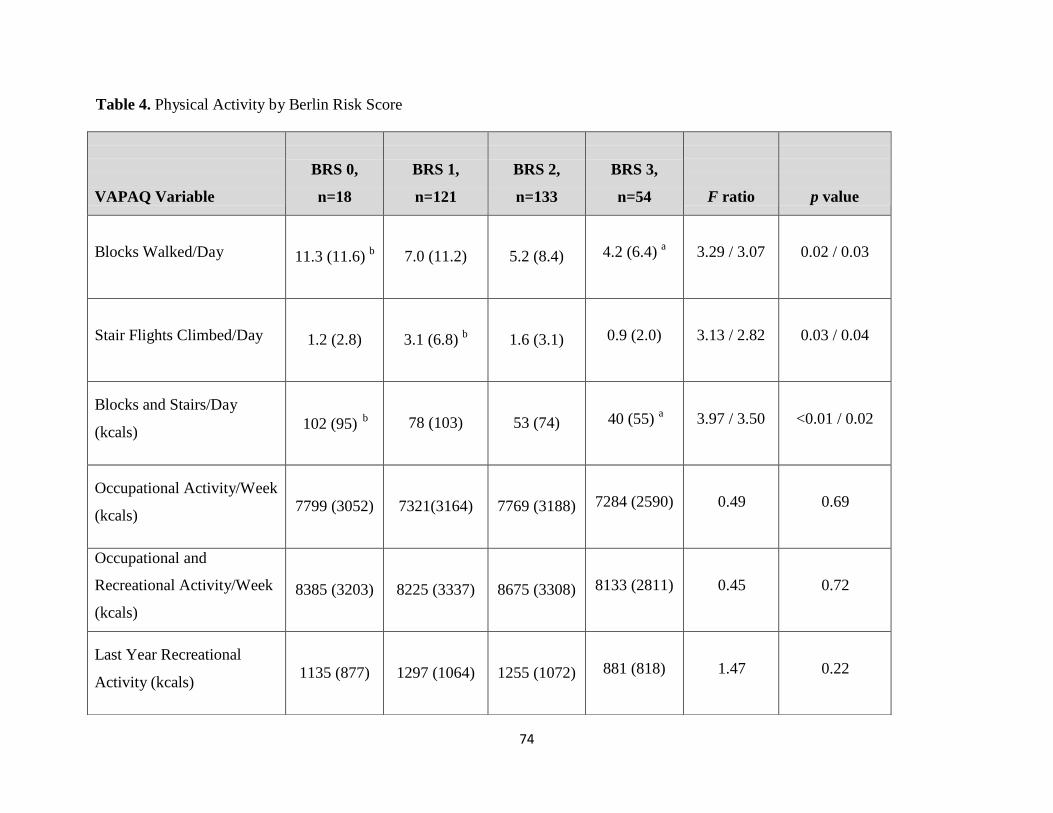
74
VAPAQ Variable
BRS 0,
n=18
BRS 1,
n=121
BRS 2,
n=133
BRS 3,
n=54
F ratio
p value
Blocks Walked/Day
11.3 (11.6) b
7.0 (11.2)
5.2 (8.4)
4.2 (6.4) a
3.29 / 3.07
0.02 / 0.03
Stair Flights Climbed/Day
1.2 (2.8)
3.1 (6.8) b
1.6 (3.1)
0.9 (2.0)
3.13 / 2.82
0.03 / 0.04
Blocks and Stairs/Day
(kcals)
b 102 (95)
78 (103)
53 (74)
a
3.97 / 3.50
<0.01 / 0.02
Occupational Activity/Week
(kcals)
7799 (3052)
7321(3164)
7769 (3188)
7284 (2590)
0.49
0.69
Occupational and
Recreational Activity/Week
(kcals)
8385 (3203)
8225 (3337)
8675 (3308)
8133 (2811)
0.45
0.72
Last Year Recreational
Activity (kcals)
1135 (877)
1297 (1064)
1255 (1072)
881 (818)
1.47
0.22
Table 4. Physical Activity by Berlin Risk Score
40 (55)

75
Lifetime Recreational
Activity (kcals)
556 (457)
995 (916)
932 (1053)
865 (774)
1.06
0.37
Data are expressed as group Mean and Standard Deviation (SD). BMI was controlled for in the analyses; p values and F ratios are
expressed as without the covariate / with the covariate, where appropriate. Bonferroni post-hoc comparisons were used to investigate
differences between BRS groups. a =different from BRS 0, and
b =different from BRS 3. Abbreviations: VAPAQ-Veterans Affairs
Physical Activity Questionnaire; BRS-Berlin Risk Score; kcals-kilocalories.

76
DISCUSSION
OSA Prevalence and Risk
Findings from this study indicate that approximately 57% of older adult subjects with
AAA disease were at High-risk for OSA according to the clinical interpretation of the BQ.
Though not a true prevalence rate since OSA was not clinically diagnosed, the BQ is considered
a surrogate indicator for OSA for the purposes of this study due to the validity of the BQ for
identifying individuals at risk for OSA [49-51]. These findings appear to be consistent with the
literature, demonstrating that OSA prevalence increases with age and is higher among people
older than 65 years.
Several large cohort studies have examined the prevalence rates of OSA among adults
using in-laboratory PSG. The Wisconsin Sleep Cohort Study, Southern Pennsylvania Cohort
Study, and the Vitoria-Gasteiz Spain Cohort Study evaluated large groups of adults between the
ages of 20-99 years and estimated the prevalence of OSA (as defined by an AHI greater than 5
events/hr) to be 9-24%, 17%, and 26-28%, respectively [19] [23, 56] [20]. Davies and Stradling
analyzed 12 studies of OSA prevalence in Western populations and estimated that 1 to 5% of
adult men have OSA [57].
OSA prevalence appears to increase with age and several studies have reported high
prevalence of OSA among people older than 65 years. Ancoli-Israel and colleagues evaluated
more than 400 men and women age 65 to 95 years and found that 70% of men and 56% of
women had an AHI of 10 or greater [22]. The Vitorio-Gasteiz, Spain Cohort study found that for
ages 71-100 years, the prevalence of mild OSA was 80% and moderate OSA was 49% for
women and 57% for men [20, 21]. The Cleveland Family Study reported OSA prevalence rates
of 32% for women and 42% for men over 60 years of age in their study [58]. Mason and

77
colleagues investigated the prevalence of OSA in 127 individuals with AAA disease and
determined that 40% of their subject sample had an oxygen desaturation index (ODI) of greater
than 10. Their subject sample was slightly younger (mean 67.9 yr) than the subjects in this study
and patients older than 75 years were excluded.
Although prevalence of OSA in the elderly is high, several authors have suggested that
most of the age-related increase occurs before age 65 and then plateaus. Bixler and colleagues
conducted a cohort study and found that OSA increases in prevalence from 20 to 59 years of age,
peaking at a prevalence rate of 5.4%, after which it plateaus or decreases for patients 60 and
older [23]. The authors concluded that OSA in older patients is less severe than OSA in the
young. Similarly, Ancoli-Israel and colleagues found that AHI and RDI decreased by decade in
elderly subjects 65-95 years of age, concluding that the increase in apnea indices associated with
aging occurs before age 65 [22]. The Sleep Heart Health Study showed that although the
proportion of people with moderate to severe OSA was approximately 1.7-fold higher in older
(60-99 years) compared to middle-age (40-60 years) adults, most of this increase occurred before
age 65, after which it plateaued or slightly increased [59]. These trends suggest that either a
relative increase in mortality rate from OSA or a remission of OSA with aging exists. Further
research is needed to better understand the long term impact of OSA and the clinical implications
for the elderly with OSA.
Clinical Indicators of OSA
Results of this study indicate that AAA size was similar between BQ OSA-risk groups,
in contrast to the literature that suggests a relationship exists between OSA risk and AAA
disease. Subject selection criteria to only include patients with small AAA disease (aortic
diameter ≥2.5 and < 5.5 cm) may explain the lack of association between OSA risk and AAA

78
size in this study. Findings indicate that anthropometric markers of excess body mass or
central adiposity were consistent with the clinical signature of OSA among patterns reported
for the general population; participants at High-risk for OSA had greater BMIs, WC, HC, and
W/H ratios than their Low-risk counterparts. When stratified by BRS, only the BRS 3 group
was higher on indices of body habitus, suggesting that this group of High-risk subjects (17%)
contributes to the majority of the difference observed in body habitus between High- and Low-
risk groups.
Some data suggest that OSA in older individuals may be a distinctly different disorder
than that suffered by those of middle age. Although mild OSA is exceptionally prevalent among
elderly adults, it seems to be weakly associated with signs and symptoms commonly found in
younger adults with the disorder and thus may be more difficult to detect. Furthermore, markers
that are strong predictors of OSA in middle-aged adults, such as increased body mass, central fat
accumulation and snoring, are less strongly associated with OSA in the elderly [59]. Ancoli-
Israel and colleagues conducted a follow-up study with older adults with OSA and found that
changes in BMI were weakly associated with changes in AHI [60]. Similarly, several studies
have shown that the association between obesity and OSA severity is weaker in older adults
compared to middle-aged adults in the Sleep Heart Health Study [23, 56, 59]. Studies of OSA in
older populations also report little or no association of OSA with sleepiness, HTN, or declines in
cognitive function, all of which are common correlates of OSA in middle-aged adults [61-64].
Findings from this study indicate the proportion of participants taking anti-HTN
medications was significantly higher in the groups at High-risk for OSA. Approximately 82% of
the subjects classified as High-risk for OSA by those methods were receiving anti-HTN
medications, indicating greater incidence of diagnosed HTN. When stratified by BRS, the BRS 3
group was significantly higher on the proportion of subjects taking these medications, indicating

79
a greater incidence of diagnosed diabetes in this High-risk OSA group.
Influences of OSA Risk on Physical Activity
Findings indicate that High-Risk OSA subjects, as indicated from the clinical BQ and the
BRS, reported engaging in fewer blocks walked/day, flights of stairs climbed/day, and expended
less energy engaging in these activities compared to their Low-risk counterparts. Again, when
stratified by BRS, only the BRS 3 group was less active, suggesting that this small group of
High-risk subjects (17%) contributes to the majority of the differences observed in PA habits
between High- and Low-risk groups. These differences remained statistically significant even
after controlling for differences in BMI. This is an interesting finding suggesting OSA is
associated with reduced daily moderate and vigorous PA, independent of obesity. BQ High- and
Low-risk OSA groups and BRS groups did not differ on other indices of occupational and
recreational PA, including weekly occupational and recreational activity, yearly and lifetime
recreational activity. These findings demonstrate that participants at High-risk for OSA report
engaging in less daily PA, such as moderate walking and more vigorous stair climbing than their
low-risk counterparts. The inability to walk four blocks and climb two flights of stairs has been
shown to be an independent predictor of peri-operative and post-operative complications and
even death following major, non-cardiac surgery [65, 66]. Additionally, Jain and colleagues
demonstrated that the inability to climb stairs was associated with higher all-cause and CVD
mortality among a large group of patients with peripheral arterial disease [67]. This group also
suggests that stair climbing is a more precise indication of overall cardiovascular fitness
compared to walking distance and speed, which were not associated with all-cause or CVD
mortality in their study. Stair climbing ability is also considered a reliable surrogate of peak
oxygen consumption, a powerful predictor of cardiovascular morbidity and premature

80
cardiovascular mortality [68]. Contrastingly, OSA risk did not influence participants self-
reported activities related to occupation and recreation, neither recent nor lifetime. It is unclear
whether the reduced daily PA observed in our subject sample at High-risk for OSA is a result of
their OSA risk or a contributing factor to it. It may be that patients with OSA are neither
psychologically motivated nor physically able to engage in regular PA due in part to fatigue and
EDS. Or perhaps this groups’ sedentary behavior has over time contributed to their OSA risk, in
part through influences on obesity.
Research in young and middle-age populations has shown that increased OSA severity is
associated with decreased subjective measures of PA [45, 47, 48]. A recent cross-sectional study
by Chasens and colleagues is consistent with previous research, finding that OSA severity is
associated with decreased PA in middle-aged adults [69]. This group observed negative
associations between AHI and objective measures of PA, including total energy expenditure,
steps walked, and average METS; they also concluded that subjective sleepiness is associated
with perceived difficulty in activity, but not with objectively measured activity. Using cross-
sectional data collected from the Sleep Heart Health Study, Quan and colleagues observed the
associations between PA and sleep disordered breathing in 4,275 middle-aged adults and found
significant associations between decreased moderate to moderately vigorous PA and increased
severity of OSA [45].
Research has demonstrated that all individuals benefit from regular PA, whether it be
vigorous exercise or mild-level exertion activities. Developing and maintaining aerobic
endurance, joint flexibility, and muscle strength is especially important for aging individuals [70]
as it aids in maintenance of muscle mass, flexibility, bone mineral density, basal metabolism, and
functional capacity, all of which naturally decline with aging. Physically active individuals also
tend to outlive their inactive counterparts, as there is a dose-response relationship between the

81
amount of energy expended through PA and mortality in middle-age and elderly populations [37,
38]. Participation in regular exercise also has been shown to reduce the risk of developing AAA
disease [39] and may limit progression of early AAA disease [40].
PA may further benefit people with OSA by promoting physical and psychological
wellbeing in patients by improving sleep architecture. Epidemiological, cross-sectional, and
experimental studies have suggested that both acute and chronic exercise influences sleep.
Epidemiological cross-sectional studies have shown that increased PA is associated with a
reduced prevalence of sleep disturbance [9, 44, 59, 71] and SDB [46].Quan and colleagues
took their analyses one step further, concluding that vigorous PA was more highly
associated with a decrease in the prevalence of SDB than modest intensity PA [45].
However, it is unclear whether PA has a direct influence on psychological states or
indirect effects by influencing other risk factors associated with OSA, including obesity and
hypertension. Norman and colleagues demonstrated that patients with OSA showed reduced
respiratory disturbance index with increased total sleep time, decreased awakenings and arousals
during sleep, and improved mood following a 6 month exercise program [72]. These subjects
also lost weight and improved their exercise tolerance. Another group evaluated a 6 month
exercise intervention for OSA patients and found that despite no changes in body weight or
physical status, subjects reduced their RDIs and reported less fatigue and improvements in
energy [73]. Hong and colleagues examined the relationship between OSA severity, PA, and
psychological well-being in middle-age OSA patients and concluded that PA level better
predicted perceptions of energy and fatigue than OSA severity [74]. The authors also concluded
that regular PA was significantly correlated with subjective well-being, even after controlling for
OSA severity and BMI, suggesting that mood-enhancing effects of exercise may also be evident
in OSA patients.
82
A limitation of this study is that OSA was not clinically diagnosed but rather risk of the
disorder was determined by interview and self-reports, using the BQ, the most widely used
questionnaire for assessing OSA risk. A second limitation is that the BQ may not provide a high
level of diagnostic specificity to discriminate OSA in an elderly population, as indicated by
recent findings [75]. Despite these limitations, a strength of this methodology is that study staff
administered the BQ to participants via interview rather than the participants completing them
independently. This allowed participants to ask questions or clarify statements with research
staff, if needed, and reduced individual interpretation that can be a limitation with self-report
assessments.
Participation in PA was assessed through self-report questionnaire, one of the most
practical and widely used methods for assessing PA; however, a limitation is that subjects may
misclassify and over report PA behavior due to recall and social desirability biases [76, 77].
This limitation was addressed by having study staff administer the BQ to participants via
interview rather than the participants completing them independently. This allowed participants
to ask questions or clarify statements with research staff, if needed, and reduced individual
interpretation that can be a limitation with self-report assessments.
A final limitation of this study is that because subjects were a convenience sample of
patients with AAA disease, results may not be generalizable to an elderly population; however,
due to the high prevalence of undiagnosed AAA disease in the elderly observed by Singh and
colleagues, these findings may be more generalizable to the elderly population than originally
thought [78]. This study did not include a control group of elderly adults without AAA disease;
therefore, it was not possible to determine how much of the high prevalence of OSA risk in this
study is attributed to AAA disease; however, because high prevalence of OSA has been
documented among older adults without documented AAA disease [20, 22, 58], it is not

83
suspected that the high prevalence of OSA-risk in this study to be primarily attributed to
presence of AAA disease.
In conclusion, findings from this study indicate that approximately 57% of older adults
subjects with AAA disease were at High-risk for OSA according to the clinical interpretation of
the BQ. Elderly participants at High-risk for OSA have greater BMIs and other indices of body
habitus consistent with the clinical signature of OSA. Only the BRS 3 group was higher on
measures of body habitus, suggesting that this subset of subjects at High-risk for OSA (17%)
contributes to the majority of the difference observed in body habitus between High- and Low-
risk groups. Findings from this study also indicate a greater incidence of diagnosed HTN in the
High-risk OSA groups (BQ High-risk and BRS 2 and 3). Although previous studies of OSA in
older populations report little association between OSA and HTN [79], our results are more
consistent with OSA symptomology in the general population, in which OSA and HTN are
highly associated [6, 9].
This study is the first to examine the associations between OSA risk and self-report PA
behavior among an elderly population with newly diagnosed small AAA disease. Findings
indicate that subjects at High-risk for OSA report engaging in less daily moderate and vigorous
PA, including block walking and stair climbing, and expend less energy engaging in these
activities compared to their Low-risk counterparts, even after controlling for differences in body
habitus. Contrastingly, OSA risk did not influence participants’ self-reported PA behavior related
to recent and lifetime occupation and recreation. Further studies are needed to examine the
causal relationship between OSA and PA, as it is unknown whether reduced PA among OSA
patients is a result of their OSA, contributes to their OSA, or both.
Finally, the BRS may prove a useful interpretation of the BQ for clinical purposes, as
additional information was revealed when subjects were stratified by BRS that was not observed

84
when subjects were classified by the clinical interpretation of the BQ (High vs. Low-risk for
OSA). The BRS may provide additional information by identifying subjects at increased risk for
OSA and at risk for associated comorbid chronic diseases.

85
REFERENCES 1. White, D.P., The pathogenesis of obstructive sleep apnea: advances in the past 100
years. Am J Respir Cell Mol Biol, 2006. 34(1): p. 1-6.
2. Shamsuzzaman, A.S., B.J. Gersh, and V.K. Somers, Obstructive sleep apnea:
implications for cardiac and vascular disease. JAMA, 2003. 290(14): p. 1906-14.
3. Young, T., et al., Estimation of the clinically diagnosed proportion of sleep apnea
syndrome in middle-aged men and women. Sleep, 1997. 20(9): p. 705-6.
4. Vgontzas, A.N., et al., Sleep apnea and sleep disruption in obese patients. Arch Intern
Med, 1994. 154(15): p. 1705-11.
5. Fischer, J. and F. Raschke, [Glucose tolerance, insulin resistance and arterial
hypertension in patients with obstructive sleep apnea syndrome]. Pneumologie, 1995. 49
Suppl 1: p. 131-5.
6. Nieto, F.J., et al., Association of sleep-disordered breathing, sleep apnea, and
hypertension in a large community-based study. Sleep Heart Health Study. JAMA, 2000.
283(14): p. 1829-36.
7. Ohayon, M.M., The effects of breathing-related sleep disorders on mood disturbances in
the general population. J Clin Psychiatry, 2003. 64(10): p. 1195-200; quiz, 1274-6.
8. Peker, Y., et al., Increased incidence of cardiovascular disease in middle-aged men with
obstructive sleep apnea: a 7-year follow-up. Am J Respir Crit Care Med, 2002. 166(2): p.
159-65.
9. Peppard, P.E., et al., Prospective study of the association between sleep-disordered
breathing and hypertension. N Engl J Med, 2000. 342(19): p. 1378-84.
10. Saruhara, H., et al., Obstructive sleep apnea as a potential risk factor for aortic disease.
Heart Vessels, 2012. 27(2): p. 166-73.
11. Spiegel, K., R. Leproult, and E. Van Cauter, Impact of sleep debt on metabolic and
endocrine function. Lancet, 1999. 354(9188): p. 1435-9.
12. Strohl, K.P., et al., Insulin levels, blood pressure and sleep apnea. Sleep, 1994. 17(7): p.
614-8.
13. Wolk, R., A.S. Shamsuzzaman, and V.K. Somers, Obesity, sleep apnea, and
hypertension. Hypertension, 2003. 42(6): p. 1067-74.

86
14. Somers, V.K., et al., Sympathetic neural mechanisms in obstructive sleep apnea. J Clin
Invest, 1995. 96(4): p. 1897-904.
15. Narkiewicz, K., et al., Baroreflex control of sympathetic nerve activity and heart rate in
obstructive sleep apnea. Hypertension, 1998. 32(6): p. 1039-43.
16. Abrishami, A., A. Khajehdehi, and F. Chung, A systematic review of screening
questionnaires for obstructive sleep apnea. Can J Anaesth, 2010. 57(5): p. 423-38.
17. Ramachandran, S.K. and L.A. Josephs, A meta-analysis of clinical screening tests for
obstructive sleep apnea. Anesthesiology, 2009. 110(4): p. 928-39.
18. Young, T., et al., Predictors of sleep-disordered breathing in community-dwelling adults:
the Sleep Heart Health Study. Arch Intern Med, 2002. 162(8): p. 893-900.
19. Young, T., et al., The occurrence of sleep-disordered breathing among middle-aged
adults. N Engl J Med, 1993. 328(17): p. 1230-5.
20. Duran, J., et al., Obstructive sleep apnea-hypopnea and related clinical features in a
population-based sample of subjects aged 30 to 70 yr. Am J Respir Crit Care Med, 2001.
163(3 Pt 1): p. 685-9.
21. Durán, C. Prevalence of obstructive sleep apnea–hypopnea and related clinical features
in the elderly: a population-based study in the general population aged 71–100. in World
Conference 2001 Sleep Odyssey. 2001. Montevideo, Uruguay.
22. Ancoli-Israel, S., et al., Sleep-disordered breathing in community-dwelling elderly. Sleep,
1991. 14(6): p. 486-95.
23. Bixler, E.O., et al., Effects of age on sleep apnea in men: I. Prevalence and severity. Am
J Respir Crit Care Med, 1998. 157(1): p. 144-8.
24. Mason, R.H., et al., Obstructive sleep apnea in patients with abdominal aortic
aneurysms: highly prevalent and associated with aneurysm expansion. Am J Respir Crit
Care Med, 2011. 183(5): p. 668-74.
25. Cronin, O., P.J. Walker, and J. Golledge, The association of obesity with abdominal
aortic aneurysm presence and growth. Atherosclerosis, 2012.
26. CDC. Healthy Aging. Helping People to Live Long and Productive Lives and Enjoy a
Good Quality of Life 2011 [cited 2012 September 21]; Available from:
http://www.cdc.gov/chronicdisease/resources/publications/aag/aging.htm.

87
27. CDC. How much physical activity do older adults need? [cited 2012 September 21];
Available from:
http://www.cdc.gov/physicalactivity/everyone/guidelines/olderadults.html.
28. CDC. Physical Activity. Healthy Places 2012 [cited 2012 September 21]; Available
from: http://www.cdc.gov/healthyplaces/healthtopics/physactivity.htm.
29. Hoyert, D.L.a.J.X., National Vital Statistics Reports: Deaths: Preliminary Data for 2011.
2012. 61(6).
30. Anderson, L., The State of Aging and Health in America, 2007, CDC
31. Hahn, R.A., et al., Excess deaths from nine chronic diseases in the United States, 1986.
JAMA, 1990. 264(20): p. 2654-9.
32. McGinnis, J.M. and W.H. Foege, Actual causes of death in the United States. JAMA,
1993. 270(18): p. 2207-12.
33. Morris, J.N., et al., Exercise in leisure time: coronary attack and death rates. Br Heart J,
1990. 63(6): p. 325-34.
34. Paffenbarger, R.S., Jr., et al., Physical activity, all-cause mortality, and longevity of
college alumni. N Engl J Med, 1986. 314(10): p. 605-13.
35. Hu, F.B., et al., Physical activity and risk for cardiovascular events in diabetic women.
Ann Intern Med, 2001. 134(2): p. 96-105.
36. Kriska, A., Physical activity and the prevention of type 2 diabetes mellitus: how much for
how long? Sports Med, 2000. 29(3): p. 147-51.
37. Blair, S.N., et al., Changes in physical fitness and all-cause mortality. A prospective
study of healthy and unhealthy men. JAMA, 1995. 273(14): p. 1093-8.
38. Lee, I.M., C.C. Hsieh, and R.S. Paffenbarger, Jr., Exercise intensity and longevity in men.
The Harvard Alumni Health Study. JAMA, 1995. 273(15): p. 1179-84.
39. Kent, K.C., et al., Analysis of risk factors for abdominal aortic aneurysm in a cohort of
more than 3 million individuals. J Vasc Surg, 2010. 52(3): p. 539-48.
40. Myers, J.N., et al., Effects of exercise training in patients with abdominal aortic
aneurysm: preliminary results from a randomized trial. J Cardiopulm Rehabil Prev,
2010. 30(6): p. 374-83.

88
41. Hasan, J., et al., Exercise habits and sleep in a middle-aged Finnish population. Acta
Physiol Scand Suppl, 1988. 574: p. 33-5.
42. Urponen, H., et al., Self-evaluations of factors promoting and disturbing sleep: an
epidemiological survey in Finland. Soc Sci Med, 1988. 26(4): p. 443-50.
43. Vuori, I., et al., Epidemiology of exercise effects on sleep. Acta Physiol Scand Suppl,
1988. 574: p. 3-7.
44. Sherrill, D.L., K. Kotchou, and S.F. Quan, Association of physical activity and human
sleep disorders. Arch Intern Med, 1998. 158(17): p. 1894-8.
45. Quan, S.F., et al., Association of physical activity with sleep-disordered breathing. Sleep
Breath, 2007. 11(3): p. 149-57.
46. Peppard, P.E. and T. Young, Exercise and sleep-disordered breathing: an association
independent of body habitus. Sleep, 2004. 27(3): p. 480-4.
47. Chasens, E.R., M.G. Umlauf, and T.E. Weaver, Sleepiness, physical activity, and
functional outcomes in veterans with type 2 diabetes. Appl Nurs Res, 2009. 22(3): p. 176-
82.
48. Vasquez, M.M., et al., Associations of dietary intake and physical activity with sleep
disordered breathing in the Apnea Positive Pressure Long-Term Efficacy Study
(APPLES). J Clin Sleep Med, 2008. 4(5): p. 411-8.
49. Ahmadi, N., et al., The Berlin questionnaire for sleep apnea in a sleep clinic population:
relationship to polysomnographic measurement of respiratory disturbance. Sleep Breath,
2008. 12(1): p. 39-45.
50. Netzer, N.C., et al., Using the Berlin Questionnaire to identify patients at risk for the
sleep apnea syndrome. Ann Intern Med, 1999. 131(7): p. 485-91.
51. Weinreich, G., et al., [Is the Berlin questionnaire an appropriate diagnostic tool for sleep
medicine in pneumological rehabilitation?]. Pneumologie, 2006. 60(12): p. 737-42.
52. Sharma, S.K., et al., Validation of the modified Berlin questionnaire to identify patients at
risk for the obstructive sleep apnoea syndrome. Indian J Med Res, 2006. 124(3): p. 281-
90.
53. Bassett, D.R., et al., Energy cost of stair climbing and descending on the college alumnus
questionnaire. Med Sci Sports Exerc, 1997. 29(9): p. 1250-4.

89
54. Ainsworth, B.E., et al., Compendium of physical activities: classification of energy costs
of human physical activities. Med Sci Sports Exerc, 1993. 25(1): p. 71-80.
55. Myers, J., et al., Fitness versus physical activity patterns in predicting mortality in men.
Am J Med, 2004. 117(12): p. 912-8.
56. Bixler, E.O., et al., Prevalence of sleep-disordered breathing in women: effects of gender.
Am J Respir Crit Care Med, 2001. 163(3 Pt 1): p. 608-13.
57. Davies, R.J. and J.R. Stradling, The epidemiology of sleep apnoea. Thorax, 1996. 51
Suppl 2: p. S65-70.
58. Redline, S., et al., Improvement of mild sleep-disordered breathing with CPAP compared
with conservative therapy. Am J Respir Crit Care Med, 1998. 157(3 Pt 1): p. 858-65.
59. Young, T., et al., Predictors of sleep-disordered breathing in community-dwelling adults:
the Sleep Heart Health Study. Arch Intern Med, 2002. 162(8): p. 893-900.
60. Ancoli-Israel, S., et al., Long-term follow-up of sleep disordered breathing in older
adults. Sleep Med, 2001. 2(6): p. 511-6.
61. Ancoli-Israel, S. and T. Coy, Are breathing disturbances in elderly equivalent to sleep
apnea syndrome? Sleep, 1994. 17(1): p. 77-83.
62. Enright, P.L., et al., Prevalence and correlates of snoring and observed apneas in 5,201
older adults. Sleep, 1996. 19(7): p. 531-8.
63. Ingram, F., et al., Sleep apnea and vigilance performance in a community-dwelling older
sample. Sleep, 1994. 17(3): p. 248-52.
64. Young, T., Sleep-disordered breathing in older adults: is it a condition distinct from that
in middle-aged adults? Sleep, 1996. 19(7): p. 529-30.
65. Girish, M., et al., Symptom-limited stair climbing as a predictor of postoperative
cardiopulmonary complications after high-risk surgery. Chest, 2001. 120(4): p. 1147-51.
66. Reilly, D.F., et al., Self-reported exercise tolerance and the risk of serious perioperative
complications. Arch Intern Med, 1999. 159(18): p. 2185-92.
67. Jain, A., et al., The Walking Impairment Questionnaire stair-climbing score predicts
mortality in men and women with peripheral arterial disease. J Vasc Surg, 2012. 55(6):
p. 1662-73 e2.

90
68. Myers, J., et al., Exercise capacity and mortality among men referred for exercise testing.
N Engl J Med, 2002. 346(11): p. 793-801.
69. Chasens, E.R., et al., Subjective and objective appraisal of activity in adults with
obstructive sleep apnea. J Aging Res, 2011. 2011: p. 751819.
70. Ades, P.A., et al., Exercise conditioning in the elderly coronary patient. J Am Geriatr
Soc, 1987. 35(2): p. 121-4.
71. Newman, A.B., et al., Progression and regression of sleep-disordered breathing with
changes in weight: the Sleep Heart Health Study. Arch Intern Med, 2005. 165(20): p.
2408-13.
72. Norman, J.F., et al., Exercise training effect on obstructive sleep apnea syndrome. Sleep
Res Online, 2000. 3(3): p. 121-9.
73. Giebelhaus, V., et al., Physical Exercise as an Adjunct Therapy in Sleep Apnea-An Open
Trial. Sleep Breath, 2000. 4(4): p. 173-176.
74. Hong, S. and J.E. Dimsdale, Physical activity and perception of energy and fatigue in
obstructive sleep apnea. Med Sci Sports Exerc, 2003. 35(7): p. 1088-92.
75. Sforza, E., et al., Is the Berlin questionnaire a useful tool to diagnose obstructive sleep
apnea in the elderly? Sleep Med, 2011. 12(2): p. 142-6.
76. Aadahl, M., et al., Self-reported physical activity compared with maximal oxygen uptake
in adults. Eur J Cardiovasc Prev Rehabil, 2007. 14(3): p. 422-8.
77. Sallis, J.F. and B.E. Saelens, Assessment of physical activity by self-report: status,
limitations, and future directions. Res Q Exerc Sport, 2000. 71(2 Suppl): p. S1-14.
78. Singh, K., et al., Prevalence of and risk factors for abdominal aortic aneurysms in a
population-based study : The Tromso Study. Am J Epidemiol, 2001. 154(3): p. 236-44.
79. O'Connor, G.T., et al., Prospective study of sleep-disordered breathing and hypertension:
the Sleep Heart Health Study. Am J Respir Crit Care Med, 2009. 179(12): p. 1159-64.
91
CHAPTER THREE
OBSTRUCTIVE SLEEP APNEA RISK IN ABDOMINAL AORTIC ANEURYSM
DISEASE PATIENTS: ASSOCIATIONS WITH METABOLIC SYNDROME
ABSTRACT
Study Objectives: Examine the prevalence of metabolic syndrome (MetSyn) and its constituent
markers in a large sample of elderly patients with newly diagnosed small AAA disease and
assess how MetSyn may be associated with risk for obstructive sleep apnea (OSA). Methods:
Study methods included extraction of medical history and drug information from medical
records; completion of a physical examination to assess resting blood pressure (BP) and
anthropometrics; fasting serum blood analyses for glucose, insulin, and lipid profile; and
completion of the Berlin Questionnaire (BQ) with verification of responses completed by
interviews with study staff, to assess OSA risk. To further examine gradations in OSA risk,
subjects were also classified by Berlin Risk Score (BRS), the sum of the three categorical scores
from the BQ. Results: The prevalence of MetSyn among subjects in this sample was 41%, with
hypertension being the most prevalent component (94%), followed by elevated fasting glucose
(55%), low high-density lipoprotein cholesterol (HDL-C; 52%), increased waist circumference
(WC; 45%), and elevated triglycerides (TG; 13%). In addition, of those subjects at High-risk for
OSA according to the BQ, 45% also had MetSyn according to the NCEP ATP III criteria [1],
whereas only 35% of those at Low-risk for OSA had MetSyn. Subjects with the highest BRS
had an increased prevalence of MetSyn and MetSyn components, including increased WC and
reduced HDL-C, independent of obesity. No other associations between OSA risk and other
cardio-metabolic risk factor of interest were observed. Conclusions: OSA risk was associated
with prevalence of MetSyn and several of its components, including increased WC and HDL-C,
independent of obesity; however, this association was only observed in those patients with the

92
highest BRS, suggesting the BRS may prove a useful interpretation of the BQ for clinical
purposes. No associations between OSA risk and any other cardio-metabolic risk factor of
interest were observed, suggesting that there is not a significant association between OSA and
cardio-metabolic risk factors, beyond the effects of obesity, among our elderly sample of AAA
patients. Additional research to better understand the manifestation of OSA in the elderly is
crucial for proper clinical management of older patients.

93
INTRODUCTION
Obstructive sleep apnea (OSA) is characterized by repetitive bouts of upper airway
occlusion or collapse during sleep, resulting in intermittent periods of hypoxia, hypercapnia, and
fragmented sleep [2]. OSA is the most common sleep related breathing disorder, affecting an
estimated 20% of the U.S. adult population [3]; Prevalence of OSA is difficult to report, as up to
90% of people with the disorder remain undiagnosed [4], though it is anticipated to rise as an
increasing proportion of Americans are obese and elderly, both of which are risk factors for
OSA. Obesity is the primary risk factor for OSA and is reported in more than 40% of OSA cases;
furthermore, more than 80% of individuals with OSA are also obese [5]. Untreated OSA can
increase risk for several chronic diseases and disorders including obesity, HTN and CVD,
metabolic disorders, depression, and aortic disease [6-14]; however, the mechanism(s) linking
OSA to HTN and CVD remains undetermined. Repetitive nighttime apneas and hypopneas
(cessations and pauses in breathing) result in activation of the sympathetic nervous system (SNS)
and stressful arousals to reestablish breathing. It has been determined that OSA patients
demonstrate an exaggerated activation of the SNS that persists into waking hours [15]. Over
time, activation of the baroreceptors, which respond to normalize these SNS oscillations, become
altered and depressed in OSA patients [16], suggesting an impairment of the cardiovascular
autonomic system, thereby increasing risk for HTN and CVD.
The “gold standard” for diagnosing OSA is laboratory polysomnography (PSG);
however, sleep health questionnaires that stratify patients based on clinical symptoms, physical
examinations, and risk factors, are often employed as a first step assessment to screen for OSA.
Questionnaires that are commonly used to screen for OSA and have been validated against PSG,
include the Epworth Sleepiness Scale (ESS), Pittsburgh Sleep Quality Index (PSQI), Berlin

94
Questionnaire (BQ), and most recently, the STOP-Bang questionnaire. Sleep screening
questionnaires do not require complicated calculations to identify high risk patients, and they are
relatively easy and cost-effective to apply clinically; however, their accuracy relies on self-report
and disclosure of signs and symptoms, as well as the patient’s memory and ability and
willingness to follow instructions. The BQ is regarded for its high specificity and sensitivity for
predicting moderate to severe OSA [17] and is among the most accurate screening questionnaires
for OSA [18].
Sleep disorders, specifically OSA, are highly prevalent in older adults; the Sleep Heart
Health Study found that among 6,400 older adults, sleep disordered breathing (SDB) prevalence
rates for mild to severe SDB ranged from 19-36% for adults 60-98 years old [19]. These rates far
outpace those for middle aged adults, age 30-60 years old, whose SDB rates were 2-4% for
women and men [20]. One cohort study found that for adults 71-100 years, the prevalence of
mild OSA was 80% and moderate OSA was 49% for women and 57% for men [21, 22]. Despite
these high prevalence rates, studies have suggested that most of the age-related increase in
prevalence of OSA occurs before age 65 and plateaus at some point after age 65 [23, 24].
Recently, OSA was determined to be highly prevalent among patients with AAA disease,
a disease of the elderly in which the lower part of the aorta is weakened and bulging. Moderate
or severe OSA was present in 42% of their subjects with AAA disease [25]. One very recent
report suggested that OSA may not only be a risk for factor for aortic disease [11], but a causal
factor for faster AAA expansion [25]. AAA disease is prevalent in the elderly, most often
occurring in people age 60 years and older, and AAA presence is associated with overweight and
obesity [26].

95
The metabolic syndrome (MetSyn) describes the frequent simultaneous presence of
obesity, hyperlipidemia, type II diabetes, and HTN [27]. One of the most commonly used
definitions of the MetSyn is that of National Cholesterol Education Program Adult Treatment
Panel (NCEP ATP) III) [1] (Table 1). More than one-third of American adults may have MetSyn
[28], characterized by the presence of at least three of the five risk factors outlined in Table 1.
MetSyn increases significantly with age and BMI; older adults were 4-6 times more to meet the
criteria for MetSyn as young adults, and obese individuals were 17-32 times more likely than
normal weight counterparts to meet the criteria for MetSyn [28].
The pathogenesis of the MetSyn is complex and not yet fully elucidated but appears to
have two primary points of origin that include obesity and IR. Other factors that have been
implicated as contributors to the development of MetSyn include age, and a pro-inflammatory
state; however, the NCEP ATP III considers obesity, specifically abdominal obesity, the main
contributing factor for the development of MetSyn as it contributes to HTN, dyslipidemia,
hyperglycemia, and is associated with risk for CVD. Researchers found that the MetSyn alone
predicted 25% of all new-onset CVD [29] and the primary outcome of MetSyn is CVD [1].
MetSyn has also been associated with advanced vascular damage in AAA patients [30].
Studies indicate that OSA may be a manifestation of the MetSyn [31, 32]; in fact,
individuals with OSA are more than twice as likely to have MetSyn as compared to obese
controls [33]. OSA and the MetSyn may be characterized by the same pathophysiologic
environment, which increases risk for developing CVD [34]. Increased visceral fat and the IR
that accompanies it seem to be the main characteristics responsible for the development of OSA
and the MetSyn [3, 35]. OSA is often accompanied by the same disorders which characterize the
MetSyn, including HTN, elevated fasting blood glucose, IR, abdominal obesity, and

96
dyslipidemia. Other characteristics shared between OSA and MetSyn, include increased
sympathetic nervous system activation, endothelial dysfunction, and systemic inflammation [3,
36]. One study found that the prevalence of MetSyn is almost 40% greater in patients with OSA
[33]. It is unclear whether OSA is observed as part of the basic pathophysiology of the MetSyn
or whether OSA, through repetitive hypoxemia events during apneas and other mechanisms,
induces the derangements that constitute the MetSyn.
Research suggests that OSA in older age may be a condition distinct from that of middle
age. Many of the cardiovascular and metabolic abnormalities that are associated with OSA are
less associated in older adults and comorbidities that worsen with time in untreated middle-age
cohorts with OSA may be less associated with severity of OSA in the elderly but more attributed
to aging [37]. Furthermore, risk factors and predictors of OSA in middle-aged adults are less
strongly associated with OSA in the elderly [19, 24, 38-44]. The untoward associations between
OSA and clinical markers of MetSyn has been elucidated in pre-elderly populations [33, 45] but
not systematically examined in the elderly [46]. Furthermore, AAA disease has been associated
with MetSyn and OSA independently, but to our knowledge these disorders have not been
examined together.
OBJECTIVES
One aim of this study was to examine the cardio-metabolic profile related to MetSyn
and the constituent markers of MetSyn, as defined by the NCEP ATP III criteria, among elderly
patients with newly diagnosed AAA disease. The second aim was to assess in this sample how
biomarkers of MetSyn and MetSyn status may be associated with risk for OSA, as assessed by
the BQ.

97
METHODS
Subjects (n=326) with newly diagnosed small AAAs (aortic diameter ≥2.5 and < 5.5 cm)
were recruited from Stanford University Medical Center, the Veterans Affairs Palo Alto Health
Care System (VAPAHCS) and Kaiser Permanente of Northern California. Subjects were 50
years of age or older, agreed to comply with study protocols and procedures, and provided
voluntary consent to participate. Recruitment procedures and all study-related activities were
reviewed and approved in advance by Institutional Review Boards (IRBs) at Stanford University
(including VAPAHCS) as well as the Kaiser Permanente Division of Research and an
independent Data Safety Monitoring Board (DSMB) organized by the NHLBI. Additional details
on recruitment procedures can be found in Appendix A. Study methods for all participants
included extraction of medical history and drug information from medical records; completion of
a physical examination with study personnel to assess resting systolic and diastolic BP, as well as
measures of body habitus including height and weight for BMI calculation and waist (WC) and
hip (HC) circumference measurements; fasting blood analysis for complete lipid panels and
serum insulin and glucose levels; and completion of questionnaires, with verification of subject
answers completed by interview with study staff, regarding health history, and OSA risk.
Physical Examination and Health History
Subjects underwent a physical examination with study personnel to assess resting
systolic and diastolic blood pressure (BP), as well as measures of body habitus,
including height and weight for body mass index (BMI) calculation and waist (WC) and
hip circumference (HC) measurements, which were also used to calculate waist/hip
(W/H) ratio. Detailed assessment protocols for these measures are included in Appendix
98
A. Subjects also provided information on prescriptive medications they were receiving
to determine the extent of medically managed HTN, dyslipidemia, type II diabetes, and
other diseases and disorders in the sample.
Berlin Questionnaire
The modified Berlin Questionnaire (BQ) is a 12-item self-report questionnaire that
includes questions about risk factors for OSA that can be identified with three discrete
sign/symptom categories of 1.) snoring behavior, 2.) wake time sleepiness and fatigue, and 3.)
obesity and HTN. The modified BQ, an extension of the original BQ, includes three additional
questions regarding choking behavior and wake-time sleepiness. The modified BQ is a validated
instrument used to identify individuals who are at risk for OSA with a sensitivity (86%) and
specificity (95%) comparable to the original BQ [47-50]; positive and negative predictive values
of 96% and 82%, respectively, were reported for the modified BQ [50]. Subjects completed the
BQ and responses were confirmed and clarified by one-on-one interview between subject and
study personnel.
Patients were classified as Low- or High -Risk for OSA based on their responses to the
individual items on the BQ and their overall scores in the three symptom categories, according to
the scoring instructions detailed by Netzer and colleagues [48]. To further examine gradations in
OSA risk, subjects were also classified by their Berlin Risk Score (BRS), the sum of the three
categorical scores from the BQ. Subjects were grouped into one of four BRS groups which
equated to the number of categories that were scored positive from their BQ (BRS 0, 1, 2, or 3).
It should be noted that this is not a validated interpretation of the BQ, but simply an approach to
examine a more detailed analysis of risk for OSA from patient responses to the individual
questions and risk factor categories that comprise the BQ.

99
Biomarkers for Metabolic and Cardiovascular Disease Risk
Overnight fasting serum blood was collected from participants and evaluated for
biomarkers of metabolic and cardiovascular diseases, including serum insulin and glucose, lipid
profile, including total cholesterol (TC), high-density lipoprotein cholesterol (HDL-C), low-
density lipoprotein cholesterol (LDL-C), and triglycerides (TG). Detailed collection procedures
for these measures can be found in Appendix A.
Metabolic Syndrome
Presence of MetSyn was determined using criteria from the NCEP ATP III guidelines [1],
which defines MetSyn as the presence of at least three of the five risk factors outlined in Table 1.
Prescription medication use was also taken into consideration when identifying the presence or
absence of each of the MetSyn risk factors. Subjects taking an anti-HTN medication to control
BP were identified as positive for having an elevated BP according to the ATP III MetSyn
criteria. Similarly, patients taking an anti-diabetic medication were identified as positive for
having an elevated fasting glucose, one of the five risk factors that constitute MetSyn. Taking a
fibrate or niacin medication to control elevated TGs and HDL-C, respectively, was also
considered when examining the presence of MetSyn risk factors and the disorder among the
subject sample.
Statistical Analyses
Data were stored electronically in a SPSS® (SPSS, Inc., Chicago, IL) database (Version
20.0). Statistical significance was determined a priori for all experimental analyses as a p value
< 0.05. To examine the occurrence of MetSyn and the cardio-metabolic profile, related to the
constituent biomarkers of MetSyn, among elderly AAA patients, descriptive statistics of the

100
subject sample were assessed to observe means, standard deviations, and ranges for variables of
interest related to clinical and physical measurements and metabolic and cardiovascular
biomarkers. To examine associations between MetSyn and constituent biomarkers and risk for
OSA, subjects were classified as High-Risk or Low-Risk for OSA, using the clinical
interpretation of the BQ [48]. To further examine gradations in OSA risk, subjects were also
classified by their BRS, which for this investigation, was defined as the sum of the three
categorical scores from the BQ. Descriptive statistics were assessed to observe means, standard
deviations, and ranges for variables of interest by group. To compare means between and within
groups, independent sample t-tests and ANOVA were performed, for two- and four-group
comparisons, respectively; Bonferroni post hoc analysis were used to further examine differences
between BRS group comparisons for all dependent variables of interest related to metabolic and
cardiovascular biomarkers. Although the subject sample was similar, group differences existed
for BMI that may affect relationships between dependent variables of interest related to MetSyn
constituents and OSA risk; therefore, a general linear model univariate procedure was performed,
when appropriate, to control for BMI as a covariate.
RESULTS
Characteristics, Cardiovascular and Metabolic Biomarkers, and MetSyn Profile of Study
Participants
Characteristics of the subject sample are displayed in Table 2. Characteristics by gender
can be found in Appendix D but are not presented here since characteristics were similar
between men and women, other than anthropometric characteristics influenced by gender
differences. All values are expressed as group means (standard deviation-SD). The majority of

101
the subject sample was male (83%), mean age was 73.3 (8.5) yr, and the group was overweight
with a BMI of 29.3 (6.1) kg/m2.
Constituent markers of MetSyn for the subject sample are also included in Table 2.
Participants had a high WC (gender specific) and demonstrated elevated levels for systolic BP
and fasting glucose. Mean values for HDL-C levels (gender specific) and TGs were within a
range considered within clinically normal limits, per the NCEP ATP III criteria. Regarding
additional markers of cardio- metabolic risk, the subject sample had a normal level for fasting
insulin level, slightly elevated value for HOMA-IR, and desirable levels for TC and LDL-C. A
significant proportion of the subject sample was taking anti-hypertensive medications (89%)
and anti-lipemic medications (79%), respectively. Fewer subjects were taking medications to
control diabetes (21%).
Table 3 and Figure 1 demonstrate the prevalence of MetSyn and the individual
components of the disorder, as defined by the NCEP ATP III criteria, among the subject sample
of elderly adults with AAA disease. As a group, they demonstrated a MetSyn prevalence of 41%.
The most prevalent MetSyn component was HTN or taking a prescribed anti-HTN medication
(95%) followed by elevated fasting glucose or taking a prescribed medication to control diabetes
(55%), low HDL-C level or taking a prescribed niacin medication (52%), high WC (45%), and
elevated TG level or taking a prescribed fibrate medication (13%) Prevalence rates of MetSyn
and the individual components of the disorder by gender did not differ and are presented in
Appendix D.
Cardiovascular and Metabolic Biomarkers and MetSyn Profile by OSA-Risk

102
Table 4 displays group characteristics and cardiovascular and metabolic biomarkers of
the subject sample by OSA-risk according to the clinical interpretation of the BQ (High- vs.
Low-risk for OSA). A high proportion of the study sample was considered High-risk for OSA by
the BQ (57%). AAA size was similar between OSA-risk groups. The BQ High-risk group was
slightly younger and had a greater BMI compared to the BQ Low-risk Group. There was a
significant relationship between age and BMI (F=13.5, p<0.01); therefore, BMI was selected as
the covariate and controlled for in the analyses, where appropriate.
Regarding constituent markers of MetSyn using the NCEP ATP III criteria, WC was
higher among the BQ High-risk group, though not significant when controlled for BMI. Resting
BP was similar between BQ OSA risk groups, though a higher proportion of the BQ High-risk
group was taking anti-HTN medications to control BP (92% vs. 84%; p=0.05), even after
controlling for group differences in BMI. Fasting glucose and HDL-C were similar between BQ
OSA risk groups and TG level, though higher in the BQ High-risk compared to the BQ Low-risk
group, significance did not remain after controlling for BMI; however, a higher proportion of the
BQ High-risk group was taking a fibrate medications to reduce TGs (10% vs. 0%; p=0.02). Other
medication classes that may influence the components of MetSyn, using the NCEP ATP III
definition, including anti-lipemics and diabetic medications, were similar between BQ OSA risk
groups.
Table 4 also highlights additional cardio-metabolic variables of interest related to MetSyn
and OSA risk. Due to the influence and associations with BMI, HC and W/H ratio were higher
among the BQ High-risk compared to the BQ Low-risk group. Fasting insulin was elevated in
the BQ High-risk group compared to the BQ Low-risk group, but this difference did not remain
significant after controlling for BMI. TC and LDL-C were similar between BQ OSA risk groups.

103
Table 5 and Figure 2 demonstrates the prevalence of MetSyn and the individual
components of the disorder, as defined by the NCEP ATP III criteria, among the subject sample
by OSA-risk according to the clinical interpretation of the BQ. Prevalence of MetSyn was
similar between BQ High- and Low-risk groups (45% vs. 35%), respectively. The BQ High-Risk
group had a higher prevalence of increased WC (51% vs. 38%) and elevated HDL/Rx niacin
(59% vs. 44%) compared to their Low-risk counterparts, respectively, though these differences
were not significant after controlling for BMI. BQ High- and Low-risk groups did not differ on
any other component of the MetSyn, including BP (95% vs. 94%), fasting glucose (58% vs.
52%), or TGs (12% vs. 13%), respectively.
Table 6 displays the cardiovascular and metabolic biomarkers of the subject sample by
BRS. Few subjects were classified in the BRS 0 group (6%), while a moderate proportion of
subjects had a BRS of 1 or 2 (37% and 41%), respectively. Approximately 17% of subjects were
classified in the BRS 3 group. Age was similar between the four BRS groups; BMI increased
linearly with BRS and was controlled for in the analyses (p<0.01). Regarding constituent
markers of MetSyn using the NCEP ATP III criteria, WC, was higher among the BRS group 3
compared to BRS 0 and 1 groups, but not significant after controlling for BMI. Resting BP was
similar across BRS groups; however anti-HTN medication use was less prevalent among BRS
group 0 vs. all other BRS groups (p<0.01), even after controlling for group differences in BMI.
Fasting glucose and use of diabetic medications were similar across BRS groups after controlling
for differences in BMI, as were HDL-C, TGs, and use of anti-lipemic medications. Table 6 also
highlights additional cardio-metabolic variables of interest related to MetSyn and OSA risk. HC
and W/H ratio were similar across groups after controlling for group differences in BMI, as was
fasting insulin. TC and LDL-C were also similar across BRS groups.

104
Table 7 and Figure 3 demonstrate the prevalence of MetSyn and the individual
components of the disorder, as defined by the NCEP ATP III criteria, among the subject sample
by BRS. There was an increased prevalence of MetSyn among the BRS 3 group compared to the
BRS 0, 1, and 2 groups (65% vs. 11%, 13%, and 37%; p<0.01), respectively, after controlling for
group differences in BMI. MetSyn components including increased WC (p=0.01) and reduced
HDL/Rx niacin (p=0.04) were also more prevalent among the BRS 3 group compared to the
lower-risk groups after controlling for BMI. Elevated fasting glucose while more prevalent
among the BRS 3 group, though this difference did not remain significant after controlling for
BMI. MetSyn components including elevated BP or use of anti-HTN medications and elevated
TG or use of fibrate medications did not differ between BRS groups, and these components were
the most and least prevalent MetSyn components among the groups, respectively.
DISCUSSION
Prevalence of MetSyn and MetSyn Components among Elderly AAA Patients
Findings from this study indicate that the prevalence of MetSyn among our subject
sample of elderly patients with newly diagnosed AAA disease is 41%. HTN was the most
prevalent MetSyn component among our subject sample, with 95% of participants having an
elevated BP by the NCEP ATP III criteria or those taking a prescribed anti-HTN medication.
Prevalence of the remaining MetSyn biomarkers, including elevated fasting glucose, low HDL-
C, increased WC, and high TG was 55%, 52%, 45%, and 13%, respectively. Regarding
additional cardio-metabolic risk factors for MetSyn, fasting insulin level of our population was in
normal range, though HOMA-IR was elevated compared to the normal upper value of 2.60 [51].
Fasting lipid values for TC, HDL-C, LDL-C, and TGs were all within clinically normal ranges,
though a significant proportion of subjects (79%) were taking prescription anti-lipemic

105
medications. Additionally, about one-fifth of the subject sample was taking one or more
prescription medications to control diabetes and 83% were taking other prescription medications.
These findings regarding the prevalence of MetSyn among an elderly subject sample with
AAA disease are consistent with the literature on similar sub-populations. Gorter and colleagues
determined the overall and gender-specific prevalence of MetSyn and its components among 100
patients with AAA disease and found 47% of their subject sample met the NCEP ATP III criteria
for having MetSyn [52]. High BP was the most prevalent risk factor among their subject sample
(80%), followed by low HDL-C (44%) and high TGs (44%), high fasting glucose (38%), and
abdominal obesity (37%). Olijhoek and colleagues conducted a cross-sectional study to
investigate the relationship between MetSyn and vascular disease among 502 patients with
recently diagnosed coronary heart disease [30]. Among their subject sample of 89 patients with
AAA disease, the prevalence of MetSyn was 45%.
The prevalence of MetSyn among this elderly subject sample with AAA disease was
slightly lower than those reported by Ervin and colleagues who examined the prevalence of
MetSyn among a sample 3,423 adults, of which 1240 subjects were 60 years and older, from the
NHANES 2003-2006 data [28]. They determined that the prevalence of MetSyn increased with
each succeeding age group for both sexes and that 52% of males and 54% of females age 60
years and over met the NCEP ATP III criteria for MetSyn. However, similar to this study, HTN
was the most prevalent MetSyn component for their population of older adults in the Ervin study,
followed by elevated fasting glucose, while abdominal obesity and dyslipidemia were less
prevalent MetSyn components. Mean age of the elderly group in the Ervin paper is not reported
and our study did not report on race or ethnicity among the subject sample, all of which have
been shown to influence MetSyn [28]; therefore, we cannot speculate if these factors may

106
attribute to the difference in MetSyn prevalence reported by us vs Ervin et al. Additional
comparisons can be made between this study and the Ervin paper regarding prevalence of
MetSyn and MetSyn components by age. Ervin found that the prevalence of MetSyn among
persons age 20-39 years was 15.6%-20.3% and the most prevalent MetSyn component among
this age group for males was abdominal obesity, followed by elevated TGs, high fasting glucose,
HTN, and low HDL-C for males [28]. For females, abdominal obesity was also the most
prevalent MetSyn component, followed by low HDL-C, high TGs, elevated fasting glucose, and
HTN. An interesting observation is that in younger populations, abdominal obesity it the most
prevalent MetSyn component; however, in our study of older AAA patients, HTN, elevated
fasting glucose, and reduced HDL-C were more prevalent than abdominal obesity. Additionally,
while HTN was the most prevalent MetSyn component among subjects in this study, it was the
least prevalent component among younger women and was of low prevalence among younger
men. These findings indicate that while MetSyn increases with age, the cardio-metabolic profile
related to MetSyn adjusts, and constituent markers such as abdominal obesity become less
prevalent in older adults, while other risk factors such as HTN and elevated fasting glucose
become more prevalent with age. This study support the notion that a better understanding of the
progression of MetSyn and the clinical implications from young to old age is crucial for proper
clinical management of all MetSyn patients and stage of life should be a consideration in how
they are managed.
An interesting finding by Olijhoek and colleagues was that MetSyn in their elderly
patients with AAA disease was associated with a high prevalence of microalbuminuria, or excess
protein in the urine, an indication of kidney dysfunction [30]. The authors concluded that in
patients with vascular disease, including AAA disease, MetSyn is associated with more advanced

107
vascular damage, as measured by indicators for increased cardiovascular risk, including
microalbuminuria [30]. Watanabe and colleagues also demonstrated significant associations
between MetSyn and microalbuminuria among older adults [53]. Microalbuminuria was not
evaluated in this study and is not a component of the MetSyn according to the NCEP ATP III
criteria; however it is a risk factor for the World Health Organization (WHO) definition of
MetSyn and has been shown to be strongly related with the components of the MetSyn [54]. The
MetSyn profile among patients with vascular diseases, including AAA disease, may vary by
different MetSyn criteria and definitions, including that of the WHO. The most commonly used
definitions of MetSyn are those by the WHO and the NCEP ATP III, which share many
similarities but offer several differences as well. Prevalence of MetSyn among various
subpopulations and racial/ethnic groups may vary depending on the MetSyn definition and
criteria used [55]. These differences may extend to specific subpopulations with known diseases
but have yet to be determined. Further research to examine the clinical manifestation of MetSyn
in elderly populations with vascular disease is warranted.
Associations between MetSyn and OSA Risk
Findings from this study indicate that approximately 57% of our subject sample of older
adults with AAA disease is at high-risk for OSA according to the clinical interpretation of the
BQ; among the BQ High-risk group, 45% had MetSyn according to the NCEP ATP III criteria
[1]. OSA risk was not significantly associated with prevalence of MetSyn nor the prevalence of
MetSyn components including elevated BP, elevated fasting glucose, or elevated TG. After
controlling for BMI, prevalence of increased WC was also not associated with OSA risk.
Reduced HDL-C was the only MetSyn component that was associated with BQ OSA-risk,

108
independent of BMI. Additionally, no other cardio-metabolic risk factors of interest were
associated with risk for OSA, including fasting insulin, TC, or LDL-C. The BQ and BRS High-
risk OSA groups had an increased prevalence of anti-HTN medication use, suggesting that that
OSA may be associated with HTN; however this component of the MetSyn was similar between
groups when considering both BP level and anti-HTN medication use.
A novel finding of this study is that when OSA-risk was stratified by BRS, prevalence of
MetSyn and prevalence of MetSyn components, including increased WC and reduced HDL-C,
were significantly associated with OSA risk, independent of BMI. Although associations were
not observed between OSA-risk and MetSyn and its constituent markers, as determined from the
clinical interpretation of the BQ, when OSA-risk was further stratified to evaluate more detailed
categorical responses from the BQ, associations were observed between OSA-risk, MetSyn and
MetSyn components, independent of obesity. These findings suggest an association exists
between OSA risk and MetSyn among subjects considered at highest-risk for OSA. To our
knowledge, this study is the first to examine associations between MetSyn and biomarkers of
MetSyn with risk for OSA in an elderly population with AAA disease.
Literature on the association between MetSyn and OSA in younger and middle-age
cohorts is mixed and inconclusive. Several groups have demonstrated that OSA and MetSyn are
highly associated, independent of obesity, and conclude that OSA is a manifestation of the
MetSyn. Coughlin and colleagues examined the prevalence of MetSyn and its components in a
group of middle-age males and found that MetSyn prevalence was more than twice as high
among the OSA group vs. similar controls (87% vs. 35%) [33]. This group also found that
independent of obesity, OSA was associated with increased BP, higher insulin and TG
concentrations, decreased HDL-C, and a trend toward higher HOMA IR values. Ip and

109
colleagues confirmed that OSA is independently associated with insulin resistance in a large
group of middle-age adults, as demonstrated by higher levels of fasting insulin and HOMA-IR
among subjects with OSA vs. similar controls [56, 57]. Stagnitti and colleagues also reported
that middle-age subjects with OSA demonstrate a distinct profile with clustering of vascular risk
factors related to MetSyn, including higher TGs, diastolic BP, and insulin levels, compared to
similar controls [58]. Gruber and colleagues evaluated the associations between MetSyn, insulin
resistance, and albuminuria with OSA in middle-aged adults and found that the prevalence of
MetSyn was higher in OSA vs. non-OSA subjects (74% vs. 24%) [59]. Additionally,
independent of obesity, TG and glucose were higher in participants with OSA compared to
similar controls, while insulin levels and prevalence of microalbuminuria were similar between
groups.
Conversely, conflicting literature suggests that obesity is the primary driving factor of
metabolic abnormalities in OSA patients, rather than the presence of OSA. Sharma et al.
conducted a two-year case-control study to assess the metabolic profile in middle-age subjects
with OSA [60]. This group concluded that obesity was the major determinant of metabolic
abnormalities in their cohort, as OSA had no independent association with components of the
MetSyn, including dyslipidemia, insulin resistance, or elevated glucose. Stoohs and colleagues
screened middle-aged adults for OSA and found that those with OSA had significantly more
insulin resistance; however, when their model was corrected for multiple variables, BMI was the
sole determinant of the observed elevated insulin resistance [61]. Barcelo and colleagues
evaluated metabolic biomarkers among a group of middle-age men, including obese and non-
obese patients with OSA, as well as a group of non-obese healthy subjects [62]. Their findings
agree with those of Sharma and Stoohs, that metabolic abnormalities in OSA are associated with
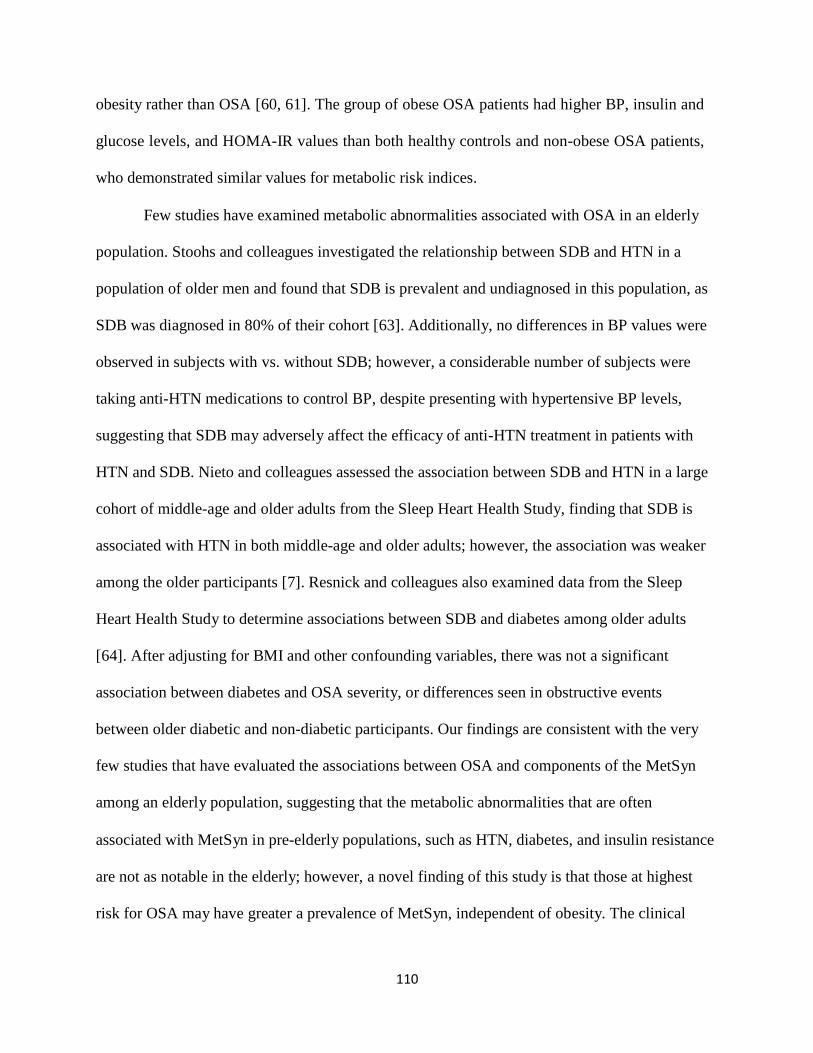
110
obesity rather than OSA [60, 61]. The group of obese OSA patients had higher BP, insulin and
glucose levels, and HOMA-IR values than both healthy controls and non-obese OSA patients,
who demonstrated similar values for metabolic risk indices.
Few studies have examined metabolic abnormalities associated with OSA in an elderly
population. Stoohs and colleagues investigated the relationship between SDB and HTN in a
population of older men and found that SDB is prevalent and undiagnosed in this population, as
SDB was diagnosed in 80% of their cohort [63]. Additionally, no differences in BP values were
observed in subjects with vs. without SDB; however, a considerable number of subjects were
taking anti-HTN medications to control BP, despite presenting with hypertensive BP levels,
suggesting that SDB may adversely affect the efficacy of anti-HTN treatment in patients with
HTN and SDB. Nieto and colleagues assessed the association between SDB and HTN in a large
cohort of middle-age and older adults from the Sleep Heart Health Study, finding that SDB is
associated with HTN in both middle-age and older adults; however, the association was weaker
among the older participants [7]. Resnick and colleagues also examined data from the Sleep
Heart Health Study to determine associations between SDB and diabetes among older adults
[64]. After adjusting for BMI and other confounding variables, there was not a significant
association between diabetes and OSA severity, or differences seen in obstructive events
between older diabetic and non-diabetic participants. Our findings are consistent with the very
few studies that have evaluated the associations between OSA and components of the MetSyn
among an elderly population, suggesting that the metabolic abnormalities that are often
associated with MetSyn in pre-elderly populations, such as HTN, diabetes, and insulin resistance
are not as notable in the elderly; however, a novel finding of this study is that those at highest
risk for OSA may have greater a prevalence of MetSyn, independent of obesity. The clinical

111
manifestations and associations of OSA among the elderly have been demonstrated to differ
from those of younger and middle-age cohorts and some data suggest that OSA in older age may
be a condition distinct from that of middle age. [19, 37-39, 41, 42, 65]. Our findings support
these observations and the notion that a better understanding of OSA in the elderly and how it
differs from the typical OSA patient of middle-age is crucial for proper clinical management of
older patients.
A limitation of this study is that OSA was not clinically diagnosed but rather risk of the
disorder was determined by interview and self-report using the BQ, the most widely used
questionnaire for assessing OSA risk. A second limitation is that the BQ may not provide a high
level of diagnostic specificity to discriminate OSA in an elderly population, as indicated by
recent findings [66]. Despite these limitations, a strength of the methodology utilized in this
study is that study staff administered the BQ to participants via interview rather than the
participants completing them alone. This allowed participants to ask questions or clarify
statements with research staff, if needed, and reduced individual interpretation that can be a
limitation with self-report assessments.
Because subjects included in this sample were participants with AAA disease, results
regarding MetSyn prevalence may not be generalizable to an elderly population; however, due to
the high prevalence of undiagnosed AAA disease in the elderly observed by Singh and
colleagues [67], the findings of this study may be more generalizable to the elderly population
than originally thought. Additionally, race and ethnicity were not reported for these subjects,
which has been shown to influence MetSyn and its constituent markers [28].
A final limitation of this study is that parametric statistical methods were utilized for all
analyses of group comparisons. Non-parametric statistical tests may have been more appropriate

112
for some dependent variables of interest that included outliers and non-normal distributions,
including fasting glucose and insulin, HOMA-IR, LDL-C, and HDL-C (Shapiro-Wilk test of
normality, p<0.01). However, controlling analyses for covariates, such as BMI, is a limitation of
these non-parametric hypotheses tests and therefore, were not utilized in these analyses.
In conclusion, findings from this study indicate that the prevalence of MetSyn in this
subject sample of elderly patients with AAA disease was 41%. Hypertension was the most
prevalent of the MetSyn components, followed by elevated fasting glucose, low HDL-C,
increased waist circumference, and elevated serum triglycerides. These findings are consistent
with literature on the prevalence of MetSyn in patients with AAA disease. Evaluating the
prevalence of MetSyn utilizing different MetSyn definitions, such as that of the WHO, may be
considered for AAA patients to consider additional components indicative of cardio-metabolic
dysfunction.
Of the 57% of subjects at High-risk for OSA included in this study, 45% also had
MetSyn according to the NCEP ATP III criteria [1]. OSA risk from the BQ was not associated
with prevalence of MetSyn, nor any of its components, except for HDL-C; however, subjects
with the highest BRS did have a greater prevalence of MetSyn and two of its components,
reduced HDL-C and increased WC, independent of obesity. Findings from this study also
suggest that OSA may be associated with use of anti-HTN medications to control BP; we did not
observe associations between OSA risk and any other cardio-metabolic risk factor of interest,
suggesting that there is not a significant association between OSA and cardio-metabolic risk
factors among our elderly subject sample of AAA patients. This study is the first to examine
associations between MetSyn and biomarkers of MetSyn with risk for OSA in an elderly
population with AAA disease. These findings support the notion that the clinical manifestations

113
and associations of OSA related to cardio-metabolic disease risk among the elderly differ from
those of younger and middle-age cohorts, suggesting that OSA in older age may be a condition
distinct from that of middle age. Further research to examine the clinical manifestation of
MetSyn across the lifespan and in populations with vascular disease is warranted for proper
clinical management of older patients.
Finally, the BRS may prove a useful interpretation of the BQ for clinical purposes, as
additional information regarding MetSyn risk was observed when subjects were stratified by
BRS that was not observed when subjects were classified by the clinical interpretation of the BQ.
The BRS may provide additional information by identifying subjects at increased risk for OSA
and at risk for associated comorbid chronic diseases.

114
TABLES
Table 1. NCEP ATP III Clinical Identification of the Metabolic Syndrome
Risk Factor/MetSyn Component Defining Level
Fasting Plasma Glucose (mg/dL) ≥110
WC (cm) Male; Female >102; >88
BP (mmHg) ≥130/85
TG (mg/dL) ≥150
HDL-C (mg/dL) Male; Female <40; <50
# of components for MetSyn diagnosis ≥3
Derived from Grundy et al. [1] Abbreviations: WC-waist circumference; BP-blood pressure;
TG-triglycerides; HDL-C-high density lipoprotein cholesterol.

115
Table 2. Subject Characteristics and Cardio-metabolic Risk Factors
Characteristic Subject Sample, n=326
Age (yr) 73.3 (8.5)
Gender (% M/F) 83% / 17%
AAA size (cm) 3.5 (0.8)
BMI (kg/m2) 29.3 (6.1)
WC (cm) 100.7 (15.2)
SBP rest (mmHg) 142.3 (17.5)
DBP rest (mmHg) 76.6 (10.4)
Anti-HTN Med (%) 89
Fasting Glucose (mg/dL) 113.3 (27.0)
Fasting Insulin (mU/L) 13.6 (14.4)
HOMA IR 4.2 (6.2)
Diabetic Med (%) 21
TC (mg/dL) 161.8 (42.9)
HDL-C (mg/dL) 44.2 (14.2)
LDL-C (mg/dL) 93.6 (33.6)
TG (mg/dL) 98.4 (47.7)
Anti-lipemic Med (%) 79
Data are expressed as subject sample Means ± Standard Deviations (SD). Medication data is
presented as a group percentage (%) taking each class of medication. Abbreviations: AAA-
abdominal aortic aneurysm; BMI-body mass index; WC-waist circumference; SBP-systolic
blood pressure; DBP-diastolic blood pressure; HTN-hypertension; Med-medication; HOMA
IR- homeostatic model assessment for insulin resistance; TC-total cholesterol; HDL-C-high

116
density lipoprotein-cholesterol; LDL-C-low density lipoprotein-cholesterol; TG-triglycerides.
Table 3. Prevalence of Metsyn Components and MetSyn Among SubjectS MetSyn Component (NCEP ATP III)
Subject Sample
Prevalence, n=326
Increased WC (%) 45
Elevated BP or anti-HTN medication (%) 95
Elevated Fasting Glucose or diabetic Med (%) 55
Elevated TG or Rx Med (%) 13
Reduced HDL or Rx Med (%) 52
MetSyn (≥3 components; %) 41
Data are expressed as prevalence of each MetSyn component and MetSyn, as defined by the
NCEP ATP III, among the subject sample. Abbreviations: WC-waist circumference; BP-blood
pressure; HTN-hypertension; Rx-prescription; Med-medication; TG-triglycerides; HDL-C-high
density lipoprotein cholesterol.

117
Table 4. Subject Characteristics and Cardiovascular and Metabolic Biomarkers by BQ OSA-Risk
Characteristic
BQ Low-Risk,
n=139
BQ High-Risk,
n=187
t statistic/F
ratio
Pearson
Chi Square
p value
Proportion (%)
43
57
_
7.07
<0.01
Age (yrs)
74.5 (8.6)
72.3 (8.3)
2.30
_
0.02
AAA size (cm)
3.5 (0.7)
3.5 (0.8)
-0.69
_
0.49
BMI (kg/m2)
27.6 (5.1)
30.5 (6.5)
-4.35
_
<0.01
WC (cm)
97.0 (14.2)
103.4 (15.2)
-3.69 / 2.31
_
<0.01/ 0.63
HC (cm)
102.8 (10.2)
107.2 (13.1)
-3.13 / 18.3
_
<0.01 / 0.52
W/H ratio
0.94 (0.07)
0.96 (0.08)
-2.68 / 1.83
_
<0.01 / 0.18
SBP rest (mmHg)
143.3 (17.5)
141.6 (17.6)
0.83
_
0.41

118
DBP rest (mmHg)
76.3 (9.8)
76.8 (10.8)
-0.39
_
0.69
Anti-HTN Med (%)
84
92
-2.30 /3.1
5.2
0.02/0.05
Fasting Glucose (mg/dL)
112.3 (31.8)
114.1 (22.9)
-0.56
_
0.57
Fasting Insulin (mU/L)
11.1 (10.6)
15.4 (16.5)
-2.64 / 0.89
_
0.01/ 0.35
HOMA IR
3.5 (6.1)
4.7 (6.2)
-1.66
_
0.10
Diabetic Med (%)
17
24
-1.43
2.03
0.15
TC (mg/dL)
160.1 (44.5)
162.4 (41.8)
-0.29
_
0.77
TG (mg/dL)
91.6 (45.1)
103.3 (49.0)
-2.03 / 1.80
_
0.04 / 0.18
HDL (mg/dL)
45.6 (13.7)
43.1 (14.5)
1.49
_
0.14
LDL (mg/dL)
92.3 (32.8)
94.6 (34.3)
-0.59
_
0.56

119
Anti-lipemic Med (%)
79
80
-3.32
0.11
0.74
Data are expressed as group Mean and Standard Deviation (SD). BMI was controlled for in the analyses; p values and F ratios for
statistical difference between groups are expressed as without the covariate / with the covariate, where appropriate. Medication data is
presented as a group percentage (%) taking each class of medication. Abbreviations: AAA-abdominal aortic aneurysm; BMI-body
mass index; WC-waist circumference; SBP-systolic blood pressure; DBP-diastolic blood pressure; HTN-hypertension; Med-
medication; HOMA IR-homeostatic model assessment for insulin resistance; TC-total cholesterol; HDL-C-high density lipoprotein-
cholesterol; LDL-C-low density lipoprotein-cholesterol; TG-triglycerides.
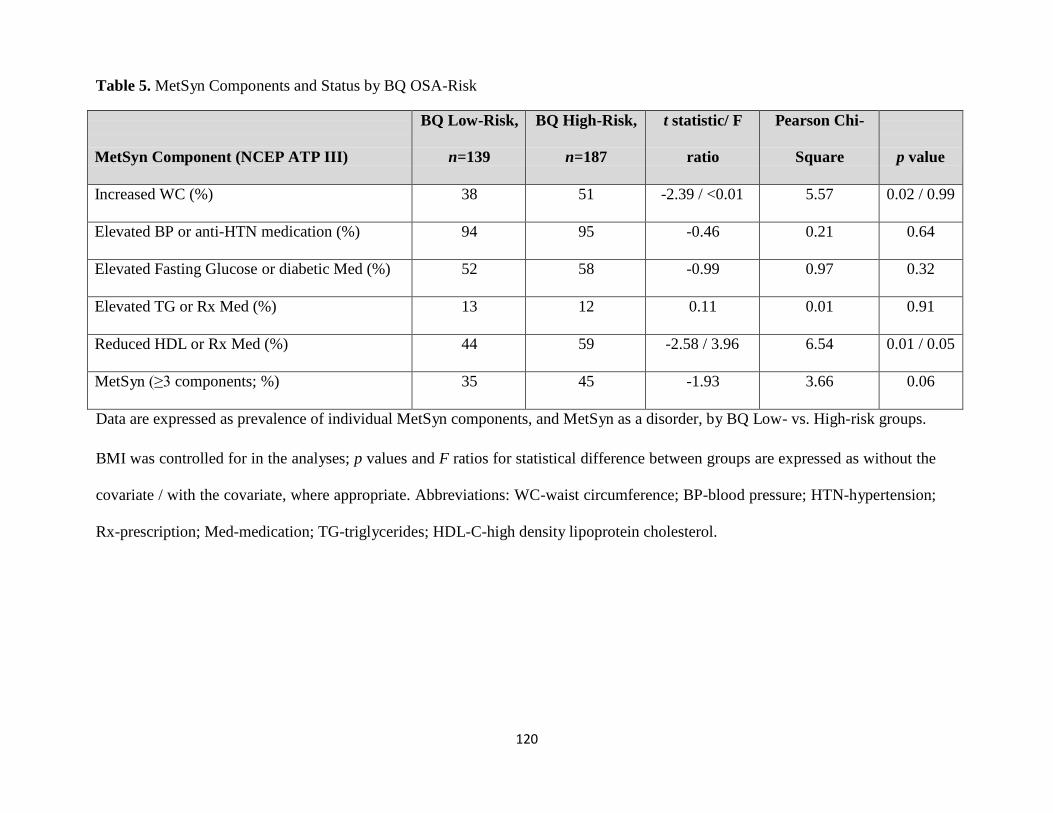
120
Table 5. MetSyn Components and Status by BQ OSA-Risk
MetSyn Component (NCEP ATP III)
BQ Low-Risk,
n=139
BQ High-Risk,
n=187
t statistic/ F
ratio
Pearson Chi-
Square
p value
Increased WC (%) 38 51 -2.39 / <0.01 5.57 0.02 / 0.99
Elevated BP or anti-HTN medication (%) 94 95 -0.46 0.21 0.64
Elevated Fasting Glucose or diabetic Med (%) 52 58 -0.99 0.97 0.32
Elevated TG or Rx Med (%) 13 12 0.11 0.01 0.91
Reduced HDL or Rx Med (%) 44 59 -2.58 / 3.96 6.54 0.01 / 0.05
MetSyn (≥3 components; %) 35 45 -1.93 3.66 0.06
Data are expressed as prevalence of individual MetSyn components, and MetSyn as a disorder, by BQ Low- vs. High-risk groups.
BMI was controlled for in the analyses; p values and F ratios for statistical difference between groups are expressed as without the
covariate / with the covariate, where appropriate. Abbreviations: WC-waist circumference; BP-blood pressure; HTN-hypertension;
Rx-prescription; Med-medication; TG-triglycerides; HDL-C-high density lipoprotein cholesterol.

121
Table 6. Cardiovascular and Metabolic Biomarkers by Berlin Risk Score
Characteristic
BRS 0, n=18
BRS 1, n=121
BRS 2, n=133
BRS 3, n=54
F ratio
Pearson
Chi-Square
p value
Proportion (%)
6
37
41
17
_
110.4
<0.01
Age (yr)
72.6 (9.5)
74.8 (8.5)
72.3 (7.9)
72.4 (9.4)
2.10
_
0.10
BMI (kg/m2)
24.4 (3.2) b
28.1 (5.2) b
29.8 (6.3) ab
32.5 (6.6)
11.45
_
<0.01
WC (cm)
89.6 (12.1) b
98.2 (14.2) b
101.8 (15.8) a
107.2 (13.2)
8.05 / 0.17
_
<0.01 / 0.92
HC (cm)
97.8 (9.8)
103.7 (10.1)
106.5 (13.6) a
109.0 (11.5) a
5.10 / 0.97
_
<0.01 / 0.41
W/H ratio
0.91 (0.06) b
0.95 (0.08) b
0.96 (0.07)
0.99 (0.09)
5.00 / 1.59
_
<0.01 / 0.19

122
SBP rest (mmHg)
144.7 (17.4)
143.1 (17.6)
140.5 (15.7)
144.3 (21.4)
0.82
_
0.48
DBP rest (mmHg)
77.8 (11.8)
76.1 (9.4)
76.6 (11.0)
77.2 (10.4)
0.23
_
0.88
Fasting Glucose
(mg/dL)
96.4 (9.8) b
114.7 (33.3)
112.0 (20.2)
119.6 (28.3)
3.19 / 1.76
_
0.02 / 0.16
Fasting Insulin (mU/L)
8.3 (5.7)
11.5 (11.1) b
14.2 (17.0)
18.5 (14.8)
3.28/0.70
_
0.02 / 0.56
HOMA IR
2.0 (1.3)
3.7 (6.5)
4.3 (6.3)
5.8 (5.8)
1.90
_
0.13
TC (mg/dL)
158.6 (30.9)
161.4 (46.4)
165.8 (44.1)
154.0 (34.3)
0.94
_
0.42
TG (mg/dL)
81.3 (33.3)
93.3 (46.8)
100.4 (46.6)
110.6 (54.3)
2.34
_
0.07
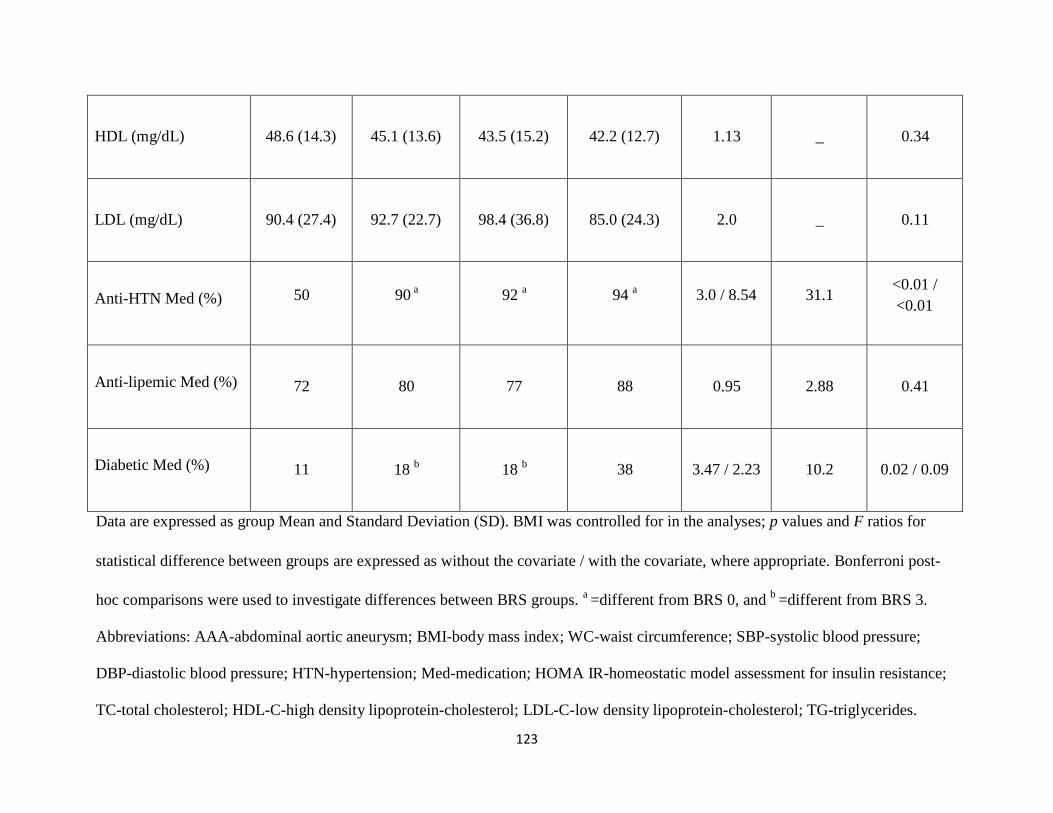
123
HDL (mg/dL)
48.6 (14.3)
45.1 (13.6)
43.5 (15.2)
42.2 (12.7)
1.13
_
0.34
LDL (mg/dL)
90.4 (27.4)
92.7 (22.7)
98.4 (36.8)
85.0 (24.3)
2.0
_
0.11
Anti-HTN Med (%)
50
90 a
92 a
94 a
3.0 / 8.54
31.1
<0.01 /
<0.01
Anti-lipemic Med (%)
72
80
77
88
0.95
2.88
0.41
Diabetic Med (%)
11
18 b
18 b
38
3.47 / 2.23
10.2
0.02 / 0.09
Data are expressed as group Mean and Standard Deviation (SD). BMI was controlled for in the analyses; p values and F ratios for
statistical difference between groups are expressed as without the covariate / with the covariate, where appropriate. Bonferroni post-
hoc comparisons were used to investigate differences between BRS groups. a =different from BRS 0, and
b =different from BRS 3.
Abbreviations: AAA-abdominal aortic aneurysm; BMI-body mass index; WC-waist circumference; SBP-systolic blood pressure;
DBP-diastolic blood pressure; HTN-hypertension; Med-medication; HOMA IR-homeostatic model assessment for insulin resistance;
TC-total cholesterol; HDL-C-high density lipoprotein-cholesterol; LDL-C-low density lipoprotein-cholesterol; TG-triglycerides.

124
Table 7. MetSyn Components and Status by Berlin Risk Score
MetSyn Component
(NCEP ATP III)
BRS 0, n=18
BRS 1, n=121
BRS 2, n=133
BRS 3, n=54
F ratio
Pearson
Chi-Square
p value
Increased WC (%)
11
b
42
b
42
b
75
3.93
27.2
<0.01 / <0.01
Elevated BP or anti-HTN
medication (%)
83
95
95
96
1.58
4.73
0.19
Elevated Fasting Glucose
or Rx Med (%)
38
b
54
51
73
2.25
8.94
0.03 / 0.08
Elevated TG or Rx Med
(%)
6
14
12
14
0.41
1.25
0.74

125
Reduced HDL or Rx Med
(%)
17
48
58
a
61
a
2.87
12.9
<0.01 / 0.04
MetSyn (≥3 components;
%)
11
b
13
b
37
b
65
3.34
20.6
<0.01 / 0.02
Data are expressed as prevalence of individual MetSyn components, and MetSyn as a disorder, by BRS OSA-risk groups. BMI was
controlled for in the analyses; p values and F ratios for statistical difference between groups are expressed as without the covariate /
with the covariate, where appropriate. Abbreviations: WC-waist circumference; BP-blood pressure; HTN-hypertension; Med-
medication; Rx-prescription; TG-triglycerides; HDL-C-high density lipoprotein cholesterol.

126
Pre
val
ence
(%
) FIGURES
100
90 Increased WC
80
70 Elevated BP/Anti-HTN Meds
60 Elevated Glucose/Diabetic
50 Meds
40 Elevated TG/Fibrate Meds
30 Reduced HDL-C/Niacin Meds
20 MetSyn (≥3 components)
10
0
Subject Sample of Elderly AAA Patients (n=326)
Figure 1. Prevalence of MetSyn Components and MetSyn among the Subject Sample.
Abbreviations: WC-waist circumference; BP- blood pressure; HTN-hypertension; Med-medication; TG-triglycerides; HDL-C-high
density lipoprotein cholesterol; AAA-abdominal aortic aneurysm.
127
Pre
val
ence
(%
) 100
90
80
70
* Increased WC
60 Elevated BP/Anti-HTN Meds
Elevated Glucose/Diabetic Meds 50
Elevated TG/Fibrate Meds
40 Reduced HDL-C/Niacin Meds
MetSyn (≥3 components) 30
20
10
0
BQ Low-Risk BQ High-Risk
Figure 2. MetSyn Components and Status by BQ OSA-Risk.
Data are expressed as prevalence of individual MetSyn components, and MetSyn as a disorder, by BQ Low- vs. High-risk groups.
BMI was controlled for in the analyses and * indicates statistical significance, which was set at p<0.05. Abbreviations: WC-waist
circumference; BP-blood pressure; HTN-hypertension; Med- medication; TG-triglycerides; HDL-C-high density lipoprotein
cholesterol; BQ-Berlin Questionnaire.

128
Pre
val
ence
(%
) 120
100
80
Increased WC
a Elevated BP/Anti-HTN Meds a
60 Elevated Glucose/Diabetic Meds
Elevated TG/Fibrate Meds
b b Reduced HDL-C/Niacin Meds
40 b MetSyn (≥3 components)
20 b b
b
0
BRS 0 BRS 1 BRS 2 BRS 3
Figure 3. MetSyn Components and Status by Berlin Risk Score.
Data are expressed as group Mean (Standard Deviation-SD). BMI was controlled for in the analyses. Bonferroni post-hoc
comparisons were used to investigate differences between BRS groups. a=different from BRS 0, and
b =different from BRS 3.
Statistical significance was set at p<0.05. Abbreviations: WC-waist circumference; BP-blood pressure; HTN-hypertension; Med-

129
medication; TG-triglycerides; HDL-C-high density lipoprotein cholesterol; BRS-Berlin Risk Score.

130
REFERENCES
1. Grundy, S.M., et al., Definition of metabolic syndrome: report of the National Heart,
Lung, and Blood Institute/American Heart Association conference on scientific issues
related to definition. Arterioscler Thromb Vasc Biol, 2004. 24(2): p. e13-8.
2. White, D.P., The pathogenesis of obstructive sleep apnea: advances in the past 100
years. Am J Respir Cell Mol Biol, 2006. 34(1): p. 1-6.
3. Shamsuzzaman, A.S., B.J. Gersh, and V.K. Somers, Obstructive sleep apnea:
implications for cardiac and vascular disease. JAMA, 2003. 290(14): p. 1906-14.
4. Young, T., et al., Estimation of the clinically diagnosed proportion of sleep apnea
syndrome in middle-aged men and women. Sleep, 1997. 20(9): p. 705-6.
5. Vgontzas, A.N., et al., Sleep apnea and sleep disruption in obese patients. Arch Intern
Med, 1994. 154(15): p. 1705-11.
6. Fischer, J. and F. Raschke, [Glucose tolerance, insulin resistance and arterial
hypertension in patients with obstructive sleep apnea syndrome]. Pneumologie, 1995. 49
Suppl 1: p. 131-5.
7. Nieto, F.J., et al., Association of sleep-disordered breathing, sleep apnea, and
hypertension in a large community-based study. Sleep Heart Health Study. JAMA, 2000.
283(14): p. 1829-36.
8. Ohayon, M.M., The effects of breathing-related sleep disorders on mood disturbances in
the general population. J Clin Psychiatry, 2003. 64(10): p. 1195-200; quiz, 1274-6.
9. Peker, Y., et al., Increased incidence of cardiovascular disease in middle-aged men with
obstructive sleep apnea: a 7-year follow-up. Am J Respir Crit Care Med, 2002. 166(2): p.
159-65.
10. Peppard, P.E., et al., Prospective study of the association between sleep-disordered
breathing and hypertension. N Engl J Med, 2000. 342(19): p. 1378-84.
11. Saruhara, H., et al., Obstructive sleep apnea as a potential risk factor for aortic disease.
Heart Vessels, 2012. 27(2): p. 166-73.
12. Spiegel, K., R. Leproult, and E. Van Cauter, Impact of sleep debt on metabolic and
endocrine function. Lancet, 1999. 354(9188): p. 1435-9.

131
13. Strohl, K.P., et al., Insulin levels, blood pressure and sleep apnea. Sleep, 1994. 17(7): p.
614-8.
14. Wolk, R., A.S. Shamsuzzaman, and V.K. Somers, Obesity, sleep apnea, and
hypertension. Hypertension, 2003. 42(6): p. 1067-74.
15. Somers, V.K., et al., Sympathetic neural mechanisms in obstructive sleep apnea. J Clin
Invest, 1995. 96(4): p. 1897-904.
16. Narkiewicz, K., et al., Baroreflex control of sympathetic nerve activity and heart rate in
obstructive sleep apnea. Hypertension, 1998. 32(6): p. 1039-43.
17. Abrishami, A., A. Khajehdehi, and F. Chung, A systematic review of screening
questionnaires for obstructive sleep apnea. Can J Anaesth, 2010. 57(5): p. 423-38.
18. Ramachandran, S.K. and L.A. Josephs, A meta-analysis of clinical screening tests for
obstructive sleep apnea. Anesthesiology, 2009. 110(4): p. 928-39.
19. Young, T., et al., Predictors of sleep-disordered breathing in community-dwelling adults:
the Sleep Heart Health Study. Arch Intern Med, 2002. 162(8): p. 893-900.
20. Young, T., et al., The occurrence of sleep-disordered breathing among middle-aged
adults. N Engl J Med, 1993. 328(17): p. 1230-5.
21. Duran, J., et al., Obstructive sleep apnea-hypopnea and related clinical features in a
population-based sample of subjects aged 30 to 70 yr. Am J Respir Crit Care Med, 2001.
163(3 Pt 1): p. 685-9.
22. Durán, C. Prevalence of obstructive sleep apnea–hypopnea and related clinical features
in the elderly: a population-based study in the general population aged 71–100. in World
Conference 2001 Sleep Odyssey. 2001. Montevideo, Uruguay.
23. Ancoli-Israel, S., et al., Sleep-disordered breathing in community-dwelling elderly. Sleep,
1991. 14(6): p. 486-95.
24. Bixler, E.O., et al., Effects of age on sleep apnea in men: I. Prevalence and severity. Am
J Respir Crit Care Med, 1998. 157(1): p. 144-8.
25. Mason, R.H., et al., Obstructive sleep apnea in patients with abdominal aortic
aneurysms: highly prevalent and associated with aneurysm expansion. Am J Respir Crit
Care Med, 2011. 183(5): p. 668-74.

132
26. Cronin, O., P.J. Walker, and J. Golledge, The association of obesity with abdominal
aortic aneurysm presence and growth. Atherosclerosis, 2012.
27. Avogaro P, C.G., Enzi G, Tiengo A, Associazione di iperlipidemia, diabete mellito e
obesità di medio grado. Acta Diabetol Lat, 1967. 4: p. 36-41.
28. Ervin, R.B., Prevalence of metabolic syndrome among adults 20 years of age and over,
by sex, age, race and ethnicity, and body mass index: United States, 2003-2006. Natl
Health Stat Report, 2009(13): p. 1-7.
29. Lakka, H.M., et al., Abdominal obesity is associated with increased risk of acute
coronary events in men. Eur Heart J, 2002. 23(9): p. 706-13.
30. Olijhoek, J.K., et al., The metabolic syndrome is associated with advanced vascular
damage in patients with coronary heart disease, stroke, peripheral arterial disease or
abdominal aortic aneurysm. Eur Heart J, 2004. 25(4): p. 342-8.
31. Coughlin, S., P. Calverley, and J. Wilding, Sleep disordered breathing--a new component
of syndrome x? Obes Rev, 2001. 2(4): p. 267-74.
32. Vgontzas, A.N., E.O. Bixler, and G.P. Chrousos, Sleep apnea is a manifestation of the
metabolic syndrome. Sleep Med Rev, 2005. 9(3): p. 211-24.
33. Coughlin, S.R., et al., Obstructive sleep apnoea is independently associated with an
increased prevalence of metabolic syndrome. Eur Heart J, 2004. 25(9): p. 735-41.
34. Kostoglou-Athanassiou, I. and P. Athanassiou, Metabolic syndrome and sleep apnea.
Hippokratia, 2008. 12(2): p. 81-6.
35. Gami, A.S. and V.K. Somers, Obstructive sleep apnoea, metabolic syndrome, and
cardiovascular outcomes. Eur Heart J, 2004. 25(9): p. 709-11.
36. Vgontzas, A.N., et al., Sleep apnea and daytime sleepiness and fatigue: relation to
visceral obesity, insulin resistance, and hypercytokinemia. J Clin Endocrinol Metab,
2000. 85(3): p. 1151-8.
37. Ancoli-Israel, S., et al., Natural history of sleep disordered breathing in community
dwelling elderly. Sleep, 1993. 16(8 Suppl): p. S25-9.
38. Ancoli-Israel, S. and T. Coy, Are breathing disturbances in elderly equivalent to sleep
apnea syndrome? Sleep, 1994. 17(1): p. 77-83.

133
39. Enright, P.L., et al., Prevalence and correlates of snoring and observed apneas in 5,201
older adults. Sleep, 1996. 19(7): p. 531-8.
40. Foley, D.J., et al., Associations of symptoms of sleep apnea with cardiovascular disease,
cognitive impairment, and mortality among older Japanese-American men. J Am Geriatr
Soc, 1999. 47(5): p. 524-8.
41. Ingram, F., et al., Sleep apnea and vigilance performance in a community-dwelling older
sample. Sleep, 1994. 17(3): p. 248-52.
42. Young, T., Sleep-disordered breathing in older adults: is it a condition distinct from that
in middle-aged adults? Sleep, 1996. 19(7): p. 529-30.
43. Ancoli-Israel, S., et al., Long-term follow-up of sleep disordered breathing in older
adults. Sleep Med, 2001. 2(6): p. 511-6.
44. Young, T., et al., Predictors of sleep-disordered breathing in community-dwelling adults:
the Sleep Heart Health Study. Arch Intern Med, 2002. 162(8): p. 893-900.
45. Peled, N., et al., Association of elevated levels of vascular endothelial growth factor in
obstructive sleep apnea syndrome with patient age rather than with obstructive sleep
apnea syndrome severity. Respiration, 2007. 74(1): p. 50-5.
46. Tasali, E. and M.S. Ip, Obstructive sleep apnea and metabolic syndrome: alterations in
glucose metabolism and inflammation. Proc Am Thorac Soc, 2008. 5(2): p. 207-17.
47. Ahmadi, N., et al., The Berlin questionnaire for sleep apnea in a sleep clinic population:
relationship to polysomnographic measurement of respiratory disturbance. Sleep Breath,
2008. 12(1): p. 39-45.
48. Netzer, N.C., et al., Using the Berlin Questionnaire to identify patients at risk for the
sleep apnea syndrome. Ann Intern Med, 1999. 131(7): p. 485-91.
49. Weinreich, G., et al., [Is the Berlin questionnaire an appropriate diagnostic tool for sleep
medicine in pneumological rehabilitation?]. Pneumologie, 2006. 60(12): p. 737-42.
50. Sharma, S.K., et al., Validation of the modified Berlin questionnaire to identify patients at
risk for the obstructive sleep apnoea syndrome. Indian J Med Res, 2006. 124(3): p. 281-
90.
51. Ascaso, J.F., et al., Diagnosing insulin resistance by simple quantitative methods in
subjects with normal glucose metabolism. Diabetes Care, 2003. 26(12): p. 3320-5.

134
52. Gorter, P.M., et al., Prevalence of the metabolic syndrome in patients with coronary
heart disease, cerebrovascular disease, peripheral arterial disease or abdominal aortic
aneurysm. Atherosclerosis, 2004. 173(2): p. 363-9.
53. Watanabe, H., et al., Metabolic syndrome and risk of development of chronic kidney
disease: the Niigata preventive medicine study. Diabetes Metab Res Rev, 2010. 26(1): p.
26-32.
54. Choi, H.S., S.H. Ryu, and K.B. Lee, The relationship of microalbuminuria with
metabolic syndrome. Nephron Clin Pract, 2006. 104(2): p. c85-93.
55. Ford, E.S. and W.H. Giles, A comparison of the prevalence of the metabolic syndrome
using two proposed definitions. Diabetes Care, 2003. 26(3): p. 575-81.
56. Doherty, G., K. Stagnitti, and A.M. Schoo, From student to therapist: follow up of a first
cohort of Bachelor of Occupational Therapy students. Aust Occup Ther J, 2009. 56(5): p.
341-9.
57. Ip, M.S., et al., Obstructive sleep apnea is independently associated with insulin
resistance. Am J Respir Crit Care Med, 2002. 165(5): p. 670-6.
58. Stagnitti, F., Abdominal compartment syndrome after surgery of abdominal aortic
aneurysm. Ann Ital Chir, 2009. 80(6): p. 493-4.
59. Gruber, A., et al., Obstructive sleep apnoea is independently associated with the
metabolic syndrome but not insulin resistance state. Cardiovasc Diabetol, 2006. 5: p. 22.
60. Sharma, S.K., et al., Obesity, and not obstructive sleep apnea, is responsible for
metabolic abnormalities in a cohort with sleep-disordered breathing. Sleep Med, 2007.
8(1): p. 12-7.
61. Stoohs, R.A., F. Facchini, and C. Guilleminault, Insulin resistance and sleep-disordered
breathing in healthy humans. Am J Respir Crit Care Med, 1996. 154(1): p. 170-4.
62. Barcelo, A., et al., Effects of obesity on C-reactive protein level and metabolic
disturbances in male patients with obstructive sleep apnea. Am J Med, 2004. 117(2): p.
118-21.
63. Stoohs, R.A., et al., Sleep-disordered breathing and systemic hypertension in the older
male. J Am Geriatr Soc, 1996. 44(11): p. 1295-300.
64. Resnick, H.E., et al., Diabetes and sleep disturbances: findings from the Sleep Heart
Health Study. Diabetes Care, 2003. 26(3): p. 702-9.
135
65. Punjabi, N.M., The epidemiology of adult obstructive sleep apnea. Proc Am Thorac Soc,
2008. 5(2): p. 136-43.
66. Sforza, E., et al., Is the Berlin questionnaire a useful tool to diagnose obstructive sleep
apnea in the elderly? Sleep Med, 2011. 12(2): p. 142-6.
67. Singh, K., et al., Prevalence of and risk factors for abdominal aortic aneurysms in a
population-based study : The Tromso Study. Am J Epidemiol, 2001. 154(3): p. 236-44.

136
CHAPTER FOUR
OBSTRUCTIVE SLEEP APNEA RISK IN ABDOMINAL AORTIC ANUERYSM
DISEASE PATIENTS: ASSOCIATIONS WITH EXERCISE CAPACITY AND
TOLERANCE
ABSTRACT
Purpose: Compare and contrast exercise capacity and physiological responses to
Cardiopulmonary exercise testing (CPET) in elderly patients with abdominal aortic aneurysm
(AAA) disease relative to risk for obstructive sleep apnea (OSA). Methods: 114 elderly
volunteer subjects with newly diagnosed small AAAs participated. Study methods for all
participants included extraction of medical history and drug information from medical records;
completion of a physical examination with study personnel to assess measures of body habitus
including body mass index (BMI) calculation; completion of a symptom-limited CPET with gas
exchange using an individualized treadmill protocol to assess exercise capacity and responses
during CPET; and completion of the Berlin Questionnaire (BQ), with verification of responses
completed by interviews with study staff, to assess OSA risk. Subjects were classified as High-
Risk or Low-Risk for OSA, using the BQ; to further examine gradations in OSA risk, subjects
were also classified by their Berlin Risk Score (BRS), as determined by summing the three
categorical scores from the BQ (BRS 0, 1, 2, or 3). Results: Exercise capacity and responses at
rest, the VT, peak exercise, and during active recovery, including HR, BP, VE, VO2, VE/VCO2
slope, and RER were not different between BQ High- and Low-risk groups. After controlling
for group differences in BMI, exercise capacity and responses at rest, the VT, peak exercise, and
during active recovery were also similar between BRS groups. Conclusion: OSA risk, in this
study of elderly AAA disease patients, did not influence exercise capacity or physiological
responses to cardiopulmonary exercise testing. Further research is needed to better understand
the clinical implications OSA may have on the elderly with AAA disease.

137
INTRODUCTION
Obstructive sleep apnea (OSA) is the most common sleep related breathing disorder,
affecting an estimated 20% of the U.S. adult population [1]; Prevalence of OSA is difficult to
report, as up to 90% of people with the disorder remain undiagnosed [2], though it is anticipated
to rise as an increasing proportion of Americans are obese and elderly, both of which are risk
factors for OSA. OSA is characterized by repetitive bouts of upper airway occlusion or collapse
during sleep, resulting in intermittent periods of hypoxia, hypercapnia, and fragmented sleep [3].
Obesity is the primary risk factor for OSA and is reported in more than 40% of OSA cases;
furthermore, more than 80% of individuals with OSA are also obese [4].
Untreated OSA can increase risk for several chronic diseases and disorders including
obesity, HTN and CVD, metabolic disorders, depression, and aortic disease [5-13]; however, the
mechanism(s) linking OSA to HTN and CVD remains undetermined. Repetitive nighttime
apneas and hypopneas (cessations and pauses in breathing) result in activation of the sympathetic
nervous system (SNS) and stressful arousals to reestablish breathing. It has been determined that
OSA patients demonstrate an exaggerated activation of the SNS that persists into waking hours
that can lead to elevations in HR and BP [14]. Over time, activation of the baroreceptors, which
respond to normalize these HR and BP oscillations, become altered and depressed in OSA
patients [15], suggesting an impairment of the cardiovascular autonomic system, thereby
increasing risk for HTN and CVD.
The “gold standard” for diagnosing OSA is laboratory polysomnography (PSG);
however, sleep health questionnaires that stratify patients based on clinical symptoms, physical
examinations, and risk factors, are often employed as a first step assessment to screen for OSA.
Questionnaires that are commonly used to screen for OSA and have been validated against PSG,
include the Epworth Sleepiness Scale (ESS), Pittsburgh Sleep Quality Index (PSQI), Berlin
139
Questionnaire (BQ), and most recently, the STOP-Bang questionnaire. Sleep screening
questionnaires do not require complicated calculations to identify high risk patients, and they are
relatively easy and cost-effective to apply clinically; however, there are also limitations. Sleep
questionnaires rely on self-report and disclosure of signs and symptoms, as well as the patient’s
memory and ability and willingness to follow instructions. Additionally, many of the signs and
symptoms of OSA may be difficult for the patient to self-identify, such as snoring and choking
during sleep, and can be misinterpreted as other conditions; however, the BQ is regarded for its
high specificity and sensitivity for predicting moderate to severe OSA [16]. The BQ is also
among the most accurate screening questionnaires for OSA [17].
Sleep disorders, specifically OSA, are highly prevalent in older adults; the Sleep Heart
Health Study found that among 6,400 older adults, sleep disordered breathing (SDB) prevalence
rates for mild to severe SDB ranged from 19-36% for adults 60-98 years old [18]. These rates far
outpace those for middle aged adults, age 30-60 years old, whose SDB rates were 2-4% for
women and men [19]. One cohort study found that for adults 71-100 years, the prevalence of
mild OSA was 80% and moderate OSA was 49% for women and 57% for men [20, 21]. Despite
these high prevalence rates, studies have suggested that most of the age-related increase in
prevalence of OSA occurs before age 65 and plateaus at some point after age 65 [22, 23].
Recently, OSA was determined to be highly prevalent among patients with AAA disease,
a disease of the elderly in which the lower part of the aorta is weakened and bulging. Moderate
or severe OSA was present in 42% of their subjects with AAA disease [24]. One very recent
report suggested that OSA may not only be a risk for factor for aortic disease [10], but a causal
factor for faster AAA expansion [24]. AAA disease is prevalent in the elderly, most often
occurring in people age 60 years and older, and AAA presence is associated with overweight and
140
obesity [25]. Risk factors for AAA include advancing age, history of cigarette smoking, male
gender and family history.
Increases in chronic diseases and disabilities that often accompany aging, in addition to
AAA disease, may limit the daily activities of older adults and reduce health-related quality of
life. Approximately 80% of older Americans have at least one and 50% have at least two chronic
conditions, such as cardiovascular disease (CVD), type II diabetes, or cancer [26]. Chronic
illness also may contribute to the reductions in physical activity (PA) and exercise capacity in
older adults. Unfortunately, few older adults achieve the minimum recommendation for PA; up
to 34% of adults age 65-74 years and up to 44% of adults ages 75 years and older are inactive
[27]. This, despite the recommendations that older adults without specific health limitations
should engage in 150 minutes of moderate intensity aerobic activity each week, or 75 minutes of
vigorous intensity aerobic activity, in addition to two days each week of muscle-strengthening
activities [28].
Conversely, physical inactivity and a sedentary lifestyle contribute to and exacerbate
many chronic diseases that are the leading causes of death in the U.S, including cardiovascular
and metabolic diseases [29]. In 2002, the primary causes of death for older adults in the U.S.
were heart disease, cancer, and stroke, together accounting for 61% of all deaths in America,
among those age 65 years and older [30]. Three studies from the last two decades clearly point
to poor health behaviors, including diet, physical inactivity, and smoking, as accountable for
somewhere between 14-35% of the deaths each year that are attributable chronic diseases [31-
33].
Regular PA is important for improving the health and wellbeing of people of all ages. PA
increases cardiovascular functional capacity and decreases myocardial oxygen demand at any

141
level of exertion by increasing both maximum cardiac output and the ability of muscles to extract
and utilize oxygen from the blood [34]. Beneficial changes in hemodynamic, hormonal,
metabolic, neurological, and respiratory function also occur with increased exercise capacity [35-
38]. Developing and maintaining aerobic endurance, joint flexibility, and muscle strength is
especially important for aging individuals [39] to improve mobility and physical functioning and
ability to complete activities of daily living (ADLs), in addition to the mental health and quality
of life benefits. A fundamental requirement for many ADLs is the ability to perform aerobic
work, requiring the efforts of the heart, lungs, and circulation to deliver oxygen to metabolically
active muscles. Exercise capacity is affected by age, sex, conditioning status, presence of
diseases, or medications that can influence peak oxygen consumption (VO2peak) [40].
Previous studies have shown that elderly individuals experience changes in the cardiac
autonomic control, due to aging, demonstrating a marked reduction in parasympathetic
modulation [41]; therefore, this population demonstrates a reduction in cardiac output (CO),
peripheral blood flow, and muscle metabolism, which can promote changes related to the
transport and use of oxygen in the body [42]. During cardio-pulmonary exercise testing (CPET),
elderly persons demonstrate lower values for maximal power (cycle ergometry), and peak HR, as
well as ventilatory and metabolic variables, compared to younger populations; this is primarily
due to muscular and cardiorespiratory changes caused by aging [42].
The assessment of exercise capacity and physiological responses during CPET provides
important diagnostic and prognostic information in a clinical setting [40] and is an effective tool
for identifying those at high risk for CVD [43]. Exercise capacity and PA status are well-
established predictors of cardiovascular and overall mortality [44-46], supporting the value of
CPET as a clinical tool that provides relevant diagnostic and prognostic information in both

142
healthy persons and those with cardiovascular conditions [46]. CPET is frequently used to assess
integrated response of cardiovascular, respiratory, and muscular systems to graded physical
exercise. In addition to exercise capacity, other physiological responses during CPET are of
clinical utility, including responses at the ventilatory threshold (VT) and during exercise
recovery. The VT, defined by the exercise level at which ventilation begins to increase
exponentially for a given increment in oxygen consumption (V02), can predict exercise
performance and intensity. Researchers have identified oxygen consumption at the VT as a
parameter of comparable importance to VO2 at peak exercise for identifying patients at increased
mortality risk [47]. Additionally, recovery responses post exercises reflect impairment in
autonomic regulation and may have prognostic value for those at risk for cardiovascular
complications; abnormal HR or BP responses during exercise recovery have been shown to
predict future CVD [48] and mortality [49, 50]. CPET has also been safe and effective for
evaluating AAA patients; Myers and colleagues evaluated exercise capacity and responses to
CPET in elderly patients with small AAAs and found that although they demonstrated similar
exercise capacities, AAA patients had a slightly higher incidence of hyper- and hypotensive
responses to exercise than the age-matched referral group, suggestive of potential autonomic
imbalance [51].
Patients with OSA are also characterized by excessive daytime sleepiness (EDS), fatigue,
and decreased daily PA which may also impair muscle energy metabolism and decrease exercise
tolerance [52]. Obesity is often a co-morbid condition in individuals with OSA and may also
influence exercise capacity through abnormalities in lung function and increases in ventilatory
stress [53]. Decreased exercise capacity, an independent predictor for all-cause mortality in
older men [46], has been demonstrated in middle-aged adults with OSA [54-56]; however, the

143
mechanisms by which have not been thoroughly determined. Possible causes include
cardiovascular [57], respiratory [58], and peripheral muscular abnormalities [52]. Autonomic
nervous system dysfunction has been hypothesized to link OSA to CVDs such as HTN, heart
failure, myocardial infarction, and stroke [59]. In patients with OSA, sympathetic drive is
increased during nighttime apneic events as well as during daytime awake periods [14].
Recovery responses following maximal exercise reflect primarily parasympathetic reactivation
and have been shown to be of prognostic importance in the general population [60]. The
influence of OSA risk on exercise capacity and physiological responses during exercise and
recovery has been examined in pre-elderly populations with OSA [53, 56, 61, 62] but not
systematically examined in an elderly population at risk for OSA with newly diagnosed AAAs.
RESEARCH AIM AND HYPOTHESIS
The aim of this study is to compare and contrast exercise capacity and physiological
responses to CPET in elderly patients with AAA disease according to risk for OSA, as assessed
by the BQ. The working hypothesis is that OSA risk is associated with reduced exercise capacity
and with physiological responses to exercise suggestive of autonomic imbalance and ventilatory
inefficiency.
METHODS
A total of 114 subjects with newly diagnosed small AAAs (aortic diameter ≥2.5 and < 5.5
cm) were recruited from Stanford University Medical Center, the Veterans Affairs Palo Alto
Health Care System (VAPAHCS) and Kaiser Permanente of Northern California. Subjects were
50 years of age or older, agreed to comply with study protocols and procedures, and provided

144
voluntary consent to participate. Additional exclusion criteria is discussed in Appendix A.
Recruitment procedures and all study-related activities were reviewed and approved in advance
by Institutional Review Boards (IRBs) at Stanford University (including VAPAHCS) as well as
the Kaiser Permanente Division of Research and an independent Data Safety Monitoring Board
(DSMB) organized by the NHLBI. Additional details on recruitment procedures can be found in
Appendix A. Study methods for all participants included extraction of medical history and drug
information from medical records and subject completion of a health history questionnaire which
included self-report medication use; completion of a physical examination with study personnel
to assess resting systolic and diastolic BP, as well as measures of body habitus including height
and weight for body mass index (BMI) calculation and waist (WC) and hip (HC) circumference
measurements; completion of the BQ, with verification of responses completed by interviews
with study staff, to assess OSA risk; and completion of a symptom-limited CPET with gas
exchange using an individualized treadmill protocol according to recommended procedures to
assess exercise capacity and physiological responses during CPET [43].
Physical Examination and Health History
Subjects underwent a physical examination with study personnel to assess resting
systolic and diastolic BP, as well as measures of body habitus, including height and
weight for BMI calculation and waist (WC) and hip circumference (HC) measurements,
which were also used to calculate waist/hip (W/H) ratio. Detailed assessment protocols
for these measures are included in Appendix A. Subjects also provided information on
prescriptive medications they were receiving to determine the extent of medically
managed HTN, dyslipidemia, type II diabetes, and other diseases and disorders in the

145
sample.
Berlin Questionnaire
The modified Berlin Questionnaire (BQ) is a 12-item self-report questionnaire that
includes questions about risk factors for OSA that can be identified with three discrete
sign/symptom categories of 1.) snoring behavior, 2.) wake time sleepiness and fatigue, and 3.)
obesity and HTN. The modified BQ, an extension of the original BQ, includes three additional
questions regarding choking behavior and wake-time sleepiness. The modified BQ is a validated
instrument used to identify individuals who are at risk for OSA with a sensitivity (86%) and
specificity (95%) comparable to the original BQ [63-66]; positive and negative predictive values
of 96% and 82%, respectively, were reported for the modified BQ [66]. Subjects completed the
BQ and responses were confirmed and clarified by one-on-one interview between subject and
study personnel.
Patients were classified as Low- or High-Risk for OSA based on their responses to the
individual items and their overall scores in the three symptom categories, according to the
scoring instructions detailed by Netzer and colleagues [64]. To further examine gradations in
OSA risk, subjects also were classified by their Berlin Risk Score (BRS) which, for this study,
was defined as the sum of the three categorical scores from the BQ. Subjects were grouped into
one of four BRS groups which equated to the number of categories that were scored positive
from their BQ (BRS 0, 1, 2, or 3). It should be noted that this is not a validated interpretation of
the BQ, but simply an approach to examine a more detailed analysis of risk for OSA from patient
responses to the individual questions and risk factor categories that comprise the BQ.
Cardiopulmonary Exercise Testing

146
Participants completed a symptom-limited CPET with gas exchange using an
individualized ramp treadmill protocol, as previously described by Myers et al. [67] and
according to standard protocols and recommended procedures to assess exercise capacity and
physiological responses during CPET [43]. Standardized medical examinations were performed
prior to testing and medication use was continued as prescribed. Protocols were individualized to
fall within the recommended 8 to 12 minute range. Electrocardiograms (ECGs) for HR and
rhythm were obtained at rest, each minute during exercise, and during recovery. BP was
measured at rest, every 2 minutes during exercise, and during recovery or until symptoms, ECG
changes, and BP stabilized. For individual patients, a supervising physician was present who
determined if CPET’s should be terminated before pre-determined endpoints, whenever
untoward signs, symptoms, or responses occurred. In the absence of indications to stop the test,
participants were encouraged to exercise until volitional fatigue. The Borg scale for perceived
exertion was used to quantify effort [68]. Exercise capacity was estimated from peak treadmill
speed and grade [43]. CPET responses were obtained using a CosMed Quark CPET metabolic
system (CosMed Inc, Rome, Italy). Minute ventilation (VE), oxygen uptake (VO2), carbon
dioxide production (VCO2), and other cardiopulmonary exercise test variables were acquired
breath by breath, reported at 10-second intervals, and averaged over 30 seconds. The VT was
determined using the V-slope method. The VE/VCO2 slope was calculated using measured VE
and VCO2 responses during exercise. Detailed protocols and procedures for these measures are
discussed by Myers et. al in a previous publication that evaluated exercise training in patients
with AAA disease [69].
Statistical Analyses

147
Data were stored electronically in a SPSS® (SPSS, Inc., Chicago, IL) database (Version
20.0). Statistical significance was determined a priori for all experimental analyses as a p value
< 0.05. Descriptive statistics were assessed for each group to observe means, standard deviations
(S.D), and ranges for variables of interest related to exercise capacity and physiological
responses at rest, during exercise, at peak exercise, and during recovery. To compare means
between groups, independent student t-tests and ANOVA were performed, for two- and four-
group comparisons, respectively; Bonferroni post hoc analysis were used to further examine
differences between four-group comparisons for all dependent variables of interest. Although the
subject sample was similar, group differences existed for BMI that may affect relationships
between dependent variables of interest related to exercise capacity and physiological responses
to CPET; therefore, when statistically significant differences between groups were observed for
variables of interest, a general linear model univariate procedure was performed to control for
BMI.
RESULTS
Characteristics of Study Participants by OSA Risk
Characteristics of individual subjects are presented in Appendix D. Men comprised 94%
of the subject sample. Means ±SD values for characteristics of the study groups, identified at
Low- and High- risk for OSA according to subject BQ clinical risk scores are presented in Table
1. Approximately half of the overall sample (48%) was classified as High-risk for OSA by this
method. The BQ High-risk group was, on average, 3.5 years younger (t=2.21; p=0.03) and had a
greater BMI (t=-2.29; p=0.02) than the Low-risk group. Given the significant relationship
between age and BMI (F=11.6; p<0.01), analyses were controlled for the influences of BMI.
AAA size was similar between OSA-risk groups, as was resting BP. Measures of body habitus,
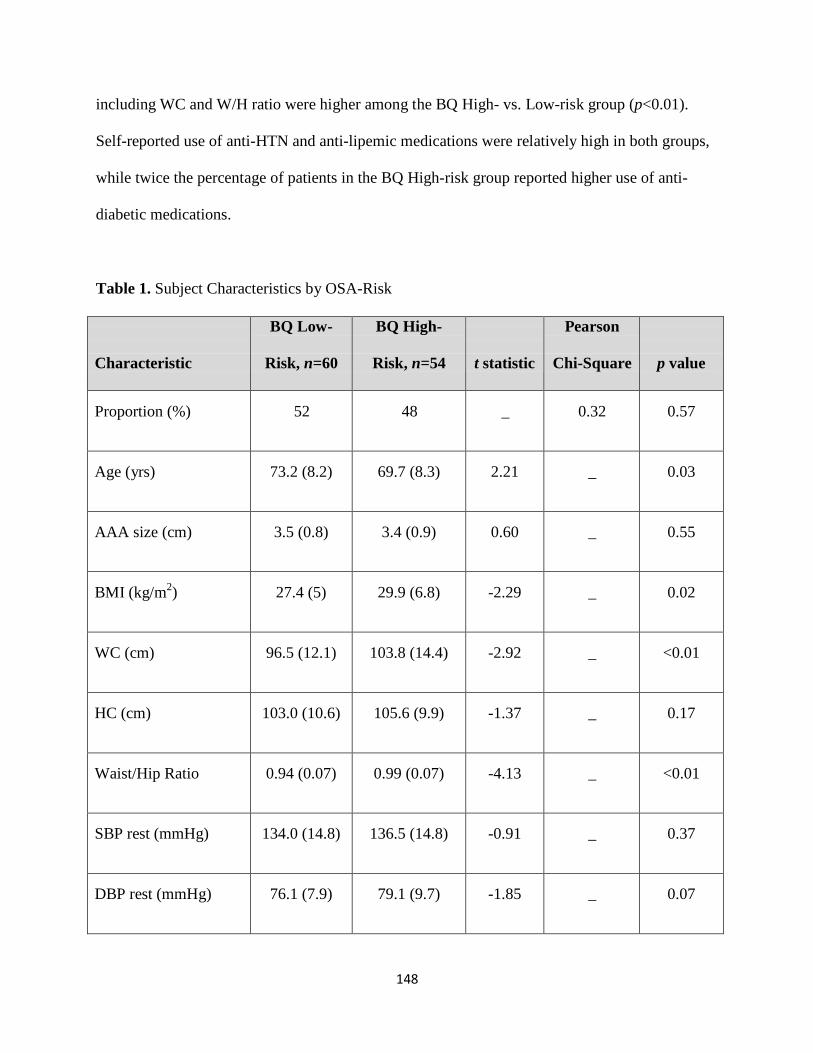
148
including WC and W/H ratio were higher among the BQ High- vs. Low-risk group (p<0.01).
Self-reported use of anti-HTN and anti-lipemic medications were relatively high in both groups,
while twice the percentage of patients in the BQ High-risk group reported higher use of anti-
diabetic medications.
Table 1. Subject Characteristics by OSA-Risk
Characteristic
BQ Low-
Risk, n=60
BQ High-
Risk, n=54
t statistic
Pearson
Chi-Square
p value
Proportion (%)
52
48
_
0.32
0.57
Age (yrs)
73.2 (8.2)
69.7 (8.3)
2.21
_
0.03
AAA size (cm)
3.5 (0.8)
3.4 (0.9)
0.60
_
0.55
BMI (kg/m2)
27.4 (5)
29.9 (6.8)
-2.29
_
0.02
WC (cm)
96.5 (12.1)
103.8 (14.4)
-2.92
_
<0.01
HC (cm)
103.0 (10.6)
105.6 (9.9)
-1.37
_
0.17
Waist/Hip Ratio
0.94 (0.07)
0.99 (0.07)
-4.13
_
<0.01
SBP rest (mmHg)
134.0 (14.8)
136.5 (14.8)
-0.91
_
0.37
DBP rest (mmHg)
76.1 (7.9)
79.1 (9.7)
-1.85
_
0.07

149
Anti-HTN Med (%)
68
76
_
0.76
0.38
Anti-lipemic Med (%)
65
64
_
0.10
0.92
Diabetic Med (%)
11
24
_
3.31
0.07
Data are expressed as group Mean and SD. Medication data is presented as a group percentage
(%) taking each class of medication. Abbreviations: AAA-abdominal aortic aneurysm; BMI-
body mass index; WC-waist circumference; HC-hip circumference; W/H-waist/hip; SBP-systolic
blood pressure; DBP-diastolic blood pressure; HTN-hypertension; Med-medication.
Subject characteristics for groups defined by BRS risk score (stratification according to
four risk levels) are presented in Table 2. This stratification resulted in the majority of subjects
being classified as either BRS 1 and 2 groups, 44% and 37%, respectively, and substantially
fewer categorized in the lowest and highest OSA risk classifications (X2=45.0; p<0.01). Age and
AAA size were similar across groups. BMI and measures of body habitus including WC and
W/H ratio significantly increased linearly across BRS groups; therefore, BMI was controlled for
in the analyses, where appropriate. HC and SBP were similar across groups, as was use of
medications to control HTN and anti-lipemic medications. Use of medications to control diabetes
was significantly higher in the BRS 3 group compared to BRS 0 and 1 groups.

150
Table 2. Subject Characteristics by Berlin Risk Score
Characteristic
BRS 0, n=9
BRS 1, n=51
BRS 2, n=41
BRS 3, n=13
F ratio
Pearson
Chi-Square
p value
Proportion (%)
8
44
37
11
_
45.0
<0.01
Age (yrs)
72.4 (6.7)
73.3 (8.5)
69.8 (8.4)
69.6 (8.5)
1.63
_
0.19
AAA size (cm)
3.1 (1.0)
3.6 (0.7)
3.5 (0.7)
3.4 (1.2)
0.97
_
0.41
BMI (kg/m2)
24.4 (3.4) a
27.9 (5.1)
29.8 (7.4)
30.5 (4.8)
2.71
_
0.05
WC (cm)
88.1 (10.6) b
98.0 (11.8)
102.8 (15.3)
106.8 (11.1)
4.73
_
<0.01
HC (cm)
96.7 (7.9)
104.1 (10.6)
105.4 (10.3)
106.3 (8.8)
2.02
_
0.12
Waist/Hip Ratio
0.92 (0.06) b
0.94 (0.07) b
0.99 (0.07)
1.0 (0.05)
6.53
_
<0.01
SBP rest (mmHg)
129.9 (10.5)
134.7 (15.5)
135.7 (15.3)
139.2 (13.3)
0.72
_
0.54

151
DBP rest (mmHg)
75.4 (6.5)
76.2 (8.2)
78.4 (9.9)
81.6 (9.1)
0.19
_
1.60
Anti-HTN Med (%)
67
69
70
92
1.02
3.09
0.38
Anti-lipemic Med (%)
56
67
62
69
0.20
0.63
0.89
Diabetic Med (%)
0 a
13 a
16
46
3.66
10.3
0.02
Data are expressed as group Mean and Standard Deviation (SD). Medication data is presented as a group percentage (%) taking each
class of medication. Bonferroni post-hoc comparisons were used to investigate differences between groups. a
= different from BQ+
Class 3, b
= different from BQ+ Class 2 and 3. Abbreviations: AAA-abdominal aortic aneurysm; BMI-body mass index; WC-waist
circumference; HC-hip circumference; W/H-waist/hip; SBP-systolic blood pressure; DBP-diastolic blood pressure; HTN-
hypertension; Med-medication.

152
Table 3 highlights the cardiopulmonary variables of interest from the CPET and
recreational PA by BQ OSA risk-group. For exercise capacity and variables assessed at rest, at
the VT, and peak exercise, including HR, BP, VE, VO2, RER, and VE/VCO2 slope, no
differences were found between groups classified as Low- vs. High--risk for OSA. Figures 1 and
2 graphically demonstrate HR and BP response during post-exercise active recovery,
respectively, neither of which differed between groups.
Table 3. CPET Variables by Clinical Berlin OSA-Risk
Characteristic
BQ Low-
Risk, n=60
BQ High-
Risk, n=54
t statistic
p value
HR at rest-supine (bt/min)
64 (11)
64 (11)
0.15
0.88
SBP at rest-supine (mmHg)
131.1 (14.6)
134.4 (14.9)
-1.20
0.23
DBP at rest-supine (mmHg)
76.0 (8.4)
78.8 (8.6)
-1.76
0.08
HR at rest-standing (bt/min)
69.6 (13.7)
67.9 (13.6)
0.65
0.52
SBP at rest-standing
(mmHg)
130.0 (17.2)
134.7 (18.3)
-1.40
0.17
DBP at rest-standing
(mmHg)
76.4 (8.9)
77.7 (10.9)
-0.69
0.49
HR at VT (bt/min)
102 (24)
100 (19)
0.97
0.73

153
Time at VT (% Max
Exercise Time)
41
47
-1.11
0.27
VE at VT (L/min)
36.0 (12.0)
36.9 (11.3)
-0.11
0.69
VO2 at VT (ml/kg/min)
14.9 (4.1)
14.7 (4.2)
0.24
0.81
RER at VT
0.9 (0.3)
0.8 (0.2)
1.14
0.26
VE/VCO2 slope at VT
0.30 (0.04)
0.29 (0.06)
0.80
0.43
HR peak (bt/min)
131.7 (23.7)
126.8 (21.9)
1.15
0.26
SBP peak (mmHg)
180.6 (25.4)
189.4 (29.6
-1.69
0.09
DBP peak (mmHg)
78.0 (12.4)
82.5 (14.2)
-1.80
0.08
VE peak (L/min)
62.7 (20.7)
69.2 (19.9)
-1.70
0.09
VO2 peak (ml/kg/min)
20.8 (7.3)
20.9 (6.3)
-0.12
0.91
RER peak
1.1 (0.2)
1.5 (2.6)
-0.24
0.29
Data are expressed as group Mean and SD. BMI was controlled for in the analyses; p values and
F ratios are expressed as without the covariate / with the covariate where appropriate.
Abbreviations: HR-heart rate; SBP-systolic blood pressure; DBP-diastolic blood pressure; VT-
ventilatory threshold; VO2-oxygen consumption; RER-respiratory exchange ratio.

154
Bea
t/m
in
140
130
120
110
100
90
80
BQ Low-Risk
BQ High-Risk
70
60
50
HR peak HRR min1 HRR min2 HRR min5
Figure 1. HR Slope During Post-Exercise Recovery by Clinical Berlin OSA-Risk.
BMI was controlled for in the analyses. Abbreviations: BQ-Berlin Questionnaire; HR-heart
rate; HRR- heart rate recovery.

155
mm
Hg
200
190
180
170
160
150
140
130
BQ Low-Risk
BQ High-Risk
120
110
100 SBP peak SBPR min1 SBPR min2 SBPR min5
Figure 2. SBP Slope During Post-Exercise Recovery by Clinical Berlin OSA-Risk.
BMI was controlled for in the analyses. Abbreviations: BQ-Berlin Questionnaire; SBP-
systolic blood pressure; SBPR- systolic blood pressure recovery.

156
Table 4 highlights the cardiopulmonary variables of interest from the CPET by BRS
group. Exercise capacity and physiological responses at rest and the VT including HR, BP, VE,
VO2, RER, and VE/VCO2 slope were similar across BRS groups at the VT. Physiological
responses recorded at peak exercise were also similar between groups, including BP, VE,
VO2max, and RERpeak, though HR at peak exercise was higher among the BRS 0 group compared
to BRS groups 1, 2, and 3 (F=2.81; p=0.04). SBP during the first minute of active recovery was
higher among the BRS 0 group compared to the BRS 1 group but no longer remained significant
after controlling for group differences in BMI. No other measurement of HR or BP differed
between groups during active recovery between BRS groups. Figures 3 and 4 graphically
demonstrate HR and BP response during post-exercise active recovery, respectively, across BRS
groups.

157
Table 4. CPET Variables by Berlin Risk Score
Characteristic
Berlin Risk
Score=0, n=9
Berlin Risk
Score=1, n=51
Berlin Risk
Score=2, n=41
Berlin Risk
Score=3, n=13
F ratio
p value
HR at rest-
supine (bt/min)
64.2 (13.6)
64.2 (10.9)
64.6 (10.5)
61.7 (11.7)
0.23
0.87
SBP at rest-
supine (mmHg)
125.3 (13.7)
132.1 (14.6)
134.0 (13.9)
135.8 (18.5)
1.06
0.40
DBP at rest-
supine (mmHg)
78.2 (6.4)
75.6 (8.7)
78.2 (7.5)
81.0 (11.6)
1.60
0.19
HR at rest-
standing
(bt/min)
70.2 (13.8)
69.4 (13.8)
69.6 (14.2)
62.8 (10.3)
0.94
0.42
SBP at rest-
standing
(mmHg)
125.1 (14.3)
130.9 (17.6)
134.2 (18.8)
136.2 (17.6)
0.95
0.42
DBP at rest-
standing
76.9 (9.5)
76.4 (8.9)
76.8 (10.5)
80.6 (12.2)
0.66
0.58

158
(mmHg)
HR at VT
(bt/min)
118.0 (17.6)
102.6 (18.3)
99.8 (17.4)
102.0 (23.1)
1.36
0.26
Time at VT (%
Max Exercise
Time)
61
38
45
52
2.57
0.06
VE at VT
(L/min)
44.7 (8.0)
35.5 (10.5)
36.7 (11.8)
37.5 (9.9)
1.49
0.22
VO2 at VT (ml/kg/min)
17.2 (2.5)
14.5 (4.2)
14.5 (4.5)
15.1 (3.5)
0.90
0.44
RER at VT
0.93 (0.07)
0.86 (0.10)
0.84 (0.11)
0.86 (0.10)
1.66
0.18
VE/VCO2 slope at VT
0.28 (0.02)
0.30 (0.04)
0.29 (0.06)
0.29 (0.06)
0.52
0.67
HR peak
(bt/min)
149.9 (22.2) c
128.4 (22.6)
126.8 (20.7)
126.5 (26.0)
3.05 / 2.81
0.03 / 0.04

159
SBP peak
(mmHg)
186.9 (35.6)
179.4 (23.4)
188.2 (30.0)
193.1 (29.2)
1.23
0.30
DBP peak
(mmHg)
82.1 (11.2)
77.2 (12.5)
82.4 (15.1)
82.8 (11.4)
1.41
0.24
VE peak
(L/min)
69.8 (10.3)
61.3 (21.9)
68.7 (19.3)
70.7 (22.7)
1.43
0.24
VO2 peak (ml/kg/min)
21.6 (10.3)
20.2 (7.3)
20.6 (7.0)
20.3 (6.5)
0.09
0.96
RER peak
1.1 (0.1)
1.1 (0.2)
1.1 (0.1)
1.1 (0.1)
0.08
0.97
Data are expressed as group Means and SD. BMI was controlled for in the analyses; p values and F ratios are expressed as without the
covariate / with the covariate where appropriate. Bonferroni post-hoc comparisons were used to investigate differences between
groups. a
= different from BQ+ Class 3; c
= different from BQ+ Class 1,2, and 3; and d
= different from BQ+ Class 0. Abbreviations:
HR-heart rate; SBP-systolic blood pressure; DBP-diastolic blood pressure; VT-ventilatory threshold; VO2-oxygen consumption; RER-
respiratory exchange ratio.

160
bt/
min
170
*
150
130
110
90
70
BRS 0
BRS 1
BRS 2
BRS 3
50
HR peak HRR min1 HRR min2 HRR min5
Figure 3. HR Slope During Post-Exercise Recovery by Berlin Risk Score.
BMI was controlled for in the analyses. Bonferroni post-hoc comparisons were used to
investigate differences between BRS groups. * indicates BRS 0 ≠ BRS 1, 2 and 3. Statistical
significance was set at p<0.05. Abbreviations: BRS-Berlin Risk Score; HR-heart rate; HRR-
heart rate recovery.

161
mm
Hg
220
200
180
160
140
BRS 0
BRS 1
BRS 2
BRS 3
120
100 SBP peak SBPR min1 SBPR min2 SBPR min5
Figure 4. SBP Slope During Post-Exercise Recovery by Berlin Risk Score.
BMI was controlled for in the analyses. Bonferroni post-hoc comparisons were used to
investigate differences between BRS groups. Statistical significance was set at p<0.05. No
differences found between groups. Abbreviations: BRS-Berlin Risk Score; SBP-systolic blood
pressure; SBPR- systolic blood pressure recovery.

162
DISCUSSION
Findings indicate that the group of elderly AAA patients at High-risk for OSA, as
indicated from the BQ, demonstrate similar exercise capacity and physiological responses to
CPET compared to their Low-risk counterparts, suggesting that exercise tolerance was not
impacted by presence of OSA risk in elderly AAA patients. Stratifying the subject sample by
BRS revealed group differences for peak HR, which was higher among the lowest risk BRS
group compared to BRS 1, 2, and 3 groups. Group differences in HR at peak exercise were not
due to the influences of medication known to affect physiological responses to exercise, as use of
anti-HTN medications was similar across OSA-risk groups. To investigate this further, a non-
parametric Kruskal Wallis test to account for the non-normal distribution of the mean HRpeak
revealed that group differences for HRpeak were not significant (p=0.06). All OSA-risk groups
(BQ High- vs. Low-risk and BRS groups) were able to achieve at least 80% of their age-
predicted maximal HR, which was not influenced by OSA-risk, further supporting the findings
exercise capacity and responses are not associated with OSA risk in elderly AAA patients.
This is the first study to evaluate the associations between OSA risk and exercise capacity
and responses in an elderly group of AAA patients; interestingly, these findings contrast with
those that have evaluated influences of OSA and exercise tolerance in middle-age and young
adult populations. Przybylowski and colleagues found that exercise capacity can be limited due
to hypertensive responses during exercise in middle-age OSA patients; they also found that those
with severe OSA have exaggerated hemodynamic response to exercise and delayed post-exercise
BP recovery [53]. Nanas et al. evaluated the CPET responses among middle-age men with and
without moderate to severe OSA, as diagnosed from overnight PSG, and determined that OSA
patients demonstrated reduced exercise capacity and delayed heart rate recovery (HRR)

163
compared to men without OSA [54]. Kaleth and colleagues found a distinctive response to CPET
in middle-age OSA patients, characterized by a blunted HR response during exercise, delayed
systolic BP response in early recovery, and elevated diastolic BP in both exercise and early
recovery [61]. Tryfon and colleagues investigated BP responses during CPET in a group of
young to middle age men (range 22-54 years) and found that normotensive OSA patients develop
diastolic BP elevation earlier during exercise and at peak exercise compared to normotensive
men without OSA [70]. These findings are of clinical importance, as diastolic HTN during
exercise is a risk factor for developing future HTN and can be a limiting factor of physical
performance [71]. Hargens and colleagues observed the influences of OSA on exercise responses
in young, college-age men and determined that OSA elicits an attenuated HR recovery post-
exercise, indicative of potential autonomic regulation imbalance, as well as increased ventilatory
responses to exercise suggestive of increased sympathetic drive [62, 72]. Aron et al. [56]
published a review of the literature examining exercise testing in OSA patients, citing that
several studies found that patients with OSA have a reduced exercise capacity, blunted HR
response during exercise, and atypical BP response during exercise and recovery. Aron
highlighted possible explanations for these responses, including cardiac dysfunction, impaired
muscle metabolism, chronic sympathetic over-activation, and endothelial dysfunction [56]. The
age of subjects included in Aron’s review ranged from 22 to 52 years of age, confirming the lack
of literature regarding OSA and exercise capacity and responses in older adults.
Research suggests that OSA in older age may be a condition distinct from that of middle
age. Many of the cardiovascular and metabolic abnormalities that are highly associated with
OSA in middle-age adults are less associated in older adults with OSA. Both HTN and obesity,
which are highly associated and influenced by OSA risk in middle-age populations, are less

164
related in older adults [6, 73, 74]. Additionally, comorbidities that worsen with OSA severity and
time untreated in middle-aged cohorts may not be linked to severity of OSA in the elderly and
may actually decrease with age [75]. This unique clinical manifestation of OSA in the elderly
may also influence exercise capacity and tolerance in these AAA patients. Although OSA
prevalence increases with age, several studies have demonstrated that this steady increase in
prevalence with each decade plateaus or decreases after age 65 [22, 23, 76] and OSA in older
patients may be less severe than OSA in younger populations [23]. It may be that a remission of
OSA or physiological adaptations to OSA exists with aging and the disorder has less of an
influence on exercise capacity and tolerance in older adults than is seen in younger populations.
Further research is needed to better understand the long term impact of untreated OSA and the
clinical implications for the elderly with OSA.
A limitation of this study is that OSA was not clinically diagnosed but rather risk of the
disorder was determined by interview and self-reports, using the BQ, the most widely used
questionnaire for assessing OSA risk. A second limitation is that the BQ may not provide a high
level of diagnostic specificity to discriminate OSA in an elderly population, as indicated by
recent findings [77]. Despite these limitations, a strength of the methodology utilized in this
study is that study staff administered the BQ to participants via interview rather than the
participants completing them independently. This allowed participants to ask questions or clarify
statements with research staff, if needed, and reduced individual interpretation that can be a
limitation with self-report assessments.
A final limitation of this study is that because subjects were a convenience sample of
patients with AAA disease, results may not be generalizable to an elderly population; however,
due to the high prevalence of undiagnosed AAA disease in the elderly [78], the findings of this
study may be more generalizable to the elderly population than originally thought. Furthermore,

165
Myers and colleagues demonstrated that AAA patients are capable of achieving exercise
capacities and CPET results and risk scores similar to age-matched referral subjects [51].
In conclusion, the working hypothesis was proved incorrect, as findings indicate that
OSA risk does not influence exercise capacity or physiological responses to exercise during
CPET among an elderly group of AAA patients. This is the first study to evaluate the
associations between OSA risk and exercise capacity and responses in an elderly sub-population.
Our findings contrast with those that have demonstrated associations between OSA and reduced
exercise capacity, chronotropic incompetence, and autonomic imbalance in middle-age and
young adult populations [53, 54, 56, 61, 62, 70]. Research suggests that OSA in older age may
be a condition distinct from that of middle age; this unique clinical manifestation of OSA in the
elderly may also influence exercise capacity and tolerance in these AAA patients due to
physiological adaptations to OSA that may develop with aging. Further research is needed to
better understand the long term impact of untreated OSA and the clinical implications for the
elderly with OSA.

166
REFERENCES 1. Shamsuzzaman, A.S., B.J. Gersh, and V.K. Somers, Obstructive sleep apnea:
implications for cardiac and vascular disease. JAMA, 2003. 290(14): p. 1906-14.
2. Young, T., et al., Estimation of the clinically diagnosed proportion of sleep apnea
syndrome in middle-aged men and women. Sleep, 1997. 20(9): p. 705-6.
3. White, D.P., The pathogenesis of obstructive sleep apnea: advances in the past 100
years. Am J Respir Cell Mol Biol, 2006. 34(1): p. 1-6.
4. Vgontzas, A.N., et al., Sleep apnea and sleep disruption in obese patients. Arch Intern
Med, 1994. 154(15): p. 1705-11.
5. Fischer, J. and F. Raschke, [Glucose tolerance, insulin resistance and arterial
hypertension in patients with obstructive sleep apnea syndrome]. Pneumologie, 1995. 49
Suppl 1: p. 131-5.
6. Nieto, F.J., et al., Association of sleep-disordered breathing, sleep apnea, and
hypertension in a large community-based study. Sleep Heart Health Study. JAMA, 2000.
283(14): p. 1829-36.
7. Ohayon, M.M., The effects of breathing-related sleep disorders on mood disturbances in
the general population. J Clin Psychiatry, 2003. 64(10): p. 1195-200; quiz, 1274-6.
8. Peker, Y., et al., Increased incidence of cardiovascular disease in middle-aged men with
obstructive sleep apnea: a 7-year follow-up. Am J Respir Crit Care Med, 2002. 166(2): p.
159-65.
9. Peppard, P.E., et al., Prospective study of the association between sleep-disordered
breathing and hypertension. N Engl J Med, 2000. 342(19): p. 1378-84.
10. Saruhara, H., et al., Obstructive sleep apnea as a potential risk factor for aortic disease.
Heart Vessels, 2012. 27(2): p. 166-73.
11. Spiegel, K., R. Leproult, and E. Van Cauter, Impact of sleep debt on metabolic and
endocrine function. Lancet, 1999. 354(9188): p. 1435-9.
12. Strohl, K.P., et al., Insulin levels, blood pressure and sleep apnea. Sleep, 1994. 17(7): p.
614-8.
13. Wolk, R., A.S. Shamsuzzaman, and V.K. Somers, Obesity, sleep apnea, and
hypertension. Hypertension, 2003. 42(6): p. 1067-74.

167
14. Somers, V.K., et al., Sympathetic neural mechanisms in obstructive sleep apnea. J Clin
Invest, 1995. 96(4): p. 1897-904.
15. Narkiewicz, K., et al., Baroreflex control of sympathetic nerve activity and heart rate in
obstructive sleep apnea. Hypertension, 1998. 32(6): p. 1039-43.
16. Abrishami, A., A. Khajehdehi, and F. Chung, A systematic review of screening
questionnaires for obstructive sleep apnea. Can J Anaesth, 2010. 57(5): p. 423-38.
17. Ramachandran, S.K. and L.A. Josephs, A meta-analysis of clinical screening tests for
obstructive sleep apnea. Anesthesiology, 2009. 110(4): p. 928-39.
18. Young, T., et al., Predictors of sleep-disordered breathing in community-dwelling adults:
the Sleep Heart Health Study. Arch Intern Med, 2002. 162(8): p. 893-900.
19. Young, T., et al., The occurrence of sleep-disordered breathing among middle-aged
adults. N Engl J Med, 1993. 328(17): p. 1230-5.
20. Duran, J., et al., Obstructive sleep apnea-hypopnea and related clinical features in a
population-based sample of subjects aged 30 to 70 yr. Am J Respir Crit Care Med, 2001.
163(3 Pt 1): p. 685-9.
21. Durán, C. Prevalence of obstructive sleep apnea–hypopnea and related clinical features
in the elderly: a population-based study in the general population aged 71–100. in World
Conference 2001 Sleep Odyssey. 2001. Montevideo, Uruguay.
22. Ancoli-Israel, S., et al., Sleep-disordered breathing in community-dwelling elderly. Sleep,
1991. 14(6): p. 486-95.
23. Bixler, E.O., et al., Effects of age on sleep apnea in men: I. Prevalence and severity. Am
J Respir Crit Care Med, 1998. 157(1): p. 144-8.
24. Mason, R.H., et al., Obstructive sleep apnea in patients with abdominal aortic
aneurysms: highly prevalent and associated with aneurysm expansion. Am J Respir Crit
Care Med, 2011. 183(5): p. 668-74.
25. Cronin, O., P.J. Walker, and J. Golledge, The association of obesity with abdominal
aortic aneurysm presence and growth. Atherosclerosis, 2012.
26. CDC. Healthy Aging. Helping People to Live Long and Productive Lives and Enjoy a
Good Quality of Life 2011 [cited 2012 September 21]; Available from:
http://www.cdc.gov/chronicdisease/resources/publications/aag/aging.htm.

168
27. CDC. Behavioral Risk Factor Surveillance System (Prevalence Data). [cited 2012
August 8]; Available from: http://www.cdc.gov/brfss
28. CDC. Physical Activity. Healthy Places 2012 [cited 2012 September 21]; Available
from: http://www.cdc.gov/healthyplaces/healthtopics/physactivity.htm.
29. Hoyert, D.L.a.J.X., National Vital Statistics Reports: Deaths: Preliminary Data for 2011.
2012. 61(6).
30. CDC, National Center for Health Statistics, National Vital Statistics System, 2006.
31. Anderson, L., The State of Aging and Health in America, 2007, CDC
32. Hahn, R.A., et al., Excess deaths from nine chronic diseases in the United States, 1986.
JAMA, 1990. 264(20): p. 2654-9.
33. McGinnis, J.M. and W.H. Foege, Actual causes of death in the United States. JAMA,
1993. 270(18): p. 2207-12.
34. Fletcher, G.F., et al., Statement on exercise: benefits and recommendations for physical
activity programs for all Americans. A statement for health professionals by the
Committee on Exercise and Cardiac Rehabilitation of the Council on Clinical
Cardiology, American Heart Association. Circulation, 1996. 94(4): p. 857-62.
35. Adamopoulos, S., et al., Physical training improves skeletal muscle metabolism in
patients with chronic heart failure. J Am Coll Cardiol, 1993. 21(5): p. 1101-6.
36. Coats, A.J., et al., Controlled trial of physical training in chronic heart failure. Exercise
performance, hemodynamics, ventilation, and autonomic function. Circulation, 1992.
85(6): p. 2119-31.
37. Hambrecht, R., et al., Physical training in patients with stable chronic heart failure:
effects on cardiorespiratory fitness and ultrastructural abnormalities of leg muscles. J
Am Coll Cardiol, 1995. 25(6): p. 1239-49.
38. Sullivan, M.J., M.B. Higginbotham, and F.R. Cobb, Exercise training in patients with
chronic heart failure delays ventilatory anaerobic threshold and improves submaximal
exercise performance. Circulation, 1989. 79(2): p. 324-9.
39. Ades, P.A., et al., Exercise conditioning in the elderly coronary patient. J Am Geriatr
Soc, 1987. 35(2): p. 121-4.

169
40. Fleg, J.L., et al., Assessment of functional capacity in clinical and research applications:
An advisory from the Committee on Exercise, Rehabilitation, and Prevention, Council on
Clinical Cardiology, American Heart Association. Circulation, 2000. 102(13): p. 1591-7.
41. Melo, R.C., et al., Effects of age and physical activity on the autonomic control of heart
rate in healthy men. Braz J Med Biol Res, 2005. 38(9): p. 1331-8.
42. Lauretani, F., et al., Age-associated changes in skeletal muscles and their effect on
mobility: an operational diagnosis of sarcopenia. J Appl Physiol, 2003. 95(5): p. 1851-
60.
43. Prescription, A.s.G.f.E.T.a., ACSM’s Guidelines for Exercise Testing and Prescription.
8th ed. ed2009, Baltimore, MD: Lippincott Williams & Wilkins.
44. Chang, J.A. and V.F. Froelicher, Clinical and exercise test markers of prognosis in
patients with stable coronary artery disease. Curr Probl Cardiol, 1994. 19(9): p. 533-87.
45. Pate, R.R., et al., Physical activity and public health. A recommendation from the Centers
for Disease Control and Prevention and the American College of Sports Medicine.
JAMA, 1995. 273(5): p. 402-7.
46. Myers, J., et al., Exercise capacity and mortality among men referred for exercise testing.
N Engl J Med, 2002. 346(11): p. 793-801.
47. Gitt, A.K., et al., Exercise anaerobic threshold and ventilatory efficiency identify heart
failure patients for high risk of early death. Circulation, 2002. 106(24): p. 3079-84.
48. Kravariti, M., et al., Predictors of endothelial dysfunction in young women with
polycystic ovary syndrome. J Clin Endocrinol Metab, 2005. 90(9): p. 5088-95.
49. Cole, C.R., et al., Heart rate recovery after submaximal exercise testing as a predictor of
mortality in a cardiovascularly healthy cohort. Ann Intern Med, 2000. 132(7): p. 552-5.
50. Nishime, E.O., et al., Heart rate recovery and treadmill exercise score as predictors of
mortality in patients referred for exercise ECG. JAMA, 2000. 284(11): p. 1392-8.
51. Myers, J., et al., Cardiopulmonary exercise testing in small abdominal aortic aneurysm:
profile, safety, and mortality estimates. Eur J Cardiovasc Prev Rehabil, 2011. 18(3): p.
459-66.
52. Vanuxem, D., et al., Impairment of muscle energy metabolism in patients with sleep
apnoea syndrome. Respir Med, 1997. 91(9): p. 551-7.

170
53. Przybylowski, T., et al., Exercise capacity in patients with obstructive sleep apnea
syndrome. J Physiol Pharmacol, 2007. 58 Suppl 5(Pt 2): p. 563-74.
54. Nanas, S., et al., Heart rate recovery and oxygen kinetics after exercise in obstructive
sleep apnea syndrome. Clin Cardiol, 2010. 33(1): p. 46-51.
55. Ching-Chi L, C.-K.L., Kun-Ming W, Effect of treatment by nasal CPAP on
cardiopulmonary exercise test in obstructive sleep apnea syndrome. Lung 2004(182): p.
199-212.
56. Aron, A., et al., Potential clinical use of cardiopulmonary exercise testing in obstructive
sleep apnea hypopnea syndrome. Int J Cardiol, 2009. 132(2): p. 176-86.
57. Shahar, E., et al., Sleep-disordered breathing and cardiovascular disease: cross-sectional
results of the Sleep Heart Health Study. Am J Respir Crit Care Med, 2001. 163(1): p. 19-
25.
58. Robinson, G.V., J.R. Stradling, and R.J. Davies, Sleep . 6: obstructive sleep
apnoea/hypopnoea syndrome and hypertension. Thorax, 2004. 59(12): p. 1089-94.
59. Aydin, M., et al., Cardiac autonomic activity in obstructive sleep apnea: time-dependent
and spectral analysis of heart rate variability using 24-hour Holter electrocardiograms.
Tex Heart Inst J, 2004. 31(2): p. 132-6.
60. Cole, C.R., et al., Heart-rate recovery immediately after exercise as a predictor of
mortality. N Engl J Med, 1999. 341(18): p. 1351-7.
61. Kaleth, A.S., et al., Unique cardiopulmonary exercise test responses in overweight
middle-aged adults with obstructive sleep apnea. Sleep Med, 2007. 8(2): p. 160-8.
62. Hargens, T.A., et al., Attenuated heart rate recovery following exercise testing in
overweight young men with untreated obstructive sleep apnea. Sleep, 2008. 31(1): p.
104-10.
63. Ahmadi, N., et al., The Berlin questionnaire for sleep apnea in a sleep clinic population:
relationship to polysomnographic measurement of respiratory disturbance. Sleep Breath,
2008. 12(1): p. 39-45.
64. Netzer, N.C., et al., Using the Berlin Questionnaire to identify patients at risk for the
sleep apnea syndrome. Ann Intern Med, 1999. 131(7): p. 485-91.
65. Weinreich, G., et al., [Is the Berlin questionnaire an appropriate diagnostic tool for sleep
medicine in pneumological rehabilitation?]. Pneumologie, 2006. 60(12): p. 737-42.
171
66. Sharma, S.K., et al., Validation of the modified Berlin questionnaire to identify patients at
risk for the obstructive sleep apnoea syndrome. Indian J Med Res, 2006. 124(3): p. 281-
90.
67. Myers, J., et al., Comparison of the ramp versus standard exercise protocols. J Am Coll
Cardiol, 1991. 17(6): p. 1334-42.
68. Borg, G., Borg’s Perceived Exertion Scales1998, Champaign, IL: Human Kinetics
Publishers.
69. Myers, J.N., et al., Effects of exercise training in patients with abdominal aortic
aneurysm: preliminary results from a randomized trial. J Cardiopulm Rehabil Prev,
2010. 30(6): p. 374-83.
70. Tryfon, S., et al., Sleep apnea syndrome and diastolic blood pressure elevation during
exercise. Respiration, 2004. 71(5): p. 499-504.
71. Narkiewicz, K., et al., Sympathetic activity in obese subjects with and without obstructive
sleep apnea. Circulation, 1998. 98(8): p. 772-6.
72. Hargens, T.A., et al., Altered ventilatory responses to exercise testing in young adult men
with obstructive sleep apnea. Respir Med, 2009. 103(7): p. 1063-9.
73. Stoohs, R.A., et al., Sleep-disordered breathing and systemic hypertension in the older
male. J Am Geriatr Soc, 1996. 44(11): p. 1295-300.
74. Ancoli-Israel, S., et al., Long-term follow-up of sleep disordered breathing in older
adults. Sleep Med, 2001. 2(6): p. 511-6.
75. Ancoli-Israel, S., et al., Natural history of sleep disordered breathing in community
dwelling elderly. Sleep, 1993. 16(8 Suppl): p. S25-9.
76. Young, T., et al., Predictors of sleep-disordered breathing in community-dwelling adults:
the Sleep Heart Health Study. Arch Intern Med, 2002. 162(8): p. 893-900.
77. Sforza, E., et al., Is the Berlin questionnaire a useful tool to diagnose obstructive sleep
apnea in the elderly? Sleep Med, 2011. 12(2): p. 142-6.
78. Singh, K., et al., Prevalence of and risk factors for abdominal aortic aneurysms in a
population-based study : The Tromso Study. Am J Epidemiol, 2001. 154(3): p. 236-44.

172
CHAPTER FIVE SUMMARY AND RECOMMENDATIONS
Obstructive sleep apnea, the most common sleep related breathing disorder, is highly
prevalent among older adults. At least 1 in 10 people older than 65 years of age have diagnosed
OSA (compared to 1 in 20 adults in the general population) and prevalence is anticipated to rise
as an increasing proportion of Americans are obese and elderly, both of which are risk factors for
OSA [1, 2]; however under diagnosis remains a significant concern. It is estimated that up to
90% of people with OSA remain undiagnosed, likely due to poor awareness of the disorder, lack
of routine screening, and limited diagnostic sleep study facilities. Additionally, among elderly
adults, OSA is weakly associated with common signs and symptoms and may be difficult to
detect in this population [3]. Another concern is limited research on the clinical manifestations of
OSA in older adults. OSA in older adults is complex and some data suggest that in older age,
OSA may be a condition distinct from that of middle age [3-11].
The subject sample included in this dissertation represents a unique group of elderly
AAA patients who may be at increased risk for OSA. Recently, OSA was determined to be
highly prevalent among patients with AAA disease [12] and may not only be a risk for factor for
aortic disease [13], but a causal factor for faster AAA expansion [12]. Due to the limited
literature regarding the influences of OSA risk on health status and disease risk among this
unique population, the primary aims of this dissertation were to:
Evaluate the risk of OSA among elderly patients with newly diagnosed AAA disease and
examine associations between OSA risk and self-report PA behavior in the subject
sample (Study 1);
Examine the cardio-metabolic profile related to MetSyn and the constituent markers of
MetSyn among elderly patients with newly diagnosed AAA disease

173
and assess how risk for OSA may be associated with biomarkers of MetSyn and
MetSyn status among this group (Study 2); and
Examine and compare and contrast exercise capacity and physiological responses to
CPET in elderly patients with AAA disease relative to OSA risk Study 1
Findings from this study indicate that approximately 57% of subjects were indicated
at high-risk for OSA, and approximately 17% of the subject sample was indicated at
“highest” risk by a positive score for all three of the BQ risk categories, including snoring
behavior, EDS, and presence of obesity or HTN. These findings appear to be consistent with
the literature, demonstrating that OSA prevalence increases with age and is higher among
people older than 65 years [14-16], and is prevalent in patients with AAA disease [12].
Some data suggest that OSA in older individuals may be a distinctly different
disorder than that suffered by those of middle age, including markers that are strong
predictors of OSA in middle-aged adults, such as increased body mass and central fat
accumulation, are less strongly associated with OSA in the elderly [11, 17, 18]; however,
findings of this study indicated that elderly participants at High-risk for OSA have greater
BMIs, and indices of central fat and body habitus, WC, HC, and W/H ratios compared to
their Low-risk counterparts. This study concluded that indices of body habitus of the subject
sample are consistent with the clinical signature of OSA among the general population. An
interesting finding was that only the BRS 3 group was higher on measures of body habitus,
suggesting that this subset of subjects at High-risk for OSA (17%) contributes to the majority
of the difference observed in body habitus between High- and Low-risk groups. There was a
greater incidence of diagnosed HTN and diabetes in the High-risk OSA groups, reflected by
use of anti-HTN and diabetic controlling medications. Although previous studies of OSA in

174
older populations report little association between OSA and HTN or diabetes [19, 20], results
of this study are more consistent with OSA symptomology in the general population, in
which OSA is associated with HTN are glucose dysregulation [21-23].
These findings indicate that subjects at High-risk for OSA report engaging in less
daily moderate and vigorous PA, including block walking and stair climbing, and expend less
energy engaging in these activities compared to their Low-risk counterparts, even after
controlling for differences in body habitus. Interestingly, when stratified by BRS, only the
BRS 3 group was less active, suggesting again, that this small group of High-risk subjects
(17%) contributes to the majority of the differences observed in PA habits between High- and
Low-risk groups. These findings have important implications for older adults, as stair
climbing is a precise indication of overall cardiovascular fitness [24] and a reliable surrogate
of peak oxygen consumption, a powerful predictor of cardiovascular morbidity and
premature cardiovascular mortality [25]. The inability to climb stairs has also been associated
with higher all-cause and CVD mortality [24]. Results are consistent with the literature
among young and middle-age populations, which demonstrate that OSA is associated with
decreased subjective and objective measures of PA [26-29]. It is unclear whether the reduced
daily PA observed in our subject sample at High-risk for OSA is a result of their OSA risk or
a contributing factor to it. It may be that patients with OSA are neither psychologically
motivated nor physically able to engage in regular PA due in part to fatigue and EDS. Or
perhaps this groups’ sedentary behavior has over time contributed to their OSA risk, in part
through influences on obesity.
Finally, the BRS may prove a useful interpretation of the BQ for clinical purposes, as
additional information was teased out when subjects were stratified by BRS that was not
observed when subjects were classified by the clinical interpretation of the BQ. The BRS

175
may provide additional information by identifying subjects at increased risk for OSA and at
risk for associated comorbid chronic diseases.
Study 2
Findings from this study indicate that the prevalence of MetSyn, as defined by the
NCEP ATP III, among our subject sample of elderly patients with newly diagnosed AAA
disease was 41%, with HTN being the most prevalent MetSyn component at 94%, followed
by elevated fasting glucose (55%), low HDL-C (52%), increased WC (45%), and elevated
TGs (13%). While prevalence of MetSyn increases with age, our findings indicate that the
cardio-metabolic profile related to MetSyn adjusts in later life, and constituent markers, such
as abdominal obesity that are highly prevalent among younger groups with MetSyn, become
less prevalent in older adults; additionally, risk factors such as HTN and elevated fasting
glucose become more prevalent with age, while seemingly less prevalent in younger
populations [30]. Results are consistent with literature on MetSyn prevalence among similar
sub-populations of patients with AAA disease; however, are slightly lower than those
reported in a large cohort of apparently healthy older adults [30]. One speculation that
warrants further investigation is that MetSyn in patients with vascular disease, including
AAA disease, may be associated with more advanced vascular damage, as measured by
indicators for increased cardiovascular risk, including microalbuminuria [31, 32]. Evaluating
the prevalence of MetSyn in this specific population utilizing different criteria that considers
additional components indicative of cardio-metabolic dysfunction, such as that of the WHO,
may be warranted.
MetSyn was prevalent in 45% of our subject sample of older adults with AAA disease
at High-risk for OSA. Independent of BMI, OSA risk from the BQ was not associated with

176
prevalence of MetSyn, nor any of its components, except for HDL-C; however, an interesting
finding was that subjects considered at highest risk for OSA from the BRS did have a greater
prevalence of MetSyn and two of its components, reduced HDL-C and increased WC,
independent of obesity, suggesting that there may be an association between OSA risk and
MetSyn among those considered at highest risk for MetSyn. High-risk OSA groups had an
increased prevalence of anti-HTN medication use, suggesting that that OSA may be
associated with HTN; however this component of the MetSyn was similar between groups
when considering both BP level and anti-HTN medication use. Additionally, associations
were not observed between OSA risk and any other cardio-metabolic risk factor of interest,
suggesting that there is not a significant association between OSA and cardio-metabolic risk
factors among our elderly subject sample of AAA patients.
The literature on associations between MetSyn and OSA in younger and middle-age
cohorts is mixed and inconclusive. Several groups have demonstrated that OSA is highly
associated with MetSyn and the individual components that comprise the disorder, and these
relationships exist independent of obesity [23, 33, 34]. It has also been suggested that OSA is
a manifestation of the MetSyn. Conflicting literature, however, suggests that obesity is the
primary driving factor of metabolic abnormalities in OSA patients, rather than the presence
of OSA [20, 35, 36]. Findings from this study are consistent with the limited literature that
has evaluated the associations between OSA and components of the MetSyn among an
elderly population, suggesting that the metabolic abnormalities that are often associated with
MetSyn in pre-elderly populations, such as HTN, diabetes, and insulin resistance are not as
notable in the elderly [21,36, 37]. This study is the first to examine associations between
MetSyn and biomarkers of MetSyn with risk for OSA in an elderly population with AAA
disease. These findings support the notion that the clinical manifestations and associations of

177
OSA among the elderly differ from those of younger and middle-age cohorts, suggesting that
OSA in older age may be a condition distinct from that of middle age. Further research to
better understand the manifestation of OSA in the elderly is crucial for proper clinical
management of older patients. Additionally, the BRS may prove a useful interpretation of the
BQ for clinical purposes, as additional information regarding MetSyn risk was observed
when subjects were stratified by BRS that was not observed when subjects were classified by
the clinical interpretation of the BQ. The BRS may provide additional information by
identifying subjects at increased risk for OSA and at risk for associated comorbid chronic
diseases.
Study 3
Findings from Study 3 indicate that OSA risk does not influence exercise capacity, or
physiological responses to exercise during CPET among an elderly group of AAA patients.
After controlling for BMI and accounting for non-normal distribution of data, OSA High-
and Low- risk groups demonstrated similar values for physiological measures of interest at
rest, the VT, peak exercise, and during active recovery. Additionally, the proportion of the
subject sample taking anti-HTN medications known to affect physiological responses to
exercise, including HR and BP, was similar across OSA-risk groups.
Results from this study contrast with those in middle-age and young adult populations
that have demonstrated associations between OSA and reduced exercise capacity,
chronotropic incompetence, and autonomic imbalance [38-43], supporting the notion that
OSA in older age may be a condition distinct from that of younger cohorts. Research has
shown that middle-age patients with OSA demonstrate reduced exercise capacity, blunted
HR and hypertensive responses during exercise, and delayed post-exercise HR and BP

178
recovery [40-42]. Regarding younger groups, research has demonstrated that in comparison
to similar controls without OSA, young adult OSA patients develop diastolic BP elevation
earlier during exercise and at peak exercise, in addition to increased ventilatory responses to
exercise and an attenuated HR recovery post-exercise indicative of sympathetic drive and
autonomic imbalance [39, 43, 44]. Aron et al. [38] discusses possible explanations for these
unique responses in a review of the literature examining CPET in OSA patients, including
cardiac dysfunction, impaired muscle metabolism, chronic sympathetic over-activation, and
endothelial dysfunction [38]. The age of subjects included in Aron’s review ranged from 22
to 52 years of age, confirming the lack of literature regarding OSA and exercise capacity and
responses in older adults. Findings from this study support research that suggests OSA in
older patients may be a condition distinct from that of middle age and less severe than OSA
in younger populations [18]. It may be that a remission of OSA or physiological adaptations
to OSA exists with aging and the disorder has less of an influence on exercise capacity and
tolerance in older adults than is seen in younger and middle- age cohorts. Further research is
needed to better understand the long term impact of untreated OSA and the clinical
implications for the elderly with OSA.
Finally, the BRS may prove a useful interpretation of the BQ for clinical purposes, as
additional information was observed regarding exercise responses during CPET and
recreational PA behavior when subjects were stratified by BRS that was not observed by the
clinical interpretation of the BQ (High vs. Low-risk for OSA). The BRS may provide
additional information by identifying subjects at increased risk for OSA and at risk for
associated comorbid chronic diseases.

179
CLINICAL IMPLICATIONS
Results from the studies included in this dissertation have important practical
applications for clinicians working with elderly patients at risk for OSA. Elderly AAA
patients at High-risk for OSA report engaging in less daily moderate and vigorous PA
compared to their Low-risk counterparts, which could have implications for not only
cardiovascular fitness, but also all- cause and CVD mortality. The importance of daily
moderate to vigorous PA should be stressed to elderly patients at risk for OSA and they
should strive to meet the PA levels recommended by the Centers for Disease Control and
Prevention (CDC) [45] for older adults, which includes 150 minutes of moderate intensity
aerobic activity each week, or 75 minutes of vigorous intensity aerobic activity, in addition to
two days each week of muscle-strengthening activities that work all major muscle groups
[46]. Additionally, regular exercise may limit progression of early AAA disease in these
patients. [47].
Findings from these studies also support the notion that OSA in older adults is a
distinct condition from that of younger cohorts and should be considered when evaluating
and treating OSA in the elderly. MetSyn was prevalent in 45% of our subject sample of older
adults with AAA disease at High-risk for OSA; however, there was an association observed
between OSA risk and MetSyn among only subjects considered at highest-risk for OSA from
the BRS, suggesting that the BRS may prove a useful interpretation of the BQ for clinical
purposes, by further stratifying patients beyond a dichotomous High- vs. Low-risk.
Additionally, associations were not observed between OSA risk and other cardio-metabolic
risk factor of interest, except for HTN as indicated by use of anti-HTN medications,
suggesting that unlike middle-age cohorts, there is not a significant association between OSA
and cardio-metabolic risk factors among elderly AAA patients.

180
Indications from this study that OSA risk did not influence exercise capacity, nor
physiological responses to exercise during CPET among elderly AAA patients further supports
the notion that OSA in older patients may be a condition distinct from that of middle age and less
severe than OSA in younger populations. It may be that a remission of OSA or physiological
adaptations to the disorder exists with aging and OSA has less of an influence on exercise
capacity and tolerance in older adults than is observed in younger groups. It is encouraging to
demonstrate that elderly AAA patients at risk for OSA are equally tolerant of vigorous exercise
and capable of achieving adequate and age-appropriate levels for exercise capacity.
RECOMMENDATIONS FOR FUTURE RESEARCH
Based on the findings of the current studies and the available research pertaining to PA,
MetSyn risk, and CPET responses to exercise and recovery in elderly AAA patients at risk for
OSA, the following recommendations are suggested for future research:
1. Elderly AAA patients at High-risk for OSA reported engaging in less daily moderate and
vigorous PA compared to their Low-risk counterparts, which could have implications for
cardiovascular fitness and all-cause and CVD mortality. It may be that patients with OSA
are neither psychologically motivated nor physically able to engage in regular PA due in
part to fatigue and EDS, or perhaps this groups’ sedentary behavior has over time
contributed to their OSA risk, in part through influences on obesity. Further studies are
warranted to examine the potential causal relationship between OSA and reduced PA, as
it is unclear whether the reduced daily PA observed in our subject sample at High-risk for
OSA is a result of their OSA risk or a contributing factor to it.
2. In contrast to middle-age cohorts, associations between OSA risk, MetSyn, and cardio-
metabolic risk factors were not observed among this sample of elderly AAA patients;

181
however, there may be an association between OSA risk and MetSyn among those
considered at highest risk for MetSyn. Future research is warranted to better understand
the unique clinical manifestation of OSA demonstrated in older age.
3. In contrast to young adult and middle-age cohorts, our findings that OSA risk does not
influence exercise capacity, nor physiological responses to exercise during CPET among
elderly AAA patients further supports the idea that OSA in older patients may be a
condition distinct from that of middle age and potentially less severe than OSA in
younger populations. Research is warranted to examine if a remission of OSA or
physiological adaptations to the disorder exists with aging.
4. This study was the first to further examine gradations in OSA risk by classifying
participants by their Berlin Risk Score, a sum of the three categorical scores from the
Berlin Questionnaire. Although this is not a validated interpretation of the BQ, but simply
an approach to examine a more detailed analysis of risk for OSA from patient responses
to the individual questions and risk factor categories that comprise the BQ, findings from
these studies suggest that the BRS may prove a useful interpretation of the BQ for clinical
purposes, as additional information and group differences were observed by further
stratifying patients beyond a dichotomous High- vs. Low-risk. Future studies to examine
the utility of this BRS classification for examining OSA-risk are recommended.

182
REFERENCES 1. Shamsuzzaman, A.S., B.J. Gersh, and V.K. Somers, Obstructive sleep apnea:
implications for cardiac and vascular disease. JAMA, 2003. 290(14): p. 1906-14.
2. Young, T., et al., The occurrence of sleep-disordered breathing among middle-aged
adults. N Engl J Med, 1993. 328(17): p. 1230-5.
3. Ancoli-Israel, S., et al., Natural history of sleep disordered breathing in community
dwelling elderly. Sleep, 1993. 16(8 Suppl): p. S25-9.
4. Young, T., et al., Predictors of sleep-disordered breathing in community-dwelling adults:
the Sleep Heart Health Study. Arch Intern Med, 2002. 162(8): p. 893-900.
5. Ancoli-Israel, S. and T. Coy, Are breathing disturbances in elderly equivalent to sleep
apnea syndrome? Sleep, 1994. 17(1): p. 77-83.
6. Enright, P.L., et al., Prevalence and correlates of snoring and observed apneas in 5,201
older adults. Sleep, 1996. 19(7): p. 531-8.
7. Foley, D.J., et al., Associations of symptoms of sleep apnea with cardiovascular disease,
cognitive impairment, and mortality among older Japanese-American men. J Am Geriatr
Soc, 1999. 47(5): p. 524-8.
8. Ingram, F., et al., Sleep apnea and vigilance performance in a community-dwelling older
sample. Sleep, 1994. 17(3): p. 248-52.
9. Young, T., Sleep-disordered breathing in older adults: is it a condition distinct from that
in middle-aged adults? Sleep, 1996. 19(7): p. 529-30.
10. Ancoli-Israel, S., et al., Long-term follow-up of sleep disordered breathing in older
adults. Sleep Med, 2001. 2(6): p. 511-6.
11. Young, T., et al., Predictors of sleep-disordered breathing in community-dwelling adults:
the Sleep Heart Health Study. Arch Intern Med, 2002. 162(8): p. 893-900.
12. Mason, R.H., et al., Obstructive sleep apnea in patients with abdominal aortic
aneurysms: highly prevalent and associated with aneurysm expansion. Am J Respir Crit
Care Med, 2011. 183(5): p. 668-74.
13. Saruhara, H., et al., Obstructive sleep apnea as a potential risk factor for aortic disease.
Heart Vessels, 2012. 27(2): p. 166-73.

183
14. Ancoli-Israel, S., et al., Sleep-disordered breathing in community-dwelling elderly. Sleep,
1991. 14(6): p. 486-95.
15. Duran, J., et al., Obstructive sleep apnea-hypopnea and related clinical features in a
population-based sample of subjects aged 30 to 70 yr. Am J Respir Crit Care Med, 2001.
163(3 Pt 1): p. 685-9.
16. Redline, S., et al., Improvement of mild sleep-disordered breathing with CPAP compared
with conservative therapy. Am J Respir Crit Care Med, 1998. 157(3 Pt 1): p. 858-65.
17. Bixler, E.O., et al., Prevalence of sleep-disordered breathing in women: effects of gender.
Am J Respir Crit Care Med, 2001. 163(3 Pt 1): p. 608-13.
18. Bixler, E.O., et al., Effects of age on sleep apnea in men: I. Prevalence and severity. Am
J Respir Crit Care Med, 1998. 157(1): p. 144-8.
19. O'Connor, G.T., et al., Prospective study of sleep-disordered breathing and hypertension:
the Sleep Heart Health Study. Am J Respir Crit Care Med, 2009. 179(12): p. 1159-64.
20. Sharma, S.K., et al., Obesity, and not obstructive sleep apnea, is responsible for
metabolic abnormalities in a cohort with sleep-disordered breathing. Sleep Med, 2007.
8(1): p. 12-7.
21. Nieto, F.J., et al., Association of sleep-disordered breathing, sleep apnea, and
hypertension in a large community-based study. Sleep Heart Health Study. JAMA, 2000.
283(14): p. 1829-36.
22. Peppard, P.E., et al., Prospective study of the association between sleep-disordered
breathing and hypertension. N Engl J Med, 2000. 342(19): p. 1378-84.
23. Gruber, A., et al., Obstructive sleep apnoea is independently associated with the
metabolic syndrome but not insulin resistance state. Cardiovasc Diabetol, 2006. 5: p. 22.
24. Jain, A., et al., The Walking Impairment Questionnaire stair-climbing score predicts
mortality in men and women with peripheral arterial disease. J Vasc Surg, 2012. 55(6):
p. 1662-73 e2.
25. Myers, J., et al., Exercise capacity and mortality among men referred for exercise testing.
N Engl J Med, 2002. 346(11): p. 793-801.
26. Chasens, E.R., et al., Subjective and objective appraisal of activity in adults with
obstructive sleep apnea. J Aging Res, 2011. 2011: p. 751819.

184
27. Chasens, E.R., M.G. Umlauf, and T.E. Weaver, Sleepiness, physical activity, and
functional outcomes in veterans with type 2 diabetes. Appl Nurs Res, 2009. 22(3): p. 176-
82.
28. Quan, S.F., et al., Association of physical activity with sleep-disordered breathing. Sleep
Breath, 2007. 11(3): p. 149-57.
29. Vasquez, M.M., et al., Associations of dietary intake and physical activity with sleep
disordered breathing in the Apnea Positive Pressure Long-Term Efficacy Study
(APPLES). J Clin Sleep Med, 2008. 4(5): p. 411-8.
30. Ervin, R.B., Prevalence of metabolic syndrome among adults 20 years of age and over,
by sex, age, race and ethnicity, and body mass index: United States, 2003-2006. Natl
Health Stat Report, 2009(13): p. 1-7.
31. Olijhoek, J.K., et al., The metabolic syndrome is associated with advanced vascular
damage in patients with coronary heart disease, stroke, peripheral arterial disease or
abdominal aortic aneurysm. Eur Heart J, 2004. 25(4): p. 342-8.
32. Watanabe, H., et al., Metabolic syndrome and risk of development of chronic kidney
disease: the Niigata preventive medicine study. Diabetes Metab Res Rev, 2010. 26(1): p.
26-32.
33. Coughlin, S.R., et al., Obstructive sleep apnoea is independently associated with an
increased prevalence of metabolic syndrome. Eur Heart J, 2004. 25(9): p. 735-41.
34. Ip, M.S., et al., Obstructive sleep apnea is independently associated with insulin
resistance. Am J Respir Crit Care Med, 2002. 165(5): p. 670-6.
35. Barcelo, A., et al., Effects of obesity on C-reactive protein level and metabolic
disturbances in male patients with obstructive sleep apnea. Am J Med, 2004. 117(2): p.
118-21.
36. Stoohs, R.A., et al., Sleep-disordered breathing and systemic hypertension in the older
male. J Am Geriatr Soc, 1996. 44(11): p. 1295-300.
37. Resnick, H.E., et al., Diabetes and sleep disturbances: findings from the Sleep Heart
Health Study. Diabetes Care, 2003. 26(3): p. 702-9.
38. Aron, A., et al., Potential clinical use of cardiopulmonary exercise testing in obstructive
sleep apnea hypopnea syndrome. Int J Cardiol, 2009. 132(2): p. 176-86.

185
39. Hargens, T.A., et al., Attenuated heart rate recovery following exercise testing in
overweight young men with untreated obstructive sleep apnea. Sleep, 2008. 31(1): p.
104-10.
40. Kaleth, A.S., et al., Unique cardiopulmonary exercise test responses in overweight
middle-aged adults with obstructive sleep apnea. Sleep Med, 2007. 8(2): p. 160-8.
41. Nanas, S., et al., Heart rate recovery and oxygen kinetics after exercise in obstructive
sleep apnea syndrome. Clin Cardiol, 2010. 33(1): p. 46-51.
42. Przybylowski, T., et al., Exercise capacity in patients with obstructive sleep apnea
syndrome. J Physiol Pharmacol, 2007. 58 Suppl 5(Pt 2): p. 563-74.
43. Tryfon, S., et al., Sleep apnea syndrome and diastolic blood pressure elevation during
exercise. Respiration, 2004. 71(5): p. 499-504.
44. Hargens, T.A., et al., Altered ventilatory responses to exercise testing in young adult men
with obstructive sleep apnea. Respir Med, 2009. 103(7): p. 1063-9.
45. CDC. How much physical activity do older adults need? [cited 2012 September 21];
Available from:
http://www.cdc.gov/physicalactivity/everyone/guidelines/olderadults.html.
46. CDC. Physical Activity. Healthy Places 2012 [cited 2012 September 21]; Available
from: http://www.cdc.gov/healthyplaces/healthtopics/physactivity.htm.
47. Myers, J., et al., Fitness versus physical activity patterns in predicting mortality in men.
Am J Med, 2004. 117(12): p. 912-8.

186
APPENDIX A
DETAILED METHODOLOGY

187
Subject Recruitment
Existing patients with newly diagnosed small AAAs (aortic diameter ≥2.5 and < 5.5 cm)
from Stanford University Medical Center, the Veterans Affairs Palo Alto Health Care System
(VAPAHCS) and Kaiser Permanente of Northern California were recruited to voluntarily
participate in this research. Recruitment efforts included development of a study website to
inform potential subjects and referring physicians about the study, study brochures targeted to
both potential subjects and referring physicians, newspaper and newsletter advertisements, and
study posters displayed at participating study sites to provide patients information about the
study. For the purpose of this dissertation research, subjects with data collection records for key
measurements and analyses were included (n=326 for Studies 1 and 2; n=114 for Study 3).
Recruitment procedures and all study-related activities were reviewed and approved in advance
by Institutional Review Boards (IRBs) at Stanford University (including VAPAHCS) as well as
the Kaiser Permanente Division of Research and an independent Data Safety Monitoring Board
(DSMB) organized by the NHLBI. The ancillary study for the analyses pertaining to this
dissertation was approved by the IRB at Virginia Tech (Appendix B).
Experimental Design
Ambulatory volunteer patients from the three participating medical centers (Stanford, VA
Palo Alto, and Kaiser Santa Clara) were identified for study recruitment and asked to participate
in the study if they met the following inclusion criteria, applicable to all subjects for all studies:
Age ≥50 years;
AAA aortic diameter ≥2.5 and < 5.5 cm indicated from abdominal imaging studies; and
Provided voluntary consent to participate and is able to comply with study protocol
procedures

188
For Study 3, specifically, volunteers were excluded if they met any of the following criteria:
Unstable angina
Uncontrolled atrial fibrillation or ventricular arrhythmias
Critical aortic stenosis
Class III/IV heart failure and/or ejection fraction <20%
Active pericarditis or myocarditis
Embolism within previous 6 months
Thrombophlebitis
Hospitalized due to an infectious disease within the past three months
Pulmonary disease with a drop in O2 saturation with exercise to 90%
Evidence of significant coronary artery disease as determined by profound ischemic
markers, ominous arrhythmias, and resting electrocardiograms (ECGs) that confound the
recognition of ischemia (bundle branch block, > 1 mm ST depression, paced rhythm);
Inability to complete exercise training for 3 years or a life expectancy ≤ 5 years;
Inability to participate in an exercise stress test
Morbid obesity (BMI>39 kg/m2)
Weight gain/loss of 20 lbs. over previous three months
Claustrophobia
Hemodynamic instability with exercise
Contraindication to MRI per standard screening form (e.g. pacemaker, metal injury, etc.);
Severe renal insufficiency (serum creatinine level > 3.0 mg%);
Heavy alcohol use;
History of severe liver disease.

189
Medical history and drug information was extracted from existing patient medical records
for all participants. Study personnel conducted a physical examination with participants to assess
vital signs, including heart rate (HR)and systolic and diastolic blood pressure (BP), as well as
anthropometric measurements including height and weight for body mass index (BMI)
calculation and waist and hip circumference (WC; HC) measurements to also calculate waist/hip
(W/H) ratio. Subjects then completed interview-style questionnaires with research personnel
regarding health history, physical activity (PA) behavior and habits (Veterans Affairs Physical
Activity Questionnaire-VAPAQ), and risk for OSA (modified Berlin Questionnaire-BQ).
Abdominal ultrasound imaging was performed on all patients to confirm AAA size. A fasting
blood draw for analysis of complete lipid panel [total cholesterol (TC), low-density lipoprotein
cholesterol (LDL-C), high-density lipoprotein cholesterol (HDL-C), and triglycerides (TG)], and
serum insulin and glucose levels was also completed by all subjects. In addition, subjects
included in Study 3 completed a symptom-limited CPET with gas exchange using an
individualized ramp treadmill protocol, as previously described by Myers et al. [1] and according
to standard protocols and recommended procedures as outlined by the American College of
Sports Medicine’s Guidelines for Exercise Testing and Prescription to assess exercise capacity
and physiological responses during CPET [2].
Measurements Berlin Questionnaire
The modified Berlin Questionnaire (BQ) is a 12-item self-report questionnaire that
includes questions about risk factors for OSA that can be identified with three discrete
sign/symptom categories of 1.) snoring behavior, 2.) wake time sleepiness and fatigue, and 3.)
obesity and HTN. The modified BQ, an extension of the original BQ, includes three additional

190
questions regarding choking behavior and wake-time sleepiness. The modified BQ is a validated
instrument used to identify individuals who are at risk for OSA with a sensitivity (86%) and
specificity (95%) comparable to the original BQ [3-6]; positive and negative predictive values of
96% and 82%, respectively, were reported for the modified BQ [6]. Subjects completed the BQ
and responses were confirmed and clarified by one-on-one interview between subject and study
personnel.
Subjects were grouped into High-risk and Low-risk categories for obstructive sleep apnea
(OSA) using the modified BQ risk categorization as described previously by Netzer et al [4]. A
4-point frequency scale [0- never, 1- rarely (1-2/month), 2-sometimes (1-2/wk), 3-frequently (3-
4/wk), 4-always (>4/wk)] was used for defining various indices like snoring, choking, and
sleepiness. Determination of High-risk and Low-risk for OSA was based on responses in three
symptom categories. In category 1, High-risk was defined as persistent symptoms (>3 to 4
times/wk) in two or more questions about their snoring. In category 2, High-risk was defined as
persistent symptoms (>3 to 4 times/wk) in two or more questions about their wake time
sleepiness. In category 3, High-risk was defined as a history of high blood pressure as per the
Joint National Committee on Prevention, Detection, Evaluation, and Treatment of High Blood
Pressure (JNC VI) [7] or a body mass index (BMI) >30 kg/m2. To be considered High-risk for
OSA, patients had to have a positive score for at least two symptom categories.
To further examine gradations in OSA risk, subjects were also classified by their Berlin
Risk Score (BRS), the sum of the three categorical scores from the BQ. Subjects were grouped
into one of four BRS groups which equated to the number of categories that were scored positive
from their BQ (BRS 0 – no categories scored positive from the BQ; BRS 1 – 1 category scored
positive from the BQ; BRS 2 – 2 categories scored positive from the BQ; and BRS 3 – 3
categories scored positive from the BQ). It should be noted that this is not a validated

191
interpretation of the BQ, but simply an approach to examine a more detailed analysis of risk for
OSA from patient responses to the individual questions and risk factor categories that comprise
the BQ.
Veterans Affairs Physical Activity Questionnaire
The quantification of PA was recorded by use of the VAPAQ, modeled after the
Harvard Alumni studies of Paffenbarger and colleagues [8]. Respondents were asked to
report the number of city blocks they walk and the number of flights of stairs they climb
on a typical day, as well as the occupational and recreational activities they regularly
participate in and responses were confirmed and clarified by one-on-one interview
between subject and study personnel. Energy costs of activities were estimated from the
compendium of activities developed by Ainsworth and associates [9]. Energy cost of
stairs climbed per week was calculated using the estimation of Basset and associates
[10]. One flight of stairs equals 10 steps, and 12 blocks is considered 1 mile. Energy
expenditure was expressed in terms of lifetime adulthood recreational and occupational
PA. Recreational PA was also expressed separately as energy expended during the
previous year (recent activity). The VAPAQ has been validated and successfully used in
large numbers of veteran patients and others as reported in previous publications and has
been useful in predicting all-cause mortality [11, 12].
Physical Examination
Subjects underwent a physical examination with study personnel to assess vital
signs, including HR and systolic and diastolic BP, as well as measures of body habitus,
including height and weight for BMI calculation, and WC and HC measurements to also

192
calculate W/H ratio. Subjects also completed a health history questionnaire which
included self-reported medication use to assess medically controlled HTN, dyslipidemia,
diabetes, and other diseases and disorders.
Metabolic and Cardiovascular Biomarkers
Fasting serum blood was collected from participants and evaluated for biomarkers of
metabolic and cardiovascular diseases, including serum insulin and glucose, lipid profile,
including total cholesterol (TC), high-density lipoprotein cholesterol (HDL-C), low-density
lipoprotein cholesterol (LDL-C), and triglycerides (TG). Following an overnight fast, whole
blood samples were collected in vacutainers from each subject. After allowing 60 minutes for
coagulation, serum was separated from samples and transferred to sterile glass tubes for later
biochemical analyses. Each serum sample was coded with the specimen procurement date and
patient identification number assigned on entry to the trial, both to maintain patient
confidentiality and to blind samples during biochemical analysis.
Metabolic Syndrome
Presence of MetSyn among the subject sample was determined based on the NCEP ATP
III guidelines [13], characterized by presence of at least three of the five risk factors outlined in
Table 1 below. Prescription medication use was also taken into consideration when identifying
the presence or absence of each of the MetSyn risk factors. Subjects taking an anti-HTN
medication to control BP were identified as positive for having an elevated BP, according to the
ATP III MetSyn criteria. Similarly, patients taking an anti-diabetic medication were identified as
positive for having an elevated fasting glucose, and subjects taking a fibrate or niacin medication
to control elevated TGs and HDL-C, respectively, were considered positive for each of the

193
MetSyn components.
Table 1. NCEP ATP III Clinical Identification of the Metabolic Syndrome
Risk Factor/MetSyn Component Defining Level
Fasting Plasma Glucose (mg/dL) ≥110
WC (cm) Male; Female >102; >88
BP (mmHg) ≥130/85
TG (mg/dL) ≥150
HDL-C (mg/dL) Male; Female <40; <50
# of components for MetSyn diagnosis ≥3
Derived from Grundy et al. [13] Abbreviations: WC-waist circumference; BP-blood pressure;
TG-triglycerides; HDL-C-high density lipoprotein cholesterol.
Cardiopulmonary Exercise Testing
Participants completed a symptom-limited CPET with gas exchange using an
individualized ramp treadmill protocol, as previously described by Myers et al. [1] and
according to standard protocols and recommended procedures as outlined by the American
College of Sports Medicine’s Guidelines for Exercise Testing and Prescription to assess
exercise capacity and physiological responses during CPET [2]. Standardized medical
examinations were performed prior to testing and medication use was continued as prescribed.
Protocols were individualized to fall within the recommended 8 to 12 minute range. Subjects
were discouraged from using handrails for support. ECG for HR and rhythm were obtained at
rest, each minute during exercise, and during recovery. BP was measured manually at rest,
every 2 minutes during exercise, and during recovery or until symptoms, ECG changes, and BP
stabilized. CPET was aborted following the recommendations of the American College of

194
Sports Medicine’s Guidelines for Exercise Testing and Prescription [2]. In the absence of
indications to stop the test, participants were encouraged to exercise until volitional fatigue.
The Borg scale for perceived exertion was used to quantify effort [14]. Exercise capacity in
METs was estimated from peak treadmill speed and grade [2]. CPET responses were obtained
using a CosMed Quark CPET metabolic system (CosMed Inc, Rome, Italy). Minute ventilation
(VE), oxygen uptake (VO2), carbon dioxide production (VCO2), and other cardiopulmonary
exercise test variables were acquired breath by breath, reported at 10-second intervals, and
averaged over 30 seconds. The VT was determined using the V-slope method. Measured VE
and VCO2 responses during exercise were used to calculate the VE/VCO2 slope via least-
squares linear regression (y = mx + b, m=slope) [15]. CPETs were performed, analyzed, and
reported according to a standardized protocol and utilizing a computerized database [16].

195
APPENDIX B
INSTITUTIONAL REVIEW BOARD APPROVAL

196
W VirginiaTechI
Office of Research Compliance
lnstlbJtjonal Revaew So.:trd 2000 J<:r.fl Drive. Suite 2000 (0497) Slactstug. Vrginia 24060
54012314606 Fax 5401231-0959
e-mai [email protected]
Website:w.vw.irb.Vled.t
MEMORANDUM
DATE:February 8, 2011
TO: William G.Herbert, Jessica Mabry, Laura Newsome
FROM: Virginia Tech InstitutionalReview Board (FWA00000572, expires October 26,
2013) PROTOCOL TITLE: Evaluation of Exercise Therapy lor Small AAA
IRB NUMBER: 11-115
Effective February 8, 2011, the Virginia Tech IRB Chair, Or. David M.Moore, approved the new protocol lor the above-mentioned research protocol.
This approval provides pem1ission to begin the human subject activities outlined in the IRS-approved protocol and supporting documents.
Plans to deviate from the approved protocoland/or support ng documents must be submitted to the
IRB as an amendment request and approved by the IRB prior to the implementation of any
changes, regardless of how minor, except where necessary to eliminate apparent immediate
hazards to the subjects.Report promptly to the IRB any injuries or other unantic pated or adverse
events involving risks or hanns to human research subjects or others.
All investigators (listed above) are required to comply with the researcher requirements outlined
at http://Www.irb.vt.edu/pages/resoonsibilities.htm (please review before the commencement of
your research).
PROTOCOL INFORMATION: Approved as: Exempt, under 45 CFR 46.101(b) category(ies) 4 ProtocolApprovalDate: 2/8/2011
ProtocolExpiration Date: NA Continuing Review Due Date•: NA
•oate a Continuing Review application is due to the IRB office if human subject activities covered under this protocol,including data analysis,are to continue beyond the ProtocolExpiration Date.
FEOERALLY FUNDED RESEARCH REQUIREMENTS: Per federally regulations, 45 CFR 46.103(1), the IRB is required to compare all federally funded
grant proposals I work statements to the IRB protocol(s) which cover the human research
activities included in the proposal/ work statement before funds are released.Note that this
requirement does not apply to Exempt and Interim IRB protocols,or grants for which VT is not the
primary awardee.
The table on the following page indicates Whether grant proposals are related to this IRB protocol, and which of the listed proposals,if any,have been compared to this IRB protocol,if required.
'---------------------- Invent the Future
V I R G I N I A PO lY T E CHN I C I NS T I T U T E A ND S TA T E U N I V E RS I T Y
Ar. <qual oppor t r:r.t t y, c fft ,.mat t v< actt or. t n;-ttt utron

197
§§ -----1 -------ll--------
IRB Number 11-115 page 2 of 2 Vriginia Tech lnstitutiO<nalReview Board
• ompansoa
1
•oate this proposalnumber was compared, assessed as not requ ring comparison, o·r comparison
information was revised.
If thisIRS protocolis to cover any other grant proposa s, please contact the IRB office
(jrbadmfn @vt @dul immediately.
cc:File
V I RG I N I A PO l Y T E C H N I C I N 3T I T U T E A N O 3 T AT E UN I V E RS I T Y

198
APPENDIX C
DATA COLLECTION QUESTIONNAIRES
Modified Berlin Questionnaire
Veterans Affairs Physical Activity Questionnaire

199
MODIFIED BERLIN QUESTIONNAIRE [6]
Height (m) Weight (kg) Age Male / Female
Please choose the correct response to each question.
CATEGORY 1
1. Do you snore? □ a. Yes □ b. No □ c. Don’t know
If you snore:
2. Your snoring is: □ a. Slightly louder than breathing □ b. As loud as talking □ c. Louder than talking □ d. Very loud – can be heard in adjacent
rooms
3. How often do you snore? □ a. Nearly every day □ b. 3-4 times a week □ c. 1-2 times a week □ d. 1-2 times a month □ e. Never or nearly never
4. Has your snoring ever bothered other
people? □ a. Yes □ b. No
5. Has anyone noticed that you quit
breathing during your sleep? □ a. Nearly every day □ b. 3-4 times a week □ c. 1-2 times a week □ d. 1-2 times a month □ e. Never or nearly never
6. Do you choke while you are sleeping? □ a. Nearly every day □ b. 3-4 times a week □ c. 1-2 times a week □ d. 1-2 times a month □ e. Never or nearly never
CATEGORY 2 7. How often do you feel tired or fatigued
after your sleep? □ a. Nearly every day □ b. 3-4 times a week □ c. 1-2 times a week □ d. 1-2 times a month □ e. Never or nearly never 8. During your waking time, do you feel
tired, fatigued or not up to par? □ a. Nearly every day □ b. 3-4 times a week □ c. 1-2 times a week □ d. 1-2 times a month □ e. Never or nearly never
9. Have you ever fallen asleep while waiting
in a line to meet your doctor? □ a. Nearly in every visit □ b. In 3-4 visits □ c. In 1-2 visits □ d. Never or nearly never 10. Have you ever fallen asleep while watching
television at your home during the daytime? If yes, how frequently?
□ a. Nearly every day □ b. 3-4 times a week □ c. 1-2 times a week □ d. 1-2 times a month □ e. Never or nearly never
11. Have you ever fallen asleep while waiting in a
line to pay your electricity or telephone bills? □ a. Nearly in every visit □ b. In 3-4 visits □ c. In 1-2 visits □ d. Never or nearly never CATEGORY 3 12. Do you have high blood pressure? □ Yes □ No □ Don’t know

200
Berlin Questionnaire (for sleep apnea) Scoring Berlin Questionnaire
Adapted from: Table 2 from [4]
(Netzer NC, Stoohs RA, Netzer CM, Clark K, Strohl KP. Using the Berlin Questionnaire to
identify patients at risk for the sleep apnea syndrome. Ann Intern Med. 1999 Oct 5;131(7):485
91).
The questionnaire consists of 3 categories related to the risk of having sleep apnea.
Patients can be classified into High Risk or Low Risk based on their responses to the
individual items and their overall scores in the symptom categories.
Categories and scoring:
Category 1: items 1, 2, 3, 4, 5.
Item 1: if ‘Yes’, assign 1 point
Item 2: if ‘c’ or ‘d’ is the response, assign 1 point
Item 3: if ‘a’ or ‘b’ is the response, assign 1 point
Item 4: if ‘a’ is the response, assign 1 point
Item 5: if ‘a’ or ‘b’ is the response, assign 2 points Item 6: if ‘a’ or ‘b’ is the response, assign 1 point
Add points. Category 1 is positive if the total score is 2 or more points
Category 2: items 7, 8, 9, 10, 11
Item 6: if ‘a’ or ‘b’ is the response, assign 1 point
Item 7: if ‘a’ or ‘b’ is the response, assign 1 point
Item 8: if ‘a’ or ‘b’ is the response, assign 1 point
Item 9: if ‘a’ or ‘b’ is the response, assign 1 point
Item 10: if ‘a’ or ‘b’ is the response, assign 1 point
Item 11: if ‘a’ or ‘b’ is the response, assign 1 point
Add points. Category 2 is positive if the total score is 2 or more points
Category 3 is positive if the answer to item 10 is ‘Yes’ OR if the BMI of the
patient is greater than 30 kg/m2.
(BMI must be calculated. BMI is defined as weight (kg) divided by height (m)
squared, i.e., kg/m2).
High Risk: if there are 2 or more Categories where the score is positive
Low Risk: if there is only 1 or no Categories where the score is positive

201

202

203

204

205
APPENDIX D
ADDITIONAL DATA TABLES

206
Chapters 2 and 3 Additional Data Tables
Table 1. Subject Characteristics and by Gender
Characteristic
Men
(n=271)
Women
(n=55)
t statistic
Pearson Chi-
Square
p value
Age (yrs) 73.1 (8.4) 74.2 (9.1) -0.94 - 0.35
AAA (cm) 3.5 (0.7) 3.4 (0.8) 1.08 - 0.28
Weight (kg) 90.4 (19.5) 73.3 (18.5) 5.96 - <0.01
Height (m) 1.7 (0.08) 1.6 (0.07) 12.2 - <0.01
BMI (kg/m2) 29.5 (5.9) 28.3 (7.0) 1.38 - 0.22
WC (cm) 102.1 (13.9) 93.6 (18.6) 3.77 - <0.01
HC (cm) 105.2 (11.2) 106.4 (16.3) -0.72 - 0.58
W/H Ratio 0.97 (0.07) 0.88 (0.08) 8.92 - <0.01
SBP rest (mmHg) 142.6 (17.2) 141.1 (19.4) 0.56 - 0.57
DBP rest (mmHg) 77.7 (10.0) 71.2 (10.9) 4.14 - <0.01
Anti-HTN Med (%) 89 91 -0.55 0.31 0.58
Anti-lipemic Med (%) 81 70 1.72 2.93 0.09
Diabetic Med (%) 21 19 0.31 0.10 0.75
Data are expressed as group Mean and Standard Deviation (SD). Abbreviations: AAA-abdominal aortic aneurysm; BMI-body mass index; WC-waist circumference; HC-hip circumference; W/H- waist/hip; SBP-systolic blood pressure; DBP-diastolic blood pressure; HTN-hypertension; Med-medication.

207
Table 2. OSA Risk Classification by Gender
OSA-Risk
Men
(n=271)
Women
(n=55)
Pearson
Chi-
Square
p value Men
(n=271)
Women
(n=55)
Pearson
Chi-
Square
p value
BQ OSA Low-Risk
43
40
0.19
0.67
BRS 0
6
4
1.65
0.65
BQ OSA High-Risk
57
60 BRS 1
37
36
BRS 2 41 38
BRS 3 15 22
Data are expressed as subject sample proportions. Abbreviations: OSA-obstructive sleep apnea; BQ-Berlin Questionnaire; BRS-Berlin
Risk Score.

208
Table 3. Additional Cardio-metabolic Risk Factors by Gender
Characteristic
Men, n=271
Women, n=55 t statistic
p value
Fasting Glucose (mg/dL) 114.3 (27.1) 108.7 (26.3) 1.3 0.19
Fasting Insulin (mU/L) 13.7 (14.8) 12.9 (12.5) 0.35 0.73
HOMA IR 4.2 (6.4) 4.0 (5.2) 0.24 0.81
TC (mg/dL) 159.0 (40.3)
175.5 (52.4)
-2.53
0.01
HDL-C (mg/dL) 42.4 (13.2) 53.2 (15.6) -5.17 <0.01
LDL-C (mg/dL) 92.6 (30.9) 98.9 (44.6) -1.23 0.22
TG (mg/dL) 96.6 (46.8) 106.6 (51.2) -1.36 0.18
Data are expressed as group Mean and Standard Deviation (SD). Abbreviations: HOMA IR-homeostatic model assessment for insulin resistance; TC-total cholesterol; HDL-C-high density lipoprotein-cholesterol; LDL-C-low density lipoprotein-cholesterol; TG-
triglycerides.
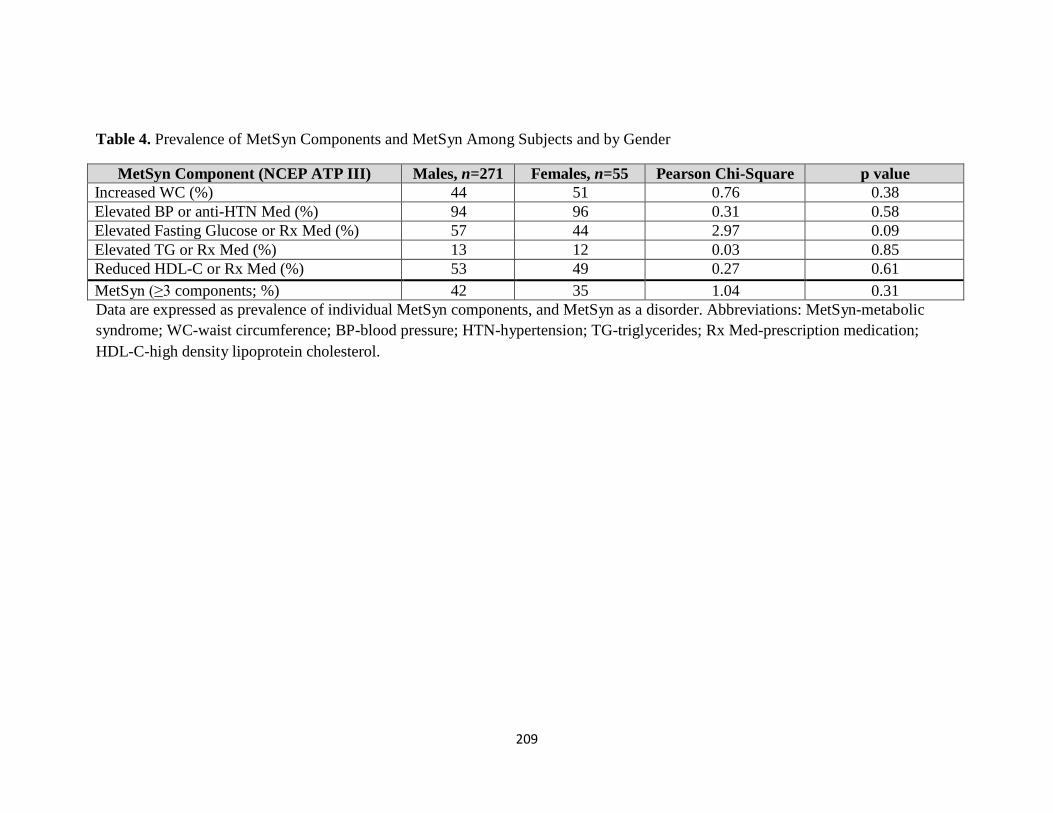
209
Table 4. Prevalence of MetSyn Components and MetSyn Among Subjects and by Gender
MetSyn Component (NCEP ATP III) Males, n=271 Females, n=55 Pearson Chi-Square p value
Increased WC (%) 44 51 0.76 0.38
Elevated BP or anti-HTN Med (%) 94 96 0.31 0.58
Elevated Fasting Glucose or Rx Med (%) 57 44 2.97 0.09
Elevated TG or Rx Med (%) 13 12 0.03 0.85
Reduced HDL-C or Rx Med (%) 53 49 0.27 0.61
MetSyn (≥3 components; %) 42 35 1.04 0.31
Data are expressed as prevalence of individual MetSyn components, and MetSyn as a disorder. Abbreviations: MetSyn-metabolic
syndrome; WC-waist circumference; BP-blood pressure; HTN-hypertension; TG-triglycerides; Rx Med-prescription medication;
HDL-C-high density lipoprotein cholesterol.

210
Chapter 4 Additional Data Table
Table 5. Subject Characteristics and by Gender
Characteristic
Subject
Sample,
n=114
Men, n=107
Women, n=7
t
statistic
Pearson
Chi-Square
p value
Age (yrs) 71.5 (8.4) 71.1 (8.3) 77.6 (7.8) -1.99 - 0.05
AAA (cm) 3.5 (0.82) 3.5 (0.84) 3.6 (0.45) -0.31 - 0.76
Weight (kg) 88.9 (20.5) 89.7 (19.8) 76.8 (28.1) 1.62 - 0.12
Height (m) 1.75 (0.18) 1.75 (0.18) 1.66 (0.07) 1.37 - 0.18
BMI (kg/m2) 28.7 (6.09) 28.7 (5.8) 28.1 (10.5) 0.23 - 0.82
WC (cm) 100.1 (13.7) 100.7 (13.2) 91.1 (19.2) 1.81 - 0.07
HC (cm) 104.3 (10.3) 104.0 (9.3) 108.3 (21.7) -1.07 - 0.29
W/H Ratio 0.97 (0.07) 0.97 (0.07) 0.84 (0.05) 5.03 - <0.01
SBP rest (mmHg) 135.2 (14.9) 135.4 (14.9) 132.4 (15.3) 0.52 - 0.61
DBP rest (mmHg) 77.5 (8.9) 78.0 (8.9) 70.9 (6.4) 2.06 - 0.04
Anti-HTN Med (%) 72 70 100 -1.72 2.92 0.09
Anti-lipemic Med (%) 65 66 43 1.23 1.53 0.22
Diabetic Med (%) 17 18 0 1.23 1.53 0.22
Data are expressed as group Mean and Standard Deviation (SD). Medication data is presented as a group percentage (%) taking each class of medication. Abbreviations: AAA-abdominal aortic aneurysm; BMI-body mass index; WC-waist circumference; HC-hip
circumference; W/H-waist/hip; SBP-systolic blood pressure; DBP-diastolic blood pressure; HTN-hypertension; Med-medication.

211
APPENDIX E
RAW DATA

212
Chapter 2 and 3 Raw Data

213
Table 1. Subject Characteristics
Subject
BQ
OSA-
risk
BRS
Age
(yr)
AAA
(cm)
BMI
(kg/m2)
WC
(cm)
HC
(cm_
W/H
ratio
SBP
(mmHg)
DBP
(mmHg)
Anti-
HTN
Med
Anti-
lipemic
Med
Diabetic
Med 1 Low 1 82 3.6 25.2 99.1 99.1 1 129 72 Y Y N 2 Low 1 77 3.8 29.0 104.1 109.2 0.95 150 68 Y Y N 3 High 3 77 3.7 29.2 109.2 102.9 1.06 142 74 N Y Y 4 High 2 68 3.4 26.4 97.8 105.4 0.93 128 80 Y Y N 5 Low 1 75 4.53 22.2 76.2 83.8 0.91 106 59 Y Y N 6 High 2 66 3.57 32.1 109.2 105.4 1.04 126 64 Y Y N 7 Low 1 63 3.69 30.5 97.8 113.8 0.86 153 79 Y Y N 8 High 2 76 3.91 32.1 115.6 106.7 1.08 115 58 Y Y N 9 High 2 75 3 28.3 96.5 96.5 1 132 78 Y N N
10 High 2 69 3.81 25.0 86.4 102.9 0.84 140 80 Y N N 11 High 2 70 3.57 33.9 110.5 110.5 1 151 90 Y Y N 12 High 2 70 3.73 31.5 101.6 108.0 0.94 120 68 Y Y N 13 Low 1 83 4.09 25.7 88.9 98.6 0.9 154 70 Y Y N 14 High 2 67 4.74 30.5 94.0 104.1 0.9 118 86 Y N N 15 High 2 79 3.25 35.7 111.8 116.8 0.96 140 90 Y Y N 16 High 3 83 3.2 31.8 110.5 106.7 1.04 158 76 Y Y N 17 Low 1 86 3.34 23.3 87.6 95.3 0.92 160 90 Y Y N 18 High 2 82 3.03 37.0 114.3 123.2 0.93 130 84 Y Y N 19 Low 1 83 3.2 32.0 106.7 108.7 0.98 136 72 Y Y N 20 High 2 68 4.52 25.5 90.2 95.3 0.95 132 70 Y Y N 21 High 2 77 4.92 26.7 119.4 113.0 1.06 140 68 Y Y Y 22 High 3 84 4.2 32.3 114.3 106.7 1.07 145 84 Y Y N 23 High 2 83 29.5 96.5 94.0 1.03 130 60 Y Y Y 24 High 2 74 3.01 29.0 99.1 108.0 0.92 145 76 Y Y N 25 Low 1 50 4.12 36.4 116.8 111.8 1.05 126 75 Y N Y 26 High 2 74 3.03 26.9 91.4 102.9 0.89 128 68 Y N N 27 Low 1 80 3.5 106.7 106.7 1 146 64 Y Y N 28 High 2 66 4.89 27.1 99.1 106.7 0.93 146 89 Y Y N

214
29 High 2 81 3.81 28.5 91.4 99.1 0.92 142 82 Y Y N 30 Low 1 66 2.87 21.0 78.7 90.2 0.87 145 79 N Y N 31 Low 1 74 3.75 33.0 121.9 114.3 1.07 147 72 Y Y Y 32 Low 0 59 3.55 26.8 101.6 108.0 0.94 173 96 N N N 33 Low 1 84 3.34 23.3 96.5 101.6 0.95 167 72 Y N Y 34 Low 1 76 4.32 25.0 92.7 102.9 0.9 159 77 Y N N 35 Low 1 82 3.8 30.0 105.4 102.9 1.02 167 93 Y Y N 36 High 2 58 3.7 44.0 129.5 134.6 0.96 146 77 Y Y Y 37 Low 1 71 3.55 30.3 99.1 104.1 0.95 130 76 Y N N 38 Low 0 69 4.02 23.5 91.4 97.8 0.94 143 87 Y Y N 39 High 3 83 2.54 25.5 83.8 94.0 0.89 146 76 Y Y Y 40 Low 0 71 3.42 30.0 111.8 110.5 1.01 162 76 Y Y N 41 Low 1 66 4.88 28.2 101.6 99.1 1.03 210 104 Y Y N 42 Low 1 65 4.02 28.0 106.7 100.3 1.06 154 84 Y Y Y 43 Low 1 75 4.02 27.1 87.6 91.4 0.96 128 71 Y Y N 44 Low 1 62 5.39 20.2 72.4 86.4 0.84 148 78 Y Y N 45 High 2 66 3.3 34.1 97.8 101.6 0.96 138 77 Y Y N 46 Low 1 72 4.56 34.4 115.6 113.0 1.02 119 63 Y Y N 47 High 2 68 4.15 24.9 83.8 96.5 0.87 146 92 Y Y Y 48 High 2 67 5.01 30.8 104.1 108.0 0.96 129 85 N Y N 49 Low 1 85 3.53 30.3 102.9 106.7 0.96 165 79 Y Y Y 50 Low 1 72 3.68 26.6 101.6 106.7 0.95 157 87 Y N N 51 High 2 75 4.56 27.0 92.7 94.0 0.99 134 72 Y Y N 52 High 2 69 4.02 24.1 92.7 99.1 0.94 153 83 Y Y N 53 High 2 79 3.18 22.7 90.2 97.8 0.92 156 65 Y Y Y 54 Low 1 76 4.21 31.6 114.3 116.8 0.98 162 90 Y N N 55 High 2 70 2.76 24.1 94.0 99.1 0.95 164 80 Y Y N 56 Low 1 76 3.03 26.7 99.1 96.5 1.03 125 64 Y Y N 57 Low 0 65 4.36 24.6 88.9 96.5 0.92 116 60 N Y N 58 High 2 74 3.41 26.5 99.1 104.1 0.95 131 66 Y Y N 59 High 2 79 3.29 28.8 111.8 111.8 1 118 64 Y Y N 60 Low 1 77 3.36 41.2 134.6 128.3 1.05 154 76 Y Y N 61 Low 0 91 3.01 27.8 97.8 105.4 0.93 136 69 Y Y Y

215
62 High 2 68 3 25.5 94.0 96.5 0.97 142 60 Y Y Y 63 Low 1 85 2.34 28.9 102.9 111.8 0.92 166 92 Y Y N 64 Low 1 83 3.19 29.9 106.7 104.1 1.02 171 66 Y Y N 65 Low 1 86 3 23.6 88.9 101.6 0.88 160 71 Y N N 66 High 2 74 4 29.5 111.8 110.5 1.01 122 64 Y Y N 67 Low 1 76 3.5 38.9 119.4 124.5 0.96 150 82 Y Y N 68 Low 1 80 3.9 29.8 101.6 101.6 1 162 73 Y Y N 69 Low 1 78 3.05 29.0 99.1 104.1 0.95 172 96 Y N N 70 High 3 70 2.67 25.9 87.6 102.9 0.85 149 78 Y Y N 71 Low 1 87 3.3 31.5 114.3 114.3 1.01 156 79 Y Y Y 72 Low 1 83 3.03 27.0 97.8 111.8 0.88 160 90 Y Y N 73 High 2 70 3.5 38.1 127.0 119.4 1.06 135 75 Y Y N 74 Low 1 82 4.4 35.6 130.8 133.4 0.98 137 69 Y Y N 75 High 3 79 4.3 33.1 104.1 104.1 1 132 71 Y Y N 76 High 2 78 3.02 32.9 108.0 109.2 0.99 158 85 Y Y Y 77 Low 1 74 4.2 33.1 116.8 115.6 1.01 160 90 Y Y N 78 Low 1 81 3.1 31.1 120.7 115.6 1.04 152 90 Y N N 79 High 3 81 3.6 32.2 106.7 108.0 0.99 129 63 Y N N 80 High 2 75 3.08 25.2 95.3 99.1 0.96 119 67 Y Y N 81 Low 1 75 4.3 26.5 91.4 101.6 0.9 118 75 Y N N 82 High 3 91 3.01 22.0 80.0 100.3 0.8 181 87 Y Y N 83 High 2 70 4.1 41.0 129.5 133.4 0.97 117 64 Y Y N 84 Low 1 64 3.5 31.5 105.4 108.0 0.98 161 86 Y Y N 85 High 3 87 3.3 28.4 96.5 104.1 0.93 178 63 Y Y N 86 High 3 52 2.88 31.7 106.7 109.2 0.98 146 87 N Y N 87 Low 0 80 2.7 25.2 85.1 95.3 0.89 131 81 Y Y N 88 Low 0 85 2.6 24.6 95.3 102.9 0.93 149 80 N N N 89 High 2 76 3.3 23.8 99.1 99.1 1 150 88 Y Y N 90 High 3 72 3 35.4 106.7 106.7 1 165 97 Y Y N 91 High 3 80 3.5 25.5 97.8 100.3 0.97 120 65 Y Y Y 92 High 3 78 31.5 110.5 106.7 1.04 128 80 Y N N 93 Low 0 69 4.4 24.4 97.8 111.8 0.88 159 97 N Y N 94 Low 1 64 3.7 27.5 97.8 99.1 0.99 141 90 N Y N

216
95 Low 0 77 2.6 25.3 96.5 101.6 0.95 146 68 Y Y N 96 Low 1 89 3.7 21.0 86.4 100.3 0.86 175 86 Y Y N 97 High 2 73 3.1 29.6 96.5 99.1 0.97 115 66 Y Y N 98 High 2 59 3.1 31.2 96.5 114.3 0.84 133 78 Y Y N 99 Low 1 68 3.2 24.1 104.1 109.2 0.95 126 74 N Y N
100 High 2 72 4.9 25.7 99.1 106.7 0.93 154 86 Y Y N 101 High 2 91 3.2 24.2 99.1 97.8 1.01 131 67 Y N N 102 High 3 62 - 26.6 94.0 100.3 0.94 130 60 Y Y N 103 Low 1 87 4.1 23.6 95.3 95.3 1 151 81 Y Y N 104 High 3 63 3.1 25.8 91.4 94.0 0.97 198 82 Y Y Y 105 High 2 70 3.6 33.7 111.8 114.3 0.98 167 97 Y N N 106 High 2 57 3.8 24.3 94.0 99.1 0.95 130 66 Y Y N 107 Low 1 83 4.5 23.1 88.9 101.6 0.88 133 78 N Y N 108 High 2 58 3.3 46.3 134.6 127.0 1.06 162 94 Y N N 109 Low 1 79 4 23.3 88.9 97.8 0.91 148 84 N Y N 110 High 2 65 3.6 28.8 101.6 104.1 0.98 160 100 - N N 111 Low 1 79 2.9 22.6 91.4 99.1 0.92 143 80 Y Y N 112 High 3 73 3.5 37.4 128.3 115.6 1.11 155 79 Y Y N 113 High 2 72 3.9 23.9 85.1 94.0 0.91 166 95 Y N N 114 High 2 70 3.6 29.0 96.5 109.2 0.88 179 94 Y Y N 115 High 2 75 2.9 38.2 106.7 109.2 0.98 134 72 Y Y N 116 Low 1 69 3 22.6 80.0 90.2 0.89 144 89 Y Y N 117 High 3 58 4 30.8 110.5 109.2 1.01 128 78 Y Y Y 118 High 3 76 3.8 32.0 109.2 101.6 1.08 115 78 Y Y Y 119 High 3 74 4.1 41.0 137.2 115.6 1.19 153 77 Y Y Y 120 Low 0 57 3.3 22.5 94.0 96.5 0.97 146 90 N Y N 121 Low 1 84 2.7 25.8 97.8 94.0 1.04 137 58 Y Y Y 122 Low 1 71 3.7 28.7 108.0 104.1 1.04 129 75 N N N 123 Low 1 69 4.5 38.7 120.7 123.2 0.98 142 75 Y Y Y 124 Low 1 83 5 26.9 96.5 99.1 0.97 136 72 Y Y N 125 High 3 70 3.1 30.3 99.1 101.6 0.98 128 75 Y Y Y 126 High 2 80 3.8 23.4 86.4 88.9 0.97 161 73 Y Y N 127 High 3 78 3.3 30.2 110.5 108.0 1.02 149 94 Y Y N

217
128 High 2 70 3.8 40.3 120.7 135.9 0.89 149 63 Y Y N 129 High 2 93 4.7 19.0 83.8 94.0 0.89 126 74 Y Y N 130 Low 1 76 4 33.5 119.4 109.2 1.09 137 80 N Y N 131 High 2 60 3.3 23.6 81.3 95.3 0.85 128 80 Y Y Y 132 High 2 75 3.4 27.2 96.5 101.6 0.95 143 83 Y Y N 133 Low 1 60 2.4 23.8 88.9 99.1 0.9 138 75 Y Y N 134 High 2 72 3.3 31.5 109.2 105.4 1.04 155 94 Y Y Y 135 High 2 66 3 29.4 110.5 111.8 0.99 149 76 N N N 136 High 2 59 2.9 23.1 97.5 95.3 1.02 126 66 Y Y N 137 High 3 70 3 30.4 114.3 101.6 1.12 163 81 Y Y N 138 Low 1 65 3.2 29.6 99.1 99.1 1 132 80 Y Y N 139 High 2 80 2.7 31.1 102.9 111.8 0.92 143 74 Y Y N 140 High 2 72 3.5 32.2 105.4 109.2 0.97 162 80 Y Y N 141 High 2 82 3 39.3 133.4 132.1 1.01 142 71 Y Y N 142 High 3 71 3.4 32.5 110.5 104.1 1.06 198 98 Y Y N 143 Low 1 71 2.9 34.5 111.8 113.0 0.99 126 74 Y Y N 144 High 2 62 5.2 29.4 97.8 102.9 0.95 174 89 Y Y N 145 High 2 78 3.5 29.3 101.6 99.1 1.03 144 78 Y Y N 146 Low 1 82 4 27.2 111.8 104.1 1.07 115 51 Y Y N 147 High 2 66 3.2 19.7 76.2 83.8 0.91 142 60 Y N N 148 High 2 75 3.1 30.8 105.4 101.6 1.04 130 77 Y Y N 149 High 2 77 3.8 27.2 99.1 99.8 0.99 155 92 Y Y N 150 High 3 68 3.4 30.1 102.9 108.0 0.95 143 73 Y Y N 151 High 2 88 3 31.9 106.7 100.3 1.06 144 76 Y Y N 152 Low 1 79 2.5 31.1 101.6 94.0 1.03 133 74 Y Y N 153 High 2 69 4.6 40.4 116.8 119.4 0.98 145 96 Y N N 154 High 2 77 4.6 27.1 92.7 99.1 0.94 142 76 Y Y N 155 High 2 70 - 28.7 - - - - - Y N N 156 High 2 65 2.5 31.8 101.6 105.4 0.96 140 83 Y Y N 157 Low 1 82 4.33 29.8 109.2 108.0 1.01 155 85 Y Y N 158 High 2 72 3.4 31.9 100.3 102.9 0.98 162 72 Y Y N 159 Low 1 67 2.58 27.4 88.9 101.6 0.88 133 82 Y Y N 160 High 2 70 3.8 57.3 165.1 188.0 0.88 140 92 N N N

218
161 Low 1 78 3.4 33.3 108.0 114.3 0.94 136 83 Y Y Y 162 High 2 85 3.7 24.0 91.4 94.0 0.97 152 68 Y N N 163 High 3 74 3.4 28.3 109.2 98.6 1.11 140 69 Y Y N 164 High 2 64 4.02 28.4 100.3 108.0 0.93 118 64 Y Y N 165 Low 1 82 2.73 23.8 88.9 97.8 0.91 153 81 Y Y N 166 Low 1 87 3.88 33.7 91.4 102.9 0.89 136 71 Y Y N 167 High 2 85 4.22 26.3 97.8 99.1 0.99 143 89 Y Y N 168 Low 1 74 3 26.6 102.9 102.9 1 126 65 Y Y N 169 High 2 74 3.4 25.2 91.4 100.3 0.91 138 46 Y Y N 170 Low 0 79 3.9 19.2 67.3 73.7 0.91 108 60 N N N 171 Low 1 58 3.1 32.4 114.3 106.7 1.07 129 80 Y N N 172 Low 1 81 3.29 28.6 108.0 108.0 1 121 69 Y Y N 173 Low 1 76 3.5 26.2 85.1 99.1 0.86 127 69 Y Y N 174 Low 1 81 4.5 33.7 111.8 118.1 0.95 165 67 Y N Y 175 High 2 71 3 27.2 101.6 99.1 1.03 140 76 Y Y N 176 High 3 80 4.3 30.6 114.3 114.3 1 149 75 Y Y N 177 Low 1 87 - 26.4 - - - 180 82 N Y N 178 High 2 80 4.8 36.9 114.3 111.8 1.02 144 70 Y N N 179 High 3 79 3.3 41.3 127.0 121.9 1.04 146 85 Y Y Y 180 Low 0 75 25.9 104.1 105.4 0.99 143 82 Y N N 181 Low 1 72 3.8 21.6 82.6 92.7 0.89 144 75 Y Y N 182 High 2 79 4 25.8 101.6 105.4 0.96 121 67 Y N N 183 High 2 80 4 23.1 88.9 91.4 0.97 180 86 Y Y Y 184 Low 0 73 3.5 26.8 88.9 96.5 0.92 170 86 N Y Y 185 High 2 80 3 25.7 91.4 94.0 0.97 158 76 Y Y N 186 Low 1 82 3.05 22.6 96.5 102.9 0.94 173 83 Y Y N 187 High 3 77 3.61 34.0 106.7 111.8 0.95 120 80 Y Y N 188 High 2 64 4.5 36.6 135.9 120.7 1.13 139 77 Y Y Y 189 High 2 68 4 27.7 101.6 102.9 0.99 149 83 Y Y N 190 High 2 72 5 28.2 96.5 99.1 0.97 130 65 Y Y N 191 High 2 66 4.2 34.0 118.1 121.9 0.97 171 94 N Y Y 192 High 2 65 3.7 27.7 99.1 104.1 0.95 126 74 Y Y N 193 High 2 73 4 24.8 95.3 95.3 1 149 85 Y Y N

219
194 High 3 82 4.4 38.3 124.5 113.0 1.1 130 65 Y N N 195 High 3 71 4.7 32.4 105.4 106.7 0.99 160 79 Y Y N 196 High 3 80 3 26.0 92.7 99.1 0.94 158 79 Y Y Y 197 High 2 71 3 33.3 116.8 105.4 1.11 148 90 Y Y Y 198 Low 1 87 4.5 25.5 94.0 99.1 0.95 124 61 N Y N 199 Low 1 66 3.8 34.4 106.7 116.8 0.91 135 71 Y Y Y 200 High 3 71 5.3 28.2 102.9 99.1 1.04 152 82 Y Y Y 201 High 3 60 - 32.4 - - - - - - - - 202 High 2 92 3.6 27.2 90.2 100.3 0.9 133 68 Y Y N 203 Low 1 73 4 41.2 129.5 124.5 1.04 130 75 Y N N 204 Low 1 79 2.5 31.1 101.6 99.1 1.03 137 79 Y Y N 205 Low 1 72 3.1 33.7 115.6 120.7 0.96 122 67 Y Y Y 206 High 2 53 2.25 51.9 182.9 148.6 1.23 156 98 Y Y Y 207 High 2 62 2.18 33.8 109.2 102.9 1.06 118 68 Y N Y 208 Low 1 51 2.83 34.3 104.1 94.0 1.11 134 88 Y N Y 209 High 2 74 2.37 28.8 102.9 109.2 0.94 150 66 Y Y N 210 Low 1 59 2.29 29.1 92.7 101.6 0.91 126 80 N Y N 211 High 3 58 2.31 39.8 121.9 124.5 0.98 138 84 Y N N 212 High 2 59 2.17 30.7 100.3 105.4 0.95 122 84 N N N 213 Low 1 76 2.55 26.7 96.5 101.6 0.95 132 72 Y Y N 214 Low 1 62 1.94 24.7 88.9 104.1 0.85 144 90 Y Y N 215 High 3 83 1.89 27.6 97.8 101.6 0.96 158 84 Y Y Y 216 Low 1 68 2.02 33.6 109.2 113.0 0.97 122 76 Y Y Y 217 High 3 61 2.14 35.0 124.5 115.6 1.08 130 90 Y Y Y 218 High 2 61 1.86 30.0 94.0 96.5 0.97 128 78 Y Y Y 219 High 2 60 2.03 37.5 116.8 116.8 1 134 80 Y Y Y 220 Low 1 71 2.22 27.0 100.3 108.0 0.93 144 86 Y Y Y 221 High 3 60 6.06 31.2 109.2 101.6 1.08 160 98 Y N N 222 High 3 62 1.87 29.4 96.5 96.5 1 132 78 Y Y N 223 Low 1 79 2.38 27.0 86.4 95.3 0.91 138 80 Y Y N 224 Low 1 52 2.55 31.6 95.3 106.7 0.89 140 82 Y N Y 225 High 2 64 1.89 26.1 94.0 101.6 0.92 130 78 Y Y N 226 Low 0 65 1.85 20.1 81.3 86.4 0.94 138 84 Y N N

220
227 Low 0 64 2.27 29.4 91.4 104.1 0.88 130 78 N Y N 228 Low 0 64 2.18 21.1 73.7 88.9 0.83 140 80 N Y N 229 High 2 72 3.43 24.7 92.7 99.1 0.94 130 80 - - - 230 High 2 70 4.42 24.7 102.9 96.5 1.07 140 68 - - - 231 Low 1 63 3.01 28.6 101.6 105.4 0.96 139 73 Y Y N 232 Low 1 76 4.25 30.6 113.0 110.5 1.02 134 78 Y Y Y 233 High 2 86 3.7 32.6 114.3 120.7 0.96 118 74 - - - 234 High 2 71 3.1 27.6 94.0 97.8 0.96 124 65 Y Y N 235 High 2 79 3.57 26.1 88.9 100.3 0.89 162 85 Y Y N 236 Low 1 80 3.5 31.5 114.3 118.1 0.97 168 89 - - - 237 High 2 73 4.7 25.5 100.3 101.6 0.99 150 93 Y Y N 238 High 2 75 3.7 30.9 109.2 111.8 0.98 116 62 Y N Y 239 High 2 73 3 23.8 83.8 95.3 0.88 130 79 - - - 240 Low 1 76 3.74 26.7 91.4 94.0 0.97 145 78 - - - 241 Low 1 67 3.7 23.2 82.6 91.4 0.9 109 68 Y Y N 242 Low 1 64 4.6 28.3 102.9 102.9 1 118 72 243 Low 1 71 - 33.7 - - - - - - - - 244 High 2 80 - 25.0 - - - - - - - - 245 High 2 67 - 38.1 - - - - - - - - 246 Low 1 70 - 46.5 - - - - - - - - 247 High 3 73 - 42.3 - - - - - - - - 248 Low 1 72 - 21.9 - - - - - - - - 249 Low 1 61 - 32.1 - - - - - - - - 250 High 2 64 - 28.3 - - - - - - - - 251 Low 1 72 - 24.3 - - - - - - - - 252 High 3 72 4.02 65.0 94.0 127.0 0.74 179 80 - - - 253 High 3 65 - 40.0 - - - - - - - - 254 High 2 69 - 32.4 104.1 109.2 0.95 149 91 - - - 255 Low 1 80 - 28.2 91.4 101.6 0.9 136 69 - - - 256 High 3 66 - 26.4 108.0 108.0 1 136 93 - - - 257 Low 1 63 - - - - - - - - - - 258 Low 1 77 - - - - - - - - - - 259 High 2 74 23.9 86.4 96.5 0.89 133 66 - - -
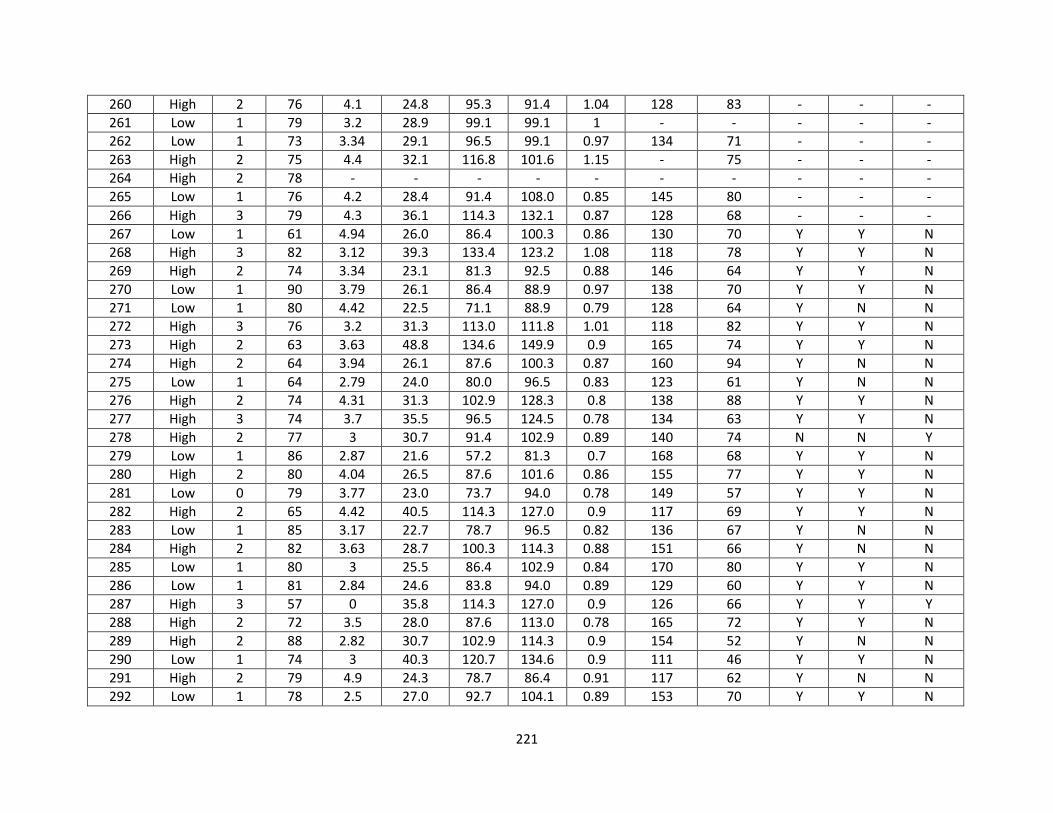
221
260 High 2 76 4.1 24.8 95.3 91.4 1.04 128 83 - - - 261 Low 1 79 3.2 28.9 99.1 99.1 1 - - - - - 262 Low 1 73 3.34 29.1 96.5 99.1 0.97 134 71 - - - 263 High 2 75 4.4 32.1 116.8 101.6 1.15 - 75 - - - 264 High 2 78 - - - - - - - - - - 265 Low 1 76 4.2 28.4 91.4 108.0 0.85 145 80 - - - 266 High 3 79 4.3 36.1 114.3 132.1 0.87 128 68 - - - 267 Low 1 61 4.94 26.0 86.4 100.3 0.86 130 70 Y Y N 268 High 3 82 3.12 39.3 133.4 123.2 1.08 118 78 Y Y N 269 High 2 74 3.34 23.1 81.3 92.5 0.88 146 64 Y Y N 270 Low 1 90 3.79 26.1 86.4 88.9 0.97 138 70 Y Y N 271 Low 1 80 4.42 22.5 71.1 88.9 0.79 128 64 Y N N 272 High 3 76 3.2 31.3 113.0 111.8 1.01 118 82 Y Y N 273 High 2 63 3.63 48.8 134.6 149.9 0.9 165 74 Y Y N 274 High 2 64 3.94 26.1 87.6 100.3 0.87 160 94 Y N N 275 Low 1 64 2.79 24.0 80.0 96.5 0.83 123 61 Y N N 276 High 2 74 4.31 31.3 102.9 128.3 0.8 138 88 Y Y N 277 High 3 74 3.7 35.5 96.5 124.5 0.78 134 63 Y Y N 278 High 2 77 3 30.7 91.4 102.9 0.89 140 74 N N Y 279 Low 1 86 2.87 21.6 57.2 81.3 0.7 168 68 Y Y N 280 High 2 80 4.04 26.5 87.6 101.6 0.86 155 77 Y Y N 281 Low 0 79 3.77 23.0 73.7 94.0 0.78 149 57 Y Y N 282 High 2 65 4.42 40.5 114.3 127.0 0.9 117 69 Y Y N 283 Low 1 85 3.17 22.7 78.7 96.5 0.82 136 67 Y N N 284 High 2 82 3.63 28.7 100.3 114.3 0.88 151 66 Y N N 285 Low 1 80 3 25.5 86.4 102.9 0.84 170 80 Y Y N 286 Low 1 81 2.84 24.6 83.8 94.0 0.89 129 60 Y Y N 287 High 3 57 0 35.8 114.3 127.0 0.9 126 66 Y Y Y 288 High 2 72 3.5 28.0 87.6 113.0 0.78 165 72 Y Y N 289 High 2 88 2.82 30.7 102.9 114.3 0.9 154 52 Y N N 290 Low 1 74 3 40.3 120.7 134.6 0.9 111 46 Y Y N 291 High 2 79 4.9 24.3 78.7 86.4 0.91 117 62 Y N N 292 Low 1 78 2.5 27.0 92.7 104.1 0.89 153 70 Y Y N

222
293 High 2 61 3.3 32.7 97.8 110.5 0.89 129 71 Y Y Y 294 Low 1 77 4.6 18.2 74.9 87.6 0.86 140 78 Y Y N 295 High 2 67 2.6 23.7 83.8 101.6 0.82 150 76 Y N N 296 High 3 57 3.2 39.9 127.0 139.7 0.91 130 62 Y Y Y 297 High 3 74 2.9 30.7 109.2 106.7 1.02 180 60 Y Y Y 298 High 3 88 3.6 24.2 91.4 96.5 0.95 170 85 Y Y N 299 High 3 55 3 28.0 104.1 99.1 1.05 107 56 Y Y Y 300 High 2 75 2.7 25.6 88.9 101.6 0.88 135 78 Y Y N 301 High 2 66 2.7 40.0 123.2 125.7 0.98 140 76 Y Y Y 302 High 2 65 2.69 29.2 99.1 108.0 0.92 131 76 - - - 303 High 2 68 4.4 26.5 83.8 104.1 0.8 182 106 N N N 304 Low 1 74 2.33 21.0 75.6 96.0 0.79 122 68 Y N N 305 High 2 58 3.1 21.8 68.6 94.0 0.73 129 86 N N N 306 High 2 83 4 34.4 119.4 114.3 1.04 109 55 Y Y N 307 High 2 84 2.56 19.2 86.4 95.3 0.91 166 70 Y Y N 308 High 3 62 3.9 32.0 96.5 109.2 0.88 113 60 N N Y 309 High 3 68 4.3 24.2 78.7 91.4 0.86 119 74 Y Y N 310 Low 1 75 2.8 23.6 81.3 99.1 0.82 151 80 Y Y N 311 High 3 81 3.8 36.7 129.5 144.8 0.89 148 84 Y Y N 312 Low 0 85 3.1 18.8 72.4 85.1 0.85 166 70 Y Y N 313 Low 1 81 3.3 16.1 68.6 87.6 0.78 150 70 - - - 314 Low 1 83 3.6 23.5 94.0 106.7 0.88 165 80 Y N Y 315 Low 1 73 - 21.7 - - - - - - - - 316 Low 1 70 - 28.4 - - - - - - - - 317 High 2 88 - 41.0 - - - - - - - - 318 Low 1 64 - 29.7 - - - - - - - - 319 High 2 72 3.43 24.7 92.7 99.1 0.94 130 80 Y Y N 320 High 2 70 4.42 24.7 102.9 96.5 1.07 140 68 N Y N 321 Low 1 81 3.3 16.1 68.6 87.6 0.8 150 70 Y Y N 322 High 2 86 3.7 32.6 114.3 120.7 1 118 74 Y Y N 323 Low 1 80 3.5 31.5 114.3 118.1 1 168 89 Y Y N 324 High 2 73 3 23.8 83.8 95.3 0.9 130 79 Y Y N 325 Low 1 76 3.74 26.7 91.4 94.0 1 145 78 Y Y N

223
326 Low 1 64 4.6 28.3 102.9 102.9 1 118 72 Y Y N
Abbreviations: OSA-obstructive sleep apnea; BQ-Berlin Questionnaire; BRS-Berlin Risk Score; AAA-abdominal aortic aneurysm; BMI-body mass index; WC-waist circumference; HC-hip circumference; W/H-waist/hip; SBP-systolic blood pressure; DBP-diastolic
blood pressure; HTN-hypertension; Med-medication.

224
Table 2. Indices of Physical Activity from Veterans Affairs Physical Activity Questionnaire
Subject
Blocks
Walked/Day
Stair Flights
Climbed/Day
Blocks and
Stairs/Day (kcals)
Last Year Recreational
PA (kcals/week)
Lifetime Recreational
PA (kcals/week) 1 2 0 17 285 115 2 1 5 18 73 228 3 2 0 17 - - 4 0 0 0 - - 5 - - - 1991 2192 6 - - - 473 170 7 - - - 487 515 8 12 0 100 911 678 9 8 0 67 2967 1945
10 - - - - - 11 - - - - - 12 2 0 17 - - 13 1 2 12 1913 1354 14 0 5 10 994 1243 15 9 0 75 182 27 16 - - - - 30 17 - - - - - 18 0 0 0 290 390 19 - - - 1197 82 20 0 0 0 - 616 21 - - - - 153 22 0 3 6 990 1424 23 - - - 360 484 24 12 0 100 1905 630 25 - - - 77 41 26 36 0 300 3077 1574 27 0 0 0 21 172 28 - - - 2913 2722 29 18 0 150 1125 2143
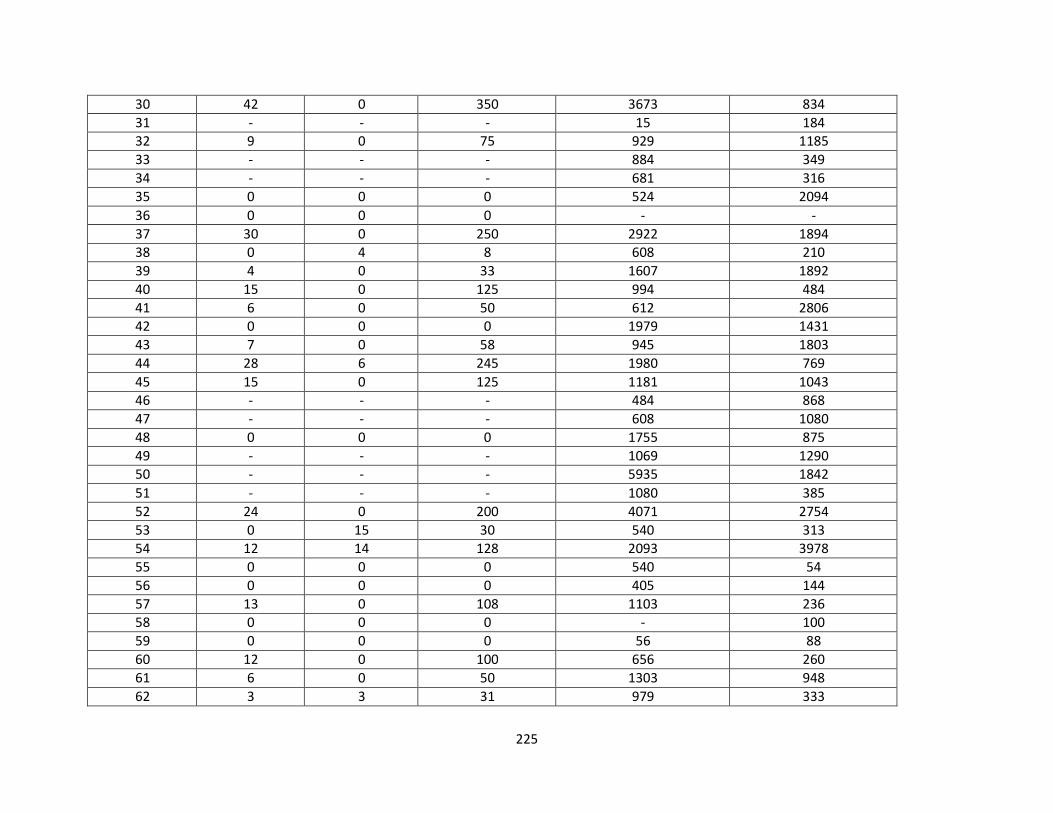
225
30 42 0 350 3673 834 31 - - - 15 184 32 9 0 75 929 1185 33 - - - 884 349 34 - - - 681 316 35 0 0 0 524 2094 36 0 0 0 - - 37 30 0 250 2922 1894 38 0 4 8 608 210 39 4 0 33 1607 1892 40 15 0 125 994 484 41 6 0 50 612 2806 42 0 0 0 1979 1431 43 7 0 58 945 1803 44 28 6 245 1980 769 45 15 0 125 1181 1043 46 - - - 484 868 47 - - - 608 1080 48 0 0 0 1755 875 49 - - - 1069 1290 50 - - - 5935 1842 51 - - - 1080 385 52 24 0 200 4071 2754 53 0 15 30 540 313 54 12 14 128 2093 3978 55 0 0 0 540 54 56 0 0 0 405 144 57 13 0 108 1103 236 58 0 0 0 - 100 59 0 0 0 56 88 60 12 0 100 656 260 61 6 0 50 1303 948 62 3 3 31 979 333

226
63 0 0 0 820 411 64 12 0 100 1485 1563 65 0 0 0 1952 2259 66 0 0 0 - 129 67 6 0 50 249 235 68 31 4 266 2228 801 69 0 0 0 2818 637 70 20 3 173 4253 2400 71 4 0 33 769 542 72 24 0 200 769 542 73 0 0 0 1080 1040 74 0 0 0 - 912 75 6 0 50 872 335 76 20 12 191 1701 920 77 15 0 125 1283 1699 78 0 0 0 - 148 79 10 0 83 703 2658 80 6 0 50 608 656 81 12 0 100 654 100 82 9 0 75 338 2304 83 48 5 410 3173 3255 84 2 10 37 2115 1765 85 6 0 50 540 1215 86 2 4 25 929 1207 87 0 6 12 3038 1139 88 8 10 87 945 154 89 12 10 120 2559 1298 90 3 0 25 857 1617 91 6 0 50 1154 611 92 0 0 0 125 1319 93 8 0 67 1514 696 94 0 0 0 720 1605 95 0 0 0 - -

227
96 12 5 109 1772 1970 97 7 5 68 1044 1188 98 0 0 0 1436 6994 99 30 2 254 3359 1761
100 5 0 42 665 366 101 4 0 33 328 126 102 0 1 2 - - 103 34 0 283 1647 958 104 8 5 76 799 723 105 0 10 20 - 432 106 0 0 0 617 626 107 0 0 0 1463 1044 108 0 5 10 342 448 109 0 0 0 - 145 110 0 10 20 1828 3619 111 22 0 183 1800 618 112 0 0 0 - - 113 7 0 58 1071 476 114 0 3 6 2027 481 115 12 0 100 1468 1631 116 36 1 302 2158 680 117 0 1 2 620 881 118 0 0 0 1069 2112 119 0 0 0 74 108 120 24 0 200 135 97 121 0 0 0 1258 833 122 0 3 6 1890 3845 123 50 8 433 1700 1799 124 0 8 16 810 538 125 0 0 0 43 795 126 0 0 0 135 45 127 0 0 0 731 58 128 0 0 0 - 882
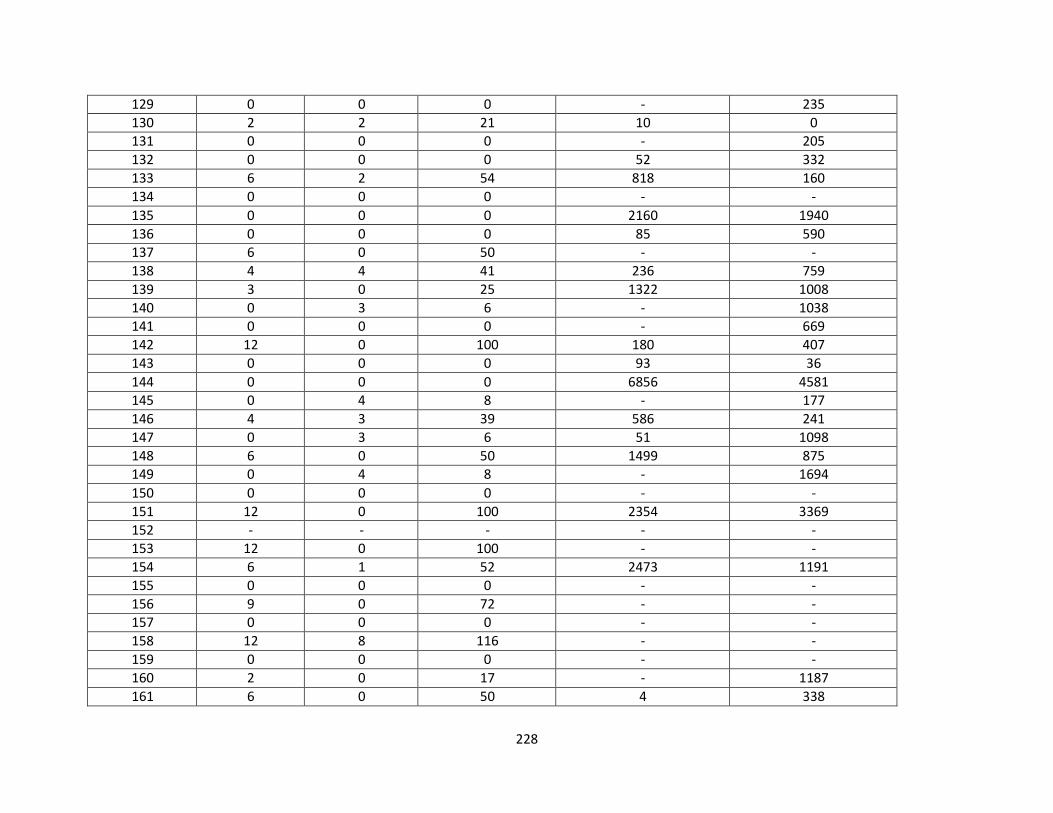
228
129 0 0 0 - 235 130 2 2 21 10 0 131 0 0 0 - 205 132 0 0 0 52 332 133 6 2 54 818 160 134 0 0 0 - - 135 0 0 0 2160 1940 136 0 0 0 85 590 137 6 0 50 - - 138 4 4 41 236 759 139 3 0 25 1322 1008 140 0 3 6 - 1038 141 0 0 0 - 669 142 12 0 100 180 407 143 0 0 0 93 36 144 0 0 0 6856 4581 145 0 4 8 - 177 146 4 3 39 586 241 147 0 3 6 51 1098 148 6 0 50 1499 875 149 0 4 8 - 1694 150 0 0 0 - - 151 12 0 100 2354 3369 152 - - - - - 153 12 0 100 - - 154 6 1 52 2473 1191 155 0 0 0 - - 156 9 0 72 - - 157 0 0 0 - - 158 12 8 116 - - 159 0 0 0 - - 160 2 0 17 - 1187 161 6 0 50 4 338

229
162 0 1 2 1634 1599 163 0 0 0 - 250 164 0 6 12 1412 262 165 0 10 20 3240 919 166 - - - - 427 167 0 0 0 1118 3207 168 - - - 643 564 169 0 0 0 1080 674 170 6 0 50 251 45 171 12 6 112 - - 172 0 1 2 338 1535 173 12 0 100 1530 1369 174 0 0 0 - 885 175 24 0 200 433 0 176 4 0 33 2055 1131 177 2 6 29 678 310 178 1 6 20 62 412 179 2 0 17 809 2317 180 1 0 8 188 - 181 12 0 100 1789 1791 182 18 1 152 0 13 183 1 0 8 779 0 184 36 0 300 35 177 185 5 0 42 604 - 186 20 0 167 1029 308 187 12 0 100 2125 1171 188 3 5 35 2125 1171 189 3 6 37 2313 757 190 12 6 112 - - 191 0 0 0 - - 192 0 0 0 - 920 193 0 0 0 57 31 194 0 0 0 - -

230
195 13 0 108 833 257 196 0 0 0 91 192 197 7 0 57 389 420 198 6 0 50 - - 199 0 3 6 - - 200 0 0 0 - - 201 10 0 83 - - 202 0 0 0 - - 203 0 0 0 292 348 204 0 3 6 - - 205 0 2 4 - - 206 0 0 0 - 2187 207 7 0 57 406 583 208 24 0 - - 414 209 4 0 33 149 1464 210 12 30 - 2911 3375 211 12 2 104 717 541 212 0 0 0 360 323 213 10 0 83 675 198 214 10 10 103 1927 4771 215 - - - 1118 1662 216 - - - 512 422 217 - - - 1802 568 218 - - - 1656 940 219 - - - 1969 505 220 - - - 2700 1453 221 12 0 100 1350 35 222 5 1 44 775 97 223 - - - 506 383 224 0 0 0 - 117 225 - - - 2138 1556 226 36 0 300 2430 1389 227 24 0 200 1328 397

231
228 12 0 100 2445 864 229 0 0 0 1530 1360 230 8 0 67 1091 241 231 0 0 0 878 1907 232 12 7 114 606 1068 233 0 0 0 1733 98 234 0 0 0 810 249 235 28 4 241 1215 447 236 18 0 150 2076 717 237 18 0 150 1013 221 238 0 5 10 - 674 239 15 0 125 1575 1588 240 0 0 0 42 1463 241 51 10 445 2653 1366 242 5 1 44 104 1918 243 0 0 0 - - 244 26 0 217 - - 245 12 0 100 - - 246 0 0 0 - - 247 12 0 100 - - 248 0 0 0 - - 249 24 0 200 - - 250 15 7 139 - - 251 - - - - - 252 34 5 294 - - 253 0 8 16 - - 254 0 0 0 - - 255 36 6 312 - - 256 0 0 0 - - 257 0 0 0 - - 258 18 50 250 - - 259 0 2 4 - - 260 9 10 95 - -

232
261 1 5 18 - - 262 12 20 140 - - 263 12 0 100 - - 264 12 0 100 - - 265 5 2 46 0 779 266 1 0 8 523 509 267 0 4 8 9 268 - - - - - 269 - - - - - 270 - - - - - 271 - - - 1781 1309 272 - - - - - 273 - - - 504 124 274 - - - 90 2 275 16 10 153 2100 1483 276 - - - 2093 617 277 0 0 0 - - 278 30 0 250 3578 1687 279 12 1 102 1283 143 280 0 9 18 900 768 281 - - - - 2 282 0 0 0 - 296 283 - - - 1238 501 284 5 0 42 1080 1258 285 0 12 24 106 243 286 12 0 100 2158 928 287 8 0 67 1234 437 288 0 0 0 540 420 289 0 0 0 - 186 290 0 3 6 - 290 291 0 0 0 - - 292 0 4 8 - - 293 8 6 79 855 438

233
294 1 0 8 2356 1412 295 28 4 241 450 193 296 3 0 25 68 368 297 0 0 0 - - 298 2 0 17 122 140 299 0 3 6 208 305 300 12 0 100 - - 301 12 4 108 - - 302 0 2 4 - - 303 8 0 67 - 270 304 - - - - - 305 12 0 - 1373 587 306 0 0 0 270 381 307 4 0 33 919 870 308 0 0 0 419 309 2 8 33 225 261 310 8 9 85 805 12 311 0 0 0 113 312 6 0 50 919 870 313 17 0 142 2700 521 314 14 0 117 1890 771 315 0 0 0 - - 316 0 0 0 - - 317 3 0 25 - - 318 7 0 58 - - 319 - - - 1530 1360 320 8 0 67 1091 241 321 - - - 2700 521 322 - - - 1733 98 323 - - - 2076 717 324 - - - 1575 1588 325 - - - 42 1463 326 - - - 104 1918

234
Abbreviations: kcals-kilocalories; PA-physical activity

235
Table 3. Cardiovascular and Metabolic Biomarkers
Subject Glucose (mg/dL) Insulin (mU/L) TC (mg/dL) HDL-C (mg/dL) LDL-C (mg/dL) TG (mg/dL) MetSyn
1 - - 148.0 45.0 65.0 188.0 - 2 - - 118.0 57.0 51.0 50.0 - 3 133.0 17.6 154.0 46.0 78.0 115.0 N 4 99.0 7.1 155.0 56.0 81.0 88.0 N 5 111.0 12.7 133.0 23.0 86.0 65.0 Y 6 112.0 13.6 137.0 29.0 83.0 97.0 Y 7 84.0 6.8 142.0 39.0 78.0 92.0 Y 8 112.0 19.5 140.0 37.0 85.0 90.0 Y 9 111.0 14.2 213.0 40.0 152.0 75.0 Y
10 129.0 14.5 249.0 32.0 190.0 89.0 N 11 114.0 10.9 158.0 38.0 90.0 113.0 N 12 104.0 22.3 110.0 38.0 52.0 76.0 N 13 104.0 3.3 138.0 35.0 88.0 74.0 Y 14 134.0 13.5 179.0 34.0 110.0 123.0 Y 15 102.0 5.4 189.0 78.0 101.0 50.0 Y 16 96.0 14.0 172.0 38.0 105.0 112.0 Y 17 97.0 3.7 149.0 59.0 72.0 91.0 N 18 104.0 5.6 193.0 38.0 126.0 112.0 Y 19 118.0 13.4 174.0 44.0 116.0 71.0 Y 20 106.0 3.2 135.0 32.0 78.0 85.0 Y 21 104.0 6.4 118.0 44.0 63.0 55.0 Y 22 93.0 9.8 219.0 54.0 113.0 200.0 Y 23 96.0 23.3 151.0 36.0 88.0 97.0 Y 24 97.0 12.2 111.0 31.0 62.0 89.0 Y 25 141.0 20.6 494.0 26.0 - - Y 26 111.0 8.3 197.0 44.0 137.0 82.0 Y 27 99.0 7.8 138.0 34.0 77.0 103.0 Y 28 105.0 9.0 127.0 41.0 74.0 60.0 Y 29 107.0 8.1 116.0 52.0 52.0 59.0 Y 30 85.0 2.0 128.0 55.0 64.0 43.0 Y

236
31 264.0 98.4 121.0 43.0 64.0 71.0 Y 32 87.0 2.0 242.0 45.0 162.0 132.0 Y 33 103.0 8.5 147.0 30.0 102.0 75.0 Y 34 123.0 11.9 201.0 37.0 115.0 174.0 Y 35 101.0 8.4 214.0 71.0 112.0 118.0 Y 36 143.0 147.6 133.0 30.0 73.0 119.0 N 37 122.0 9.4 228.0 31.0 163.0 125.0 Y 38 93.0 6.0 148.0 20.0 83.0 158.0 Y 39 143.0 9.2 161.0 71.0 81.0 46.0 Y 40 112.0 7.5 106.0 45.0 53.0 41.0 Y 41 104.0 13.4 144.0 33.0 87.0 88.0 Y 42 161.0 6.4 105.0 25.0 62.0 89.0 Y 43 104.0 12.7 130.0 44.0 70.0 82.0 Y 44 133.0 10.3 154.0 45.0 94.0 76.0 Y 45 100.0 15.6 147.0 37.0 93.0 85.0 Y 46 97.0 23.1 114.0 33.0 62.0 94.0 Y 47 146.0 16.1 156.0 32.0 74.0 160.0 Y 48 121.0 9.5 176.0 26.0 131.0 95.0 Y 49 161.0 13.7 101.0 33.0 44.0 90.0 Y 50 95.0 4.2 170.0 44.0 107.0 95.0 Y 51 103.0 4.0 162.0 41.0 114.0 34.0 Y 52 91.0 4.7 206.0 45.0 141.0 71.0 Y 53 121.0 5.4 110.0 37.0 56.0 87.0 Y 54 96.0 11.8 125.0 37.0 69.0 93.0 Y 55 108.0 3.6 184.0 67.0 101.0 78.0 Y 56 53.0 2.0 172.0 53.0 103.0 82.0 Y 57 96.0 9.2 121.0 35.0 67.0 96.0 Y 58 92.0 17.7 126.0 36.0 70.0 74.6 Y 59 93.0 7.0 148.0 38.0 90.0 77.4 Y 60 101.0 12.0 167.0 38.0 95.0 137.5 Y 61 84.0 2.0 166.0 72.0 87.0 34.0 Y 62 108.0 11.1 142.0 35.0 84.0 82.4 Y 63 88.0 11.5 150.0 39.0 94.0 84.0 Y

237
64 104.0 12.5 175.0 52.0 98.0 94.5 Y 65 117.0 8.7 134.0 36.0 84.0 72.0 Y 66 124.0 32.2 158.0 35.0 75.0 184.3 Y 67 111.0 31.5 204.0 39.0 118.0 186.0 Y 68 106.0 5.1 153.0 64.0 75.0 72.0 Y 69 96.0 6.9 208.0 57.0 141.0 52.0 Y 70 118.0 14.2 177.0 57.0 98.0 73.4 Y 71 129.0 14.0 171.0 34.0 95.0 163.6 Y 72 97.0 2.6 145.0 63.0 75.0 34.0 Y 73 119.0 33.5 173.0 38.0 108.0 106.4 Y 74 116.0 13.4 210.0 61.0 135.0 72.0 Y 75 96.0 11.4 147.0 32.0 97.0 91.0 Y 76 139.0 9.0 135.0 30.0 85.0 99.0 Y 77 99.0 4.2 150.0 40.0 100.0 51.0 Y 78 106.0 4.5 146.0 37.0 87.0 88.5 Y 79 123.0 35.1 134.0 33.0 86.0 77.0 Y 80 100.0 6.1 194.0 97.0 82.0 74.0 Y 81 102.0 32.0 174.0 32.0 122.0 71.1 Y 82 126.0 3.0 164.0 78.0 73.0 64.0 Y 83 94.0 10.8 134.0 27.0 82.0 101.2 Y 84 136.0 14.5 149.0 49.0 76.0 90.3 Y 85 130.0 3.8 113.0 44.0 56.0 65.0 Y 86 108.0 19.2 228.0 36.0 - 316.3 Y 87 96.0 5.3 147.0 41.0 90.0 81.0 Y 88 118.0 11.1 174.0 50.0 113.0 55.0 Y 89 108.0 8.6 168.0 31.0 110.0 99.7 Y 90 110.0 38.3 195.0 58.0 117.0 99.0 Y 91 131.0 69.3 180.0 36.0 92.0 189.2 Y 92 87.0 6.8 218.0 59.0 133.0 101.8 Y 93 104.0 15.1 151.0 46.0 86.0 96.0 Y 94 106.0 9.5 158.0 53.0 93.0 58.0 Y 95 89.0 23.5 126.0 45.0 58.0 83.0 N 96 113.0 3.0 150.0 51.0 91.0 38.0 Y

238
97 95.0 5.1 151.0 28.0 95.0 103.4 Y 98 102.0 6.4 215.0 42.0 143.0 110.0 Y 99 127.0 5.8 187.0 55.0 112.0 77.0 Y
100 93.0 8.7 213.0 49.0 118.0 169.1 Y 101 106.0 3.5 184.0 36.0 132.0 82.0 Y 102 123.0 - 140.0 25.0 81.0 123.3 N 103 108.0 10.2 148.0 31.0 72.0 161.9 Y 104 114.0 8.6 159.0 60.0 87.0 60.0 Y 105 104.0 22.4 223.0 28.0 157.0 147.1 Y 106 104.0 6.7 125.0 30.0 80.0 74.0 Y 107 81.0 1.0 206.0 58.0 138.0 52.0 Y 108 114.0 25.2 198.0 28.0 133.0 151.2 Y 109 115.0 9.3 200.0 44.0 144.0 60.0 Y 110 121.0 15.0 261.0 47.0 180.0 128.5 Y 111 117.0 3.6 148.0 51.0 88.0 44.0 Y 112 108.0 18.9 111.0 41.0 57.0 67.0 N 113 129.0 15.6 229.0 34.0 167.0 91.8 Y 114 116.0 10.0 158.0 42.0 100.0 80.0 Y 115 90.0 10.7 129.0 42.0 76.0 54.0 Y 116 89.0 4.5 126.0 52.0 54.0 60.7 Y 117 122.0 31.0 90.0 31.0 33.0 101.0 Y 118 122.0 31.5 141.0 39.0 69.0 127.6 Y 119 223.0 37.7 193.0 34.0 94.0 263.6 Y 120 102.0 5.3 155.0 34.0 103.0 88.0 Y 121 217.0 20.0 108.0 20.0 56.0 118.1 Y 122 103.0 6.8 151.0 31.0 108.0 58.0 Y 123 155.0 18.6 144.0 37.0 88.0 97.0 Y 124 94.0 5.9 187.0 57.0 99.0 112.9 Y 125 80.0 18.6 114.0 34.0 63.0 83.0 Y 126 100.0 3.6 140.0 73.0 53.0 70.0 Y 127 117.0 10.0 140.0 43.0 77.0 98.0 Y 128 121.0 32.9 168.0 28.0 111.0 - Y 129 112.0 4.6 126.0 65.0 44.0 84.0 Y
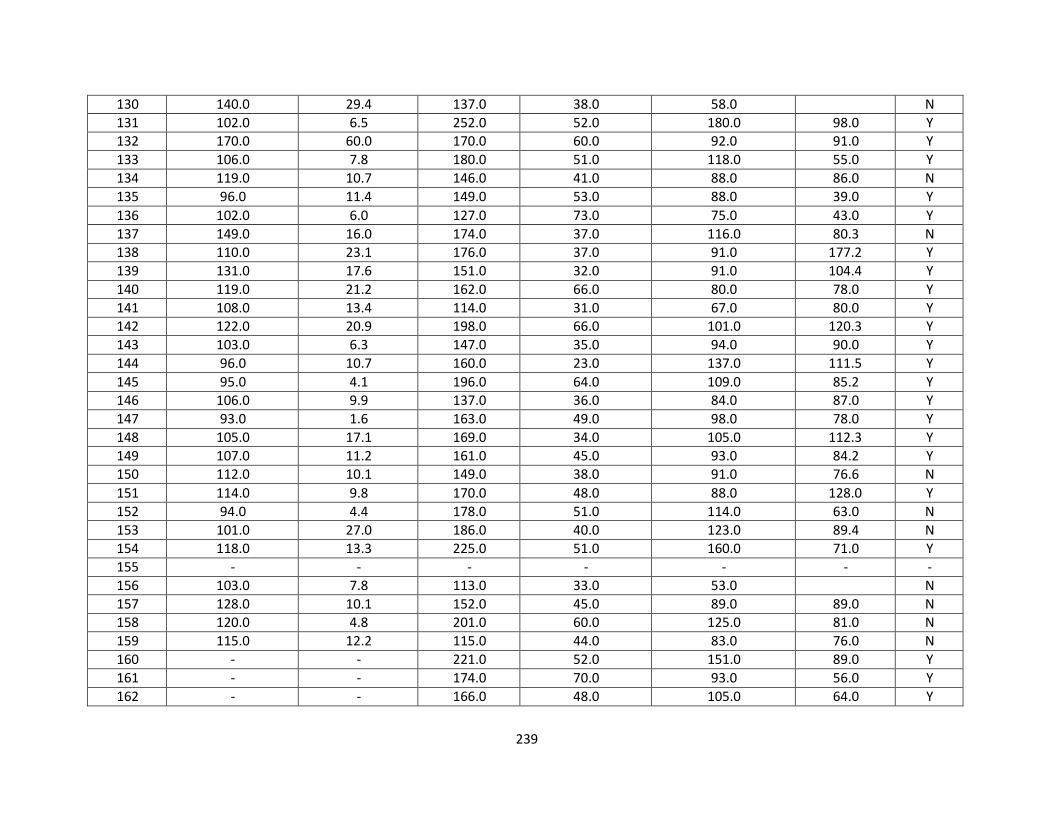
239
130 140.0 29.4 137.0 38.0 58.0 N 131 102.0 6.5 252.0 52.0 180.0 98.0 Y 132 170.0 60.0 170.0 60.0 92.0 91.0 Y 133 106.0 7.8 180.0 51.0 118.0 55.0 Y 134 119.0 10.7 146.0 41.0 88.0 86.0 N 135 96.0 11.4 149.0 53.0 88.0 39.0 Y 136 102.0 6.0 127.0 73.0 75.0 43.0 Y 137 149.0 16.0 174.0 37.0 116.0 80.3 N 138 110.0 23.1 176.0 37.0 91.0 177.2 Y 139 131.0 17.6 151.0 32.0 91.0 104.4 Y 140 119.0 21.2 162.0 66.0 80.0 78.0 Y 141 108.0 13.4 114.0 31.0 67.0 80.0 Y 142 122.0 20.9 198.0 66.0 101.0 120.3 Y 143 103.0 6.3 147.0 35.0 94.0 90.0 Y 144 96.0 10.7 160.0 23.0 137.0 111.5 Y 145 95.0 4.1 196.0 64.0 109.0 85.2 Y 146 106.0 9.9 137.0 36.0 84.0 87.0 Y 147 93.0 1.6 163.0 49.0 98.0 78.0 Y 148 105.0 17.1 169.0 34.0 105.0 112.3 Y 149 107.0 11.2 161.0 45.0 93.0 84.2 Y 150 112.0 10.1 149.0 38.0 91.0 76.6 N 151 114.0 9.8 170.0 48.0 88.0 128.0 Y 152 94.0 4.4 178.0 51.0 114.0 63.0 N 153 101.0 27.0 186.0 40.0 123.0 89.4 N 154 118.0 13.3 225.0 51.0 160.0 71.0 Y 155 - - - - - - - 156 103.0 7.8 113.0 33.0 53.0 N 157 128.0 10.1 152.0 45.0 89.0 89.0 N 158 120.0 4.8 201.0 60.0 125.0 81.0 N 159 115.0 12.2 115.0 44.0 83.0 76.0 N 160 - - 221.0 52.0 151.0 89.0 Y 161 - - 174.0 70.0 93.0 56.0 Y 162 - - 166.0 48.0 105.0 64.0 Y

240
163 89.0 9.7 116.0 36.0 59.0 79.1 Y 164 94.0 2.0 125.0 31.0 78.0 79.0 Y 165 136.0 3.6 153.0 56.0 86.0 57.0 Y 166 97.0 2.5 172.0 54.0 99.0 95.0 Y 167 106.0 10.4 137.0 38.0 85.0 68.0 Y 168 131.0 9.3 131.0 57.0 48.0 111.9 Y 169 107.0 6.2 141.0 37.0 84.0 99.0 Y 170 90.0 5.2 160.0 40.0 96.0 35.4 Y 171 117.0 8.9 161.0 34.0 111.0 78.0 N 172 82.0 8.9 110.0 36.0 46.0 105.6 Y 173 120.0 13.4 121.0 24.0 84.0 67.0 Y 174 153.0 - 192.0 45.0 130.0 84.0 Y 175 - - 213.0 31.0 142.0 201.0 N 176 - - 130.0 32.0 75.0 116.0 Y 177 - - 127.0 51.0 66.0 52.0 Y 178 - - 125.0 32.0 65.0 108.3 Y 179 - - 131.0 39.0 77.0 73.0 Y 180 - - 125.0 48.0 55.0 81.5 N 181 - - 120.0 45.0 55.0 102.0 Y 182 - - 173.0 28.0 129.0 82.0 Y 183 - - 136.0 37.0 84.0 76.0 N 184 - - 169.0 53.0 94.0 110.0 Y 185 100.0 - 107.0 35.0 48.0 84.4 N 186 105.0 5.0 120.0 39.0 71.0 49.0 Y 187 94.0 3.1 114.0 40.0 66.0 42.0 Y 188 113.0 12.4 134.0 40.0 73.0 83.4 Y 189 110.0 9.8 161.0 71.0 81.0 47.0 Y 190 114.0 13.2 119.0 39.0 58.0 81.6 N 191 107.0 27.6 174.0 41.0 99.0 133.7 N 192 101.0 18.2 212.0 31.0 60.0 356.6 Y 193 96.0 5.7 161.0 47.0 98.0 79.0 Y 194 101.0 14.9 166.0 27.0 115.0 95.5 N 195 106.0 7.0 120.0 24.0 79.0 85.0 Y

241
196 113.0 7.8 113.0 29.0 76.0 88.0 Y 197 135.0 10.5 171.0 24.0 92.0 217.2 Y 198 109.0 7.7 118.0 34.0 67.0 87.0 N 199 105.0 11.4 122.0 26.0 77.0 94.0 N 200 135.0 8.9 128.0 55.0 61.0 60.0 N 201 - - - - - - - 202 159.0 9.2 124.0 32.0 68.0 82.2 N 203 94.0 12.5 178.0 53.0 105.0 81.9 Y 204 94.0 4.4 178.0 51.0 114.0 63.0 N 205 226.0 18.5 137.0 24.0 83.0 118.0 N 206 187.0 11.9 145.0 36.0 83.0 108.4 Y 207 178.0 73.1 120.0 20.0 59.0 156.0 Y 208 94.0 6.9 244.0 32.0 297.0 338.3 Y 209 100.0 13.3 120.0 25.0 67.0 104.4 Y 210 99.0 17.3 136.0 48.0 62.0 93.8 Y 211 133.0 18.0 114.0 22.0 56.0 141.0 Y 212 93.0 8.8 209.0 30.0 133.0 171.6 Y 213 120.0 6.2 145.0 43.0 89.0 67.0 Y 214 114.0 11.5 124.0 32.0 78.0 71.0 Y 215 100.0 10.6 207.0 41.0 135.0 112.2 Y 216 99.0 32.5 181.0 48.0 118.0 77.0 Y 217 131.0 10.4 141.0 40.0 57.0 77.0 Y 218 124.0 5.6 159.0 46.0 85.0 77.0 Y 219 143.0 35.3 126.0 26.0 72.0 77.0 Y 220 202.0 21.8 125.0 34.0 75.0 82.0 Y 221 118.0 12.6 226.0 29.0 159.0 147.5 Y 222 119.0 14.6 152.0 43.0 92.0 85.0 Y 223 94.0 19.0 130.0 38.0 74.0 92.0 Y 224 94.0 19.8 228.0 96.0 122.0 48.0 Y 225 97.0 5.7 224.0 37.0 128.0 212.9 Y 226 89.0 2.0 189.0 53.0 117.0 93.0 Y 227 94.0 6.3 177.0 48.0 103.0 90.1 Y 228 107.0 9.5 179.0 52.0 119.0 41.0 Y

242
229 99.0 11.9 116.0 31.0 68.0 87.0 Y 230 106.0 9.8 195.0 55.0 114.0 96.1 Y 231 119.0 24.6 198.0 39.0 102.0 212.9 Y 232 143.0 13.6 162.0 40.0 76.0 78.5 Y 233 132.0 10.3 154.0 53.0 75.0 87.0 Y 234 105.0 9.0 145.0 33.0 73.0 139.1 Y 235 98.0 3.5 174.0 54.0 109.0 56.0 Y 236 192.0 12.9 122.0 44.0 58.0 78.7 Y 237 108.0 60.0 169.0 60.0 98.0 62.0 Y 238 165.0 16.4 138.0 29.0 78.0 119.9 Y 239 101.0 6.4 134.0 35.0 80.0 96.0 Y 240 97.0 10.6 131.0 32.0 78.0 73.9 Y 241 87.0 2.7 204.0 96.0 103.0 26.0 Y 242 94.0 22.5 192.0 37.0 125.0 190.0 Y 243 - - - - - - - 244 - - - - - - - 245 - - - - - - - 246 - - - - - - - 247 - - - - - - - 248 - - - - - - - 249 - - - - - - - 250 - - - - - - - 251 - - - - - - - 252 - - - - - - - 253 - - - - - - - 254 - - - - - - - 255 - - - - - - - 256 - - - - - - - 257 - - - - - - - 258 - - - - - - - 259 - - - - - - - 260 106.0 8.5 143.0 37.0 86.0 - N 261 125.0 - 117.0 39.0 51.0 - N

243
262 227.0 - 227.0 33.0 80.0 - N 263 152.0 - 137.0 35.0 79.0 - N 264 - - - - - - - 265 - - 217.0 51.0 152.0 71.0 Y 266 - - 177.0 60.0 92.0 125.0 Y 267 124.0 10.7 225.0 55.0 141.0 127.3 Y 268 98.0 38.6 154.0 45.0 82.0 120.1 N 269 89.0 8.8 145.0 44.0 84.0 85.0 N 270 87.0 5.6 130.0 38.0 76.0 81.0 N 271 105.0 5.6 212.0 37.0 147.0 122.8 Y 272 127.0 19.9 210.0 46.0 118.0 203.0 N 273 134.0 25.4 142.0 50.0 69.0 104.1 Y 274 115.0 11.5 414.0 93.0 288.0 148.6 Y 275 101.0 4.5 206.0 57.0 137.0 59.0 Y 276 94.0 2.0 214.0 78.0 115.0 92.6 Y 277 130.0 62.5 130.0 25.0 68.0 162.9 N 278 149.0 18.9 186.0 36.0 75.0 333.0 Y 279 92.0 6.5 155.0 62.0 80.0 67.0 Y 280 82.0 6.4 179.0 52.0 106.0 91.7 Y 281 86.0 14.5 144.0 62.0 62.0 89.9 N 282 98.0 24.3 161.0 38.0 99.0 105.0 Y 283 92.0 5.9 252.0 40.0 179.0 147.7 Y 284 97.0 8.1 136.0 39.0 69.0 123.7 Y 285 93.0 5.4 176.0 44.0 101.0 138.0 Y 286 97.0 12.2 155.0 54.0 85.0 82.0 Y 287 123.0 10.7 171.0 55.0 86.0 133.5 Y 288 95.0 4.9 169.0 59.0 86.0 105.0 Y 289 98.0 14.6 186.0 64.0 104.0 91.0 Y 290 95.0 7.0 147.0 54.0 64.0 130.8 Y 291 110.0 4.9 286.0 53.0 209.0 106.8 N 292 98.0 6.6 132.0 53.0 67.0 62.0 N 293 122.0 20.7 152.0 51.0 80.0 92.6 Y 294 94.0 4.6 156.0 65.0 74.0 84.0 Y

244
295 99.0 3.4 230.0 54.0 131.0 200.3 Y 296 214.0 44.5 156.0 35.0 99.0 97.0 Y 297 178.0 29.7 123.0 47.0 57.0 95.0 N 298 98.0 8.3 147.0 53.0 74.0 98.0 Y 299 117.0 6.0 110.0 50.0 54.0 31.0 Y 300 109.0 9.8 152.0 48.0 90.0 69.0 N 301 181.0 41.3 136.0 42.0 73.0 93.5 N 302 132.0 - 138.0 49.0 70.0 95.0 N 303 - - 270.0 45.0 197.0 64.0 Y 304 93.0 8.2 166.0 41.0 82.0 190.5 N 305 88.0 4.2 214.0 97.0 109.0 38.0 Y 306 94.0 3.7 110.0 40.0 57.0 63.0 Y 307 89.0 2.5 230.0 86.0 126.0 88.0 Y 308 113.0 140.0 28.0 67.0 198.5 Y 309 89.0 11.3 147.0 39.0 89.0 96.0 Y 310 99.0 9.8 116.0 75.0 30.0 53.0 Y 311 88.0 11.5 150.0 39.0 87.0 107.7 Y 312 95.0 7.8 176.0 85.0 79.0 59.0 Y 313 105.0 5.5 171.0 66.0 90.0 75.0 Y 314 107.0 8.6 181.0 68.0 100.0 64.0 Y 315 - - - - - - - 316 - - - - - - - 317 - - - - - - - 318 - - - - - - - 319 99.0 11.9 116.0 31.0 68.0 87.0 Y 320 106.0 9.8 195.0 55.0 114.0 128.0 Y 321 105.0 5.5 171.0 66.0 90.0 75.0 Y 322 132.0 10.3 154.0 53.0 75.0 87.0 Y 323 192.0 12.9 122.0 44.0 58.0 101.0 - 324 101.0 6.4 134.0 35.0 80.0 96.0 - 325 97.0 10.6 131.0 32.0 78.0 105.0 Y 326 94.0 22.5 192.0 37.0 125.0 253.0 Y

245
Abbreviations: TC-total cholesterol; HDL-C-high density lipoprotein-cholesterol; LDL-C-low density lipoprotein-cholesterol; TG-
triglycerides; MetSyn-metabolic syndrome.

246
Chapter 4 Raw Data

247
Table 4. Subject Characteristics
Subject
OSA-
risk
BRS
Age
(yr)
AAA
(cm)
BMI
(kg/m2)
WC
(cm)
HC
(cm)
W/H
ratio
SBP
(mmHg)
DBP
(mmHg)
Anti-
HTN
med
Anti-
lipemic
Med
Diabetic
Med 1 Y 2 53.00 2.3 51.9 182.9 148.6 1.23 156 98 Y Y Y 2 Y 2 62.00 2.2 33.8 109.2 102.9 1.06 118 68 Y N Y 3 Y 1 51.00 2.8 34.3 104.1 94.0 1.11 134 88 Y N Y 4 Y 2 74.00 2.4 28.8 102.9 109.2 0.94 150 66 Y Y N 5 N 1 59.00 2.3 29.1 92.7 101.6 0.91 126 80 N Y N 6 Y 3 58.00 2.3 39.8 121.9 124.5 0.98 138 84 Y N N 7 N 2 59.00 2.2 30.7 100.3 105.4 0.95 122 84 N N N 8 N 1 76.00 2.6 26.7 96.5 101.6 0.95 132 72 Y Y N 9 Y 1 62.00 1.9 24.7 88.9 104.1 0.85 144 90 Y Y N
10 N 3 83.00 1.9 27.6 97.8 101.6 0.96 158 84 Y Y Y 11 N 1 68.00 2.0 33.6 109.2 113.0 0.97 122 76 Y Y Y 12 Y 3 61.00 2.1 35.0 124.5 115.6 1.08 130 90 Y Y Y 13 N 2 61.00 1.9 30.0 94.0 96.5 0.97 128 78 Y Y Y 14 Y 2 60.00 2.0 37.5 116.8 116.8 1.00 134 80 Y Y Y 15 Y 1 71.00 2.2 27.0 100.3 108.0 0.93 144 86 Y Y Y 16 Y 3 60.00 6.1 31.2 109.2 101.6 1.08 160 98 Y N N 17 N 3 62.00 1.9 29.4 96.5 96.5 1.00 132 78 Y Y N 18 N 1 79.00 2.4 27.0 86.4 95.3 0.91 138 80 Y Y N 19 N 1 52.00 2.6 31.6 95.3 106.7 0.89 140 82 Y N Y 20 Y 2 64.00 1.9 26.1 94.0 101.6 0.92 130 78 Y Y N 21 N 0 65.00 1.9 20.1 81.3 86.4 0.94 138 84 Y N N 22 N 0 64.00 2.3 29.4 91.4 104.1 0.88 130 78 N Y N 23 N 0 64.00 2.2 21.1 73.7 88.9 0.83 140 80 N Y N 24 N 2 70.00 4.4 24.7 102.9 96.5 1.07 140 68 - - - 25 Y 1 63.00 3.0 28.6 101.6 105.4 0.96 139 73 Y Y N 26 Y 1 76.00 4.3 30.6 113.0 110.5 1.02 134 78 Y Y Y 27 N 2 86.00 3.7 32.6 114.3 120.7 0.96 118 74 - - - 28 Y 2 71.00 3.1 27.6 94.0 97.8 0.96 124 65 Y Y N

248
29 N 2 79.00 3.6 26.1 88.9 100.3 0.89 162 85 Y Y N 30 Y 1 80.00 3.5 31.5 114.3 118.1 0.97 168 89 - - - 31 N 2 73.00 4.7 25.5 100.3 101.6 0.99 150 93 Y Y N 32 Y 2 75.00 3.7 30.9 109.2 111.8 0.98 116 62 Y N Y 33 N 2 73.00 3.0 23.8 83.8 95.3 0.88 130 79 - - - 34 Y 1 76.00 3.7 26.7 91.4 94.0 0.97 145 78 - - - 35 N 1 67.00 3.7 23.2 82.6 91.4 0.90 109 68 Y Y N 36 Y 1 64.00 4.6 28.3 102.9 102.9 1.00 118 72 - - - 37 Y 2 82.00 4.1 36.5 111.1 114.3 1.00 152 78 N N N 38 N 1 86.00 4.8 23.0 94.0 101.6 0.90 124 78 N Y N 39 N 1 83.00 4.8 19.6 76.8 88.9 0.90 144 65 N Y N 40 N 1 77.00 4.8 21.6 87.6 96.5 0.90 160 80 Y Y N 41 Y 1 55.00 3.8 26.8 94.0 101.6 0.90 122 98 N Y N 42 Y 1 77.00 4.5 29.9 109.2 109.2 1.00 150 74 N N N 43 N 2 57.00 3.4 34.5 102.9 120.7 0.90 110 76 Y Y N 44 Y 1 75.00 3.6 24.5 91.4 96.5 1.00 134 80 N N N 45 N 1 74.00 3.3 26.9 83.8 106.7 0.80 153 70 Y N N 46 N 2 70.00 4.2 29.3 102.9 105.4 1.00 137 88 N N N 47 Y 2 60.00 3.3 27.6 94.0 99.1 1.00 161 94 N Y N 48 Y 2 73.00 3.6 28.4 100.3 102.9 1.00 130 70 Y N N 49 Y 1 71.00 4.6 25.9 101.1 108.0 0.90 154 78 Y N N 50 Y 2 72.00 3.9 27.3 99.1 101.6 1.00 148 84 Y N N 51 N 0 80.00 4.3 21.4 83.8 96.5 0.90 145 75 N N N 52 Y 1 72.00 3.5 30.9 110.5 113.0 1.00 163 74 N N N 53 Y 2 72.00 3.4 24.7 92.7 99.1 0.94 130 80 Y Y N 54 Y 1 62.00 4.4 49.9 125.7 153.7 0.80 114 68 Y N N 55 Y 1 73.00 4.2 32.5 109.2 108.0 1.00 128 68 Y Y N 56 Y 3 61.00 4.2 32.2 102.9 106.7 1.00 130 82 Y Y N 57 Y 2 67.00 4.5 29.3 105.4 102.9 1.00 150 88 Y Y N 58 N 2 70.00 4.4 24.7 102.9 96.5 1.07 140 68 N Y N 59 Y 2 64.00 3.5 31.0 102.9 104.1 1.00 120 70 Y Y N 60 N 0 74.00 4.2 25.1 82.6 94.0 0.90 120 80 Y Y N 61 Y 0 78.00 3.9 27.3 92.7 100.3 0.90 126 76 Y Y N

249
62 Y 2 68.00 3.4 32.0 110.5 114.3 1.00 155 90 Y Y N 63 Y 1 78.00 3.8 26.7 90.2 102.9 0.90 134 84 Y Y N 64 Y 1 82.00 3.0 28.1 94.0 101.6 0.90 132 80 Y Y Y 65 Y 2 72.00 4.1 30.7 108.0 106.7 1.00 150 84 Y Y N 66 N 1 80.00 3.1 30.0 106.7 114.3 0.90 120 73 Y Y N 67 N 1 79.00 3.9 34.8 116.8 115.6 1.00 120 62 N Y N 68 N 3 74.00 3.3 32.4 104.1 104.1 1.00 110 78 N N N 69 Y 1 81.00 3.8 30.1 100.3 108.0 0.90 118 61 Y Y N 70 N 1 72.00 4.4 23.3 94.0 91.4 1.00 153 87 N Y N 71 Y 2 54.00 3.4 31.3 109.2 111.8 1.00 108 72 Y Y N 72 N 1 84.00 3.2 25.1 92.7 99.1 0.90 124 70 Y Y N 73 Y 2 75.00 3.6 29.2 102.9 105.4 1.00 138 76 N Y N 74 Y 3 71.00 3.6 27.8 111.8 110.5 1.00 140 62 Y Y Y 75 N 1 71.00 4.1 28.2 96.5 94.0 1.00 138 78 Y Y N 76 Y 1 74.00 4.1 30.4 106.7 111.8 1.00 145 88 Y Y N 77 Y 3 79.00 4.0 24.2 91.4 96.5 1.00 145 74 Y Y Y 78 Y 1 86.00 3.4 23.1 78.7 96.5 0.80 136 67 Y N N 79 Y 2 69.00 4.0 24.4 96.5 101.6 1.00 126 69 Y Y N 80 N 1 77.00 3.3 27.3 108.0 113.0 1.00 116 66 N Y N 81 Y 1 62.00 4.0 30.0 106.7 104.1 1.00 143 84 Y Y N 82 N 1 81.00 3.3 16.1 68.6 87.6 0.80 150 70 Y Y N 83 Y 2 86.00 3.7 32.6 114.3 120.7 1.00 118 74 Y Y N 84 Y 3 78.00 3.4 21.6 92.7 99.1 0.94 142 84 Y Y Y 85 N 1 80.00 3.5 31.5 114.3 118.1 1.00 168 89 Y Y N 86 N 2 73.00 3.0 23.8 83.8 95.3 0.90 130 79 Y Y N 87 Y 1 76.00 3.7 26.7 91.4 94.0 1.00 145 78 Y Y N 88 N 2 68.00 3.2 22.9 95.9 95.3 1.00 140 78 N Y N 89 Y 0 72.00 4.0 28.8 111.8 111.8 1.00 118 76 Y N N 90 Y 1 64.00 3.5 26.6 100.3 99.1 1.00 149 81 Y N N 91 Y 2 63.00 4.0 22.6 106.7 96.5 1.10 152 90 Y Y N 92 Y 2 80.00 3.6 25.6 99.1 121.9 1.00 132 60 N N Y 93 Y 0 81.00 2.5 23.4 88.9 91.4 1.00 136 64 Y Y N 94 Y 2 75.00 3.7 30.9 108.0 105.4 1.00 138 64 Y N N

250
95 N 1 77.00 3.2 20.7 81.3 92.7 0.90 108 70 N N N 96 Y 3 78.00 3.9 33.5 121.9 119.4 1.00 144 88 Y Y N 97 Y 1 73.00 3.8 34.9 118.1 118.1 1.00 149 81 N N N 98 Y 1 82.00 3.3 28.7 99.1 106.7 0.90 142 78 Y Y N 99 N 1 76.00 3.7 26.2 97.8 99.1 1.00 112 66 N N N
100 Y 1 64.00 4.6 28.3 102.9 102.9 1.00 118 72 Y Y N 101 N 2 64.00 3.3 24.4 85.1 94.0 0.90 104 74 Y N N 102 Y 3 68.00 3.0 33.8 110.5 105.4 1.10 150 87 Y Y Y 103 Y 2 82.00 3.8 29.3 91.4 99.1 0.90 138 74 N N N 104 Y 1 82.00 3.8 24.4 83.8 96.5 0.90 120 64 Y N N 105 N 1 75.00 4.0 23.1 85.1 96.5 0.90 116 78 N N N 106 N 1 77.00 4.3 24.6 88.9 101.6 0.90 128 78 Y Y N 107 Y 2 87.00 4.2 23.8 97.8 104.1 0.90 158 86 N N N 108 Y 2 62.00 4.7 32.2 106.7 104.1 1.00 160 101 Y N N 109 N 1 77.00 3.5 106.7 100.3 1.10 132 70 Y N N 110 N 2 63.00 3.3 24.5 88.9 99.1 0.90 138 90 N N N 111 N 0 74.00 3.0 23.0 86.4 96.5 0.90 116 66 Y N N 112 N 1 78.00 3.3 33.3 108.0 111.8 1.00 116 66 N Y N 113 Y 3 72.00 4.0 27.8 102.9 100.3 1.00 130 72 Y N N 114 N 2 71.00 3.8 63.0 114.3 99.1 1.20 128 76 - - -
Abbreviations: OSA-obstructive sleep apnea; BQ-Berlin Questionnaire; BRS-Berlin Risk Score; AAA-abdominal aortic aneurysm;
BMI-body mass index; WC-waist circumference; HC-hip circumference; W/H-waist/hip; SBP-systolic blood pressure; DBP-diastolic
blood pressure; HTN-hypertension; Med-medication.

251
Table 5. Cardiopulmonary Exercise Test Variables at Rest, Ventilatory Threshold, Peak Exercise, and Recovery
Subject
Rest
Ventilatory
Threshold (VT)
Peak Exercise
Recovery HR-
supine
(bt/min)
SBP
supine
(mmHg)
DBP
supine
(mmHg)
HR
(bt/min)
VO2
(ml/kg/
min)
RER
HR
(bt/min)
SBP
(mmHg)
DBP
(mmHg)
VO2
(ml/kg/
min)
RER
HR
min1
(bt/min)
SBP
min1
(bt/min)
1 72 142 84 112 13.6 0.84 124 246 106 12.3 1.05 87 210 2 52 118 68 86 12.2 0.93 104 120 158 14.7 1.18 64 130 3 61 144 92 99 17.0 0.90 115 170 88 29.8 1.12 86 148 4 65 124 68 92 16.9 0.97 119 210 76 28.7 1.36 93 204 5 63 126 80 140 24.5 0.94 172 180 90 37.8 1.18 137 180 6 62 138 84 127 16.6 0.83 163 180 84 24.5 1.15 102 182 7 70 122 84 - - - 137 170 76 18.2 0.90 103 148 8 54 138 72 109 15.0 0.81 136 214 88 17.5 1.13 110 194 9 67 144 90 - - - 165 228 100 42.0 1.15 - -
10 87 170 90 108 11.9 0.71 130 190 86 14.0 1.08 125 190 11 68 122 76 110 13.2 0.99 146 200 90 21.4 1.32 124 176 12 67 130 90 149 18.0 0.86 156 190 98 16.5 1.01 91 170 13 76 128 78 107 17.8 0.81 127 190 76 26.6 1.07 102 182 14 69 158 98 117 15.1 0.98 142 208 70 24.2 1.11 120 168 15 75 144 86 140 21.7 0.95 155 186 76 27.3 1.11 130 188 16 77 160 98 113 11.4 0.72 118 220 104 13.3 0.97 105 190 17 59 132 78 111 20.5 0.94 152 200 70 36.8 1.28 119 196 18 55 138 80 111 17.3 0.91 125 190 70 23.1 1.12 102 186 19 65 140 82 - - - - - - - - - - 20 58 130 78 - - - 115 166 82 26.3 1.13 85 162 21 96 138 84 - - - 175 122 78 24.9 1.14 - - 22 60 130 78 118 20.2 0.96 152 218 74 34.3 1.25 110 200 23 63 130 80 - - - 149 172 84 33.3 1.14 - - 24 86 138 72 134 16.6 1.02 147 214 80 18.8 1.11 128 212 25 68 100 60 98 13.1 0.94 - 160 50 16.6 1.15 113 132 26 63 154 86 - 10.3 0.77 112 184 92 15.1 1.03 93 184 27 - - - - 11.4 0.81 - - - - - - -

252
28 75 118 70 116 11.9 0.70 166 180 76 22.4 1.09 155 158 29 54 136 76 80 18.4 0.83 112 190 80 29.0 1.12 61 180 30 68 150 88 113 13.4 0.79 127 208 70 15.7 1.25 96 208 31 65 158 80 99 15.7 0.86 95 170 80 17.6 1.29 90 180 32 61 144 72 111 12.8 0.89 128 196 76 14.6 1.07 118 190 33 52 116 78 80 7.8 0.70 133 160 84 20.4 1.32 108 164 34 60 126 70 82 11.4 0.94 98 180 70 11.8 1.16 83 120 35 64 142 88 128 19.9 0.75 166 208 86 27.9 1.23 152 206 36 60 118 72 92 14.5 0.71 130 158 80 22.3 1.16 102 158 37 55 152 80 - 15.6 1.00 129 200 80 17.4 1.13 90 194 38 47 124 86 75 15.7 0.90 106 174 80 21.0 1.19 95 190 39 60 138 52 73 9.7 0.77 83 160 82 16.0 1.18 75 150 40 70 164 72 83 10.1 0.72 110 164 70 14.6 1.10 105 145 41 44 132 78 83 13.6 0.97 109 170 84 15.5 1.17 75 198 42 62 141 78 - 14.1 0.76 125 182 80 15.2 1.21 129 172 43 73 136 84 - 9.6 0.90 123 180 86 10.6 0.93 101 182 44 70 114 80 129 16.0 0.82 174 180 86 35.9 1.16 138 160 45 54 120 74 - 12.7 0.77 83 128 60 15.1 0.96 113 144 46 50 110 76 - 15.7 0.88 102 164 76 21.7 0.93 82 160 47 66 134 80 - 11.3 0.67 140 178 86 22.2 1.10 121 196 48 68 136 76 101 11.3 0.67 120 206 74 18.9 1.14 103 198 49 60 150 74 103 13.8 0.84 119 195 90 15.1 1.25 62 194 50 53 122 70 83 12.1 0.72 110 142 68 22.7 1.01 77 162 51 51 102 68 102 18.5 0.95 116 174 105 22.2 1.05 97 - 52 51 132 72 101 16.5 0.99 110 142 70 17.5 1.13 84 130 53 87 151 89 - 27.5 0.73 169 230 100 33.6 0.95 142 280 54 55 140 74 - 15.8 0.85 106 200 84 20.7 1.15 70 164 55 62 120 78 103 14.2 0.99 133 214 90 19.6 1.09 117 176 56 48 118 64 - 19.4 1.03 120 174 80 23.6 1.09 94 170 57 65 158 80 - 21.0 1.00 139 168 80 23.5 1.23 115 128 58 86 138 72 134 16.6 1.02 147 214 80 18.8 1.11 128 212 59 56 130 72 69 9.7 0.83 82 144 74 12.1 1.11 68 180 60 60 114 76 19.1 0.99 156 178 88 21.1 1.14 115 158

253
61 75 122 88 147 12.6 0.98 170 170 70 15.7 1.18 140 180 62 64 118 76 103 12.6 0.93 138 226 94 17.6 1.17 118 218 63 62 120 68 89 10.1 0.86 98 156 74 12.3 0.96 91 156 64 83 132 74 114 14.7 0.90 124 160 52 17.3 1.00 106 150 65 60 124 66 122 15.5 1.00 130 200 80 15.8 1.05 106 218 66 51 128 66 117 29.7 1.04 126 180 40 34.3 1.14 105 158 67 61 120 78 - - - 110 146 76 18.4 0.90 78 136 68 54 142 80 90 15.3 0.89 132 210 86 23.0 1.19 92 215 69 65 108 64 96 20.3 1.07 109 160 84 21.3 1.20 86 172 70 93 130 68 - - - 135 170 76 - 0.00 122 184 71 49 152 86 83 12.8 0.75 109 152 76 18.1 1.03 94 164 72 63 160 78 96 10.9 0.78 138 170 78 20.6 1.14 115 146 73 60 136 72 107 14.5 0.80 158 208 84 20.7 1.22 111 202 74 47 146 84 71 11.2 0.82 89 166 80 15.3 1.09 65 170 75 73 164 90 103 12.5 0.99 127 208 70 15.7 1.25 96 208 76 58 142 74 85 10.0 0.77 106 172 66 13.0 1.10 100 176 77 62 140 80 96 16.3 0.81 119 240 76 19.3 1.12 91 224 78 55 134 68 96 16.0 1.01 116 184 76 19.4 1.15 88 194 79 67 140 92 97 17.8 0.78 132 200 74 27.0 1.22 116 184 80 60 122 78 92 9.9 0.68 155 214 86 20.3 1.23 131 206 81 86 126 68 124 10.0 0.76 149 170 76 13.7 1.04 132 176 82 53 120 68 83 12.4 0.81 105 174 84 16.6 1.09 84 178 83 - - - - 11.4 0.81 - - - - - - - 84 68 100 90 88 14.1 0.76 111 172 76 20.4 1.10 89 154 85 68 150 88 113 13.4 0.79 127 208 70 15.7 1.25 96 208 86 52 116 78 80 7.8 0.70 133 160 84 20.4 1.32 108 164 87 60 126 70 82 11.4 0.94 98 180 70 11.8 1.16 83 120 88 54 104 74 - 16.6 0.78 124 148 64 25.0 1.03 96 144 89 55 138 78 106 15.7 0.99 112 184 90 16.7 1.08 95 214 90 65 136 80 - 15.4 0.91 140 240 108 19.6 1.02 105 218 91 75 138 70 104 14.8 0.84 133 190 78 22.3 1.11 122 170 92 53 128 78 94 12.7 0.69 149 210 96 26.4 1.17 120 186 93 57 142 82 - 16.6 0.84 167 224 70 - 1.05 112 226

254
94 64 130 76 - 23.5 0.93 135 220 78 36.6 1.12 101 210 95 69 120 62 99 6.7 0.72 132 206 60 14.1 1.16 119 204 96 63 132 78 - 19.1 0.99 129 206 86 24.5 1.25 109 188 97 56 108 72 86 12.6 0.71 124 168 80 19.5 1.04 87 178 98 70 118 60 - 13.9 0.80 156 148 64 17.3 1.00 129 170 99 57 158 80 93 15.0 0.77 136 148 60 21.1 1.12 118 148
100 60 118 72 92 14.5 0.71 130 158 80 22.3 1.16 102 158 101 63 150 88 123 14.2 0.84 122 170 78 18.4 1.16 126 200 102 61 - - 97 9.8 0.81 152 230 90 20.9 1.30 134 210 103 57 144 88 - 12.6 0.85 98 140 74 15.8 1.13 95 136 104 66 132 90 128 19.1 0.95 146 182 80 22.2 1.05 134 176 105 85 128 78 - 14.1 0.82 142 194 80 21.6 1.11 124 190 106 59 138 74 - 9.4 0.85 132 160 84 10.3 1.09 97 164 107 64 118 72 95 10.9 0.96 114 234 66 - 1.13 102 184 108 62 146 72 73 10.2 0.75 86 204 86 11.6 0.98 67 210 109 68 120 71 - 20.7 0.98 169 180 72 39.4 1.24 144 174 110 64 138 90 88 14.1 0.80 127 220 78 26.4 1.23 85 176 111 61 112 70 117 17.6 0.81 152 240 80 26.3 1.10 131 220 112 102 118 78 140 16.6 0.83 156 160 90 18.6 1.11 155 - 113 47 122 56 72 12.5 0.98 74 132 60 12.5 1.02 56 124 114 75 128 76 103 11.8 0.83 106 168 82 13.9 - 90 170
Abbreviations: HR-heart rate; SBP-systolic blood pressure; DBP-diastolic blood pressure; VO
2-oxygen consumption; RER-respiratory
exchange ratio; PA-physical activity.

255
APPENDIX F
STATISTICAL OUTPUT TABLES

256
Chapters 2 and 3 Statistical Output Tables

257
Table 1. Independent Samples Test for Subject Characteristics and VAPAQ by Clinical Berlin OSA Risk
Independent Sampl es Test
Levene's Test for Equality of
Variances
t-test for Equality of Means
F
Sig.
t
df
Sig. (2-tailed)
Me an
Difference
Std. Error
Difference
95% ConfidenceInterval of the
Difference
Lower Upper
Age Equal variances
assumed
Equal variances not
assumed
. 471 .493 2.299
2.287
324
291.531
.022
.023
2.17205
2.17205
.94 476
.94974
.31341
.30283
4.03068
4.04126
AAA_size Equal variances
assumed
Equal variances not
assumed
. 000 .992 -.687
-.695
296
279.951
.49 2
.487
-.06145
-.06145
.089 40
.08838
-.23740
-.23543
.11450
.11253
BMI Equal variances
assumed
Equal variances not
assumed
3.009 .084 - 4.352
- 4.514
320
318.212
.000
.000
- 2.92162
- 2.92162
.67129
.64721
-4.24233
-4.19497
-1.60092
-1.6 4828
Waist_cm Equal variances
assumed
Equal variances not
assumed
. 025 .875 - 3.686
- 3.728
304
284.371
.000
.000
- 6.33267
- 6.33267
1.71808
1.69853
-9.71351
-9.67597
- 2.95183
- 2.98938
Hip_cm Equal variances
assumed
Equal variances not
assumed
2.463 .118 - 3.132
- 3.259
304
301.896
.002
.001
- 4.34237
- 4.34237
1.38634
1.33233
-7.07041
-6.96421
-1.61433
-1.72053
Waist_Hip_ratio Equal variances
assumed
I::qual vanances not
assumed
. 013 .908 - 2.681
- 2.713
304
284.977
.008
.007
-.02405
-.02405
.00897
.00886
-.04171
-.04150
-. 00639
-. 00660
SBP-rest Equal variances
assumed
Equal variances not
assumed
. 000 .999 .825
.826
303
274.343
.410
.410
1.68106
1.68106
2.03732
2.03616
-2.32802
-2.32743
5.69013
5.68954
DBP-rest Equal variances
assumed
Equal variances not
assumed
1.420 .234 -.393
-.400
304
288.161
.69 4
.690
-.47 402
-.47 402
1.20531
1.18616
-2.84582
-2.80865
1. 89778
1. 86061
Blocks_walked_day Equal variances
assumed
Equal variances not
assumed
15.630 .000 2.459
2.337
324
233.380
.014
.020
2.61609
2.61609
1.06382
1.119 43
.52322
.41062
4.70895
4.82156
Stairs -climbed_day Equal variances
assumed
Equal variances not
assumed
12.655 .000 2.433
2.1 42
274
141.249
.016
.03 4
1.37674
1.37674
.56591
.64 280
.26266
.10599
2.49083
2.64750
Blocks_flights_day Equal variances
assumed
Equal variances not
assumed
16.8 21 .000 3.1 43
2.926
271
176.442
.002
.00 4
32.48890
32.48890
10.33784
11.10196
12.13622
10.57918
52.84159
54.39863

258
Table 2. Analysis of Variance for Subject Characteristics and VAPAQ by Berlin Risk Score
ANOVA
Sum or
Squares
df
Mean Square
F
Slg.
Age Between Groups
Within Groups
Total
450.252
22984.104
23434.356
3
322
325
150.084
71.379
2.103 .1 00
AM_size Between Groups
Within Groups
Total
2.286
1 70.051
172.338
3
294
297
.762
.578
1.318 .269
BMI Between Group s
Within Groups
Total
11 70.110
10828.832
11998.942
3
318
321
390.037
34.053
11.454 .000
Waist_cm Between Groups
Within Groups
Total
5169.579
6 4630.719
69800.298
3
302
305
1723.193
214.009
8.052 .000
Hlp_cm Between Groups
Within Groups
Total
21 64.102
42743.064
44907.166
3
302
305
721.367
141.533
5.097 .002
Waist_Hip_ratio Between Groups
Within Groups
Total
.088
1.777
1.865
3
302
305
.029
.006
4.991 .002
SBP_rest Between Groups
Within Groups
Total
758.887
92871.624
93630.511
3
301
304
252.962
308.544
.820 .484
DBP_rest Between Groups
Within Groups
Total
74.979
32825.138
32900.118
3
302
305
24.993
108.693
.230 .876
Blocks_walked_day Between Groups
Within Groups
Total
885.343
28896.460
29781.804
3
322
325
295.114
89.741
3.289 .021
Stairs_climbed_day Between Groups
Within Groups
Total
198.747
5767.195
5965.942
3
272
275
66.249
21.203
3.1 25 .026
Blocks_flights_day Between Groups
Within Groups
Total
83514.656
1887967.395
1971482.051
3
269
272
27838.219
7018.466
3.966 .009

259
Table 3. Bonferroni Post Hoc Test for Subject Characteristics and VAPAQ by Berlin Risk Score
Muniple Compa r
sons
Bonferroni
Deoendent Variable I Berlin Risk Score (J) Berlin Risk Score
Mean Difference (1-
J)
Std. Error
Sig.
95% Confidence Interval
Lower Bound Upper Bound
Age .00 1 Category positive
2 Categoricpoitivc
3 Categories positive
-2.1 7401
.28780
.25926
2.1 3434
2.12184
2.2994 2
1.000
1.000
1.000
-7.8400
5.3450
-5. 8449
3.4919
5.0206
6.3634
1 Category positive 00
2 Categories positive
3 Categories positive
2.1 7401
2.461 82
2.43327
2.1 3434
1.06141
1.38266
1.000
.126
.476
-3. 4919
-.3559
-1.2372
7.8400
5.2795
6.1038
2 Categories positive 00
1 Category positive
3 Categories positive
-.28780
-2.461 82
-.02854
2.12184
1.06141
1.36328
1.000
.126
1.000
-5 9206
-5.2795
-3.6476
5.3450
3559
3.5905
3 Categories positive .00
1 Category positive
2 Categories positive
-.25926
-2.43327
.0285 4
2.299 42
1.38266
1.36328
1.000
.476
1.000
-6.3634
-6.1038
-3.5905
5.8449
1.2372
3.6476
AAA_size .00 1 Category positive
2 Categories positive
3 Categories positive
-.29199
-.35534
-.20735
.19832
.19669
.21 465
.852
.431
1.000
-. 8188
-. 8778
-.7775
.2348
.1671
.3628
1 Category positive 00
2 Categories positive
3 Categories positive
291 99
-.06335
08463
.19832
.09986
13174
.852
1.000
1.000
-.2348
-.3286
-.2653
8188
2019
4346
2 Categories positive 00
1 Category positive
3 Categories positive
35534
06335
14 798
.19669
.09986
.12929
.431
1.000
1.000
-.1671
-.2019
-. 195 4
8778
3286
.4914
3 Categories positive .00
1 Category positive
2 Categories positive
.20735
-.08 463
-.14798
.21465
.13174
.12929
1.000
1.000
1.000
-.3628
-.4346
-.4914
.7775
.2653
.1954
BMI .00 1 Category positive
2 Categories positive
3 Categories positive
-3.73662
-5.37687"
-8.0870 4
1.47662
1.46622
1.58822
.071
.002
.000
-7.6569
-9.2695
-12.3035
.1836
-1 .4842
-3.8705
1 Category positive 00
2 Categories positive
3 Categories positive
3.73662
-1 .64025
-4.35042_..
1.47662
.73930
95875
.071
.163
000
-.1836
-3. 6030
-6.8958
7.6569
3225
-1 .8051
2 Categories positive 00
1 Category positive
3 Categories positive
5.37687
1 .64025
-2.71017"
1.46622
.73930
.94265
.002
.163
.026
1.4842
-.3225
-5.2128
92695
3.6030
-.2076
3 Categories positive .00
1 Category positive
2 Categories positive
8.08704
4.35042"
2.71017"
1.58822
.95875
.94265
.000
.000
.026
3.8705
1.8051
.2076
12.3035
6.8958
5.2128
Waist_cm .00 1 Category positive
2 Categories positive
3 Categories positive
-8.62899
-1 2.222 48
-17.54758
3.71953
3.68436
4.01069
.126
.006
.000
-18.5071
-22. 0072
-28. 1990
1 .2492
-2.4377
-6.8962
1 Category positive 00
2 Categories positive
3 Categories positive
8.62899
-3.59349
-8.91 959"
3.71953
1.90543
2.4 7826
.126
.362
002
-1.2492
-8_6538
-15.5002
1 8.5071
1 .4668
-2.3369
2 Categories positive 00
1 Category positive
3 Categories positive
1 2.22248
3.59349
-5.32511
3.68436
1.90543
2.42515
.006
.362
.173
2.4377
-1.4668
-11.7657
22 0072
8.6538
1.1155
3 Categories positive .00
1 Category positive
2 Categories positive
17.54758
8.91859"
5.32511
4.01069
2.47826
2.42515
.000
.002
.173
6.8962
2.3369
-1.1155
28.1990
15.5002
11.7657
Hip_Cn"l 00 1 Category poitive
2 Categories positive
3 Categories positive
-a.aa1 2a -8.68400...
-11 .1 71 02..
3.02484
2.99623
3.26161
.317
.024
.004
-16.641 2
-19.8331
2.1!J20
-.7268
-2.5090
1 Category positive .00
2 Categories positive
3 Categories positive
5.88125
-2.80275
-5.28977
3. 02484
1.54955
2.01540
. 317
.429
.055
-2.1520
-6.9180
-10.6422
13.9145
1.3125
.0626
2 Categories positive .00
1 Category positive
3 Categories positive
8.68400
2.80275
-2.48702
2.99623
1.54955
1.97221
.024
.429
1.000
.7268
-1.31 25
-7.7247
16.6412
6.9180
2.7507
3 Categories positive 00
1 Category positive
2 Categories positive
11 .1 71 02
5.28977
2.48702
3.26161
2.01 54 0
1.97221
.004
.055
1.000
2. 5090
-.0626
-2.7507
19.8331
10.6422
7.724 7
Waist_Hip_ratio 00 1 Category positive
2 Categories positive
3 Categories positive
- 03065
-.04 209
-.071 as·
01950
.01932
. 02103
703
.181
. 005
-.0824
-.0934
-. 1269
0212
0092
- 0152
1 Category positive .00
2 Categories positive
3 Categories positive
.03065
-.01144
-.04040"
. 01950
.00999
.01300
.703
1.000
.012
-. 0212
-.0380
-.0749
.0824
.0151
-.0059
2 Categories positive .00
1 Category positive
3 Categories positive
.04209
.01144
- 02895
.01932
. 00999
.01272
.181
1.000
.141
-. 0092
-.01 51
-.0627
.0934
.0380
.0048
3 Categories positive 00
1 Category positive
2 Categories positive
071 05
0 4 040..
02895
.02103
.01300
01272
.005
.012
.141
.01 52
.0059
-.0048
1269
0749
0627
• .The mean difference 1s s1gmficant at the 0.05 level.

*.The mean difference 1s s1gmficant at the 0.051evel.
260
Table 3. Bonferroni Post Hoc Test for Subject Characteristics and VAPAQ by Berlin Risk
Score con't
Multiple Comparisons
Bonferroni
Deoendent Variable (I) Berlin R isk Score (J) Berlin Risk Score
Mean
Difference ( J)
Std.Error
Sig.
95% Confidence Interval
Lower Bound Upper Bound
SBP- rest _oo 1 Category positive
2 Categories positive
3 Categories positive
1.65859
4.18254
.44771
4.46612
4.42607
4.81572
1.000
1.000
1.000
-10.2026
-7.5722
-12.3419
13.5t98
15.9373
13.2374
1 Category postiive _oo 2 Categories positive
3 Categories positive
-1.65859
2.52395
-1.21087
4.46612
2.29210
2.97570
1.000
1.000
1.000
-13.5t 98
-3.5634
-9.1t38
10.2026
8.6t 13
6.6920
2 Categories positive _oo 1 Category positive
3 Categories positive
-4.18254
-2.52395
-3.73 4 83
4.42607
2.29210
2.91524
1.000
1.000
1.000
-15.9373
-8.6t 13
-1t.4772
7.5722
3.5634
4.0075
3 Categori es postiive _oo 1 Category positive
2 Categories positive
-_44771
1.21087
3.73 4 83
4.81572
2.97570
2.91524
1.000
1.000
1.000
-13.2374
-6.6920
-4.0075
12.3419
9.1t38
11.4772
DBP_rest _oo 1 Category positive
2 Categories positive
3 Categories positive
1.76970
1.19554
.67647
2.65077
2.62570
2.85827
1.000
1.000
1.000
-5.2701
-5.7777
-6_9t 44
8.8095
8.1688
8.2673
1 Category positive .00
2 Categories positive
3 Categories positive
-1.76970
-.57 416
-1.09323
2.65077
1.35792
1.76617
1.000
1.000
1.000
-8.8095
-4.1805
-5.7837
5.2701
3.0322
3.5973
2 Categories positive .00
1 Category positive
3 Categories positive
-1.19554
.57 416
-.51907
2.62570
1.35792
1.7283t
1.000
1.000
1.000
-8.1688
-3.0322
-5.1090
5.7777
4.1805
4.0709
3 Categories positive .00
1 Category positive
2 Categories positive
-.67647
t .09323
.51907
2.85827
t .76617
t .7283t
1.000
1.000
1.000
-8.2673
-3.5973
-4.0709
6.9t 44
5.7837
5.1090
Blocks_walked_day .00 1 Category positive
2 Categories positive
3 Categories positive
4.37 4 66
6.13033
7.14815
2.39317
2.37914
2.57826
.411
.063
.035
- t .9784
-.1855
.3037
10.7277
12.446t
13.9926
1 Category positive _oo 2 Categories positive
3 Categories positive
-4.37 4 66
1.75567
2.77349
2.39317
t .19013
1.55033
.411
.8 4 7
.44 7
-10.7277
- t.4037
- t .3421
t .9784
4.9t50
6.8891
2 Categories positive _oo 1 Category positive
3 Categories positive
-6.13033
-1.75567
1.01782
2.37914
1.19013
1.52860
.063
.8 4 7
1.000
-12.4461
- 4.9t 50
-3.0401
.1855
t .4037
5.0757
3 Categori es postiive _oo 1 Category positive
2 Categories positive
-7.14815
-2.77349
-1.01782
2.57826
1.55033
1.52860
_035
.44 7
1.000
-13.9926
-6.8891
-5.0757
-_3037
1.3421
3.0401
Stairs_climbed_day _oo 1 Category positive
2 Categories positive
3 Categories positive
-1.91827
-_47570
.27851
1.2126t
1.19650
1.29613
.689
1.000
1.000
-5.1410
-3.6556
-3.1662
1.3045
2.704 2
3.7232
1 Category positive _oo 2 Categories positive
3 Categories positive
1.91827
1.44 256
2.19678
1.21261
.63841
.80988
.689
.14 8
.0 4 3
- t .3045
-_2541
.0444
5.1410
3.1392
4.3492
2 Categories positive _oo 1 Category positive
3 Categories positive
.47570
-1.44 256
.754 21
1.19650
.63841
.78555
1.000
.14 8
1.000
- 2.704 2
- 3.1392
-1.3335
3.6556
.2541
2.8420
3 Categori es positive _oo 1 Category positive
2 Categories positive
-_27851
-2.19678
-.75 4 21
1.29613
.80988
.78555
1.000
.0 4 3
1.000
- 3.7232
- 4.3 492
- 2.8 420
3.1662
-_0444
1.3335
Blocks_fiights_day _oo 1 Category positive
2 Categories positive
3 Categories positive
24.48197
49.35294
62.10804
22 09793
21.78110
23.58145
1.000
.14 6
.054
-3 4.2524
-8.5393
-_5694
83.2163
107.2452
124.7855
1 Category positive .00
2 Categories positive
3 Categories positive
-24.48197
24.87097
37.62607
22.09793
11.70610
14.78856
1.000
.207
.069
-83.2163
-6.2428
- t.6806
34.2524
55.9848
76.9327
2 Categories positive .00
1 Category positive
3 Categories positive
-49.35294
-24.87097
12.75510
2t .78110
1t .70610
14.31082
.14 6
.207
1.000
-107.2452
-55.9848
-25.2818
8.5393
6.2428
50.7920
3 Categories positive .00
1 Category positive
2 Categories positive
-62.10804
-37.62607
-12.75510
23.58145
14.78856
14.31082
.054
.069
1.000
-124.7855
-76.9327
-50.7920
.5694
t.6806
25.2818

261
Table 4. Independent Samples Test for Cardiovascular and Metabolic Biomarkers by Clinical Berlin OSA Risk

262
Table 5. Analysis of Variance for Cardiovascular and Metabolic Biomarkers by Berlin Risk Score
ANOVA
Sum of
Squares
d'
Mean Square
F
Sig.
Glucose_fasting_serum Between Groups
Within Groups
Total
6805.932
199184.265
205990.197
3
280
283
2268.644
711.372
3.189 .024
lnsulin_fasting_serun Between Groups
Within Groups
Total
1996.539
55213.727
57210.266
3
272
275
665.513
202.992
3.279 .021
TC Between Groups
Within Groups
Total
5190.500
548621.888
553812.387
3
298
301
1730.167
1841.013
.940 .422
HDL Between Groups
Within Groups
Total
687.297
60197.687
00884.983
3
298
301
229.099
202.006
1.134 .335
LDL Between Groups
Within Groups
Total
6699.250
330955.747
337654.997
3
296
299
2233.083
1118.094
1.997 .114
TG Between Groups
Within Groups
Total
15736.537
650767.245
666503.782
3
290
293
5245.512
2244.025
2.338 .074

263
Table 6. Bonferroni Post Hoc Test for Cardiovascular and Metabolic Biomarkers by Berlin
Risk Score
Muhipl e Compa r sons
Bonferroni
DeoendentVariable I Berlin Risk Score J Berlin Risk Score
Mean Difference (1-
.J)
Std. Error
Sig.
95% Confidence I nterval
Lower Bound Upper Bound
Glucose_fasting_serum .00 1 Category positive
2 Categori es positive
3 Categor es positive
-18.337
-15.591
-23.190-
7.162
7.106
7.741
.066
.174
.01 8
-37.37
-34.47
-43.76
.70
3.29
-2.62
1 Category positive .00
2 Categori es positive
3 Categor es positive
18.337
2.745
-4.854
7.162
3.587
4.723
.066
1.000
1.000
-.70
-6.79
-17.40
37.37
1 2.28
7.70
2 Categories positive .00
1 Category positive
3 Categor es positive
15.591
-2.745
-7.599
7.106
3.587
4.636
.174
1.000
.614
-3.29
-12.28
-19.92
34.47
6.79
4.72
3 Categories positive .00
1 Category positive
2 Categori es positive
23.190
4.854
7.599
7.741
4.723
4.636
.01 8
1.000
614
2.62
-7.70
-4.72
43.76
1 7.40
19.92
lnsulin_fasting_serum .00 1 Category positive
2 Categori es positive
3 Categor es positive
-3.271
-5.929
-10.268
3.834
3.802
4.159
1.000
.720
.085
-13.46
-16.03
-21.32
6.92
4.17
.79
1 Category positive .00
2 Categori es positive
3 Categor es positive
3.271
-2.658
-6.997"
3.834
1.943
2.574
1.000
1.000
.042
-6.92
-7.82
-13.84
1 3.46
2.51
-.16
2 Categories positive .00
1 Category positive
3 Categori es positive
5.929
2.658
-4.339
3.802
1.943
2.526
.720
1.000
.522
- 4.17
- 2.51
-11.05
16.03
7.82
2.37
3 Categories positive .00
1 Category positive
2 Categor es positive
10.268
6.997"
4.339
4.159
2.574
2.526
.085
.042
.522
-.79
.16
-2.37
21.32
1 3.84
11.05
TC .00 1 Category positive
2 Categor es positive
3 Categori es positive
-2.77071
-7.16489
4.65193
10.9094 0
10.81696
11.82583
1.000
1.000
1.000
-31.7459
-35.8946
-26. 7573
26.2045
21.5648
36.0612
1 Category positive 00
2 Categori es positive
3 Categori es positive
2.77071
-4.3941 8
7.42263
10.90940
5.60933
7.36941
1.000
1.000
1.000
-26.2045
-19.2925
-12. 1504
31.7459
10.5041
26.9957
2 Categories positive .00
1 Category positive
3 Categori es positive
7.16489
4.3941 8
11 .81682
10.81696
5.60933
7.23186
1.000
1.000
.620
-21.5648
-10.5041
-7.3909
35.8946
19.2925
31.0245
3 Categories positive .00
1 Category positive
2 Categor es positive
-4.65193
-7.42263
-11 .81682
11.82583
7.36941
7.23186
1.000
1.000
.620
-36.0612
-26.9957
-31.0245
26.7573
12.1504
7.3909
HDL .00 1 Category positive
2 Categor es positive
3 Categori es positive
3.43737
5.05956
6.33107
3.61 372
3.58310
3.91 728
1.000
.954
643
-6.1606
-4.4571
-4.0732
13.0354
14.5762
16.7353
1 Category positive 00
2 Categori es positive
3 Categori es positive
-3.43737
1 .6221 8
2.89369
3.61372
1.85808
2.44110
1.000
1.000
1.000
-13.0354
-3.3129
-3.5898
6.1606
6.5572
9.3772
2 Categories positive .00
1 Category positive
3 Categori es positive
-5.05956
-1 .6221 8
1 .27151
3.58310
1.85808
2.39554
.954
1.000
1.000
-14.5762
-6.5572
-5.0910
4.4571
3.31 29
7.6340
3 Categories positive .00
1 Category positive
2 Categor es positive
-6.33107
-2.89369
-1 .27151
3.91 728
2.44110
2.39554
.643
1.000
1.000
-16.7353
-9.3772
-7.6340
4.0732
3.5898
5.0910
LDL .00 1 Category positive
2 Categori es positive
3 Categor es positive
-2.26249
-7.97111
5.43056
8.50729
8.42977
9.2 4175
1.000
1.000
1.000
-24.8588
-30.3615
-19.1165
20.3338
14.4193
29.9776
1 Category positive .00
2 Categor es positive
3 Categor es positive
2.26249
-5.70862
7.6930 4
8.50729
4.38206
5.79235
1.000
1.000
1.000
-20.3338
-17.34 79
-7. 6921
24.8588
5.9306
23.0782
2 Categories positive 00
1 Category positive
3 Categori es positive
7.97111
5.70862
13.40167
8.4 2977
4.38206
5.67788
1.000
1.000
.11 3
-14.4193
-5 9306
-1.6794
30.3615
17.34 79
28.4827
3 Categories positive .00
1 Category positive
2 Categor es positive
-5.43056
-7.69304
-13.40167
9.2 4175
5.79235
5.67788
1.000
1.000
.11 3
-29.9776
-23 0782
-28.4827
19.1165
7.6921
1.6794
TG .00 1 Category positive
2 Categor es positive
3 Categor es positive
-11 .99203
-19.02594
-29.27222
12.07634
11.96719
13.05620
1.000
.678
.154
-44.0726
-50.8165
-63.9558
20.0885
12.7647
5.4113
1 Category positive .00
2 Categor es positive
3 Categor es positive
11 .99203
-7.03391
-17.2801 9
12.07634
6.3020 4
8.18330
1.000
1.000
.213
-20 0885
-23.7751
-39.0190
44.0726
9.7073
4.4586
2 Categories positive 00
1 Category positive
3 Categori es positive
19.02594
7.03391
-10.24628
11.96719
6.3020 4
8.02135
678
1.000
1.000
-12. 7647
-9.7073
-31.5548
50.8165
23.7751
11.0623
3 Categories positive .00
1 Category positive
2 Categor es positive
29.27222
17.2801 9
10.24628
13.05620
8.18330
8.02135
.154
.21 3
1.000
-5.4113
-4.4586
-11.0623
63.9558
39.0190
31.5548
..... The mean difference 1s s1gmficant at the 0.05 level.

264
Chapter 4 Statistical Output Tables

265
Table 7. Independent Samples Test for Subject Characteristics by Clinical Berlin OSA Risk
Independent Sampl es Test
Levene's Test for Equality of
Variances
t-test for Equality of Means
F
Sig.
t
df
Sig. (2-tailed)
Mean
Difference
Std.Error
Difference
95% Confidence Interval of the
Difference
Lower Upper
Age Equalvariances
assumed
Equalvariances not
assumed
.158 .692 2.217
2.214
112
110.007
.029
.029
3.44630
3.44630
1.55419
1.55653
.36687
.36163
6.52572
6.53096
AAA_size Equalvariances
assumed
Equalvariances not
assumed
.033 .856 .591
.588
112
107.689
.556
.558
.09096
.09096
.15384
.15461
-.21385
-.21552
.39578
.39744
BMI Equalvariances
assumed
Equalvariances not
assumed
1.010 .317 -2.363
-2.332
111
96.428
.020
.022
-2.65796
-2.65796
1.12461
1.13996
-4.88644
-4.92063
-.42948
-.39529
Waist_cm Equalvariances
assumed
Equalvariances not
assumed
.308 .580 -2.989
-2.961
112
103.749
.003
.004
-7.43209
-7.43209
2.48669
2.51025
-12.35915
-12.41015
-2.50503
-2.45403
Hip_cm Equalvariances
assumed
Equalvariances not
assumed
.048 .828 -1.421
-1.425
112
111.707
.158
.157
-2.74167
-2.74167
1.92998
1.92434
-6.56567
-6.55462
1.08234
1.07128
Waist_Hip_ratio Equalvariances
assumed
Equalvariances not
assumed
2.500 .117 -4.183
-4.182
112
110.609
.000
.000
-.05369
-.05369
.01283
.01284
-.07911
-.07913
-.02826
-.02824
SBP_rest Equalvariances
assumed
Equalvariances not
assumed
.004 .952 -.943
-.943
112
110.682
.348
.348
-2.62963
-2.62963
2.78800
2.78841
-8.15370
-8.15523
2.89444
2.89597
DBP_rest Equalvariances
assumed
Equalvariances not
assumed
2.388 .125 -1.822
-1.802
112
102.161
.071
.074
-3.02778
-3.02778
1.66155
1.67987
-6.31993
-6.35973
.26437
.30418

266
Table 8. Analysis of Variance for Subject Characteristics by Berlin Risk Score
ANOVA
Sum of Squares
df
Mean Square
F
Sig.
Age Between Groups
Within Groups
Total
342.960
7683.505
8026.465
3
110
113
114.320
69.850
1.637 .185
AAA_size Between Groups
Within Groups
Total
1.928
73.642
75.570
3
110
113
.643
.669
.960 .414
BMI Between Groups
Within Groups
Total
297.999
3859.322
4157.321
3
109
112
99.333
35.407
2.805 .043
Waist_em Between Groups
Within Groups
Total
2467.514
18785.830
21253.344
3
110
113
822.505
170.780
4.816 .003
Hip_cm Between Groups
Within Groups
Total
640.258
11430.061
12070.319
3
110
113
213.419
103.910
2.054 .111
Waist_Hip_ratio Between Groups
Within Groups
Total
.093
.514
.606
3
110
113
.031
.005
6.618 .000
SBP_rest Between Groups
Within Groups
Total
484.580
24454.543
24939.123
3
110
113
161.527
222.314
.727 .538
DBP_rest Between Groups
Within Groups
Total
372.249
8676.216
9048.465
3
110
113
124.083
78.875
1.573 .200

267
Table 9. Bonferroni Post Hoc Tests for Subject Characteristics by Berlin Risk Score
Multiple Comparisons
Bonferroni
Deoendent Variable II Berlin Risk Score !J\ Berlin Risk Score
Mean Difference (1-
J)
Std.Error
Sig.
95% Confidence Interval
Lower Bound
Upper Bound
Age .00 1.00
2.00
3.00
-.83007
2.71274
2.82906
3.02171
3.07649
3.62411
1.000
1.000
1.000
-8.9488
-5.5532
-6.9082
7.2887
10.9787
12.5664
1.00 .00
2.00
3.00
.83007
3.54280
3.65913
3.02171
1.75307
2.59667
1.000
.274
.970
-7.2887
-1.1674
-3.3176
8.9488
8.2530
10.6359
2.00 .00
1.00
3.00
-2.71274
-3.54280
.11632
3.07649
1.75307
2.66021
1.000
.274
1.000
-10.9787
-8.2530
-7.0312
5.5532
1.1674
7.2638
3.00 .00
1.00
2.00
-2.82906
-3.65913
-.11632
3.62411
2.59667
2.66021
1.000
.970
1.000
-12.5664
-10.6359
-7.2638
6.9082
3.3176
7.0312
AAA_size .00 1.00
2.00
3.00
-.45516
-.32108
-.21658
.29583
.30119
.35480
.761
1.000
1.000
-1.2500
-1.1303
-1.1699
.3397
.4882
.7367
1.00 .00
2.00
3.00
.45516
.13408
.23858
.29583
.17163
.25421
.761
1.000
1.000
-.3397
-.3270
-.4444
1.2500
.5952
.9216
2.00 .00
1.00
3.00
.32108
-.13408
.10450
.30119
.17163
.26044
1.000
1.000
1.000
-.4882
-.5952
-.5952
1.1303
.3270
.8042
3.00 .00
1.00
2.00
.21658
-.23858
-.10450
.35480
.25421
.26044
1.000
1.000
1.000
-.7367
-.9216
-.8042
1.1699
.4444
.5952
BMI .00 1.00
2.00
3.00
-3.53782
-5.51588
-6.09838
2.15458
2.19035
2.58024
.621
.079
.119
-9.3277
-11.4019
-13.0322
2.2521
.3702
.8354
1.00 .00
2.00
3.00
3.53782
-1.97806
-2.56055
2.15458
1.25368
1.85249
.621
.705
1.000
-2.2521
-5.3470
-7.5387
9.3277
1.3909
2.4176
2.00 .00
1.00
3.00
5.51588
1.97806
-.58250
2.19035
1.25368
1.89398
.079
.705
1.000
-.3702
-1.3909
-5.6721
11.4019
5.3470
4.5071
3.00 .00
1.00
2.00
6.09838
2.56055
.58250
2.58024
1.85249
1.89398
.119
1.000
1.000
-.8354
-2.4176
-4.5071
13.0322
7.5387
5.6721
Waist_cm .00 1.00
2.00
3.00
-9.98818
-15.03350
-18.72436
4.72485
4.81050
5.66679
.221
.014
.008
-22.6829
-27.9584
-33.9499
2.7066
-2.1086
-3.4988
1.00 .00
2.00
3.00
998818
-5.04532
-8.73618
4.72485
2.74117
4.06024
.221
.410
.202
-2.7066
-12.4103
-19.6453
22.6829
2.3197
2.1729
2.00 .00
1.00
3.00
15.03350
5.04532
-3.69086
4.81050
2.74117
4.15961
.014
.410
1.000
2.1086
-2.3197
-14.8669
27.9584
12.4103
7.4852
3.00 .00
1.00
2.00
18.72436
8.73618
3.69086
5.66679
4.06024
4.15961
.008
.202
1.000
3.4988
-2.1729
-7.4852
33.9499
19.6453
14.8669
*.The mean difference 1s s1gmficant at the 0.05 level.
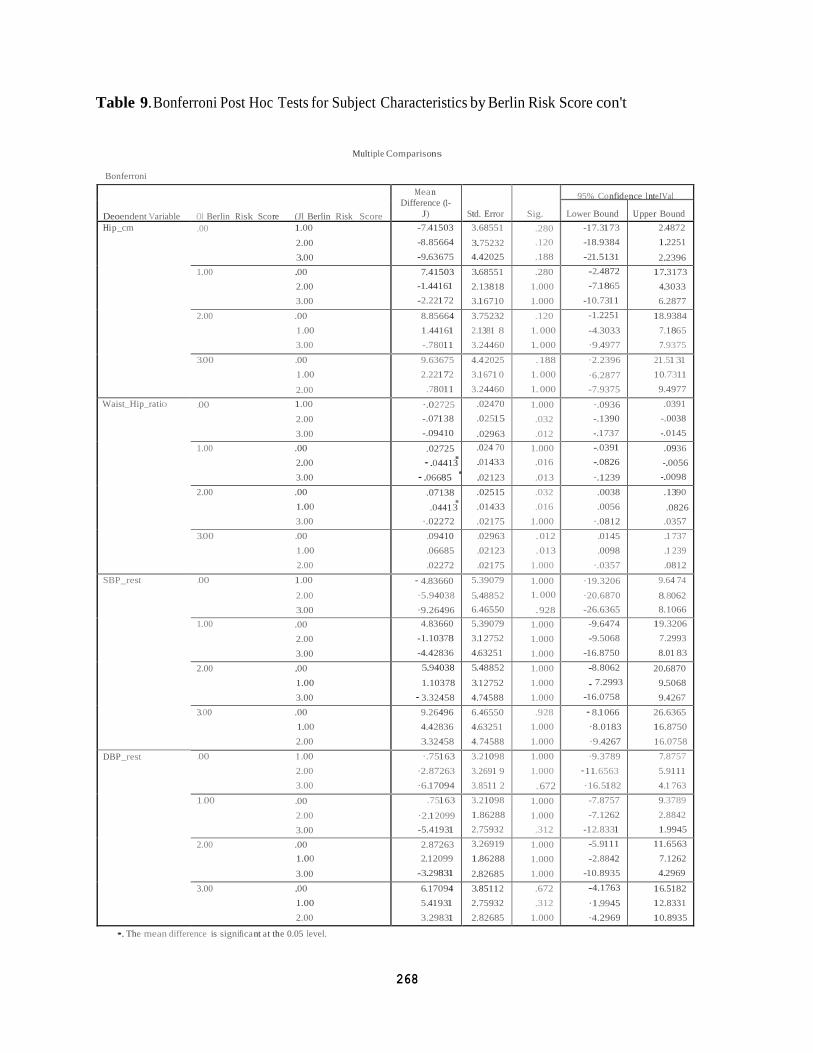
268
Deoendent Variable Ol Berlin Risk Score (Jl Berlin Risk Score
Mea n
Difference (1-
J)
Std. Error
Sig.
95% Confidence l nteJVal
Lower Bound
U pper Bound
Hi p_cm .00 1.00
2.00
3.00
-7.41503
-8.85664
-9.63675
3.68551
3.75232
4.42025
.280
.120
.188
-17.3173
-18.9384
-21.5131
2.4872
1.2251
2.2396
1.00 .00
2.00
3.00
7.41503
-1.44161
-2.22172
3.68551
2.13818
3.16710
.280
1.000
1.000
-2.4872
-7.1865
-10.7311
17.3173
4.3033
6.2877
2.00 .00
1 .00
3.00
8.85664
1.44161
-.78011
3.75232
2.1381 8
3.24460
.120
1.000
1.000
-1.2251
-4.3033
·9.4977
18.9384
7.1865
7.9375
3.00 .00
1 .00
2.00
9.63675
2.22172
.78011
4.4 2025
3.1 671 0
3.24460
.188
1.000
1.000
·2.2396
·6.2877
-7.9375
21 .51 31
1 0.7311
9.4977
Waist_Hip_ratio .00 1.00
2.00
3.00
·.02725
-.07138
-.09410
.02470
.02515
.02963
1.000
.032
.012
·.0936
-.1390
-.1737
.0391
-.0038
-.0145
1.00 .00
2.00
3.00
.02725.
·.06685
.024 70
.01433
.02123
1.000
.016
.013
-.0391
-.0826
·.1239
.0936
-.0098
2.00 .00
1.00
3.00
.07138.
·.02272
.02515
.01433
.02175
.032
.016
1.000
.0038
.0056
·.0812
.1390
.0357
3.00 .00
1 .00
2.00
.09410
.06685
.02272
.02963
.02123
.02175
.012
.013
1.000
.0145
.0098
·.0357
.1 737
.1 239
.0812
SBP_rest .00 1.00
2.00
3.00
·4.83660
·5.94038
·9.26496
5.39079
5.48852
6.46550
1.000
1.000
.928
·19.3206
·20.6870
-26.6365
9.64 74
8.8062
8.1066
1.00 .00
2.00
3.00
4.83660
-1.10378
-4.42836
5.39079
3.12752
4.63251
1.000
1.000
1.000
-9.6474
-9.5068
-16.8750
19.3206
7.2993
8.01 83
2.00 .00
1.00
3.00
5.94038
1.10378
·3.32458
5.48852
3.12752
4.74588
1.000
1.000
1.000
-8.8062
. 7.2993
-16.0758
20.6870
9.5068
9.4267
3.00 .00
1.00
2.00
9.26496
4.42836
3.32458
6.46550
4.63251
4.74588
.928
1.000
1.000
·8.1066
·8.0183
·9.4267
26.6365
16.8750
1 6.0758
DBP_rest .00 1 .00
2.00
3.00
·.75163
·2.87263
·6.17094
3.21098
3.2691 9
3.8511 2
1.000
1.000
.672
·9.3789
·11.6563
·16.5182
7.8757
5.9111
4.1 763
1.00 .00
2.00
3.00
.75163
·2.12099
-5.41931
3.21098
1.86288
2.75932
1.000
1.000
.312
-7.8757
-7.1262
-12.8331
9.3789
2.8842
1.9945
2.00 .00
1.00
3.00
2.87263
2.12099
-3.29831
3.26919
1.86288
2.82685
1.000
1.000
1.000
-5.9111
-2.8842
-10.8935
11.6563
7.1262
4.2969
3.00 .00
1.00
2.00
6.17094
5.41931
3.29831
3.85112
2.75932
2.82685
.672
.312
1.000
-4.1763
·1.9945
·4.2969
16.5182
12.8331
10.8935
Table 9. Bonferroni Post Hoc Tests for Subject Characteristics by Berlin Risk Score con't
Multiple Comparisons
Bonferroni
·.04413.
-.0056
.04413 .0826
•. The mean difference is significa nt at the 0.05 level.

269
Table 10. Independent Samples Test for CPET Variables at Rest and the Ventilatory Threshold by Clinical Berlin OSA Risk
Independent Sampl es Test
Levene's Test for Equality of
Variances
t-test for Equality of Means
F
Sig.
t
df
Sig.(2-tailed)
Mean
Difference
Std. Error
Difference
95% Confidence Interval of the
Difference
Lower Upper
HR_sup Equalvariances
assumed
Equalvariances not
assumed
.004 .948 .369
.371
110
109.479
.713
.711
.75769
.75769
2.05117
2.04006
-3.30726
-3.28545
4.82264
4.80083
SBP_sup Equalvariances
assumed
Equalvariances not
assumed
.000 .998 -1.076
-1.074
109
105.475
.284
.285
-3.01471
-3.01471
2.80291
2.80720
-8.56998
-8.58057
2.54057
2.55116
DBP_sup Equalvariances
assumed
Equalvariances not
assumed
.001 .974 -1.632
-1.630
109
105.523
.106
.106
-2.63039
-2.63039
1.61162
1.61392
-5.82458
-5.83031
.56379
.56953
HR_vt Equalvariances
assumed
Equalvariances not
assumed
.000 .993 .971
.970
80
79034
.335
.335
4.03399
4 03399
4.15530
4.15770
-4.23532
-4.24164
12.30330
12.30962
V02mlkg_vt Equalvariances
assumed
Equalvariances not
assumed
.012 .913 .571
.572
104
103.914
.569
.569
.44311
.44311
.77633
.77535
-1.09639
-1.09444
1.98261
1.98067
RER_vt Equalvariances
assumed
Equalvariances not
assumed
.243 .623 1.027
1.027
104
103.695
.307
.307
.02055
.02055
.02001
.02002
-.01913
-.01915
.06023
.06024

270
Table 11. Independent Samples Test for CPET Variables at Peak Exercise and Recovery by Clinical Berlin OSA Risk
Independent Sampl es Test
Levene's Test for Equality of
Variances
t-test for Equality of Means
F
Sig.
t
df
Sig.(2-tailed)
Mean
Difference
Std.Error
Difference
95% Confidence Interval of the
Difference
Lower Upper
HR_max Equalvariances
assumed
Equalvariances not
assumed
1.503 .223 1.342
1.349
108
107.999
.183
.180
5.78183
5.78183
4.30975
4.28446
-2.76084
-2.71071
14.32450
14.27437
SBP_max Equalvariances
assumed
Equalvariances not
assumed
2.455 .120 -1.542
-1.528
109
101.595
.126
.130
-8.01760
-8.01760
5.20042
5.24830
-18.32467
-18.42808
2.28947
2.39288
DPB_max
Equalvariances
assumed
Equalvariances not
assumed
.244 .622 -1.659
-1.646
109
102.225
.100
.103
-4.17080
-4.17080
2.51339
2.53447
-9.15225
-9.19777
.81066
.85618
V02mlkg_max Equalvariances
assumed
Equalvariances not
assumed
.590 .444 .074
.075
106
105.417
.941
.941
.09636
.09636
1.30401
1.29055
-2.48897
-2.46244
2.68168
2.65516
RER_max Equalvariances
assumed
Equalvariances not
assumed
.026 .872 -.364
-.375
108
99.369
.717
.708
-.00994
-.00994
.02732
.02647
-.06409
-.06246
.04422
.04259
HRR1 Equalvariances
assumed
Equalvariances not
assumed
.310 .579 1.487
1.489
106
105.707
.140
.140
6.11813
6.11813
4.11327
4.10986
-2.03682
-2.03032
14.27309
14.26658
SBP_reef Equalvariances
assumed
Equalvariances not
assumed
.010 .919 -1.459
-1.456
104
102.661
.148
.148
-7.69160
-7.69160
5.27343
5.28109
-18.14900
-18.16580
2.76581
2.78261
LastYearRecPA Equalvariances
assumed
Equalvariances not
assumed
2.762 .099 1.257
1.294
107
96.648
.211
.199
285.69699
285.69699
227.28189
220.81928
-164.86286
-152.58833
736.25684
723.98231

271
Table 12. Analysis of Variance for CPET Variables at Rest and the Ventilatory Threshold by Berlin Risk Score

272
Table 13. Bonferroni Post Hoc Tests for CPET Variables at Rest and the Ventilatory
Threshold by Berlin Risk Score
Muniple Cornpar-i ons
Bonferroni
Deoe ndent Variable rn Berlin Risk Score J Be r in Risk Score
Mean Difference (1-
J)
Std. Error
Sig.
95% Confidence Interval
Lower Bound Upper Bound
HR_sup .00 1. 00
2.00
3.00
.02614
.19658
2.52991
3.94 211
4.03206
4. 72800
1.000
1.000
1.000
-10.5692
-10.64 05
-10.1777
1 0.6214
11. 0336
1 5.2375
1. 00 00
2.00
3.00
-.0261 4
.17044
2.50377
3.94 211
2.31 933
3.38760
1.000
1.000
1.000
-10.621 4
- 6.0633
- 6. 6012
1 0.5692
6.4 042
11. 6087
2 00 00
1 .00
3.00
-.19658
-.17044
2.33333
4.03206
2.31 933
3.49186
1.000
1.000
1.000
-11.0336
- 6.40 4 2
- 7.0518
1 0.6405
6.0633
11 .7185
3.00 00
1 .00
2.00
-2.52991
-2.50377
-2.33333
4. 72800
3.38760
3.49186
1.000
1.000
1.000
-15.2375
-11.6087
-11.7185
1 0.1777
6.6012
7.0518
S BP_ sup 00 1.00
2.00
3.00
-6.764 71
-8.23077
-1 0.50000
5.32 492
5.4 464 1
6.4944 3
1.000
.802
.653
-21.0791
-22.8718
- 27.9583
7.5497
6.4102
6.9583
1.00 .00
2.00
3.00
6.764 71
-1 .46606
-3.73529
5.32 492
3.1 3291
4. 72539
1.000
1.000
1.000
- 7.5497
- 9.8879
-16.4381
21 .0791
6.9558
8.9675
2.00 .00
1 .00
3.00
8.23077
1 .46606
-2.26923
5.4464 1
3.1 3291
4.86190
.802
1.000
1.000
- 6.4102
- 6.9558
-15.3389
22.871 a 9.8879
1 0.8005
3.00 00
1 .00
2.00
1 0.50000
3.73529
2.26923
6.4944 3
4. 72539
4.86190
.653
1.000
1.000
- 6.9583
- 8.9675
-10.8005
27.9583
1 6.4381
15.3389
DBP_sup 00 1.00
2.00
3.00
2.594 77
29915
-2.77778
3 06033
3.1 3016
3.732 4 8
1.000
1.000
1.000
- 5 6320
- 8.1153
-12.811 4
1 0.8215
8.7136
7.2558
1.00 00
2.00
3.00
-2.594 77
-2.29563
-5.37255
3 06033
1.80054
2. 71578
1.000
1.000
.303
-10.8215
- 7.1358
-12.6731
5.6320
2.5446
1 .9280
2.00 00
1.00
3.00
-.29915
2.29563
-3.07692
3.1 3016
1.80054
2. 794 23
1.000
1.000
1.000
- 8.7136
- 2.544 6
-10.5883
8.1153
7.1358
4.4345
3.00 .00
1.00
2.00
2.77778
5.37255
3.07692
3. 732 4 8
2.71 578
2.794 23
1.000
.303
1.000
- 7.2558
-1.9280
- 4. 43 4 5
12.8114
1 2.6731
1 0.5883
HR_vt .00 1 .00
2.00
3.00
1 5.3684 2
1 8.25000
1 6 00000
8.8781a 9.06065
10 06572
.52 4
.285
696
- 8.6667
- 6.2791
-11.2500
39.4 035
4 2.7791
43.2500
1.00 00
2.00
3.00
-1 5.3684 2
2.881 58
631 58
8.87818
4.64801
6.38964
.52 4
1.000
1.000
-39.4035
- 9.7016
-16.6665
8.6667
1 5.4647
17.9297
2 00 00
1.00
3.00
-1 8.25000
-2.881 58
-2.25000
9.06065
4.64801
6.64 084
285
1.000
1.000
-4 2.7791
-15.46 4 7
-20.2282
6.2791
9.7016
1 5.7282
3.00 00
1 .00
2.00
-1 6.00000
.63158
2.25000
10.06572
6.38064
6.64 084
.696
1.000
1.000
-4 3.2500
17.0207
-15.7282
11 .2500
1 6.6665
20.2282
V02mlkg_vt 00 1.00
2.00
3.00
2.66249
2.97451
2.11835
1.60963
1.63089
1.86260
607
.427
1.000
-1.6685
-1.4137
- 2.8933
6.9935
7.3627
7.1300
1.00 .00
2.00
3.00
-2.66249
31201
-.54 41 4
1.60963
86059
1.2 4503
.607
1.000
1.000
- 6.9935
- 2 0036
- 3.89 4 1
1 .6685
26276
2.8059
2.00 .00
1.00
3.00
-2.97451
-.31201
-.85615
1.63089
.86059
1.272 4 0
.427
1.000
1.000
- 7.3627
- 2.6276
- 4.2798
1 .4137
2.0036
25675
3.00 00
1 .00
2.00
-2.11835
.5441 4
85615
1.86260
1. 2 4503
1. 272 4 0
1.000
1.000
1.000
- 7.1300
- 2.8059
- 2.5675
2.8933
3.8941
4.2798
RER_vt 00 1.00
2.00
3.00
0754 7
09040
.07374
0 414 1
.0 4196
.0 4 792
4 28
.201
.762
-.0360
-.0225
-.0552
1869
.2033
.2027
1.00 00
2.00
3.00
-.0754 7
01493
-.00173
.0 414 1
02214
.03203
.428
1.000
1.000
-.1869
-.044 6
-.0879
.0360
.0745
.0845
2 00 00
1.00
3.00
- 09040
-.01493
-.01667
0 4196
.02214
.03274
201
1.000
1.000
- 2033
-.07 4 5
-.10 48
0225
.0446
.0714
3.00 00
1.00
2.00
-.07374
00173
01667
.0 4 792
03203
.03274
.762
1.000
1.000
-.2027
-.08 4 5
-.071 4
.0552
0879
.1 048

273
Table 14. Analysis of Variance for CPET Variables at Peak Exercise and Recovery
by Berlin Risk Score
ANOVA
Sum of Squares
df
Mean Square
F
Sig.
HR_max Between Groups
Within Groups
Total
4437.803
51479.188
55916.991
3
106
109
1479.268
485.653
3.046 .032
SBP_max Between Groups
Within Groups
Total
2553.203
80700.761
83253.964
3
107
110
851.068
754.213
1.128 .341
DPB_max Between Groups
Within Groups
Total
668.345
18844.214
19512.559
3
107
110
222.782
176.114
1.265 .290
V02mlkg_max Between Groups
Within Groups
Total
116.615
4735.279
4851.894
3
104
107
38.872
45.532
.854 .468
RER_max Between Groups
Within Groups
Total
.006
2.202
2.208
3
106
109
.002
.021
.091 .965
HRR1 Between Groups
Within Groups
Total
1593.854
47771.109
49364.963
3
104
107
531.285
459.338
1.157 .330
SBP_reef Between Groups
Within Groups
Total
5687.349
72494.274
78181.623
3
102
105
1895.783
710.728
2.667 .052
LastYearRecPA Between Groups
Within Groups
Total
11130872.42
141082058.3
152212930.8
3
105
108
3710290.807
1343638.651
2.761 .046

274
Deoendent Varia ble m Berlin Risk Score (J ) Berlin Risk Score
Mea n Difference (1-
J)
Std. Error
Sig.
95% Confidence Interval
Lower Bound
U pper Bound
HR_max .00 1.00
2.00
3.00
21.50113.
23.35043
7.99204
8.14948
9.55611
.050
.023
.097
.0132
2.2340
-2.3428
42.9891
49.0437
1.00 .00
2.00
3.00
-21.50113
2.64417
1.84929
7.99204
4.72905
6.87526
.050
1.000
1.000
-42.9891
-10.0707
-16.6360
-.0132
15.3590
20.3346
2.00 .00
1.00
3.00
-24.14530
-2.64417
-.79487
8.14948
4.72905
7.05766
.023
1.000
1.000
-46.0566
-15.3590
-19.7706
-2.2340
10.0707
18.1809
3.00 .00
1.00
2.00
-23.35043
-1.84929
.79487
9.55611
6.87526
7.05766
.097
1.000
1.000
-49 0437
-20.3346
-18.1809
2.3428
16.6360
19.7706
SBP_max .00 1.00
2.00
3.00
7.46889
-.18803
-6.18803
9.94413
10.15580
11.90873
1.000
1.000
1.000
-19.2629
-27.4888
-38.2010
34.2006
27.1127
25.8249
1.00 .00
2.00
3.00
-7.46889
-7.65692
-13.65692
9.94413
5.86712
8.54989
1.000
1.000
.679
-34.2006
-23.4289
-36.6407
19.2629
8.1150
9.3268
2.00 .00
1.00
3.00
.18803
7.65692
-6.00000
10.15580
5.86712
8.79518
1.000
1.000
1.000
-27.1127
-8.1150
-29.6431
27.4888
23.4289
17.6431
3.00 .00
1.00
2.00
6.18803
13.65692
6.00000
11.90873
8.54989
8.79518
1.000
.679
1.000
-25.8249
-9.3268
-17.6431
38.2010
36.6407
29.6431
DPB_max .00 1.00
2.00
3.00
4.87111
.16239
-.65812
4.80526
4.90754
5.75461
1.000
1.000
1.000
-8.0464
-13.0300
-16.1276
17.7886
13.3548
14.8114
1.00 .00
2.00
3.00
-4.87111
-4.70872
-5.52923
4.80526
2.83514
4.13153
1.000
.598
1.000
-17.7886
-12.3301
-16.6356
8.0464
2.9127
5.5771
2.00 .00
1.00
3.00
-.16239
4.70872
-.82051
4.90754
2.83514
4.25006
1.000
.598
1.000
-13.3548
-2.9127
-12.2455
13.0300
12.3301
10.6045
3.00 .00
1.00
2.00
.65812
5.52923
.82051
5.75461
4.13153
4.25006
1.000
1.000
1.000
-14.8114
-5.5771
-10.6045
16.1276
16.6356
12.2455
V02mlkg_max .00 1.00
2.00
3.00
4.07564
3.48046
3.94933
2.57306
2.62481
3.03214
.697
1.000
1.000
-2.8450
-3.5794
-4.2061
10.9963
10.5403
12.1048
1.00 .00
2.00
3.00
-4.07564
-.59518
-.12631
2.57306
1.45857
2.10515
.697
1.000
1.000
-10.9963
-4.5182
-5.7884
2.8450
3.3279
5.5358
2.00 .00
1.00
3.00
-3.48046
.59518
.46887
2.62481
1.45857
2.16809
1.000
1.000
1.000
-10.5403
-3.3279
-5.3626
3.5794
4.5182
6.3003
3.00 .00
1.00
2.00
-3.94933
.12631
-.46887
3.03214
2.10515
2.16809
1.000
1.000
1.000
-12.1048
-5.5358
-6.3003
4.2061
5.7884
5.3626
Table 15. Bonferroni Post Hoc Test for CPET Variables at Peak Exercise and Recovery
by Berlin Risk Score
Multiple Comparisons
Bonferroni
24.14530 46.0566
*.The mea n d ifference is significa nt at the 0.05 1evel.
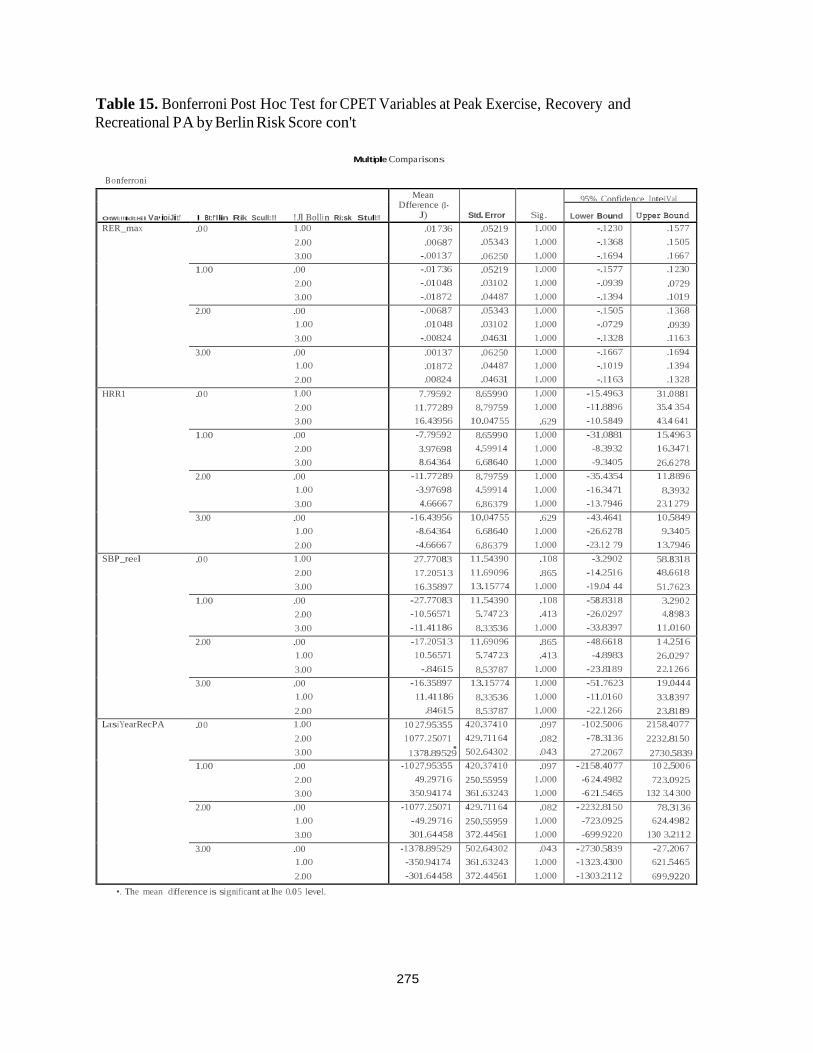
275
OtWI:!!IIdt:Hil Va• ioiJit:!' I Bt:!'llin Rik Scull:!! !Jl Bolli n Ri:sk Stull:!!
Mean Difference (1-
J)
Std. Error
Sig.
95% Confidence lnteiVal
Lower Bound
Upper Bound
RER_max .0 0 1.00
2.00
3.00
.01 736
.00687
-.00137
.05219
.05343
.06250
1.000
1.000
1.000
-.1230
-.1368
-.1694
.1 577
.1 505
.1 66 7
1.00 .00
2.00
3.00
-.01 736
-.01048
-.01872
.05219
.03102
.04487
1.000
1.000
1.000
-.1577
-.0939
-.1394
.1 230
.0729
.1019
2.00 .00
1.00
3.00
-.00687
.01048
-.00824
.05343
.03102
.04631
1.000
1.000
1.000
-.1505
-.0729
-.1328
.1 368
.0939
.116 3
3.00 .00
1.00
2.00
.00137
.01872
.00824
.06250
.04487
.04631
1.000
1.000
1.000
-.1667
-.1019
-.1163
.1 694
.1 394
.1 328
HRR1 .0 0 1.00
2.00
3.00
7.79592
11.77289
16.43956
8.65990
8.79759
10.04755
1.000
1.000
.629
-15.4963
-11.8896
-10.5849
31.0881
35.4 354
4 3.4 641
1.00 .00
2.00
3.00
-7.79592
3.97698
8.64364
8.65990
4.59914
6.68640
1.000
1.000
1.000
-31.0881
-8.3932
-9.3405
15.496 3
16.3471
26.6 278
2.00 .00
1.00
3.00
-11.77289
-3.97698
4.6666 7
8.79759
4.59914
6.86379
1.000
1.000
1.000
-35.4354
-16.34 71
-13.7946
11.8896
8.3932
2 3.1 279
3.00 .00
1.00
2.00
-16.43956
-8.64364
-4.6666 7
10.04755
6.68640
6.86379
.629
1.000
1.000
- 43.4641
-26.62 78
-23.12 79
10.5849
9.3405
13.7946
SBP_reel .0 0 1.00
2.00
3.00
27.77083
17.20513
16.35897
11.54390
11.69096
13.15774
.108
.865
1.000
-3.2902
-14.2516
-19.04 44
58.8318
48.6618
51.7623
1.00 .00
2.00
3.00
-27.77083
-10.56571
-11.41186
11.54390
5.747 23
8.33536
.108
.413
1.000
-58.8318
-26.0297
-33.8397
3.290 2
4.8983
11.0160
2.00 .00
1.00
3.00
-17.20513
10.56571
-.84615
11.69096
5.747 23
8.53787
.865
.413
1.000
- 48.6618
-4.8983
-23.8189
1 4.2516
26.029 7
2 2.1 266
3.00 .00
1.00
2.00
-16.35897
11.41186
.84615
13.15774
8.33536
8.53787
1.000
1.000
1.000
-51.7623
-11.0160
-22.1266
19.044 4
33.8397
2 3.8189
LasiYearRecPA .0 0 1.00
2.00
3.00
10 27.95355
1077.25071. 420.37410
429.711 64
502.64302
.097
.082
.043
-102.5006
-78.3136
27.2067
2158.4077
2232.8150
1.00 .00
2.00
3.00
-10 27.95355
49.29 716
350.94174
420.37410
250.55959
361.63243
.097
1.000
1.000
- 2158.40 77
-6 24.4982
-6 21.5465
10 2.500 6
72 3.0925
132 3.4 300
2.00 .00
1.00
3.00
-1077.25071
- 49.29 716
301.64 458
429.711 64
250.55959
372.44561
.082
1.000
1.000
- 2232.8150
-723.0925
-699.9220
78.3136
624.4982
130 3.2112
3.00 .00
1.00
2.00
-1378.89529
-350.94174
-301.64 458
502.64302
361.63243
372.44561
.043
1.000
1.000
- 2730.5839
-1323.4300
-1303.2112
-2 7.206 7
621.5465
699.9220
Table 15. Bonferroni Post Hoc Test for CPET Variables at Peak Exercise, Recovery and
Recreational PA by Berlin Risk Score con't
Multiple Comparisons
B onferroni
1378.89529 2730.5839
•. The mean difference is significant at lhe 0.05 level.

276
REFERENCES 1. Myers, J., et al., Comparison of the ramp versus standard exercise protocols. J Am Coll
Cardiol, 1991. 17(6): p. 1334-42.
2. Prescription, A.s.G.f.E.T.a., ACSM’s Guidelines for Exercise Testing and Prescription.
8th ed. ed2009, Baltimore, MD: Lippincott Williams & Wilkins.
3. Ahmadi, N., et al., The Berlin questionnaire for sleep apnea in a sleep clinic population:
relationship to polysomnographic measurement of respiratory disturbance. Sleep Breath,
2008. 12(1): p. 39-45.
4. Netzer, N.C., et al., Using the Berlin Questionnaire to identify patients at risk for the
sleep apnea syndrome. Ann Intern Med, 1999. 131(7): p. 485-91.
5. Weinreich, G., et al., [Is the Berlin questionnaire an appropriate diagnostic tool for sleep
medicine in pneumological rehabilitation?]. Pneumologie, 2006. 60(12): p. 737-42.
6. Sharma, S.K., et al., Validation of the modified Berlin questionnaire to identify patients at
risk for the obstructive sleep apnoea syndrome. Indian J Med Res, 2006. 124(3): p. 281-
90.
7. The sixth report of the Joint National Committee on prevention, detection, evaluation,
and treatment of high blood pressure. Arch Intern Med, 1997. 157(21): p. 2413-46.
8. Paffenbarger, R.S., Jr., et al., Physical activity, all-cause mortality, and longevity of
college alumni. N Engl J Med, 1986. 314(10): p. 605-13.
9. Ainsworth, B.E., et al., Compendium of physical activities: classification of energy costs
of human physical activities. Med Sci Sports Exerc, 1993. 25(1): p. 71-80.
10. Bassett, D.R., et al., Energy cost of stair climbing and descending on the college alumnus
questionnaire. Med Sci Sports Exerc, 1997. 29(9): p. 1250-4.
11. Myers, J., et al., Fitness versus physical activity patterns in predicting mortality in men.
Am J Med, 2004. 117(12): p. 912-8.
12. Myers, J.N., et al., Effects of exercise training in patients with abdominal aortic
aneurysm: preliminary results from a randomized trial. J Cardiopulm Rehabil Prev,
2010. 30(6): p. 374-83.

277
13. Grundy, S.M., et al., Definition of metabolic syndrome: report of the National Heart,
Lung, and Blood Institute/American Heart Association conference on scientific issues
related to definition. Arterioscler Thromb Vasc Biol, 2004. 24(2): p. e13-8.
14. Borg, G., Borg’s Perceived Exertion Scales1998, Champaign, IL: Human Kinetics
Publishers.
15. Arena, R., et al., Maximal aerobic capacity and the oxygen uptake efficiency slope as
predictors of large artery stiffness in apparently healthy subjects. J Cardiopulm Rehabil
Prev, 2009. 29(4): p. 248-54.
16. Shue P, F.V., EXTRA: an expert system for exercise test reporting. J Non-Invas Test.,
1998. II-4: p. 21-27.