Embed Size (px)
Citation preview

OCAS-RPT-002 Revision 0
Dose Reconstruction Exposure Matrix for Radiation Exposure Compensation Act (RECA) Section 5 Claims D. Allen J. Guido May 2009 Approval: ______________________________________________ J.W. Neton, Associate Director for Science National Institute for Occupational Safety and Health (NIOSH) Office of Compensation Analysis and Support (OCAS) 4676 Columbia Parkway Cincinnati, Ohio 45526

TABLE OF CONTENTS
1. INTRODUCTION ....................................................................................................... 4
2. APPLICABILITY........................................................................................................ 5
3. MEDICAL X-RAYS ................................................................................................... 5
4. MINERS ...................................................................................................................... 5 4.1 Literature Review.................................................................................................... 5 4.2 Internal Exposure Matrix ........................................................................................ 6 4.3 Radon Exposure ...................................................................................................... 8 4.4 External Exposure Matrix ....................................................................................... 9
4.4.1 Penetrating Radiation.................................................................................. 9 4.4.2 Non-Penetrating Radiation........................................................................ 10
5. MILLERS .................................................................................................................. 11 5.1 Literature Review.................................................................................................. 11 5.2 Internal Exposure Matrix ...................................................................................... 13
5.2.1 Temporal Adjustment ............................................................................... 15 5.3 Radon Exposure Matrix ........................................................................................ 17 5.4 External Exposure Matrix ..................................................................................... 18
6. ORE TRANSPORTERS............................................................................................ 21 6.1 Literature Review.................................................................................................. 21 6.2 Internal Exposure Matrix ...................................................................................... 21 6.3 Radon Exposure Matrix ........................................................................................ 22 6.4 External Exposure Matrix ..................................................................................... 22
7. REFERENCES .......................................................................................................... 22
OCAS-RPT-002 Rev. 0 Page 2 of 24
LIST OF TABLES
Table Description Page1-1 RECA Claimant Categories ........................................................................ 4
4-1 Summary of Information Available for Uranium Miner Exposure Matrix 6
4-2 Summary of Information Available for Uranium Miner Internal Exposure Matrix.......................................................................................................... 7
4-3 Uranium Progeny Alpha Fractions ............................................................. 8
4-4 Internal Exposure Matrix – Uranium Miners.............................................. 8
4-5 Radon Dose Conversion Factors................................................................. 9
4-6 Summary of Information Available for Uranium Miner External Exposure Matrix........................................................................................................ 10
5-1 HASL Uranium Mill Reports.................................................................... 12
5-2 Summary of Information Available for Uranium Miller Exposure Matrix................................................................................................................... 13
5-3 Summary of Information Available for Uranium Miller Internal Exposure Matrix........................................................................................................ 14
5-4 Uranium Progeny Alpha Fractions ........................................................... 15
5-5 Internal Exposure Matrix – Uranium Millers ........................................... 15
5-6 Radon Measurements from Uranium Mills .............................................. 17
5-7 Radiation Measurements from Uranium Mills ......................................... 19
LIST OF FIGURES Figure Description Page4-1 Analysis of Air Sampling Data from Uranium Mines ................................ 7
4-2 Analysis of Penetrating Radiation dose Rates at Uranium Mines .............. 9
5-1 Analysis of DSHEFS Uranium Mill Air Sampling Data .......................... 16
5-2 Analysis of Radon Concentrations from Tailings..................................... 18
5-3 Analysis of Penetrating Dose Rates at Uranium Mills ............................. 20
5-4 Analysis of Non-Penetrating Dose Rates at Uranium Mills ..................... 21
OCAS-RPT-002 Rev. 0 Page 3 of 24

1. Introduction
The Radiation Exposure Compensation Act (RECA) and subsequent amendments established three categories of claimants under section 5 of the act: “uranium miner”, “uranium mill worker”, and “ore transporter” (Table 1-1). This program is administered by the Department of Justice (DOJ). Table 1-1, RECA Claimant Categories
Category Definition Exposure Disease Uranium Miner
Individuals employed in aboveground or underground uranium mines located in Colorado, New Mexico, Arizona, Wyoming, South Dakota, Washington, Utah, Idaho, North Dakota, Oregon, and Texas at any time during the period beginning on January 1, 1942, and ending on December 31, 1971.
The claimant must have been exposed to 40 or more working level months (WLMs) of radiation while employed in a uranium mine or worked for at least one year in a uranium mine during the relevant time period.
Compensable diseases include primary lung cancer and certain nonmalignant respiratory diseases.
Uranium Mill Worker
Individuals employed in uranium mills located in Colorado, New Mexico, Arizona, Wyoming, South Dakota, Washington, Utah, Idaho, North Dakota, Oregon, and Texas at any time during the period beginning on January 1, 1942, and ending on December 31, 1971.
The claimant must have worked in a uranium mill for at least one year during the relevant time period.
Compensable diseases include primary lung cancer, certain nonmalignant respiratory diseases, renal cancer, and other chronic renal disease including nephritis and kidney tubal tissue injury.
Ore Transporters
Individuals employed in the transport of uranium ore or vanadium-uranium ore from mines or mills located in Colorado, New Mexico, Arizona, Wyoming, South Dakota, Washington, Utah, Idaho, North Dakota, Oregon, and Texas at any time during the period beginning on January 1, 1942, and ending on December 31, 1971.
The claimant must have transported ore for at least one year during the relevant time period.
Compensable diseases include primary lung cancer, certain nonmalignant respiratory diseases, renal cancer, and other chronic renal disease including nephritis and kidney tubal tissue injury.
A DOJ Section 5 award denial automatically translates into a DOL denial under Part B of EEOICPA. However, exposure duration and disease types required for compensation under RECA are not necessarily required for recovery under EEOICPA Part E. The expanded definition of a covered uranium worker and covered conditions under Part E of EEOICPA mean that a DOJ Section 5 award denial has no affect on Part E adjudication. DOJ may deny Section 5 awards based upon employment timeframes required under the RECA that have no bearing on the EEOICPA. Additionally, DOJ denies Section 5 awards if the claimed condition is not a covered condition under the RECA. Expanded
OCAS-RPT-002 Rev. 0 Page 4 of 24
covered conditions under Part E might allow for an acceptance where DOJ has denied a claim (DOL 2009).
2. Applicability The combination of available personnel monitoring information and workplace exposure values contained in this exposure matrix are intended to reflect the best available estimate of radiation exposure to RECA section 5 claimants for the purpose of determination of causation. Because of the limitations in the available exposure information, it is not possible to produce a unique estimate for each individual’s radiation exposure scenario. Rather, this report provides a series of matrices that can be used to bound exposures for certain defined classes of workers. Where information was sparse or incomplete, claimant favorable assumptions were used in the interpretation of these data and their subsequent translation into the exposure matrix. This report is intended to provide default exposure estimates when no information is available. If claimant-specific information is available for a particular claim, that information may be substituted for the default values in this matrix.
3. Medical X-rays The dose from medical X-rays that were required as a condition of employment will also be included in the dose estimate. No information regarding occupational medical doses specific to RECA sites was found. Information to be used in dose reconstructions, for which no specific information is available, is provided in ORAUT-OTIB-0006, the dose reconstruction project technical information bulletin covering diagnostic x-ray procedures. Unless specific information for the particular case is available, it will be assumed that each worker received an annual PA chest x-ray.
4. Miners
4.1 Literature Review Only limited information is available on exposure conditions to uranium miners during the period starting January 1, 1942, and ending on December 31, 1971, with the exception of radon, which has been well studied. One comprehensive study, conducted in 1967 through 1968 by the US Atomic Energy Commission’s Health and Safety Laboratory (HASL) (HASL-220), contains information on uranium dust and external radiation exposure which is suitable for application to RECA section 5 claimants. This study evaluated exposure conditions at 9 mines (6 in Colorado and 3 in New Mexico). The mines were selected to represent a cross section of mining industry (size, geology and location). Ore assay in the 9 mines ranged from 0.2% to 0.3% by weight. One contemporary study (Duport 2001) presents data on internal and external radiation exposure at Canadian and French uranium mines. Although it would be difficult to extrapolate the radon and uranium dust exposure data presented back to the applicable
OCAS-RPT-002 Rev. 0 Page 5 of 24

period for RECA section 5 claimants, external exposure data presented is believed to be a valid benchmark against values extrapolated from the 1968 HASL study. The external exposure pathway is likely to be less impacted by differences in mine conditions between the two periods. Table 4-1 contains a summary of the data evaluated for inclusion in the exposure matrix for uranium miners. Table 4-1, Summary of Information Available for Uranium Miner Exposure Matrix
Pathway Component Data Source Comments Ore dust HASL-220 Tabulated data on gross alpha
measurements in air for each of 9 mines will be used.
Radon RECA Use RECA assigned Radon Exposure
Internal
Uranium Progeny Assume that uranium is in equilibrium with progeny
Shallow beta to gamma ratio on ore measured at mills
Beta and gamma measurements on uranium ore at mills extracted from HASL reports.
External
Deep HASL-220 Tabulated gamma dose-rates for each of 9 mines
4.2 Internal Exposure Matrix
HASL-220 presents a summary of uranium air dust measurements (Table III of report, reproduced below in Table 4-2) which provides a snapshot of exposure conditions within uranium mines. Based on guidance contained in Technical Information Bulletin: Default Assumptions and Methods for Atomic Weapons Employer Dose Reconstructions (Battelle, 2007), the underlying data (contained in Appendix C of HASL-220) was fit to a lognormal distribution (Figure 4-1). The resulting geometric mean (GM) was 4.18 dpm/m3 with a geometric standard deviation (GSD) of 3.34. In this analysis, the single outlier measurement from mine ‘D’ was excluded (as recommended in the underlying report (HASL-220)).
OCAS-RPT-002 Rev. 0 Page 6 of 24

Table 4-2, Summary of Information Available for Uranium Miner Internal Exposure Matrix
Concentration (dpm/m3) Mine # Samples Min Max Mean
A 13 0.2 28 12
B 19 0.2 24 4.6
C 12 0.1 6.2 2.2
D 7 8.2 1040a (73) 170 (26)
E 8 7.6 26 1.7
F 10 1.6 21 8.1
G 10 1 9.6 3.2
H 9 0.7 17 7.7
I 8 0.7 4.8 2.1 a Single outlier sample, number in parenthesis is next highest and mean with this data point excluded. Figure 4-1, Analysis Air Sampling Data from Uranium Mines.
Lognormal Analysis
0.01
0.1
1
10
100
-3 -2 -1 0 1 2 3Standard Normal Deviate, z
Airborne U Concentration (dpm/m3)
Sorted DataGM = 4.18 GSD = 3.34 R2 = 0.967
The concentration of uranium progeny can be determined based on the assumption of radiological equilibrium. Since the underlying measured values represent the total alpha concentration in air, concentrations fractions of uranium progeny are based on the alpha emission fractions (Table 4-3). Radon and its short lived progeny were not included because it is accounted for under the Radon section. This is a favorable assumption since they would contribute to the measured alpha concentration in air. Some short lived and other isotopes that produce minimal dose were also excluded. By adjusting the fractions
OCAS-RPT-002 Rev. 0 Page 7 of 24

for the remaining isotopes to 100% these simplifications are slightly favorable to the claimant. Table 4-3, Uranium Progeny Alpha Fractions
Nuclide fraction U 0.41 Th-230 0.20 Ra-226 0.20 Po-210 0.20
Assuming a breathing rate of 1.2 m3/hr and applying the alpha fractions in Table 4-3, results in intake quantities shown in Table 4-4. Note that ingestion intakes were determined based on Technical Information Bulletin: Estimation of Ingestion Intakes (OCAS 2004) and are also tabulated. Table 4-4, Internal Exposure Matrix – Uranium Miners
Intake (pCi/y)a
Nuclide Inhalation Ingestion U 1.8E+03 3.8E+01
Th-230 9.0E+02 1.8E+01
Ra-226 9.0E+02 1.8E+01
Po-210 9.0E+02 1.8E+01 (a) values listed are GM of a lognormal distribution with GSD of 3.34
4.3 Radon Exposure The Department of Justice (DOJ) which administers the RECA program calculated a radon exposure for most uranium miners. These calculations are based on the length of employment at each mine and the radon data available for the particular mine. The values calculated by DOJ should be used for applicable dose calculations. The Department of Labor (DOL) has obtained information from DOJ for cases forwarded to NIOSH. DOL has in turn forwarded information to NIOSH for use in dose reconstruction. The calculated exposure must be broken up into individual years for input into the Integrated RadioEpidemiological Program (IREP). If no DOJ calculated value is available, the radon data for the particular mine and year can be used to calculate a radon exposure. Radon exposures calculated by DOJ are in units of working level months (WLM). OCAS-TIB-0011 should be used to convert this estimate into a dose estimate for respiratory tract tissues other than the lung (compartments ET1 and ET2 in the ICRP lung model (ICRP66)). For all other organs, the current models of the International Commission on Radiological Protection (ICRP) can be used to determine the dose per unit WLM. This was performed utilizing the parameters outlined in OCAS-TIB-0011.
OCAS-RPT-002 Rev. 0 Page 8 of 24

The resulting dose conversion is provided in Table 4-5. This dose is entered into IREP as alpha radiation. Table 4-5, Radon Dose Conversion Factors
Organ or Tissue Dose per WLM (mrem) Kidney 33
Stomach 16 Small Intestine 12
Upper Large Intestine 9.3 Lower Large Intestine 8.3
Colon 8.8 All other tissue 8.2
4.4 External Exposure Matrix
4.4.1 Penetrating Radiation
HASL-220 contains a summary of external dose (penetrating) measurements (Table IV of the report, reproduced below in Table 4-6) which provides some detail of the external exposure conditions within uranium mines. Based on guidance contained in Technical Information Bulletin: Default Assumptions and Methods for Atomic Weapons Employer Dose Reconstructions (Battelle, 2007), this data was fit to a lognormal distribution (using the methodology in section 2.1.2.3). The resulting GM was 0.36 mR/hr with a GSD of 1.5. The resulting annual dose is assumed to be represented by a lognormal distribution with GM of 730 mR and a GSD of 1.5. This assumption compares favorably with data cited for Canadian (620 mR/yr) and French (247 – 562 mR/yr) mines (Duport 2001). The dose should be considered to consist of 50% 30-250kev photons and 50% greater than 250 kev photons. Figure 4-2 is a graph of the calculated lognormal distribution with data points representing the mean dose rates and error bars representing the minimum and maximum dose rates. Figure 4-2, Analysis of Penetrating Radiation Dose Rates at Uranium Mines
OCAS-RPT-002 Rev. 0 Page 9 of 24

Lognormal Analysis
0.1
1
10
-2 -1.5 -1 -0.5 0 0.5 1 1.5 2Standard Normal Deviate, z
Mea
n D
ose
Rat
e (m
r/hr)
Sorted DataGM = 0.36 GSD = 1.5 R2 = 0.948
Table 4-6, Summary of Information Available for Uranium Miner External
Exposure Matrix Mine Gamma Radiation (mR/hr) Min Max Mean
A < 0.1 0.9 0.33 B < 0.1 1.1 0.50 C < 0.1 2.6 0.47 D < 0.1 2.0 0.33 E < 0.1 0.8 0.24 F 0.1 0.6 0.24 G 0.2 1.5 0.70 H 0.1 1.1 0.50 I 0.1 1.3 0.20
4.4.2 Non-Penetrating Radiation
HASL-220 did not present any non-penetrating dose rates. However, several other HASL reports exist that detail conditions at uranium mills. Several of these reports list both the penetrating and non-penetrating dose rates on uranium ore piles. Since the configuration of a pile is different than that in a mine, the actual dose rates on a pile may not be representative of a mine environment. However, the ratio of non-penetrating radiation to penetrating radiation should be reasonably similar in both situations. Therefore, the non-penetrating values and the penetrating values from uranium ore were extracted from the reports and a ratio derived from the two averages. The resulting ratio indicates that the non-penetrating dose is 37% of the penetrating dose. The values used to develop this number are in Table 5-7 of section 5.4. The dose should be considered to consist of electrons greater than 15 kev.
OCAS-RPT-002 Rev. 0 Page 10 of 24

5. Millers
5.1 Literature Review The Health and Safety Laboratory conducted a comprehensive survey of the twelve uranium mills that were operating as of July 1, 1957. The results were published as a summary report (HASL-40) and in the form of individual reports for each mill (Table 5-1). In total, time weighted average exposure data (to uranium dust) is tabulated for 2150 individual workers. Information on external radiation at each mill is also included for each of the mills.
OCAS-RPT-002 Rev. 0 Page 11 of 24

Table 5-1, HASL Uranium Mill Reports
Report Site SRDB Ref. ID
HASL-40 Mill ID
HASL 9 National Lead Company – Montecello Mill 10247 A
HASL 13 Climax Uranium Company, Grand Junction, Colorado 14064 B
HASL 14 Anaconda Company, Grants, New Mexico 21796 F
HASL 15 Uranium Reduction Company, Moab, Utah 16845 E
HASL 16 Union Carbide Nuclear Plant, Rifle, Colorado 12106 H
HASL 17 Vanadium Corporation of America, Naturita, Colorado 11284 G
HASL 18 Kerr McGee Oil Industries, Inc., Shiprock, New Mexico 16592 I
HASL 19 Mines Development Inc., Edgemont, South Dakota 14067 D
HASL 20 Rare Metals Corporation, Tuba City, Arizona 14144 J
HASL 26 Union Carbide Nuclear Co., Uravan, Colorado 12121 K
HASL 30 Vitro Uranium Company, Salt Lake City, Utah 14135 L
HASL 35 Vanadium Corporation of America, Durango, Colorado 12528 C
In addition to the detailed analysis contained in the HASL studies, a collection of air sample data held by NIOSH Division of Surveillance, Health Evaluations, and Field Studies (DSHEFS) was reviewed. The collection contains data on 14 mills for the period 1950 through 1972 and contains 14,795 individual air sample results. While these data can not be directly used to determine individual exposure to uranium dust because no data exists on the duration of these exposures, it can be used to evaluate the relative changes that occurred in the radiological conditions at uranium mills over the time frame, especially as it compares to the 1958 snapshot contained in the HASL studies. Table 5-2 contains a summary of the data evaluated for inclusion in the exposure matrix for uranium millers.
OCAS-RPT-002 Rev. 0 Page 12 of 24

Table 5-2, Summary of Information Available for Uranium Miller Exposure Matrix Pathway Component Data Source Comments
Ore dust HASL-40a Tabulated daily average exposure summary (from cohort of 2150 workers) will be used.
Radon HASL-40 tailing pile measurements
Only limited data is available
Internal
Uranium Progeny One of two profiles assumed: full equilibrium or uranium concentrate constituents.
HASL reports support the presence of full equilibrium in only ore crushing and handling areas, all other areas are mainly uranium. Data on concentration of progeny in uranium concentrate from NRC Generic Environmental Impact Statement on uranium milling, NUREG-0706 (NRC) can be used.
Shallow HASL-40 Tabulated data in HASL-40 corrected and categorized using individual HASL reports.
External
Deep HASL-40 Tabulated data in HASL-40 corrected and categorized using individual HASL reports.
a HASL-40: Study of 12 domestic mills in operation as of 7/1/1957. Selected samples analyzed for uranium and radium.
5.2 Internal Exposure Matrix HASL-40 presents a summary of daily average exposure estimates based on uranium air dust samples (Table II of report, reproduced below in Table 5-3) which provides a snapshot of exposure conditions within uranium mills. Based on guidance contained in Technical Information Bulletin: Default Assumptions and Methods for Atomic Weapons Employer Dose Reconstructions (Battelle, 2007), the underlying data (contained in Appendix II of HASL-40) was used to determine the parameters of a lognormal distribution. The calculation was performed using the LogNorm4 Program and based on the weighted average of the average concentration and ‘% > 5 x 10-11’ columns. Specifically, the lognormal distribution was determined based on an average value of 16.72 (x 10-11 microCuries/ml) and assuming a 66th percentile of 5 (x 10-11 microCuries/ml). The resulting GM was 2.14 (x 10-11 microCuries/ml) with a GSD of 7.6. The 95th percentile calculated using this distribution (60 x 10-11 microCuries/ml) compares favorably with the data in Table III of HASL-40, in which it can be deduced that overall 95% of the exposures are less than 50 x 10-11 microCuries/ml (based on a weighted average of the data in Table III, 93.7% based on the arithmetic average presented in HASL 40). The GM can be converted to 21.4 pCi/m3. These units are used in the rest of this report.
OCAS-RPT-002 Rev. 0 Page 13 of 24

Table 5-3, Summary of Information Available for Uranium Miller Internal Exposure Matrix
Daily Average Exposure Summarya
microCi/ml x 10-11
Mill Report Individuals maximum average % > 5 x 10-11
micro Ci/ml A HASL 9 214 325 12.5 46
B HASL 13 187 60 5 18
C HASL 35 170 175 15.1 47
D HASL 19 47 200 14.5 11
E HASL 15 162 500 44.5 54
F HASL 14 502 150 5.5 16
G HASL 17 113 300 8.5 30
H HASL 16 122 500 69.5 55
I HASL 18 135 600 44.5 29
J HASL 20 87 75 9.5 48
K HASL 26 250 30 8.5 54
L HASL 30 161 125 4.5 16
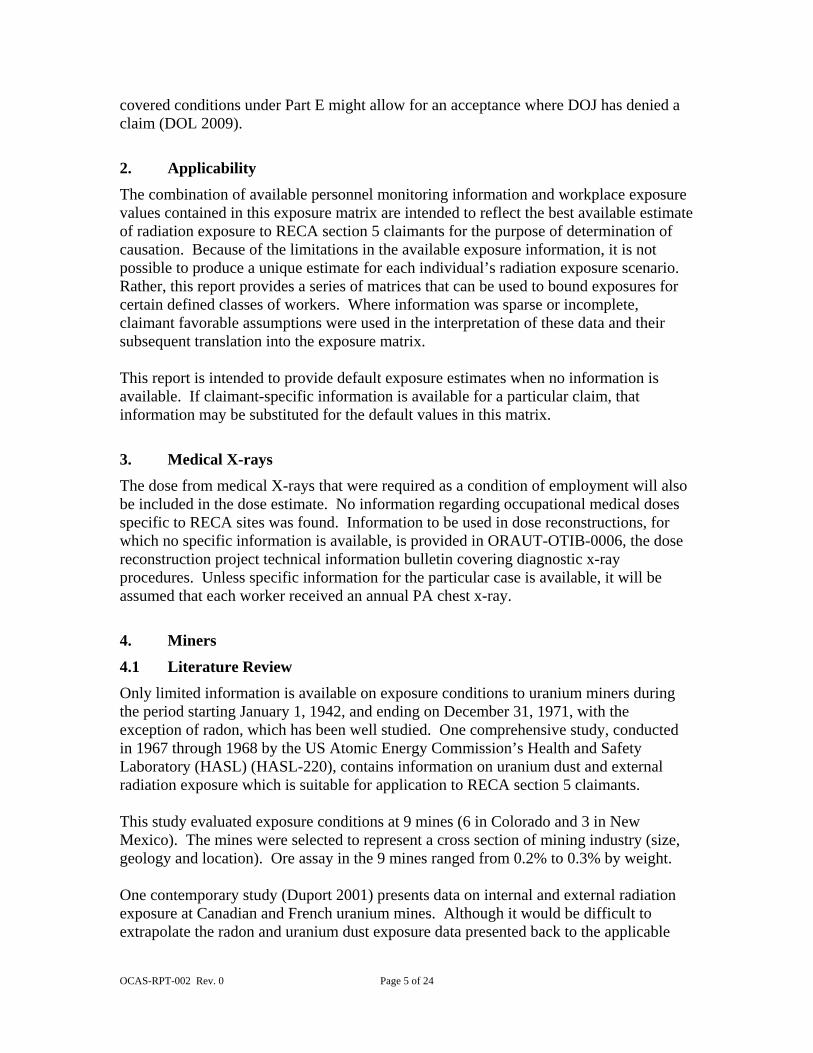
weighted average value 16.7 33.8 (a) in order to convert to pCi/m3 multiply value by 10 The concentration of uranium progeny can be determined based on the assumption of radiological equilibrium in uranium ore and based on data contained in NUREG-0706 (NRC) for yellowcake. Since it is unlikely that the source of a claimant’s internal exposure (either uranium ore or yellowcake) will be known, the internal exposure matrix for uranium millers contains values for both sources. The source term that is most claimant favorable should be applied based on the specifics of each individual claim. Since the underlying measured values represent the total alpha concentration in air, concentration fractions of uranium progeny are based on the alpha emission fractions for either uranium ore or yellowcake, as appropriate (Table 5-4). Radon and its short lived progeny were not included because it is accounted for under the Radon section. This is a favorable assumption since they would contribute to the measured alpha concentration in air. Some short lived and other isotopes that produce minimal dose were also excluded. By adjusting the fractions for the remaining isotopes to 100% these simplifications are slightly favorable to the claimant.
OCAS-RPT-002 Rev. 0 Page 14 of 24
Table 5-4, Uranium Progeny Alpha Fractions Nuclide Fraction Ore Yellowcakea
U 4.1E-01 9.9E-01
Th-230 2.0E-01 5.0E-03
Ra-226 2.0E-01 9.9E-04
Po-210 2.0E-01 9.9E-04 a - fractions listed from NUREG-0706 (ORAUT SRDB Ref. ID 33684) Assuming a breathing rate of 1.2 m3/hr and applying the alpha fractions in Table 5-4, results in intake quantities shown in Table 5-5. Note that ingestion intakes were determined based on Technical Information Bulletin: Estimation of Ingestion Intakes (OCAS 2004) and are also tabulated. Table 5-5, Internal Exposure Matrix – Uranium Miners
Nuclide Uranium Ore Yellowcake
Inhalation (pCi/yr)
Ingestion (pCi/yr)
Inhalation (pCi/yr)
Ingestion (pCi/yr)
U 2.1E+04 4.3E+02 5.1E+04 1.1E+03
Th-230 1.0E+04 2.1E+02 2.6E+02 5.3E+00
Ra-226 1.0E+04 2.1E+02 5.1E+01 1.1E+00
Po-210 1.0E+04 2.1E+02 5.1E+01 1.1E+00 (a) listed values are at the GM of a lognormal distribution with GSD of 7.6
5.2.1 Temporal Adjustment
Since all of the data used in the internal dose matrix was based on a 1958 survey, the need for a temporal adjustment was investigated. Air sample data compiled by the NIOSH DSHEFS division was obtained. Data for each year was fit to a lognormal distribution and plotted in Figure 5-1 (GM with the 95% confidence interval). From this plot, it is evident that exposure values prior to 1958 were likely higher and those post 1958 were likely lower. However, in order to avoid compounding favorable assumptions and insure a reasonable estimate, the values assigned in this report were reviewed against the DSHEFS data. The DSHEFS data was reported in units of mass of uranium while the HASL data was reported in units of gross alpha activity. This requires some adjustments in order to compare the two. In order to adjust the data, the activity ratio of various uranium decay products must be known. It is reasonable to assume that the uranium ore contains the U-238 decay products in equilibrium with the U-238. However, that equilibrium is upset during the processing of the uranium in a mill. The material sampled could be as high as 100% uranium by activity. In order to make an approximate comparison, the DSHEFS data was multiplied by four to account for the four long lived alpha emitting decay products of uranium. This adjusts the DSHEFS data to gross long lived alpha activity in air. The data was further converted to units of dpm/m3. Figure 5-1 shows a graph of the
OCAS-RPT-002 Rev. 0 Page 15 of 24

median and 95th percentile DSHEFS data. Also included in the figure is the median and 95th percentile of the air concentrations derived in this report. Figure 5-1, Analysis of DSHEFS Uranium Mill Air Sampling Data.
0.001
0.01
0.1
1
10
100
1000
10000
1950 1955 1960 1965 1970
Year
dpm
/cu.
met
er
DSHEFS Geometric Mean HASL Geometric Mean HASL 95% It can be clearly seen in the graph that the airborne activity derived in this report is greater than any year of the DSHEFS data. One possible explanation for the difference is the likelihood that the HASL data actually contains some short-lived alpha emitter activity from radon decay products. One report (HASL-15) shows very clearly the decay of short-lived alpha emitters by listing the results of counting the same sample on two separate days nearly one month apart. The alpha activity decreased in nearly every case. Since this is very time dependent and since the decay time was not recorded, it is not possible to correct for this overestimate. Another possible explanation for the difference is that the DSHEFS surveys after 1958 were much more extensive than prior to 1958. The average number of samples collected prior to 1958 was 45.7 per year while the average number collected after 1958 was 1001 per year. It is not unusual when sampling an area for health hazards to concentrate samples in areas believed to cause the highest exposures. This implies the HASL samples as well as the pre-1958 DSHEFS samples may be inherently skewed high while the post 1958 DSHEFS samples may be more representative of the entire mill. This implies the approximately one order of magnitude decrease between 1956 and 1960 may not truly represent a decrease in airborne activity. It may only represent a more robust sampling of the mills.
OCAS-RPT-002 Rev. 0 Page 16 of 24

While it is likely some decrease of airborne activities occurred between 1956 and 1960, it is evident that the model represented in this report is bounding of all years. Therefore, no temporal adjustment is necessary.
5.3 Radon Exposure Matrix
Information available for radon exposures at uranium mills is limited. The available information consists of radon measurements over the tailings. This source of information should be favorable to the claimant because the tailings should contain the highest concentration of radium (the source of radon) of all the materials found in a mill. These measurements measured the radon gas directly however, the primary source of exposure from radon is the radon progeny (decay products). This is normally measured in working levels (WL). The parameters necessary to convert the gas measurement into working levels were taken from OCAS-TIB-0011. The available data is listed in Table 5-6. Table 5-6, Radon Measurements from Uranium Mills
HASL report number Radon (pCi/L) HASL-13 4.5 HASL-35 2.8 HASL-19 2.4 HASL-17 8.1 HASL-16 6.5 HASL-18 6.8 HASL-20 0.8 HASL-26 29.6 HASL-30 1.8
The data was found to fit a lognormal distribution reasonably well. The GM of that distribution is 4.26 pCi/L with a 2.8 GSD (Figure 5-2). Using the parameters from OCAS-TIB-0011, this equates to 0.03 WL. This value must be multiplied by the number of months an individual is exposed in order to obtain the WLM of exposure. The WLM is entered directly into an exposure model when lung is the target organ. It should be entered as the GM of a lognormal distribution with a GSD of 2.8. For other organs of the respiratory tract, OCAS-TIB-0011 should be used to convert the WLM into dose. The dose value again should be entered as the GM of a lognormal distribution with a GSD of 2.8. For all other organs or tissues, Table 4-5 should be used for a dose conversion factor.
OCAS-RPT-002 Rev. 0 Page 17 of 24

Figure 5-2, Analysis of Radon Concentrations from Tailings
Lognormal Analysis
0.1
1
10
100
-2 -1.5 -1 -0.5 0 0.5 1 1.5 2
Standard Normal Deviate, z
Rad
on (p
Ci/L
)
Sorted DataGM=4.26 GSD = 2.8 R2 = 0.966
5.4 External Exposure Matrix
External exposure information was obtained from individual HASL reports that made up HASL-40. The individual reports were used to separate data pertaining to the ore piles for use in section 4 for non-penetrating radiation dose. It was also clear that some of the values reported in HASL-40 were contact readings while others were taken at a distance more applicable to whole body exposure. Data from four of the mills was not used because only the total (penetrating plus non-penetrating) radiation values were recorded. While the reports for some of the surveys was very comprehensive, others were cursory with only a few readings. In order to weight each mill equally, four values were selected from each report when available. The values were the maximum penetrating and non-penetrating dose rate for the ore stock piles as well as the maximum penetrating and non-penetrating dose rates for the remainder of the mill. The values were intended to be representative of an individual’s whole body dose. In keeping with that, dose rates that were measured on contact with floors and other objects as well as those close to objects are not included. In general, the measurements are those taken in the general work area approximately three feet above the floor. The values are listed in Table 5-7.
OCAS-RPT-002 Rev. 0 Page 18 of 24

Table 5-7, Radiation Measurements from Uranium Mills Ore stock piles Remainder of Mill HASL Report #
β (mrad/hr) γ (mr/hr) β (mrad/hr) γ (mr/hr) HASL-9 N/D 0.2 0.9 1.0 HASL-13 N/D 0.7 N/D 1.6 HASL-35 0.8 0.8 25 0.6 HASL-19 1.5 4.0 HASL-15 9.0 0.3 HASL-14 0.15 HASL-18 N/D 0.5 8.0 0.6 HASL-20 0.3 0.8 2.4 0.8
N/D indicates readings were not detectable Values from the Ore stock piles were reasonably consistent so they were averaged to determine an average non-penetrating and an average penetrating dose rate. A ratio of these averages was determined to be 0.37 non-penetrating to penetrating. This value is used in section 4 for estimating the non-penetrating dose to uranium miners based on the penetrating dose information. For uranium millers, all of the penetrating dose rates (from Ore and the remainder of the mill) were combined and determined to fit a lognormal distribution. The parameters of this distribution are a GM of 0.65 mr/hr with a GSD of 2.3 (Figure 5-3). The typical work year was assumed to be 2000 hours per year so the GM is multiplied by 2000 to obtain an annual dose rate of 1300 mr/yr. This value should be used as the GM of a lognormal distribution and the value of 2.3 should be used as the GSD. If an individual worked only part of a year, the GM value should be prorated to the fraction of the year the individual worked at the mill. The GSD value is not prorated. The dose should be considered to consist of 50% 30-250kev photons and 50% greater than 250 kev photons.
OCAS-RPT-002 Rev. 0 Page 19 of 24

Figure 5-3, Analysis of Penetrating Dose Rates at Uranium Mills
Lognormal Analysis
0.1
1
10
-2 -1.5 -1 -0.5 0 0.5 1 1.5 2
Standard Normal Deviate, z
Gam
ma
Dos
e R
ate
(mr/h
r)
Sorted Data
GM = 0.65 GSD = 2.3 R2 = .943
The non-penetrating dose for uranium millers was also determined by first combining all the non-penetrating dose rates in Table 5-7. This data also fit a lognormal distribution with a GM of 0.8 mrad/hr and a GSD of 8.46 (Figure 5-4). The GM can be multiplied by 2000 hours to obtain an annual dose of 1600 mrad/yr. This value should be used as the GM of a lognormal distribution and the value of 8.46 should be used as the GSD. If an individual worked only part of a year, the GM value should be prorated to the fraction of the year the individual worked at the mill. The GSD value is not prorated. The dose should be considered to consist of electrons greater than 15kev.
OCAS-RPT-002 Rev. 0 Page 20 of 24

Figure 5-4, Analysis of Non-Penetrating Dose Rates at Uranium Mills
Lognormal Analysis
0.01
0.1
1
10
100
-2 -1.5 -1 -0.5 0 0.5 1 1.5 2
Standard Normal Deviate, Z
Bet
a D
ose
Rat
e (m
rad/
hr)
Sorted Data
GM = 0.8 GSD = 8.46 R2 = .964
6. Ore Transporters
6.1 Literature Review No reports specific to ore transporters have been located. Ore transporters are defined as anyone who transported ore from mines or mills. Transportation throughout a mine or a mill is considered work at a mine or a mill and the dose should be estimated using those categories of work. The Transporter category is reserved for those who primarily transported ore between mines and mills. This would necessarily cause some exposure while being loaded at a mine and while unloading at a mill. Therefore, the uranium miners and uranium millers exposure matrix will be the basis for estimating exposure to transporters.
6.2 Internal Exposure Matrix Ore transporters could receive exposure to airborne radioactive dusts while in transit but also while loading or unloading the ore at the mines and the mills. The transit time, loading time and unloading time for these transporters are unknown but believed to be widely variable. Because of this, a precise estimate is not possible. This matrix will assume that transporters are exposed to airborne uranium at the same level as uranium miners. This is believed to be a favorable estimate since uranium miners should be handling uranium ore in much closer proximity and for longer periods of time. Also, the handling done by the miners is likely to generate higher dust concentrations than the
OCAS-RPT-002 Rev. 0 Page 21 of 24

transportation of that ore. The internal exposure for transporters is therefore, estimated using the uranium miners internal exposure matrix. The values are found in Table 4-4.
6.3 Radon Exposure Matrix Ore transporters could be exposed to radon at the mines or the mills. While a transporter would enter the mine property for loading, it is assumed that a transporter would not actually enter the active mining areas of the property on a routine basis. This may not be the case in an open pit mine but the radon levels tend to be much lower in those mines. Therefore, the transporter is assumed to be exposed to surface radon levels rather than those found in underground mines. The radon exposure for transporters is therefore, estimated using the uranium millers radon exposure matrix. The values for that matrix are found in section 5.3.
6.4 External Exposure Matrix
Ore transporters could receive radiation dose while in transit but also while loading or unloading the ore at the mines and the mills. The transit time, loading time and unloading time for these transporters are unknown but believed to be widely variable. Because of this, a precise estimate is not possible. This matrix will assume that transporters are exposed to external radiation at the same level as uranium miners. This is believed to be a favorable estimate since uranium miners would be in close proximity to the ore for longer periods of time. The external radiation values contained in section 4.4 will therefore be used for ore transporters.
7. References 1. Battelle Memorial Institute, Battelle-TIB-5000/PNWD-3741, Technical Information
Bulletin: Default Assumptions and Methods for Atomic Weapons Employer Dose Reconstructions, Rev 00, April 2, 2007, SRDB Reference ID 32016.
2. Duport P, 2002, Is the Radon Risk Overestimated? Neglected Doses in the Estimation
of the Risk of Lung Cancer in Uranium Underground Miners, Radiation Protection Dosimetry, 98(3): 329 – 338.
3. DOL (U.S. Department of Labor), Federal (EEOICPA) Procedure Manual,
http://www.dol.gov/esa/owcp/energy/regs/compliance/PolicyandProcedures/ProcedureManualPartE.htm , accessed January, 2009
4. HASL-9 (Health and Safety Laboratory) National Lead Company, Montecello Mill, Occupational Exposures to Radioactive Contaminants (Health and Safety Laboratory, United States Atomic Energy Commission, New York, NY, HASL-9/NLM-1, January 7, 1958), SRDB Reference ID 10247.
OCAS-RPT-002 Rev. 0 Page 22 of 24

5. HASL-13 (Health and Safety Laboratory) Occupational and Non-Occupational
Radiation and Contamination – Climax Uranium Company, Grand Junction, Colorado (Health and Safety Laboratory, United States Atomic Energy Commission, New York, NY, HASL-13, January 27, 1958), SRDB Reference ID 14064.
6. HASL-14 (Health and Safety Laboratory) Occupational and Non-Occupational
Radiation and Contamination – Anaconda Company, Grants, New Mexico (Health and Safety Laboratory, United States Atomic Energy Commission, New York, NY, HASL-14A, January 27, 1958), SRDB Reference ID 21796.
7. HASL-15 (Health and Safety Laboratory) Occupational and Non-Occupational
Radiation and Contamination – Uranium Reduction Company, Moab, Utah (Health and Safety Laboratory, United States Atomic Energy Commission, New York, NY, HASL-15, January 27, 1958), SRDB Reference ID 16845.
8. HASL-16 (Health and Safety Laboratory) Occupational and Non-Occupational
Radiation and Contamination – Union Carbide Nuclear Plant, Rifle, Colorado (Health and Safety Laboratory, United States Atomic Energy Commission, New York, NY, HASL-16, January 28, 1958), SRDB Reference ID 12106.
9. HASL-17 (Health and Safety Laboratory) Occupational and Non-Occupational
Radiation and Contamination – Vanadium Corporation of America, Naturita, Colorado (Health and Safety Laboratory, United States Atomic Energy Commission, New York, NY, HASL-17, January 30, 1958), SRDB Reference ID 11284.
10. HASL-18 (Health and Safety Laboratory) Occupational and Non-Occupational
Radiation and Contamination – Kerr McGee Oil Industries, Inc., Shiprock, New Mexico (Health and Safety Laboratory, United States Atomic Energy Commission, New York, NY, HASL-18, February 7, 1958), SRDB Reference ID 16592.
11. HASL-19 (Health and Safety Laboratory) Occupational and Non-Occupational
Radiation and Contamination- Mines Development Inc., Edgemont, South Dakota (Health and Safety Laboratory, United States Atomic Energy Commission, New York, NY, HASL-19, February 12, 1958), SRDB Reference ID 14067.
12. HASL-20 (Health and Safety Laboratory) Occupational and Non-Occupational
Radiation and Contamination – Rare Metals Corporation, Tuba City, Arizona (Health and Safety Laboratory, United States Atomic Energy Commission, New York, NY, HASL-20, February 14, 1958), SRDB Reference ID 14144.
13. HASL-26 (Health and Safety Laboratory) Occupational and Non-Occupational
Radiation and Contamination – Union Carbide Nuclear Co., Uravan, Colorado (Health and Safety Laboratory, United States Atomic Energy Commission, New York, NY, HASL-26, March 5, 1958), SRDB Reference ID 12121.
OCAS-RPT-002 Rev. 0 Page 23 of 24

14. HASL-30 (Health and Safety Laboratory) Occupational and Non-Occupational Radiation and Contamination – Vitro Uranium Company, Salt Lake City, Utah (Health and Safety Laboratory, United States Atomic Energy Commission, New York, NY, HASL-30, March 20, 1958), SRDB Reference ID 14135.
15. HASL-35 (Health and Safety Laboratory) Occupational and Non-Occupational
Radiation and Contamination (Health and Safety Laboratory, United States Atomic Energy Commission, New York, NY, HASL-35, April 21, 1958), SRDB Reference ID 12528.
16. HASL-40 (Health and Safety Laboratory) Environmental Hazards Associated with
the Milling of Uranium Ore – A Summary Report (Health and Safety Laboratory, United States Atomic Energy Commission, New York, NY, HASL-40, June 4, 1958), SRDB Reference ID 17032b.
17. HASL-220 (Health and Safety Laboratory) Investigation of the Radiological
Characteristics of Uranium Mine Atmospheres (Health and Safety Laboratory, United States Atomic Energy Commission, New York, NY, HASL-220, December, 1969), SRDB Reference ID 15795.
18. ICRP66 (International Commission on Radiological Protection), Respiratory Tract
Model for Radiological Protection, ICRP Publication 66, Annals of the ICRP Vol. 24 (1-3), Pergamon Press, Oxford, England, 1994.
19. NRC (United States Nuclear Regulatory Commission), Final Generic Environmental
Impact Statement on Uranium Milling Project M-25 (NUREG-0706, Volume III), SRDB Reference ID 33684.
20. OCAS (Office of Compensation Analysis and Support), OCAS-TIB-009, Technical
Information Bulletin: Estimation of Ingestion Intakes, Rev 0, April 13, 2004, SRDB Reference ID 22397.
OCAS-RPT-002 Rev. 0 Page 24 of 24