Embed Size (px)
Citation preview
O
Comptroller of the Currency Administrator of National Banks
Washington, DC 20219
OCC’s Quarterly Report on Bank Derivatives Activities Second Quarter 2007
Executive Summary
• U.S. commercial banks generated $6.2 billion in revenues trading cash and derivative instruments in the second quarter of 2007, the second highest total ever, and 30% higher than the second quarter of 2006. Revenues in the second quarter are 12% less than the record level set in the first quarter.
• Net Current Credit Exposure, the net amount owed to banks if all contracts were immediately liquidated, increased $20 billion from the prior quarter to $199 billion.
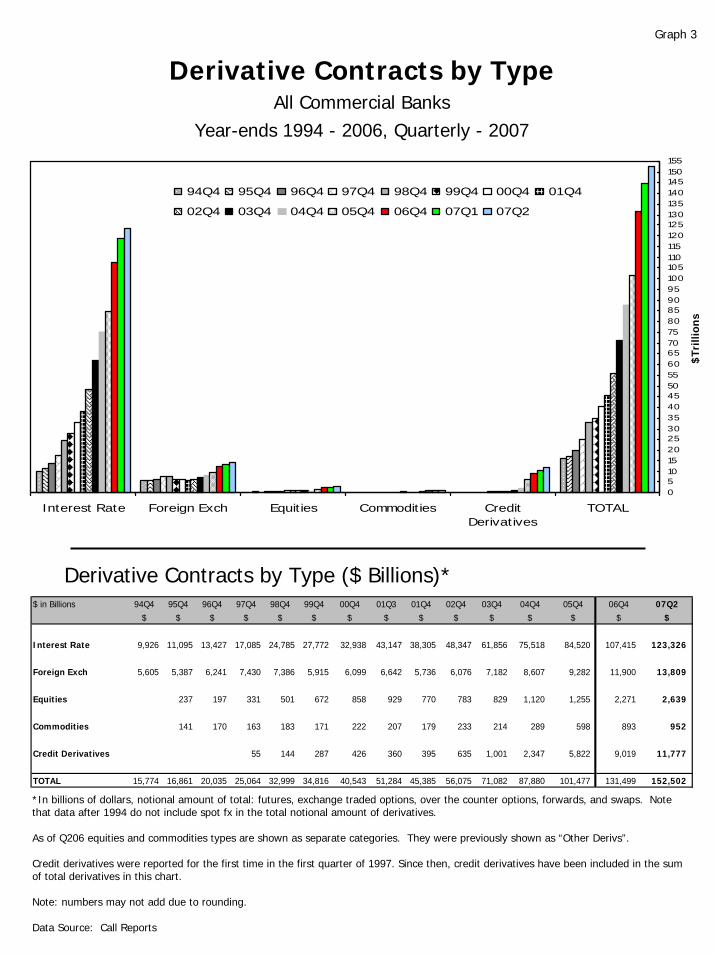
• The notional amount of derivatives held by U.S. commercial banks increased $7.7 trillion to $152.5 trillion in the second quarter, 5% higher than in the first quarter and 28% higher than a year ago. Bank derivative contracts remain concentrated in interest rate products, which represent 81% of total notionals.
• The notional amount of credit derivatives, the fastest growing product of the global derivatives market, increased 16% from the first quarter to $11.8 trillion. Credit default swaps represent 98% of the total amount of credit derivatives. Credit derivatives contracts are 79% higher than a year ago.
• The largest derivatives dealers continue to strengthen the operational infrastructure for over-the-counter derivatives through a collaborative effort with financial supervisors.
The OCC’s quarterly report on bank derivatives activities and trading revenues is based on Call Report information provided by all insured U.S. commercial banks and trust companies, as well as on other published financial data.
Derivatives activity in the U.S. banking system is dominated by a small group of large financial institutions. Five large banks with the greatest notionals represent 97% of the total industry notional amount, 80% of total trading revenues and 88% of industry net current credit exposure.
While bank supervisors normally have concerns about market or product concentrations, there are three important mitigating factors with respect to derivatives activities. First, there are a number of other providers of derivatives products, such as investment banks and foreign banks, whose activity is not reflected in the data in this report. As a result, there is aggressive competition in the market for providing derivatives products. Second, because the highly specialized business of structuring, trading, and managing the full array of risks in a portfolio of derivatives transactions requires sophisticated tools and expertise, derivatives activity is appropriately concentrated in those few institutions that have made the resource commitment to be able to operate the business in a safe and sound manner. Typically, only the largest institutions have the resources, both in personnel and technology, to support the requisite risk management infrastructure. Third, the OCC has examiners, who continuously evaluate the credit, market, operation, reputation and compliance risks of derivatives activities, on-site at the largest bank providers of derivatives products.
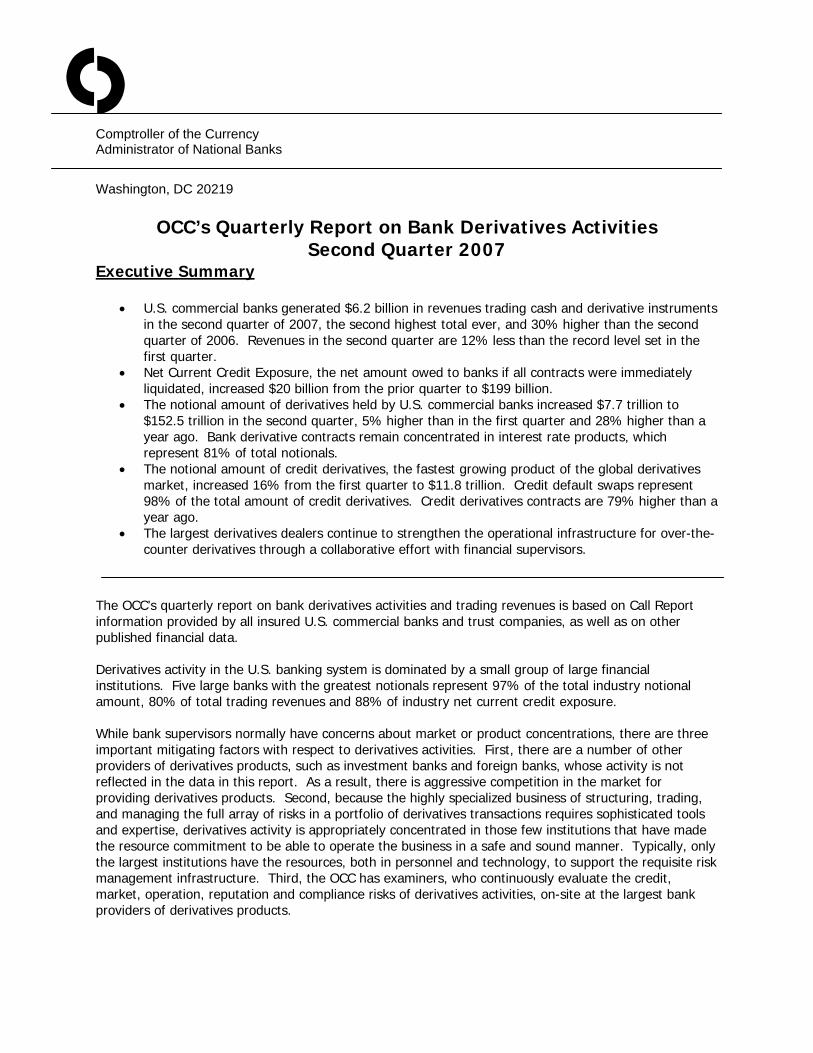
Revenues Trading revenues from cash instruments and derivative products totaled $6.2 billion in the second quarter of 2007 for all insured U.S. commercial banks (see first table below), down 12% from the record level of $7.0 billion in the first quarter of 2007. Trading revenues in the second quarter are the second highest ever recorded. Interest rate revenues increased 24%, or $578 million, to a record high. All other revenue types fell from the first quarter. Foreign exchange revenues decreased 31%, or $567 million, to $1.3 billion, the lowest level in the past eight quarters. Equity revenues fell 41%, or $711 million, to $1.0 billion. Bank dealers generally reported strong client flows until the last several weeks of the quarter. Trading Revenues$ in millions Q2 '07 Q1 '07Interest Rate 2,991$ 2,413$ 578$ 24% 1,668$ 1,323$ 79%Foreign Exchange 1,264 1,831 (567) -31% 2,675 (1,411) -53%Equity 1,024 1,735 (711) -41% 103 921 894%Comdty & Other 25 175 (150) -86% 274 (249) -91%Credit 853 878 (25) -3% NA 853 NA Tot Trading Rev 6,157$ 7,032$ (875)$ -12% 4,720$ 1,437$ 30%
% Change Q2 vs. Q2
% Change Q2 vs. Q1
Change Q2 vs. Q1 Q2 '06
Change Q2 vs. Q2
2007 Q2Avg Hi Low Avg Hi Low
Interest Rate 2,991$ 1,181$ 1,052$ 1,086$ 2,991$ (472)$ 1,560$ 2,991$ 552$ Foreign Exchange 1,264 1,336 1,308 1,315 2,675 514 1,783 2,675 1,264Equity 1,024 333 510 463 1,829 (305) 1,225 1,829 103Comdty & Other 25 115 103 107 789 (320) 210 789 (292)Credit 853 853 878 865 878 853 865 878 853Tot Trading Rev $6,157 $3,036 $3,000 $3,009 $7,032 $614 $4,995 $7,032 $3,130
Past 8 QuartersALL QuartersTrading Revenues $ in millions
Avg All Oth 33 Qtrs
Avg Past 12 Q2's
Note: Average, high, and low data for credit revenues cover only 2 quarters.
As interest rate contracts have become more of a "commodity" product, their contribution to revenues is smaller relative to their proportion of total notionals. Interest rate derivative contracts, for example, represent 81% of total notional derivatives, but 49% of total trading revenues. (See the charts below.) In contrast, equity exposures, which are generally more customized, are not even a 2% share of notionals but generate nearly a 17% share of all trading revenues.
Percentage Total Notionals by Type - Q2 '07
Interest Rate
Contracts80.9%
Equity Contracts
1.7%
Foreign Exchange Contracts
9.1%
Commodity/Other0.6%
Credit Derivatives
7.7%
Percentage Total Revenues by Type - Q2 '07
Foreign Exchange
20.5%
Interest Rate 48.6%
Equity16.6%
Comdty & Other0.4%
Credit13.9%
Data Source: Call Reports. Note: Beginning 1Q07, credit exposures are broken out as a separate revenue category.
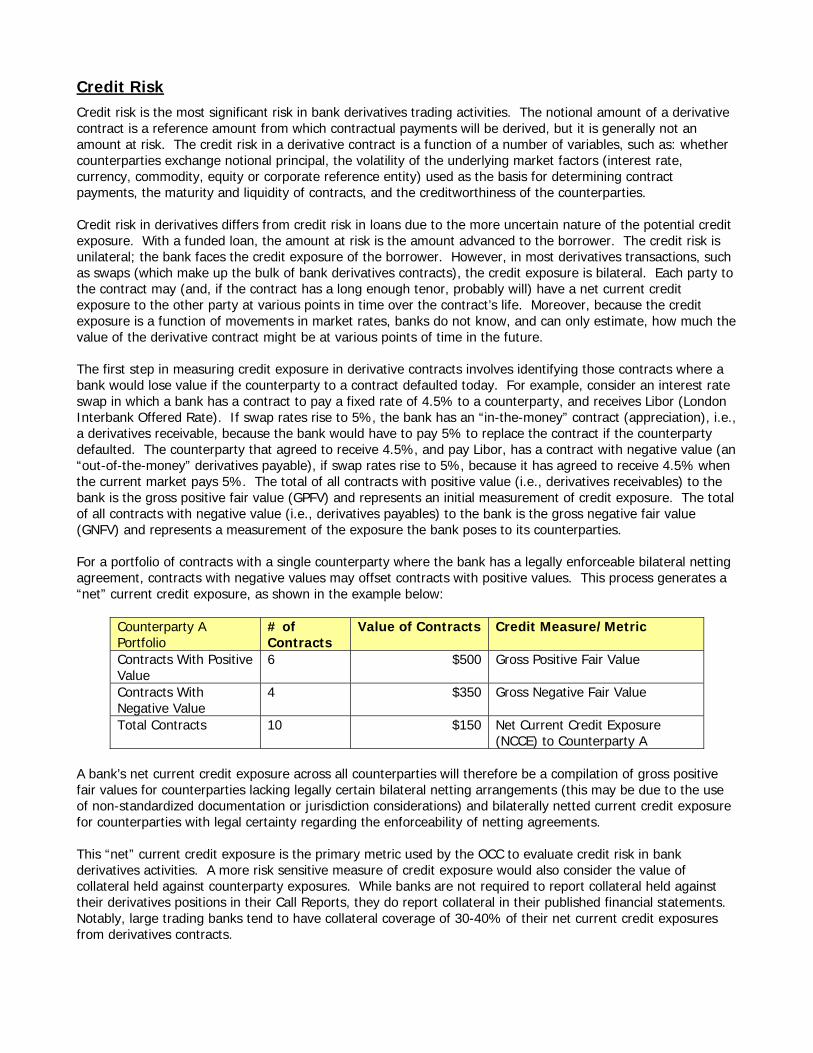
Credit Risk Credit risk is the most significant risk in bank derivatives trading activities. The notional amount of a derivative contract is a reference amount from which contractual payments will be derived, but it is generally not an amount at risk. The credit risk in a derivative contract is a function of a number of variables, such as: whether counterparties exchange notional principal, the volatility of the underlying market factors (interest rate, currency, commodity, equity or corporate reference entity) used as the basis for determining contract payments, the maturity and liquidity of contracts, and the creditworthiness of the counterparties. Credit risk in derivatives differs from credit risk in loans due to the more uncertain nature of the potential credit exposure. With a funded loan, the amount at risk is the amount advanced to the borrower. The credit risk is unilateral; the bank faces the credit exposure of the borrower. However, in most derivatives transactions, such as swaps (which make up the bulk of bank derivatives contracts), the credit exposure is bilateral. Each party to the contract may (and, if the contract has a long enough tenor, probably will) have a net current credit exposure to the other party at various points in time over the contract’s life. Moreover, because the credit exposure is a function of movements in market rates, banks do not know, and can only estimate, how much the value of the derivative contract might be at various points of time in the future. The first step in measuring credit exposure in derivative contracts involves identifying those contracts where a bank would lose value if the counterparty to a contract defaulted today. For example, consider an interest rate swap in which a bank has a contract to pay a fixed rate of 4.5% to a counterparty, and receives Libor (London Interbank Offered Rate). If swap rates rise to 5%, the bank has an “in-the-money” contract (appreciation), i.e., a derivatives receivable, because the bank would have to pay 5% to replace the contract if the counterparty defaulted. The counterparty that agreed to receive 4.5%, and pay Libor, has a contract with negative value (an “out-of-the-money” derivatives payable), if swap rates rise to 5%, because it has agreed to receive 4.5% when the current market pays 5%. The total of all contracts with positive value (i.e., derivatives receivables) to the bank is the gross positive fair value (GPFV) and represents an initial measurement of credit exposure. The total of all contracts with negative value (i.e., derivatives payables) to the bank is the gross negative fair value (GNFV) and represents a measurement of the exposure the bank poses to its counterparties. For a portfolio of contracts with a single counterparty where the bank has a legally enforceable bilateral netting agreement, contracts with negative values may offset contracts with positive values. This process generates a “net” current credit exposure, as shown in the example below:
Counterparty A Portfolio
# of Contracts
Value of Contracts Credit Measure/Metric
Contracts With Positive Value
6 $500 Gross Positive Fair Value
Contracts With Negative Value
4 $350 Gross Negative Fair Value
Total Contracts 10 $150 Net Current Credit Exposure (NCCE) to Counterparty A
A bank’s net current credit exposure across all counterparties will therefore be a compilation of gross positive fair values for counterparties lacking legally certain bilateral netting arrangements (this may be due to the use of non-standardized documentation or jurisdiction considerations) and bilaterally netted current credit exposure for counterparties with legal certainty regarding the enforceability of netting agreements. This “net” current credit exposure is the primary metric used by the OCC to evaluate credit risk in bank derivatives activities. A more risk sensitive measure of credit exposure would also consider the value of collateral held against counterparty exposures. While banks are not required to report collateral held against their derivatives positions in their Call Reports, they do report collateral in their published financial statements. Notably, large trading banks tend to have collateral coverage of 30-40% of their net current credit exposures from derivatives contracts.
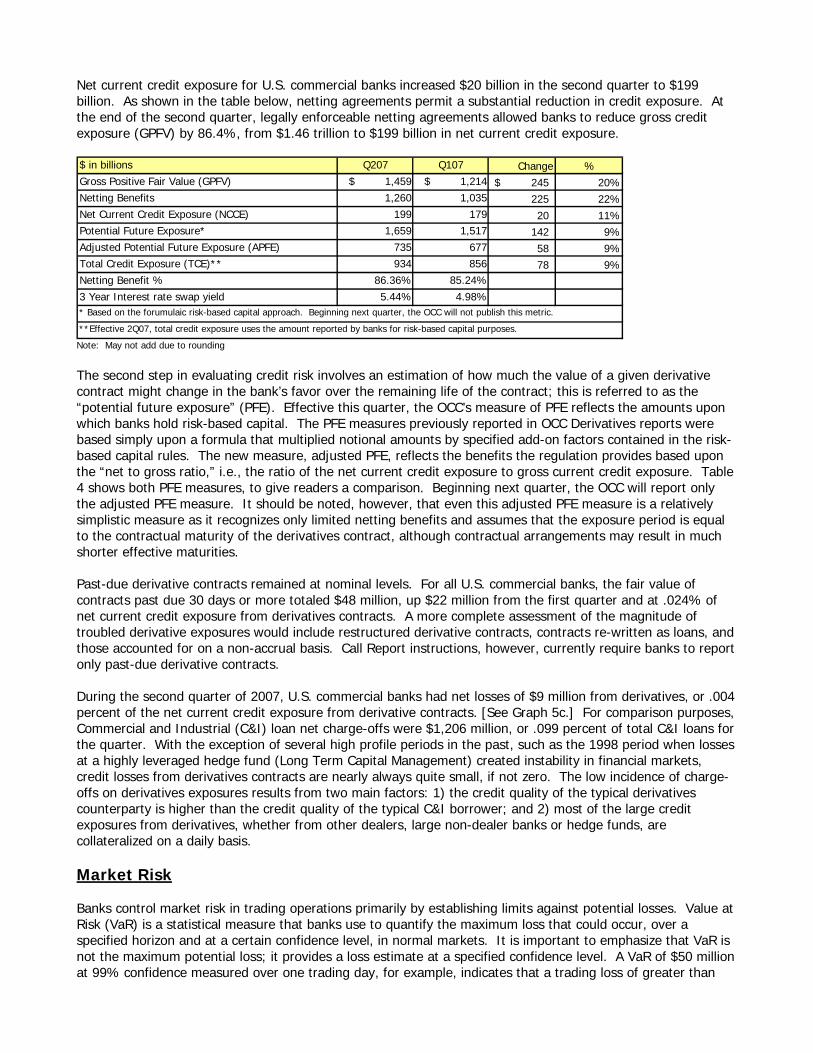
Net current credit exposure for U.S. commercial banks increased $20 billion in the second quarter to $199 billion. As shown in the table below, netting agreements permit a substantial reduction in credit exposure. At the end of the second quarter, legally enforceable netting agreements allowed banks to reduce gross credit exposure (GPFV) by 86.4%, from $1.46 trillion to $199 billion in net current credit exposure. $ in billions Q207 Q107 Change %Gross Positive Fair Value (GPFV) $ 1,459 $ 1,214 245$ 20%Netting Benefits 1,260 1,035 225 22%Net Current Credit Exposure (NCCE) 199 179 20 11%Potential Future Exposure* 1,659 1,517 142 9%Adjusted Potential Future Exposure (APFE) 735 677 58 9%Total Credit Exposure (TCE)** 934 856 78 9%Netting Benefit % 86.36% 85.24%3 Year Interest rate swap yield 5.44% 4.98%
**Effective 2Q07, total credit exposure uses the amount reported by banks for risk-based capital purposes.
* Based on the forumulaic risk-based capital approach. Beginning next quarter, the OCC will not publish this metric.
Note: May not add due to rounding The second step in evaluating credit risk involves an estimation of how much the value of a given derivative contract might change in the bank’s favor over the remaining life of the contract; this is referred to as the “potential future exposure” (PFE). Effective this quarter, the OCC’s measure of PFE reflects the amounts upon which banks hold risk-based capital. The PFE measures previously reported in OCC Derivatives reports were based simply upon a formula that multiplied notional amounts by specified add-on factors contained in the risk-based capital rules. The new measure, adjusted PFE, reflects the benefits the regulation provides based upon the “net to gross ratio,” i.e., the ratio of the net current credit exposure to gross current credit exposure. Table 4 shows both PFE measures, to give readers a comparison. Beginning next quarter, the OCC will report only the adjusted PFE measure. It should be noted, however, that even this adjusted PFE measure is a relatively simplistic measure as it recognizes only limited netting benefits and assumes that the exposure period is equal to the contractual maturity of the derivatives contract, although contractual arrangements may result in much shorter effective maturities. Past-due derivative contracts remained at nominal levels. For all U.S. commercial banks, the fair value of contracts past due 30 days or more totaled $48 million, up $22 million from the first quarter and at .024% of net current credit exposure from derivatives contracts. A more complete assessment of the magnitude of troubled derivative exposures would include restructured derivative contracts, contracts re-written as loans, and those accounted for on a non-accrual basis. Call Report instructions, however, currently require banks to report only past-due derivative contracts. During the second quarter of 2007, U.S. commercial banks had net losses of $9 million from derivatives, or .004 percent of the net current credit exposure from derivative contracts. [See Graph 5c.] For comparison purposes, Commercial and Industrial (C&I) loan net charge-offs were $1,206 million, or .099 percent of total C&I loans for the quarter. With the exception of several high profile periods in the past, such as the 1998 period when losses at a highly leveraged hedge fund (Long Term Capital Management) created instability in financial markets, credit losses from derivatives contracts are nearly always quite small, if not zero. The low incidence of charge-offs on derivatives exposures results from two main factors: 1) the credit quality of the typical derivatives counterparty is higher than the credit quality of the typical C&I borrower; and 2) most of the large credit exposures from derivatives, whether from other dealers, large non-dealer banks or hedge funds, are collateralized on a daily basis. Market Risk Banks control market risk in trading operations primarily by establishing limits against potential losses. Value at Risk (VaR) is a statistical measure that banks use to quantify the maximum loss that could occur, over a specified horizon and at a certain confidence level, in normal markets. It is important to emphasize that VaR is not the maximum potential loss; it provides a loss estimate at a specified confidence level. A VaR of $50 million at 99% confidence measured over one trading day, for example, indicates that a trading loss of greater than
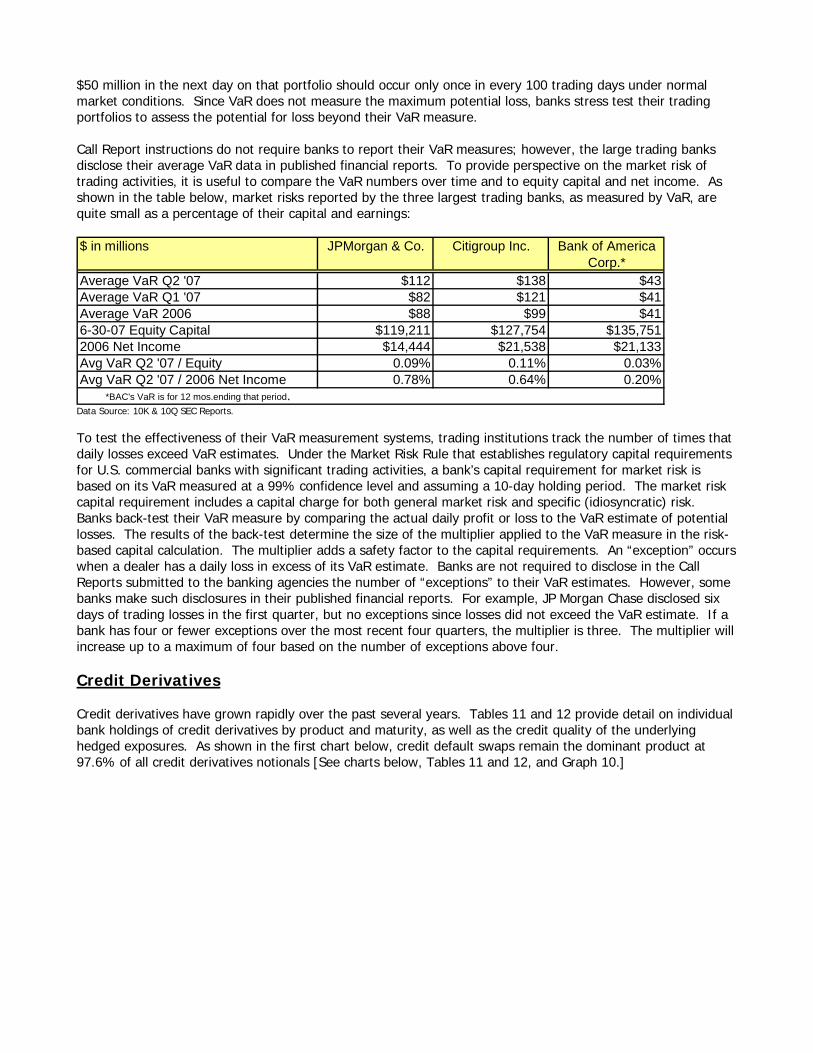
$50 million in the next day on that portfolio should occur only once in every 100 trading days under normal market conditions. Since VaR does not measure the maximum potential loss, banks stress test their trading portfolios to assess the potential for loss beyond their VaR measure. Call Report instructions do not require banks to report their VaR measures; however, the large trading banks disclose their average VaR data in published financial reports. To provide perspective on the market risk of trading activities, it is useful to compare the VaR numbers over time and to equity capital and net income. As shown in the table below, market risks reported by the three largest trading banks, as measured by VaR, are quite small as a percentage of their capital and earnings: $ in millions JPMorgan & Co. Citigroup Inc. Bank of America
Corp.*Average VaR Q2 '07 $112 $138 $43Average VaR Q1 '07 $82 $121 $41Average VaR 2006 $88 $99 $416-30-07 Equity Capital $119,211 $127,754 $135,7512006 Net Income $14,444 $21,538 $21,133Avg VaR Q2 '07 / Equity 0.09% 0.11% 0.03%Avg VaR Q2 '07 / 2006 Net Income 0.78% 0.64% 0.20% *BAC's VaR is for 12 mos.ending that period.
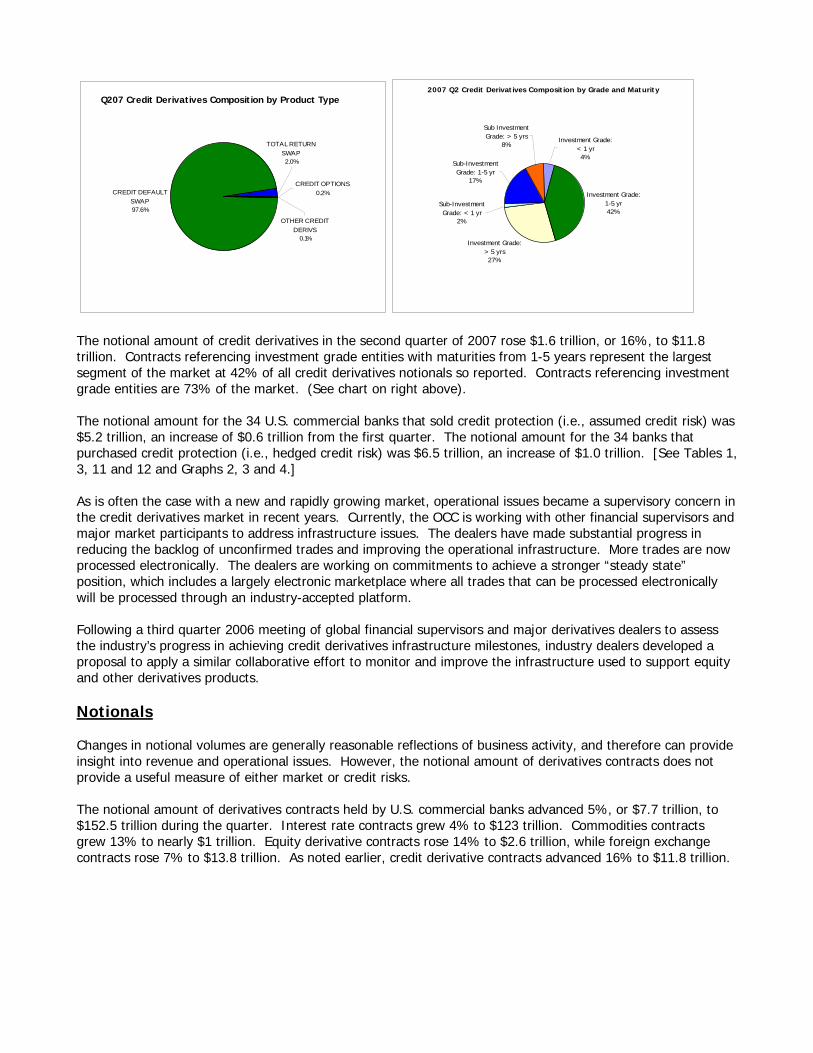
Data Source: 10K & 10Q SEC Reports. To test the effectiveness of their VaR measurement systems, trading institutions track the number of times that daily losses exceed VaR estimates. Under the Market Risk Rule that establishes regulatory capital requirements for U.S. commercial banks with significant trading activities, a bank’s capital requirement for market risk is based on its VaR measured at a 99% confidence level and assuming a 10-day holding period. The market risk capital requirement includes a capital charge for both general market risk and specific (idiosyncratic) risk. Banks back-test their VaR measure by comparing the actual daily profit or loss to the VaR estimate of potential losses. The results of the back-test determine the size of the multiplier applied to the VaR measure in the risk-based capital calculation. The multiplier adds a safety factor to the capital requirements. An “exception” occurs when a dealer has a daily loss in excess of its VaR estimate. Banks are not required to disclose in the Call Reports submitted to the banking agencies the number of “exceptions” to their VaR estimates. However, some banks make such disclosures in their published financial reports. For example, JP Morgan Chase disclosed six days of trading losses in the first quarter, but no exceptions since losses did not exceed the VaR estimate. If a bank has four or fewer exceptions over the most recent four quarters, the multiplier is three. The multiplier will increase up to a maximum of four based on the number of exceptions above four. Credit Derivatives Credit derivatives have grown rapidly over the past several years. Tables 11 and 12 provide detail on individual bank holdings of credit derivatives by product and maturity, as well as the credit quality of the underlying hedged exposures. As shown in the first chart below, credit default swaps remain the dominant product at 97.6% of all credit derivatives notionals [See charts below, Tables 11 and 12, and Graph 10.]
Q207 Credit Derivatives Composition by Product Type
CREDIT OPTIONS0.2%
TOTAL RETURN SWAP2.0%
OTHER CREDIT DERIVS
0.1%
CREDIT DEFAULT SWAP97.6%
2007 Q2 Credit Derivatives Composition by Grade and Maturity
Investment Grade: 1-5 yr42%
Investment Grade: > 5 yrs27%
Sub-Investment Grade: 1-5 yr
17%
Sub-Investment Grade: < 1 yr
2%
Sub Investment Grade: > 5 yrs
8%Investment Grade:
< 1 yr4%
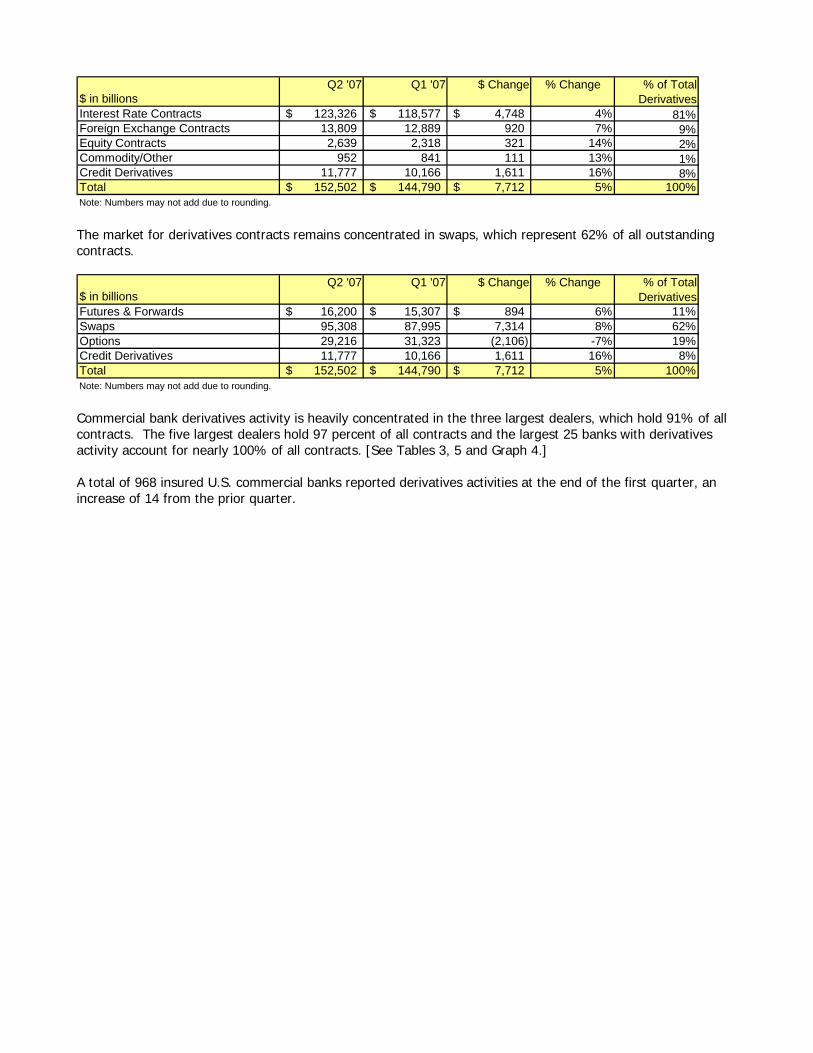
The notional amount of credit derivatives in the second quarter of 2007 rose $1.6 trillion, or 16%, to $11.8 trillion. Contracts referencing investment grade entities with maturities from 1-5 years represent the largest segment of the market at 42% of all credit derivatives notionals so reported. Contracts referencing investment grade entities are 73% of the market. (See chart on right above). The notional amount for the 34 U.S. commercial banks that sold credit protection (i.e., assumed credit risk) was $5.2 trillion, an increase of $0.6 trillion from the first quarter. The notional amount for the 34 banks that purchased credit protection (i.e., hedged credit risk) was $6.5 trillion, an increase of $1.0 trillion. [See Tables 1, 3, 11 and 12 and Graphs 2, 3 and 4.] As is often the case with a new and rapidly growing market, operational issues became a supervisory concern in the credit derivatives market in recent years. Currently, the OCC is working with other financial supervisors and major market participants to address infrastructure issues. The dealers have made substantial progress in reducing the backlog of unconfirmed trades and improving the operational infrastructure. More trades are now processed electronically. The dealers are working on commitments to achieve a stronger “steady state” position, which includes a largely electronic marketplace where all trades that can be processed electronically will be processed through an industry-accepted platform. Following a third quarter 2006 meeting of global financial supervisors and major derivatives dealers to assess the industry’s progress in achieving credit derivatives infrastructure milestones, industry dealers developed a proposal to apply a similar collaborative effort to monitor and improve the infrastructure used to support equity and other derivatives products. Notionals Changes in notional volumes are generally reasonable reflections of business activity, and therefore can provide insight into revenue and operational issues. However, the notional amount of derivatives contracts does not provide a useful measure of either market or credit risks. The notional amount of derivatives contracts held by U.S. commercial banks advanced 5%, or $7.7 trillion, to $152.5 trillion during the quarter. Interest rate contracts grew 4% to $123 trillion. Commodities contracts grew 13% to nearly $1 trillion. Equity derivative contracts rose 14% to $2.6 trillion, while foreign exchange contracts rose 7% to $13.8 trillion. As noted earlier, credit derivative contracts advanced 16% to $11.8 trillion.
$ in billionsQ2 '07 Q1 '07 $ Change % Change % of Total
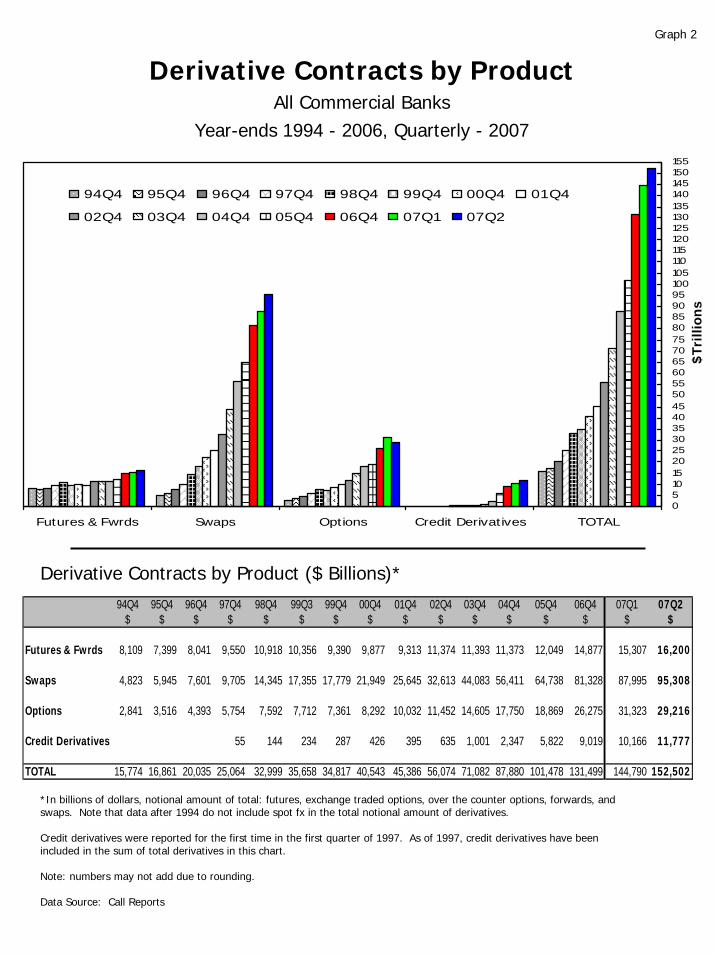
DerivativesInterest Rate Contracts 123,326$ 118,577$ 4,748$ 4% 81%Foreign Exchange Contracts 13,809 12,889 920 7% 9%Equity Contracts 2,639 2,318 321 14% 2%Commodity/Other 952 841 111 13% 1%Credit Derivatives 11,777 10,166 1,611 16% 8%Total 152,502$ 144,790$ 7,712$ 5% 100%Note: Numbers may not add due to rounding. The market for derivatives contracts remains concentrated in swaps, which represent 62% of all outstanding contracts.
$ in billionsQ2 '07 Q1 '07 $ Change % Change % of Total
DerivativesFutures & Forwards 16,200$ 15,307$ 894$ 6% 11%Swaps 95,308 87,995 7,314 8% 62%Options 29,216 31,323 (2,106) -7% 19%Credit Derivatives 11,777 10,166 1,611 16% 8%Total 152,502$ 144,790$ 7,712$ 5% 100%Note: Numbers may not add due to rounding. Commercial bank derivatives activity is heavily concentrated in the three largest dealers, which hold 91% of all contracts. The five largest dealers hold 97 percent of all contracts and the largest 25 banks with derivatives activity account for nearly 100% of all contracts. [See Tables 3, 5 and Graph 4.] A total of 968 insured U.S. commercial banks reported derivatives activities at the end of the first quarter, an increase of 14 from the prior quarter.
GLOSSARY OF TERMS Bilateral Netting: A legally enforceable arrangement between a bank and a counterparty that creates a single legal obligation covering all included individual contracts. This means that a bank’s receivable or payable, in the event of the default or insolvency of one of the parties, would be the net sum of all positive and negative fair values of contracts included in the bilateral netting arrangement. Credit Derivative: A financial contract that allows a party to take, or reduce, credit exposure (generally on a bond, loan or index). Our derivatives survey includes over-the-counter (OTC) credit derivatives, such as credit default swaps, total return swaps, and credit spread options. Derivative: A financial contract whose value is derived from the performance of underlying market factors, such as interest rates, currency exchange rates, and commodity/equity prices. Derivative transactions include a wide assortment of financial contracts including structured debt obligations and deposits, swaps, futures, options, caps, floors, collars, forwards and various combinations thereof. Gross Negative Fair Value: The sum total of the fair values of contracts where the bank owes money to its counterparties, without taking into account netting. This represents the maximum losses the bank’s counterparties would incur if the bank defaults and there is no netting of contracts, and no bank collateral was held by the counterparties. Gross negative fair values associated with credit derivatives are included. Gross Positive Fair Value: The sum total of the fair values of contracts where the bank is owed money by its counterparties, without taking into account netting. This represents the maximum losses a bank could incur if all its counterparties default and there is no netting of contracts, and the bank holds no counterparty collateral. Gross positive fair values associated with credit derivatives are included. Net Current Credit Exposure (NCCE): For a portfolio of derivative contracts, NCCE is the gross positive fair value of contracts less the dollar amount of netting benefits. On any individual contract, current credit exposure (CCE) is the fair value of the contract if positive, and zero when the fair value is negative or zero. NCCE is also the net amount owed to banks if all contracts were immediately liquidated. Notional Amount: The nominal or face amount that is used to calculate payments made on swaps and other risk management products. This amount generally does not change hands and is thus referred to as notional. Over-the-Counter Derivative Contracts: Privately negotiated derivative contracts that are transacted off organized exchanges. Potential Future Exposure (PFE): An estimate of what the current credit exposure (CCE) could be over time, based upon a supervisory formula in the agencies’ risk-based capital rules. PFE is generally determined by multiplying the notional amount of the contract by a credit conversion factor that is based upon the underlying market factor (e.g., interest rates, commodity prices, equity prices, etc.) and the contract’s remaining maturity. However, the risk-based capital rules permit banks to adjust the formulaic PFE measure by the “net to gross ratio,” which proxies the risk-reduction benefits attributable to a valid bilateral netting contract. PFE data in this report uses the amounts upon which banks hold risk-based capital. Total Credit Exposure (TCE): The sum total of net current credit exposure (NCCE) and potential future exposure (PFE). Total Risk-Based Capital: The sum of tier 1 plus tier 2 capital. Tier 1 capital consists of common shareholders’ equity, perpetual preferred shareholders’ equity with noncumulative dividends, retained earnings, and minority interests in the equity accounts of consolidated subsidiaries. Tier 2 capital consists of subordinated debt, intermediate-term preferred stock, cumulative and long-term preferred stock, and a portion of a bank’s allowance for loan and lease losses.
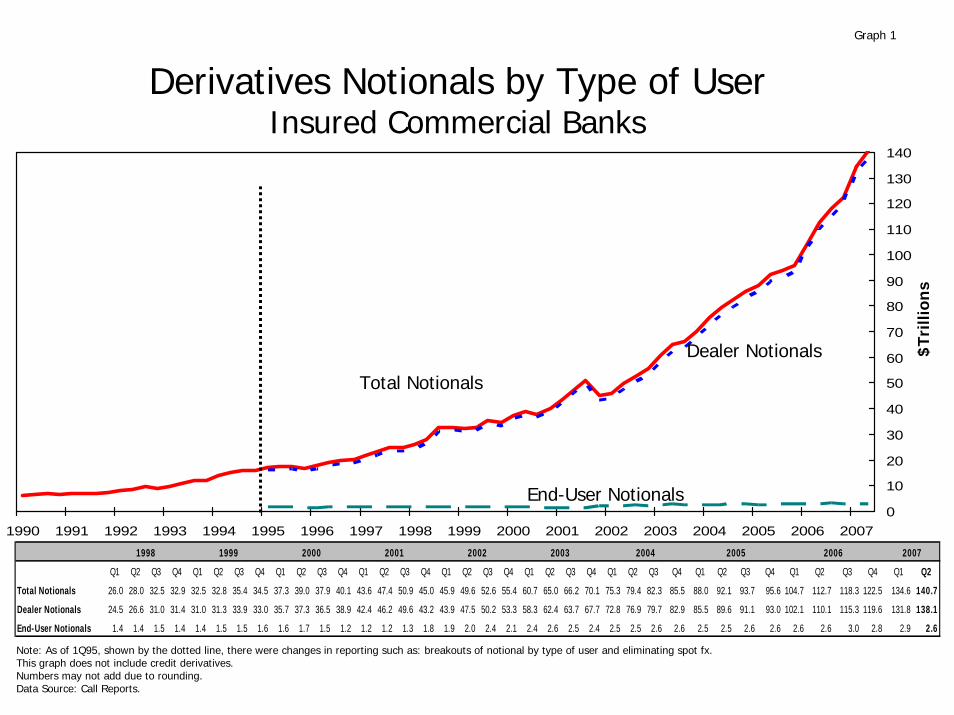
Derivatives Notionals by Type of UserInsured Commercial Banks
0
10
20
30
40
50
60
70
80
90
100
110
120
130
140
1990 1991 1992 1993 1994 1995 1996 1997 1998 1999 2000 2001 2002 2003 2004 2005 2006 2007
Total Notionals
Dealer Notionals
End-User Notionals
Note: As of 1Q95, shown by the dotted line, there were changes in reporting such as: breakouts of notional by type of user and eliminating spot fx.This graph does not include credit derivatives.Numbers may not add due to rounding.Data Source: Call Reports.
Graph 1
$Tr
illio
ns
Q1 Q2 Q3 Q4 Q1 Q2 Q3 Q4 Q1 Q2 Q3 Q4 Q1 Q2 Q3 Q4 Q1 Q2 Q3 Q4 Q1 Q2 Q3 Q4 Q1 Q2 Q3 Q4 Q1 Q2 Q3 Q4 Q1 Q2 Q3 Q4 Q1 Q2
Total Notionals 26.0 28.0 32.5 32.9 32.5 32.8 35.4 34.5 37.3 39.0 37.9 40.1 43.6 47.4 50.9 45.0 45.9 49.6 52.6 55.4 60.7 65.0 66.2 70.1 75.3 79.4 82.3 85.5 88.0 92.1 93.7 95.6 104.7 112.7 118.3 122.5 134.6 140.7
Dealer Notionals 24.5 26.6 31.0 31.4 31.0 31.3 33.9 33.0 35.7 37.3 36.5 38.9 42.4 46.2 49.6 43.2 43.9 47.5 50.2 53.3 58.3 62.4 63.7 67.7 72.8 76.9 79.7 82.9 85.5 89.6 91.1 93.0 102.1 110.1 115.3 119.6 131.8 138.1
End-User Notionals 1.4 1.4 1.5 1.4 1.4 1.5 1.5 1.6 1.6 1.7 1.5 1.2 1.2 1.2 1.3 1.8 1.9 2.0 2.4 2.1 2.4 2.6 2.5 2.4 2.5 2.5 2.6 2.6 2.5 2.5 2.6 2.6 2.6 2.6 3.0 2.8 2.9 2.6
1998 1999 2000 2001 200720062002 2003 2004 2005
Derivative Contracts by ProductAll Commercial Banks
Year-ends 1994 - 2006, Quarterly - 2007
05101520253035404550556065707580859095100105110115120125130135140145150155
Futures & Fwrds Swaps Options Credit Derivatives TOTAL
94Q4 95Q4 96Q4 97Q4 98Q4 99Q4 00Q4 01Q4
02Q4 03Q4 04Q4 05Q4 06Q4 07Q1 07Q2
*In billions of dollars, notional amount of total: futures, exchange traded options, over the counter options, forwards, and swaps. Note that data after 1994 do not include spot fx in the total notional amount of derivatives.
Credit derivatives were reported for the first time in the first quarter of 1997. As of 1997, credit derivatives have been included in the sum of total derivatives in this chart.
Note: numbers may not add due to rounding.
Data Source: Call Reports
Graph 2
Derivative Contracts by Product ($ Billions)*
$Tri
llion
s
94Q4 95Q4 96Q4 97Q4 98Q4 99Q3 99Q4 00Q4 01Q4 02Q4 03Q4 04Q4 05Q4 06Q4 07Q1 07Q2$ $ $ $ $ $ $ $ $ $ $ $ $ $ $ $
Futures & Fwrds 8,109 7,399 8,041 9,550 10,918 10,356 9,390 9,877 9,313 11,374 11,393 11,373 12,049 14,877 15,307 16,200
Swaps 4,823 5,945 7,601 9,705 14,345 17,355 17,779 21,949 25,645 32,613 44,083 56,411 64,738 81,328 87,995 95,308
Options 2,841 3,516 4,393 5,754 7,592 7,712 7,361 8,292 10,032 11,452 14,605 17,750 18,869 26,275 31,323 29,216
Credit Derivatives 55 144 234 287 426 395 635 1,001 2,347 5,822 9,019 10,166 11,777
TOTAL 15,774 16,861 20,035 25,064 32,999 35,658 34,817 40,543 45,386 56,074 71,082 87,880 101,478 131,499 144,790 152,502
05101520253035404550556065707580859095100105110115120125130135140145150155
Interest Rate Foreign Exch Equities Commodities CreditDerivatives
TOTAL
94Q4 95Q4 96Q4 97Q4 98Q4 99Q4 00Q4 01Q4
02Q4 03Q4 04Q4 05Q4 06Q4 07Q1 07Q2
*In billions of dollars, notional amount of total: futures, exchange traded options, over the counter options, forwards, and swaps. Note that data after 1994 do not include spot fx in the total notional amount of derivatives.
As of Q206 equities and commodities types are shown as separate categories. They were previously shown as “Other Derivs”.
Credit derivatives were reported for the first time in the first quarter of 1997. Since then, credit derivatives have been included in the sum of total derivatives in this chart.
Note: numbers may not add due to rounding.
Data Source: Call Reports
Graph 3
Derivative Contracts by Type ($ Billions)*
Derivative Contracts by TypeAll Commercial Banks
Year-ends 1994 - 2006, Quarterly - 2007
$Tr
illio
ns
$ in Billions 94Q4 95Q4 96Q4 97Q4 98Q4 99Q4 00Q4 01Q3 01Q4 02Q4 03Q4 04Q4 05Q4 06Q4 07Q2$ $ $ $ $ $ $ $ $ $ $ $ $ $ $
Interest Rate 9,926 11,095 13,427 17,085 24,785 27,772 32,938 43,147 38,305 48,347 61,856 75,518 84,520 107,415 123,326
Foreign Exch 5,605 5,387 6,241 7,430 7,386 5,915 6,099 6,642 5,736 6,076 7,182 8,607 9,282 11,900 13,809
Equities 237 197 331 501 672 858 929 770 783 829 1,120 1,255 2,271 2,639
Commodities 141 170 163 183 171 222 207 179 233 214 289 598 893 952
Credit Derivatives 55 144 287 426 360 395 635 1,001 2,347 5,822 9,019 11,777
TOTAL 15,774 16,861 20,035 25,064 32,999 34,816 40,543 51,284 45,385 56,075 71,082 87,880 101,477 131,499 152,502
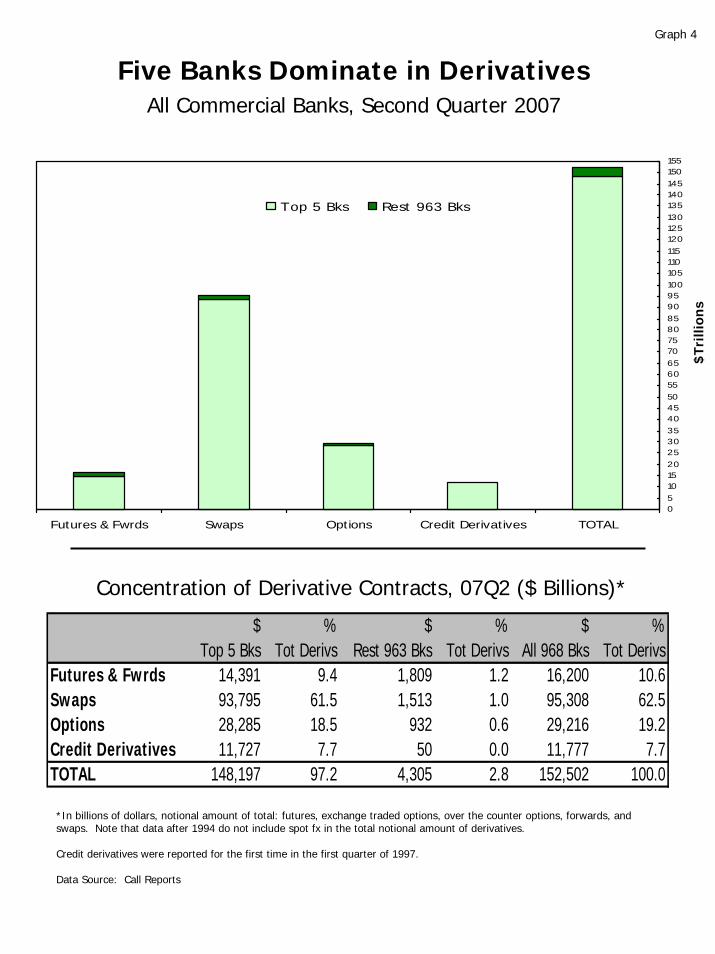
Five Banks Dominate in Derivatives All Commercial Banks, Second Quarter 2007
05101520253035404550556065707580859095100105110115120125130135140145150155
Futures & Fwrds Swaps Options Credit Derivatives TOTAL
Top 5 Bks Rest 963 Bks
*In billions of dollars, notional amount of total: futures, exchange traded options, over the counter options, forwards, and swaps. Note that data after 1994 do not include spot fx in the total notional amount of derivatives.
Credit derivatives were reported for the first time in the first quarter of 1997.
Data Source: Call Reports
Graph 4
Concentration of Derivative Contracts, 07Q2 ($ Billions)*
$Tri
llion
s
$ % $ % $ %Top 5 Bks Tot Derivs Rest 963 Bks Tot Derivs All 968 Bks Tot Derivs
Futures & Fwrds 14,391 9.4 1,809 1.2 16,200 10.6Swaps 93,795 61.5 1,513 1.0 95,308 62.5Options 28,285 18.5 932 0.6 29,216 19.2Credit Derivatives 11,727 7.7 50 0.0 11,777 7.7TOTAL 148,197 97.2 4,305 2.8 152,502 100.0
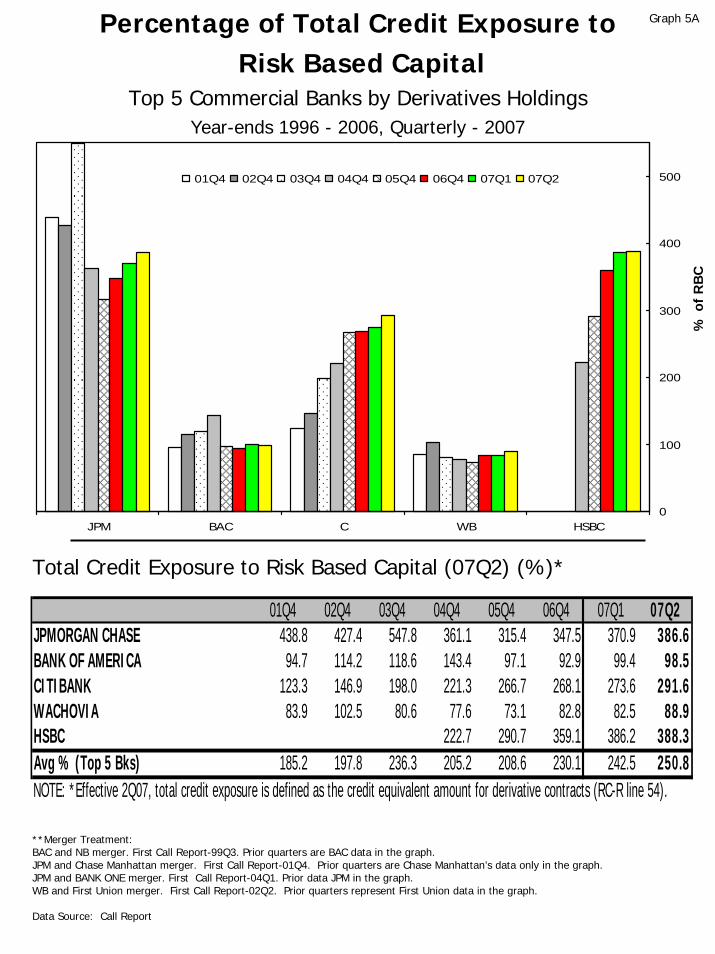
Percentage of Total Credit Exposure toRisk Based Capital
Top 5 Commercial Banks by Derivatives HoldingsYear-ends 1996 - 2006, Quarterly - 2007
0
100
200
300
400
500
JPM BAC C WB HSBC
01Q4 02Q4 03Q4 04Q4 05Q4 06Q4 07Q1 07Q2
**Merger Treatment: BAC and NB merger. First Call Report-99Q3. Prior quarters are BAC data in the graph.JPM and Chase Manhattan merger. First Call Report-01Q4. Prior quarters are Chase Manhattan’s data only in the graph. JPM and BANK ONE merger. First Call Report-04Q1. Prior data JPM in the graph.WB and First Union merger. First Call Report-02Q2. Prior quarters represent First Union data in the graph.
Data Source: Call Report
Graph 5A
% o
f R
BC
Total Credit Exposure to Risk Based Capital (07Q2) (%)*
01Q4 02Q4 03Q4 04Q4 05Q4 06Q4 07Q1 07Q2JPMORGAN CHASE 438.8 427.4 547.8 361.1 315.4 347.5 370.9 386.6BANK OF AMERICA 94.7 114.2 118.6 143.4 97.1 92.9 99.4 98.5CITIBANK 123.3 146.9 198.0 221.3 266.7 268.1 273.6 291.6WACHOVIA 83.9 102.5 80.6 77.6 73.1 82.8 82.5 88.9HSBC 222.7 290.7 359.1 386.2 388.3Avg % (Top 5 Bks) 185.2 197.8 236.3 205.2 208.6 230.1 242.5 250.8NOTE: *Effective 2Q07, total credit exposure is defined as the credit equivalent amount for derivative contracts (RC-R line 54).
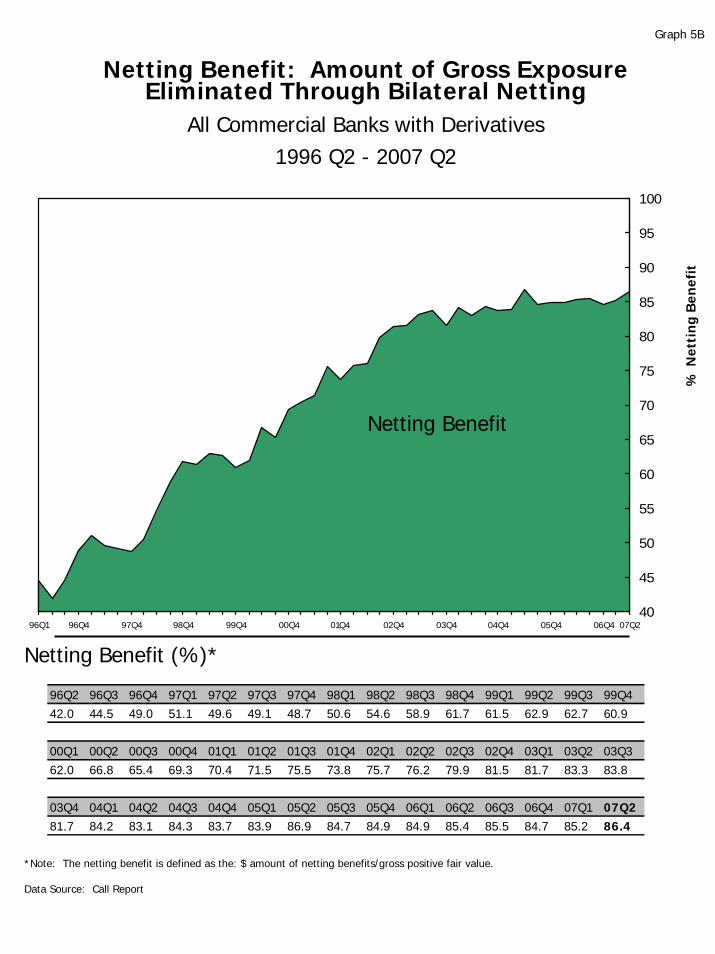
Netting Benefit: Amount of Gross Exposure Eliminated Through Bilateral Netting
All Commercial Banks with Derivatives1996 Q2 - 2007 Q2
40
45
50
55
60
65
70
75
80
85
90
95
100
96Q1 96Q4 97Q4 98Q4 99Q4 00Q4 01Q4 02Q4 03Q4 04Q4 05Q4 06Q4 07Q2
*Note: The netting benefit is defined as the: $ amount of netting benefits/gross positive fair value.
Data Source: Call Report
Graph 5B
Netting Benefit (%)*
Netting Benefit
% N
etti
ng
Ben
efit
96Q2 96Q3 96Q4 97Q1 97Q2 97Q3 97Q4 98Q1 98Q2 98Q3 98Q4 99Q1 99Q2 99Q3 99Q442.0 44.5 49.0 51.1 49.6 49.1 48.7 50.6 54.6 58.9 61.7 61.5 62.9 62.7 60.9
00Q1 00Q2 00Q3 00Q4 01Q1 01Q2 01Q3 01Q4 02Q1 02Q2 02Q3 02Q4 03Q1 03Q2 03Q362.0 66.8 65.4 69.3 70.4 71.5 75.5 73.8 75.7 76.2 79.9 81.5 81.7 83.3 83.8
03Q4 04Q1 04Q2 04Q3 04Q4 05Q1 05Q2 05Q3 05Q4 06Q1 06Q2 06Q3 06Q4 07Q1 07Q281.7 84.2 83.1 84.3 83.7 83.9 86.9 84.7 84.9 84.9 85.4 85.5 84.7 85.2 86.4
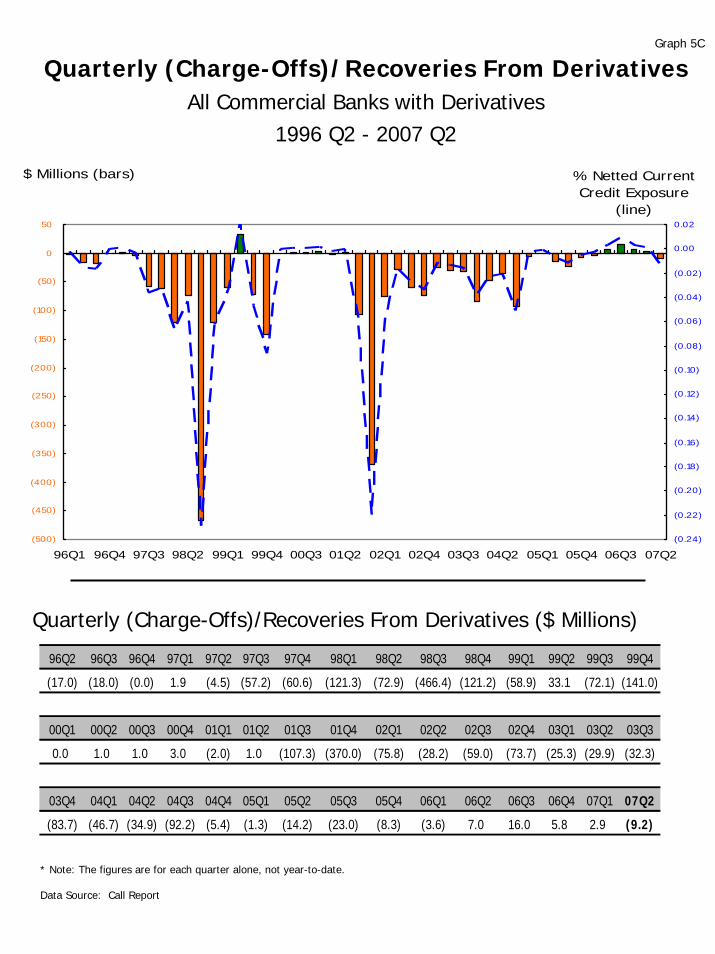
Quarterly (Charge-Offs)/Recoveries From DerivativesAll Commercial Banks with Derivatives
1996 Q2 - 2007 Q2
(500)
(450)
(400)
(350)
(300)
(250)
(200)
(150)
(100)
(50)
0
50
96Q1 96Q4 97Q3 98Q2 99Q1 99Q4 00Q3 01Q2 02Q1 02Q4 03Q3 04Q2 05Q1 05Q4 06Q3 07Q2
$ Millions (bars)
(0.24)
(0.22)
(0.20)
(0.18)
(0.16)
(0.14)
(0.12)
(0.10)
(0.08)
(0.06)
(0.04)
(0.02)
0.00
0.02
% Netted Current Credit Exposure
(line)
* Note: The figures are for each quarter alone, not year-to-date.
Data Source: Call Report
Graph 5C
Quarterly (Charge-Offs)/Recoveries From Derivatives ($ Millions)
96Q2 96Q3 96Q4 97Q1 97Q2 97Q3 97Q4 98Q1 98Q2 98Q3 98Q4 99Q1 99Q2 99Q3 99Q4
(17.0) (18.0) (0.0) 1.9 (4.5) (57.2) (60.6) (121.3) (72.9) (466.4) (121.2) (58.9) 33.1 (72.1) (141.0)
00Q1 00Q2 00Q3 00Q4 01Q1 01Q2 01Q3 01Q4 02Q1 02Q2 02Q3 02Q4 03Q1 03Q2 03Q3
0.0 1.0 1.0 3.0 (2.0) 1.0 (107.3) (370.0) (75.8) (28.2) (59.0) (73.7) (25.3) (29.9) (32.3)
03Q4 04Q1 04Q2 04Q3 04Q4 05Q1 05Q2 05Q3 05Q4 06Q1 06Q2 06Q3 06Q4 07Q1 07Q2
(83.7) (46.7) (34.9) (92.2) (5.4) (1.3) (14.2) (23.0) (8.3) (3.6) 7.0 16.0 5.8 2.9 (9.2)
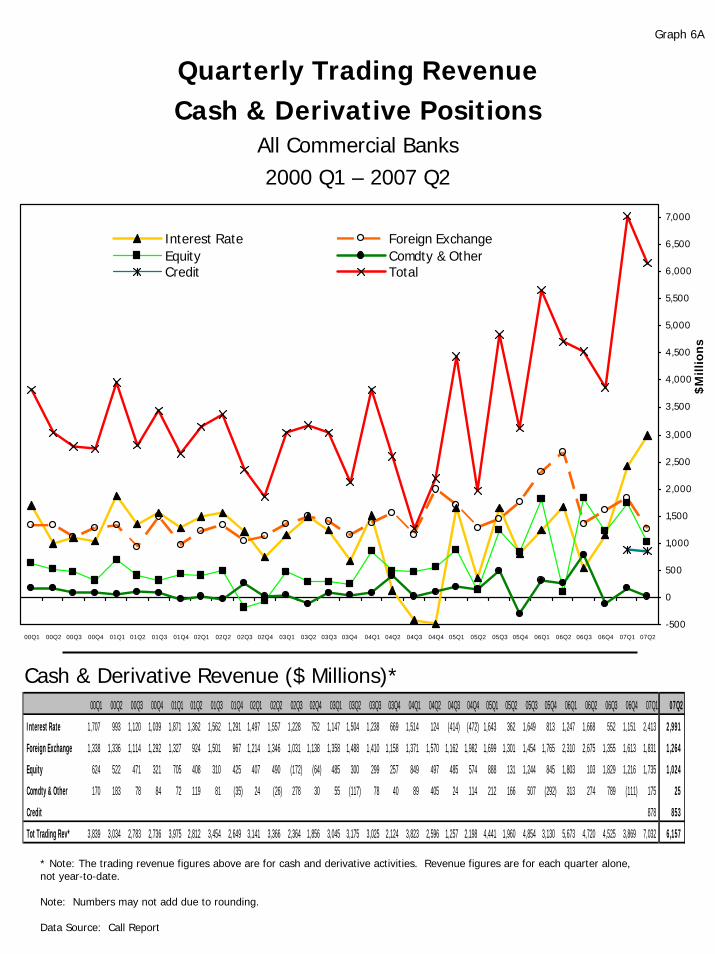
Quarterly Trading RevenueCash & Derivative Positions
All Commercial Banks2000 Q1 – 2007 Q2
-500
0
500
1,000
1,500
2,000
2,500
3,000
3,500
4,000
4,500
5,000
5,500
6,000
6,500
7,000
00Q1 00Q2 00Q3 00Q4 01Q1 01Q2 01Q3 01Q4 02Q1 02Q2 02Q3 02Q4 03Q1 03Q2 03Q3 03Q4 04Q1 04Q2 04Q3 04Q4 05Q1 05Q2 05Q3 05Q4 06Q1 06Q2 06Q3 06Q4 07Q1 07Q2
Interest Rate Foreign ExchangeEquity Comdty & OtherCredit Total
* Note: The trading revenue figures above are for cash and derivative activities. Revenue figures are for each quarter alone, not year-to-date.
Note: Numbers may not add due to rounding.
Data Source: Call Report
Graph 6A
Cash & Derivative Revenue ($ Millions)*$
Mill
ion
s00Q1 00Q2 00Q3 00Q4 01Q1 01Q2 01Q3 01Q4 02Q1 02Q2 02Q3 02Q4 03Q1 03Q2 03Q3 03Q4 04Q1 04Q2 04Q3 04Q4 05Q1 05Q2 05Q3 05Q4 06Q1 06Q2 06Q3 06Q4 07Q1 07Q2
Interest Rate 1,707 993 1,120 1,039 1,871 1,362 1,562 1,291 1,497 1,557 1,228 752 1,147 1,504 1,238 669 1,514 124 (414) (472) 1,643 362 1,649 813 1,247 1,668 552 1,151 2,413 2,991
Foreign Exchange 1,338 1,336 1,114 1,292 1,327 924 1,501 967 1,214 1,346 1,031 1,138 1,358 1,488 1,410 1,158 1,371 1,570 1,162 1,982 1,699 1,301 1,454 1,765 2,310 2,675 1,355 1,613 1,831 1,264
Equity 624 522 471 321 705 408 310 425 407 490 (172) (64) 485 300 299 257 849 497 485 574 888 131 1,244 845 1,803 103 1,829 1,216 1,735 1,024
Comdty & Other 170 183 78 84 72 119 81 (35) 24 (26) 278 30 55 (117) 78 40 89 405 24 114 212 166 507 (292) 313 274 789 (111) 175 25
Credit 878 853
Tot Trading Rev* 3,839 3,034 2,783 2,736 3,975 2,812 3,454 2,649 3,141 3,366 2,364 1,856 3,045 3,175 3,025 2,124 3,823 2,596 1,257 2,198 4,441 1,960 4,854 3,130 5,673 4,720 4,525 3,869 7,032 6,157
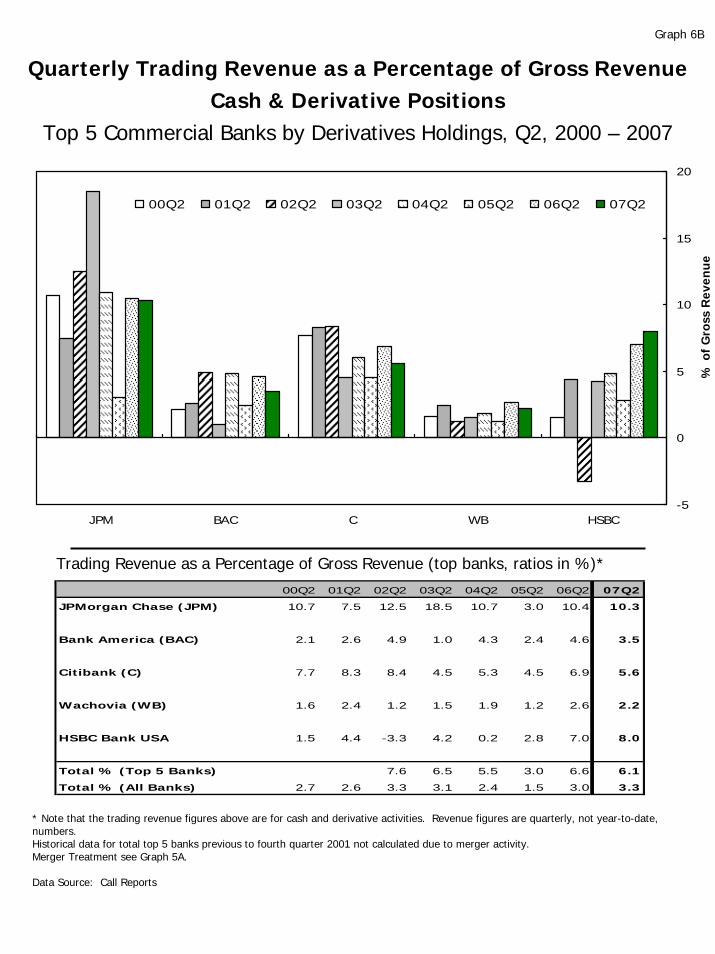
Quarterly Trading Revenue as a Percentage of Gross RevenueCash & Derivative Positions
Top 5 Commercial Banks by Derivatives Holdings, Q2, 2000 – 2007
-5
0
5
10
15
20
JPM BAC C WB HSBC
00Q2 01Q2 02Q2 03Q2 04Q2 05Q2 06Q2 07Q2
* Note that the trading revenue figures above are for cash and derivative activities. Revenue figures are quarterly, not year-to-date, numbers.Historical data for total top 5 banks previous to fourth quarter 2001 not calculated due to merger activity.Merger Treatment see Graph 5A.
Data Source: Call Reports
Graph 6B
Trading Revenue as a Percentage of Gross Revenue (top banks, ratios in %)*
% o
f G
ross
Rev
enu
e
00Q2 01Q2 02Q2 03Q2 04Q2 05Q2 06Q2 07Q2
JPMorgan Chase (JPM) 10.7 7.5 12.5 18.5 10.7 3.0 10.4 10.3
Bank America (BAC) 2.1 2.6 4.9 1.0 4.3 2.4 4.6 3.5
Citibank (C) 7.7 8.3 8.4 4.5 5.3 4.5 6.9 5.6
Wachovia (WB) 1.6 2.4 1.2 1.5 1.9 1.2 2.6 2.2
HSBC Bank USA 1.5 4.4 -3.3 4.2 0.2 2.8 7.0 8.0
Total % (Top 5 Banks) 7.6 6.5 5.5 3.0 6.6 6.1
Total % (All Banks) 2.7 2.6 3.3 3.1 2.4 1.5 3.0 3.3
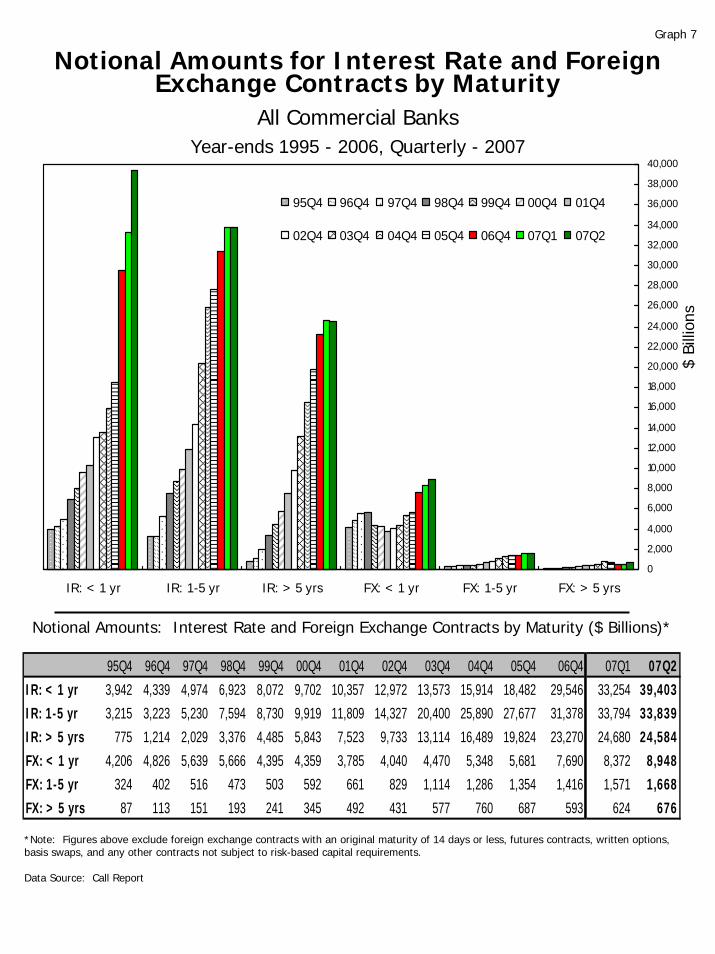
Notional Amounts for Interest Rate and Foreign Exchange Contracts by Maturity
All Commercial BanksYear-ends 1995 - 2006, Quarterly - 2007
0
2,000
4,000
6,000
8,000
10,000
12,000
14,000
16,000
18,000
20,000
22,000
24,000
26,000
28,000
30,000
32,000
34,000
36,000
38,000
40,000
IR: < 1 yr IR: 1-5 yr IR: > 5 yrs FX: < 1 yr FX: 1-5 yr FX: > 5 yrs
95Q4 96Q4 97Q4 98Q4 99Q4 00Q4 01Q4
02Q4 03Q4 04Q4 05Q4 06Q4 07Q1 07Q2
*Note: Figures above exclude foreign exchange contracts with an original maturity of 14 days or less, futures contracts, written options, basis swaps, and any other contracts not subject to risk-based capital requirements.
Data Source: Call Report
Graph 7
Notional Amounts: Interest Rate and Foreign Exchange Contracts by Maturity ($ Billions)*
$ Bi
llion
s95Q4 96Q4 97Q4 98Q4 99Q4 00Q4 01Q4 02Q4 03Q4 04Q4 05Q4 06Q4 07Q1 07Q2
IR: < 1 yr 3,942 4,339 4,974 6,923 8,072 9,702 10,357 12,972 13,573 15,914 18,482 29,546 33,254 39,403IR: 1-5 yr 3,215 3,223 5,230 7,594 8,730 9,919 11,809 14,327 20,400 25,890 27,677 31,378 33,794 33,839IR: > 5 yrs 775 1,214 2,029 3,376 4,485 5,843 7,523 9,733 13,114 16,489 19,824 23,270 24,680 24,584FX: < 1 yr 4,206 4,826 5,639 5,666 4,395 4,359 3,785 4,040 4,470 5,348 5,681 7,690 8,372 8,948FX: 1-5 yr 324 402 516 473 503 592 661 829 1,114 1,286 1,354 1,416 1,571 1,668FX: > 5 yrs 87 113 151 193 241 345 492 431 577 760 687 593 624 676
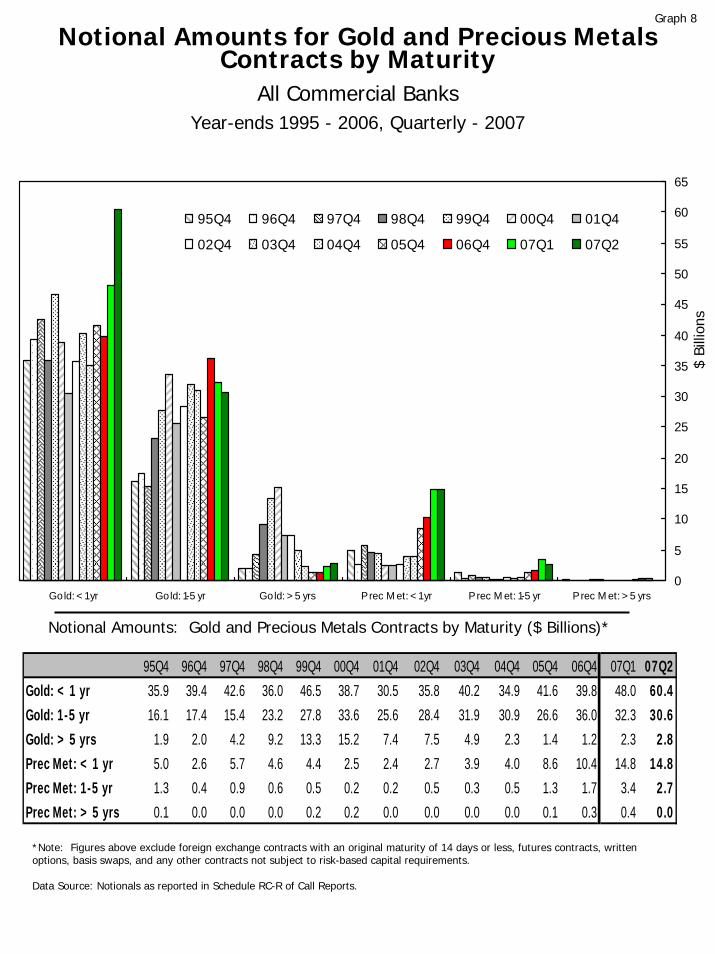
Notional Amounts for Gold and Precious Metals Contracts by Maturity
All Commercial BanksYear-ends 1995 - 2006, Quarterly - 2007
0
5
10
15
20
25
30
35
40
45
50
55
60
65
Gold: < 1 yr Gold: 1-5 yr Gold: > 5 yrs Prec M et: < 1 yr Prec M et: 1-5 yr Prec M et: > 5 yrs
95Q4 96Q4 97Q4 98Q4 99Q4 00Q4 01Q4
02Q4 03Q4 04Q4 05Q4 06Q4 07Q1 07Q2
*Note: Figures above exclude foreign exchange contracts with an original maturity of 14 days or less, futures contracts, written options, basis swaps, and any other contracts not subject to risk-based capital requirements.
Data Source: Notionals as reported in Schedule RC-R of Call Reports.
Graph 8
Notional Amounts: Gold and Precious Metals Contracts by Maturity ($ Billions)*
$ Bi
llion
s
95Q4 96Q4 97Q4 98Q4 99Q4 00Q4 01Q4 02Q4 03Q4 04Q4 05Q4 06Q4 07Q1 07Q2Gold: < 1 yr 35.9 39.4 42.6 36.0 46.5 38.7 30.5 35.8 40.2 34.9 41.6 39.8 48.0 60.4Gold: 1-5 yr 16.1 17.4 15.4 23.2 27.8 33.6 25.6 28.4 31.9 30.9 26.6 36.0 32.3 30.6Gold: > 5 yrs 1.9 2.0 4.2 9.2 13.3 15.2 7.4 7.5 4.9 2.3 1.4 1.2 2.3 2.8Prec Met: < 1 yr 5.0 2.6 5.7 4.6 4.4 2.5 2.4 2.7 3.9 4.0 8.6 10.4 14.8 14.8Prec Met: 1-5 yr 1.3 0.4 0.9 0.6 0.5 0.2 0.2 0.5 0.3 0.5 1.3 1.7 3.4 2.7Prec Met: > 5 yrs 0.1 0.0 0.0 0.0 0.2 0.2 0.0 0.0 0.0 0.0 0.1 0.3 0.4 0.0
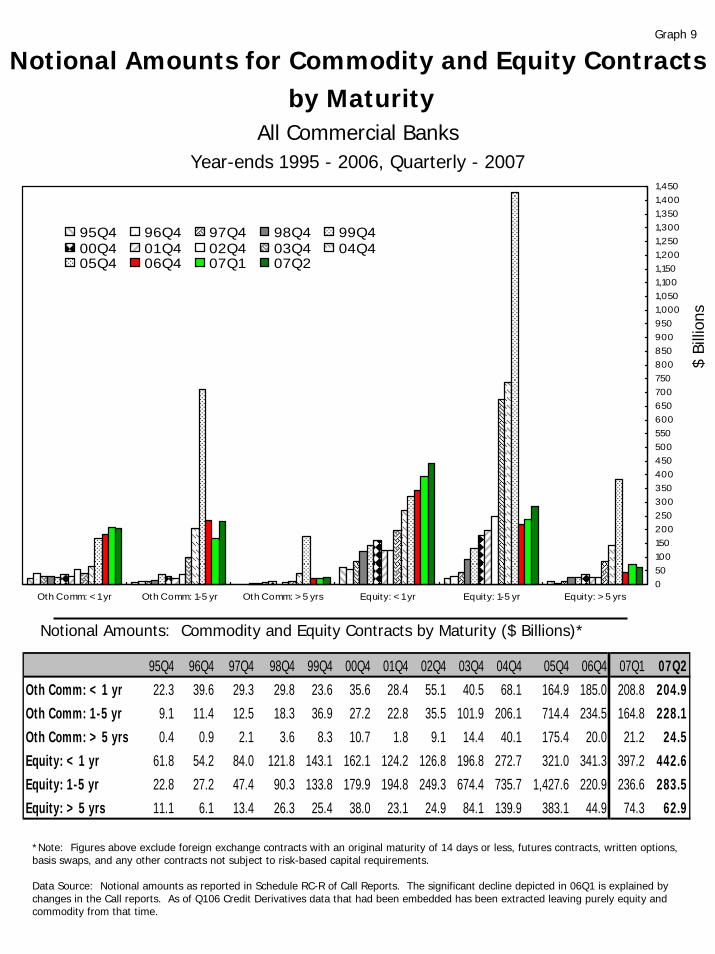
Notional Amounts for Commodity and Equity Contractsby Maturity
All Commercial BanksYear-ends 1995 - 2006, Quarterly - 2007
0501001502002503003504004505005506006507007508008509009501,0001,0501,1001,1501,2001,2501,3001,3501,4001,450
Oth Comm: < 1 yr Oth Comm: 1-5 yr Oth Comm: > 5 yrs Equity: < 1 yr Equity: 1-5 yr Equity: > 5 yrs
95Q4 96Q4 97Q4 98Q4 99Q400Q4 01Q4 02Q4 03Q4 04Q405Q4 06Q4 07Q1 07Q2
*Note: Figures above exclude foreign exchange contracts with an original maturity of 14 days or less, futures contracts, written options, basis swaps, and any other contracts not subject to risk-based capital requirements.
Data Source: Notional amounts as reported in Schedule RC-R of Call Reports. The significant decline depicted in 06Q1 is explained by changes in the Call reports. As of Q106 Credit Derivatives data that had been embedded has been extracted leaving purely equity and commodity from that time.
Graph 9
Notional Amounts: Commodity and Equity Contracts by Maturity ($ Billions)*
$ Bi
llion
s
95Q4 96Q4 97Q4 98Q4 99Q4 00Q4 01Q4 02Q4 03Q4 04Q4 05Q4 06Q4 07Q1 07Q2Oth Comm: < 1 yr 22.3 39.6 29.3 29.8 23.6 35.6 28.4 55.1 40.5 68.1 164.9 185.0 208.8 204.9Oth Comm: 1-5 yr 9.1 11.4 12.5 18.3 36.9 27.2 22.8 35.5 101.9 206.1 714.4 234.5 164.8 228.1Oth Comm: > 5 yrs 0.4 0.9 2.1 3.6 8.3 10.7 1.8 9.1 14.4 40.1 175.4 20.0 21.2 24.5Equity: < 1 yr 61.8 54.2 84.0 121.8 143.1 162.1 124.2 126.8 196.8 272.7 321.0 341.3 397.2 442.6Equity: 1-5 yr 22.8 27.2 47.4 90.3 133.8 179.9 194.8 249.3 674.4 735.7 1,427.6 220.9 236.6 283.5Equity: > 5 yrs 11.1 6.1 13.4 26.3 25.4 38.0 23.1 24.9 84.1 139.9 383.1 44.9 74.3 62.9
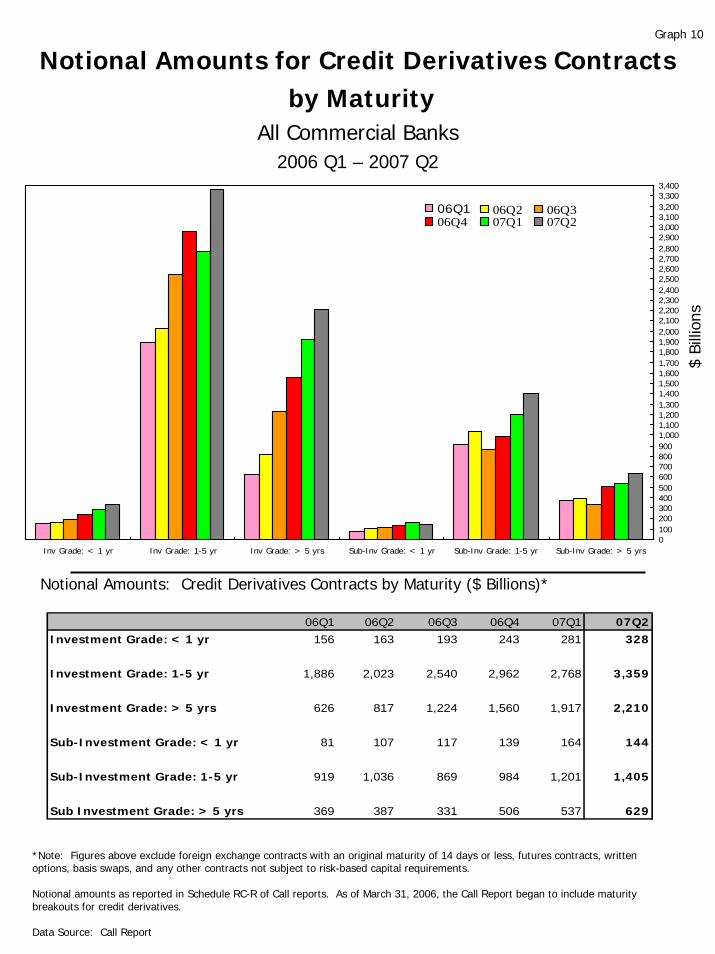
Notional Amounts for Credit Derivatives Contractsby Maturity
All Commercial Banks2006 Q1 – 2007 Q2
01002003004005006007008009001,0001,1001,2001,3001,4001,5001,6001,7001,8001,9002,0002,1002,2002,3002,4002,5002,6002,7002,8002,9003,0003,1003,2003,3003,400
Inv Grade: < 1 yr Inv Grade: 1-5 yr Inv Grade: > 5 yrs Sub-Inv Grade: < 1 yr Sub-Inv Grade: 1-5 yr Sub-Inv Grade: > 5 yrs
06Q1 06Q2 06Q306Q4 07Q1 07Q2
*Note: Figures above exclude foreign exchange contracts with an original maturity of 14 days or less, futures contracts, written options, basis swaps, and any other contracts not subject to risk-based capital requirements.
Notional amounts as reported in Schedule RC-R of Call reports. As of March 31, 2006, the Call Report began to include maturity breakouts for credit derivatives.
Data Source: Call Report
Graph 10
Notional Amounts: Credit Derivatives Contracts by Maturity ($ Billions)*
$ Bi
llion
s
06Q1 06Q2 06Q3 06Q4 07Q1 07Q2Investment Grade: < 1 yr 156 163 193 243 281 328
Investment Grade: 1-5 yr 1,886 2,023 2,540 2,962 2,768 3,359
Investment Grade: > 5 yrs 626 817 1,224 1,560 1,917 2,210
Sub-Investment Grade: < 1 yr 81 107 117 139 164 144
Sub-Investment Grade: 1-5 yr 919 1,036 869 984 1,201 1,405
Sub Investment Grade: > 5 yrs 369 387 331 506 537 629
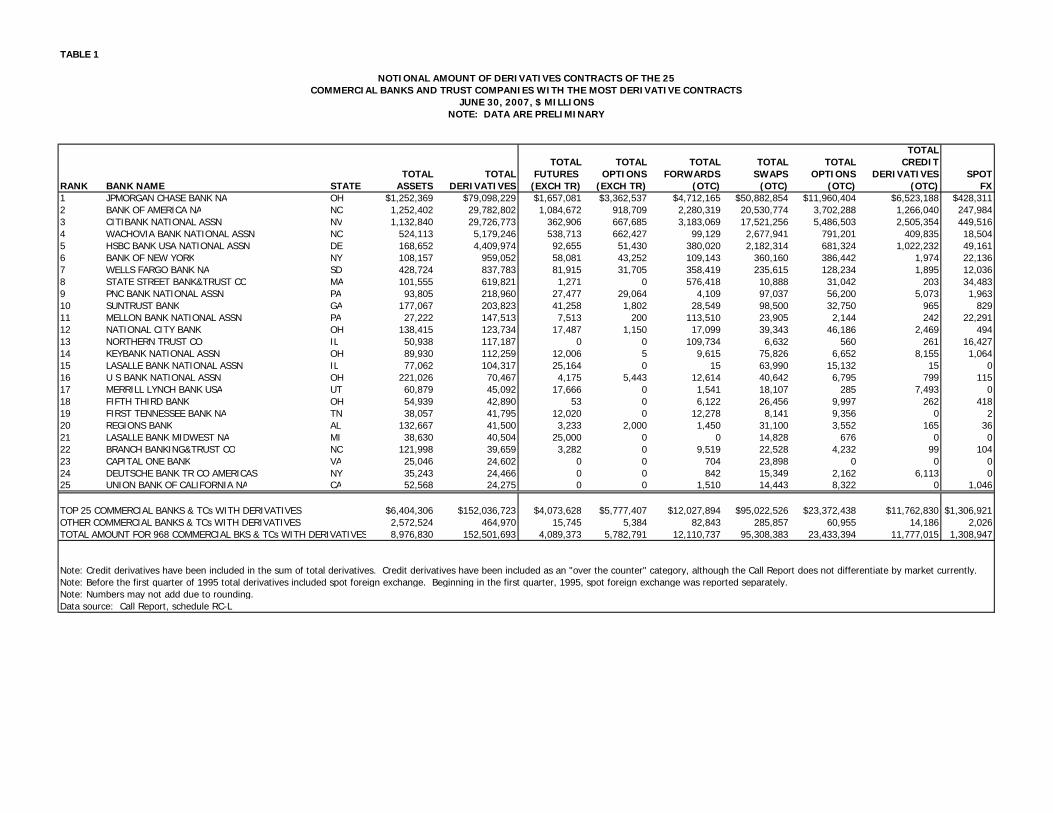
TABLE 1
TOTALTOTAL TOTAL TOTAL TOTAL TOTAL CREDIT
TOTAL TOTAL FUTURES OPTIONS FORWARDS SWAPS OPTIONS DERIVATIVES SPOTRANK BANK NAME STATE ASSETS DERIVATIVES (EXCH TR) (EXCH TR) (OTC) (OTC) (OTC) (OTC) FX1 JPMORGAN CHASE BANK NA OH $1,252,369 $79,098,229 $1,657,081 $3,362,537 $4,712,165 $50,882,854 $11,960,404 $6,523,188 $428,3112 BANK OF AMERICA NA NC 1,252,402 29,782,802 1,084,672 918,709 2,280,319 20,530,774 3,702,288 1,266,040 247,9843 CITIBANK NATIONAL ASSN NV 1,132,840 29,726,773 362,906 667,685 3,183,069 17,521,256 5,486,503 2,505,354 449,5164 WACHOVIA BANK NATIONAL ASSN NC 524,113 5,179,246 538,713 662,427 99,129 2,677,941 791,201 409,835 18,5045 HSBC BANK USA NATIONAL ASSN DE 168,652 4,409,974 92,655 51,430 380,020 2,182,314 681,324 1,022,232 49,1616 BANK OF NEW YORK NY 108,157 959,052 58,081 43,252 109,143 360,160 386,442 1,974 22,1367 WELLS FARGO BANK NA SD 428,724 837,783 81,915 31,705 358,419 235,615 128,234 1,895 12,0368 STATE STREET BANK&TRUST CO MA 101,555 619,821 1,271 0 576,418 10,888 31,042 203 34,4839 PNC BANK NATIONAL ASSN PA 93,805 218,960 27,477 29,064 4,109 97,037 56,200 5,073 1,96310 SUNTRUST BANK GA 177,067 203,823 41,258 1,802 28,549 98,500 32,750 965 82911 MELLON BANK NATIONAL ASSN PA 27,222 147,513 7,513 200 113,510 23,905 2,144 242 22,29112 NATIONAL CITY BANK OH 138,415 123,734 17,487 1,150 17,099 39,343 46,186 2,469 49413 NORTHERN TRUST CO IL 50,938 117,187 0 0 109,734 6,632 560 261 16,42714 KEYBANK NATIONAL ASSN OH 89,930 112,259 12,006 5 9,615 75,826 6,652 8,155 1,06415 LASALLE BANK NATIONAL ASSN IL 77,062 104,317 25,164 0 15 63,990 15,132 15 016 U S BANK NATIONAL ASSN OH 221,026 70,467 4,175 5,443 12,614 40,642 6,795 799 11517 MERRILL LYNCH BANK USA UT 60,879 45,092 17,666 0 1,541 18,107 285 7,493 018 FIFTH THIRD BANK OH 54,939 42,890 53 0 6,122 26,456 9,997 262 41819 FIRST TENNESSEE BANK NA TN 38,057 41,795 12,020 0 12,278 8,141 9,356 0 220 REGIONS BANK AL 132,667 41,500 3,233 2,000 1,450 31,100 3,552 165 3621 LASALLE BANK MIDWEST NA MI 38,630 40,504 25,000 0 0 14,828 676 0 022 BRANCH BANKING&TRUST CO NC 121,998 39,659 3,282 0 9,519 22,528 4,232 99 10423 CAPITAL ONE BANK VA 25,046 24,602 0 0 704 23,898 0 0 024 DEUTSCHE BANK TR CO AMERICAS NY 35,243 24,466 0 0 842 15,349 2,162 6,113 025 UNION BANK OF CALIFORNIA NA CA 52,568 24,275 0 0 1,510 14,443 8,322 0 1,046
TOP 25 COMMERCIAL BANKS & TCs WITH DERIVATIVES $6,404,306 $152,036,723 $4,073,628 $5,777,407 $12,027,894 $95,022,526 $23,372,438 $11,762,830 $1,306,921OTHER COMMERCIAL BANKS & TCs WITH DERIVATIVES 2,572,524 464,970 15,745 5,384 82,843 285,857 60,955 14,186 2,026TOTAL AMOUNT FOR 968 COMMERCIAL BKS & TCs WITH DERIVATIVES 8,976,830 152,501,693 4,089,373 5,782,791 12,110,737 95,308,383 23,433,394 11,777,015 1,308,947
Note: Before the first quarter of 1995 total derivatives included spot foreign exchange. Beginning in the first quarter, 1995, spot foreign exchange was reported separately.Note: Numbers may not add due to rounding.Data source: Call Report, schedule RC-L
NOTIONAL AMOUNT OF DERIVATIVES CONTRACTS OF THE 25
Note: Credit derivatives have been included in the sum of total derivatives. Credit derivatives have been included as an "over the counter" category, although the Call Report does not differentiate by market currently.
COMMERCIAL BANKS AND TRUST COMPANIES WITH THE MOST DERIVATIVE CONTRACTSJUNE 30, 2007, $ MILLIONS
NOTE: DATA ARE PRELIMINARY
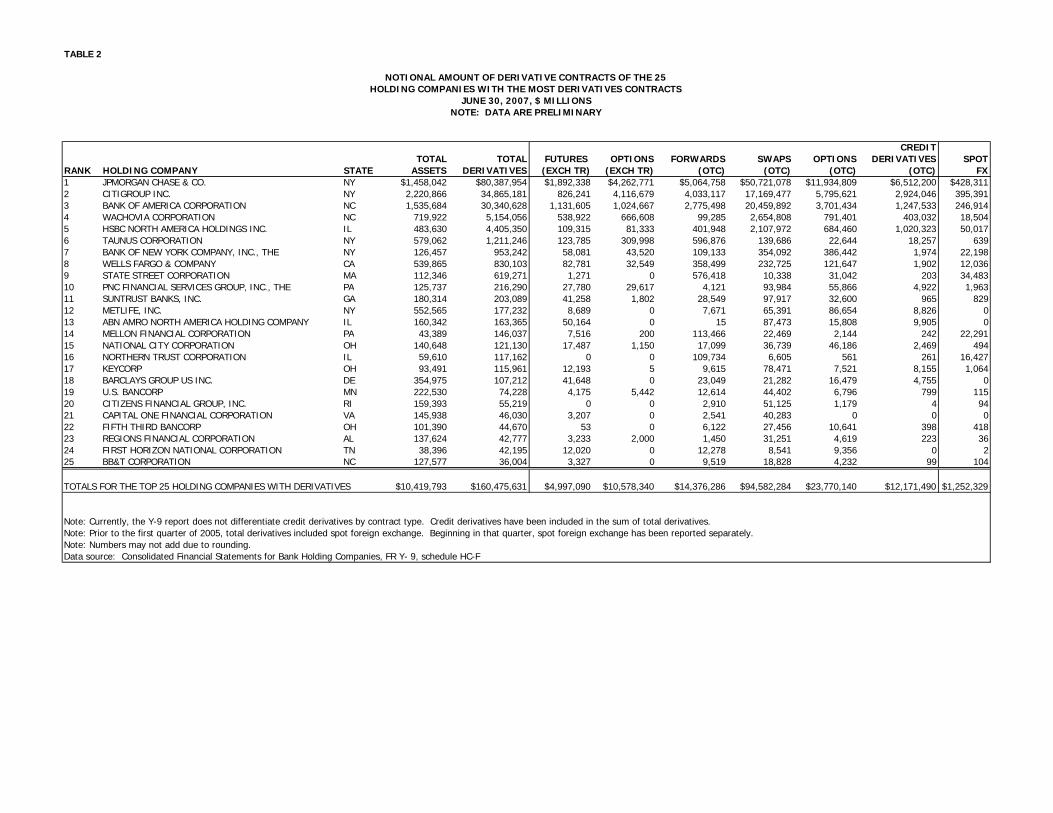
TABLE 2
CREDITTOTAL TOTAL FUTURES OPTIONS FORWARDS SWAPS OPTIONS DERIVATIVES SPOT
RANK HOLDING COMPANY STATE ASSETS DERIVATIVES (EXCH TR) (EXCH TR) (OTC) (OTC) (OTC) (OTC) FX1 JPMORGAN CHASE & CO. NY $1,458,042 $80,387,954 $1,892,338 $4,262,771 $5,064,758 $50,721,078 $11,934,809 $6,512,200 $428,3112 CITIGROUP INC. NY 2,220,866 34,865,181 826,241 4,116,679 4,033,117 17,169,477 5,795,621 2,924,046 395,3913 BANK OF AMERICA CORPORATION NC 1,535,684 30,340,628 1,131,605 1,024,667 2,775,498 20,459,892 3,701,434 1,247,533 246,9144 WACHOVIA CORPORATION NC 719,922 5,154,056 538,922 666,608 99,285 2,654,808 791,401 403,032 18,5045 HSBC NORTH AMERICA HOLDINGS INC. IL 483,630 4,405,350 109,315 81,333 401,948 2,107,972 684,460 1,020,323 50,0176 TAUNUS CORPORATION NY 579,062 1,211,246 123,785 309,998 596,876 139,686 22,644 18,257 6397 BANK OF NEW YORK COMPANY, INC., THE NY 126,457 953,242 58,081 43,520 109,133 354,092 386,442 1,974 22,1988 WELLS FARGO & COMPANY CA 539,865 830,103 82,781 32,549 358,499 232,725 121,647 1,902 12,0369 STATE STREET CORPORATION MA 112,346 619,271 1,271 0 576,418 10,338 31,042 203 34,48310 PNC FINANCIAL SERVICES GROUP, INC., THE PA 125,737 216,290 27,780 29,617 4,121 93,984 55,866 4,922 1,96311 SUNTRUST BANKS, INC. GA 180,314 203,089 41,258 1,802 28,549 97,917 32,600 965 82912 METLIFE, INC. NY 552,565 177,232 8,689 0 7,671 65,391 86,654 8,826 013 ABN AMRO NORTH AMERICA HOLDING COMPANY IL 160,342 163,365 50,164 0 15 87,473 15,808 9,905 014 MELLON FINANCIAL CORPORATION PA 43,389 146,037 7,516 200 113,466 22,469 2,144 242 22,29115 NATIONAL CITY CORPORATION OH 140,648 121,130 17,487 1,150 17,099 36,739 46,186 2,469 49416 NORTHERN TRUST CORPORATION IL 59,610 117,162 0 0 109,734 6,605 561 261 16,42717 KEYCORP OH 93,491 115,961 12,193 5 9,615 78,471 7,521 8,155 1,06418 BARCLAYS GROUP US INC. DE 354,975 107,212 41,648 0 23,049 21,282 16,479 4,755 019 U.S. BANCORP MN 222,530 74,228 4,175 5,442 12,614 44,402 6,796 799 11520 CITIZENS FINANCIAL GROUP, INC. RI 159,393 55,219 0 0 2,910 51,125 1,179 4 9421 CAPITAL ONE FINANCIAL CORPORATION VA 145,938 46,030 3,207 0 2,541 40,283 0 0 022 FIFTH THIRD BANCORP OH 101,390 44,670 53 0 6,122 27,456 10,641 398 41823 REGIONS FINANCIAL CORPORATION AL 137,624 42,777 3,233 2,000 1,450 31,251 4,619 223 3624 FIRST HORIZON NATIONAL CORPORATION TN 38,396 42,195 12,020 0 12,278 8,541 9,356 0 225 BB&T CORPORATION NC 127,577 36,004 3,327 0 9,519 18,828 4,232 99 104
TOTALS FOR THE TOP 25 HOLDING COMPANIES WITH DERIVATIVES $10,419,793 $160,475,631 $4,997,090 $10,578,340 $14,376,286 $94,582,284 $23,770,140 $12,171,490 $1,252,329
Note: Currently, the Y-9 report does not differentiate credit derivatives by contract type. Credit derivatives have been included in the sum of total derivatives.Note: Prior to the first quarter of 2005, total derivatives included spot foreign exchange. Beginning in that quarter, spot foreign exchange has been reported separately.Note: Numbers may not add due to rounding.Data source: Consolidated Financial Statements for Bank Holding Companies, FR Y- 9, schedule HC-F
NOTIONAL AMOUNT OF DERIVATIVE CONTRACTS OF THE 25HOLDING COMPANIES WITH THE MOST DERIVATIVES CONTRACTS
NOTE: DATA ARE PRELIMINARYJUNE 30, 2007, $ MILLIONS
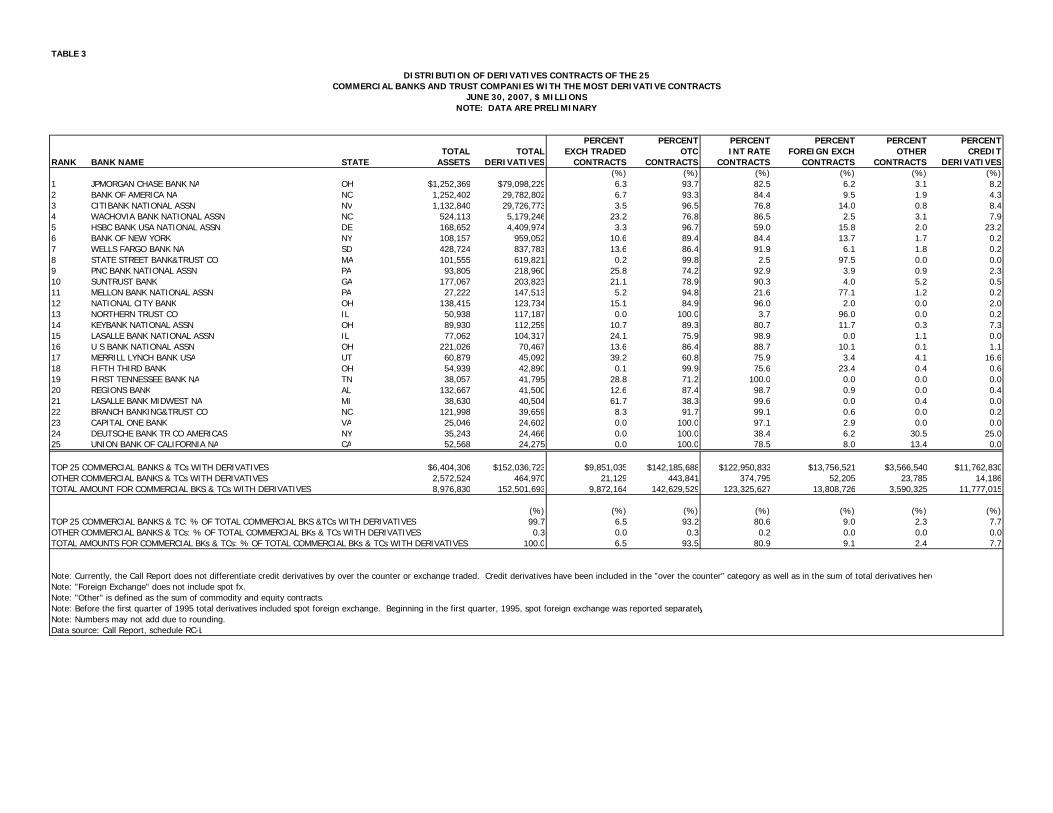
TABLE 3
PERCENT PERCENT PERCENT PERCENT PERCENT PERCENTTOTAL TOTAL EXCH TRADED OTC INT RATE FOREIGN EXCH OTHER CREDIT
RANK BANK NAME STATE ASSETS DERIVATIVES CONTRACTS CONTRACTS CONTRACTS CONTRACTS CONTRACTS DERIVATIVES(%) (%) (%) (%) (%) (%)
1 JPMORGAN CHASE BANK NA OH $1,252,369 $79,098,229 6.3 93.7 82.5 6.2 3.1 8.22 BANK OF AMERICA NA NC 1,252,402 29,782,802 6.7 93.3 84.4 9.5 1.9 4.33 CITIBANK NATIONAL ASSN NV 1,132,840 29,726,773 3.5 96.5 76.8 14.0 0.8 8.44 WACHOVIA BANK NATIONAL ASSN NC 524,113 5,179,246 23.2 76.8 86.5 2.5 3.1 7.95 HSBC BANK USA NATIONAL ASSN DE 168,652 4,409,974 3.3 96.7 59.0 15.8 2.0 23.26 BANK OF NEW YORK NY 108,157 959,052 10.6 89.4 84.4 13.7 1.7 0.27 WELLS FARGO BANK NA SD 428,724 837,783 13.6 86.4 91.9 6.1 1.8 0.28 STATE STREET BANK&TRUST CO MA 101,555 619,821 0.2 99.8 2.5 97.5 0.0 0.09 PNC BANK NATIONAL ASSN PA 93,805 218,960 25.8 74.2 92.9 3.9 0.9 2.310 SUNTRUST BANK GA 177,067 203,823 21.1 78.9 90.3 4.0 5.2 0.511 MELLON BANK NATIONAL ASSN PA 27,222 147,513 5.2 94.8 21.6 77.1 1.2 0.212 NATIONAL CITY BANK OH 138,415 123,734 15.1 84.9 96.0 2.0 0.0 2.013 NORTHERN TRUST CO IL 50,938 117,187 0.0 100.0 3.7 96.0 0.0 0.214 KEYBANK NATIONAL ASSN OH 89,930 112,259 10.7 89.3 80.7 11.7 0.3 7.315 LASALLE BANK NATIONAL ASSN IL 77,062 104,317 24.1 75.9 98.9 0.0 1.1 0.016 U S BANK NATIONAL ASSN OH 221,026 70,467 13.6 86.4 88.7 10.1 0.1 1.117 MERRILL LYNCH BANK USA UT 60,879 45,092 39.2 60.8 75.9 3.4 4.1 16.618 FIFTH THIRD BANK OH 54,939 42,890 0.1 99.9 75.6 23.4 0.4 0.619 FIRST TENNESSEE BANK NA TN 38,057 41,795 28.8 71.2 100.0 0.0 0.0 0.020 REGIONS BANK AL 132,667 41,500 12.6 87.4 98.7 0.9 0.0 0.421 LASALLE BANK MIDWEST NA MI 38,630 40,504 61.7 38.3 99.6 0.0 0.4 0.022 BRANCH BANKING&TRUST CO NC 121,998 39,659 8.3 91.7 99.1 0.6 0.0 0.223 CAPITAL ONE BANK VA 25,046 24,602 0.0 100.0 97.1 2.9 0.0 0.024 DEUTSCHE BANK TR CO AMERICAS NY 35,243 24,466 0.0 100.0 38.4 6.2 30.5 25.025 UNION BANK OF CALIFORNIA NA CA 52,568 24,275 0.0 100.0 78.5 8.0 13.4 0.0
TOP 25 COMMERCIAL BANKS & TCs WITH DERIVATIVES $6,404,306 $152,036,723 $9,851,035 $142,185,688 $122,950,833 $13,756,521 $3,566,540 $11,762,830OTHER COMMERCIAL BANKS & TCs WITH DERIVATIVES 2,572,524 464,970 21,129 443,841 374,795 52,205 23,785 14,186TOTAL AMOUNT FOR COMMERCIAL BKS & TCs WITH DERIVATIVES 8,976,830 152,501,693 9,872,164 142,629,529 123,325,627 13,808,726 3,590,325 11,777,015
(%) (%) (%) (%) (%) (%) (%)TOP 25 COMMERCIAL BANKS & TC: % OF TOTAL COMMERCIAL BKS &TCs WITH DERIVATIVES 99.7 6.5 93.2 80.6 9.0 2.3 7.7OTHER COMMERCIAL BANKS & TCs: % OF TOTAL COMMERCIAL BKs & TCs WITH DERIVATIVES 0.3 0.0 0.3 0.2 0.0 0.0 0.0TOTAL AMOUNTS FOR COMMERCIAL BKs & TCs: % OF TOTAL COMMERCIAL BKs & TCs WITH DERIVATIVES 100.0 6.5 93.5 80.9 9.1 2.4 7.7
Note: "Foreign Exchange" does not include spot fx.Note: "Other" is defined as the sum of commodity and equity contracts.Note: Before the first quarter of 1995 total derivatives included spot foreign exchange. Beginning in the first quarter, 1995, spot foreign exchange was reported separatelyNote: Numbers may not add due to rounding.Data source: Call Report, schedule RC-L
Note: Currently, the Call Report does not differentiate credit derivatives by over the counter or exchange traded. Credit derivatives have been included in the "over the counter" category as well as in the sum of total derivatives here
DISTRIBUTION OF DERIVATIVES CONTRACTS OF THE 25COMMERCIAL BANKS AND TRUST COMPANIES WITH THE MOST DERIVATIVE CONTRACTS
NOTE: DATA ARE PRELIMINARYJUNE 30, 2007, $ MILLIONS
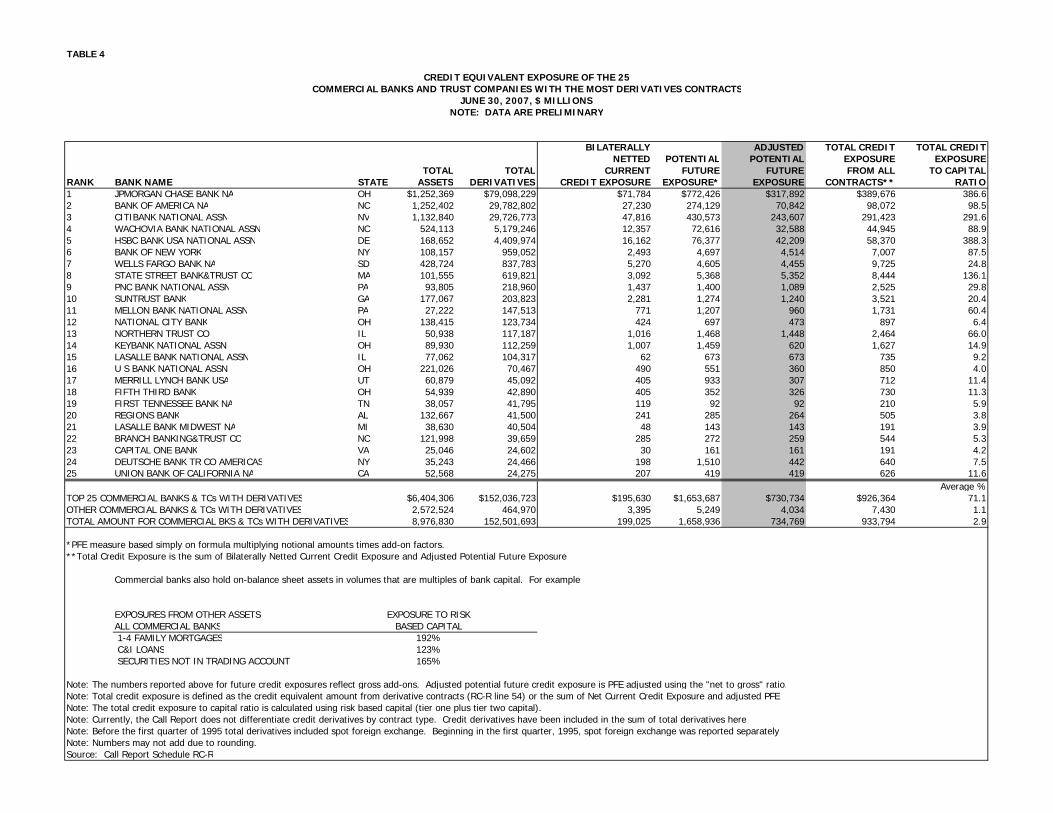
TABLE 4
BILATERALLY ADJUSTED TOTAL CREDIT TOTAL CREDITNETTED POTENTIAL POTENTIAL EXPOSURE EXPOSURE
TOTAL TOTAL CURRENT FUTURE FUTURE FROM ALL TO CAPITALRANK BANK NAME STATE ASSETS DERIVATIVES CREDIT EXPOSURE EXPOSURE* EXPOSURE CONTRACTS** RATIO1 JPMORGAN CHASE BANK NA OH $1,252,369 $79,098,229 $71,784 $772,426 $317,892 $389,676 386.62 BANK OF AMERICA NA NC 1,252,402 29,782,802 27,230 274,129 70,842 98,072 98.53 CITIBANK NATIONAL ASSN NV 1,132,840 29,726,773 47,816 430,573 243,607 291,423 291.64 WACHOVIA BANK NATIONAL ASSN NC 524,113 5,179,246 12,357 72,616 32,588 44,945 88.95 HSBC BANK USA NATIONAL ASSN DE 168,652 4,409,974 16,162 76,377 42,209 58,370 388.36 BANK OF NEW YORK NY 108,157 959,052 2,493 4,697 4,514 7,007 87.57 WELLS FARGO BANK NA SD 428,724 837,783 5,270 4,605 4,455 9,725 24.88 STATE STREET BANK&TRUST CO MA 101,555 619,821 3,092 5,368 5,352 8,444 136.19 PNC BANK NATIONAL ASSN PA 93,805 218,960 1,437 1,400 1,089 2,525 29.810 SUNTRUST BANK GA 177,067 203,823 2,281 1,274 1,240 3,521 20.411 MELLON BANK NATIONAL ASSN PA 27,222 147,513 771 1,207 960 1,731 60.412 NATIONAL CITY BANK OH 138,415 123,734 424 697 473 897 6.413 NORTHERN TRUST CO IL 50,938 117,187 1,016 1,468 1,448 2,464 66.014 KEYBANK NATIONAL ASSN OH 89,930 112,259 1,007 1,459 620 1,627 14.915 LASALLE BANK NATIONAL ASSN IL 77,062 104,317 62 673 673 735 9.216 U S BANK NATIONAL ASSN OH 221,026 70,467 490 551 360 850 4.017 MERRILL LYNCH BANK USA UT 60,879 45,092 405 933 307 712 11.418 FIFTH THIRD BANK OH 54,939 42,890 405 352 326 730 11.319 FIRST TENNESSEE BANK NA TN 38,057 41,795 119 92 92 210 5.920 REGIONS BANK AL 132,667 41,500 241 285 264 505 3.821 LASALLE BANK MIDWEST NA MI 38,630 40,504 48 143 143 191 3.922 BRANCH BANKING&TRUST CO NC 121,998 39,659 285 272 259 544 5.323 CAPITAL ONE BANK VA 25,046 24,602 30 161 161 191 4.224 DEUTSCHE BANK TR CO AMERICAS NY 35,243 24,466 198 1,510 442 640 7.525 UNION BANK OF CALIFORNIA NA CA 52,568 24,275 207 419 419 626 11.6
Average %TOP 25 COMMERCIAL BANKS & TCs WITH DERIVATIVES $6,404,306 $152,036,723 $195,630 $1,653,687 $730,734 $926,364 71.1OTHER COMMERCIAL BANKS & TCs WITH DERIVATIVES 2,572,524 464,970 3,395 5,249 4,034 7,430 1.1TOTAL AMOUNT FOR COMMERCIAL BKS & TCs WITH DERIVATIVES 8,976,830 152,501,693 199,025 1,658,936 734,769 933,794 2.9
*PFE measure based simply on formula multiplying notional amounts times add-on factors.**Total Credit Exposure is the sum of Bilaterally Netted Current Credit Exposure and Adjusted Potential Future Exposure.
Commercial banks also hold on-balance sheet assets in volumes that are multiples of bank capital. For example:
EXPOSURES FROM OTHER ASSETS EXPOSURE TO RISKALL COMMERCIAL BANKS BASED CAPITAL 1-4 FAMILY MORTGAGES 192% C&I LOANS 123% SECURITIES NOT IN TRADING ACCOUNT 165%
Note: Total credit exposure is defined as the credit equivalent amount from derivative contracts (RC-R line 54) or the sum of Net Current Credit Exposure and adjusted PFENote: The total credit exposure to capital ratio is calculated using risk based capital (tier one plus tier two capital). Note: Currently, the Call Report does not differentiate credit derivatives by contract type. Credit derivatives have been included in the sum of total derivatives hereNote: Before the first quarter of 1995 total derivatives included spot foreign exchange. Beginning in the first quarter, 1995, spot foreign exchange was reported separatelyNote: Numbers may not add due to rounding.Source: Call Report Schedule RC-R
Note: The numbers reported above for future credit exposures reflect gross add-ons. Adjusted potential future credit exposure is PFE adjusted using the "net to gross" ratio.
CREDIT EQUIVALENT EXPOSURE OF THE 25COMMERCIAL BANKS AND TRUST COMPANIES WITH THE MOST DERIVATIVES CONTRACTS
NOTE: DATA ARE PRELIMINARYJUNE 30, 2007, $ MILLIONS
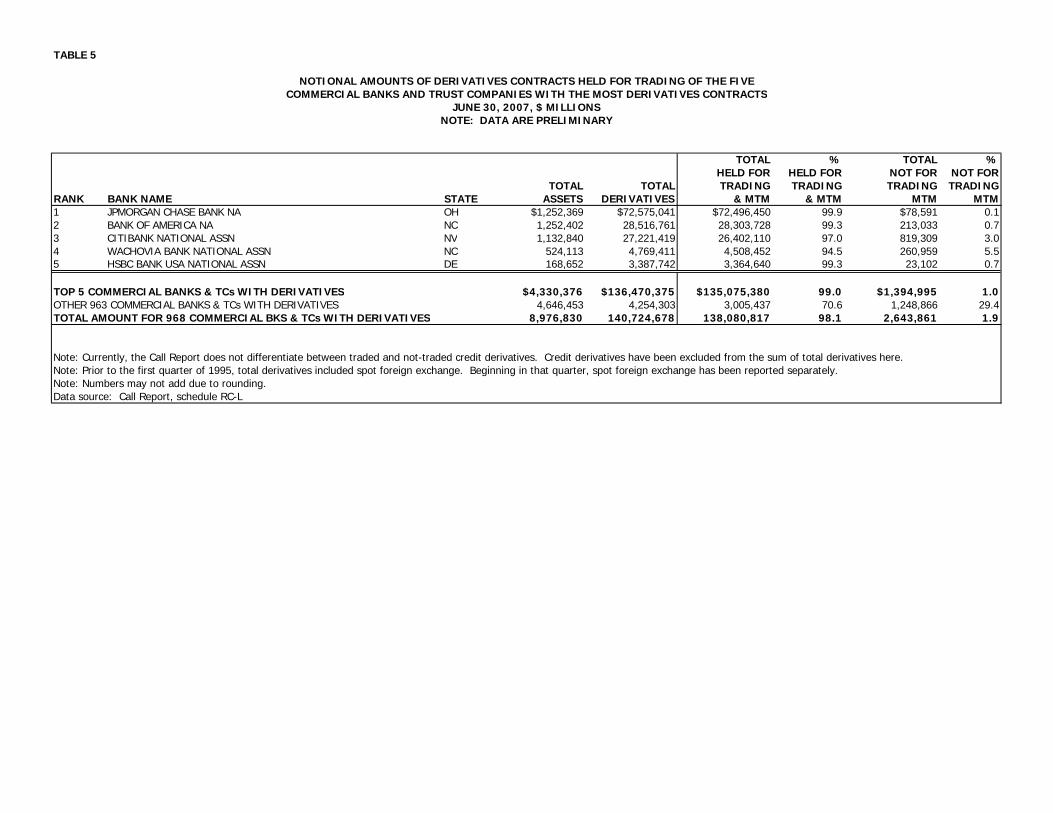
TABLE 5
TOTAL % TOTAL %HELD FOR HELD FOR NOT FOR NOT FOR
TOTAL TOTAL TRADING TRADING TRADING TRADINGRANK BANK NAME STATE ASSETS DERIVATIVES & MTM & MTM MTM MTM1 JPMORGAN CHASE BANK NA OH $1,252,369 $72,575,041 $72,496,450 99.9 $78,591 0.12 BANK OF AMERICA NA NC 1,252,402 28,516,761 28,303,728 99.3 213,033 0.73 CITIBANK NATIONAL ASSN NV 1,132,840 27,221,419 26,402,110 97.0 819,309 3.04 WACHOVIA BANK NATIONAL ASSN NC 524,113 4,769,411 4,508,452 94.5 260,959 5.55 HSBC BANK USA NATIONAL ASSN DE 168,652 3,387,742 3,364,640 99.3 23,102 0.7
TOP 5 COMMERCIAL BANKS & TCs WITH DERIVATIVES $4,330,376 $136,470,375 $135,075,380 99.0 $1,394,995 1.0OTHER 963 COMMERCIAL BANKS & TCs WITH DERIVATIVES 4,646,453 4,254,303 3,005,437 70.6 1,248,866 29.4TOTAL AMOUNT FOR 968 COMMERCIAL BKS & TCs WITH DERIVATIVES 8,976,830 140,724,678 138,080,817 98.1 2,643,861 1.9
Note: Currently, the Call Report does not differentiate between traded and not-traded credit derivatives. Credit derivatives have been excluded from the sum of total derivatives here.Note: Prior to the first quarter of 1995, total derivatives included spot foreign exchange. Beginning in that quarter, spot foreign exchange has been reported separately.Note: Numbers may not add due to rounding.Data source: Call Report, schedule RC-L
NOTIONAL AMOUNTS OF DERIVATIVES CONTRACTS HELD FOR TRADING OF THE FIVECOMMERCIAL BANKS AND TRUST COMPANIES WITH THE MOST DERIVATIVES CONTRACTS
NOTE: DATA ARE PRELIMINARYJUNE 30, 2007, $ MILLIONS
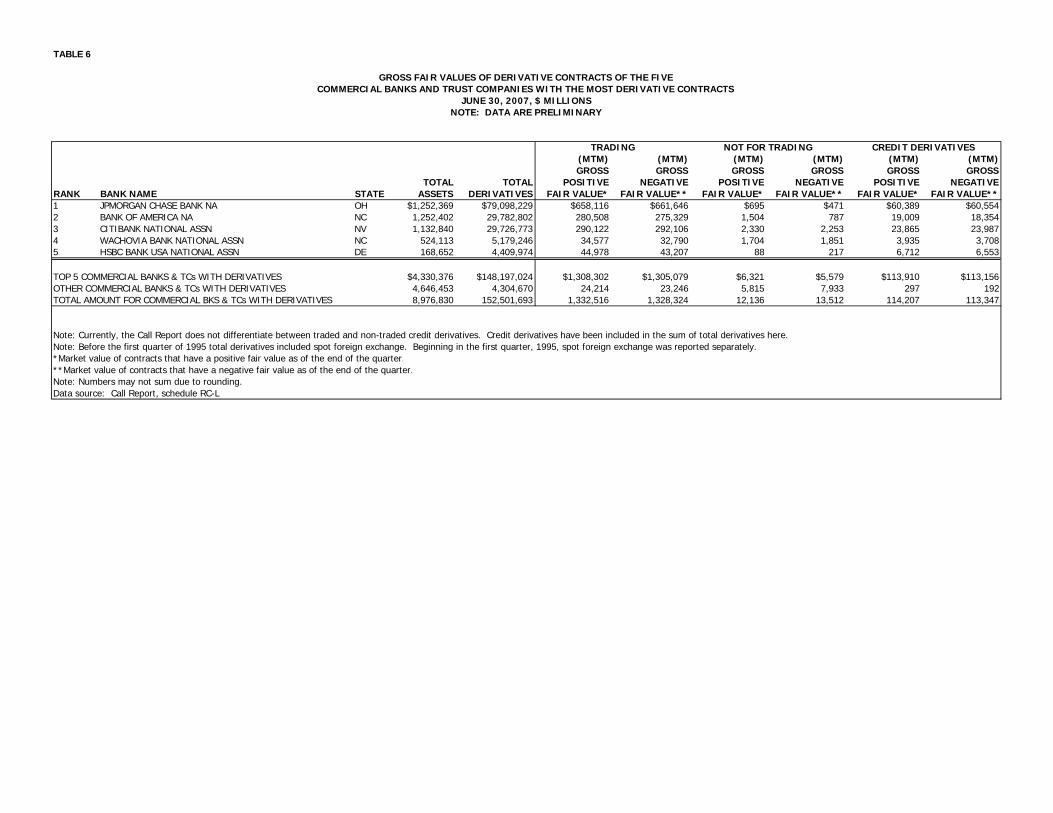
TABLE 6
(MTM) (MTM) (MTM) (MTM) (MTM) (MTM)GROSS GROSS GROSS GROSS GROSS GROSS
TOTAL TOTAL POSITIVE NEGATIVE POSITIVE NEGATIVE POSITIVE NEGATIVERANK BANK NAME STATE ASSETS DERIVATIVES FAIR VALUE* FAIR VALUE** FAIR VALUE* FAIR VALUE** FAIR VALUE* FAIR VALUE**1 JPMORGAN CHASE BANK NA OH $1,252,369 $79,098,229 $658,116 $661,646 $695 $471 $60,389 $60,5542 BANK OF AMERICA NA NC 1,252,402 29,782,802 280,508 275,329 1,504 787 19,009 18,3543 CITIBANK NATIONAL ASSN NV 1,132,840 29,726,773 290,122 292,106 2,330 2,253 23,865 23,9874 WACHOVIA BANK NATIONAL ASSN NC 524,113 5,179,246 34,577 32,790 1,704 1,851 3,935 3,7085 HSBC BANK USA NATIONAL ASSN DE 168,652 4,409,974 44,978 43,207 88 217 6,712 6,553
TOP 5 COMMERCIAL BANKS & TCs WITH DERIVATIVES $4,330,376 $148,197,024 $1,308,302 $1,305,079 $6,321 $5,579 $113,910 $113,156OTHER COMMERCIAL BANKS & TCs WITH DERIVATIVES 4,646,453 4,304,670 24,214 23,246 5,815 7,933 297 192TOTAL AMOUNT FOR COMMERCIAL BKS & TCs WITH DERIVATIVES 8,976,830 152,501,693 1,332,516 1,328,324 12,136 13,512 114,207 113,347
Note: Currently, the Call Report does not differentiate between traded and non-traded credit derivatives. Credit derivatives have been included in the sum of total derivatives here.Note: Before the first quarter of 1995 total derivatives included spot foreign exchange. Beginning in the first quarter, 1995, spot foreign exchange was reported separately.*Market value of contracts that have a positive fair value as of the end of the quarter.**Market value of contracts that have a negative fair value as of the end of the quarter.Note: Numbers may not sum due to rounding.Data source: Call Report, schedule RC-L
TRADING CREDIT DERIVATIVES
GROSS FAIR VALUES OF DERIVATIVE CONTRACTS OF THE FIVECOMMERCIAL BANKS AND TRUST COMPANIES WITH THE MOST DERIVATIVE CONTRACTS
NOTE: DATA ARE PRELIMINARYJUNE 30, 2007, $ MILLIONS
NOT FOR TRADING
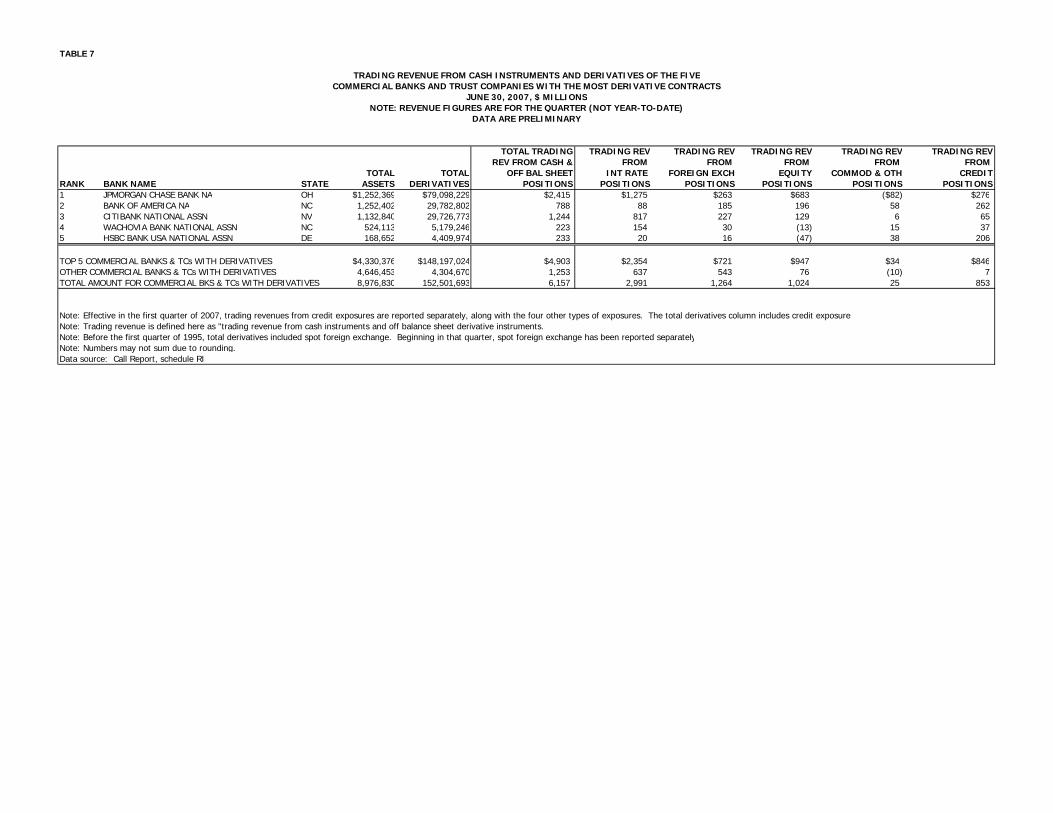
TABLE 7
TOTAL TRADING TRADING REV TRADING REV TRADING REV TRADING REV TRADING REVREV FROM CASH & FROM FROM FROM FROM FROM
TOTAL TOTAL OFF BAL SHEET INT RATE FOREIGN EXCH EQUITY COMMOD & OTH CREDITRANK BANK NAME STATE ASSETS DERIVATIVES POSITIONS POSITIONS POSITIONS POSITIONS POSITIONS POSITIONS1 JPMORGAN CHASE BANK NA OH $1,252,369 $79,098,229 $2,415 $1,275 $263 $683 ($82) $2762 BANK OF AMERICA NA NC 1,252,402 29,782,802 788 88 185 196 58 2623 CITIBANK NATIONAL ASSN NV 1,132,840 29,726,773 1,244 817 227 129 6 654 WACHOVIA BANK NATIONAL ASSN NC 524,113 5,179,246 223 154 30 (13) 15 375 HSBC BANK USA NATIONAL ASSN DE 168,652 4,409,974 233 20 16 (47) 38 206
TOP 5 COMMERCIAL BANKS & TCs WITH DERIVATIVES $4,330,376 $148,197,024 $4,903 $2,354 $721 $947 $34 $846OTHER COMMERCIAL BANKS & TCs WITH DERIVATIVES 4,646,453 4,304,670 1,253 637 543 76 (10) 7TOTAL AMOUNT FOR COMMERCIAL BKS & TCs WITH DERIVATIVES 8,976,830 152,501,693 6,157 2,991 1,264 1,024 25 853
Note: Trading revenue is defined here as "trading revenue from cash instruments and off balance sheet derivative instruments.Note: Before the first quarter of 1995, total derivatives included spot foreign exchange. Beginning in that quarter, spot foreign exchange has been reported separatelyNote: Numbers may not sum due to rounding.Data source: Call Report, schedule RI
Note: Effective in the first quarter of 2007, trading revenues from credit exposures are reported separately, along with the four other types of exposures. The total derivatives column includes credit exposures
TRADING REVENUE FROM CASH INSTRUMENTS AND DERIVATIVES OF THE FIVECOMMERCIAL BANKS AND TRUST COMPANIES WITH THE MOST DERIVATIVE CONTRACTS
DATA ARE PRELIMINARYNOTE: REVENUE FIGURES ARE FOR THE QUARTER (NOT YEAR-TO-DATE)
JUNE 30, 2007, $ MILLIONS
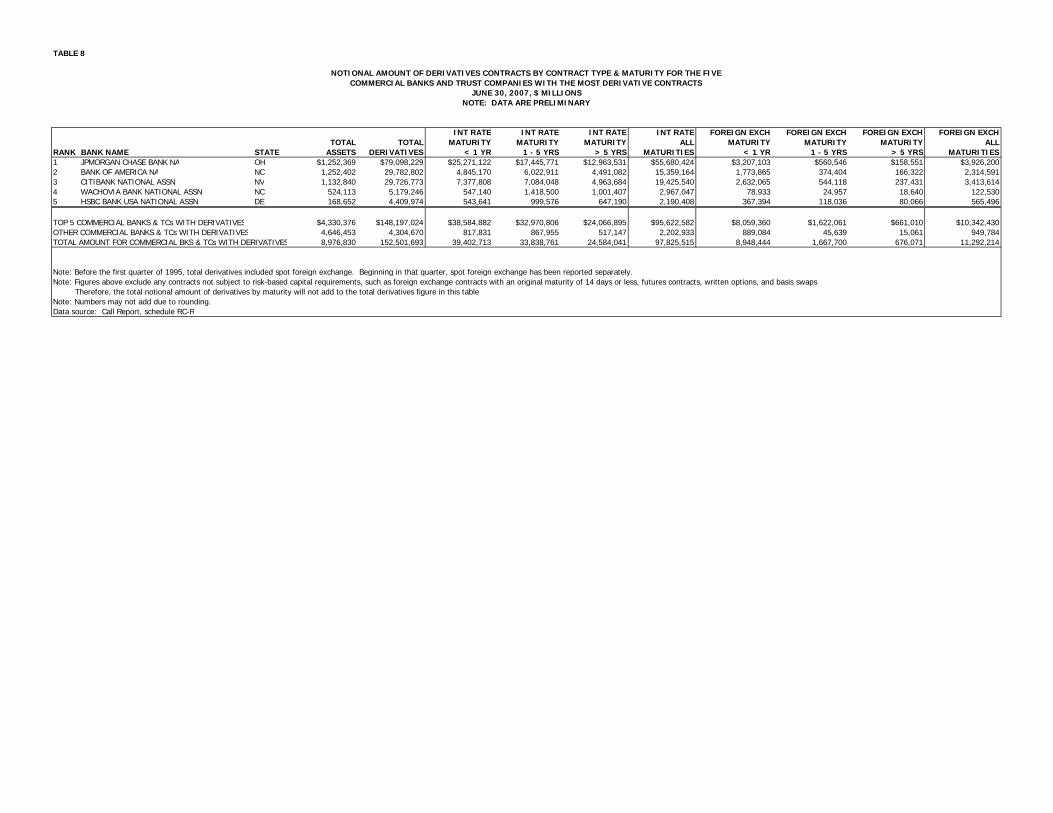
TABLE 8
INT RATE INT RATE INT RATE INT RATE FOREIGN EXCH FOREIGN EXCH FOREIGN EXCH FOREIGN EXCHTOTAL TOTAL MATURITY MATURITY MATURITY ALL MATURITY MATURITY MATURITY ALL
RANK BANK NAME STATE ASSETS DERIVATIVES < 1 YR 1 - 5 YRS > 5 YRS MATURITIES < 1 YR 1 - 5 YRS > 5 YRS MATURITIES1 JPMORGAN CHASE BANK NA OH $1,252,369 $79,098,229 $25,271,122 $17,445,771 $12,963,531 $55,680,424 $3,207,103 $560,546 $158,551 $3,926,2002 BANK OF AMERICA NA NC 1,252,402 29,782,802 4,845,170 6,022,911 4,491,082 15,359,164 1,773,865 374,404 166,322 2,314,5913 CITIBANK NATIONAL ASSN NV 1,132,840 29,726,773 7,377,808 7,084,048 4,963,684 19,425,540 2,632,065 544,118 237,431 3,413,6144 WACHOVIA BANK NATIONAL ASSN NC 524,113 5,179,246 547,140 1,418,500 1,001,407 2,967,047 78,933 24,957 18,640 122,5305 HSBC BANK USA NATIONAL ASSN DE 168,652 4,409,974 543,641 999,576 647,190 2,190,408 367,394 118,036 80,066 565,496
TOP 5 COMMERCIAL BANKS & TCs WITH DERIVATIVES $4,330,376 $148,197,024 $38,584,882 $32,970,806 $24,066,895 $95,622,582 $8,059,360 $1,622,061 $661,010 $10,342,430OTHER COMMERCIAL BANKS & TCs WITH DERIVATIVES 4,646,453 4,304,670 817,831 867,955 517,147 2,202,933 889,084 45,639 15,061 949,784TOTAL AMOUNT FOR COMMERCIAL BKS & TCs WITH DERIVATIVES 8,976,830 152,501,693 39,402,713 33,838,761 24,584,041 97,825,515 8,948,444 1,667,700 676,071 11,292,214
Note: Before the first quarter of 1995, total derivatives included spot foreign exchange. Beginning in that quarter, spot foreign exchange has been reported separately.Note: Figures above exclude any contracts not subject to risk-based capital requirements, such as foreign exchange contracts with an original maturity of 14 days or less, futures contracts, written options, and basis swaps. Therefore, the total notional amount of derivatives by maturity will not add to the total derivatives figure in this tableNote: Numbers may not add due to rounding.Data source: Call Report, schedule RC-R
NOTIONAL AMOUNT OF DERIVATIVES CONTRACTS BY CONTRACT TYPE & MATURITY FOR THE FIVECOMMERCIAL BANKS AND TRUST COMPANIES WITH THE MOST DERIVATIVE CONTRACTS
NOTE: DATA ARE PRELIMINARYJUNE 30, 2007, $ MILLIONS
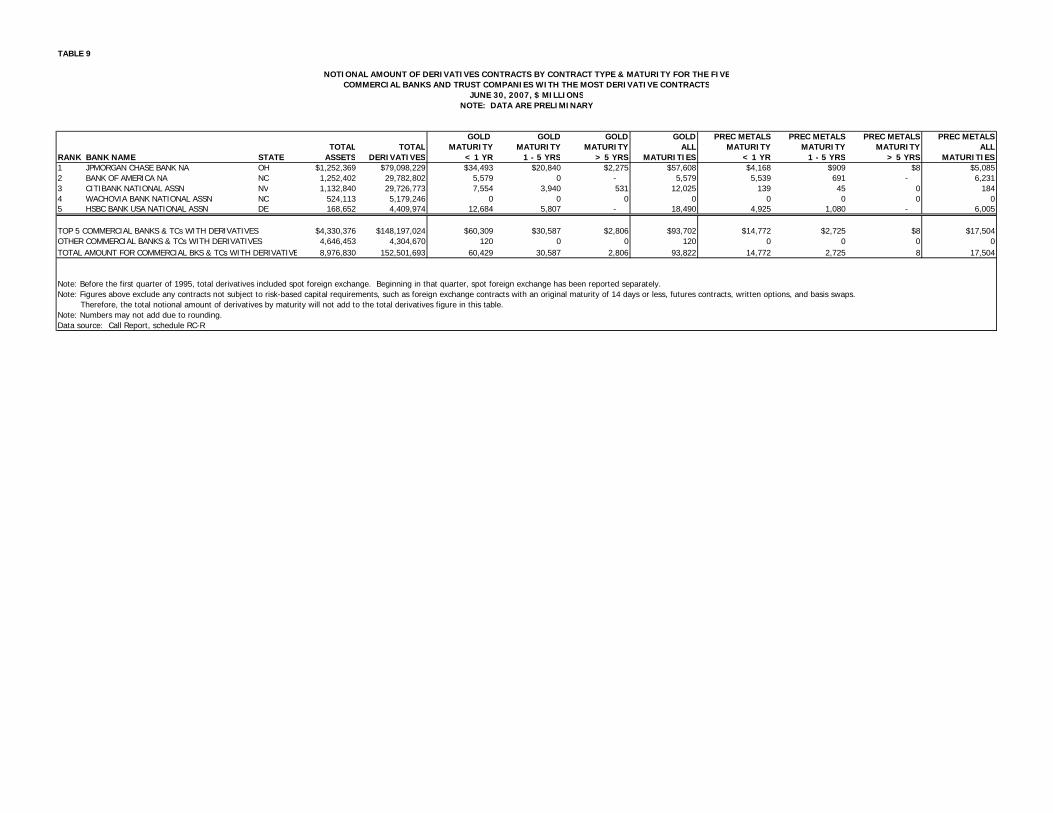
TABLE 9
GOLD GOLD GOLD GOLD PREC METALS PREC METALS PREC METALS PREC METALSTOTAL TOTAL MATURITY MATURITY MATURITY ALL MATURITY MATURITY MATURITY ALL
RANK BANK NAME STATE ASSETS DERIVATIVES < 1 YR 1 - 5 YRS > 5 YRS MATURITIES < 1 YR 1 - 5 YRS > 5 YRS MATURITIES1 JPMORGAN CHASE BANK NA OH $1,252,369 $79,098,229 $34,493 $20,840 $2,275 $57,608 $4,168 $909 $8 $5,0852 BANK OF AMERICA NA NC 1,252,402 29,782,802 5,579 0 - 5,579 5,539 691 - 6,2313 CITIBANK NATIONAL ASSN NV 1,132,840 29,726,773 7,554 3,940 531 12,025 139 45 0 1844 WACHOVIA BANK NATIONAL ASSN NC 524,113 5,179,246 0 0 0 0 0 0 0 05 HSBC BANK USA NATIONAL ASSN DE 168,652 4,409,974 12,684 5,807 - 18,490 4,925 1,080 - 6,005
TOP 5 COMMERCIAL BANKS & TCs WITH DERIVATIVES $4,330,376 $148,197,024 $60,309 $30,587 $2,806 $93,702 $14,772 $2,725 $8 $17,504OTHER COMMERCIAL BANKS & TCs WITH DERIVATIVES 4,646,453 4,304,670 120 0 0 120 0 0 0 0TOTAL AMOUNT FOR COMMERCIAL BKS & TCs WITH DERIVATIVE 8,976,830 152,501,693 60,429 30,587 2,806 93,822 14,772 2,725 8 17,504
Note: Before the first quarter of 1995, total derivatives included spot foreign exchange. Beginning in that quarter, spot foreign exchange has been reported separately.Note: Figures above exclude any contracts not subject to risk-based capital requirements, such as foreign exchange contracts with an original maturity of 14 days or less, futures contracts, written options, and basis swaps. Therefore, the total notional amount of derivatives by maturity will not add to the total derivatives figure in this table.Note: Numbers may not add due to rounding.Data source: Call Report, schedule RC-R
NOTIONAL AMOUNT OF DERIVATIVES CONTRACTS BY CONTRACT TYPE & MATURITY FOR THE FIVECOMMERCIAL BANKS AND TRUST COMPANIES WITH THE MOST DERIVATIVE CONTRACTS
NOTE: DATA ARE PRELIMINARYJUNE 30, 2007, $ MILLIONS
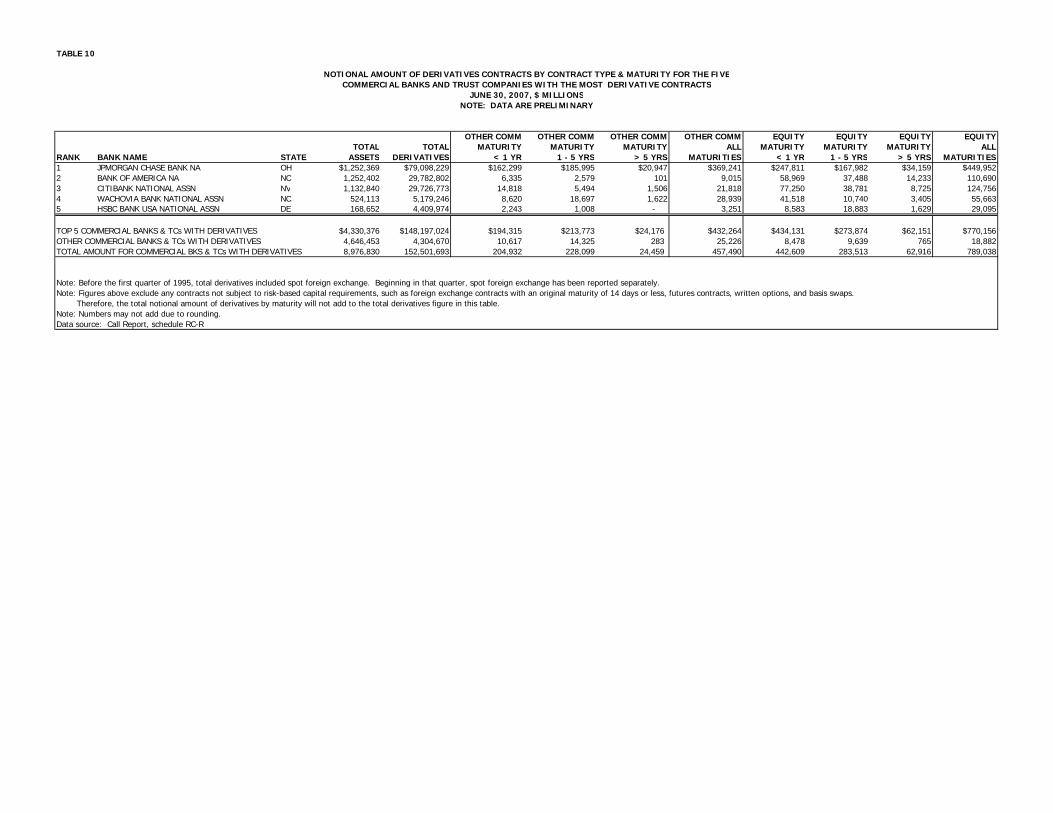
TABLE 10
OTHER COMM OTHER COMM OTHER COMM OTHER COMM EQUITY EQUITY EQUITY EQUITYTOTAL TOTAL MATURITY MATURITY MATURITY ALL MATURITY MATURITY MATURITY ALL
RANK BANK NAME STATE ASSETS DERIVATIVES < 1 YR 1 - 5 YRS > 5 YRS MATURITIES < 1 YR 1 - 5 YRS > 5 YRS MATURITIES1 JPMORGAN CHASE BANK NA OH $1,252,369 $79,098,229 $162,299 $185,995 $20,947 $369,241 $247,811 $167,982 $34,159 $449,9522 BANK OF AMERICA NA NC 1,252,402 29,782,802 6,335 2,579 101 9,015 58,969 37,488 14,233 110,6903 CITIBANK NATIONAL ASSN NV 1,132,840 29,726,773 14,818 5,494 1,506 21,818 77,250 38,781 8,725 124,7564 WACHOVIA BANK NATIONAL ASSN NC 524,113 5,179,246 8,620 18,697 1,622 28,939 41,518 10,740 3,405 55,6635 HSBC BANK USA NATIONAL ASSN DE 168,652 4,409,974 2,243 1,008 - 3,251 8,583 18,883 1,629 29,095
TOP 5 COMMERCIAL BANKS & TCs WITH DERIVATIVES $4,330,376 $148,197,024 $194,315 $213,773 $24,176 $432,264 $434,131 $273,874 $62,151 $770,156OTHER COMMERCIAL BANKS & TCs WITH DERIVATIVES 4,646,453 4,304,670 10,617 14,325 283 25,226 8,478 9,639 765 18,882TOTAL AMOUNT FOR COMMERCIAL BKS & TCs WITH DERIVATIVES 8,976,830 152,501,693 204,932 228,099 24,459 457,490 442,609 283,513 62,916 789,038
Note: Before the first quarter of 1995, total derivatives included spot foreign exchange. Beginning in that quarter, spot foreign exchange has been reported separately.Note: Figures above exclude any contracts not subject to risk-based capital requirements, such as foreign exchange contracts with an original maturity of 14 days or less, futures contracts, written options, and basis swaps. Therefore, the total notional amount of derivatives by maturity will not add to the total derivatives figure in this table.Note: Numbers may not add due to rounding.Data source: Call Report, schedule RC-R
JUNE 30, 2007, $ MILLIONS
NOTIONAL AMOUNT OF DERIVATIVES CONTRACTS BY CONTRACT TYPE & MATURITY FOR THE FIVECOMMERCIAL BANKS AND TRUST COMPANIES WITH THE MOST DERIVATIVE CONTRACTS
NOTE: DATA ARE PRELIMINARY
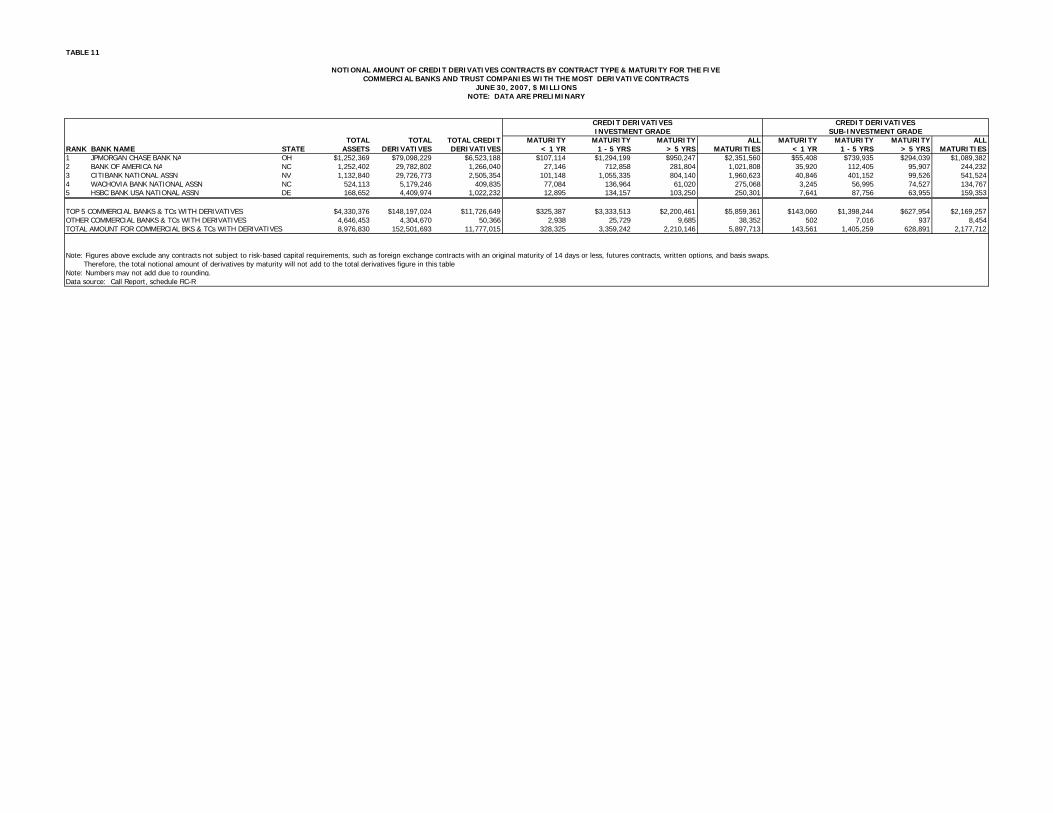
TABLE 11
TOTAL TOTAL TOTAL CREDIT MATURITY MATURITY MATURITY ALL MATURITY MATURITY MATURITY ALLRANK BANK NAME STATE ASSETS DERIVATIVES DERIVATIVES < 1 YR 1 - 5 YRS > 5 YRS MATURITIES < 1 YR 1 - 5 YRS > 5 YRS MATURITIES1 JPMORGAN CHASE BANK NA OH $1,252,369 $79,098,229 $6,523,188 $107,114 $1,294,199 $950,247 $2,351,560 $55,408 $739,935 $294,039 $1,089,3822 BANK OF AMERICA NA NC 1,252,402 29,782,802 1,266,040 27,146 712,858 281,804 1,021,808 35,920 112,405 95,907 244,2323 CITIBANK NATIONAL ASSN NV 1,132,840 29,726,773 2,505,354 101,148 1,055,335 804,140 1,960,623 40,846 401,152 99,526 541,5244 WACHOVIA BANK NATIONAL ASSN NC 524,113 5,179,246 409,835 77,084 136,964 61,020 275,068 3,245 56,995 74,527 134,7675 HSBC BANK USA NATIONAL ASSN DE 168,652 4,409,974 1,022,232 12,895 134,157 103,250 250,301 7,641 87,756 63,955 159,353
TOP 5 COMMERCIAL BANKS & TCs WITH DERIVATIVES $4,330,376 $148,197,024 $11,726,649 $325,387 $3,333,513 $2,200,461 $5,859,361 $143,060 $1,398,244 $627,954 $2,169,257OTHER COMMERCIAL BANKS & TCs WITH DERIVATIVES 4,646,453 4,304,670 50,366 2,938 25,729 9,685 38,352 502 7,016 937 8,454TOTAL AMOUNT FOR COMMERCIAL BKS & TCs WITH DERIVATIVES 8,976,830 152,501,693 11,777,015 328,325 3,359,242 2,210,146 5,897,713 143,561 1,405,259 628,891 2,177,712
Note: Figures above exclude any contracts not subject to risk-based capital requirements, such as foreign exchange contracts with an original maturity of 14 days or less, futures contracts, written options, and basis swaps. Therefore, the total notional amount of derivatives by maturity will not add to the total derivatives figure in this table.Note: Numbers may not add due to rounding.Data source: Call Report, schedule RC-R
SUB-INVESTMENT GRADEINVESTMENT GRADECREDIT DERIVATIVES
NOTIONAL AMOUNT OF CREDIT DERIVATIVES CONTRACTS BY CONTRACT TYPE & MATURITY FOR THE FIVECOMMERCIAL BANKS AND TRUST COMPANIES WITH THE MOST DERIVATIVE CONTRACTS
NOTE: DATA ARE PRELIMINARY
CREDIT DERIVATIVES
JUNE 30, 2007, $ MILLIONS
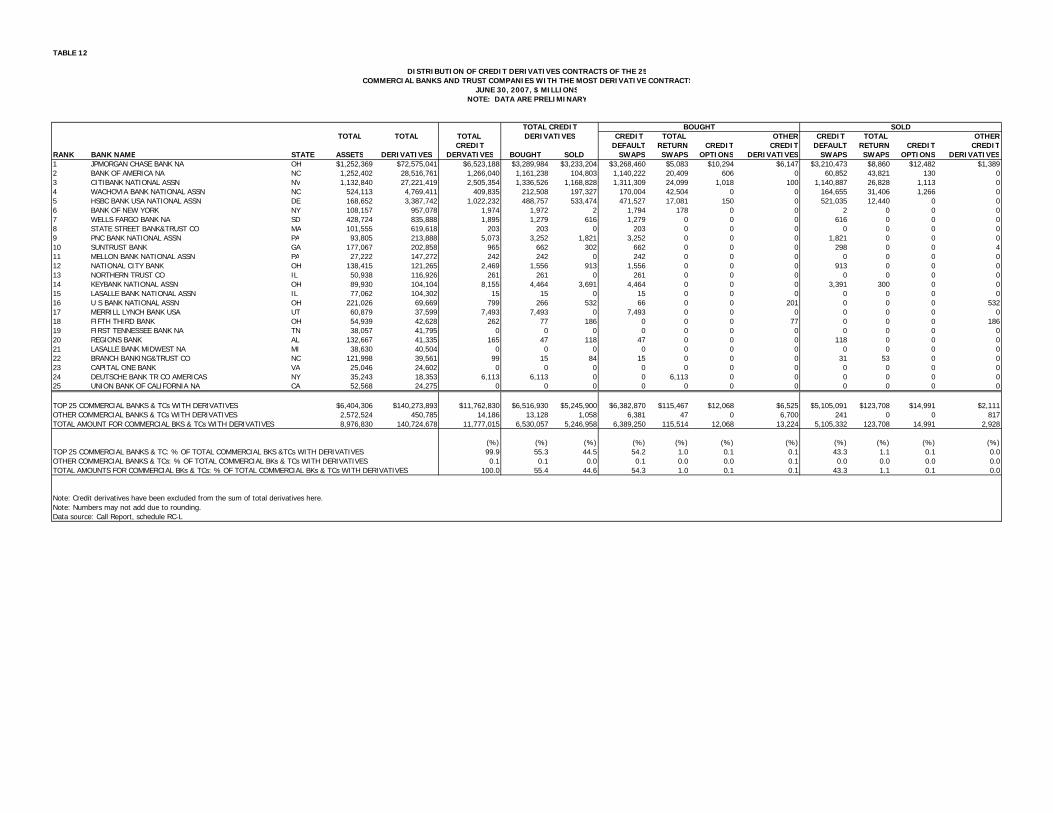
TABLE 12
TOTAL TOTAL TOTAL CREDIT TOTAL OTHER CREDIT TOTAL OTHERCREDIT DEFAULT RETURN CREDIT CREDIT DEFAULT RETURN CREDIT CREDIT
RANK BANK NAME STATE ASSETS DERIVATIVES DERVATIVES BOUGHT SOLD SWAPS SWAPS OPTIONS DERIVATIVES SWAPS SWAPS OPTIONS DERIVATIVES1 JPMORGAN CHASE BANK NA OH $1,252,369 $72,575,041 $6,523,188 $3,289,984 $3,233,204 $3,268,460 $5,083 $10,294 $6,147 $3,210,473 $8,860 $12,482 $1,3892 BANK OF AMERICA NA NC 1,252,402 28,516,761 1,266,040 1,161,238 104,803 1,140,222 20,409 606 0 60,852 43,821 130 03 CITIBANK NATIONAL ASSN NV 1,132,840 27,221,419 2,505,354 1,336,526 1,168,828 1,311,309 24,099 1,018 100 1,140,887 26,828 1,113 04 WACHOVIA BANK NATIONAL ASSN NC 524,113 4,769,411 409,835 212,508 197,327 170,004 42,504 0 0 164,655 31,406 1,266 05 HSBC BANK USA NATIONAL ASSN DE 168,652 3,387,742 1,022,232 488,757 533,474 471,527 17,081 150 0 521,035 12,440 0 06 BANK OF NEW YORK NY 108,157 957,078 1,974 1,972 2 1,794 178 0 0 2 0 0 07 WELLS FARGO BANK NA SD 428,724 835,888 1,895 1,279 616 1,279 0 0 0 616 0 0 08 STATE STREET BANK&TRUST CO MA 101,555 619,618 203 203 0 203 0 0 0 0 0 0 09 PNC BANK NATIONAL ASSN PA 93,805 213,888 5,073 3,252 1,821 3,252 0 0 0 1,821 0 0 010 SUNTRUST BANK GA 177,067 202,858 965 662 302 662 0 0 0 298 0 0 411 MELLON BANK NATIONAL ASSN PA 27,222 147,272 242 242 0 242 0 0 0 0 0 0 012 NATIONAL CITY BANK OH 138,415 121,265 2,469 1,556 913 1,556 0 0 0 913 0 0 013 NORTHERN TRUST CO IL 50,938 116,926 261 261 0 261 0 0 0 0 0 0 014 KEYBANK NATIONAL ASSN OH 89,930 104,104 8,155 4,464 3,691 4,464 0 0 0 3,391 300 0 015 LASALLE BANK NATIONAL ASSN IL 77,062 104,302 15 15 0 15 0 0 0 0 0 0 016 U S BANK NATIONAL ASSN OH 221,026 69,669 799 266 532 66 0 0 201 0 0 0 53217 MERRILL LYNCH BANK USA UT 60,879 37,599 7,493 7,493 0 7,493 0 0 0 0 0 0 018 FIFTH THIRD BANK OH 54,939 42,628 262 77 186 0 0 0 77 0 0 0 18619 FIRST TENNESSEE BANK NA TN 38,057 41,795 0 0 0 0 0 0 0 0 0 0 020 REGIONS BANK AL 132,667 41,335 165 47 118 47 0 0 0 118 0 0 021 LASALLE BANK MIDWEST NA MI 38,630 40,504 0 0 0 0 0 0 0 0 0 0 022 BRANCH BANKING&TRUST CO NC 121,998 39,561 99 15 84 15 0 0 0 31 53 0 023 CAPITAL ONE BANK VA 25,046 24,602 0 0 0 0 0 0 0 0 0 0 024 DEUTSCHE BANK TR CO AMERICAS NY 35,243 18,353 6,113 6,113 0 0 6,113 0 0 0 0 0 025 UNION BANK OF CALIFORNIA NA CA 52,568 24,275 0 0 0 0 0 0 0 0 0 0 0
TOP 25 COMMERCIAL BANKS & TCs WITH DERIVATIVES $6,404,306 $140,273,893 $11,762,830 $6,516,930 $5,245,900 $6,382,870 $115,467 $12,068 $6,525 $5,105,091 $123,708 $14,991 $2,111OTHER COMMERCIAL BANKS & TCs WITH DERIVATIVES 2,572,524 450,785 14,186 13,128 1,058 6,381 47 0 6,700 241 0 0 817TOTAL AMOUNT FOR COMMERCIAL BKS & TCs WITH DERIVATIVES 8,976,830 140,724,678 11,777,015 6,530,057 5,246,958 6,389,250 115,514 12,068 13,224 5,105,332 123,708 14,991 2,928
(%) (%) (%) (%) (%) (%) (%) (%) (%) (%) (%)TOP 25 COMMERCIAL BANKS & TC: % OF TOTAL COMMERCIAL BKS &TCs WITH DERIVATIVES 99.9 55.3 44.5 54.2 1.0 0.1 0.1 43.3 1.1 0.1 0.0OTHER COMMERCIAL BANKS & TCs: % OF TOTAL COMMERCIAL BKs & TCs WITH DERIVATIVES 0.1 0.1 0.0 0.1 0.0 0.0 0.1 0.0 0.0 0.0 0.0TOTAL AMOUNTS FOR COMMERCIAL BKs & TCs: % OF TOTAL COMMERCIAL BKs & TCs WITH DERIVATIVES 100.0 55.4 44.6 54.3 1.0 0.1 0.1 43.3 1.1 0.1 0.0
Note: Credit derivatives have been excluded from the sum of total derivatives here.Note: Numbers may not add due to rounding.Data source: Call Report, schedule RC-L
DISTRIBUTION OF CREDIT DERIVATIVES CONTRACTS OF THE 25COMMERCIAL BANKS AND TRUST COMPANIES WITH THE MOST DERIVATIVE CONTRACTS
NOTE: DATA ARE PRELIMINARY
DERIVATIVESBOUGHT SOLDTOTAL CREDIT
JUNE 30, 2007, $ MILLIONS