Embed Size (px)
Citation preview
Occupational health and safety issues for aged care workers: A comparison with
public hospital workers
Tracey Shea
Helen De Cieri
Cathy Sheehan
Ross Donohue
Brian Cooper
March 2016
Research report: 045-0316-R10

ISCRR Research Report# 045-0316-R10 Page 2 of 35
This research report was prepared for WorkSafe Victoria by
Tracey Shea, Helen De Cieri, Cathy Sheehan, Ross Donohue, Brian Cooper: Department of Management, Monash Business School, Monash University.
Acknowledgements
We gratefully acknowledge the generous support provided by WorkSafe Victoria and the Institute for Safety, Compensation and Recovery Research (ISCRR) for this project. We also acknowledge research assistance provided by Robin Baker, Naomi Uehara, Trisha Pettit, Sarah Lindsay, Marian Sims, Wendy Webber and Janelle Blythe, Monash University. We also thank Professor Judy Currey, Deakin University, for expert advice on the nursing context.
Disclaimer
The information provided in this document can only assist an individual or organisation in a general way. Monash University is not engaged in rendering specific professional advice and Monash University accepts no liability arising from the use of, or reliance on, the material contained in this document. Before relying on the material, users should carefully make their own assessment as to its accuracy, currency, completeness and relevance for their purposes, and should obtain any appropriate professional advice relevant to their particular circumstances. The material in this report is subject to copyright rights, if any person wishes to use, reproduce or adapt the material in this report, please contact the authors.
Contact details
Professor Helen De Cieri
Monash Business School
P.O. Box 197 Caulfield East
Victoria Australia 3145
Telephone: +613 9903 4155
Email: [email protected]
Website: www.ohsleadindicators.org
ISCRR is a joint initiative of WorkSafe Victoria, the Transport Accident Commission and Monash University. The opinions, findings and conclusions expressed in this publication are those of the authors and not necessarily those of WorkSafe Victoria or ISCRR.

ISCRR Research Report# 045-0316-R10 Page 3 of 35
To cite this report:
Shea, T., De Cieri, H., Sheehan, C., Donohue, R., & Cooper, B. 2015. Occupational health and safety issues for aged care workers: A comparison with public hospital workers. Report prepared for ISCRR and WSV. Monash University, report no. 045-0216-R10: Caulfield East VIC Australia.
Accompanying document:
De Cieri, H., Shea, T., Sheehan, C., Donohue, R., & Cooper, B. 2015. Leading indicators of occupational health and safety: A report on a survey of Australian Nursing and Midwifery Federation (Victorian Branch) members. ISCRR report number: 0714-045-R5. Monash University: Caulfield East VIC Australia.

ISCRR Research Report# 045-0316-R10 Page 4 of 35
With regard to the IWH-OPM and the Organizational Performance Metric-Monash University (OPM-MU):
This work is licensed under the Creative Commons Attribution-NonCommercial-NoDerivatives 4.0 International License. To view a copy of this license, visit http://creativecommons.org/licenses/by-nc-nd/4.0/ or send a letter to Creative Commons, PO Box 1866, Mountain View, CA 94042, USA
Monash University licenses the Organizational Performance Metric-Monash University (OPM-MU) under a Creative Commons Attribution-NonCommercial-NoDerivatives 4.0 International License on the following terms:
Attribution – Licensees will be required to give appropriate credit to Monash University, WorkSafe Victoria, and IWH (as creator of the original IWH-OPM).
Non-commercial – Licensees will only be able to use the OPM-MU for non-commercial purposes.
No-derivatives – If a licensee remixes, transforms or builds upon the OPM-MU, the licensee will not be able to distribute that derivative of the OPM-MU.

ISCRR Research Report# 045-0316-R10 Page 5 of 35
Table of Contents
1. Executive Summary ..................................................................................................... 6
1.1. Background and aims ........................................................................................... 6
1.1. Research method ................................................................................................. 6
1.2. Key findings .......................................................................................................... 7
2. Introduction ................................................................................................................ 10
3. Method ........................................................................................................................ 11
3.1. Sample and procedure ....................................................................................... 11
3.2. Measures ............................................................................................................ 11
4. Results ........................................................................................................................ 13
4.1. Survey respondents and shifts worked ............................................................... 13
4.2. OHS leading indicators ....................................................................................... 20
4.3. Risk factors and hazard exposure ...................................................................... 22
4.4. Workplace bullying, violence and aggression ..................................................... 25
4.5. OHS outcomes ................................................................................................... 28
4.6. OHS incidents and risk of fatigue and workplace stress ..................................... 30
5. Key Findings and Conclusion ................................................................................... 31
6. References .................................................................................................................. 34
ISCRR Research Report# 045-0316-R10 Page 6 of 35
1. Executive Summary
1.1. Background and aims
This report presents supplementary results of an Occupational Health and Safety (OHS) Survey conducted with the members of the Australian Nursing and Midwifery Federation (ANMF) (Victorian Branch) in April and May 2014 by a Monash University research team. The work is part of a large national research project that is being conducted by Monash University in partnership with the WorkSafe Victoria, the Institute for Safety, Compensation and Recovery Research and SafeWork Australia.
The aim of this report is to focus specifically on a comparison of survey responses from ANMF members working in public hospitals and aged care facilities related to
1. Demographics and shifts worked;
2. OHS leading indicators;
3. Risk factors for OHS and exposure to hazards;
4. Workplace bullying, violence and aggression;
5. OHS outcomes; and
6. OHS incidents and risk of fatigue and workplace stress.
1.1. Research method
ANMF (Victorian Branch) members were invited to participate in an online OHS Survey through April and May 2014. The survey targeted all registered members of the ANMF (Victorian Branch). Overall, 69,927 members had the opportunity to participate in the survey. Responses were received from 4,891 members, which represented 7 percent response rate. The subset of this sample of interest to this report were members who worked in aged care facilities (n = 956 respondents) and public hospitals (n = 2,492 respondents).

ISCRR Research Report# 045-0316-R10 Page 7 of 35
1.2. Key findings
This comparison of survey results from the ANMF members working in aged care facilities and public hospitals revealed the following:
1. The profiles of respondents working in aged care facilities and public hospitals were similar in several respects:
The majority of respondents in both workplace types were women, aged between 46 and 65 years. Generally, members in both workplace types (aged care facilities and public hospitals) work in only one job, and were currently working full-time or part-time. Due to the anonymous nature of the survey, respondents could not directly be compared with non-respondents. Nevertheless, the sample characteristics are highly consistent with national statistics on the nursing and midwifery workforce in Australia (AIHW, 2012).
2. The profiles differed with respect to representation of ANMF membership groups:
Respondents from public hospitals reported working in all four ANMF member groups: registered nurses, enrolled nurses, midwives and personal carers. The majority of respondents working in public hospitals, however, worked as registered nurses.
Respondents working in aged care facilities were registered nurses, enrolled nurses and personal carers. Half of respondents from aged care facilities worked as enrolled nurses.
3. OHS leading indicators were measured using the Organizational Performance Metric-Monash University (OPM-MU).1 Key findings for OHS leading indicators showed that
The patterns of scores on individual OPM-MU items was very similar across workplace types.
The item, those who act safely receive positive recognition, obtained the lowest average score from respondents in both workplace types.
The item workers and supervisors have the information they need to work safely received the highest average score.
Respondents working in aged care facilities tended to rate their workplaces higher on OHS leading indicators compared to those working in public hospitals. The average scores on the OPM-MU for the overall ANMF member survey was 27.4 (SD = 6.7). Overall, members of the ANMF rated their workplaces lower than those obtained from a recent study of managers in Victorian workplaces across different industries where the average OPM-MU score was 33.4 (SD = 4.2).
1 The Organizational Performance Metric‐Monash University (OPM‐MU: Shea et al., 2016) is an adapted version of the Organizational Performance Metric (IWH‐OPM: IWH, 2011; 2013).
ISCRR Research Report# 045-0316-R10 Page 8 of 35
4. Seven risk factors were measured: workplace psychological safety, emotional labour, burnout, role overload, physical demands / ergonomic issues, violence in the workplace and bullying. Key findings for risk factors were
Respondents’ experience of emotional labour was higher in aged care facilities than in public hospitals.
For other risk factors, the pattern of scores is very similar for respondents working in aged care facilities and public hospitals.
Generally, role overload was rated very high indicating that this is the most prevalent risk factor in both aged care facilities and public hospitals.
5. Exposure to a range of hazards was assessed: fatigue, workplace stress, occupational violence and aggression, workplace bullying, patient handling, other manual handling, noise, blood-borne pathogens, other infectious agents, cytotoxic drugs, chemical agents, ionizing radiation (e.g., X-rays), non-ionizing radiation. Key findings for exposure to hazards were
An overall pattern of hazard exposure that is similar across workplace types.
A greater exposure, on average, to hazards such as blood pathogens and other infectious agents, radiation, chemical agents and cytotoxic drugs for respondents who work in public hospitals.
Slightly higher exposure, on average, to fatigue, stress as well as violence and aggression for respondents working in public hospitals.
Slightly higher exposure to bullying as well as patient and manual handling issues, on average, for respondents who work in aged care facilities.
6. Key findings for occupational bullying and violence were
More than half of those working in aged care facilities and nearly half of those working in public hospitals reported that they had experienced at least one episode of workplace bullying in the past 12 months. Respondents working in aged care facilities were more likely to report of bullying than respondents in public hospitals.
The predominant source of bullying experienced by respondents working in both workplace types was either from managers/supervisors or colleagues.
Nearly half of respondents in both workplace types indicated that they had experienced occupational violence or aggression at least a few times in the past twelve months.
In both workplace types, for those who had experienced violence and aggression at work in the past 12 months, most indicated that occupational violence and aggression came from patients.
While the general pattern for the source of violence and aggression is similar for both groups, the experience of violence and aggression from relatives of patients, patient visitors and the public was much higher in public hospitals.
ISCRR Research Report# 045-0316-R10 Page 9 of 35
7. Key findings for OHS outcomes were
Fifty-nine percent of respondents working in aged care facilities and 62 percent of respondents working in public hospitals reported that they had experienced an OHS incident in the past year.
The average number of OHS incidents experienced by members of both workplace types shows that near misses are the most prevalent type of incident experienced.
8. OHS incidents and risk of fatigue and workplace stress:
Fatigue is associated with OHS incidents. Respondents who reported being at higher risk of fatigue at work were more likely to experience OHS incidents, compared to the respondents who were at lower risk of fatigue at work. No differences were observed between workplace types.
Work-related stress is associated with OHS incidents. Respondents who reported being at higher risk of stress at work were more likely to experience OHS incidents, compared to the respondents who were at lower risk of stress at work.
This report is part of a larger study investigating leading indicators of OHS. Several other reports are available on this project and we recommend that this report be viewed as a companion piece to the other reports, which are available at http://ohsleadindicators.org and on the ISCRR website (www.iscrr.com.au). Overall, this research will contribute to understanding of OHS leading indicators and OHS performance in Australian workplaces.
ISCRR Research Report# 045-0316-R10 Page 10 of 35
2. Introduction
Nationally and internationally, regulators, researchers and practitioners in occupational health and safety (OHS) have a shared interest in understanding the links between workplace factors and OHS outcomes. There are substantial changes evident in workplaces and workforces due to influences such as economic pressures, demographic changes, technological innovation and changes in employment patterns (Cappelli & Keller, 2013; Shaw, 2013). Research has shown that these changes are associated with OHS matters. Recent workers’ compensation claims data and other work-related injury and illness statistics show that workers in the residential care sector, which includes aged care workers, have a higher than average chance of being seriously injured at work (WorkSafe Victoria, 2015).
This report compares perceptions of two subsets of members of the Australian Nursing and Midwifery Federation (ANMF Victorian branch), members working in public hospitals and members working in aged care, on the results of an Occupational Health and Safety (OHS) Survey. The survey was conducted in April-May 2014 by a Monash University research team.
The aim of this brief report is to focus specifically on a comparison of survey responses from ANMF members working in public hospitals and aged care facilities, related to
1. Demographics and shifts worked;
2. OHS leading indicators;
3. Risk factors for OHS and exposure to hazards;
4. Workplace bullying, violence and aggression;
5. OHS outcomes; and
6. OHS incidents and risk of fatigue and workplace stress.
Given the supplementary nature of this report a detailed background is not provided. Readers seeking greater detail on the subject matter areas covered in this report or further information on the original study are referred to the initial report on the ANMF member survey by De Cieri and colleagues (2015).

ISCRR Research Report# 045-0316-R10 Page 11 of 35
3. Method
3.1. Sample and procedure
The sample for this report was drawn from a survey conducted with members of the ANMF (Victorian branch) during April and May 2014. The survey was conducted online and targeted all registered members of the ANMF. Members were sent an invitation email that contained a link to the survey and they were able to complete the questionnaires at their own pace. Two reminders were sent out at two and four weeks following the initial invitation.
While data were collected from 4,891 members of the ANMF (representing a 7 percent response rate), the focus of this report is on the subset of members working in aged care facilities and public hospitals. For full details of this survey, see the initial report prepared by De Cieri and colleagues (2015).
The survey contained several sections where respondents were asked to provide information about their role in their respective workplaces, their experience of OHS incidents in the past 12 months, and their perceptions, attitudes and behaviours and other issues related to OHS, such as exposure to psychosocial, physical and physiological risk in the workplace.
3.2. Measures
Respondent demographic and workplace details were collected along with several perceptual measures. Demographic measures included details such as gender and age while workplace details included employment status, workplace tenure and location as well as membership type.
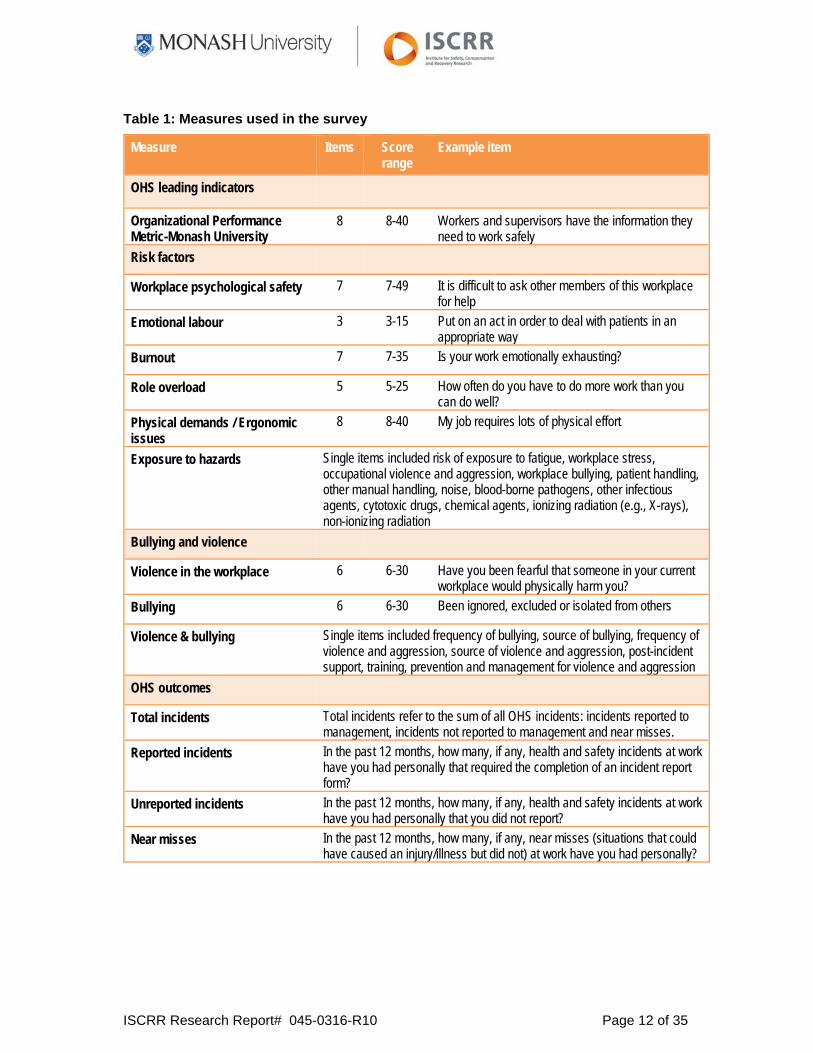
Table 1 below shows the measures used in the survey that are the focus of this report: OHS leading indicators, risk factors and violence and bullying. As shown in the table most measures were rated on Likert response scales (e.g., from 1 = strongly disagree to 5 = strongly agree) but some were single item measures asking for binary responses (e.g., yes, no) or for frequency of occurrence (e.g., 0, 1, 2, 3 …).
Generally, the scores for the items were summed to obtain the respondent’s overall rating on each measure. However, the measures in the risk factor section of this report have been consolidated into one figure to enable comparisons to be drawn between scales. These risk factor measures were constructed using different numbers of items and response options, and so can only be compared directly by converting the raw total scores to a common metric with scores ranging from 0 to 100.
ISCRR Research Report# 045-0316-R10 Page 12 of 35
Table 1: Measures used in the survey
Measure Items Score range
Example item
OHS leading indicators
Organizational Performance Metric-Monash University
8 8-40 Workers and supervisors have the information they need to work safely
Risk factors
Workplace psychological safety 7 7-49 It is difficult to ask other members of this workplace for help
Emotional labour 3 3-15 Put on an act in order to deal with patients in an appropriate way
Burnout 7 7-35 Is your work emotionally exhausting?
Role overload 5 5-25 How often do you have to do more work than you can do well?
Physical demands / Ergonomic issues
8 8-40 My job requires lots of physical effort
Exposure to hazards Single items included risk of exposure to fatigue, workplace stress, occupational violence and aggression, workplace bullying, patient handling, other manual handling, noise, blood-borne pathogens, other infectious agents, cytotoxic drugs, chemical agents, ionizing radiation (e.g., X-rays), non-ionizing radiation
Bullying and violence
Violence in the workplace 6 6-30 Have you been fearful that someone in your current workplace would physically harm you?
Bullying 6 6-30 Been ignored, excluded or isolated from others
Violence & bullying Single items included frequency of bullying, source of bullying, frequency of violence and aggression, source of violence and aggression, post-incident support, training, prevention and management for violence and aggression
OHS outcomes
Total incidents Total incidents refer to the sum of all OHS incidents: incidents reported to management, incidents not reported to management and near misses.
Reported incidents In the past 12 months, how many, if any, health and safety incidents at work have you had personally that required the completion of an incident report form?
Unreported incidents In the past 12 months, how many, if any, health and safety incidents at work have you had personally that you did not report?
Near misses In the past 12 months, how many, if any, near misses (situations that could have caused an injury/illness but did not) at work have you had personally?

ISCRR Research Report# 045-0316-R10 Page 13 of 35
4. Results
The results discussed in this report first describe the respondents and then compare the responses with regard to OHS leading indicators, risk factors and exposure to hazards, violence and bullying and OHS outcomes
by workplace type (aged care, public hospital); and
within the aged care group (ANMF member type).
Finally, responses from ANMF members working in aged care facilities are also examined according to reported levels of fatigue and stress (low, medium, high).
4.1. Survey respondents and shifts worked
Aged care facilities
50 percent were enrolled nurses 92 percent were women 67 percent were aged 46 to 65 years 82 percent held only one job 13 percent worked in full-time and 75
percent worked in part-time positions 52 percent have been working for their
current employer for five years or less
Public hospitals
75 percent were registered nurses 92 percent were women 60 percent were aged 46 to 65 years 82 percent held only one job 27 percent worked in full-time and 63
percent worked in part-time positions 36 percent have been working for their
current employer for five years or less
Figure 1 below shows that the majority (74 percent) of respondents working in public hospitals were registered nurses, although the other member types were also represented. Fifty percent of respondents working in aged care facilities were enrolled nurses.
Figure 1: Member type by workplace
35%
50%
0%
15%
74%
14% 12%
0%0%
20%
40%
60%
80%
100%
Registered nurse Enrolled nurse Midwife Personal carer
Aged care Public hospital

ISCRR Research Report# 045-0316-R10 Page 14 of 35
Figure 2 below shows that distribution of gender across workplace type is the same. Most respondents were women.
Figure 2: Gender by workplace type
Figure 3 below shows that there is a similar distribution of age across workplace type. Generally, members working in aged care facilities and public hospitals were aged between 46 and 65 years.
Figure 3: Respondent age by workplace type
Figure 4 below shows that the number of jobs held is the same for respondents in aged care and in public hospitals. Most respondents held only one job.
8%
92%
8%
92%
0%
20%
40%
60%
80%
100%
Male Female
Aged care Public hospital
3%10%
15%
38%29%
4%5%14%
20%
36%
24%
2%
0%
20%
40%
60%
80%
100%
18‐25 years 26‐35 years 36‐45 years 46‐55 years 56‐65 years 66+ years
Aged care Public hospital

ISCRR Research Report# 045-0316-R10 Page 15 of 35
Figure 4: Number of jobs by workplace type
Figure 5 below displays the distribution of employment status for members by workplace type. While the distribution of employment status was similar across workplace type, a larger proportion of members working in aged care were working in part-time positions, compared with those working in public hospitals.
Figure 5: Employment status by workplace type
Figure 6 below shows that the length of time the respondents have been employed in their workplace (workplace tenure) is roughly similar across workplace types. However, fifty-two percent of those working in aged care reported working in their jobs for less than five years, while forty-two percent of those working in public hospitals had been in their jobs for more than ten years.
82%
18%
82%
18%
0%
20%
40%
60%
80%
100%
One job More than one job
Aged care Public hospital
13%
75%
9%1% 2%
27%
63%
8%1% 1%
0%
20%
40%
60%
80%
100%
Full‐time Part‐time Bank /Casual Temporary/Agency Other
Aged care Public hospital

ISCRR Research Report# 045-0316-R10 Page 16 of 35
Figure 6: Workplace tenure by workplace type
Figure 7 shows that there were no differences for members across workplace type with regard to percentage of respondents who worked set shifts. The majority of ANMF members working in both aged care facilities and public hospitals did not work set shifts.
Figure 7: Set shifts by workplace type
Figure 8 below shows that ANMF members from both aged care facilities and public hospitals who said they worked set shifts, worked across a range of shift types (respondents were able to select more than one shift type). However, members working in aged care were more likely to work evening shifts while those working in public hospitals were more likely to work day shifts.
12%
40%
22%17%
9%8%
28%22% 25%
17%
0%
20%
40%
60%
80%
100%
Less than 1 year 1 to 5 years 6 to 10 years 11 to 20 years More than 20 years
Aged care Public hospital
29%
71%
34%
66%
0%
20%
40%
60%
80%
100%
Yes No
Aged care Public hospital

ISCRR Research Report# 045-0316-R10 Page 17 of 35
Figure 8: Type of set shifts by workplace type
Figure 9 below shows that ANMF members working in public hospitals were more likely to work rotating shifts compared to ANMF members working in aged care facilities.
Figure 9: Rotating shifts by workplace type
Figure 10 shows that of those who said they worked rotating shifts, most respondents from both workplace types indicated that there is no pattern to the rostering of their rotating shifts. The lack of a rostering pattern is particularly prevalent in public hospitals.
80% 77%
59%
46%
72%
58% 60%
83%
0%
20%
40%
60%
80%
100%
AM shifts PM shifts Night shifts Day shifts
Aged care Public hospital
24%
76%
53%47%
0%
20%
40%
60%
80%
100%
Yes No
Aged care Public hospital

ISCRR Research Report# 045-0316-R10 Page 18 of 35
Figure 10: Rostering pattern by workplace type
Figure 11 shows that the percentage of respondents who work double shifts across workplace types is roughly equivalent. Most respondents indicated that they did not work double shifts.
Figure 11: Double shifts by workplace type
Figure 12 below displays the distribution of double shifts across workplace type. This figure shows that, in both workplaces, those who said they worked double shifts tended to work only one or two double shifts per month.
30%
47%
23%19%
65%
16%
0%
20%
40%
60%
80%
100%
Yes No Unsure
Aged care Public hospital
12%
88%
13%
87%
0%
20%
40%
60%
80%
100%
Yes No
Aged care Public hospital

ISCRR Research Report# 045-0316-R10 Page 19 of 35
Figure 12: Double shifts per month by workplace type
Figure 13 below displays the distribution of short shifts across workplace type. This figure shows that, in both workplaces, most members did not work short shifts.
Figure 13: Short shifts by workplace type
Figure 14 shows some differences in the distribution of short shifts per month across ANMF members from different workplace types. Respondents working in public hospitals who reported working short shifts often worked only one short shift a month; however, those working in aged care facilities were likely to work more than one short shift in a month.
53%
28%
9% 5% 6%
73%
13%4% 4% 5%
0%
20%
40%
60%
80%
100%
Once Twice Three times Four times More than four times
Aged care Public hospital
16%
84%
6%
94%
0%
20%
40%
60%
80%
100%
Yes No
Aged care Public hospital

ISCRR Research Report# 045-0316-R10 Page 20 of 35
Figure 14: Short shifts per month by workplace type
4.2. OHS leading indicators
Scores on the OHS leading indicators, as measured by the eight-item OPM-MU, are displayed below in Figure 15 and Figure 16. Figure 15 below displays the average ratings for each of the OPM-MU items. Respondents rated their workplaces using the entire range of response options from strongly disagree (1) through to strongly agree (5) with average scores for each item ranging from 3.0 to 3.8 for members of both workplace types.
The patterns of scores on individual items were the generally the same across workplace types with ANMF members from public hospitals rating their workplaces slightly lower on OHS leading indicators compared to ANMF members working in aged care facilities. The item, those who act safely receive positive recognition, obtained the lowest average score from respondents in both workplace types. The item workers and supervisors have the information they need to work safely received the highest average score.
13%
24%
7%
35%
20%
36%
17%9%
19% 19%
0%
20%
40%
60%
80%
100%
Once Twice Three times Four times More than four times
Aged care Public hospital

ISCRR Research Report# 045-0316-R10 Page 21 of 35
Figure 15: Individual items of the OPM-MU by workplace type
3.5
3.0
3.5
3.3
3.8
3.5
3.6
3.8
3.3
3.0
3.4
3.1
3.8
3.5
3.5
3.7
0.0 1.0 2.0 3.0 4.0 5.0
Everyone has the resources / equipment they need
Those who act safely receive positive recognition
Those in charge of OHS have authority
Workers involved in decisions
Information needed to work safely
OHS at least as important as efficiency
Everyone values ongoing OHS
Formal OHS audits
Public hospital Aged care

ISCRR Research Report# 045-0316-R10 Page 22 of 35
Figure 16 below shows that members working in aged care facilities tended to rate their workplaces slightly higher on OHS leading indicators compared to those working in public hospitals. The average scores on the OPM-MU for the overall ANMF member survey was 27.4 (SD = 6.7). Overall, members of the ANMF rated their workplaces lower than those obtained from a recent study of managers in Victorian workplaces across different industries where the average OPM-MU score was 33.4 (SD = 4.2).
Figure 16: OPM-MU score by workplace type
4.3. Risk factors and hazard exposure
In this section we compare the two workplace types on several measures of risk. In addition to comparing member ratings across workplace types, we also compare ratings within workplace type to determine which risk factors are more prevalent within each workplace type.
For ease of presentation and comparison, raw scores on each of these scales have been converted to range from 0 to 100 to create a common metric that enables us to compare scores from scales that have different numbers of items and different numbers of response options. For example, in the chart below, role overload scored, on average, 76.8 out of the maximum possible score of 100.
Figure 17 below shows that, with the exception of emotional labour which was higher in aged care facilities, the pattern of risk scores is generally the same for respondents working in aged care facilities and public hospitals. Generally, role overload is rated very high indicating that this is the most prevalent risk factor.
28.127.2
20.0
25.0
30.0
35.0
40.0
Aged care Public hospital

ISCRR Research Report# 045-0316-R10 Page 23 of 35
Figure 17: Risk factors by workplace type
51.7
37.7
55.7
78.6
48.7
48.3
23.8
56.1
35.8
53.0
78.9
47.4
35.2
19.8
0.0 20.0 40.0 60.0 80.0 100.0
Bullying
Violence in the workplace
Physical demands
Role overload
Burnout
Emotional labour
Psychological safety
Public hospital Aged care

ISCRR Research Report# 045-0316-R10 Page 24 of 35
Figure 18 shows that the overall pattern of hazard exposure is similar across workplace types but respondents who work in public hospitals have greater exposure, on average, to hazards such as blood pathogens and other infectious agents, radiation, chemical agents and cytotoxic drugs. ANMF members working in public hospitals also reported slightly higher exposure, on average, to fatigue, stress as well as violence and aggression. ANMF members who work in aged care facilities reported experiencing slightly higher levels of bullying and exposure to patient and manual handling issues, on average, compared to those working in public hospitals.
Figure 18: Exposure to hazards by workplace type
1.7
1.3
1.2
1.3
2.3
2.7
2.3
3.0
3.4
3.0
2.9
3.6
3.6
2.0
1.9
1.9
1.7
2.5
3.1
3.0
3.0
3.3
3.2
2.8
3.8
3.7
0.0 1.0 2.0 3.0 4.0 5.0
Cytotoxic drugs
Chemical agents
Ionizing radiation
Non‐ionizing radiation
Noise
Other infectious
Blood pathogens
Manual handling
Patient handling
Violence & aggression
Bullying
Stress
Fatigue
Public hospital Aged care

ISCRR Research Report# 045-0316-R10 Page 25 of 35
4.4. Workplace bullying, violence and aggression
Figure 19 below shows that nearly half of those working in aged care facilities and nearly half of those working in public hospitals and slightly more than half of those working in aged care reported that they had experienced at least one episode of bullying in the past 12 months. However, at least 10 percent of those working in both aged care and public hospitals reported experiencing regular bullying (monthly, weekly or daily). Overall, respondents working in aged care facilities reported slightly higher levels of bullying than members in public hospitals.
Figure 19: Experience of bullying by workplace type
Figure 20 below shows that the predominant source of bullying experienced by respondents working in both workplace types was either from managers/supervisors or colleagues. More than half of those respondents who indicated that they had experienced bullying indicated the source of bullying as managers/supervisors. Respondents in aged care facilities indicated greater levels of bullying from colleagues compared to those working in public hospitals. It should be noted that it was possible for respondents to indicate more than one source of bullying.
Figure 20: Source of bullying by workplace type
48%39%
3%7% 4%
58%
33%
2% 5% 2%
0%
20%
40%
60%
80%
100%
Never A few times Monthly Weekly Daily
Aged care Public hospital
51%
64%
14%9%
57%
40%
11% 10%
0%
20%
40%
60%
80%
100%
Managers/Supervisors
Colleagues Subordinates Other
Aged care Public hospital

ISCRR Research Report# 045-0316-R10 Page 26 of 35
Figure 21 below shows that most respondents reported the presence of prevention and management policies for violence and aggression. This was higher in public hospitals compared to aged care facilities.
Figure 21: Prevention and management policies by workplace type
Figure 22 shows that 74 percent of those in public hospitals and 61 percent of those in aged care facilities had received training to manage violence and aggression.
Figure 22: Training in managing violence and aggression
Figure 23 below shows that nearly half of respondents in both workplace types indicated that they had experienced occupational violence or aggression at least a few times in the past twelve months, while nearly a third of respondents in both workplace types indicated that they experienced regular episodes (monthly, weekly or daily) of violence or aggression. The experience of violence and aggression was roughly equivalent across workplace types.
86%
14%
95%
6%
0%
20%
40%
60%
80%
100%
Policies No policies
Aged care Public hospital
61%
39%
74%
26%
0%
20%
40%
60%
80%
100%
Training No training
Aged care Public hospital
ISCRR Research Report# 045-0316-R10 Page 27 of 35
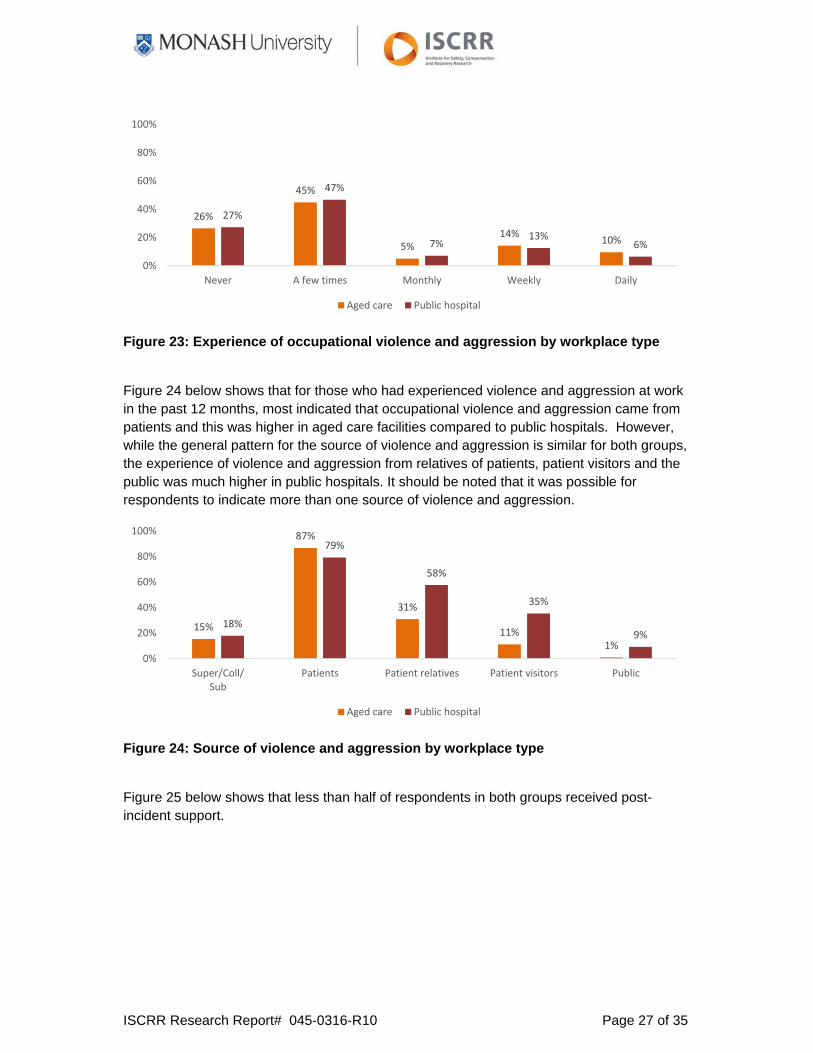
Figure 23: Experience of occupational violence and aggression by workplace type
Figure 24 below shows that for those who had experienced violence and aggression at work in the past 12 months, most indicated that occupational violence and aggression came from patients and this was higher in aged care facilities compared to public hospitals. However, while the general pattern for the source of violence and aggression is similar for both groups, the experience of violence and aggression from relatives of patients, patient visitors and the public was much higher in public hospitals. It should be noted that it was possible for respondents to indicate more than one source of violence and aggression.
Figure 24: Source of violence and aggression by workplace type
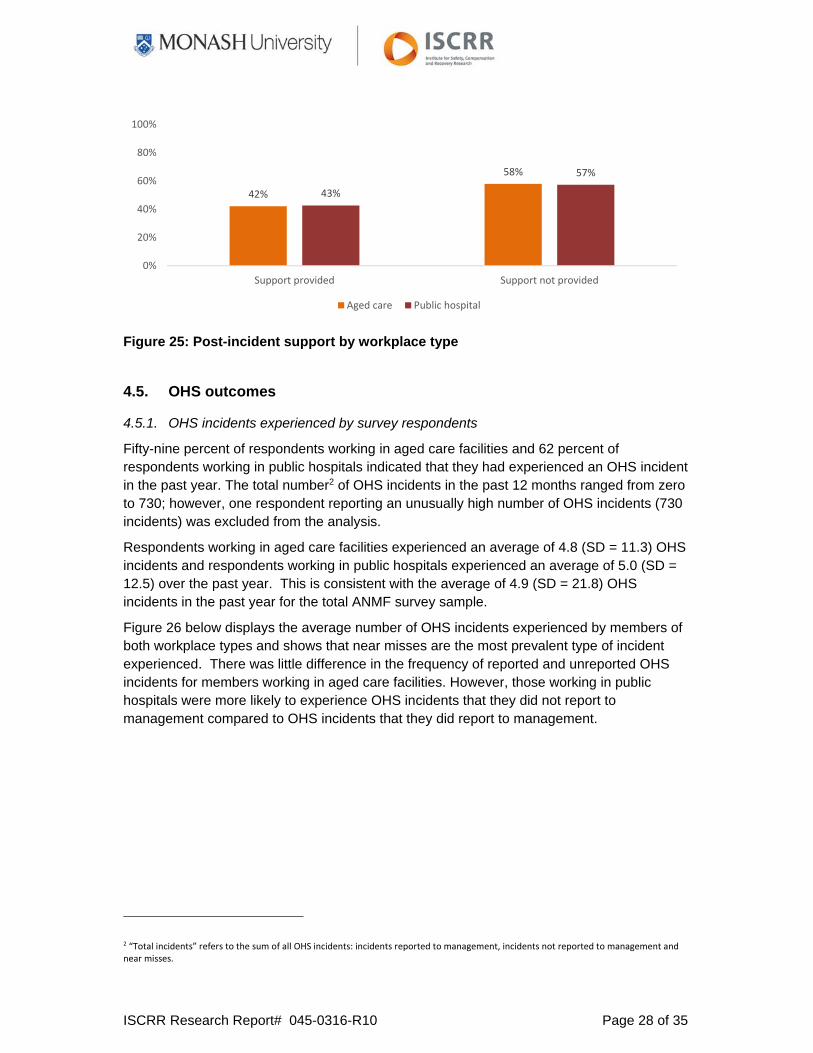
Figure 25 below shows that less than half of respondents in both groups received post-incident support.
26%
45%
5%14%
10%
27%
47%
7%13%
6%
0%
20%
40%
60%
80%
100%
Never A few times Monthly Weekly Daily
Aged care Public hospital
15%
87%
31%
11%1%
18%
79%
58%
35%
9%
0%
20%
40%
60%
80%
100%
Super/Coll/Sub
Patients Patient relatives Patient visitors Public
Aged care Public hospital
ISCRR Research Report# 045-0316-R10 Page 28 of 35
Figure 25: Post-incident support by workplace type
4.5. OHS outcomes
4.5.1. OHS incidents experienced by survey respondents
Fifty-nine percent of respondents working in aged care facilities and 62 percent of respondents working in public hospitals indicated that they had experienced an OHS incident in the past year. The total number2 of OHS incidents in the past 12 months ranged from zero to 730; however, one respondent reporting an unusually high number of OHS incidents (730 incidents) was excluded from the analysis.
Respondents working in aged care facilities experienced an average of 4.8 (SD = 11.3) OHS incidents and respondents working in public hospitals experienced an average of 5.0 (SD = 12.5) over the past year. This is consistent with the average of 4.9 (SD = 21.8) OHS incidents in the past year for the total ANMF survey sample.
Figure 26 below displays the average number of OHS incidents experienced by members of both workplace types and shows that near misses are the most prevalent type of incident experienced. There was little difference in the frequency of reported and unreported OHS incidents for members working in aged care facilities. However, those working in public hospitals were more likely to experience OHS incidents that they did not report to management compared to OHS incidents that they did report to management.
2 “Total incidents” refers to the sum of all OHS incidents: incidents reported to management, incidents not reported to management and near misses.
42%
58%
43%
57%
0%
20%
40%
60%
80%
100%
Support provided Support not provided
Aged care Public hospital

ISCRR Research Report# 045-0316-R10 Page 29 of 35
Figure 26: OHS incidents by workplace type
4.5.2. Days off work due to OHS incidents
Twenty-one percent of respondents in aged care facilities and 18 percent of respondents in public hospitals indicated they have had days off work that were associated with a workplace OHS incident within the last 12 months. On average, the number of days off work as a result of an OHS injury or illness was 11.1 days (SD = 23.2) for those working in an aged care facility and 11.9 (SD = 28.2) for those working in public hospitals.
Thirty-one percent of respondents in aged care facilities and 35 percent of respondents in public hospitals reported having days off work as a result of workplace stress within the last 12 months. On average, the number of days off work as a result of workplace stress was 10.5 days (SD = 25.0) for those working in an aged care facility and 7.1 (SD = 19.9) for those working in public hospitals.
4.5.3. WorkCover claims
Eleven percent of respondents working in aged care facilities and 7 percent of respondents working in public hospitals indicated that they had submitted a WorkCover claim for a workplace injury or illness. Four percent of respondents working in aged care facilities and 3 percent of respondents working in public hospitals indicated that they had made a WorkCover claim for workplace stress or a workplace stress-related illness in the past year.
Although the pattern of the number of claims accepted to those submitted was similar between those working in aged care facilities and public hospitals, the average number of claims submitted by those working in aged care facilities (M = 1.6 claims submitted, SD = 1.5; M = 1.3 claims accepted, SD = 1.5) for workplace injury or illness was slightly higher than the number of claims submitted by those working in public hospitals (M = 1.3 claims submitted, SD = 1.1; M = 1.0 claims accepted, SD = 0.6).
Similarly, the pattern of the number of claims accepted for workplace stress or stress-related illness to those submitted was similar between those working in aged care facilities and public hospitals. The average number of stress-related claims submitted by those working in aged care facilities (M = 1.8 claims submitted, SD = 1.5; M = 1.5 claims accepted, SD = 1.7)
1.37 1.32
2.07
1.16
1.62
2.17
0.00
1.00
2.00
3.00
Reported incidents Incidents not reported Near misses
Aged care Public hospital
ISCRR Research Report# 045-0316-R10 Page 30 of 35
for stress-related injury or illness was slightly higher than the number of stress-related claims submitted by those working in public hospitals (M = 1.6 stress claims submitted, SD = 1.6; M = 0.9 stress claims accepted, SD = 0.7).
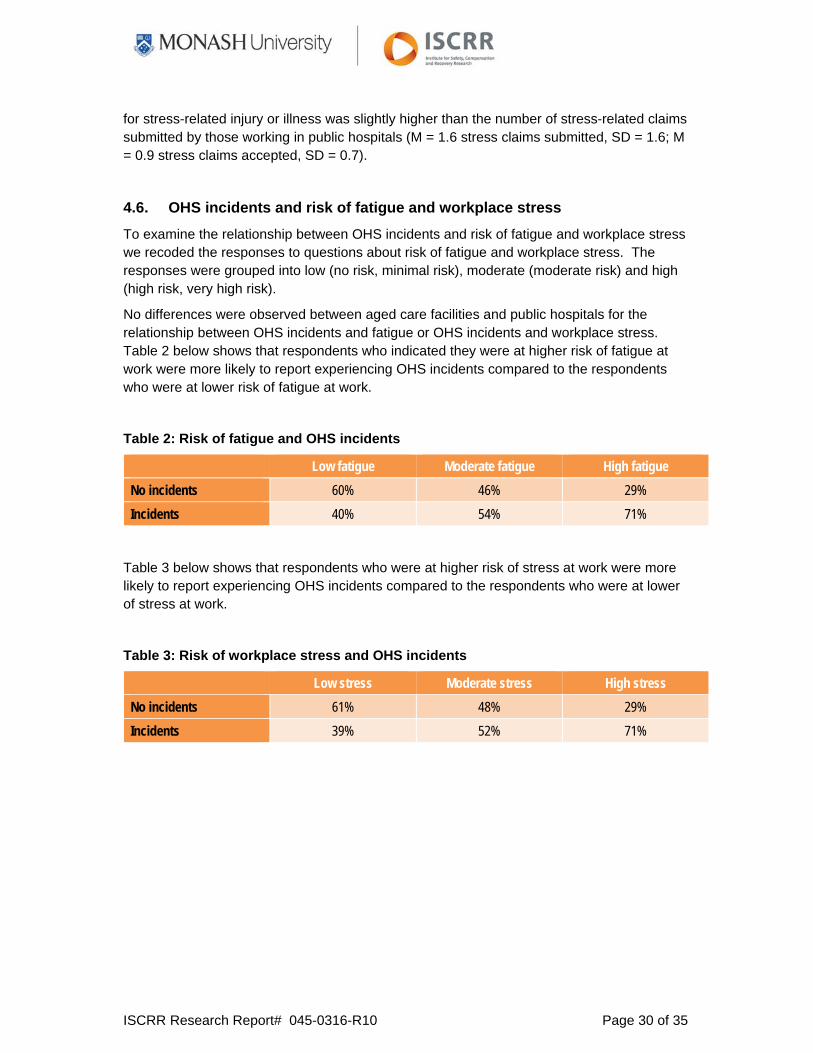
4.6. OHS incidents and risk of fatigue and workplace stress
To examine the relationship between OHS incidents and risk of fatigue and workplace stress we recoded the responses to questions about risk of fatigue and workplace stress. The responses were grouped into low (no risk, minimal risk), moderate (moderate risk) and high (high risk, very high risk).
No differences were observed between aged care facilities and public hospitals for the relationship between OHS incidents and fatigue or OHS incidents and workplace stress. Table 2 below shows that respondents who indicated they were at higher risk of fatigue at work were more likely to report experiencing OHS incidents compared to the respondents who were at lower risk of fatigue at work.
Table 2: Risk of fatigue and OHS incidents
Low fatigue Moderate fatigue High fatigue
No incidents 60% 46% 29%
Incidents 40% 54% 71%
Table 3 below shows that respondents who were at higher risk of stress at work were more likely to report experiencing OHS incidents compared to the respondents who were at lower of stress at work.
Table 3: Risk of workplace stress and OHS incidents
Low stress Moderate stress High stress
No incidents 61% 48% 29%
Incidents 39% 52% 71%

ISCRR Research Report# 045-0316-R10 Page 31 of 35
5. Key Findings and Conclusion
This comparison of survey results from the ANMF members working in aged care facilities and public hospitals revealed the following:
1. The profiles of respondents working in aged care facilities and public hospitals were similar in several respects:
The majority of respondents in both workplace types were women, aged between 46 and 65 years. Generally, members in both workplace types (aged care facilities and public hospitals) work in only one job, and were currently working full-time or part-time. Due to the anonymous nature of the survey, respondents could not directly be compared with non-respondents. Nevertheless, the sample characteristics are highly consistent with national statistics on the nursing and midwifery workforce in Australia (AIHW, 2012).
2. The profiles differed with respect to representation of ANMF membership groups:
Respondents from public hospitals reported working in all four ANMF member groups: registered nurses, enrolled nurses, midwives and personal carers. The majority of respondents working in public hospitals worked as registered nurses.
Respondents working in aged care facilities were registered nurses, enrolled nurses and personal carers. Half the respondents from aged care facilities worked as enrolled nurses.
3. OHS leading indicators were measured using the Organizational Performance Metric-Monash University (OPM-MU). Key findings for OHS leading indicators showed that
The patterns of scores on individual OPM-MU items was very similar across workplace types.
The item, those who act safely receive positive recognition, obtained the lowest average score from respondents in both workplace types.
The item workers and supervisors have the information they need to work safely received the highest average score.
Respondents working in aged care facilities tended to rate their workplaces higher on OHS leading indicators compared to those working in public hospitals. The average scores on the OPM-MU for the overall ANMF member survey was 27.4 (SD = 6.7). Overall, members of the ANMF rated their workplaces lower than those obtained from a recent study of managers in Victorian workplaces across different industries where the average OPM-MU score was 33.4 (SD = 4.2).

ISCRR Research Report# 045-0316-R10 Page 32 of 35
4. Seven risk factors were measured: workplace psychological safety, emotional labour, burnout, role overload, physical demands / ergonomic issues, violence in the workplace and bullying. Key findings for risk factors were
Respondents’ experience of emotional labour was higher in aged care facilities than in public hospitals.
For other risk factors, the pattern of scores is very similar for respondents working in aged care facilities and public hospitals.
Generally, role overload was rated very high indicating that this is the most prevalent risk factor in both aged care facilities and public hospitals.
5. Exposure to a range of hazards was assessed: fatigue, workplace stress, occupational violence and aggression, workplace bullying, patient handling, other manual handling, noise, blood-borne pathogens, other infectious agents, cytotoxic drugs, chemical agents, ionizing radiation (e.g., X-rays), non-ionizing radiation. Key findings for exposure to hazards were
An overall pattern of hazard exposure that is similar across workplace types.
A greater exposure, on average, to hazards such as blood pathogens and other infectious agents, radiation, chemical agents and cytotoxic drugs for respondents who work in public hospitals.
Slightly higher exposure, on average, to fatigue, stress as well as violence and aggression for respondents working in public hospitals.
Slightly higher levels of bullying and exposure to patient and manual handling issues, on average, for respondents who work in aged care facilities.
6. Key findings for occupational bullying and violence were
More than half of those working in aged care facilities and nearly half of those working in public hospitals reported that they had experienced at least one episode of workplace bullying in the past 12 months. Respondents working in aged care facilities reported slightly higher levels of bullying than respondents in public hospitals.
The predominant source of bullying experienced by respondents working in both workplace types was either from managers/supervisors or colleagues.
Nearly half of respondents in both workplace types indicated that they had experienced occupational violence or aggression at least a few times in the past twelve months.
In both workplace types, for those who had experienced violence and aggression at work in the past 12 months, most indicated that occupational violence and aggression came from patients.
While the general pattern for the source of violence and aggression is similar for both groups, the experience of violence and aggression from relatives of patients, patient visitors and the public was much higher in public hospitals.

ISCRR Research Report# 045-0316-R10 Page 33 of 35
7. Key findings for OHS outcomes were
Fifty-nine percent of respondents working in aged care facilities and 62 percent of respondents working in public hospitals reported that they had experienced an OHS incident in the past year.
The average number of OHS incidents experienced by members of both workplace types shows that near misses are the most prevalent type of incident experienced.
8. OHS incidents and risk of fatigue and workplace stress:
Fatigue is associated with OHS incidents. Respondents who reported being at higher risk of fatigue at work were more likely to experience OHS incidents, compared to the respondents who were at lower risk of fatigue at work. No differences were observed between workplace types.
Work-related stress is associated with OHS incidents. Respondents who reported being at higher risk of stress at work were more likely to experience OHS incidents, compared to the respondents who were at lower risk of stress at work.
This report is part of a larger study investigating leading indicators of OHS. Several other reports are available on this project and we recommend that this report be viewed as a companion piece to the other reports, which are available at http://ohsleadindicators.org and on the ISCRR website (www.iscrr.com.au). Overall, this research will contribute to understanding of OHS leading indicators and OHS performance in Australian workplaces.

ISCRR Research Report# 045-0316-R10 Page 34 of 35
6. References
AIHW. 2012. Nursing and midwifery workforce 2012. Canberra.
Cappelli, P., & Keller, J.R. (2013). Classifying work in the new economy. Academy of Management Review, 36(4), 575-596.
De Cieri, H., Shea, T., Sheehan, C., Donohue, R., & Cooper, B. 2015. Leading indicators of occupational health and safety: A report on a survey of Australian Nursing and Midwifery Federation (Victorian Branch) members. ISCRR report number: 0714-045-R5. Monash University: Caulfield East VIC Australia.
IWH [Institute for Work & Health]. (2011). Benchmarking organizational leading indicators for the prevention and management of injuries and illnesses: Final report. Institute for Work & Health: Toronto, Ontario.
IWH [Institute for Work & Health]. (2013). Developing leading indicators of work injury and illness. Institute for Work & Health: Toronto, Ontario.
Shaw, L. (2013). Are we ready to address the new expectations of work and workers in the transforming world of work? Work & Stress, 44, 3-9.
Shea, T., De Cieri, H., Donohue, R., Cooper, B., & Sheehan, C. (2016). Leading indicators of occupational health and safety: An employee and workplace level validation study. Safety Science, 85, 293-304.
WorkSafe Victoria. (2015). Residential care services (aged care). Retrieved February 1 2016, from http://www.worksafe.vic.gov.au/safety-and-prevention/your-industry/residential-care-services-aged-care

www.iscrr.com.au