Embed Size (px)
Citation preview
Occupational mismatch in Europe:
Understanding overeducation and
overskilling for policy making
Sara Flisi,
Valentina Goglio,
Elena Meroni,
Margarida Rodrigues,
Esperanza Vera-Toscano
2014
Report EUR 26618 EN
2
European Commission Joint Research Centre Institute for the Protection and Security of the Citizen Contact information Esperanza Vera-Toscano Address: Joint Research Centre, Via Enrico Fermi 2749, TP 361, 21027 Ispra (VA), Italy E-mail: [email protected] Tel.: +39 0332 78 5103 Fax: +39 0332 78 5733 http://ipsc.jrc.ec.europa.eu/ http://www.jrc.ec.europa.eu/ This publication is a Science and Policy Report by the Joint Research Centre of the European Commission. Legal Notice This publication is a Science and Policy Report by the Joint Research Centre, the European Commission’s in-house science service. It aims to provide evidence-based scientific support to the European policy-making process. The scientific output expressed does not imply a policy position of the European Commission. Neither the European Commission nor any person acting on behalf of the Commission is responsible for the use which might be made of this publication.
JRC89712 EUR 26618 EN
ISBN 978-92-79-37852-2
ISSN 1831-9424
doi: 10.2788/61733
Luxembourg: Publications Office of the European Union, 2014
© European Union, 2014
Reproduction is authorised provided the source is acknowledged.
3
Occupational mismatch in Europe: Understanding overeducation and overskilling for policy
making.
Sara Flisi, Valentina Goglio, Elena Meroni, Margarida Rodrigues, Esperanza Vera-Toscano
TABLE OF CONTENT
Executive Summary
1. Introduction
2. Literature review on the measurements of occupational mismatch
2.1. Education mismatch
2.2. Skill mismatch
2.3. Mixed approaches between education and skill mismatch
3. The Survey of Adult Skills (PIAAC)
3.1 Description of education and skill mismatch indicators used.
3.2 Principal Component Analysis
3.3 Principal Component Analysis by age groups
3.4 Principal Component Analysis by country
3.5 Conclusions from Principal Component Analysis
4. Further descriptive analysis on the different indicators of occupational mismatch at country
level
4.1 Kendall correlation
4.2 Cluster analysis
4.3 Further identifying different typologies of occupational mismatch
4.4 Conclusions from the identification of typologies of occupational mismatch
5. Individual level analysis of occupational mismatch
5.1 Socio-economic characteristics of occupationally mismatched individuals
5.2 Multinomial analysis
6. Comparison between the extent of mismatch in each country using CEDEFOP skill forecast by
educational level
7. Conclusion
Appendix A. Additional Tables
Appendix B. Principal Component Analysis
4
Executive Summary
In the last two to three decades, socio-economic changes such as increasing global competition, the skill-biased technological adjustment or the ageing of population have resulted in a labour market situation where it is difficult to find the right people for the right jobs. Skill mismatch has become a major concern as it proves to be pervasive, widespread and persistent in developed economies resulting on real costs on individuals, businesses and society as a whole, particularly when skills and/or qualifications are above those needed for the job (McGuiness, 2006; Cedefop, 2010; Leuven and Oosterbeek, 2011).1 The EU is not an exception. Thus, within this framework, governments and different social partners from EU countries jointly with the European Commission must work together to correct for any occupational mismatch so as to ensure an adequate supply of workers with the skills needed to sustain the economy’s long-term productive potential growth and social cohesion.
To successfully overcome this challenge, the first and major concern is to be able to measure individual occupational mismatch appropriately. Beyond educational attainment which, without doubt, is a more than reasonable candidate to proxy individuals’ competences, individual’s skills arise as a superior and more reliable approach to measure occupational mismatch given the current greater demand for more information-processing and high-level cognitive skills that do not necessarily need to be acquired through the educational system. The recently released Survey of Adult Skills (PIAAC) offers a unique opportunity for simultaneously measuring individuals’ competences and, as a result, occupational mismatch based both on education related variables (overeducation) and on the level of proficiency on these specific skills (overskilling).
This technical report presents EU-172 evidence on the extent of different, measures of overeducation and overskilling among working age population already used in the literature in an attempt to provide a comprehensive understanding of the relationship between overeducation and overskilling within the broader definition of occupational mismatch. It further investigates how countries differ or share common patterns in terms of amount and typology of mismatch, while investigating the socio-economic determinants responsible for different types of occupational mismatch considered. Lastly, at a very exploratory level, it provides average predicted probabilities for the different types of occupational mismatch identified using CEDEFOP skill forecast by educational level and occupation for 2020. Comparing these predicted values provides a method of measuring the overall impact on occupational mismatch of differences in age, gender or education level while controlling for other observed characteristics. Special attention is systematically paid to the role of educational systems and policies in the matter. The main findings are reported below.
Are educational and skill mismatches comparable approaches to occupational mismatch?
Education and skill mismatch do not seem to measure the same thing. The share of people who are simultaneously mismatched (both overeducated and overskilled) is pretty low (roughly around 15% of those employed for the EU-17). On the contrary, around 30% of those employed reported being
1 In this report, mismatch always refers to individuals whose skills and/or qualifications are above those needed for the job they
are in (i.e. overeducation and overskilling). While undereducation and underskilling are also forms of skill mismatch, they are out of the scope of this report. Further, notice that overeducation and overqualification are identical terms and used interchangeably in this report. 2 EU-17 includes Austria, Belgium (Flanders), Cyprus, Czech Republic, Denmark, Estonia, Finland, France, Germany, Ireland, Italy,
The Netherlands, Poland, Slovak Republic, Spain, Sweden and England/Northern Ireland (UK).
5
overeducated (but not overskilled), while roughly 17% are found to be overskilled (but not overeducated). These results suggest that it is better not to focus on one single dimension only, since most of the population is mismatched in either education or skills. Results on the high percentage of the population which claims to be overqualified (education mismatch) but not simultaneously overskilled (skill mismatch) suggest certain inefficiencies in the educational systems. Thus, we can interpret that systems do not seem to provide the type of education which enables people, with the adequate level of skills required by the labour market, to be perfectly matched, given their formal qualifications. Despite other reasons by which a perfect match in the labour market may be unlikely (i.e. reasonable constraints of regional mobility, time lags, or languages constraints among others), another possible explanation may be an “inappropriate” investment in human capital, since these overeducated workers have received extra-education that have proof not to be needed in the workplace.3 Alternatively, there is another interesting group composed of people who are over-skilled (skill mismatched) but not over-educated. This means that while they own the proper educational qualification, they also own more skills than what is required for the job they perform suggesting potential improvement on their relative labour market position. In summary, the different distribution of skill and education mismatch among European countries indicates that policies focusing on one dimension only risk to affect unevenly Member States. What are the socio-economic determinants of occupational mismatch across EU-17 countries? Females are more likely than males to be severely mismatched (i.e. simulatenously and systematically mismatched both by education and by skills) and over skilled (i.e. overskilled but not simultaneously overeducated) rather than matched in most countries; while no clear gender pattern exists for overeducation (i.e. being solely overeducated but not overskilled). Further, given the education based definition of occupation mismatch, not surprisingly, having a higher level of education implies higher probability of being over educated, solely over skilled, severely mismatched and mixed mismatched4 rather than matched. In general, occupational mismatch is larger among older individuals compared to 35-44 age-group category while for younger peers overskilling is more likely (no clear pattern for overeducation). Overeducation is a serious concern in Italy and Spain. Results indicate a very high predicted probability of being overeducated, but relatively low predicted probabilities of being over skilled, independently from the age or the educational level. This result somehow questions the ability of the education system to provide the necessary skills for the jobs currently available in the labor market. On the other side, Finland and The Netherland report much lower probabilities of begin overeducated, but higher probabilities of being over skilled, highlighting the high skills proficiency of the overall population in these countries.
3 While some level of mismatch is normal, the increase and persistency of this phenomenom is the reason for the current major
concern. 4 Mixed mismatched refers to individuals who are alternatively mismatched in one education dimension and in one skill
mismatch dimension.
6
Ceteris paribus, what could we expect in 2020 using CEDEFOP forecasts? For 2020, the share of matched individuals (i.e. those reporting simultaneously being matched both using the education and skill approaches) is likely to decrease in all countries but Sweden, Estonia and Denmark. In many cases, this decrease is partially counterbalanced by an increase in mixed mismatch, and most of all by an increase in the incidence of over education, which appears to be particularly relevant in Spain, the Netherlands, Italy and Cyprus. Two of the three countries for which a slight increase in the incidence of matched individuals is foreseen (Estonia and Denmark) show patterns similar to the UK, with a rising incidence of over skilled individuals and a decreasing share of over educated. For Sweden, a marginal increase in mixed and solely overskilled is envisaged. Interestingly, in this scenario in which employment by qualification and occupation follow the trends
foreseen by Cedefop, the share of severely mismatched individuals appears to be on the rise; this
increase seems to be particularly relevant for Spain, the Netherlands, Ireland and Cyprus.
7
1. Introduction
Skills development is extremely important for building the “virtuous circle” in which the quality of
education and training stimulates innovation, investment, technological change, enterprise
development, economic diversification and competitiveness needed for economies to accelerate the
creation of additional and more productive jobs. However, the rapid changes occurring in EU economy
and society such as increasing global competition, the skill-biased technological change or the ageing of
population make sometimes difficult to find the right people for the right jobs. Although some theories
support the idea of a temporary or individual phenomenon, empirical evidence shows that education
and skill mismatch in Europe is pervasive (Cedefop 2010), widespread and persistent, suggesting some
structural causation with the labour market structure (Brynin 2002).5 A better matching between the
potential of workers (qualifications and/or skills) and actual jobs is essential for combating
unemployment and boosting competitiveness of European countries. Further, a good job matching may
improve the welfare of individuals and, as already mentioned, bring positive effects on the productivity
and growth of the economy (for further information on the consequences of skill mismatch see among
others Brynin 2002; Ortiz 2010; Quintini 2011; or Dolado, et al., 2002). Within this framework,
governments and different social partners from EU countries jointly with the European Commission
must work together to correct for any occupational mismatch so as to ensure an adequate supply of
workers with the skills needed to sustain the economy’s long-term productive potential growth and
social cohesion.
To successfully overcome this challenge, the first and major concern is to be able to measure individual
occupational mismatch appropriately. Concerns about the mismatch between educational background
and the actual level of qualification required by the job are not a new topic, in particular among
economists. Richard Freeman already introduced in 1976 the notion of overeducation in his study on
American college graduates (Freeman 1976), and in 1981 a paper by Duncan and Hoffman (1981)
specifically addressed the problem of overeducation and its effects on wage, and presenting a measure
of education mismatch in Mincer earning equation (Oosterbeek 2000). Since then, a large body of
literature has been developed on this topic, both with a methodological perspective (how to measure
education mismatch) and with an attempt to disentangle the effects of overeducation at individual and
aggregate levels.6
5 A review made by Groot and Maassen van den Brink (2000) over 20 years of research on overeducation in Europe
and USA further suggests that the rate of overeducation has not changed significantly in the period between 1970s and 1990s. 6 The incidence of qualification shortages (individual’s undereducation) as well as their causes and consequences
has also been widely analysed (see for example, Kiker et al., 1997 or Sloane et al., 1999), however, this approach will not be empirically addressed in this technical report.
8
However, while educational attainment is without doubt a reasonable candidate to proxy individuals’
competences, this does not necessarily imply that the individual possesses the skills required for the job.
As argued by OECD, ‘more education does not automatically translate into better skills’. In effect, new
job requirements are rapidly emerging in the labour market with a greater demand for more
information-processing and high-level cognitive skills, while the skill gaps between different educational
level (in particular between tertiary graduates and upper secondary graduates) vary considerably among
countries but also within countries (among individuals with similar qualifications). This might be due to
the loss of skills through time as an effect of ageing, or might be the result of change in the type and
quality of education provided in the same country (OECD 2013). This is the reason why the
measurement of skill mismatch is considered a superior and more reliable approach to the actual
abilities/competencies owned by the individual in a specific point in time.
That said, the recently released Survey of Adult Skills (PIAAC) was designed to provide insights into the
availability of some key skills. In particular, it directly measures proficiency in several information-
processing skills – namely literacy, numeracy and problem solving in technology-rich environments, as
well as traditional educational attainment variables. Thus, PIAAC data offers a unique opportunity for
simultaneously measuring, at individual level, mismatch based both on education related variables
(overeducation) and on the level of proficiency on these specific skills (overskilling).
The purposes and contributions of this technical report are then four. First, using PIAAC data, we
present EU-17 evidence on the extent of different measures of overeducation and overskilling among
working age population in an attempt to provide a comprehensive understanding of the relationship
between education and skill mismatch. Previous studies have mainly focused on (over) education
mismatch. Second, we investigate how countries differ or share common patterns in terms of amount
and typology of mismatch. Third, we investigate the socio-economic determinants responsible for
different types of occupational mismatch considered, exploring differences between the different
typologies of mismatch with a special focus on the role of educational systems and policies in the
matter. Lastly, we provide average predicted probabilities for the different types of occupational
mismatch identified using CEDEFOP skill forecast by educational level and occupation7 for 2020.
Comparing these predicted values provides a method of measuring the overall impact on occupational
mismatch of differences in age, gender or education level while controlling for other observed
characteristics.
Thus, this technical report is organised as follows. Chapter 2 provides a literature review on education
and skill mismatch. Then, Chapters 3 and 4 use PIAAC data to build up a number of indicators of
occupational mismatch using education and skill related variables. Quantitative analysis is further
undertaken, at EU-17 and country level, to shed light on the different types of mismatch captured by the
7 See http://www.cedefop.europa.eu/EN/Files/5526_en.pdf and http://www.cedefop.europa.eu/EN/about-
cedefop/projects/forecasting-skill-demand-and-supply/skills-forecasts.aspx

9
different indicators provided. Different typologies of occupational mismatch are then identified.
Chapter 5 discusses, at individual level, on some of the socio-economic determinants of occupational
mismatch (by type of mismatch identified earlier on). Chapter 6 presents a simulation exercise on an
alternative scenario based on Cedefop employment forecasts for 2020. Conclusions are presented in
Chapter 7.
10
Literature review on the approaches to measure occupational mismatch
As it has been widely outlined in the literature, different ways have been used to approach the issue
of occupational mismatch measurement (Groot and Maasen van den Brink, 2000; Hartog, 2000;
Verhaest and Omey, 2006; CEDEFOP, 2010; Quintini, 2011 or Desjardins and Rubenson, 2011). However,
while research has almost exclusively focused on education mismatch, in the last few decades we have
assisted a significant move towards greater focus on skill mismatch (e.g. Mavromaras, McGuinness,
O’Leary, Sloane and Wei, 2010). Education and skill mismatch, although related, are not the same
concept since they lead to different types of analysis and policy implications (Desjardins and Rubenson
2011).
This Chapter provides a summary of the major domains to the measurement of both education and skill
mismatch, highlighting their related pros and cons. Measures related to education mismatch are
discussed in Section 2.1., while the review of measures of skill mismatch is reported in Section 2.2.
Overall, for each of the domains the main divide is between the objective and subjective approaches
(Groot and Maassen van den Brink 2000), but in some cases also empirical methods are provided
(Cedefop 2010, OECD 2013). Briefly, the objective approach relies on objective measures, such as the
actual level of education acquired/the actual skill level in comparison to the level of education/skills of
peers in the same occupation; the subjective approach relies on direct questions made to the workers
about their perception of mismatch. Further, it is very important to clarify that education mismatch is
often used as a synonym of overeducation, but it is not entirely correct. Education mismatch may take
place upward or downward; when the educational attainment of the worker exceeds the educational
qualification required for the job, we are talking of overeducation (upward). Yet, undereducation
(occurring when the educational attainment of the workers is lower than the educational qualification
required by the job, i.e. downward) is also a case of education mismatch. The same reasoning applies to
skill mismatch. Thus, overskilling takes place when a worker’s skills exceed those required by his/her job
while underskilling or skill’s deficit is the case in which the worker has inadequate skills for his/her job
because of aging, skill’s obsolescence and so on.
In brief, as shown in Table 1 below, both education and skill mismatch can be summarized in three
categories.
Table 1. Categories of occupation mismatch
Education Skills
Overeducation (over-qualification) Overskilled (or skill surplus)
Required education (required-qualification, matched) Required skills (matched)
Undereducation (under-qualification) Underskilled (skill deficit)
Note: our elaboration
11
Nonetheless, in this technical report the focus will be on the side of upward mismatch only. The
rationale for this choice is that “over” mismatch (whatever qualification or skill related) is the condition
leading to the most negative consequences, compared to downward mismatch: as shown below,
literature maintains that over-qualification and over-skilling lead to lower levels of productivity, lower
job satisfaction and psychological stress, besides being on aggregate level a waste in terms of
investment made in education. On the other side, when downward mismatch occurs (meaning that the
worker holds a lower educational qualification than the one required for the job) the worker, in a sense,
has something to “gain” in terms of higher wage premium and higher status compared to what he could
have achieved for his/her educational qualification.
Literature shows that at individual level overeducation and overskilling are associated to a wage
premium but also to a penalty relative to qualification. Thus, overqualified individuals receive higher
rewards for their job (compared to those matched), but it is associated to lower returns to education
(do not reach the wage level typically associated to their educational qualification) (Brynin 2002).
Besides, overeducated workers may suffer from lower productivity, lower job satisfaction and
psychological strain (compared to matched workers) (Tsang and Levin 1985, Cedefop 2010, Ortiz 2010).
Those negative consequences are then reflected on aggregate level. The welfare of employees should be
of concern for the employer as well, since the loss of productivity on individual level may hamper the
aggregate output of companies. Further, it is associated to an increase in on-the-job search and turnover
(Quintini 2011). Lastly, it also represents a concern for governments. Given the large amount of
resources spent in education, they should be concerned about the returns of education (Tsang and Levin
1985), additionally, the loss of productivity may turn up to be a serious issue at country level (Dolado,
García-Serrano, and Jimeno 2002; Ortiz 2010).
2.1 Education mismatch
Education mismatch can be measured in terms of: years of education, educational level attained
(ISCED level) or alternatively, by self-reported measures of mismatch (by direct questions to workers).
The existing approaches can be collected under three already established groups agreed in the
literature, namely: 1) normative/job analysis (objective); 2) Statistical/realized matched (objective); and
3) self-declared/self-reported/self-assessment (subjective). Additionally, mixed methods have also been
developed.
2.1.1 Normative / Job Analysis (JA)
The normative approach uses an a priori supposed equivalence between education and
occupations. Analysts subjectively determine the required level of education on the basis of
occupational descriptions such as those provided in the US Dictionary of Occupational Titles (DOT).
12
Then the worker’s level of education is compared to the one he should have according to these
dictionaries and each worked is categorized as overeducated, undereducated or matched (see for
example Rumberger, 1987; McGoldrik and Robst, 1996).
This approach is conceptually superior to the Realized Match (RM) and Self-declared (DSA/ISA)
approaches explained below since it relies on the evaluation made by trained job analysts which are
surely the most appropriate players for grading jobs. As argued by Hartog (2000), they have full freedom
to choose the research design. Thus, they could focus on technology, and should even be able to
indicate scope for substitutions, between different educations or between schooling and on-the-job
training or experience. Moreover, since the approach is based on the assumption that all jobs with the
same title have the same educational requirement and that this is true in all countries using the same
occupational classification, a cross country comparison is easily feasible. Nevertheless, the assumption
of homogeneity among countries may not hold true in case different occupational classifications are
used and it is also very costly to implement.
2.1.2 Statistical / Realized matched (RM)
In this approach, an employee is classified as over or under- qualified if he/she sets out by more
than an ad-hoc value from the mean (Verdugo and Verdugo, 1989; Bauer, 2002) or mode (Kiker et al.,
1997; and Mendes de Oliveira et al., 2000) of the qualification level of his/her occupation group. The ad-
hoc value generally refers to one standard deviation although two standard deviations is also used for
cases of severe over or under- qualification.
This approach shows some restrictions that can be seen advantages operationally speaking and that we
should be aware of. The main limitations are that as in the previous JA approach, it requires the
assumption that all jobs with the same occupational title have identical educational requirements, which
may not always be the case in reality. In addition, it is sensitive to cohort effects, especially in case of a
rapid change in the educational level required for a given occupation: with younger cohorts entering the
labour market with usually higher qualification than the existing work force, a simple comparison of the
individual level of education to the mode/mean level of education of the entire work force within a
given occupation, without age distinction, can lead to wrong conclusion about the mismatched
situation. Therefore this measure combines current and past qualification requirements as it reflects
the qualifications of people who were hired at different times. In order to solve this issue, some scholars
have complemented the RM method implementing it by cohort rather than considering the entire
population as a whole (Elias and Purcell, 2004). Another variation of this method is proposed by Quinn
and Rubb (2006), who allow required education to vary with year of birth and survey year. Thus the
required education for a given occupation is then equal to the coefficient on the relevant occupation
dummy from a regression of actual education on occupation dummies, birth year and survey year. Yet,
13
another drawback is that it fails to allow more than one educational level to be appropriate for
particular occupations, especially if they are broadly defined.
In line with abovementioned limitation, the major critique is that the required educational level within
an occupation is an outcome of supply and demand forces, and thus it is endogenous. Hence, if this
information is used, it should be interpreted as the market result in an assignment model, not as
something like a shift indicator of the demand curve. In summary, it contains observations on the
equilibrium realized by the interplay of supply and demand. As a measure of the demand side it is
inadequate.
Lastly, from a more methodological point of view, the choice of one standard deviation is completely
arbitrary and results depend on the level of aggregation necessary to obtain a reliable distribution of
education. Equally, regarding the choice of the mode or the mean, the former one is usually preferred,
since using the mode as reference point has the advantage of being less sensitive to outliers and
technological change, but it also relies on some degree of arbitrariness.
2.1.3 Self-Declared /Self-Reported/Self-Assessment (DSA and ISA)
This method relies on information provided by the worker and consists of using his/her opinion on
whether the job matches or is related to his/her level of education or skills, either through direct
questions (DSA) or by asking individuals about the requirements of their current job (ISA).
A distinction made in the literature is between the educational level required to get the job and the one
required to do the job, alternatively, some authors used different expressions (e.g. “appropriate”
education level, Allen and van der Velden, 2001) to identify these separate concepts. It is also possible
to find distinctions based on further dimensions, e.g. between formal and informal schooling, or to the
concept of best preparation vs. preparation needed to perform (Leuven and Oosterbeek, 2011).
Key references in the literature for the Direct Self-Assessment (DSA) approach include Groeneveld
(1997), Chevalier (2003), or Verhaest and Omey (2006). Alternatively, for the Indirect Self-Assessment
(ISA) we find Duncan and Hoffman (1981), Hartog and Oosterbeek (1988), Sicherman (1991), Sloane et
al. (1999), Battu et al. (2000), Allen and van der Velden (2001), Dorn and Sousa-Poza (2005), Green and
Zhu (2010), Frei and Sousa-Poza (2011) or Baert et al. (2013) among others.
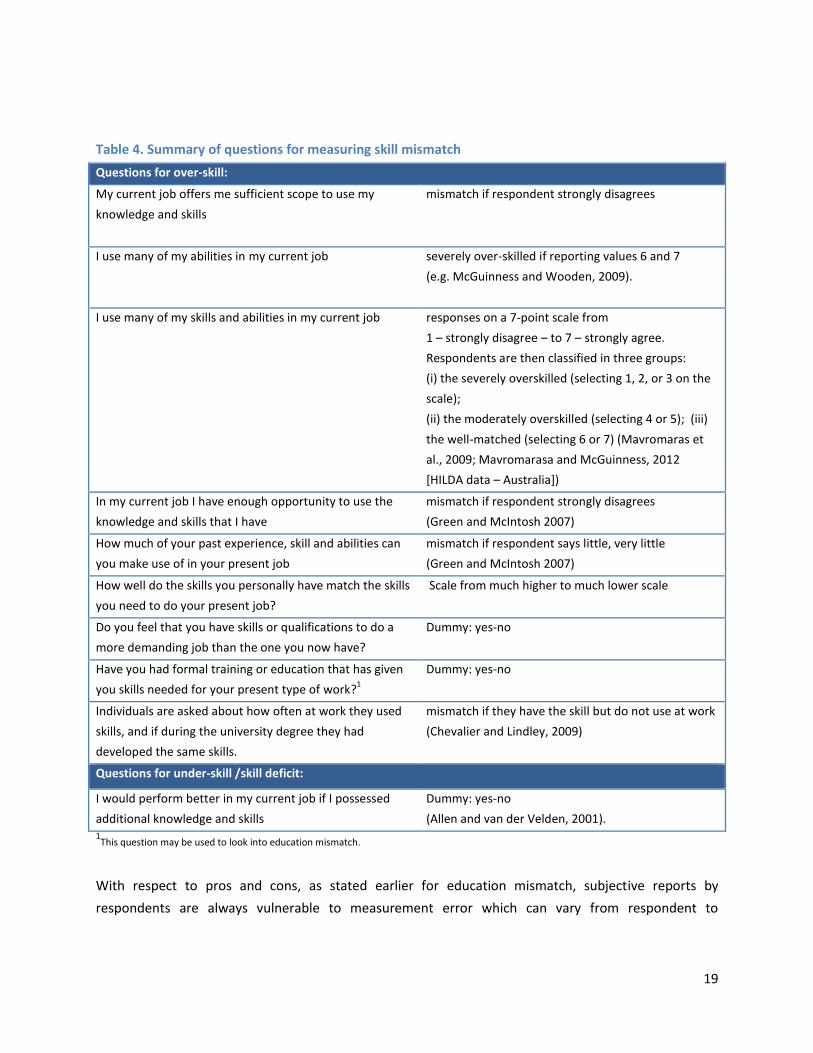
Table 2 below provides a number of questions which are most often used in surveys for observing
subjective education mismatch, according to different approaches:
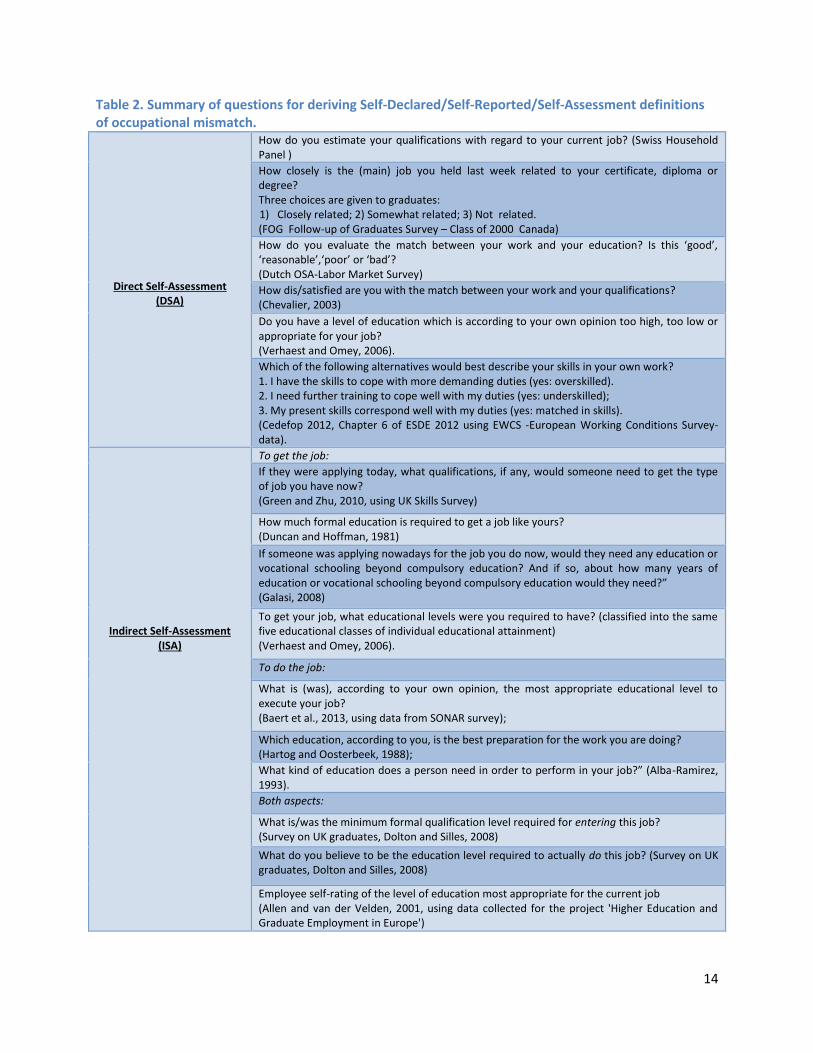
14
Table 2. Summary of questions for deriving Self-Declared/Self-Reported/Self-Assessment definitions of occupational mismatch.
Direct Self-Assessment (DSA)
How do you estimate your qualifications with regard to your current job? (Swiss Household Panel )
How closely is the (main) job you held last week related to your certificate, diploma or degree? Three choices are given to graduates: 1) Closely related; 2) Somewhat related; 3) Not related. (FOG Follow-up of Graduates Survey – Class of 2000 Canada)
How do you evaluate the match between your work and your education? Is this ‘good’, ‘reasonable’,‘poor’ or ‘bad’? (Dutch OSA-Labor Market Survey)
How dis/satisfied are you with the match between your work and your qualifications? (Chevalier, 2003)
Do you have a level of education which is according to your own opinion too high, too low or appropriate for your job? (Verhaest and Omey, 2006).
Which of the following alternatives would best describe your skills in your own work? 1. I have the skills to cope with more demanding duties (yes: overskilled). 2. I need further training to cope well with my duties (yes: underskilled); 3. My present skills correspond well with my duties (yes: matched in skills). (Cedefop 2012, Chapter 6 of ESDE 2012 using EWCS -European Working Conditions Survey- data).
Indirect Self-Assessment (ISA)
To get the job:
If they were applying today, what qualifications, if any, would someone need to get the type of job you have now? (Green and Zhu, 2010, using UK Skills Survey)
How much formal education is required to get a job like yours? (Duncan and Hoffman, 1981)
If someone was applying nowadays for the job you do now, would they need any education or vocational schooling beyond compulsory education? And if so, about how many years of education or vocational schooling beyond compulsory education would they need?” (Galasi, 2008)
To get your job, what educational levels were you required to have? (classified into the same five educational classes of individual educational attainment) (Verhaest and Omey, 2006).
To do the job:
What is (was), according to your own opinion, the most appropriate educational level to execute your job? (Baert et al., 2013, using data from SONAR survey);
Which education, according to you, is the best preparation for the work you are doing? (Hartog and Oosterbeek, 1988);
What kind of education does a person need in order to perform in your job?” (Alba-Ramirez, 1993).
Both aspects:
What is/was the minimum formal qualification level required for entering this job? (Survey on UK graduates, Dolton and Silles, 2008)
What do you believe to be the education level required to actually do this job? (Survey on UK graduates, Dolton and Silles, 2008)
Employee self-rating of the level of education most appropriate for the current job (Allen and van der Velden, 2001, using data collected for the project 'Higher Education and Graduate Employment in Europe')
15
As for JA and RM approaches, some limitations also exist for the DSA/ISA approach. Thus, subjective
reports by respondents are always vulnerable to measurement errors which can vary from respondent
to respondent. For example, individuals may easily overstate the requirements of their job, to inflate the
status of their position. Still, they might also be poorly informed about the performance of people with
different levels of education, and there is no information on the required level and on how much the
worker is over- or underqualified. Further, when responding workers may simply reproduce actual hiring
standards. This may cause problems if schooling levels in the labour force increase over time, and
employers adjust hiring standards while the jobs themselves have not changed.
The wording of the questions asked to workers often tries to reflect the different dimensions one wants
to take into account. For example, as maintained by Allen and van der Velden (2001), 'appropriate level'
might be preferable to the alternative of 'required level', since the latter measure may partly measure
formal selection requirements, whereas the former is more likely to refer to actual job content. Some
questions try to explicitly distinguish between the two aspects (getting vs. doing the job).
On the other side, there are advantages associated to this approach, since the assessment deals
precisely with the respondent’s job, not with any kind of aggregate measure. Subjective measures of the
incidence of over-qualification are typically found to exceed those obtained via objective (e.g.
dictionary-based or empirical method) measures (Groot and van den Brink, 2000). Nevertheless, the
various approaches to estimating the incidence and returns to over-qualification tend to yield broadly
consistent conclusions (McGuinness, 2006).
2.1.4 Mixed/Alternative methods
It is likely that a wise combination of above mentioned methods, depending on the availability of
data, results to be the best solution. There are several proposals coming from the literature. Thus,
Chevalier (2003) and Chevalier and Lindley (2009) mixed the normative (JA) with the self-reported
approach (DSA/ISA) to obtain a more refined measure of overeducation. The authors use the
“normative” method to determine whether an individual is over-qualified. Then, they use a subjective
question on the “satisfaction regarding the match between education and job” to divide the over-
qualified between: apparently over-qualified (the normatively overqualified satisfied with their match)
and genuinely over-qualified (the normatively over-qualified unsatisfied with their match).
Alternatively, Ghignoni (2001) proposed a measure of overeducation which takes into account also job
experience. The method relies on the idea of “frontier of competences” that links the concept of
overeducation to a minimum level of education required for entering into a particular occupation which
should be lower than workers’ experience. The “frontier function” gives the minimum quantity of the
two inputs (education and experience) needed to produce a given output.
16
Nauze-Fichet and Tomasini (2002) measure over-qualification in France by relating it to wages. A person
is classified as over-qualified if two-thirds of the individuals at the level of education immediately lower
are better paid. Indeed, all else being equal, education should enhance the productivity of work and
thus raise the expected wage rate. As a result, individuals who are paid significantly less than the wage
corresponding to their level of education are considered to be over-qualified.
Lainé and Okba (2005) use regression techniques to estimate the probability that a French youth leaving
the education system will hold a low-skilled job –defined using the normative method – based on the
level and field of the person’s highest qualification and the place of residence. Over-qualified youth are
those employed in low-skilled jobs when the statistical norm (in this case, estimated from a logistic
model) would not predict such employment.
Lastly, Büchel (2001) combines the outcomes of an Indirect Self-Assessment measure with information
on occupational status to determine whether someone is actually overeducated while Groenveld and
Hartog (2004) use the job description made by the personnel department of the organization at the
moment of hiring as a measure of required schooling. They combine subjective and job analysis
approaches.
2.2 Skill mismatch
As for education mismatch, the level of mismatch between skills owned by a worker and actual
skills required for his/her job has been measured through different approaches. The lack of appropriate
data has prevented from larger empirical evidence up to date. Nevertheless, the approaches resemble
those used for measuring education mismatch, namely: objective, subjective and mixed methods.
2.2.1 Statistical/Realized match approach (RMSKILLS)
The methodologies adopted in the literature that follow the statistical/realized match approach for
skills mismatch can be broadly distinguished in two categories. The first one includes techniques
resembling those mentioned for the RM approach for education mismatch; in such methodologies, for
each occupation the distribution of skill levels is calculated, and workers who depart from the mean or
mode by more than some ad-hoc value – generally, one or two standard deviations – are classified as
over or under-skilled. Alternatively, in a second approach, skill match and mismatch is determined on
the basis of reported engagement in a given skill-related tasks at work on one hand, and direct
measures of the skills of workers on the other (Krahn and Lowe, 1998; and Desjardins and Rubenson,
2011).
17
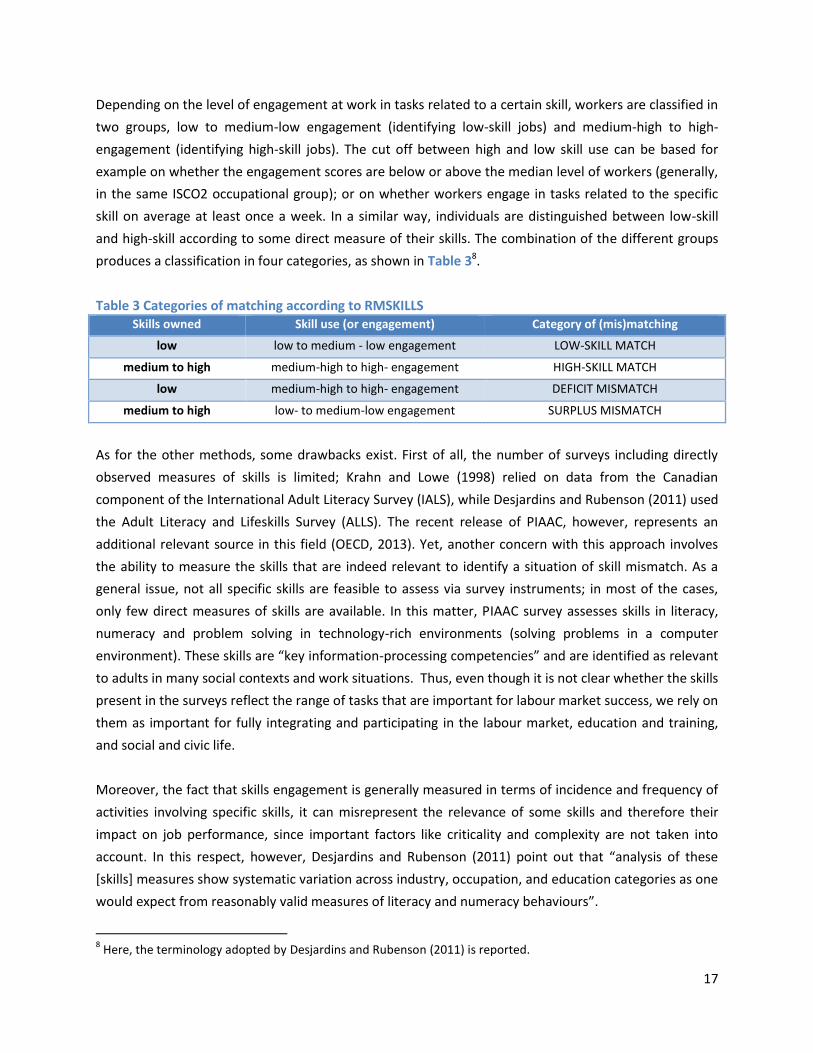
Depending on the level of engagement at work in tasks related to a certain skill, workers are classified in
two groups, low to medium-low engagement (identifying low-skill jobs) and medium-high to high-
engagement (identifying high-skill jobs). The cut off between high and low skill use can be based for
example on whether the engagement scores are below or above the median level of workers (generally,
in the same ISCO2 occupational group); or on whether workers engage in tasks related to the specific
skill on average at least once a week. In a similar way, individuals are distinguished between low-skill
and high-skill according to some direct measure of their skills. The combination of the different groups
produces a classification in four categories, as shown in Table 38.
Table 3 Categories of matching according to RMSKILLS Skills owned Skill use (or engagement) Category of (mis)matching
low low to medium - low engagement LOW-SKILL MATCH
medium to high medium-high to high- engagement HIGH-SKILL MATCH
low medium-high to high- engagement DEFICIT MISMATCH
medium to high low- to medium-low engagement SURPLUS MISMATCH
As for the other methods, some drawbacks exist. First of all, the number of surveys including directly
observed measures of skills is limited; Krahn and Lowe (1998) relied on data from the Canadian
component of the International Adult Literacy Survey (IALS), while Desjardins and Rubenson (2011) used
the Adult Literacy and Lifeskills Survey (ALLS). The recent release of PIAAC, however, represents an
additional relevant source in this field (OECD, 2013). Yet, another concern with this approach involves
the ability to measure the skills that are indeed relevant to identify a situation of skill mismatch. As a
general issue, not all specific skills are feasible to assess via survey instruments; in most of the cases,
only few direct measures of skills are available. In this matter, PIAAC survey assesses skills in literacy,
numeracy and problem solving in technology-rich environments (solving problems in a computer
environment). These skills are “key information-processing competencies” and are identified as relevant
to adults in many social contexts and work situations. Thus, even though it is not clear whether the skills
present in the surveys reflect the range of tasks that are important for labour market success, we rely on
them as important for fully integrating and participating in the labour market, education and training,
and social and civic life.
Moreover, the fact that skills engagement is generally measured in terms of incidence and frequency of
activities involving specific skills, it can misrepresent the relevance of some skills and therefore their
impact on job performance, since important factors like criticality and complexity are not taken into
account. In this respect, however, Desjardins and Rubenson (2011) point out that “analysis of these
[skills] measures show systematic variation across industry, occupation, and education categories as one
would expect from reasonably valid measures of literacy and numeracy behaviours”.
8 Here, the terminology adopted by Desjardins and Rubenson (2011) is reported.
18
Finally, part of the literature (see e.g. OECD, 2013) criticizes one the main assumptions of these
methodologies, i.e. the use of skills engagement as a proxy for skill requirements for a certain job, on
the basis that frequency of skill use is a different concept than required level. Allen et al. (2013),
however, maintain that while this is strictly speaking true, skill mismatch measures based on this
approach can nevertheless produce relevant results; according to the authors, “there is in fact strong
empirical evidence that skill use is quite strongly related to required skill level. Additionally, skill use ‐ and
skill mismatches derived by using skill use in combination with skill level – show clear and plausible
relationships with labour market outcomes. Finally, […] efficiency considerations dictate that the
greatest productivity is achieved when the people with the highest level of a given skill in the population
are the ones who are using that skill the most often, and that the least skilled are those that use that skill
the least often”.
2.2.2 Self-Declared /Self-Reported/Self-Assessment (SASKILLS)
As for evaluating education mismatch, for skill mismatch it is also possible to refer to subjective
measures by asking directly to workers about the extent of use of their skills at work.
The most used databases including subjective measures of skill mismatch are9:
- Higher Education and Graduate Employment in Europe Database (Europe and Japan);
- Household, Income and Labour Dynamics in Australia (HILDA);
- Skill Survey 2001 (Great Britain);
- British Workplace Employment Relations Survey (WERS);
- European Community Household Panel 1994-1999;
- Adult Literacy and Lifeskills Survey (ALLS);
- REFLEX;
- European Social Survey (ESS).
Key references in literature for this approach include Halaby (1994), Allen and van der Velden (2001)
Mavromara, McGuinness and Wooden (2007, 2009), Green and McIntosh (2007) or Cabral Viera (2005)
among others. Table 4 below summarizes the most frequently asked questions in surveys for deriving
skill mismatch based on Self-Declared assessment of skill use (non-exhaustive list).
9 Notice that those survey do not all contain a measure of skills, but simply a question on the perception of the
individuals about the use of their skills at work (whether matched or mismatch).
19
Table 4. Summary of questions for measuring skill mismatch
Questions for over-skill:
My current job offers me sufficient scope to use my
knowledge and skills
mismatch if respondent strongly disagrees
I use many of my abilities in my current job
severely over-skilled if reporting values 6 and 7
(e.g. McGuinness and Wooden, 2009).
I use many of my skills and abilities in my current job responses on a 7-point scale from
1 – strongly disagree – to 7 – strongly agree.
Respondents are then classified in three groups:
(i) the severely overskilled (selecting 1, 2, or 3 on the
scale);
(ii) the moderately overskilled (selecting 4 or 5); (iii)
the well-matched (selecting 6 or 7) (Mavromaras et
al., 2009; Mavromarasa and McGuinness, 2012
[HILDA data – Australia])
In my current job I have enough opportunity to use the
knowledge and skills that I have
mismatch if respondent strongly disagrees
(Green and McIntosh 2007)
How much of your past experience, skill and abilities can
you make use of in your present job
mismatch if respondent says little, very little
(Green and McIntosh 2007)
How well do the skills you personally have match the skills
you need to do your present job?
Scale from much higher to much lower scale
Do you feel that you have skills or qualifications to do a
more demanding job than the one you now have?
Dummy: yes-no
Have you had formal training or education that has given
you skills needed for your present type of work?1
Dummy: yes-no
Individuals are asked about how often at work they used
skills, and if during the university degree they had
developed the same skills.
mismatch if they have the skill but do not use at work
(Chevalier and Lindley, 2009)
Questions for under-skill /skill deficit:
I would perform better in my current job if I possessed
additional knowledge and skills
Dummy: yes-no
(Allen and van der Velden, 2001). 1This question may be used to look into education mismatch.
With respect to pros and cons, as stated earlier for education mismatch, subjective reports by
respondents are always vulnerable to measurement error which can vary from respondent to
20
respondent. On the other hand, they have the advantage of being easily observable, specific to the job
of the respondent and up-to-date. Thus most of the points raised in section 2.1.3 hold true here as well.
2.2.3 Mixed / Alternative Methods
The newly released PIAAC survey includes two questions addressing specifically over-skilling and
skill deficit, asking to workers whether:
- they feel they “have the skills to cope with more demanding duties than those they are
required to perform in their current job” (overskill) [F_Q07a]
- they feel they “need further training in order to cope well with their present duties” (skill
deficit) [F_Q07b]
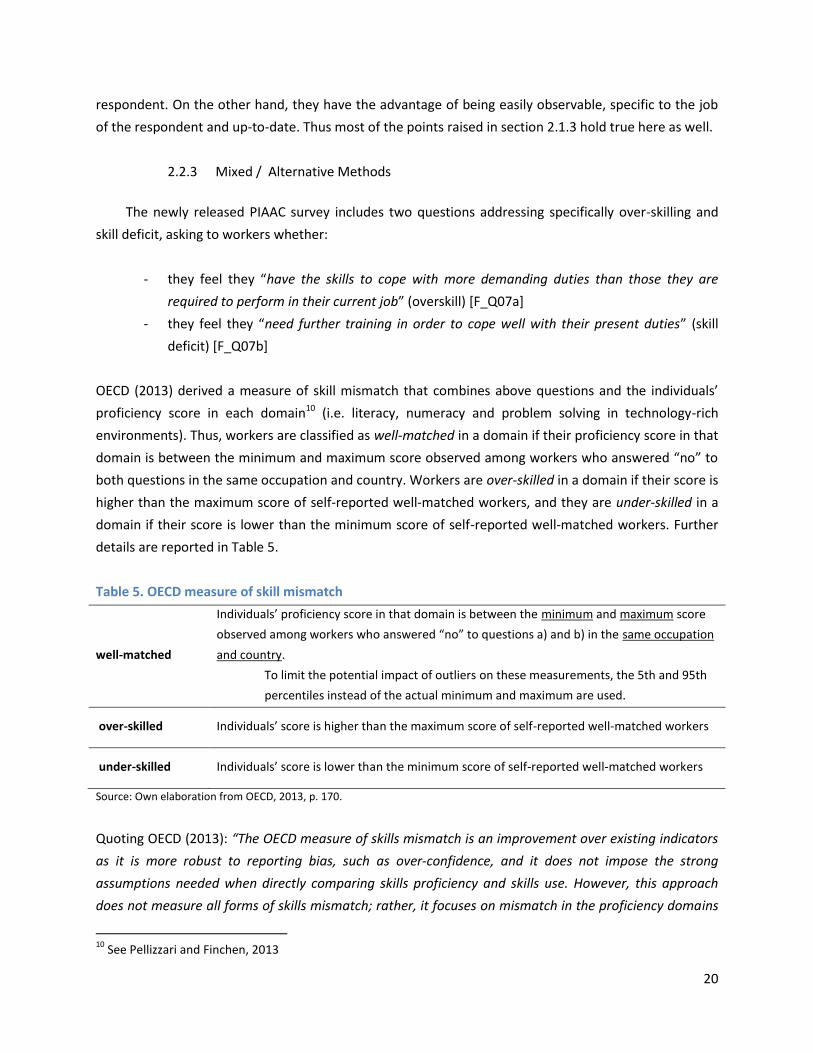
OECD (2013) derived a measure of skill mismatch that combines above questions and the individuals’
proficiency score in each domain10 (i.e. literacy, numeracy and problem solving in technology-rich
environments). Thus, workers are classified as well-matched in a domain if their proficiency score in that
domain is between the minimum and maximum score observed among workers who answered “no” to
both questions in the same occupation and country. Workers are over-skilled in a domain if their score is
higher than the maximum score of self-reported well-matched workers, and they are under-skilled in a
domain if their score is lower than the minimum score of self-reported well-matched workers. Further
details are reported in Table 5.
Table 5. OECD measure of skill mismatch
well-matched
Individuals’ proficiency score in that domain is between the minimum and maximum score
observed among workers who answered “no” to questions a) and b) in the same occupation
and country.
To limit the potential impact of outliers on these measurements, the 5th and 95th
percentiles instead of the actual minimum and maximum are used.
over-skilled Individuals’ score is higher than the maximum score of self-reported well-matched workers
under-skilled Individuals’ score is lower than the minimum score of self-reported well-matched workers
Source: Own elaboration from OECD, 2013, p. 170.
Quoting OECD (2013): “The OECD measure of skills mismatch is an improvement over existing indicators
as it is more robust to reporting bias, such as over-confidence, and it does not impose the strong
assumptions needed when directly comparing skills proficiency and skills use. However, this approach
does not measure all forms of skills mismatch; rather, it focuses on mismatch in the proficiency domains
10
See Pellizzari and Finchen, 2013
21
assessed by the Survey of Adult Skills, leaving out mismatch related to job-specific skills or that involving
more generic skills.”
2.3. Mixed approaches between education and skill mismatch
In this section we briefly present some methods for evaluating occupational mismatch that include
both an education and a skill approach.
Green and Zhu (2010) build on Chevalier’s (2003) work and distinguished between types of
overeducation, according to whether the overeducation is associated with a perceived underutilization
of skill (or not). However, they agree that it is preferable, where the data allow it, to base the
decomposition on explicit instruments identifying skill underutilization, rather than indirectly via a
satisfaction measure.
In their work Green and Zhu provide two definitions of mismatch, related to education and skills. Thus,
in order to establish job qualification requirements, respondents were asked: ‘If they were applying
today, what qualifications, if any, would someone need to get the type of job you have now?’ From the
range of options given, the highest qualification required was derived, classified into four
academic/NVQ-equivalent levels11. An individual is considered overqualified (underqualified) if his/her
own qualifications (Q) exceed (are less than) his/her job’s required qualifications (RQ). In synthesis, a
dummy variable can be drawn as follows:
Overqualification dummy (OQ): OQ = 1 if RQi < Qi;
OQ = 0 if RQi>=Qi
where index i takes on values 0 to 4.
As for skill mismatch, the level and intensity of skill utilization is measured through the question: ‘How
much of your past experience, skill and abilities can you make use of in your present job?’ Options given
for the answer are ranked on a 4 points scale: very little/a little/quite a lot/almost all.
Those who answered in either the first two scales (very little/a little) are considered to be underutilizing
their skills. As before, a dummy variable is drawn as follows:
Overskilled dummy (OS): OS =1 if reply was ‘‘very little/a little’’;
OS =0 if reply was ‘‘quite a lot/almost all’’.
11
NVQ stands for National Vocational Qualifications
22
Then, the two definitions can be combined to create four types of matching/mismatching: real
overqualification is extremely negative condition in which the individual both has an educational
qualification which exceed the qualification required and uses very little or little his/her skills in the
current job. On the other end there are matched individuals, those who hold the required educational
degree for the job they have and use quite a lot or almost all the skills he/she own in the current job.
Half-way we can find individuals who are matched in terms of skills but mismatched in terms of
educational qualification (formal overqualification) and individuals who are matched in terms of degree
but their job do not allow them to exploit completely their own skills (qualification matched and skills
underutilized). Table 6 provides greater details on the classification.
Table 6. Combination of education and skill mismatch
OS=0
(skills fully utilized)
OS=1
(skills underutilized)
OQ=0 (in graduate jobs) Matched Qualification matched and skills
underutilized
OQ=1 (in non-graduate jobs) Formal overqualification Real overqualification
Source: Own elaboration from Green and Zhu (2010)
The first comprehensive study on the interaction between qualification and skill mismatch was
conducted by Allen and van der Velden (2011), however, together with Mavromaras et al. (2009), they
found weak correlation between overeducation and overskilling.
A summary of approaches and some of the authors that have provided empirical evidence on them is
reported in Table A1 of the Appendix section.
23
The Survey of Adult Skills (PIAAC)
The Programme for the International Assessment of Adult Competencies is an international survey
that measures key cognitive and workplace skills needed for individuals to participate in society and for
economies to prosper. Using household’s interviews, the survey assesses the skills of about 150,000
working age adults (16-65) surveyed in 24 countries. The survey is the outcome of collaboration among
the participating countries, the OECD secretariat, the European Commission and an international
consortium led by Educational Testing Service (ETS) (OECD, 2013).
As discussed earlier, PIAAC assessed skills in literacy, numeracy and problem solving in technology-rich
environments (solving problems in a computer environment). The proficiency that respondents showed
in the three indicated skills is measured on a scale from 0 to 500 points, which is divided into skills levels
(from below 1 to 5 for literacy and numeracy; from below 1 to 3 for problem solving). Contextual
questionnaires collected a broad range of information, including not only educational attainment but
also family background, linguistic background, outcome variables and how skills are used at work and in
other contexts, such as the home and the community.
Table 7 below reports the number of individuals participating in each EU country.
Table 7. Number of individuals participating in the survey by country
Country Frequency Country Frequency
Austria (AT) 5130 Ireland (IE) 5983
Belgium (BE Fl) 5463 Italy (IT) 4621
Cyprus (CY) 5053 The Netherlands (NL) 5170
Czech Republic (CZ) 6102 Poland (PL) 9366
Denmark (DK) 7328 Slovak Republic (SK) 5723
Estonia (EE) 7632 Spain (ES) 6055
Finland (FI) 5464 Sweden (SE) 4469
France (FR) 6993 England/Northern Ireland (UK) 8892
Germany (DE) 5465 Total (EU 17) 104909
Source: Own elaboration
In this report we will present results for the European countries participating in the survey for literacy,
numeracy and problem solving in technology-rich environment scales. 17 European countries assessed
literacy and numeracy skills (i.e. Austria, Belgium, Cyprus, Czech Republic, Denmark, Estonia, Finland,
Germany, Ireland, Italy, Netherlands, Norway, Poland, Slovak Republic, Spain, Sweden and United
Kingdom). Cyprus, France, Italy and Spain did not participate in the problem solving in technology-rich
environments assessment.
24
3.1. Description of education and skill mismatch indicators used
Using the variables available in PIAAC dataset and the literature review on the different approaches
to measure occupational mismatch described in the previous section, we build up to 21 mismatch
measures/indicators.12 As mentioned in Chapter 2, this technical report focuses strictly on measures of
overeducation and overskilling. All indicators developed are dummy variables that equal 1 if
overeducated/overskilled and 0 otherwise, this way it will ease future quantitative analysis later on (i.e.
factor analysis).
More in detail, here follows the list of all the indicators of either overeducation or overskilling we were
able to build using the information contained in PIAAC13.
1. Education mismatch using level of education: We compare the level of education of the individual
(using variable EDCAT7) with the modal level of education of all the individuals in the same country
and ISCO 2 digits occupation (using variable ISCO2C). We defined an individual as mismatch
(overeducated) if his level of education is higher than the modal level of occupation in his
occupation and country. [varname: EDU1]
2. Education mismatch using level of education: We compare the level of education of the individual
(using variable EDCAT7) with the modal level of education of all the individuals in the same country
and ISCO 1 digit occupation (using variable ISCO1C). We defined an individual as mismatch
(overeducated) if his level of education is higher than the modal level of occupation in his
occupation and country. [varname: EDU2]
3. Education mismatch using level of education: We compare the level of education of the individual
(using variable EDCAT7) with the modal level of education of all the individuals in the same country,
same ISCO 1 digit occupation and same age cohort (using variable AGEG10LFS). We defined an
individual as mismatch if his level of education is higher than the modal level of occupation in his
occupation, country and age cohort. [varname: EDU3]
4. Education mismatch using years of education: We compare the years of education (using variable
YRSQUAL) of the individual with the average years of education of all the individuals in the same
country and ISCO 2 digits occupation. We defined an individual as mismatch if his years of education
are 1 standard deviation higher than the average years of education in his occupation and country.
[varname: YEAR1]
5. Education mismatch using years of education: We compare the years of education of the individual
with the average years of education (using variable YRSQUAL) of all the individuals in the same
country and ISCO 1 digit occupation. We defined an individual as mismatch if his years of education
12
The terms mismatch indicators and mismatch measures will be used interchangeably in this technical report. 13
We could build only indicators that were based on variables included in the PIAAC dataset with enough number of observations and plausible results for comparison across indicators.
25
are 1 standard deviation higher than the average years of education in his occupation and country.
[varname: YEAR2]
6. Education mismatch using years of education: We compare the years of education of the individual
with the average years of education of all the individuals in the same country, same ISCO 1 digit
occupation and same cohort. We defined an individual as mismatch if his years of education are 1
standard deviation higher than the average years of education in his occupation, country and
cohort. [varname: YEAR3]
7. Education mismatch using level of education and self-reported opinion on the real level of
education needed for the current job: We compare the level of education of the individual (using
variable EDCAT7) with his opinion on the qualification required for someone who was to get his
current job (using variable D_Q12a). We define an individual as mismatch if his level of education is
higher than the one he thinks it is required to get his job. [varname: SUB_EDU1]
8. Education mismatch using level of education and self-reported opinion on the real level of
education needed for the current job: This definition further investigates those individuals who
were found to be matched in their job in SUB_EDU1. Using responses to the question on whether
the qualification is necessary for doing their job satisfactorily, individuals who responded that "a
lower level would be sufficient" as re-classified as mismatch (using variable D_Q12b), thus
increasing the size of mismatch individuals from SUB_EDU1 to include those that can be identified as
genuine mismatch. [varname: SUB_EDU2]
9. Education mismatch using level of education and individuals' earnings. Following the approach of
nauze-Fichet and Tomasini (2002), we define an individual as mismatch (over-qualified) if two-thirds
of the individuals at the level of education immediately lower are better paid than him (using
variable EARNMTH and dropping observations from the 1% and 99% percentile to eliminate outliers
by country). [varname: WAGE]
10. Skill mismatch in literacy using OECD approach: First select “matched” individuals (i.e. individuals
declaring that they do not have skills to cope with more demanding duties and that they do not
need further training to cope with their present duties based on negative response to variables
F_Q07a and F_Q07b) and calculate the distribution of literacy skills of these individuals in their ISCO
1 digit occupation. We define an individual as mismatch if his literacy score is above the 95
percentile of the distribution of skills of the matched individuals in the same ISCO 1 digit occupation
and country. [varname: OECD_SKILL_LIT1]
11. Skill mismatch in numeracy using OECD approach: First select “matched” individuals (i.e. individuals
declaring that they do not have skills to cope with more demanding duties and that they do not
need further training to cope with their present duties based on negative response to variables
F_Q07a and F_Q07b) and calculate the distribution of numeracy skills of the those individuals in
their ISCO 1 digit occupation. We define an individual as mismatch if his numeracy score is above the
95 percentile of the distribution of skills of the matched individuals in the same ISCO 1 digit
occupation and country. [varname: OECD_SKILL_NUM1]
26
12. Skill mismatch in numeracy using the approach from Desjardins and Rubenson (2011). Using
engagement scores equal to once a week as cutoff for high/low engagement: we classify individuals
as either medium to high- or low-skilled in numeracy, depending on whether they score (using the
first plausible value as the score –variable PVNUM1) at skills levels 3 to 5 (medium to high) or 1-2
(low) on the proficiency level scale defined in PIAAC; we then distinguish individuals with low- vs.
high-skill jobs (i.e. with low- to medium-low engagement vs. medium-high to high- engagement),
depending on whether they engage in numeracy-related tasks14 less than or at least once a week.
We define an individual as mismatched in numeracy if he is medium- to high-skilled and has a low-
to medium-low level of numeracy engagement. [varname: SKILL_NUM2]
13. Skill mismatch in numeracy using the approach from Desjardins and Rubenson (2011). Similar to
SKILL_NUM2 but using median engagement scores as cutoff for high/low engagement: we classify
individuals as either medium to high- or low-skilled in numeracy, depending on whether they score
(using the first plausible value as the score –variable PVNUM1) at skills levels 3 to 5 (medium to
high) or 1-2 (low) on the proficiency level scale defined in PIAAC; we then distinguish individuals
with low- vs. high-skill jobs (i.e. with low- to medium-low engagement vs. medium-high to high-
engagement), depending on whether their engagement in numeracy-related tasks15 is equal or
above the median in the same country and ISCO2 occupation. We define an individual as
mismatched in numeracy if he is medium- to high-skilled and has a low- to medium-low level of
numeracy engagement. [varname: SKILL_NUM3]
14. Skill mismatch in literacy using the approach from Desjardins and Rubenson (2011). Using
engagement scores equal to once a week as cutoff for high/low engagement: we classify individuals
as either medium to high- or low-skilled in literacy, depending on whether they score (using the first
plausible value as the score –variable PVLIT1) at skills levels 3 to 5 (medium to high) or 1-2 (low) on
the proficiency level scale defined in PIAAC; we then distinguish individuals with low- vs. high-skill
jobs (i.e. with low- to medium-low engagement vs. medium-high to high- engagement), depending
on whether they engage in literacy-related tasks16 less than or at least once a week. We define an
individual as mismatched in literacy if he is medium- to high-skilled and has a low- to medium-low
level of literacy engagement. [varname: SKILL_LIT2]
15. Skill mismatch in literacy using the approach from Desjardins and Rubenson (2011). using median
engagement scores as cutoff for high/low engagement: we classify individuals as either medium to
high- or low-skilled in numeracy, depending on whether they score (using the first plausible value as
the score –variable PVLIT1) at skills levels 3 to 5 (medium to high) or 1-2 (low) on the proficiency
14
The individual numeracy engagement score is defined as the mean of the scores in the 6 numeracy-related tasks present in PIAAC (vars. G_Q03b, G_Q03c, G_Q03d, G_Q03f, G_Q03g, G_Q03h). 15
See footnote for SKILL_NUM2 for the computation of the individual numeracy engagement score. 16
The individual literacy engagement score is defined as the mean of reading and writing scores, each one computed as the mean in the scores for the relative tasks; PIAAC includes questions on 8 reading-related tasks (G_Q01a to G_Q01h) and 4 writing-related tasks (G_Q02a to G_Q2d). We decided to attribute the same weight to the two components, instead of computing the mean of all reading- and writing-related tasks altogether, which would give more relevance to reading.
27
level scale defined in PIAAC; we then distinguish individuals with low- vs. high-skill jobs (i.e. with
low- to medium-low engagement vs. medium-high to high- engagement), depending on whether
their engagement in literacy-related tasks17 is equal or above the median in the same country and
ISCO2 occupation. We define an individual as mismatched in literacy if he is medium- to high-skilled
and has a low- to medium-low level of literacy engagement. [varname: SKILL_LIT3]
16. Skill mismatch following the methodology of Allen at al. (2013), for numeracy. We standardize the
numeracy skill level (as defined by the first plausible value –variable PVNUM1) and numeracy skill
use (where the numeracy engagement score is defined as the mean of numeracy-related tasks
scores using the same variables as in SKILL_NUM2 and SKILL_NUM3), then subtract the standardized
measure of skill use from the standardized measure of skill level; we define all individuals with a
value greater than 1.5 on this difference variable as “underutilized” (i.e. overskilled). [varname:
SKILL_NUM4]
17. Skill mismatch following the methodology of Allen at al. (2013), for literacy. We standardize the
literacy skill level (as defined by the first plausible value –variable PVLIT1) and literacy skill use
(where the literacy engagement score is defined as the mean of the scores in all reading- and
writing-related tasks scores using the same variables as in SKILL_LIT2 and SKILL_LIT3), then subtract
the standardized measure of skill use from the standardized measure of skill level; we define all
individuals with a value greater than 1.5 on this difference variable as “underutilized” (i.e.
overskilled). [varname: SKILL_LIT4]
18. Skills mismatch using skill level for numeracy based on 1 standard deviation (SD) rule. We
compare the skill level of the individual in numeracy (as measured by the first plausible value –
variable PVNUM1) with the average skill level in numeracy of all individuals in the same country and
ISCO 2 digit occupation (ISCO2C). We define an individual as mismatched if its numeracy skills level
is more than 1 standard deviation higher than the average in his ISCO2 occupation and country.
[varname: SKILL_NUM5]
19. Skills mismatch using skill level for numeracy based on 2 SD rule. We compare the skill level of the
individual in numeracy (as measured by the first plausible value) with the average skill level in
numeracy of all individuals in the same country and ISCO 2 digit occupation. We define an individual
as mismatched if its numeracy skills level is more than 2 standard deviations higher than the average
in his ISCO2 occupation and country. [varname: SKILL_NUM6]
20. Skills mismatch using skill level for literacy based on 1 SD rule. We compare the skill level of the
individual in literacy (as measured by the first plausible value –variable PVLIT1) with the average skill
level in literacy of all individuals in the same country and ISCO 2 digit occupation. We define an
individual as mismatched if its literacy skills level is more than 1 standard deviation higher than the
average in his ISCO2 occupation and country. [varname: SKILL_LIT5]
21. Skills mismatch using skill level for literacy based on 2 SD rule. We compare the skill level of the
individual in literacy (as measured by the first plausible value) with the average skill level in literacy
17
See footnote for SKILL_LIT2 for the computation of the individual literacy engagement score.
28
of all individuals in the same country and ISCO 2 digit occupation. We define an individual as
mismatched if its literacy skills level is more than 2 standard deviations higher than the average in
his ISCO2 occupation and country. [varname: SKILL_LIT6]
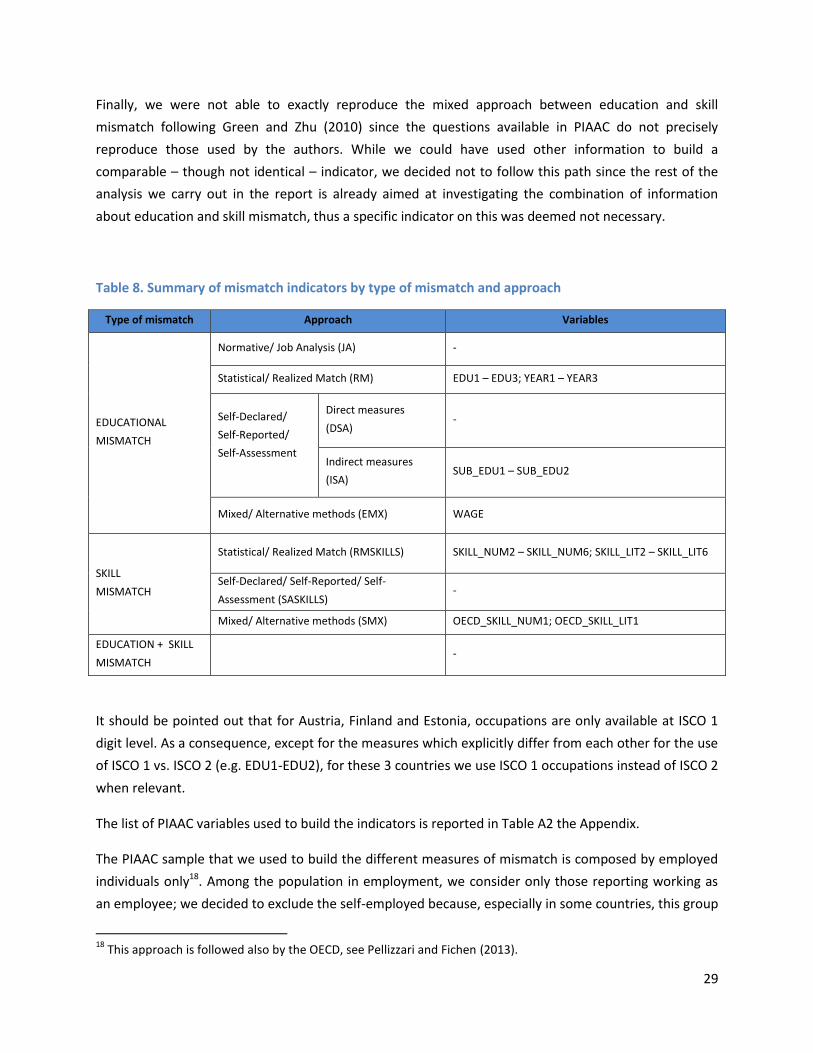
Table 8 shows the link between the 21 mismatch measures we replicate and the corresponding type of
mismatch and approach followed to construct the indicator. The first column indicates the type of
mismatch addressed by the variable, the second column refers to the methodological approach used for
building the variable and finally, the third column indicated the variable name. As an example, variables
EDU1 to EDU3 are those built using the Statistical/Realized Match method, which addresses the issue of
educational mismatch (additional summary of variables are provided in tables A2 and A3 in the
Appendix).
As mentioned above, the possibility to replicate an indicator was based on the availability of information
in PIAAC. The lack of questions in the survey concerning a direct self-assessment of the match between
the individual’s level of educational attainment and occupation prevented us from constructing DSA
subjective measures of educational mismatch; as a matter of fact, the only questions available in PIAAC
in this area are D_Q12a (“Still talking about your current job: If applying today, what would be the usual
qualifications, if any, that someone would need to GET this type of job?”) and D_Q12b (“Thinking about
whether this qualification is necessary for doing your job satisfactorily, which of the following
statements would be most true? 1. This level is necessary; 2. A lower level would be sufficient; 3. A
higher level would be needed.”), which both fall within the boundaries of ISA methods.
Concerning subjective measures of skill mismatch, two questions were available in PIAAC, namely
F_Q07a (“Do you feel that you have the skills to cope with more demanding duties than those you are
required to perform in your current job?”) and F_Q07b (“Do you feel that you need further training in
order to cope well with your present duties?”). For the sake of coherence, these two questions should
be used jointly to identify mismatch situations; however, some discrepancies arose, since there were a
number of individuals that based on their answers could be considered both overskilled and
underskilled. While this can make sense, since the answers could be based on different types of skills,
we felt that arbitrarily choosing to rely on one of the questions to identify overskilled individuals could
have been tricky. We therefore decided to use the self-assessment of skills for the current job following
the OECD approach, i.e. the mixed method reproduced in the measures
OECD_SKILL_NUM1/OECD_SKILL_LIT1.
Measures within the JA approach for education mismatch were not reproduced for a few reasons; first
of all, the existing literature is mostly based on the US Dictionary of Occupational Titles, which cannot be
directly applied here. Secondly, even having an established code on the equivalence between education
and occupations, this would become obsolete very quickly. Finally, this approach is very demanding and
time consuming.
29
Finally, we were not able to exactly reproduce the mixed approach between education and skill
mismatch following Green and Zhu (2010) since the questions available in PIAAC do not precisely
reproduce those used by the authors. While we could have used other information to build a
comparable – though not identical – indicator, we decided not to follow this path since the rest of the
analysis we carry out in the report is already aimed at investigating the combination of information
about education and skill mismatch, thus a specific indicator on this was deemed not necessary.
Table 8. Summary of mismatch indicators by type of mismatch and approach
Type of mismatch Approach Variables
EDUCATIONAL
MISMATCH
Normative/ Job Analysis (JA) -
Statistical/ Realized Match (RM) EDU1 – EDU3; YEAR1 – YEAR3
Self-Declared/
Self-Reported/
Self-Assessment
Direct measures
(DSA) -
Indirect measures
(ISA) SUB_EDU1 – SUB_EDU2
Mixed/ Alternative methods (EMX) WAGE
SKILL
MISMATCH
Statistical/ Realized Match (RMSKILLS) SKILL_NUM2 – SKILL_NUM6; SKILL_LIT2 – SKILL_LIT6
Self-Declared/ Self-Reported/ Self-
Assessment (SASKILLS) -
Mixed/ Alternative methods (SMX) OECD_SKILL_NUM1; OECD_SKILL_LIT1
EDUCATION + SKILL
MISMATCH -
It should be pointed out that for Austria, Finland and Estonia, occupations are only available at ISCO 1
digit level. As a consequence, except for the measures which explicitly differ from each other for the use
of ISCO 1 vs. ISCO 2 (e.g. EDU1-EDU2), for these 3 countries we use ISCO 1 occupations instead of ISCO 2
when relevant.
The list of PIAAC variables used to build the indicators is reported in Table A2 the Appendix.
The PIAAC sample that we used to build the different measures of mismatch is composed by employed
individuals only18. Among the population in employment, we consider only those reporting working as
an employee; we decided to exclude the self-employed because, especially in some countries, this group
18
This approach is followed also by the OECD, see Pellizzari and Fichen (2013).
30
of workers can present very peculiar and diversified features, and therefore be not comparable to the
rest of the employed population; furthermore, including these individuals would reduce the range of
indicators that we could replicate, since some information (e.g. the monthly wage) would not be
available in PIAAC for this sub-group.
Finally, following Allen et al. (2013), we decided to drop individuals that despite being formally in
employment (objective status), are self-reportedly pupils/students or in apprenticeship/internship
(subjective status). As the authors explain, the exclusion of students is motivated by the fact that
“student jobs are often low‐skilled temporary jobs taken for the sole purpose of helping the individual or
his/her family pay for the expense of obtaining an education. Apprenticeships and internships are
excluded because they are not purely work, but a combination of education and work”. The choice to
use the subjective status to identify students, rather than the objective one on individuals who are
currently in formal education, is due to the fact that we do not want to exclude from the sample those
individuals who are enrolled in some type of (possibly part-time) education, but whose main activity is
nevertheless paid work.
The final sample size is around 55000 individuals 19 .
Table 9 below provides some descriptive statistics at country level to have a better idea of the
population typology.
19
It should be noted that in order to guarantee enough variability to compute the indicators, for each measure the identification of matched and mismatched individuals was carried out only when the number of sample observations on which the indicator was based was at least 20. This rule of thumb was particularly relevant when identifying mismatched individuals based on the comparison of skill levels in very narrow sub-groups, e.g. individuals working in the same country and ISCO2 occupation. The choice of the 20 observations threshold is coherent with those reported in Commission Regulation (EC) No 1982/2003, containing the precision requirements concerning publication of the data collected in EU-SILC.
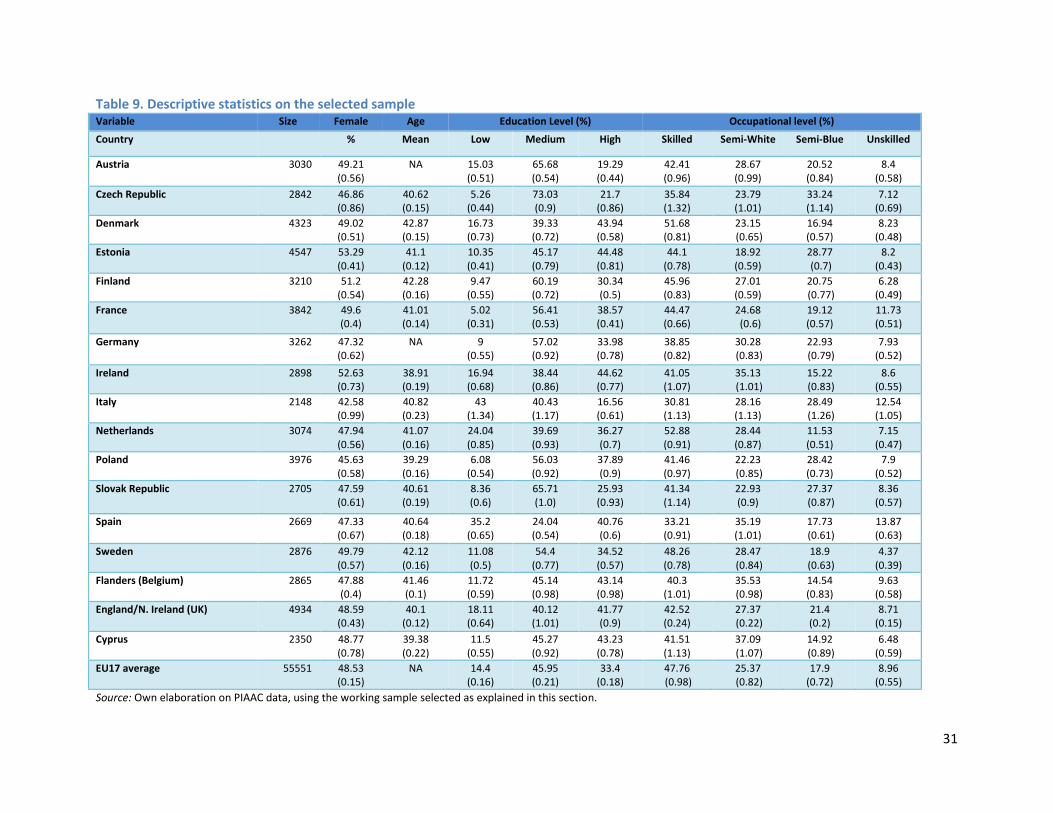
31
Table 9. Descriptive statistics on the selected sample Variable Size Female Age Education Level (%) Occupational level (%)
Country % Mean Low Medium High Skilled Semi-White Semi-Blue Unskilled
Austria 3030 49.21 (0.56)
NA 15.03 (0.51)
65.68 (0.54)
19.29 (0.44)
42.41 (0.96)
28.67 (0.99)
20.52 (0.84)
8.4 (0.58)
Czech Republic 2842 46.86 (0.86)
40.62 (0.15)
5.26 (0.44)
73.03 (0.9)
21.7 (0.86)
35.84 (1.32)
23.79 (1.01)
33.24 (1.14)
7.12 (0.69)
Denmark 4323 49.02 (0.51)
42.87 (0.15)
16.73 (0.73)
39.33 (0.72)
43.94 (0.58)
51.68 (0.81)
23.15 (0.65)
16.94 (0.57)
8.23 (0.48)
Estonia 4547 53.29 (0.41)
41.1 (0.12)
10.35 (0.41)
45.17 (0.79)
44.48 (0.81)
44.1 (0.78)
18.92 (0.59)
28.77 (0.7)
8.2 (0.43)
Finland 3210 51.2 (0.54)
42.28 (0.16)
9.47 (0.55)
60.19 (0.72)
30.34 (0.5)
45.96 (0.83)
27.01 (0.59)
20.75 (0.77)
6.28 (0.49)
France 3842 49.6 (0.4)
41.01 (0.14)
5.02 (0.31)
56.41 (0.53)
38.57 (0.41)
44.47 (0.66)
24.68 (0.6)
19.12 (0.57)
11.73 (0.51)
Germany 3262 47.32 (0.62)
NA 9 (0.55)
57.02 (0.92)
33.98 (0.78)
38.85 (0.82)
30.28 (0.83)
22.93 (0.79)
7.93 (0.52)
Ireland 2898 52.63 (0.73)
38.91 (0.19)
16.94 (0.68)
38.44 (0.86)
44.62 (0.77)
41.05 (1.07)
35.13 (1.01)
15.22 (0.83)
8.6 (0.55)
Italy 2148 42.58 (0.99)
40.82 (0.23)
43 (1.34)
40.43 (1.17)
16.56 (0.61)
30.81 (1.13)
28.16 (1.13)
28.49 (1.26)
12.54 (1.05)
Netherlands 3074 47.94 (0.56)
41.07 (0.16)
24.04 (0.85)
39.69 (0.93)
36.27 (0.7)
52.88 (0.91)
28.44 (0.87)
11.53 (0.51)
7.15 (0.47)
Poland 3976 45.63 (0.58)
39.29 (0.16)
6.08 (0.54)
56.03 (0.92)
37.89 (0.9)
41.46 (0.97)
22.23 (0.85)
28.42 (0.73)
7.9 (0.52)
Slovak Republic 2705 47.59 (0.61)
40.61 (0.19)
8.36 (0.6)
65.71 (1.0)
25.93 (0.93)
41.34 (1.14)
22.93 (0.9)
27.37 (0.87)
8.36 (0.57)
Spain 2669 47.33 (0.67)
40.64 (0.18)
35.2 (0.65)
24.04 (0.54)
40.76 (0.6)
33.21 (0.91)
35.19 (1.01)
17.73 (0.61)
13.87 (0.63)
Sweden 2876 49.79 (0.57)
42.12 (0.16)
11.08 (0.5)
54.4 (0.77)
34.52 (0.57)
48.26 (0.78)
28.47 (0.84)
18.9 (0.63)
4.37 (0.39)
Flanders (Belgium) 2865 47.88 (0.4)
41.46 (0.1)
11.72 (0.59)
45.14 (0.98)
43.14 (0.98)
40.3 (1.01)
35.53 (0.98)
14.54 (0.83)
9.63 (0.58)
England/N. Ireland (UK) 4934 48.59 (0.43)
40.1 (0.12)
18.11 (0.64)
40.12 (1.01)
41.77 (0.9)
42.52 (0.24)
27.37 (0.22)
21.4 (0.2)
8.71 (0.15)
Cyprus 2350 48.77 (0.78)
39.38 (0.22)
11.5 (0.55)
45.27 (0.92)
43.23 (0.78)
41.51 (1.13)
37.09 (1.07)
14.92 (0.89)
6.48 (0.59)
EU17 average 55551 48.53 (0.15)
NA 14.4 (0.16)
45.95 (0.21)
33.4 (0.18)
47.76 (0.98)
25.37 (0.82)
17.9 (0.72)
8.96 (0.55)
Source: Own elaboration on PIAAC data, using the working sample selected as explained in this section.
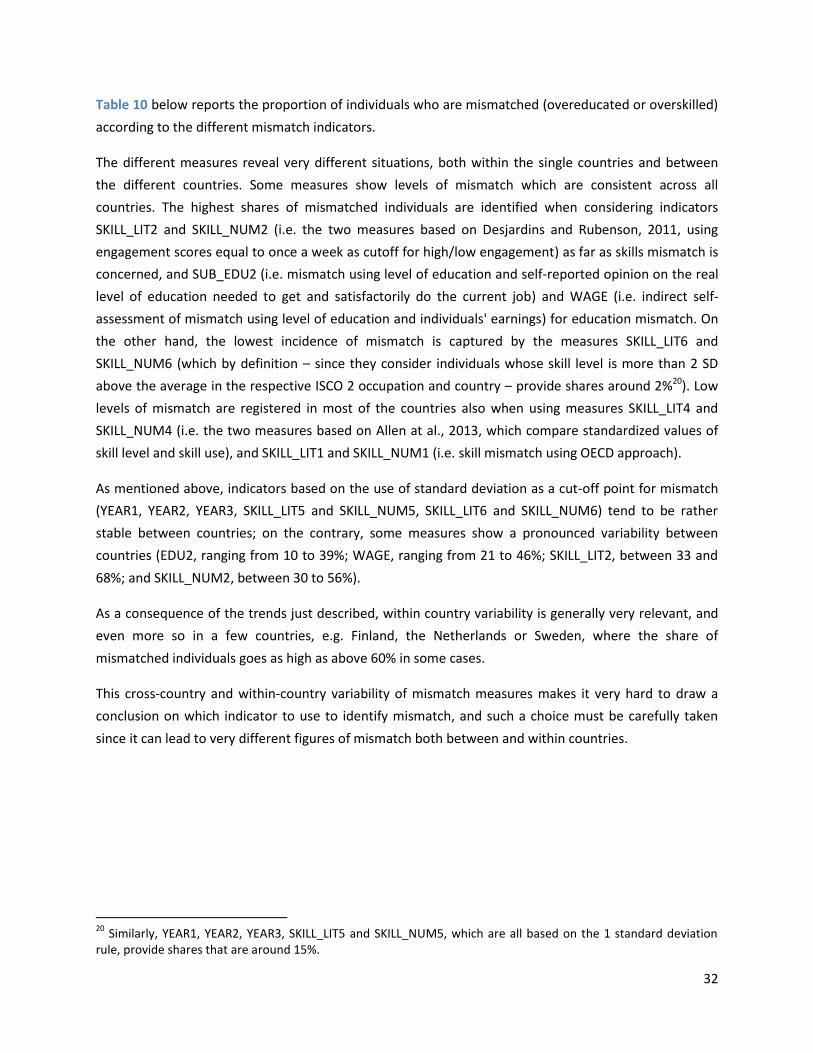
32
Table 10 below reports the proportion of individuals who are mismatched (overeducated or overskilled)
according to the different mismatch indicators.
The different measures reveal very different situations, both within the single countries and between
the different countries. Some measures show levels of mismatch which are consistent across all
countries. The highest shares of mismatched individuals are identified when considering indicators
SKILL_LIT2 and SKILL_NUM2 (i.e. the two measures based on Desjardins and Rubenson, 2011, using
engagement scores equal to once a week as cutoff for high/low engagement) as far as skills mismatch is
concerned, and SUB_EDU2 (i.e. mismatch using level of education and self-reported opinion on the real
level of education needed to get and satisfactorily do the current job) and WAGE (i.e. indirect self-
assessment of mismatch using level of education and individuals' earnings) for education mismatch. On
the other hand, the lowest incidence of mismatch is captured by the measures SKILL_LIT6 and
SKILL_NUM6 (which by definition – since they consider individuals whose skill level is more than 2 SD
above the average in the respective ISCO 2 occupation and country – provide shares around 2%20). Low
levels of mismatch are registered in most of the countries also when using measures SKILL_LIT4 and
SKILL_NUM4 (i.e. the two measures based on Allen at al., 2013, which compare standardized values of
skill level and skill use), and SKILL_LIT1 and SKILL_NUM1 (i.e. skill mismatch using OECD approach).
As mentioned above, indicators based on the use of standard deviation as a cut-off point for mismatch
(YEAR1, YEAR2, YEAR3, SKILL_LIT5 and SKILL_NUM5, SKILL_LIT6 and SKILL_NUM6) tend to be rather
stable between countries; on the contrary, some measures show a pronounced variability between
countries (EDU2, ranging from 10 to 39%; WAGE, ranging from 21 to 46%; SKILL_LIT2, between 33 and
68%; and SKILL_NUM2, between 30 to 56%).
As a consequence of the trends just described, within country variability is generally very relevant, and
even more so in a few countries, e.g. Finland, the Netherlands or Sweden, where the share of
mismatched individuals goes as high as above 60% in some cases.
This cross-country and within-country variability of mismatch measures makes it very hard to draw a
conclusion on which indicator to use to identify mismatch, and such a choice must be carefully taken
since it can lead to very different figures of mismatch both between and within countries.
20
Similarly, YEAR1, YEAR2, YEAR3, SKILL_LIT5 and SKILL_NUM5, which are all based on the 1 standard deviation rule, provide shares that are around 15%.
33
Table 10. Percentage of over educated or over skilled individuals according to the different measures of mismatch.
Source: Own elaboration from PIAAC data, using the working sample selected as explain in 3.1. Definitions of the mismatch variables are reported in section 3.1
Aus
tria
Bel
gium
Cyp
rus
Cze
ch R
epub
lic
Den
mar
k
Esto
nia
Finl
and
Fran
ce
Ger
man
y
Irel
and
Ital
y
Net
herl
ands
Pola
nd
Slov
ak R
epub
lic
Spai
n
Swed
en
Uni
ted
King
dom
EDU1 0.23 0.24 0.31 0.12 0.31 0.26 0.17 0.17 0.22 0.33 0.24 0.22 0.11 0.1 0.34 0.19 0.2
EDU2 0.23 0.29 0.3 0.12 0.32 0.26 0.18 0.16 0.22 0.39 0.22 0.24 0.1 0.1 0.35 0.21 0.15
EDU3 0.22 0.28 0.29 0.14 0.27 0.23 0.14 0.22 0.22 0.36 0.24 0.25 0.1 0.1 0.34 0.21 0.17
YEAR1 0.14 0.11 0.12 0.12 0.12 0.16 0.16 0.12 0.14 0.18 0.08 0.11 0.1 0.12 0.12 0.18
YEAR2 0.14 0.12 0.11 0.11 0.12 0.16 0.16 0.11 0.16 0.16 0.14 0.08 0.09 0.14 0.12 0.14
YEAR3 0.12 0.09 0.15 0.12 0.13 0.16 0.11 0.1 0.13 0.17 0.13 0.11 0.1 0.13 0.11 0.17
SUB_EDU1 0.25 0.22 0.25 0.24 0.24 0.39 0.2 0.42 0.27 0.37 0.2 0.2 0.23 0.21 0.36 0.23 0.36
SUB_EDU2 0.32 0.33 0.29 0.38 0.33 0.45 0.3 0.5 0.36 0.45 0.27 0.27 0.36 0.32 0.43 0.33 0.47
WAGE 0.38 0.44 0.21 0.27 0.46 0.45 0.42 0.37 0.29 0.33 0.39 0.31 0.25 0.34
OECD_SKILL_NUM1 0.18 0.07 0.05 0.13 0.07 0.08 0.06 0.05 0.08 0.12 0.12 0.04 0.05 0.11 0.21 0.04 0.05
SKILL_NUM2 0.5 0.55 0.44 0.46 0.56 0.46 0.55 0.37 0.46 0.37 0.3 0.55 0.37 0.53 0.32 0.56 0.41
SKILL_NUM3 0.21 0.22 0.18 0.22 0.25 0.2 0.26 0.15 0.19 0.15 0.09 0.23 0.15 0.25 0.12 0.24 0.18
SKILL_NUM4 0.08 0.07 0.1 0.1 0.08 0.09 0.09 0.07 0.08 0.08 0.07 0.08 0.09 0.1 0.08 0.08 0.09
SKILL_NUM5 0.15 0.15 0.16 0.16 0.15 0.16 0.15 0.15 0.16 0.15 0.16 0.15 0.15 0.15 0.15 0.15 0.15
SKILL_NUM6 0.01 0.02 0.01 0.01 0.01 0.01 0.02 0.01 0.01 0.02 0.02 0.01 0.02 0.02 0.01 0.01 0.02
OECD_SKILL_LIT1 0.1 0.06 0.1 0.17 0.08 0.08 0.07 0.05 0.13 0.1 0.09 0.05 0.05 0.1 0.04 0.06 0.05
SKILL_LIT2 0.48 0.58 0.49 0.53 0.52 0.54 0.68 0.44 0.49 0.48 0.33 0.63 0.47 0.56 0.37 0.62 0.52
SKILL_LIT3 0.23 0.26 0.24 0.24 0.24 0.25 0.31 0.19 0.22 0.23 0.13 0.3 0.21 0.26 0.17 0.29 0.25
SKILL_LIT4 0.08 0.08 0.12 0.09 0.09 0.1 0.09 0.08 0.07 0.09 0.07 0.08 0.09 0.11 0.07 0.1 0.1
SKILL_LIT5 0.15 0.15 0.15 0.16 0.15 0.15 0.15 0.15 0.16 0.15 0.16 0.15 0.16 0.14 0.15 0.15 0.16
SKILL_LIT6 0.02 0.02 0.01 0.02 0.01 0.02 0.02 0.01 0.02 0.02 0.01 0.01 0.02 0.02 0.01 0.01 0.02
34
3.2. Principal components analysis
PIAAC data has provided us the unique chance to compute as many as 21 different measures of
education and skills mismatch with the same data source. However, some of the indicators reported are
likely to be capturing types of mismatch which are relatively similar to each other; for example,
measuring education mismatch using ISCO 1 digit or ISCO 2 digit occupational classes is likely not to
make a big difference; similarly, we might expect that measuring skills mismatch with the same
methodology but considering either numeracy or literacy skills yields comparable results. While these
examples could be more intuitive and straightforward, there might be other similarities between the
different measures that are not as clear as the examples made above and that it is worthwhile
investigating.
In order to capture these potential similarities between measures, we implemented a principal
component analysis (PCA). The principal component extraction was done for the pooled sample (all
countries together) and then country by country.
The PCA was at first carried out using the whole range of 21 measures of mismatch described above.
The procedure grouped the 21 measures of mismatch in 5 main components, which we named as
follows:
1. Education mismatch objective, including measures EDU1, EDU2, EDU3, YEAR1, YEAR2, YEAR3.
2. Skill mismatch, numeracy and literacy based on distribution of skills in the population,
including measures OECD_SKILL_NUM1, SKILL_NUM5, SKILL_NUM6, OECD_SKILL_LIT1,
SKILL_LIT5, SKILL_LIT6.
3. Skill mismatch, numeracy based on the comparison of skills used and skills owned, including
measures SKILL_NUM2, SKILL_NUM3, SKILL_NUM4.
4. Skill mismatch, literacy based on the comparison of skills used and skills owned, including
measures SKILL_LIT2, SKILL_LIT3, SKILL_LIT4.
5. Education mismatch subjective, including measures SUB_EDU1, SUB_EDU2, WAGE.
In order to increase the number of observations used in the PCA, and therefore enlarge the pool of
information from which the procedure can draw, we performed a few tests running the PCA on a
smaller range of measures (see Annex B for further details). We excluded 2 measures and then a third
one, and in all cases we obtained results similar to those arising from the analysis of the 21 measures. As
a consequence, the preferred specification we choose to adopt is the one that includes only 18
measures (dropping OECD_SKILL_NUM1, OECD_SKILL_LIT1 and WAGE in order to maximise the available
sample size, i.e. to reduce the number of observation with missing observations), leading to the 5 above
mentioned components.
35
3.3. Principal components analysis by age group
In order to assess whether the factors retained and the grouping of mismatch measures change in
different sub-groups of the population, we replicated the analysis by age group. Indeed we may think
that in the group of very young individuals the latent dimensions underneath the mismatch measures
may be different from the ones in the group of old individuals. We considered 5 different age groups:
individuals younger than 25; between 25 and 34; between 35 and 44; between 45 and 54; and 55 and
above21. In all the groups we found similar results that replicated the results found with the pooled
sample. For an explanation of what Principal Component Analysis is and how to interpret the results we
refer the reader to Appendix B. In brief, the blue area showed in Table 11.
indicates that the variables used for measuring objective educational mismatch, from EDU1 to YEAR3,
are correlated each others, i.e. measure the same latent dimension both when the pooled sample is
taken into consideration, and when different age groups are considered (last 5 columns) The same can
be said for the other coloured areas (pink, green, etc…), which indicate that the variables grouped
together measure the same mismatch dimension. The only exception was the 45-54 age group, where
the PCA retained only 4 components, combining what we called component 3 and component 4 (skill
mismatch based on comparison between skills used and skills owned in numeracy and literacy), and
aggregating one of the literacy-related skill mismatch measures with component 2 (skill mismatch,
based on the distribution of skills). The conclusion that can be drawn from these results is that the
underlying dimensions appear to be common across all age groups.
21
We also tried with ten 5-years age groups, from 16-19, 20-24, up to 60-65. The results did not change, thus we report just the results with the distinction in five groups.
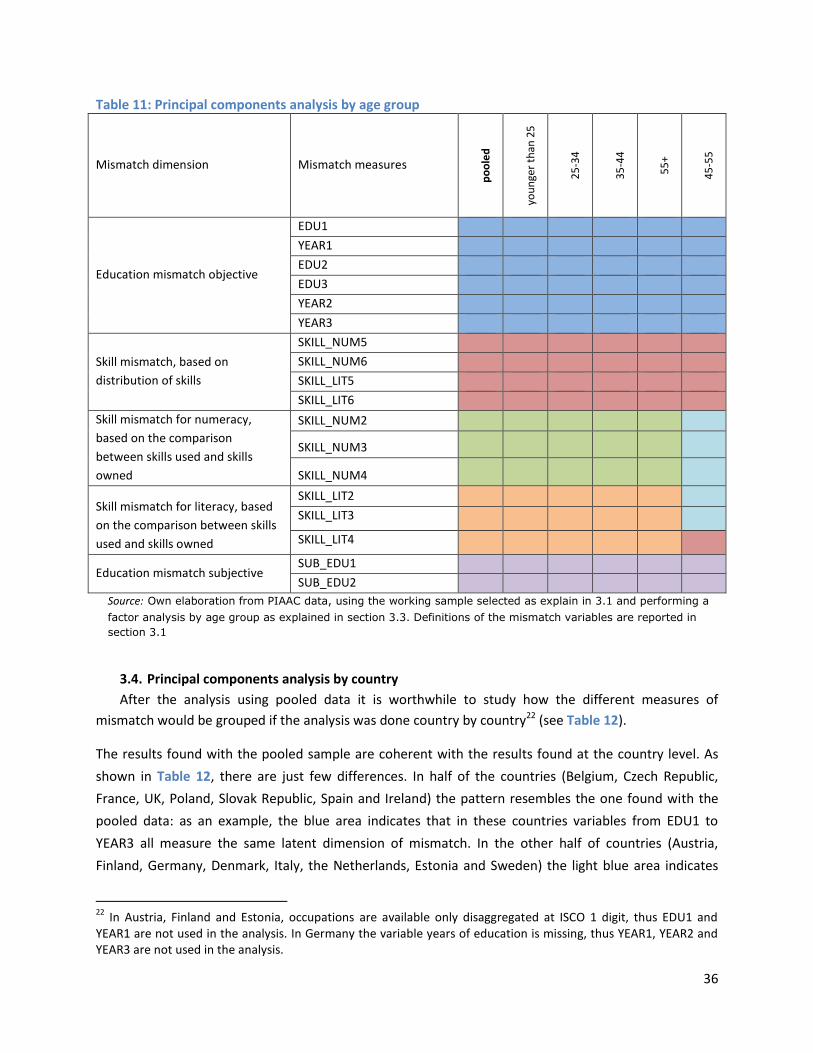
36
Table 11: Principal components analysis by age group
Mismatch dimension Mismatch measures
po
ole
d
you
nge
r th
an 2
5
25
-34
35
-44
55
+
45
-55
Education mismatch objective
EDU1
YEAR1
EDU2
EDU3
YEAR2
YEAR3
Skill mismatch, based on
distribution of skills
SKILL_NUM5
SKILL_NUM6
SKILL_LIT5
SKILL_LIT6
Skill mismatch for numeracy,
based on the comparison
between skills used and skills
owned
SKILL_NUM2
SKILL_NUM3
SKILL_NUM4
Skill mismatch for literacy, based
on the comparison between skills
used and skills owned
SKILL_LIT2
SKILL_LIT3
SKILL_LIT4
Education mismatch subjective SUB_EDU1
SUB_EDU2
Source: Own elaboration from PIAAC data, using the working sample selected as explain in 3.1 and performing a
factor analysis by age group as explained in section 3.3. Definitions of the mismatch variables are reported in
section 3.1
3.4. Principal components analysis by country
After the analysis using pooled data it is worthwhile to study how the different measures of
mismatch would be grouped if the analysis was done country by country22 (see Table 12).
The results found with the pooled sample are coherent with the results found at the country level. As
shown in Table 12, there are just few differences. In half of the countries (Belgium, Czech Republic,
France, UK, Poland, Slovak Republic, Spain and Ireland) the pattern resembles the one found with the
pooled data: as an example, the blue area indicates that in these countries variables from EDU1 to
YEAR3 all measure the same latent dimension of mismatch. In the other half of countries (Austria,
Finland, Germany, Denmark, Italy, the Netherlands, Estonia and Sweden) the light blue area indicates
22
In Austria, Finland and Estonia, occupations are available only disaggregated at ISCO 1 digit, thus EDU1 and YEAR1 are not used in the analysis. In Germany the variable years of education is missing, thus YEAR1, YEAR2 and YEAR3 are not used in the analysis.
37
that components 3 and 4 were grouped in one single factor capturing mismatch between skills used and
skills owned without distinguishing between numeracy and literacy, and one of the literacy-related skill
mismatch measures is aggregated to component 2 (skill mismatch, based on the distribution of skills).
Finally, in one country (Cyprus) component 1 and component 5 are grouped together unifying subjective
and objective education mismatch measures (blue area).
Table 12. Principal components analysis by country
Mismatch
dimension
Mismatch
measures po
ole
d
Spai
n
Bel
giu
m
Irel
and
Cze
ch R
epu
blic
Fran
ce
UK
Po
lan
d
Slo
vak
Rep
ub
lic
Cyp
rus
Fin
lan
d
Au
stri
a
Ger
man
y
Den
mar
k
Ital
y
Net
her
lan
ds
Swed
en
Esto
nia
Education
mismatch
objective
EDU1
YEAR1
EDU2
EDU3
YEAR2
YEAR3
Skill mismatch,
based on
distribution of
skills
SKILL_NUM5
SKILL_NUM6
SKILL_LIT5
SKILL_LIT6
Skill mismatch
numeracy
comparison of skill
used and skill
owned
SKILL_NUM2
SKILL_NUM3
SKILL_NUM4
Skill mismatch
literacy
comparison of skill
used and skill
owned
SKILL_LIT2
SKILL_LIT3
SKILL_LIT4
Education
mismatch
subjective
SUB_EDU1
SUB_EDU2
Source: Own elaboration from PIAAC data, using the working sample selected as explain in 3.1 and performing
a factor analysis by country as explained in section 3.4. Definitions of the mismatch variables are reported
in section 3.1
38
3.5. Conclusions on the Principal Components Analysis
The principal components analysis was done to reduce the dimension of the data, since dealing
with more than 20 indicators of mismatch can be hard, and maybe useless to draw any conclusions.
Results indicate that 5 dimensions (components) are identified. That said, instead of predicting the 5
components using the factor loadings weights we decided to select one measure for each component.
We decided to proceed in this way because when dealing with the predicted factors, interpretation can
be tricky. In particular, the factors that will emerge will be continuous variables, centred at 0, orthogonal
between each other, capturing the latent dimension of mismatch, which is not immediate to understand
and can lead to misleading conclusion if wrongly interpreted. We therefore decided to rely on 5 of the
existing measure of mismatch, each related to the 5 components, in order to make interpretation easier.
The decision was based on sample size and potential comparison with previous works undertaken using
them.
The variables we chose to represent the 5 components found were:
1. Education mismatch objective: education level above the mode of the education level in ISCO 2
digit occupation [EDU1]
2. Skill mismatch, numeracy and literacy based on the distribution of skills in the population: skill
level in literacy one standard deviation above the average skill level in literacy in the same ISCO
2 digits occupation [SKILL_LIT5]
3. Skill mismatch, numeracy based on the comparison between skills used and skills owned:
mismatch between numeracy skill level of workers and engagement in numeracy-related tasks
(following Desjardins and Rubenson, 2011), using median engagement scores as cut-off for
high/low engagement [SKILL_NUM3]
4. Skill mismatch, literacy based on the comparison between skills used and skills owned:
mismatch between literacy skill level of workers and engagement in literacy-related tasks
(following Desjardins and Rubenson, 2011), using median engagement scores as cut-off for
high/low engagement [SKILL_LIT3]
Education mismatch subjective: genuine mismatch [SUB_EDU2]Table 13 summarizes graphically the
match between variables and components: the first two columns indicate the broad category of
mismatch and the subtypes within each category (described also in secntion 2). Columns four to six
describe how the variable is built and the last two columns show which variable has been finally
selected as representative of each of the 5 components. As an example, the blue area in Table 13
indicates that EDU1 is the final variable selected in order to measure objective education mismatch; the
red area indicates that SKILL_LIT5 is the final variable selected as a measure of component 2 (skill
mismatch, based on the distribution of skills), and so on.
39
Table 13: Identified components and measures selected to represent them
Type of
mismatch
Sub-type
n. Variable name
Variable used
to identify the
educational/skil
l level Components (out of PCA)
Final
variable
selected
education
objective
1 EDU1 level modal level of individuals 1
Education mismatch,
objective EDU1
2 EDU2 level modal level of individuals 1
3 EDU3 level modal level of individuals 1
4 YEAR1 years average years 1
5 YEAR2 years average years 1
6 YEAR3 years average years 1
subjective 7 SUB_EDU1 level self-reported opinion of level required 5
Education mismatch,
subjective
SUB_EDU2
8 SUB_EDU2 level self-reported opinion 5
objective 9 WAGE level individual's earnings 5
skill
subjective 10 OECD_SKILL_NUM1 numeracy score
distribution of skills among matched
people 2
Skill mismatch, based on
the distribution of skills
SKILL_LIT5
objective
11 SKILL_NUM2 numeracy score use of numeracy skills in your job 3 Skill mismatch for
numeracy, comparison
between skills used and
skills owned
SKILL_NUM3 12 SKILL_NUM3 numeracy score use of numeracy skills in your job 3
13 SKILL_NUM4 numeracy score use of numeracy skills in your job 3
14 SKILL_NUM5 numeracy score distribution of skills among the population 2
Skill mismatch, based on
the distribution of skills
SKILL_LIT5
15 SKILL_NUM6 numeracy score distribution of skills among the population 2
subjective 16 OECD_SKILL_LIT1 literacy score
distribution of skills among matched
people 2
objective
17 SKILL_LIT2 literacy score use of numeracy skills in your job 4 Skill mismatch for literacy,
comparison between skills
used and skills owned
SKILL_LIT3 18 SKILL_LIT3 literacy score use of numeracy skills in your job 4
19 SKILL_LIT4 literacy score use of numeracy skills in your job 4
20 SKILL_LIT5 literacy score distribution of skills among the population 2 Skill mismatch, based on
the distribution of skills SKILL_LIT5
21 SKILL_LIT6 literacy score distribution of skills among the population 2
Source: Own elaboration from PIAAC data, using the working sample selected as explain in 3.1. Definitions of the mismatch variables are reported in section
3.1. Final variables chosen criteria explained in section 3.5
40
4. Further descriptive analysis on the different indicators of occupational
mismatch at country level
4.1 Kendall correlation
In order to verify whether the five measures of mismatch emerging from previous analysis are
further correlated, we run some additional analysis. Considering the data at the country level, we can
provide a “ranking” of countries, indicating the country relative position in terms of percentage of
people that are mismatched under the different definitions (e.g. ranking of countries according to the
level of objective education mismatch [EDU1] or according to the level of subjective education mismatch
[SUB_EDU2]). Once these five rankings are produced (one per mismatch indicator) we can establish
whether there is a relationship among them, and even better, if a strong and significant relationship
exists between two of the given mismatch indicator, we will be able to conclude whether the different
mismatch indicators selected provide the same information.
Thus, using the country rankings by mismatch indicator, we estimated the Kendall correlation23 of these
rankings. Results are reported in Table 14 below confirming that the measures catch different aspects of
mismatch. All correlations are not significant, with two exceptions only. Indeed, the only two measures
which show a positive and highly significant correlation are [SKILL_LIT3] and [SKILL_NUM3], meaning
that the only measures that rank countries in a similar way are those measures of skill mismatch use in
literacy and in numeracy (both measures are built on a comparison between the skills used and the skills
owned).
Table 14. Kendall correlation on the ranking of the countries based on the 5 mismatch measures.
EDU1 SKILL_LIT5 SKILL_LIT3 SKILL_NUM3 SUB_EDU2
EDU1 1
SKILL_LIT5 0.1242 1
SKILL_LIT3 -0.1634 -0.0980 1
SKILL_NUM3 -0.0980 -0.1373 0.6993*** 1
SUB_EDU2 0.0196 0.1634 -0.0980 -0.1373 1
*** Results significant at 5% significance level
This analysis informs us that depending on the measure of occupation mismatch we decide to use we
may end up with different information and measuring different things. Said differently, if we measure
occupation mismatch with the measure SKILL_LIT5, we can only draw conclusions on skill mismatch in
literacy (based on the distribution of skills in the population), while if we measure occupation mismatch
23
The Kendall correlation measures the strength of dependence between two variables.
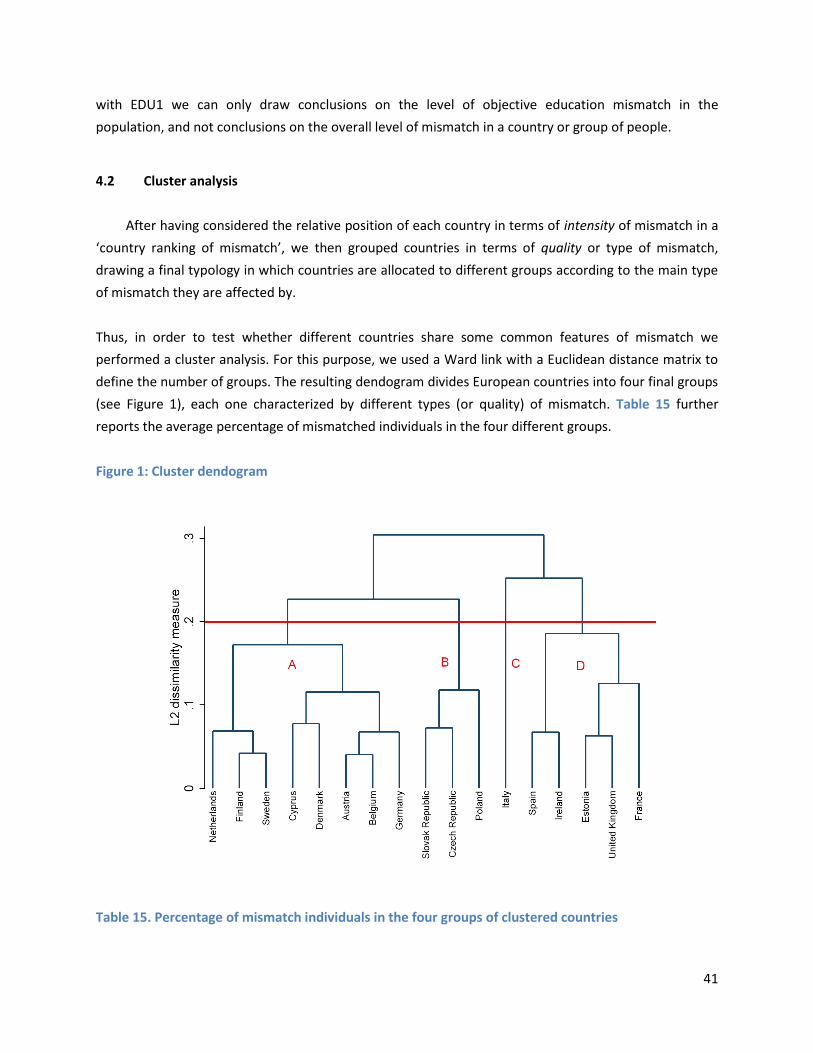
41
with EDU1 we can only draw conclusions on the level of objective education mismatch in the
population, and not conclusions on the overall level of mismatch in a country or group of people.
4.2 Cluster analysis
After having considered the relative position of each country in terms of intensity of mismatch in a
‘country ranking of mismatch’, we then grouped countries in terms of quality or type of mismatch,
drawing a final typology in which countries are allocated to different groups according to the main type
of mismatch they are affected by.
Thus, in order to test whether different countries share some common features of mismatch we
performed a cluster analysis. For this purpose, we used a Ward link with a Euclidean distance matrix to
define the number of groups. The resulting dendogram divides European countries into four final groups
(see Figure 1), each one characterized by different types (or quality) of mismatch. Table 15 further
reports the average percentage of mismatched individuals in the four different groups.
Figure 1: Cluster dendogram
Table 15. Percentage of mismatch individuals in the four groups of clustered countries
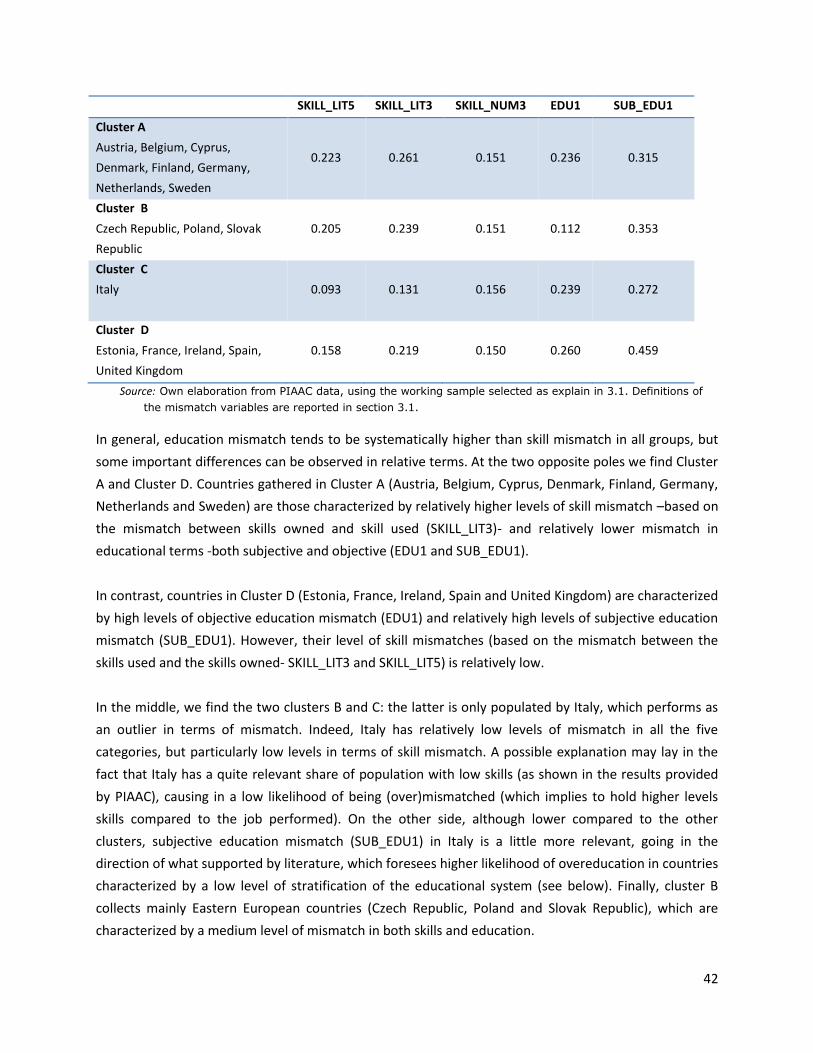
42
SKILL_LIT5 SKILL_LIT3 SKILL_NUM3 EDU1 SUB_EDU1
Cluster A
Austria, Belgium, Cyprus,
Denmark, Finland, Germany,
Netherlands, Sweden
0.223 0.261 0.151 0.236 0.315
Cluster B
Czech Republic, Poland, Slovak
Republic
0.205 0.239 0.151 0.112 0.353
Cluster C
Italy
0.093 0.131 0.156 0.239 0.272
Cluster D
Estonia, France, Ireland, Spain,
United Kingdom
0.158 0.219 0.150 0.260 0.459
Source: Own elaboration from PIAAC data, using the working sample selected as explain in 3.1. Definitions of
the mismatch variables are reported in section 3.1.
In general, education mismatch tends to be systematically higher than skill mismatch in all groups, but
some important differences can be observed in relative terms. At the two opposite poles we find Cluster
A and Cluster D. Countries gathered in Cluster A (Austria, Belgium, Cyprus, Denmark, Finland, Germany,
Netherlands and Sweden) are those characterized by relatively higher levels of skill mismatch –based on
the mismatch between skills owned and skill used (SKILL_LIT3)- and relatively lower mismatch in
educational terms -both subjective and objective (EDU1 and SUB_EDU1).
In contrast, countries in Cluster D (Estonia, France, Ireland, Spain and United Kingdom) are characterized
by high levels of objective education mismatch (EDU1) and relatively high levels of subjective education
mismatch (SUB_EDU1). However, their level of skill mismatches (based on the mismatch between the
skills used and the skills owned- SKILL_LIT3 and SKILL_LIT5) is relatively low.
In the middle, we find the two clusters B and C: the latter is only populated by Italy, which performs as
an outlier in terms of mismatch. Indeed, Italy has relatively low levels of mismatch in all the five
categories, but particularly low levels in terms of skill mismatch. A possible explanation may lay in the
fact that Italy has a quite relevant share of population with low skills (as shown in the results provided
by PIAAC), causing in a low likelihood of being (over)mismatched (which implies to hold higher levels
skills compared to the job performed). On the other side, although lower compared to the other
clusters, subjective education mismatch (SUB_EDU1) in Italy is a little more relevant, going in the
direction of what supported by literature, which foresees higher likelihood of overeducation in countries
characterized by a low level of stratification of the educational system (see below). Finally, cluster B
collects mainly Eastern European countries (Czech Republic, Poland and Slovak Republic), which are
characterized by a medium level of mismatch in both skills and education.
43
Results from the cluster analysis are generally consistent with literature. Indeed, the groups emerging
from our clustering roughly follow the traditional divide among educational systems made by
sociological literature, which classifies educational systems according to their level of standardization
and stratification (Allmendinger 1989). Standardization is defined as the level of homogeneity of the
educational system throughout the country: the higher the level of uniformity of curricula and teaching
methods across the country the higher the level of standardization. Stratification is defined according to
the level of internal differentiation of the system: the number of specific tracks (for example general,
academic and vocational) and the extent to which students can move from one to the others determine
the level of stratification. Typically, countries as Germany, Netherlands, Switzerland, Austria, and
Scandinavian countries are characterized by a high level of stratification (in our case corresponding to
cluster A), with a well-established track of vocational education both at secondary and tertiary level. On
the other side, Southern European countries and Ireland (in our case corresponding to cluster D) are
characterized by a low level of tracking and by more general training.
In this view the structure of the schooling systems plays a key role in shaping the occupational chances
of students: high levels of standardization and stratification provide better matching opportunities
between supply and demand on the labour market (Allmendinger 1989, Müller and Shavit 1998).
Generally, systems characterized by the presence of vocational tracks provide specific skills and clear
occupational profiles which are informative and familiar to employers, leading to better labour market
chances for vocational graduates. As a consequence, highly stratified systems are expected to suffer less
from overeducation than lowly stratified ones (Ortiz 2010).
As a matter of fact, Table 15 goes in the same direction of the literature, confirming a higher level of
overeducation in lowly stratified systems (cluster D). But the analysis goes even further, as said in the
Introduction section, due to lack of data on skills literature could only focus on qualifications, while here
we can show results also for skill mismatch.
Interestingly, the other side of the coin is that relatively low levels of overeducation correspond to high
levels of over-skilling. We might try to hypothesize two different reasons for this occurrence. First, it can
be interpreted it in light of the literature above mentioned. Although holding specific qualifications and
job-related skills is generally considered as a strength, it might also turn to be a weakness: specific skills
are not easily transferable among jobs (Müller and Shavit 1998), and it may become an issue when
employees have to deal with job transitions and rapid adjustments, ending up in a situation of over-
skilling.
The other hypothesis deals with a difference between the quality of skills taught at school and the actual
level of skills required by jobs. Countries belonging to cluster A are generally characterized by good or
44
very good levels of skill performances in PISA tests as well. We may guess that not all jobs require such a
high level of quality to all employees for actual everyday tasks, thus leading to a situation of over-
skilling. On the contrary, workers coming out from lowly stratified systems have less specific skills but
more often benefit of on-the-job training: this may give them task-specific skills which contribute to a
better match (at least at skill level).
4.3 Further identifying different typologies of occupational mismatch
A further step in our analysis is represented by the development of a typology of occupation
mismatch which is useful for providing an idea of the distribution and importance of mismatch in each
country. Thus, we came back to the level of the individual and observed in how many of our 5 measures
individuals resulted to be mismatched. However, since the two variables SKILL_NUM3 and SKILL_LIT3
showed to be highly correlated in the Kendal correlation exercise proving that they were measuring
basically the same, we decided to drop the former (SKILL_NUM3), in order to reduce the dimensions
considered and ease the calculation. Five groups were identified on the basis of the ‘intensity’ and ‘type’
of occupational mismatch (see Table 16 for further details). The characteristics of the groups are:
a) Matched: It refers to those individuals who are not mismatched in any of the four indicators
considered (i.e. not mismatched in either SKILL_LIT3, SKILL_LIT5, EDU1 or SUB_EDU1).
b) Severely mismatched: Individuals who are mismatched under at least 3 out of the 4 indicators
considered.
c) Skill mismatched: Individuals who are mismatched in dimensions associated to skills only (i.e.
mismatched under SKILL_LIT3 and/or SKILL_LIT5)
d) Education mismatched: Individuals who are only education mismatched (i.e. mismatched under
EDU1 and/or SUB_EDU1)
e) Mixed group: Individuals who are alternatively mismatched in one education dimension and in
one skill mismatch dimension.
Once we have grouped the individuals in the five groups, we then observed the distribution of the
groups in each country in such a way we can have an idea -per each country and per each country
compared to the others- of how strong the problem of mismatch is (i.e. how many severely mismatched
individuals there are) and which type of mismatch mostly affects a country.
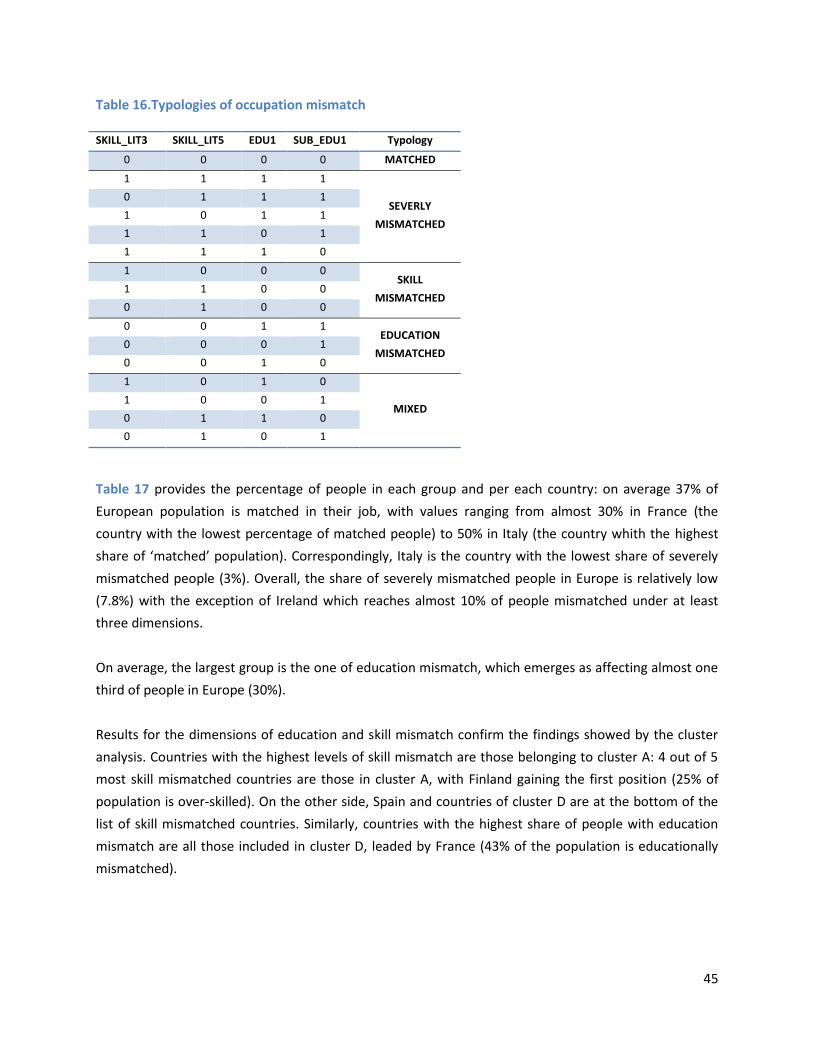
45
Table 16.Typologies of occupation mismatch
SKILL_LIT3 SKILL_LIT5 EDU1 SUB_EDU1 Typology
0 0 0 0 MATCHED
1 1 1 1
SEVERLY
MISMATCHED
0 1 1 1
1 0 1 1
1 1 0 1
1 1 1 0
1 0 0 0 SKILL
MISMATCHED 1 1 0 0
0 1 0 0
0 0 1 1 EDUCATION
MISMATCHED 0 0 0 1
0 0 1 0
1 0 1 0
MIXED 1 0 0 1
0 1 1 0
0 1 0 1
Table 17 provides the percentage of people in each group and per each country: on average 37% of
European population is matched in their job, with values ranging from almost 30% in France (the
country with the lowest percentage of matched people) to 50% in Italy (the country whith the highest
share of ‘matched’ population). Correspondingly, Italy is the country with the lowest share of severely
mismatched people (3%). Overall, the share of severely mismatched people in Europe is relatively low
(7.8%) with the exception of Ireland which reaches almost 10% of people mismatched under at least
three dimensions.
On average, the largest group is the one of education mismatch, which emerges as affecting almost one
third of people in Europe (30%).
Results for the dimensions of education and skill mismatch confirm the findings showed by the cluster
analysis. Countries with the highest levels of skill mismatch are those belonging to cluster A: 4 out of 5
most skill mismatched countries are those in cluster A, with Finland gaining the first position (25% of
population is over-skilled). On the other side, Spain and countries of cluster D are at the bottom of the
list of skill mismatched countries. Similarly, countries with the highest share of people with education
mismatch are all those included in cluster D, leaded by France (43% of the population is educationally
mismatched).
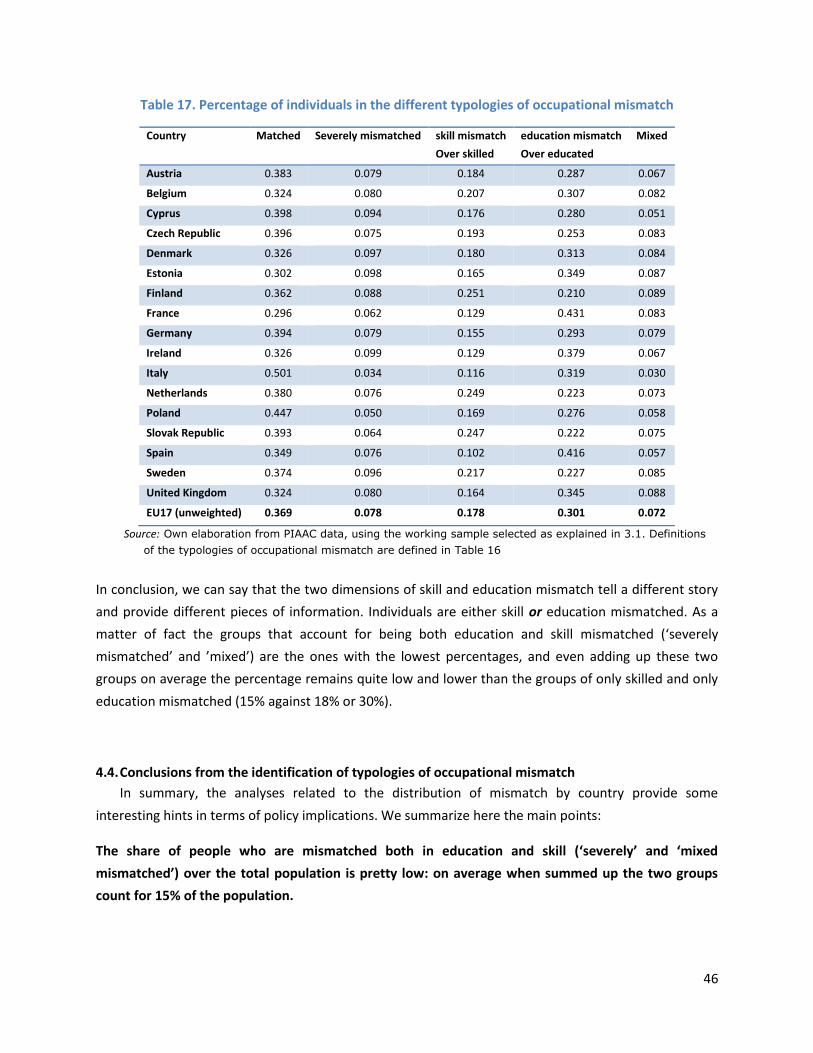
46
Table 17. Percentage of individuals in the different typologies of occupational mismatch
Country Matched Severely mismatched skill mismatch
Over skilled
education mismatch
Over educated
Mixed
Austria 0.383 0.079 0.184 0.287 0.067
Belgium 0.324 0.080 0.207 0.307 0.082
Cyprus 0.398 0.094 0.176 0.280 0.051
Czech Republic 0.396 0.075 0.193 0.253 0.083
Denmark 0.326 0.097 0.180 0.313 0.084
Estonia 0.302 0.098 0.165 0.349 0.087
Finland 0.362 0.088 0.251 0.210 0.089
France 0.296 0.062 0.129 0.431 0.083
Germany 0.394 0.079 0.155 0.293 0.079
Ireland 0.326 0.099 0.129 0.379 0.067
Italy 0.501 0.034 0.116 0.319 0.030
Netherlands 0.380 0.076 0.249 0.223 0.073
Poland 0.447 0.050 0.169 0.276 0.058
Slovak Republic 0.393 0.064 0.247 0.222 0.075
Spain 0.349 0.076 0.102 0.416 0.057
Sweden 0.374 0.096 0.217 0.227 0.085
United Kingdom 0.324 0.080 0.164 0.345 0.088
EU17 (unweighted) 0.369 0.078 0.178 0.301 0.072
Source: Own elaboration from PIAAC data, using the working sample selected as explained in 3.1. Definitions
of the typologies of occupational mismatch are defined in Table 16
In conclusion, we can say that the two dimensions of skill and education mismatch tell a different story
and provide different pieces of information. Individuals are either skill or education mismatched. As a
matter of fact the groups that account for being both education and skill mismatched (‘severely
mismatched’ and ’mixed’) are the ones with the lowest percentages, and even adding up these two
groups on average the percentage remains quite low and lower than the groups of only skilled and only
education mismatched (15% against 18% or 30%).
4.4. Conclusions from the identification of typologies of occupational mismatch
In summary, the analyses related to the distribution of mismatch by country provide some
interesting hints in terms of policy implications. We summarize here the main points:
The share of people who are mismatched both in education and skill (‘severely’ and ‘mixed
mismatched’) over the total population is pretty low: on average when summed up the two groups
count for 15% of the population.
47
This suggests that it is better not to focus on one single dimension only, since most of the population is
mismatched in either education or skills. If we only consider one dimension we refer to a fraction of the
population. As an example, if policies are addressed only to education mismatch we risk to miss the
segment of population which is skill mismatched and vice versa. Besides, due to the different
distribution of skill and education mismatch among European countries, policies focusing on one
dimension only risk to affect unevenly Member States (as an example, policies addressing education
mismatch will show different levels of involvement and different outcomes on country level according to
the pattern of mismatch which characterizes the country).
Education mismatch: According to our findings, there is a relevant part of the population which is
over-qualified (education mismatch) but not over-skilled (skill mismatch).
This means that they have a higher education level than what required by the job, but on the other side,
the skills they own are just enough to cope with it. This is an interesting finding, supporting the
hypothesis that educational qualification and skill level are not perfectly correlated: if this was the case
we should expect to have people educationally mismatched who is also skill mismatched and vice versa.
However, at least in some particular countries, it does not occur, and there is a segment of the
population who, despite a higher educational qualification, does not own extra skills under-exploited in
their current job.
In this case it seems that the educational system provides mainly general education, or at least does not
provide the type of education which enables people with the adequate level of skills required by the
labour market.
In this respect policies may intervene on the side of training, by providing more job-related skills to
people with medium-high educational level (those who are over-educated). Similar policies should go in
the direction of making the educational systems closer to the labour market, in particular in countries
where the system is less stratified and the education provided is general. It may go through a
modernization of curricula and teaching methods, with the aim of providing not any kind of knowledge,
but the kind of knowledge which can actually increase abilities and skills of students.
Skill mismatch: the other interesting group emerging from our analysis is the one made up by people
who are over-skilled (skill mismatched) but not over-educated.
This means that while they own the proper educational qualification, they also own more skills than
what required for the job they perform: their skills are not fully exploited. Interestingly, the highest
share of skill mismatched people is in the top performing countries in both in terms of educational
outcomes provided by PISA and in terms of skills outcomes provided by PIAAC (with the exception of the
48
Slovak Republic). Thus, already top performing countries also have the potential of improving their
relative position by benefitting of a reservoir of skills owned by their working age population.
In conclusion, whatever dimension mismatch implies, it always highlights some inefficiency of the
system. In the case of education mismatch the students/workers study too much or study a kind of
knowledge which is then not transferred in skills, and in the case of skill mismatch there is an
unexploited reservoir of skills. Problems may arise due to the fact that the distribution of mismatch
seems to draw a sort of ‘two-speed’ Europe in which typically best performing countries (in several
domains: education, economics, welfare) are also those affected by a ‘positive’ mismatch: they are
endowed with a reservoir of high level skills, which potentially can even further improve their
performances, activating a virtuous cycle. On the other side, education mismatch, which is the one
generating the most negative effects (lower productivity, psychological stress, …) not only is affecting a
larger share of population (compared to skill mismatch) but it also mainly affects countries which are
already low performers in education and economics (e.g. Spain, Ireland, Estonia).
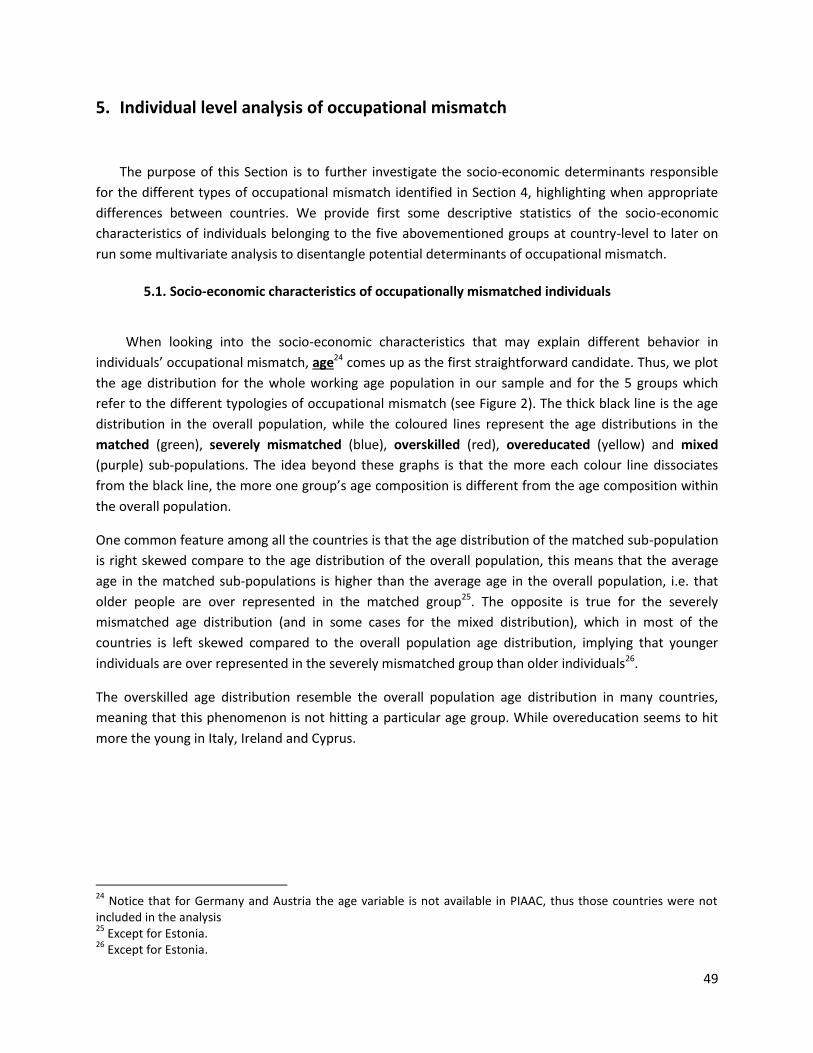
49
5. Individual level analysis of occupational mismatch
The purpose of this Section is to further investigate the socio-economic determinants responsible
for the different types of occupational mismatch identified in Section 4, highlighting when appropriate
differences between countries. We provide first some descriptive statistics of the socio-economic
characteristics of individuals belonging to the five abovementioned groups at country-level to later on
run some multivariate analysis to disentangle potential determinants of occupational mismatch.
5.1. Socio-economic characteristics of occupationally mismatched individuals
When looking into the socio-economic characteristics that may explain different behavior in
individuals’ occupational mismatch, age24 comes up as the first straightforward candidate. Thus, we plot
the age distribution for the whole working age population in our sample and for the 5 groups which
refer to the different typologies of occupational mismatch (see Figure 2). The thick black line is the age
distribution in the overall population, while the coloured lines represent the age distributions in the
matched (green), severely mismatched (blue), overskilled (red), overeducated (yellow) and mixed
(purple) sub-populations. The idea beyond these graphs is that the more each colour line dissociates
from the black line, the more one group’s age composition is different from the age composition within
the overall population.
One common feature among all the countries is that the age distribution of the matched sub-population
is right skewed compare to the age distribution of the overall population, this means that the average
age in the matched sub-populations is higher than the average age in the overall population, i.e. that
older people are over represented in the matched group25. The opposite is true for the severely
mismatched age distribution (and in some cases for the mixed distribution), which in most of the
countries is left skewed compared to the overall population age distribution, implying that younger
individuals are over represented in the severely mismatched group than older individuals26.
The overskilled age distribution resemble the overall population age distribution in many countries,
meaning that this phenomenon is not hitting a particular age group. While overeducation seems to hit
more the young in Italy, Ireland and Cyprus.
24
Notice that for Germany and Austria the age variable is not available in PIAAC, thus those countries were not included in the analysis 25
Except for Estonia. 26
Except for Estonia.
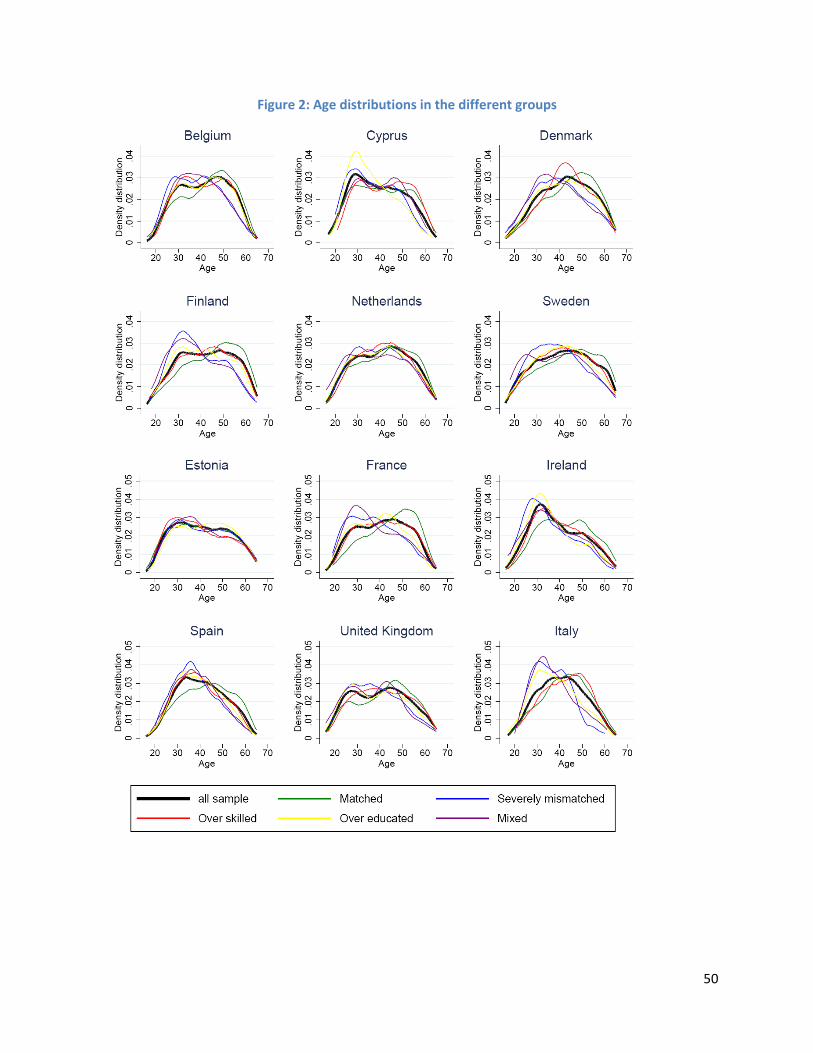
50
Figure 2: Age distributions in the different groups
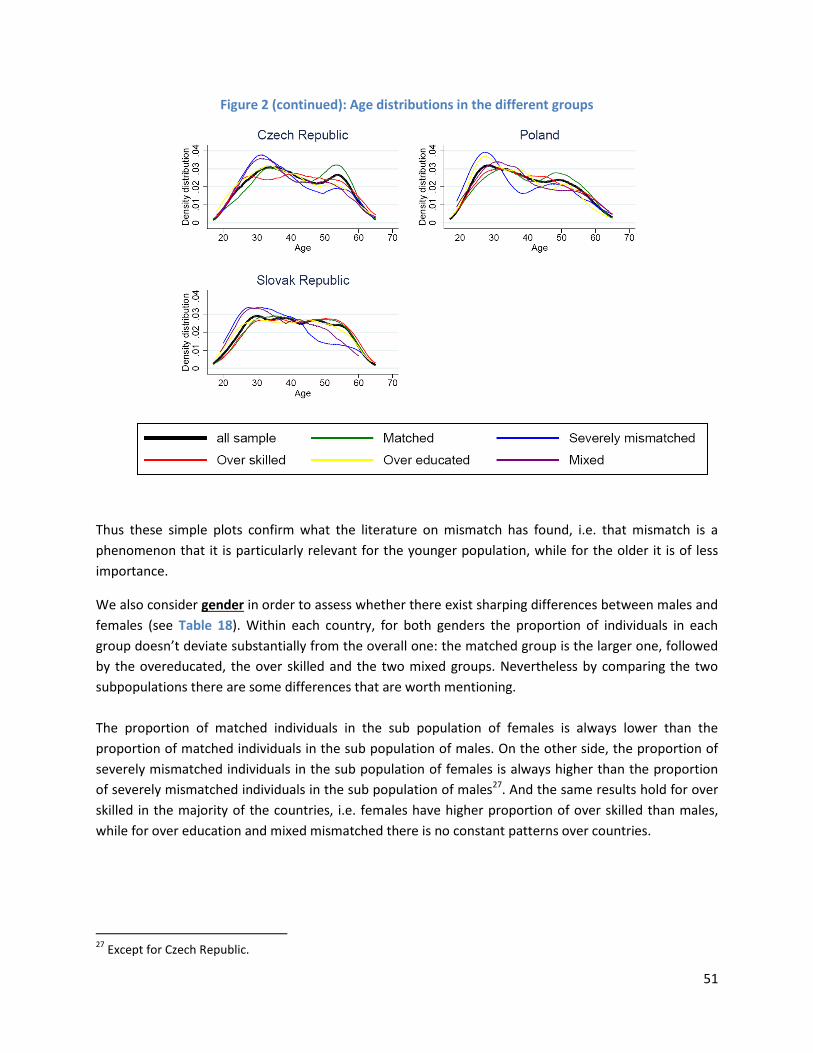
51
Figure 2 (continued): Age distributions in the different groups
Thus these simple plots confirm what the literature on mismatch has found, i.e. that mismatch is a
phenomenon that it is particularly relevant for the younger population, while for the older it is of less
importance.
We also consider gender in order to assess whether there exist sharping differences between males and
females (see Table 18). Within each country, for both genders the proportion of individuals in each
group doesn’t deviate substantially from the overall one: the matched group is the larger one, followed
by the overeducated, the over skilled and the two mixed groups. Nevertheless by comparing the two
subpopulations there are some differences that are worth mentioning.
The proportion of matched individuals in the sub population of females is always lower than the
proportion of matched individuals in the sub population of males. On the other side, the proportion of
severely mismatched individuals in the sub population of females is always higher than the proportion
of severely mismatched individuals in the sub population of males27. And the same results hold for over
skilled in the majority of the countries, i.e. females have higher proportion of over skilled than males,
while for over education and mixed mismatched there is no constant patterns over countries.
27
Except for Czech Republic.
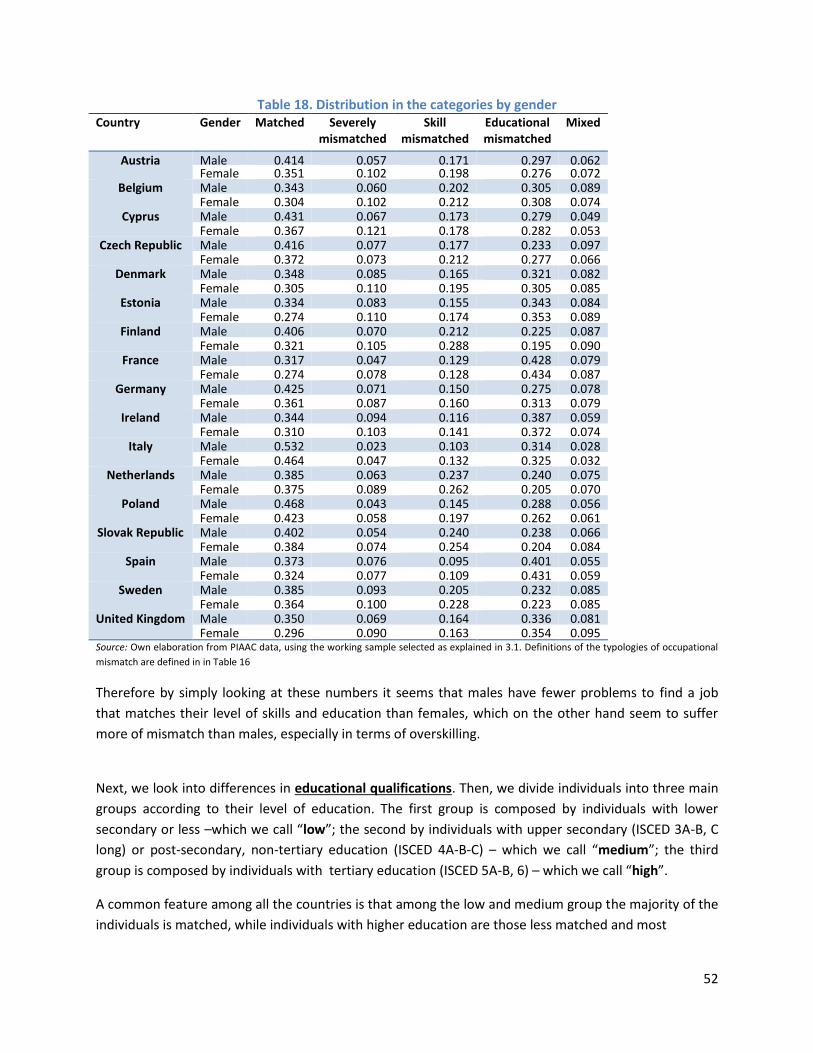
52
Table 18. Distribution in the categories by gender
Country Gender Matched Severely mismatched
Skill mismatched
Educational mismatched
Mixed
Austria Male 0.414 0.057 0.171 0.297 0.062 Female 0.351 0.102 0.198 0.276 0.072
Belgium Male 0.343 0.060 0.202 0.305 0.089 Female 0.304 0.102 0.212 0.308 0.074
Cyprus Male 0.431 0.067 0.173 0.279 0.049 Female 0.367 0.121 0.178 0.282 0.053
Czech Republic Male 0.416 0.077 0.177 0.233 0.097 Female 0.372 0.073 0.212 0.277 0.066
Denmark Male 0.348 0.085 0.165 0.321 0.082 Female 0.305 0.110 0.195 0.305 0.085
Estonia Male 0.334 0.083 0.155 0.343 0.084 Female 0.274 0.110 0.174 0.353 0.089
Finland Male 0.406 0.070 0.212 0.225 0.087 Female 0.321 0.105 0.288 0.195 0.090
France Male 0.317 0.047 0.129 0.428 0.079 Female 0.274 0.078 0.128 0.434 0.087
Germany Male 0.425 0.071 0.150 0.275 0.078 Female 0.361 0.087 0.160 0.313 0.079
Ireland Male 0.344 0.094 0.116 0.387 0.059 Female 0.310 0.103 0.141 0.372 0.074
Italy Male 0.532 0.023 0.103 0.314 0.028 Female 0.464 0.047 0.132 0.325 0.032
Netherlands Male 0.385 0.063 0.237 0.240 0.075 Female 0.375 0.089 0.262 0.205 0.070
Poland Male 0.468 0.043 0.145 0.288 0.056 Female 0.423 0.058 0.197 0.262 0.061
Slovak Republic Male 0.402 0.054 0.240 0.238 0.066 Female 0.384 0.074 0.254 0.204 0.084
Spain Male 0.373 0.076 0.095 0.401 0.055 Female 0.324 0.077 0.109 0.431 0.059
Sweden Male 0.385 0.093 0.205 0.232 0.085 Female 0.364 0.100 0.228 0.223 0.085
United Kingdom Male 0.350 0.069 0.164 0.336 0.081 Female 0.296 0.090 0.163 0.354 0.095
Source: Own elaboration from PIAAC data, using the working sample selected as explained in 3.1. Definitions of the typologies of occupational
mismatch are defined in in Table 16
Therefore by simply looking at these numbers it seems that males have fewer problems to find a job
that matches their level of skills and education than females, which on the other hand seem to suffer
more of mismatch than males, especially in terms of overskilling.
Next, we look into differences in educational qualifications. Then, we divide individuals into three main
groups according to their level of education. The first group is composed by individuals with lower
secondary or less –which we call “low”; the second by individuals with upper secondary (ISCED 3A-B, C
long) or post-secondary, non-tertiary education (ISCED 4A-B-C) – which we call “medium”; the third
group is composed by individuals with tertiary education (ISCED 5A-B, 6) – which we call “high”.
A common feature among all the countries is that among the low and medium group the majority of the
individuals is matched, while individuals with higher education are those less matched and most
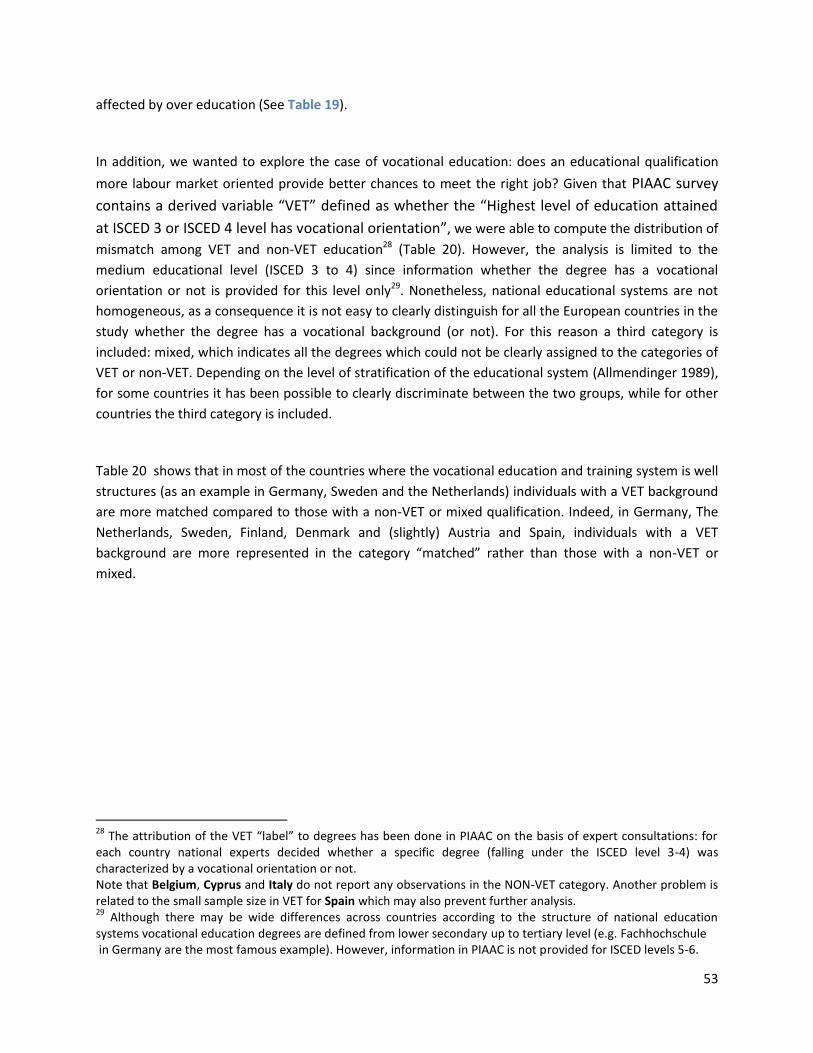
53
affected by over education (See Table 19).
In addition, we wanted to explore the case of vocational education: does an educational qualification
more labour market oriented provide better chances to meet the right job? Given that PIAAC survey
contains a derived variable “VET” defined as whether the “Highest level of education attained
at ISCED 3 or ISCED 4 level has vocational orientation”, we were able to compute the distribution of
mismatch among VET and non-VET education28 (Table 20). However, the analysis is limited to the
medium educational level (ISCED 3 to 4) since information whether the degree has a vocational
orientation or not is provided for this level only29. Nonetheless, national educational systems are not
homogeneous, as a consequence it is not easy to clearly distinguish for all the European countries in the
study whether the degree has a vocational background (or not). For this reason a third category is
included: mixed, which indicates all the degrees which could not be clearly assigned to the categories of
VET or non-VET. Depending on the level of stratification of the educational system (Allmendinger 1989),
for some countries it has been possible to clearly discriminate between the two groups, while for other
countries the third category is included.
Table 20 shows that in most of the countries where the vocational education and training system is well
structures (as an example in Germany, Sweden and the Netherlands) individuals with a VET background
are more matched compared to those with a non-VET or mixed qualification. Indeed, in Germany, The
Netherlands, Sweden, Finland, Denmark and (slightly) Austria and Spain, individuals with a VET
background are more represented in the category “matched” rather than those with a non-VET or
mixed.
28
The attribution of the VET “label” to degrees has been done in PIAAC on the basis of expert consultations: for each country national experts decided whether a specific degree (falling under the ISCED level 3-4) was characterized by a vocational orientation or not. Note that Belgium, Cyprus and Italy do not report any observations in the NON-VET category. Another problem is related to the small sample size in VET for Spain which may also prevent further analysis. 29
Although there may be wide differences across countries according to the structure of national education systems vocational education degrees are defined from lower secondary up to tertiary level (e.g. Fachhochschule in Germany are the most famous example). However, information in PIAAC is not provided for ISCED levels 5-6.
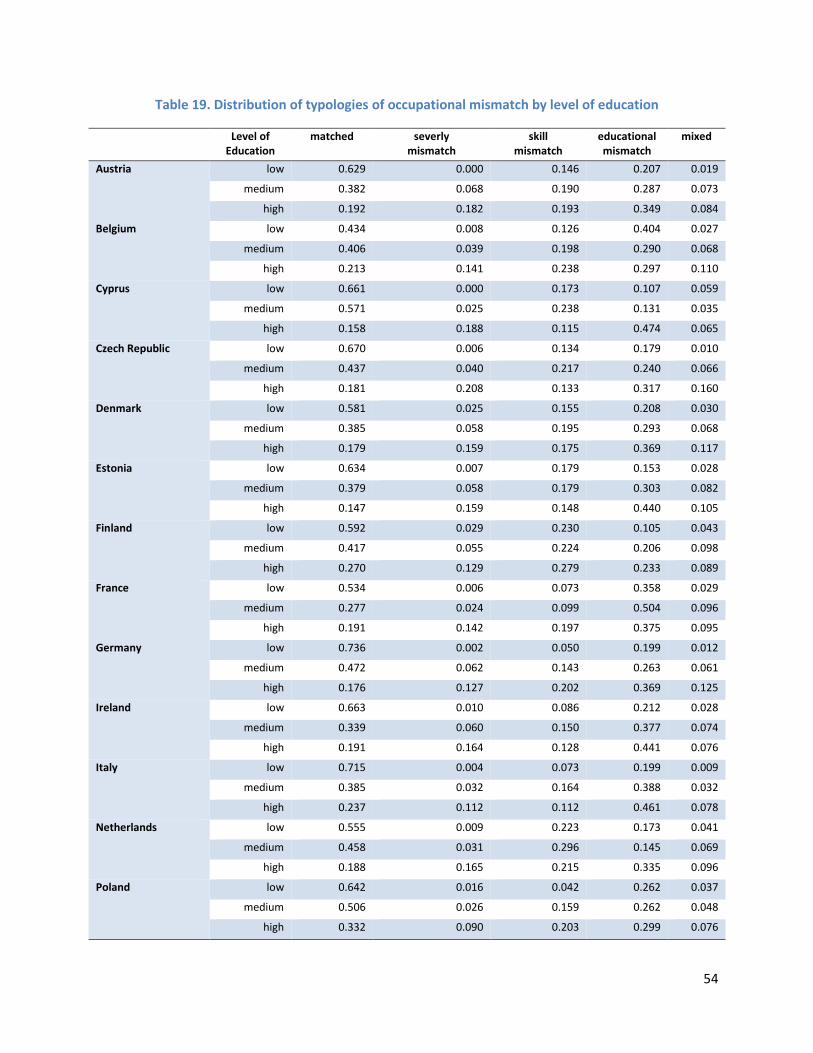
54
Table 19. Distribution of typologies of occupational mismatch by level of education
Level of Education
matched severly mismatch
skill mismatch
educational mismatch
mixed
Austria low 0.629 0.000 0.146 0.207 0.019
medium 0.382 0.068 0.190 0.287 0.073
high 0.192 0.182 0.193 0.349 0.084
Belgium low 0.434 0.008 0.126 0.404 0.027
medium 0.406 0.039 0.198 0.290 0.068
high 0.213 0.141 0.238 0.297 0.110
Cyprus low 0.661 0.000 0.173 0.107 0.059
medium 0.571 0.025 0.238 0.131 0.035
high 0.158 0.188 0.115 0.474 0.065
Czech Republic low 0.670 0.006 0.134 0.179 0.010
medium 0.437 0.040 0.217 0.240 0.066
high 0.181 0.208 0.133 0.317 0.160
Denmark low 0.581 0.025 0.155 0.208 0.030
medium 0.385 0.058 0.195 0.293 0.068
high 0.179 0.159 0.175 0.369 0.117
Estonia low 0.634 0.007 0.179 0.153 0.028
medium 0.379 0.058 0.179 0.303 0.082
high 0.147 0.159 0.148 0.440 0.105
Finland low 0.592 0.029 0.230 0.105 0.043
medium 0.417 0.055 0.224 0.206 0.098
high 0.270 0.129 0.279 0.233 0.089
France low 0.534 0.006 0.073 0.358 0.029
medium 0.277 0.024 0.099 0.504 0.096
high 0.191 0.142 0.197 0.375 0.095
Germany low 0.736 0.002 0.050 0.199 0.012
medium 0.472 0.062 0.143 0.263 0.061
high 0.176 0.127 0.202 0.369 0.125
Ireland low 0.663 0.010 0.086 0.212 0.028
medium 0.339 0.060 0.150 0.377 0.074
high 0.191 0.164 0.128 0.441 0.076
Italy low 0.715 0.004 0.073 0.199 0.009
medium 0.385 0.032 0.164 0.388 0.032
high 0.237 0.112 0.112 0.461 0.078
Netherlands low 0.555 0.009 0.223 0.173 0.041
medium 0.458 0.031 0.296 0.145 0.069
high 0.188 0.165 0.215 0.335 0.096
Poland low 0.642 0.016 0.042 0.262 0.037
medium 0.506 0.026 0.159 0.262 0.048
high 0.332 0.090 0.203 0.299 0.076
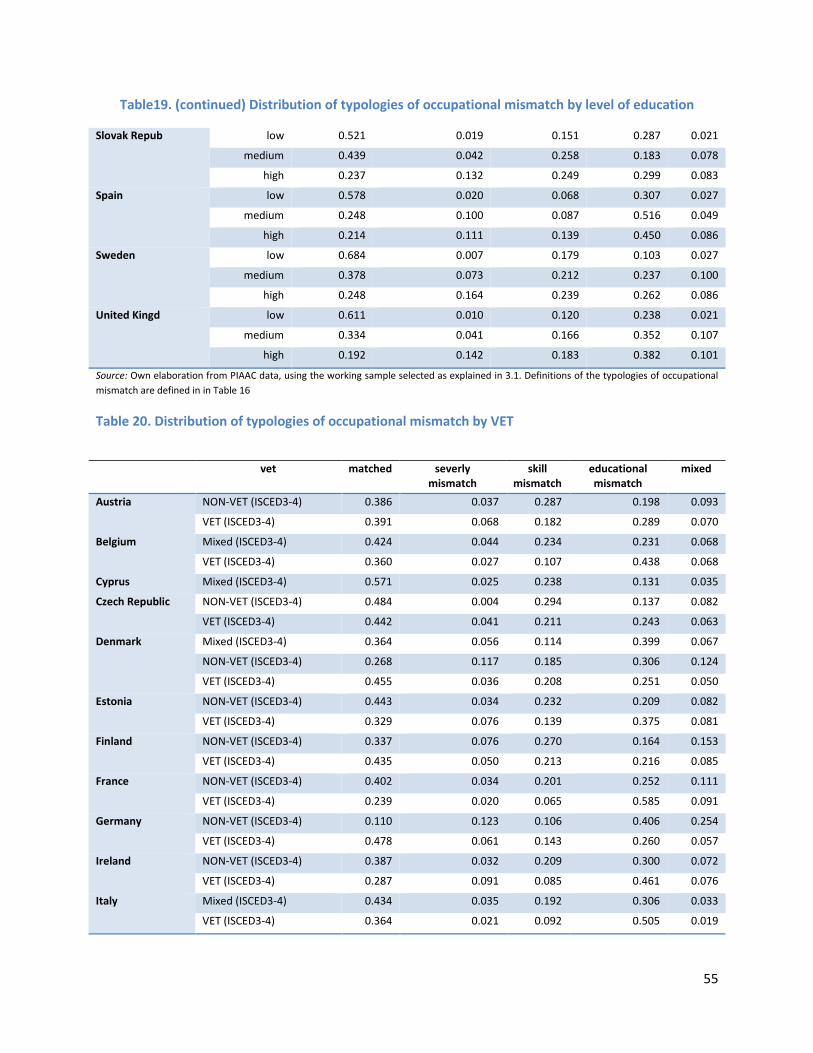
55
Table19. (continued) Distribution of typologies of occupational mismatch by level of education
Slovak Repub low 0.521 0.019 0.151 0.287 0.021
medium 0.439 0.042 0.258 0.183 0.078
high 0.237 0.132 0.249 0.299 0.083
Spain low 0.578 0.020 0.068 0.307 0.027
medium 0.248 0.100 0.087 0.516 0.049
high 0.214 0.111 0.139 0.450 0.086
Sweden low 0.684 0.007 0.179 0.103 0.027
medium 0.378 0.073 0.212 0.237 0.100
high 0.248 0.164 0.239 0.262 0.086
United Kingd low 0.611 0.010 0.120 0.238 0.021
medium 0.334 0.041 0.166 0.352 0.107
high 0.192 0.142 0.183 0.382 0.101
Source: Own elaboration from PIAAC data, using the working sample selected as explained in 3.1. Definitions of the typologies of occupational
mismatch are defined in in Table 16
Table 20. Distribution of typologies of occupational mismatch by VET
vet matched severly mismatch
skill mismatch
educational mismatch
mixed
Austria NON-VET (ISCED3-4) 0.386 0.037 0.287 0.198 0.093
VET (ISCED3-4) 0.391 0.068 0.182 0.289 0.070
Belgium Mixed (ISCED3-4) 0.424 0.044 0.234 0.231 0.068
VET (ISCED3-4) 0.360 0.027 0.107 0.438 0.068
Cyprus Mixed (ISCED3-4) 0.571 0.025 0.238 0.131 0.035
Czech Republic NON-VET (ISCED3-4) 0.484 0.004 0.294 0.137 0.082
VET (ISCED3-4) 0.442 0.041 0.211 0.243 0.063
Denmark Mixed (ISCED3-4) 0.364 0.056 0.114 0.399 0.067
NON-VET (ISCED3-4) 0.268 0.117 0.185 0.306 0.124
VET (ISCED3-4) 0.455 0.036 0.208 0.251 0.050
Estonia NON-VET (ISCED3-4) 0.443 0.034 0.232 0.209 0.082
VET (ISCED3-4) 0.329 0.076 0.139 0.375 0.081
Finland NON-VET (ISCED3-4) 0.337 0.076 0.270 0.164 0.153
VET (ISCED3-4) 0.435 0.050 0.213 0.216 0.085
France NON-VET (ISCED3-4) 0.402 0.034 0.201 0.252 0.111
VET (ISCED3-4) 0.239 0.020 0.065 0.585 0.091
Germany NON-VET (ISCED3-4) 0.110 0.123 0.106 0.406 0.254
VET (ISCED3-4) 0.478 0.061 0.143 0.260 0.057
Ireland NON-VET (ISCED3-4) 0.387 0.032 0.209 0.300 0.072
VET (ISCED3-4) 0.287 0.091 0.085 0.461 0.076
Italy Mixed (ISCED3-4) 0.434 0.035 0.192 0.306 0.033
VET (ISCED3-4) 0.364 0.021 0.092 0.505 0.019
56
Table 20. (continued) Distribution of typologies of occupational mismatch by VET
Netherlands NON-VET (ISCED3-4) 0.311 0.083 0.404 0.117 0.085
VET (ISCED3-4) 0.500 0.016 0.266 0.153 0.065
Poland NON-VET (ISCED3-4) 0.493 0.020 0.222 0.191 0.075
VET (ISCED3-4) 0.508 0.027 0.148 0.275 0.043
Slovak Repub NON-VET (ISCED3-4) 0.469 0.043 0.292 0.129 0.067
VET (ISCED3-4) 0.419 0.038 0.207 0.251 0.084
Spain NON-VET (ISCED3-4) 0.251 0.107 0.092 0.500 0.049
VET (ISCED3-4) 0.287 0.057 0.053 0.564 0.039
Sweden Mixed (ISCED3-4) 0.384 0.105 0.143 0.271 0.096
NON-VET (ISCED3-4) 0.344 0.082 0.224 0.263 0.086
VET (ISCED3-4) 0.457 0.041 0.224 0.176 0.101
United Kingd Mixed (ISCED3-4) 0.401 0.022 0.117 0.376 0.084
NON-VET (ISCED3-4) 0.338 0.044 0.191 0.335 0.092
VET (ISCED3-4) 0.390 0.032 0.168 0.312 0.097
Source: Own elaboration from PIAAC data, using the working sample selected as explained in 3.1. Definitions of the typologies of occupational
mismatch defined in in Table 16
While for the low educated individuals the proportion of matched can be as high as 70 % (e.g. Italy), for
the professional and high the numbers are much lower (between 6 and 45%). This finding is expected in
the sense that the lower is the educational level the higher are the chances of not being mismatched, at
least educationally speaking (keep in mind that we defined mismatch as over educated or over skilled).
We further observe, as expected, how countries with a tradition of vocational tracks such as Austria,
Germany, the Netherlands and even the UK have a significantly smaller proportion of professionals skill
mismatched only than highly educated skill mismatched, which somehow reassure the importance of
having the proper skills.
Lastly, before going into any type of multivariate analysis, in Table 21 we divided individuals into four
main groups according to their occupations, distinguishing between:
- Skilled occupations, including e.g. legislators, senior officials and managers; professionals;
technicians and associate professionals (ISCO 1 digit 1, 2 and 3);
- Semi-skilled white collar occupations, including e.g. clerks; service workers and shop and market
sales workers (ISCO 1 digit 4 and 5);
- Semi-skilled blue collar occupations, including e.g. skilled agricultural and fishery workers; craft and
related trades workers; plant and machine operators and assemblers (ISCO 1 digit 6, 7 and 8 );
- Unskilled (or elementary) occupations, including e.g. labourers (ISCO 1 digit 9).
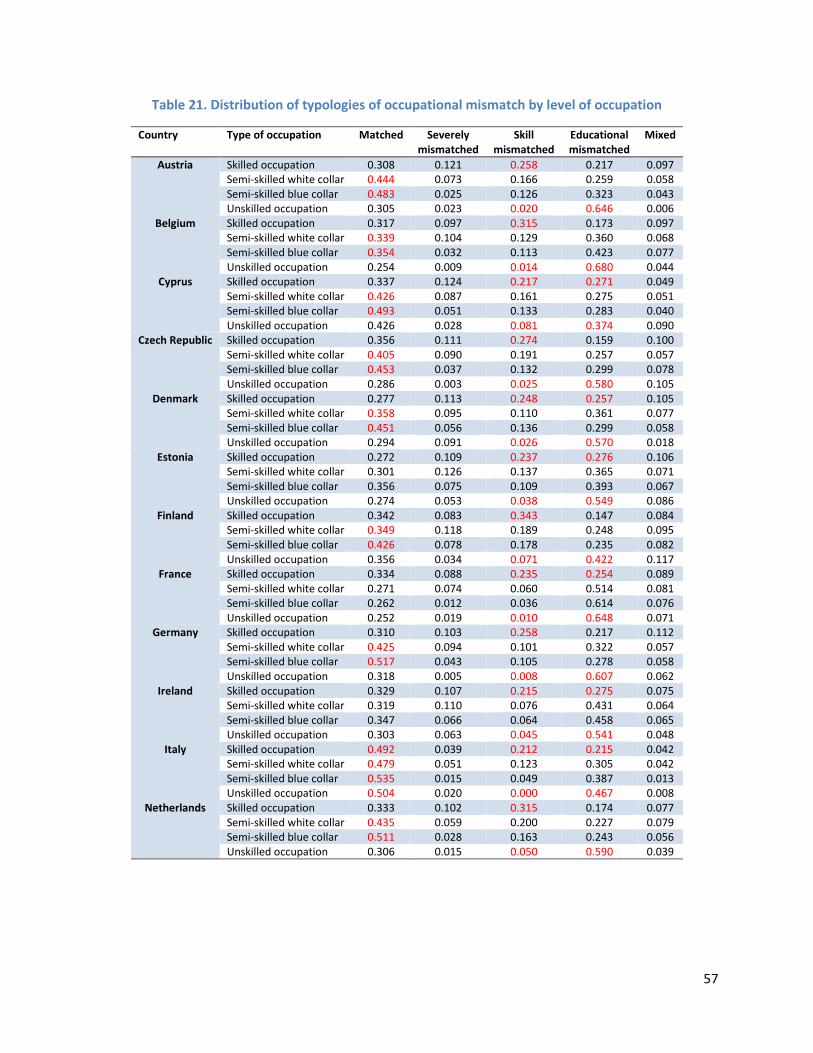
57
Table 21. Distribution of typologies of occupational mismatch by level of occupation
Country Type of occupation Matched Severely mismatched
Skill mismatched
Educational mismatched
Mixed
Austria Skilled occupation 0.308 0.121 0.258 0.217 0.097 Semi-skilled white collar 0.444 0.073 0.166 0.259 0.058 Semi-skilled blue collar 0.483 0.025 0.126 0.323 0.043 Unskilled occupation 0.305 0.023 0.020 0.646 0.006
Belgium Skilled occupation 0.317 0.097 0.315 0.173 0.097 Semi-skilled white collar 0.339 0.104 0.129 0.360 0.068 Semi-skilled blue collar 0.354 0.032 0.113 0.423 0.077 Unskilled occupation 0.254 0.009 0.014 0.680 0.044
Cyprus Skilled occupation 0.337 0.124 0.217 0.271 0.049 Semi-skilled white collar 0.426 0.087 0.161 0.275 0.051 Semi-skilled blue collar 0.493 0.051 0.133 0.283 0.040 Unskilled occupation 0.426 0.028 0.081 0.374 0.090
Czech Republic Skilled occupation 0.356 0.111 0.274 0.159 0.100 Semi-skilled white collar 0.405 0.090 0.191 0.257 0.057 Semi-skilled blue collar 0.453 0.037 0.132 0.299 0.078 Unskilled occupation 0.286 0.003 0.025 0.580 0.105
Denmark Skilled occupation 0.277 0.113 0.248 0.257 0.105 Semi-skilled white collar 0.358 0.095 0.110 0.361 0.077 Semi-skilled blue collar 0.451 0.056 0.136 0.299 0.058 Unskilled occupation 0.294 0.091 0.026 0.570 0.018
Estonia Skilled occupation 0.272 0.109 0.237 0.276 0.106 Semi-skilled white collar 0.301 0.126 0.137 0.365 0.071 Semi-skilled blue collar 0.356 0.075 0.109 0.393 0.067 Unskilled occupation 0.274 0.053 0.038 0.549 0.086
Finland Skilled occupation 0.342 0.083 0.343 0.147 0.084 Semi-skilled white collar 0.349 0.118 0.189 0.248 0.095 Semi-skilled blue collar 0.426 0.078 0.178 0.235 0.082 Unskilled occupation 0.356 0.034 0.071 0.422 0.117
France Skilled occupation 0.334 0.088 0.235 0.254 0.089 Semi-skilled white collar 0.271 0.074 0.060 0.514 0.081 Semi-skilled blue collar 0.262 0.012 0.036 0.614 0.076 Unskilled occupation 0.252 0.019 0.010 0.648 0.071
Germany Skilled occupation 0.310 0.103 0.258 0.217 0.112 Semi-skilled white collar 0.425 0.094 0.101 0.322 0.057 Semi-skilled blue collar 0.517 0.043 0.105 0.278 0.058 Unskilled occupation 0.318 0.005 0.008 0.607 0.062
Ireland Skilled occupation 0.329 0.107 0.215 0.275 0.075 Semi-skilled white collar 0.319 0.110 0.076 0.431 0.064 Semi-skilled blue collar 0.347 0.066 0.064 0.458 0.065 Unskilled occupation 0.303 0.063 0.045 0.541 0.048
Italy Skilled occupation 0.492 0.039 0.212 0.215 0.042 Semi-skilled white collar 0.479 0.051 0.123 0.305 0.042 Semi-skilled blue collar 0.535 0.015 0.049 0.387 0.013 Unskilled occupation 0.504 0.020 0.000 0.467 0.008
Netherlands Skilled occupation 0.333 0.102 0.315 0.174 0.077 Semi-skilled white collar 0.435 0.059 0.200 0.227 0.079 Semi-skilled blue collar 0.511 0.028 0.163 0.243 0.056 Unskilled occupation 0.306 0.015 0.050 0.590 0.039
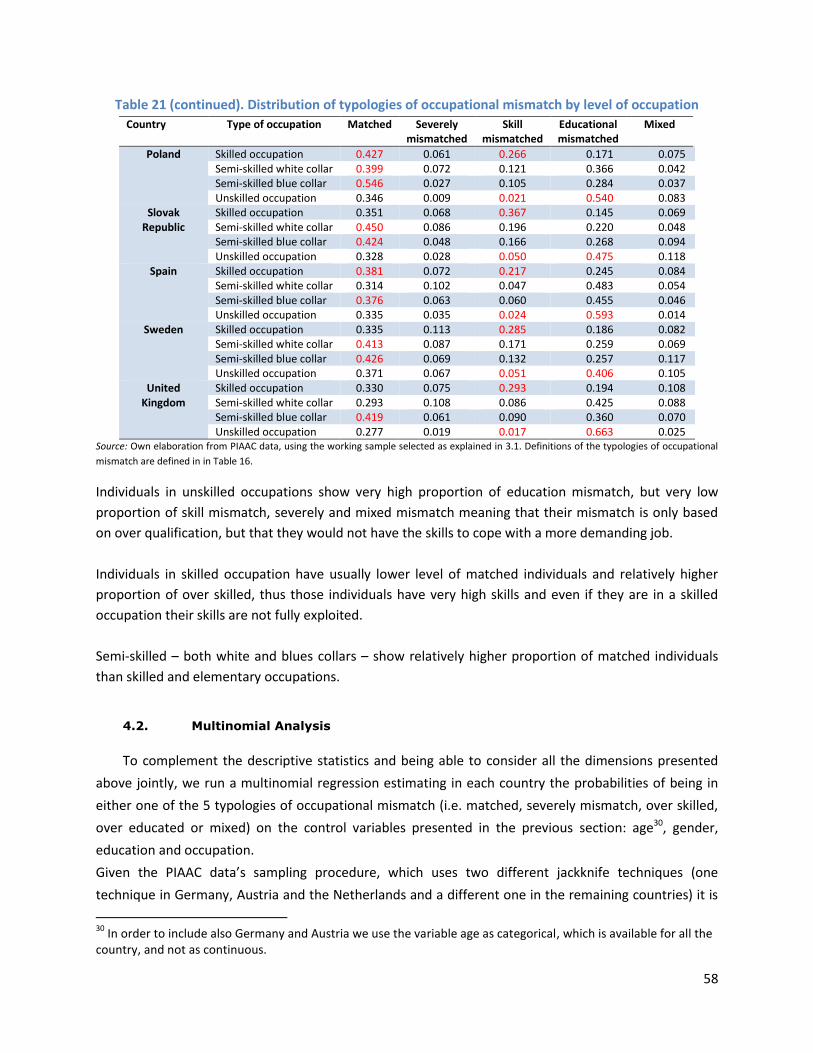
58
Table 21 (continued). Distribution of typologies of occupational mismatch by level of occupation
Country Type of occupation Matched Severely mismatched
Skill mismatched
Educational mismatched
Mixed
Poland Skilled occupation 0.427 0.061 0.266 0.171 0.075 Semi-skilled white collar 0.399 0.072 0.121 0.366 0.042 Semi-skilled blue collar 0.546 0.027 0.105 0.284 0.037 Unskilled occupation 0.346 0.009 0.021 0.540 0.083
Slovak Republic
Skilled occupation 0.351 0.068 0.367 0.145 0.069 Semi-skilled white collar 0.450 0.086 0.196 0.220 0.048 Semi-skilled blue collar 0.424 0.048 0.166 0.268 0.094 Unskilled occupation 0.328 0.028 0.050 0.475 0.118
Spain Skilled occupation 0.381 0.072 0.217 0.245 0.084 Semi-skilled white collar 0.314 0.102 0.047 0.483 0.054 Semi-skilled blue collar 0.376 0.063 0.060 0.455 0.046 Unskilled occupation 0.335 0.035 0.024 0.593 0.014
Sweden Skilled occupation 0.335 0.113 0.285 0.186 0.082 Semi-skilled white collar 0.413 0.087 0.171 0.259 0.069 Semi-skilled blue collar 0.426 0.069 0.132 0.257 0.117 Unskilled occupation 0.371 0.067 0.051 0.406 0.105
United Kingdom
Skilled occupation 0.330 0.075 0.293 0.194 0.108 Semi-skilled white collar 0.293 0.108 0.086 0.425 0.088 Semi-skilled blue collar 0.419 0.061 0.090 0.360 0.070 Unskilled occupation 0.277 0.019 0.017 0.663 0.025
Source: Own elaboration from PIAAC data, using the working sample selected as explained in 3.1. Definitions of the typologies of occupational
mismatch are defined in in Table 16.
Individuals in unskilled occupations show very high proportion of education mismatch, but very low
proportion of skill mismatch, severely and mixed mismatch meaning that their mismatch is only based
on over qualification, but that they would not have the skills to cope with a more demanding job.
Individuals in skilled occupation have usually lower level of matched individuals and relatively higher
proportion of over skilled, thus those individuals have very high skills and even if they are in a skilled
occupation their skills are not fully exploited.
Semi-skilled – both white and blues collars – show relatively higher proportion of matched individuals
than skilled and elementary occupations.
4.2. Multinomial Analysis
To complement the descriptive statistics and being able to consider all the dimensions presented
above jointly, we run a multinomial regression estimating in each country the probabilities of being in
either one of the 5 typologies of occupational mismatch (i.e. matched, severely mismatch, over skilled,
over educated or mixed) on the control variables presented in the previous section: age30, gender,
education and occupation.
Given the PIAAC data’s sampling procedure, which uses two different jackknife techniques (one
technique in Germany, Austria and the Netherlands and a different one in the remaining countries) it is
30
In order to include also Germany and Austria we use the variable age as categorical, which is available for all the country, and not as continuous.
59
not possible to estimate this regression pooling all the countries together, therefore we run it by
country31. For the computation of standards errors we follow the procedure required by the PIAAC data,
using the 80 replicates.
We run the multinomial using as baseline category the matched one, thus results presented in the table
are to be interpreted as the likelihood of being in either one of the remaining four mismatch categories,
compared to being matched.
As for the control variables, reference categories were: male, low education, age group 35-44 and
unskilled occupation.
Results (see Table 22) show that females are more likely than males to be severely mismatched and over
skilled rather than matched in most countries; while no clear gender pattern exists for over education:
females are more likely than males to be overeducated rather than matched in BE, CZ, FR, SK, ES, UK, DE
and IT while females are less likely than males to be overeducated in DK, EE, FI, EI, NL, SE, AT, CY32.
As for education, all countries show a similar pattern: having a higher level of education implies higher
probability of being over educated, over skilled, severely mismatch and mixed mismatched rather than
matched.
While for age, in all countries older age category implies lower probability of being severely mismatched
rather than matched, regarding over education common results are found for older age groups, since in
almost all countries age groups 55+ and 45-54 have lower probabilities of begin overeducated than age
group 35-44. But for younger age groups, there are some relevant difference by country: age group 25-
34 is less likely to overeducated than age group 35-44 in AT, SE and DK, but more likely in the remaining
countries and age group <25 is less likely to be overeducated than age group 35-44 in BG, EE, PL, ES, SE,
DE, but more likely in the remaining countries. As for the probability of being over skilled, in almost all
countries age groups 55+ and 45-54 have lower probability of begin over skilled than age group 35-44;
age group 25-34 is less likely to be over skilled than age group 35-44 in DK, NL, PL, AT, DE, IT; age group
<25 is less likely to be over skilled than age group 35-44 in BG, NL, UK, CY, DE
Finally for occupation we find again a similar pattern across all the countries, finding that the higher the
skill of the occupation the higher the probability of being severely mismatch rather than matched; the
higher the skill of the occupation the higher the probability of being over skilled rather than matched,
but the higher the skill of the occupation the lower the probability of being overeducated rather than
matched.
31
It would be eventually possible to run it pooling the countries sharing the same technique. 32
We use country codes in this section for gaining a clearer picture of the results accross countries.
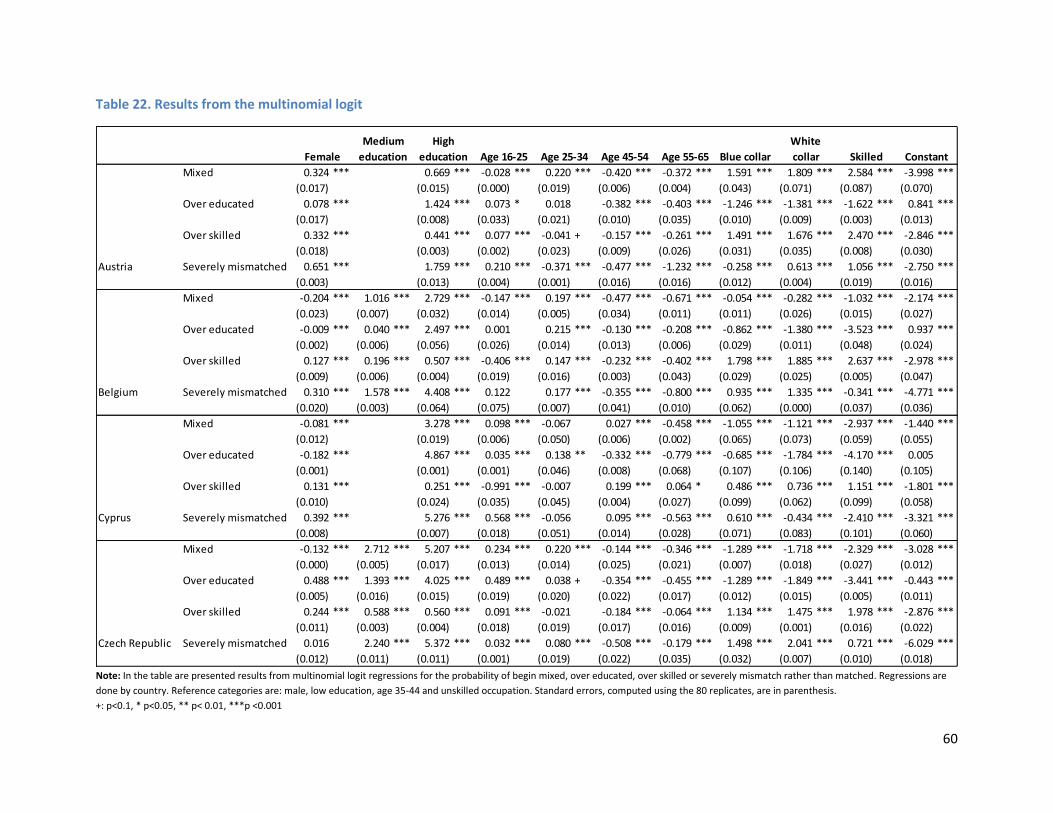
60
Table 22. Results from the multinomial logit
Note: In the table are presented results from multinomial logit regressions for the probability of begin mixed, over educated, over skilled or severely mismatch rather than matched. Regressions are
done by country. Reference categories are: male, low education, age 35-44 and unskilled occupation. Standard errors, computed using the 80 replicates, are in parenthesis.
+: p<0.1, * p<0.05, ** p< 0.01, ***p <0.001
Mixed 0.324 *** 0.669 *** -0.028 *** 0.220 *** -0.420 *** -0.372 *** 1.591 *** 1.809 *** 2.584 *** -3.998 ***
(0.017) (0.015) (0.000) (0.019) (0.006) (0.004) (0.043) (0.071) (0.087) (0.070)
Over educated 0.078 *** 1.424 *** 0.073 * 0.018 -0.382 *** -0.403 *** -1.246 *** -1.381 *** -1.622 *** 0.841 ***
(0.017) (0.008) (0.033) (0.021) (0.010) (0.035) (0.010) (0.009) (0.003) (0.013)
Over skilled 0.332 *** 0.441 *** 0.077 *** -0.041 + -0.157 *** -0.261 *** 1.491 *** 1.676 *** 2.470 *** -2.846 ***
(0.018) (0.003) (0.002) (0.023) (0.009) (0.026) (0.031) (0.035) (0.008) (0.030)
Austria Severely mismatched 0.651 *** 1.759 *** 0.210 *** -0.371 *** -0.477 *** -1.232 *** -0.258 *** 0.613 *** 1.056 *** -2.750 ***
(0.003) (0.013) (0.004) (0.001) (0.016) (0.016) (0.012) (0.004) (0.019) (0.016)
Mixed -0.204 *** 1.016 *** 2.729 *** -0.147 *** 0.197 *** -0.477 *** -0.671 *** -0.054 *** -0.282 *** -1.032 *** -2.174 ***
(0.023) (0.007) (0.032) (0.014) (0.005) (0.034) (0.011) (0.011) (0.026) (0.015) (0.027)
Over educated -0.009 *** 0.040 *** 2.497 *** 0.001 0.215 *** -0.130 *** -0.208 *** -0.862 *** -1.380 *** -3.523 *** 0.937 ***
(0.002) (0.006) (0.056) (0.026) (0.014) (0.013) (0.006) (0.029) (0.011) (0.048) (0.024)
Over skilled 0.127 *** 0.196 *** 0.507 *** -0.406 *** 0.147 *** -0.232 *** -0.402 *** 1.798 *** 1.885 *** 2.637 *** -2.978 ***
(0.009) (0.006) (0.004) (0.019) (0.016) (0.003) (0.043) (0.029) (0.025) (0.005) (0.047)
Belgium Severely mismatched 0.310 *** 1.578 *** 4.408 *** 0.122 0.177 *** -0.355 *** -0.800 *** 0.935 *** 1.335 *** -0.341 *** -4.771 ***
(0.020) (0.003) (0.064) (0.075) (0.007) (0.041) (0.010) (0.062) (0.000) (0.037) (0.036)
Mixed -0.081 *** 3.278 *** 0.098 *** -0.067 0.027 *** -0.458 *** -1.055 *** -1.121 *** -2.937 *** -1.440 ***
(0.012) (0.019) (0.006) (0.050) (0.006) (0.002) (0.065) (0.073) (0.059) (0.055)
Over educated -0.182 *** 4.867 *** 0.035 *** 0.138 ** -0.332 *** -0.779 *** -0.685 *** -1.784 *** -4.170 *** 0.005
(0.001) (0.001) (0.001) (0.046) (0.008) (0.068) (0.107) (0.106) (0.140) (0.105)
Over skilled 0.131 *** 0.251 *** -0.991 *** -0.007 0.199 *** 0.064 * 0.486 *** 0.736 *** 1.151 *** -1.801 ***
(0.010) (0.024) (0.035) (0.045) (0.004) (0.027) (0.099) (0.062) (0.099) (0.058)
Cyprus Severely mismatched 0.392 *** 5.276 *** 0.568 *** -0.056 0.095 *** -0.563 *** 0.610 *** -0.434 *** -2.410 *** -3.321 ***
(0.008) (0.007) (0.018) (0.051) (0.014) (0.028) (0.071) (0.083) (0.101) (0.060)
Mixed -0.132 *** 2.712 *** 5.207 *** 0.234 *** 0.220 *** -0.144 *** -0.346 *** -1.289 *** -1.718 *** -2.329 *** -3.028 ***
(0.000) (0.005) (0.017) (0.013) (0.014) (0.025) (0.021) (0.007) (0.018) (0.027) (0.012)
Over educated 0.488 *** 1.393 *** 4.025 *** 0.489 *** 0.038 + -0.354 *** -0.455 *** -1.289 *** -1.849 *** -3.441 *** -0.443 ***
(0.005) (0.016) (0.015) (0.019) (0.020) (0.022) (0.017) (0.012) (0.015) (0.005) (0.011)
Over skilled 0.244 *** 0.588 *** 0.560 *** 0.091 *** -0.021 -0.184 *** -0.064 *** 1.134 *** 1.475 *** 1.978 *** -2.876 ***
(0.011) (0.003) (0.004) (0.018) (0.019) (0.017) (0.016) (0.009) (0.001) (0.016) (0.022)
Czech Republic Severely mismatched 0.016 2.240 *** 5.372 *** 0.032 *** 0.080 *** -0.508 *** -0.179 *** 1.498 *** 2.041 *** 0.721 *** -6.029 ***
(0.012) (0.011) (0.011) (0.001) (0.019) (0.022) (0.035) (0.032) (0.007) (0.010) (0.018)
Age 45-54 Age 55-65 Blue collar
White
collar Skilled ConstantFemale
Medium
education
High
education Age 16-25 Age 25-34
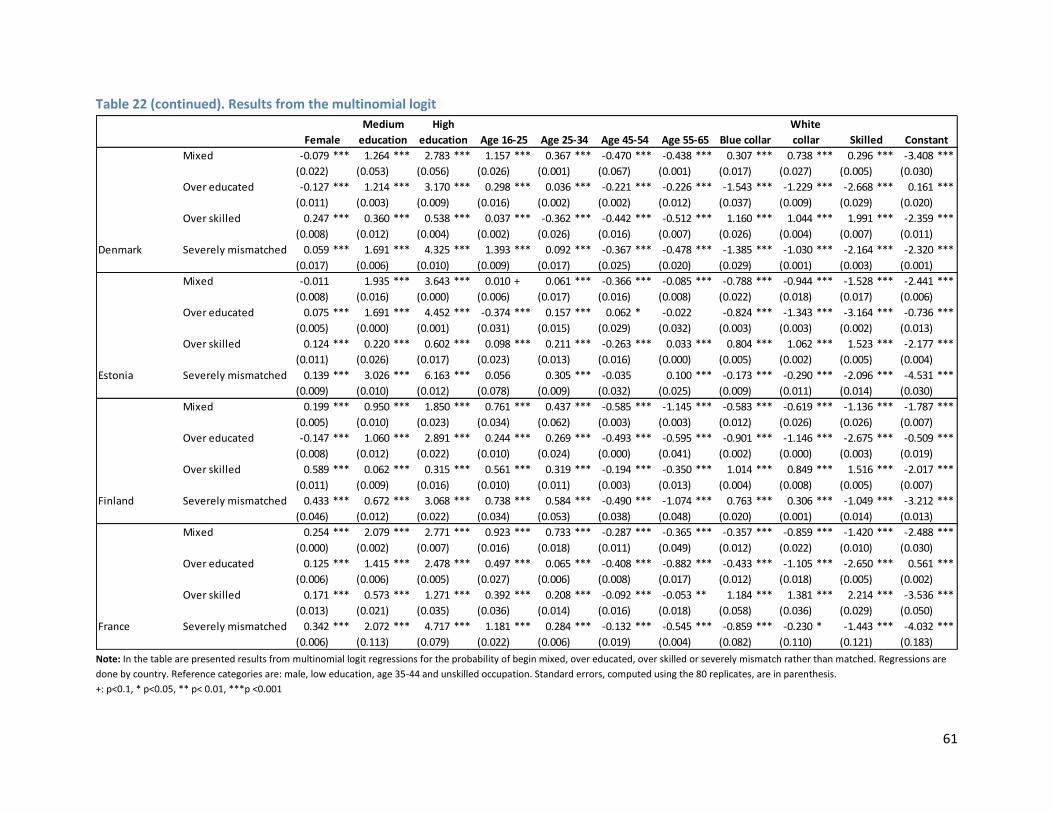
61
Table 22 (continued). Results from the multinomial logit
Note: In the table are presented results from multinomial logit regressions for the probability of begin mixed, over educated, over skilled or severely mismatch rather than matched. Regressions are
done by country. Reference categories are: male, low education, age 35-44 and unskilled occupation. Standard errors, computed using the 80 replicates, are in parenthesis.
+: p<0.1, * p<0.05, ** p< 0.01, ***p <0.001
Mixed -0.079 *** 1.264 *** 2.783 *** 1.157 *** 0.367 *** -0.470 *** -0.438 *** 0.307 *** 0.738 *** 0.296 *** -3.408 ***
(0.022) (0.053) (0.056) (0.026) (0.001) (0.067) (0.001) (0.017) (0.027) (0.005) (0.030)
Over educated -0.127 *** 1.214 *** 3.170 *** 0.298 *** 0.036 *** -0.221 *** -0.226 *** -1.543 *** -1.229 *** -2.668 *** 0.161 ***
(0.011) (0.003) (0.009) (0.016) (0.002) (0.002) (0.012) (0.037) (0.009) (0.029) (0.020)
Over skilled 0.247 *** 0.360 *** 0.538 *** 0.037 *** -0.362 *** -0.442 *** -0.512 *** 1.160 *** 1.044 *** 1.991 *** -2.359 ***
(0.008) (0.012) (0.004) (0.002) (0.026) (0.016) (0.007) (0.026) (0.004) (0.007) (0.011)
Denmark Severely mismatched 0.059 *** 1.691 *** 4.325 *** 1.393 *** 0.092 *** -0.367 *** -0.478 *** -1.385 *** -1.030 *** -2.164 *** -2.320 ***
(0.017) (0.006) (0.010) (0.009) (0.017) (0.025) (0.020) (0.029) (0.001) (0.003) (0.001)
Mixed -0.011 1.935 *** 3.643 *** 0.010 + 0.061 *** -0.366 *** -0.085 *** -0.788 *** -0.944 *** -1.528 *** -2.441 ***
(0.008) (0.016) (0.000) (0.006) (0.017) (0.016) (0.008) (0.022) (0.018) (0.017) (0.006)
Over educated 0.075 *** 1.691 *** 4.452 *** -0.374 *** 0.157 *** 0.062 * -0.022 -0.824 *** -1.343 *** -3.164 *** -0.736 ***
(0.005) (0.000) (0.001) (0.031) (0.015) (0.029) (0.032) (0.003) (0.003) (0.002) (0.013)
Over skilled 0.124 *** 0.220 *** 0.602 *** 0.098 *** 0.211 *** -0.263 *** 0.033 *** 0.804 *** 1.062 *** 1.523 *** -2.177 ***
(0.011) (0.026) (0.017) (0.023) (0.013) (0.016) (0.000) (0.005) (0.002) (0.005) (0.004)
Estonia Severely mismatched 0.139 *** 3.026 *** 6.163 *** 0.056 0.305 *** -0.035 0.100 *** -0.173 *** -0.290 *** -2.096 *** -4.531 ***
(0.009) (0.010) (0.012) (0.078) (0.009) (0.032) (0.025) (0.009) (0.011) (0.014) (0.030)
Mixed 0.199 *** 0.950 *** 1.850 *** 0.761 *** 0.437 *** -0.585 *** -1.145 *** -0.583 *** -0.619 *** -1.136 *** -1.787 ***
(0.005) (0.010) (0.023) (0.034) (0.062) (0.003) (0.003) (0.012) (0.026) (0.026) (0.007)
Over educated -0.147 *** 1.060 *** 2.891 *** 0.244 *** 0.269 *** -0.493 *** -0.595 *** -0.901 *** -1.146 *** -2.675 *** -0.509 ***
(0.008) (0.012) (0.022) (0.010) (0.024) (0.000) (0.041) (0.002) (0.000) (0.003) (0.019)
Over skilled 0.589 *** 0.062 *** 0.315 *** 0.561 *** 0.319 *** -0.194 *** -0.350 *** 1.014 *** 0.849 *** 1.516 *** -2.017 ***
(0.011) (0.009) (0.016) (0.010) (0.011) (0.003) (0.013) (0.004) (0.008) (0.005) (0.007)
Finland Severely mismatched 0.433 *** 0.672 *** 3.068 *** 0.738 *** 0.584 *** -0.490 *** -1.074 *** 0.763 *** 0.306 *** -1.049 *** -3.212 ***
(0.046) (0.012) (0.022) (0.034) (0.053) (0.038) (0.048) (0.020) (0.001) (0.014) (0.013)
Mixed 0.254 *** 2.079 *** 2.771 *** 0.923 *** 0.733 *** -0.287 *** -0.365 *** -0.357 *** -0.859 *** -1.420 *** -2.488 ***
(0.000) (0.002) (0.007) (0.016) (0.018) (0.011) (0.049) (0.012) (0.022) (0.010) (0.030)
Over educated 0.125 *** 1.415 *** 2.478 *** 0.497 *** 0.065 *** -0.408 *** -0.882 *** -0.433 *** -1.105 *** -2.650 *** 0.561 ***
(0.006) (0.006) (0.005) (0.027) (0.006) (0.008) (0.017) (0.012) (0.018) (0.005) (0.002)
Over skilled 0.171 *** 0.573 *** 1.271 *** 0.392 *** 0.208 *** -0.092 *** -0.053 ** 1.184 *** 1.381 *** 2.214 *** -3.536 ***
(0.013) (0.021) (0.035) (0.036) (0.014) (0.016) (0.018) (0.058) (0.036) (0.029) (0.050)
France Severely mismatched 0.342 *** 2.072 *** 4.717 *** 1.181 *** 0.284 *** -0.132 *** -0.545 *** -0.859 *** -0.230 * -1.443 *** -4.032 ***
(0.006) (0.113) (0.079) (0.022) (0.006) (0.019) (0.004) (0.082) (0.110) (0.121) (0.183)
Age 55-65 Blue collar
White
collar Skilled ConstantFemale
Medium
education
High
education Age 16-25 Age 25-34 Age 45-54
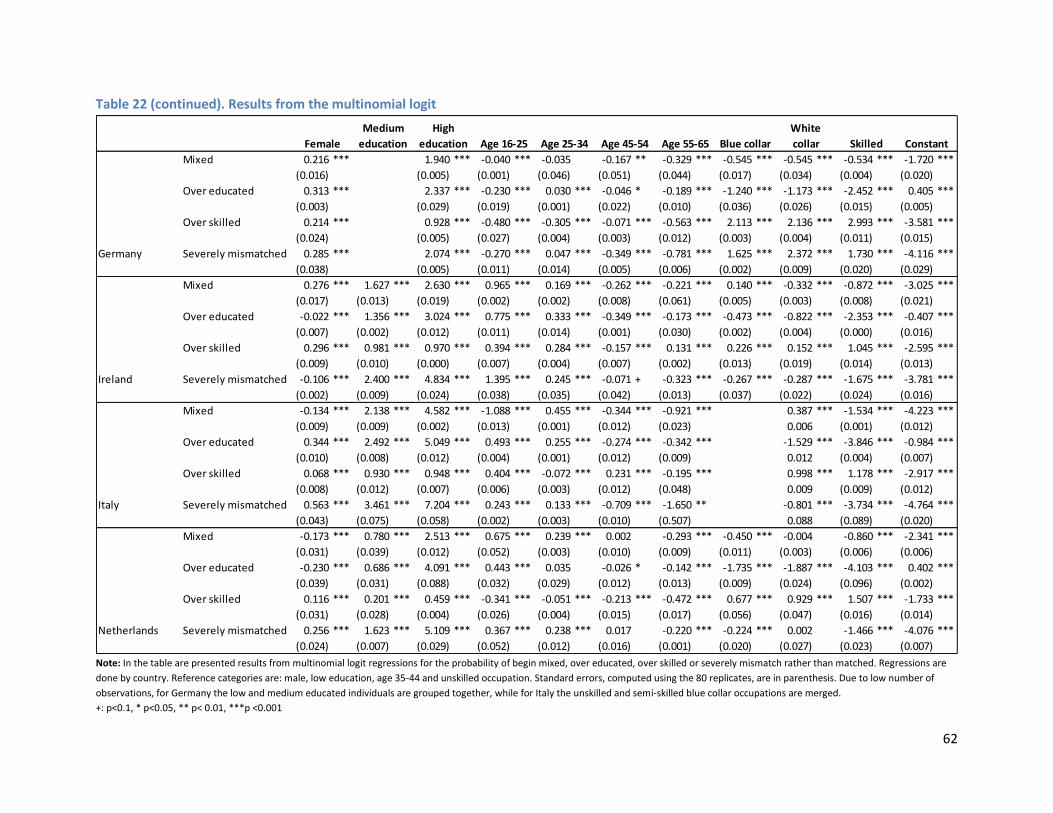
62
Table 22 (continued). Results from the multinomial logit
Note: In the table are presented results from multinomial logit regressions for the probability of begin mixed, over educated, over skilled or severely mismatch rather than matched. Regressions are
done by country. Reference categories are: male, low education, age 35-44 and unskilled occupation. Standard errors, computed using the 80 replicates, are in parenthesis. Due to low number of
observations, for Germany the low and medium educated individuals are grouped together, while for Italy the unskilled and semi-skilled blue collar occupations are merged.
+: p<0.1, * p<0.05, ** p< 0.01, ***p <0.001
Mixed 0.216 *** 1.940 *** -0.040 *** -0.035 -0.167 ** -0.329 *** -0.545 *** -0.545 *** -0.534 *** -1.720 ***
(0.016) (0.005) (0.001) (0.046) (0.051) (0.044) (0.017) (0.034) (0.004) (0.020)
Over educated 0.313 *** 2.337 *** -0.230 *** 0.030 *** -0.046 * -0.189 *** -1.240 *** -1.173 *** -2.452 *** 0.405 ***
(0.003) (0.029) (0.019) (0.001) (0.022) (0.010) (0.036) (0.026) (0.015) (0.005)
Over skilled 0.214 *** 0.928 *** -0.480 *** -0.305 *** -0.071 *** -0.563 *** 2.113 *** 2.136 *** 2.993 *** -3.581 ***
(0.024) (0.005) (0.027) (0.004) (0.003) (0.012) (0.003) (0.004) (0.011) (0.015)
Germany Severely mismatched 0.285 *** 2.074 *** -0.270 *** 0.047 *** -0.349 *** -0.781 *** 1.625 *** 2.372 *** 1.730 *** -4.116 ***
(0.038) (0.005) (0.011) (0.014) (0.005) (0.006) (0.002) (0.009) (0.020) (0.029)
Mixed 0.276 *** 1.627 *** 2.630 *** 0.965 *** 0.169 *** -0.262 *** -0.221 *** 0.140 *** -0.332 *** -0.872 *** -3.025 ***
(0.017) (0.013) (0.019) (0.002) (0.002) (0.008) (0.061) (0.005) (0.003) (0.008) (0.021)
Over educated -0.022 *** 1.356 *** 3.024 *** 0.775 *** 0.333 *** -0.349 *** -0.173 *** -0.473 *** -0.822 *** -2.353 *** -0.407 ***
(0.007) (0.002) (0.012) (0.011) (0.014) (0.001) (0.030) (0.002) (0.004) (0.000) (0.016)
Over skilled 0.296 *** 0.981 *** 0.970 *** 0.394 *** 0.284 *** -0.157 *** 0.131 *** 0.226 *** 0.152 *** 1.045 *** -2.595 ***
(0.009) (0.010) (0.000) (0.007) (0.004) (0.007) (0.002) (0.013) (0.019) (0.014) (0.013)
Ireland Severely mismatched -0.106 *** 2.400 *** 4.834 *** 1.395 *** 0.245 *** -0.071 + -0.323 *** -0.267 *** -0.287 *** -1.675 *** -3.781 ***
(0.002) (0.009) (0.024) (0.038) (0.035) (0.042) (0.013) (0.037) (0.022) (0.024) (0.016)
Mixed -0.134 *** 2.138 *** 4.582 *** -1.088 *** 0.455 *** -0.344 *** -0.921 *** 0.387 *** -1.534 *** -4.223 ***
(0.009) (0.009) (0.002) (0.013) (0.001) (0.012) (0.023) 0.006 (0.001) (0.012)
Over educated 0.344 *** 2.492 *** 5.049 *** 0.493 *** 0.255 *** -0.274 *** -0.342 *** -1.529 *** -3.846 *** -0.984 ***
(0.010) (0.008) (0.012) (0.004) (0.001) (0.012) (0.009) 0.012 (0.004) (0.007)
Over skilled 0.068 *** 0.930 *** 0.948 *** 0.404 *** -0.072 *** 0.231 *** -0.195 *** 0.998 *** 1.178 *** -2.917 ***
(0.008) (0.012) (0.007) (0.006) (0.003) (0.012) (0.048) 0.009 (0.009) (0.012)
Italy Severely mismatched 0.563 *** 3.461 *** 7.204 *** 0.243 *** 0.133 *** -0.709 *** -1.650 ** -0.801 *** -3.734 *** -4.764 ***
(0.043) (0.075) (0.058) (0.002) (0.003) (0.010) (0.507) 0.088 (0.089) (0.020)
Mixed -0.173 *** 0.780 *** 2.513 *** 0.675 *** 0.239 *** 0.002 -0.293 *** -0.450 *** -0.004 -0.860 *** -2.341 ***
(0.031) (0.039) (0.012) (0.052) (0.003) (0.010) (0.009) (0.011) (0.003) (0.006) (0.006)
Over educated -0.230 *** 0.686 *** 4.091 *** 0.443 *** 0.035 -0.026 * -0.142 *** -1.735 *** -1.887 *** -4.103 *** 0.402 ***
(0.039) (0.031) (0.088) (0.032) (0.029) (0.012) (0.013) (0.009) (0.024) (0.096) (0.002)
Over skilled 0.116 *** 0.201 *** 0.459 *** -0.341 *** -0.051 *** -0.213 *** -0.472 *** 0.677 *** 0.929 *** 1.507 *** -1.733 ***
(0.031) (0.028) (0.004) (0.026) (0.004) (0.015) (0.017) (0.056) (0.047) (0.016) (0.014)
Netherlands Severely mismatched 0.256 *** 1.623 *** 5.109 *** 0.367 *** 0.238 *** 0.017 -0.220 *** -0.224 *** 0.002 -1.466 *** -4.076 ***
(0.024) (0.007) (0.029) (0.052) (0.012) (0.016) (0.001) (0.020) (0.027) (0.023) (0.007)
Age 45-54 Age 55-65 Blue collar
White
collar Skilled ConstantFemale
Medium
education
High
education Age 16-25 Age 25-34
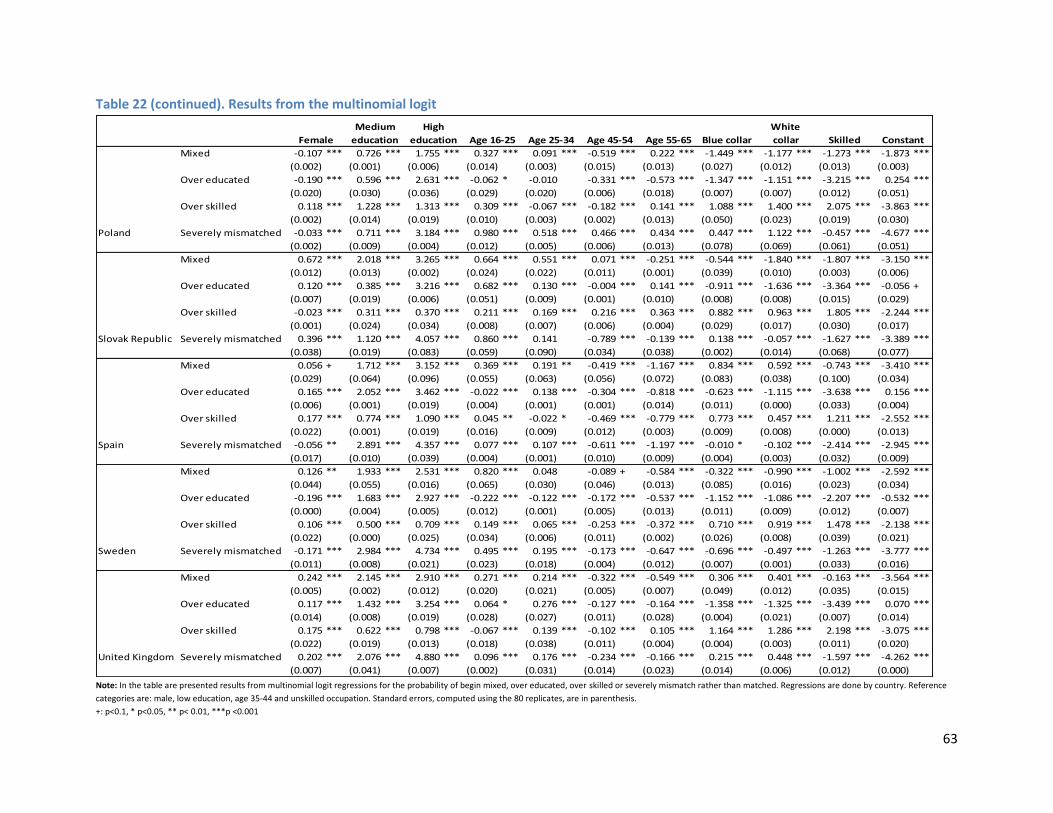
63
Table 22 (continued). Results from the multinomial logit
Note: In the table are presented results from multinomial logit regressions for the probability of begin mixed, over educated, over skilled or severely mismatch rather than matched. Regressions are done by country. Reference
categories are: male, low education, age 35-44 and unskilled occupation. Standard errors, computed using the 80 replicates, are in parenthesis.
+: p<0.1, * p<0.05, ** p< 0.01, ***p <0.001
Mixed -0.107 *** 0.726 *** 1.755 *** 0.327 *** 0.091 *** -0.519 *** 0.222 *** -1.449 *** -1.177 *** -1.273 *** -1.873 ***
(0.002) (0.001) (0.006) (0.014) (0.003) (0.015) (0.013) (0.027) (0.012) (0.013) (0.003)
Over educated -0.190 *** 0.596 *** 2.631 *** -0.062 * -0.010 -0.331 *** -0.573 *** -1.347 *** -1.151 *** -3.215 *** 0.254 ***
(0.020) (0.030) (0.036) (0.029) (0.020) (0.006) (0.018) (0.007) (0.007) (0.012) (0.051)
Over skilled 0.118 *** 1.228 *** 1.313 *** 0.309 *** -0.067 *** -0.182 *** 0.141 *** 1.088 *** 1.400 *** 2.075 *** -3.863 ***
(0.002) (0.014) (0.019) (0.010) (0.003) (0.002) (0.013) (0.050) (0.023) (0.019) (0.030)
Poland Severely mismatched -0.033 *** 0.711 *** 3.184 *** 0.980 *** 0.518 *** 0.466 *** 0.434 *** 0.447 *** 1.122 *** -0.457 *** -4.677 ***
(0.002) (0.009) (0.004) (0.012) (0.005) (0.006) (0.013) (0.078) (0.069) (0.061) (0.051)
Mixed 0.672 *** 2.018 *** 3.265 *** 0.664 *** 0.551 *** 0.071 *** -0.251 *** -0.544 *** -1.840 *** -1.807 *** -3.150 ***
(0.012) (0.013) (0.002) (0.024) (0.022) (0.011) (0.001) (0.039) (0.010) (0.003) (0.006)
Over educated 0.120 *** 0.385 *** 3.216 *** 0.682 *** 0.130 *** -0.004 *** 0.141 *** -0.911 *** -1.636 *** -3.364 *** -0.056 +
(0.007) (0.019) (0.006) (0.051) (0.009) (0.001) (0.010) (0.008) (0.008) (0.015) (0.029)
Over skilled -0.023 *** 0.311 *** 0.370 *** 0.211 *** 0.169 *** 0.216 *** 0.363 *** 0.882 *** 0.963 *** 1.805 *** -2.244 ***
(0.001) (0.024) (0.034) (0.008) (0.007) (0.006) (0.004) (0.029) (0.017) (0.030) (0.017)
Slovak Republic Severely mismatched 0.396 *** 1.120 *** 4.057 *** 0.860 *** 0.141 -0.789 *** -0.139 *** 0.138 *** -0.057 *** -1.627 *** -3.389 ***
(0.038) (0.019) (0.083) (0.059) (0.090) (0.034) (0.038) (0.002) (0.014) (0.068) (0.077)
Mixed 0.056 + 1.712 *** 3.152 *** 0.369 *** 0.191 ** -0.419 *** -1.167 *** 0.834 *** 0.592 *** -0.743 *** -3.410 ***
(0.029) (0.064) (0.096) (0.055) (0.063) (0.056) (0.072) (0.083) (0.038) (0.100) (0.034)
Over educated 0.165 *** 2.052 *** 3.462 *** -0.022 *** 0.138 *** -0.304 *** -0.818 *** -0.623 *** -1.115 *** -3.638 *** 0.156 ***
(0.006) (0.001) (0.019) (0.004) (0.001) (0.001) (0.014) (0.011) (0.000) (0.033) (0.004)
Over skilled 0.177 *** 0.774 *** 1.090 *** 0.045 ** -0.022 * -0.469 *** -0.779 *** 0.773 *** 0.457 *** 1.211 *** -2.552 ***
(0.022) (0.001) (0.019) (0.016) (0.009) (0.012) (0.003) (0.009) (0.008) (0.000) (0.013)
Spain Severely mismatched -0.056 ** 2.891 *** 4.357 *** 0.077 *** 0.107 *** -0.611 *** -1.197 *** -0.010 * -0.102 *** -2.414 *** -2.945 ***
(0.017) (0.010) (0.039) (0.004) (0.001) (0.010) (0.009) (0.004) (0.003) (0.032) (0.009)
Mixed 0.126 ** 1.933 *** 2.531 *** 0.820 *** 0.048 -0.089 + -0.584 *** -0.322 *** -0.990 *** -1.002 *** -2.592 ***
(0.044) (0.055) (0.016) (0.065) (0.030) (0.046) (0.013) (0.085) (0.016) (0.023) (0.034)
Over educated -0.196 *** 1.683 *** 2.927 *** -0.222 *** -0.122 *** -0.172 *** -0.537 *** -1.152 *** -1.086 *** -2.207 *** -0.532 ***
(0.000) (0.004) (0.005) (0.012) (0.001) (0.005) (0.013) (0.011) (0.009) (0.012) (0.007)
Over skilled 0.106 *** 0.500 *** 0.709 *** 0.149 *** 0.065 *** -0.253 *** -0.372 *** 0.710 *** 0.919 *** 1.478 *** -2.138 ***
(0.022) (0.000) (0.025) (0.034) (0.006) (0.011) (0.002) (0.026) (0.008) (0.039) (0.021)
Sweden Severely mismatched -0.171 *** 2.984 *** 4.734 *** 0.495 *** 0.195 *** -0.173 *** -0.647 *** -0.696 *** -0.497 *** -1.263 *** -3.777 ***
(0.011) (0.008) (0.021) (0.023) (0.018) (0.004) (0.012) (0.007) (0.001) (0.033) (0.016)
Mixed 0.242 *** 2.145 *** 2.910 *** 0.271 *** 0.214 *** -0.322 *** -0.549 *** 0.306 *** 0.401 *** -0.163 *** -3.564 ***
(0.005) (0.002) (0.012) (0.020) (0.021) (0.005) (0.007) (0.049) (0.012) (0.035) (0.015)
Over educated 0.117 *** 1.432 *** 3.254 *** 0.064 * 0.276 *** -0.127 *** -0.164 *** -1.358 *** -1.325 *** -3.439 *** 0.070 ***
(0.014) (0.008) (0.019) (0.028) (0.027) (0.011) (0.028) (0.004) (0.021) (0.007) (0.014)
Over skilled 0.175 *** 0.622 *** 0.798 *** -0.067 *** 0.139 *** -0.102 *** 0.105 *** 1.164 *** 1.286 *** 2.198 *** -3.075 ***
(0.022) (0.019) (0.013) (0.018) (0.038) (0.011) (0.004) (0.004) (0.003) (0.011) (0.020)
United Kingdom Severely mismatched 0.202 *** 2.076 *** 4.880 *** 0.096 *** 0.176 *** -0.234 *** -0.166 *** 0.215 *** 0.448 *** -1.597 *** -4.262 ***
(0.007) (0.041) (0.007) (0.002) (0.031) (0.014) (0.023) (0.014) (0.006) (0.012) (0.000)
Age 55-65 Blue collar
White
collar Skilled ConstantFemale
Medium
education
High
education Age 16-25 Age 25-34 Age 45-54
64
Finally, in order to simplify the interpretation of the results and to be able to easily compare also
probabilities of being in two different mismatch categories (rather than in comparison to the matched
one), we calculated predicted probabilities of being in the different categories according to the different
combination of variables. We present here results of the combination of “age and level of education”
and of “occupation category and level of education”.
Figure 3 reports the predicted probabilities of being in either one of the mismatched typologies
compared to being matched. For the sake of clarity, we selected only age group 25-34 (which we called
“young”) and 45-54 (which we call “old”), taking also into account that these age groups are those at a
greater risk of occupational mismatch. We consider the three levels of education (i.e. low, medium, and
high). Thus we have 2x3=6 possible combinations of age and education for which we estimated the
predicted probabilities. In the estimations, all the other variables are kept at the mean (weighted) in
each country.
With these graphs we aim at shedding light on the effect of education taking into account age. We
present the results for only 6 countries: Italy and Spain (as representative of Mediterranean countries,
and belonging to Clusters C and D respectively); Poland (as representative of Eastern Europe countries –
Cluster B); Finland and the Netherlands (as representative of the northern social democratic countries –
Cluster A) and Germany (as representative of a continental country – again, Cluster A).
The overall aim of these charts is to see which are the probabilities of being in each mismatch category
for individuals in different age groups and with different education levels. They can however be read
also by age group and educational level separately, in order to draw general conclusions on which
characteristics are more closely associated to being in a particular mismatch condition.
65
Figure 3. Predicted probabilities of being matched, severely mismatched, over educated, over skilled or mixed by “age and education level” 33
33
On the horizontal axis, 8 different categories are presented. Individuals are disaggregated by education level (low, medium, professional and high), and then further distinguished according to their age (as mentioned above, the 25-34 years-old – “young” – and the 45-54 years-old – “old”).
0.00
0.10
0.20
0.30
0.40
0.50
0.60
0.70
0.80
0.90
1.00
young old young old young old
Low Medium High
Pre
dic
ted
pro
bab
iliti
es
Germany
SeverelymismatchedOver skilled
Over educated
Mixed
matched
0.00
0.10
0.20
0.30
0.40
0.50
0.60
0.70
0.80
0.90
1.00
young old young old young old
Low Medium High
Pre
dic
ted
pro
bab
iliti
es
Finland
SeverelymismatchedOver skilled
Over educated
Mixed
matched
66
0.00
0.10
0.20
0.30
0.40
0.50
0.60
0.70
0.80
0.90
1.00
young old young old young old
Low Medium High
Pre
dic
ted
pro
bab
iliti
es
Poland
SeverelymismatchedOver skilled
Over educated
Mixed
matched
0.00
0.10
0.20
0.30
0.40
0.50
0.60
0.70
0.80
0.90
1.00
young old young old young old
Low Medium High
Pre
dic
ted
pro
bab
iliti
es
Netherlands
SeverelymismatchedOver skilled
Over educated
Mixed
matched
67
By looking at the graphs for the six considered countries we notice that, as already highlighted in the
descriptive section, younger individuals have systematically higher probabilities of being mismatched
than the older individuals, and this is true for all educational levels and all countries (except for
Germany, where the shares of matched individuals are even slightly higher among the low educated);
however, in many cases these differences are not very large.
In Italy and Spain we observe very high predicted probabilities of being overeducated (higher – above
0.50 – for individuals with high education, lower but still relevant for individuals with medium
education, and by definition close to 0 for the low educated), but rather low predicted probabilities
(below 0.10) of being over skilled, severely or mixed mismatched, independently from the age or the
educational level. Only individuals with high education have relatively high probabilities (around 0.10) of
0.00
0.10
0.20
0.30
0.40
0.50
0.60
0.70
0.80
0.90
1.00
young old young old young old
Low Medium High
Pre
dic
ted
pro
bab
iliti
es
Italy
SeverelymismatchedOver skilled
Over educated
Mixed
matched
0.00
0.10
0.20
0.30
0.40
0.50
0.60
0.70
0.80
0.90
1.00
young old young old young old
Low Medium High
Pre
dic
ted
pro
bab
iliti
es
Spain
SeverelymismatchedOver skilled
Over educated
Mixed
matched
68
being severely mismatched. This confirms the hypothesis we made under the previous section based
solely on descriptive statistics. In these countries, individuals with high education face the problem of
ending up in a job that does not match their level of education, but on the other side these individuals
have the right skills to comply with their job’s duties, they do not own massive extra skills that they
underutilized in their job. This result somehow questions the ability of the education system to provide
the necessary skills for the job.
On the other side, in Finland we observe much lower but still relevant probabilities of begin
overeducated (basically close to 0 for individuals with both low and medium education, and between
0.20 and 0.30 for thehighly educated), but higher probabilities of being over skilled (especially for low
and medium level education, which reach around 0.15-0.25 probabilities) or severely mismatched
(especially for highly educated, with percentage around 0.20). Interestingly, individuals with low
education have almost 0 probability of being not only overeducated but also mixed or severely
mismatched, but high probabilities of begin over skilled for the job they are in. An analogous situation
can be found in the Netherlands, although with higher probabilities of being overeducated for those
with high education, and somewhat lower overskill probabilities for the low and medium educated
young individuals, and for those with professional education. This evidence supports our hypothesis of
the “smart countries”, where the overall population has high skills and thus also individuals with low
education have them and can therefore suffer from skill mismatch.
In Germany the low and medium educated individuals are grouped together in one single group34; this
group of individuals has very low probabilities of being in any type of mismatch;while individual with
high education have as usual high probabilities of begin overedcauted. . Poland resembles Germany,
with slightly lower probabilities of over education for the high educated (around 0.40) ,
As a conclusion we can say that age matters, but not as much as could be expected: younger individuals
have always higher predicted probabilities of being mismatched than older individuals, but the
difference is not very large. In Italy and Spain individuals with high and professional education have very
high predicted probabilities of being over educated, which are not reflected in high probabilities of being
overskilled, thus it is a matter of qualification rather than skills. In Finland and the Netherlands,
individuals with low and medium education have (relatively) high predicted probabilities of being over
skilled, that are not reflected in high probabilities of over education, severely or mixed mismatch.
Figure 4 reports the predicted probabilities of being in either one of the mismatched categories
combining “level of education and occupational category”.
34
There were not enough observations to have the four educational groups.
69
Figure 4: Predicted probabilities of being matched, severely mismatched, over educated, over skilled
or mixed by “occupational category and education level”35
35
On the horizontal axis, 16 different categories are presented. Individuals are disaggregated by education level (low, medium, professional and high), and then further distinguished according to their occupational category (skilled, semi-skilled white collar, semi-skilled blue collar, unskilled).
0.00
0.10
0.20
0.30
0.40
0.50
0.60
0.70
0.80
0.90
1.00Sk
ille
d
Sem
i/w
hit
e
Sem
i/b
lue
Un
skill
ed
Skill
ed
Sem
i/w
hit
e
Sem
i/b
lue
Un
skill
ed
Skill
ed
Sem
i/w
hit
e
Sem
i/b
lue
Un
skill
ed
Low Medium High
Pre
dic
ted
pro
bab
iliti
es
Germany
Severelymismatched
Over skilled
Over educated
0.00
0.10
0.20
0.30
0.40
0.50
0.60
0.70
0.80
0.90
1.00
Skill
ed
Sem
i/w
hit
e
Sem
i/b
lue
Un
skill
ed
Skill
ed
Sem
i/w
hit
e
Sem
i/b
lue
Un
skill
ed
Skill
ed
Sem
i/w
hit
e
Sem
i/b
lue
Un
skill
ed
Low Medium High
Pre
dic
ted
pro
bab
iliti
es
Finland
Severelymismatched
Over skilled
Over educated

70
0.00
0.10
0.20
0.30
0.40
0.50
0.60
0.70
0.80
0.90
1.00
Skill
ed
Sem
i/w
hit
e
Sem
i/b
lue
Un
skill
ed
Skill
ed
Sem
i/w
hit
e
Sem
i/b
lue
Un
skill
ed
Skill
ed
Sem
i/w
hit
e
Sem
i/b
lue
Un
skill
ed
Low Medium High
Pre
dic
ted
pro
bab
iliti
es
Poland
Severelymismatched
Over skilled
Over educated
0.00
0.10
0.20
0.30
0.40
0.50
0.60
0.70
0.80
0.90
1.00
Skill
ed
Sem
i/w
hit
e
Sem
i/b
lue
Un
skill
ed
Skill
ed
Sem
i/w
hit
e
Sem
i/b
lue
Un
skill
ed
Skill
ed
Sem
i/w
hit
e
Sem
i/b
lue
Un
skill
ed
Low Medium High
Pre
dic
ted
pro
bab
iliti
es
Netherland
Severelymismatched
Over skilled
Over educated
0.00
0.10
0.20
0.30
0.40
0.50
0.60
0.70
0.80
0.90
1.00
Skill
ed
Sem
i/w
hit
e
Sem
i/b
lue
Un
skill
ed
Skill
ed
Sem
i/w
hit
e
Sem
i/b
lue
Un
skill
ed
Skill
ed
Sem
i/w
hit
e
Sem
i/b
lue
Un
skill
ed
Low Medium High
Pre
dic
ted
pro
bab
iliti
es
Italy
Severelymismatched
Over skilled
Over educated
71
Comparing the different occupations within country and for each educational level, one common path
emerges: the more skilled the occupation of the worker (according to the scale described in Section 5.1),
the higher the probability that the individual is matched (with the expection of low educated in the
Netherland). As can be easily expected, the opposite is true for the probability of being over educated:
across all educational levels, individuals in a skilled job show systematically lower probabilities of being
over educated than individuals in less skilled jobs; among individuals with low and medium education,
the risk of over education is generally close to 0 for those in skilled and semi-skilled white collar jobs, but
higher for those with semi-skilled blue collar and unskilled occupations, especially in Spain, where the
probability for those with medium education and an unskilled job is close to 0.70, and Italy, where it
approaches 0.6036.
One feature that is common among all the countries is that individuals in unskilled occupations have low
predicted probabilities of being over skilled, severely or mixed mismatched (very close to 0 for all
educational levels); on the other hand, they show rather high probabilities to be over educated: this is
especially true for those with higher education (with chances of over education above 0.60 in all
countries, but often much higher), but also for those with medium (with probabilities reaching 0.45 in
the Netherlands and even 0.70 in Spain) and low education (with probabilities around 0.30 in Germany,
the Netherlands, Spain and Poland). While it is expected that individuals with higher levels of
educational attainment working in an unskilled job are over educated, the evidence that they are most
often not over skilled proves that they have just the right skills to perform their job, and they would
probably not be able to comply with a more skill demanding occupation; and this holds irrespectively of
the country.
36
As mentioned above, due to the low number of observations, for Italy the unskilled and semi-skilled blue collar occupations are merged.
0.00
0.10
0.20
0.30
0.40
0.50
0.60
0.70
0.80
0.90
1.00
Skill
ed
Sem
i/w
hit
e
Sem
i/b
lue
Un
skill
ed
Skill
ed
Sem
i/w
hit
e
Sem
i/b
lue
Un
skill
ed
Skill
ed
Sem
i/w
hit
e
Sem
i/b
lue
Un
skill
ed
Low Medium High
Pre
dic
ted
pro
bab
iliti
es
Spain
Severelymismatched
Over skilled
Over educated
72
Focusing on the group of people that are in a skilled occupation with high level of education, we notice
that in Italy and Spain the predicted probabilities of being over educated are systematically higher than
the predicted probabilities of being over skilled; the opposite is true in Finland, where highly educated
individuals (incl. high education) in skilled occupations have higher probabilities of being over skilled
rather than over educated. In Poland and the Netherlands, the probabilities are very similar, while in
Germany highly educated individuals in skilled occupations have similar probabilities of begin over
skilled and over educated
Summing up, we can say that some consistent patterns common across countries emerge when we
consider semi-skilled and unskilled occupations, while some country differences exist when it comes to
skilled occupations.
73
5. Comparison between the extent of mismatch in each country using
CEDEFOP skill forecast by educational level and occupation
As a further exercise we wanted to estimate the future levels of mismatch in each country following
Cedefop37 skill forecasts approach38. Cedefop produces skill supply and demand forecasts providing
information on future labour market trends in Europe. Within its skills forecast exercise, Cedefop
produces forecasts of employment trends, showing the development of the employed persons in
different sectors, occupations and qualifications up to 2020. We used these forecasted employment
trends by qualification and occupation for 2020 as a basis to construct an alternative scenario, on which
we estimated the predicted probabilities of being matched, severely mismatched, over skilled, over
educated or mixed mismatched in all the available countries. In addition, together with Cedefop
forecasts, we also used the population projections provided by Eurostat to recover the age distribution
of the population in 2020. The predicted probabilities we obtain are for the whole population, and can
thus be interpreted as the proportion of people falling under each category, i.e. the future proportion of
matched and mismatched individuals in the alternative scenario in which employment by qualification
and occupation follow the trends foreseen by Cedefop.
Starting from the ISCO 1 digit classification used by Cedefop for the occupations, we built the same four
occupational categories we used in the previous chapters.
We took Cedefop estimates of the employed population’s level of education in 2012 and the forecasts
for 2020. Cedefop forecasts foresee in all the countries a reduction of individuals with low education
and an increase of individuals with high education (SeeTable 23a).
37
European Centre for the Development of Vocational Training 38
See http://www.cedefop.europa.eu/EN/Files/5526_en.pdf and http://www.cedefop.europa.eu/EN/about-cedefop/projects/forecasting-skill-demand-and-supply/skills-forecasts.aspx
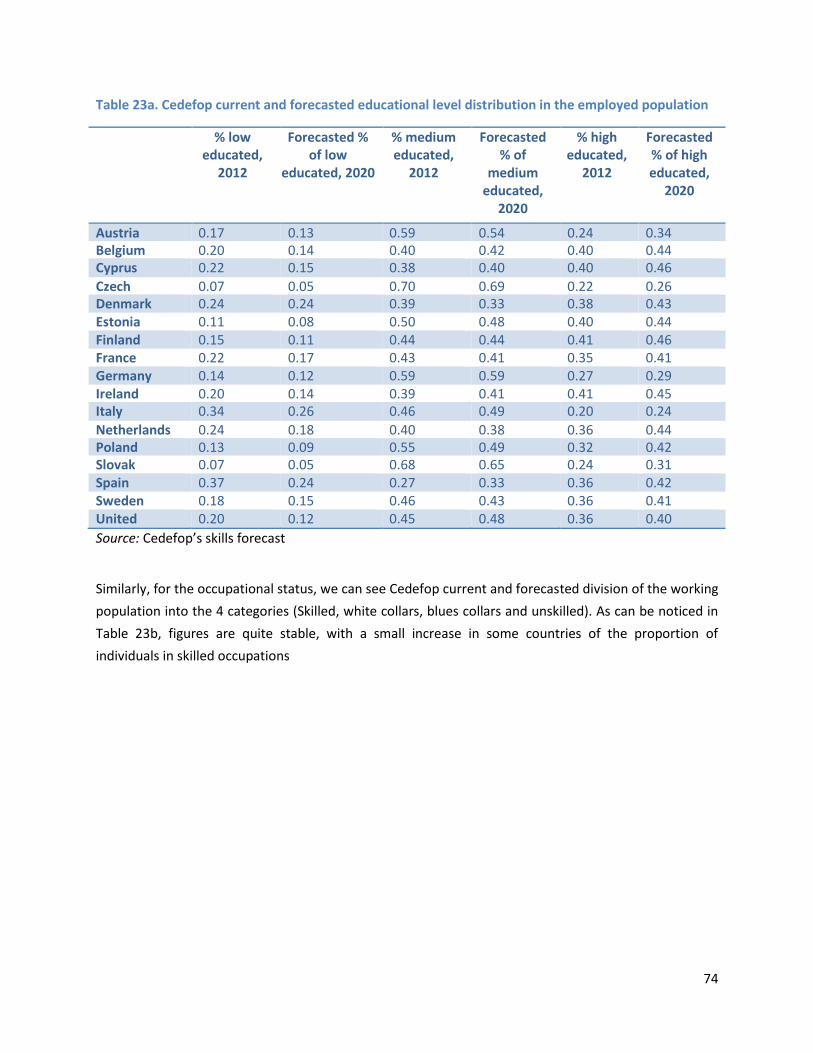
74
Table 23a. Cedefop current and forecasted educational level distribution in the employed population
% low educated,
2012
Forecasted % of low
educated, 2020
% medium educated,
2012
Forecasted % of
medium educated,
2020
% high educated,
2012
Forecasted % of high educated,
2020
Austria 0.17 0.13 0.59 0.54 0.24 0.34 Belgium 0.20 0.14 0.40 0.42 0.40 0.44 Cyprus 0.22 0.15 0.38 0.40 0.40 0.46
Czech Republic
0.07 0.05 0.70 0.69 0.22 0.26 Denmark 0.24 0.24 0.39 0.33 0.38 0.43 Estonia 0.11 0.08 0.50 0.48 0.40 0.44 Finland 0.15 0.11 0.44 0.44 0.41 0.46 France 0.22 0.17 0.43 0.41 0.35 0.41 Germany 0.14 0.12 0.59 0.59 0.27 0.29 Ireland 0.20 0.14 0.39 0.41 0.41 0.45 Italy 0.34 0.26 0.46 0.49 0.20 0.24
Netherlands 0.24 0.18 0.40 0.38 0.36 0.44 Poland 0.13 0.09 0.55 0.49 0.32 0.42 Slovak Republic
0.07 0.05 0.68 0.65 0.24 0.31 Spain 0.37 0.24 0.27 0.33 0.36 0.42 Sweden 0.18 0.15 0.46 0.43 0.36 0.41 United Kingdom KindgomKingdomS
0.20 0.12 0.45 0.48 0.36 0.40
Source: Cedefop’s skills forecast
Similarly, for the occupational status, we can see Cedefop current and forecasted division of the working
population into the 4 categories (Skilled, white collars, blues collars and unskilled). As can be noticed in
Table 23b, figures are quite stable, with a small increase in some countries of the proportion of
individuals in skilled occupations
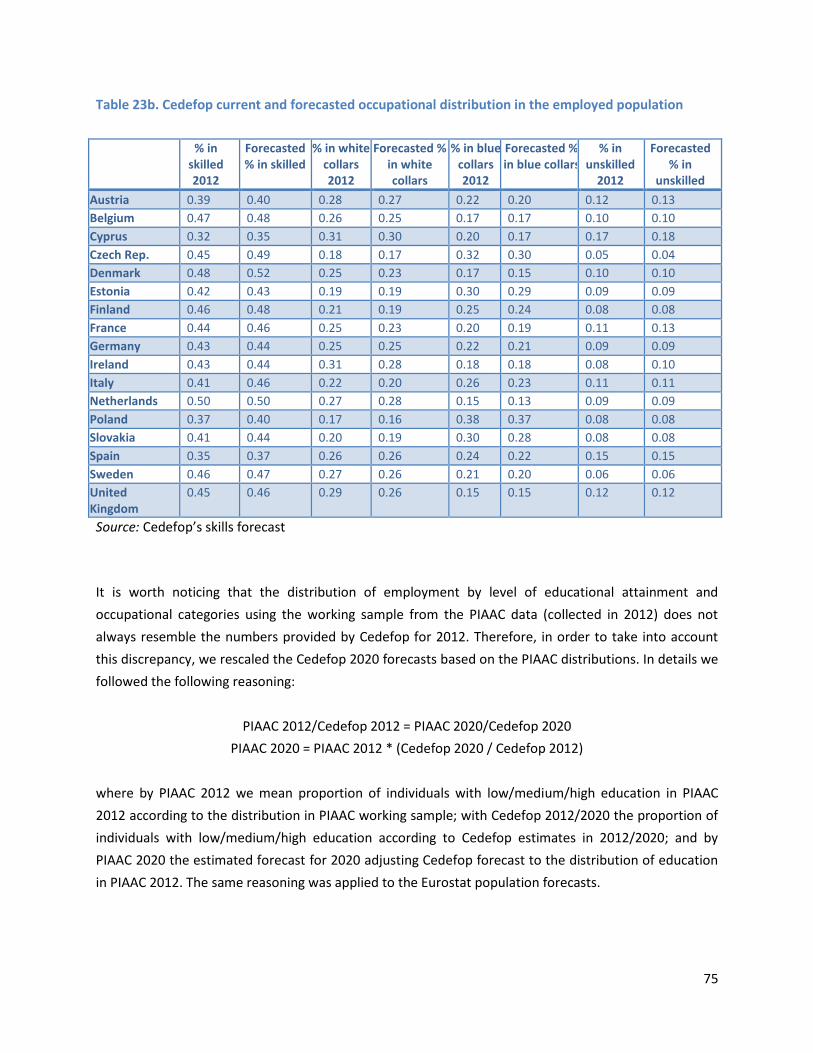
75
Table 23b. Cedefop current and forecasted occupational distribution in the employed population
% in skilled 2012
Forecasted % in skilled
% in white collars 2012
Forecasted % in white collars
% in blue collars 2012
Forecasted % in blue collars
% in unskilled
2012
Forecasted % in
unskilled
Austria 0.39 0.40 0.28 0.27 0.22 0.20 0.12 0.13
Belgium 0.47 0.48 0.26 0.25 0.17 0.17 0.10 0.10
Cyprus 0.32 0.35 0.31 0.30 0.20 0.17 0.17 0.18
Czech Rep. 0.45 0.49 0.18 0.17 0.32 0.30 0.05 0.04
Denmark 0.48 0.52 0.25 0.23 0.17 0.15 0.10 0.10
Estonia 0.42 0.43 0.19 0.19 0.30 0.29 0.09 0.09
Finland 0.46 0.48 0.21 0.19 0.25 0.24 0.08 0.08
France 0.44 0.46 0.25 0.23 0.20 0.19 0.11 0.13
Germany 0.43 0.44 0.25 0.25 0.22 0.21 0.09 0.09
Ireland 0.43 0.44 0.31 0.28 0.18 0.18 0.08 0.10
Italy 0.41 0.46 0.22 0.20 0.26 0.23 0.11 0.11
Netherlands 0.50 0.50 0.27 0.28 0.15 0.13 0.09 0.09
Poland 0.37 0.40 0.17 0.16 0.38 0.37 0.08 0.08
Slovakia 0.41 0.44 0.20 0.19 0.30 0.28 0.08 0.08
Spain 0.35 0.37 0.26 0.26 0.24 0.22 0.15 0.15
Sweden 0.46 0.47 0.27 0.26 0.21 0.20 0.06 0.06
United Kingdom
0.45 0.46 0.29 0.26 0.15 0.15 0.12 0.12
Source: Cedefop’s skills forecast
It is worth noticing that the distribution of employment by level of educational attainment and
occupational categories using the working sample from the PIAAC data (collected in 2012) does not
always resemble the numbers provided by Cedefop for 2012. Therefore, in order to take into account
this discrepancy, we rescaled the Cedefop 2020 forecasts based on the PIAAC distributions. In details we
followed the following reasoning:
PIAAC 2012/Cedefop 2012 = PIAAC 2020/Cedefop 2020
PIAAC 2020 = PIAAC 2012 * (Cedefop 2020 / Cedefop 2012)
where by PIAAC 2012 we mean proportion of individuals with low/medium/high education in PIAAC
2012 according to the distribution in PIAAC working sample; with Cedefop 2012/2020 the proportion of
individuals with low/medium/high education according to Cedefop estimates in 2012/2020; and by
PIAAC 2020 the estimated forecast for 2020 adjusting Cedefop forecast to the distribution of education
in PIAAC 2012. The same reasoning was applied to the Eurostat population forecasts.
76
We calculated the predicted probabilities of being in one of the 5 categories by country using current
PIAAC data and then using the distribution by level of education, occupation and age forecasted (PIAAC
2020). This is done to assess how these distributions will change according to the change in the
forecasted levels. Of course this exercise is based on a series of assumptions that we need to keep in
mind when reading the results:
1. The effect of the estimated beta, used to calculate the predicted probabilities, is the same now
and in 2020.
2. The compositions of the remaining control variables will not change between now and 2020,
e.g. in 2020 there will be the same proportion of females than in 2012.
3. The differences that exist between the PIAAC current working sample and Cedefop 2012 are
constant over time.
Having in mind these caveats we can look at Figure 5 which, for each country, displays the predicted
probability of being in either one of the 5 categories for the current year (2012) and for 2020.
According to this simulation exercise, the share of matched individuals is likely to decrease in all
countries but Sweden, Estonia and Denmark. In many cases, this decrease is partially counterbalanced
by an increase in mixed mismatch, and most of all by an increase in the incidence of over education,
which appears to be particularly relevant in Spain, the Netherlands, Italy and Cyprus. The share of over
skilled individuals, on the other hand, is on the decrease for all these countries. The main exception to
this trend is found in the United Kingdom, where the share of over skilled individuals appears to increase
while the incidence of over education is declining39.
Two of the three countries for which a slight increase in the incidence of matched individuals is foreseen
(Estonia and Denmark) show patterns similar to the UK, with a rising incidence of over skilled individuals
and a decreasing share of over educated. For Sweden, a marginal increase in mixed and over skilled is
envisaged.
Interestingly, in this alternative scenario the share of severely mismatched individuals appears to be on
the rise; this increase seems to be particularly relevant for Spain, the Netherlands, Ireland and Cyprus.
39
For the UK, it should be pointed out that while PIAAC data cover England and Northern Ireland only, the Cedefop figures refer to the whole United Kingdom. This discrepancy should however be partly taken into account in the rescaling exercise explained above.
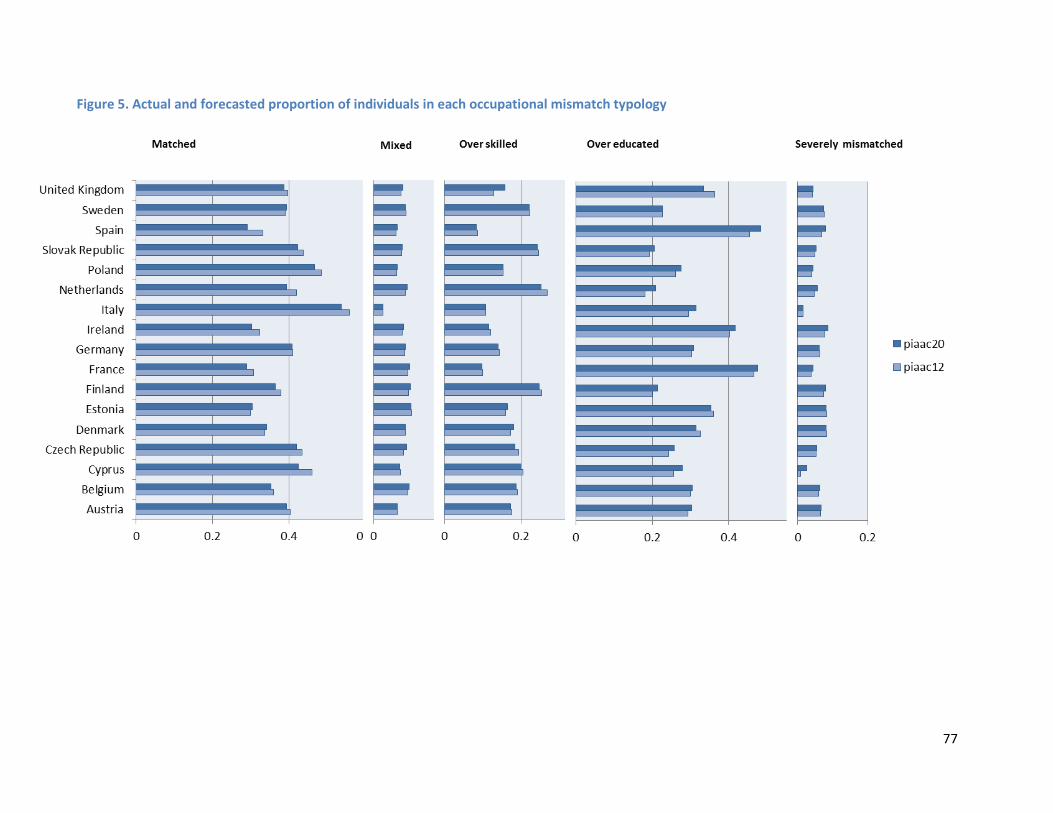
77
Figure 5. Actual and forecasted proportion of individuals in each occupational mismatch typology
78
6. Conclusions
In the last two to three decades, socio-economic changes such as increasing global competition, the
skill-biased technological change or the ageing of population have resulted in a labour market situation
where it is difficult to find the right people for the right jobs. Skill mismatch has become a major concern
as it proves to be pervasive, widespread and persistent in developed economies resulting on real costs
on individuals, businesses and society as a whole. The EU is not an exception. Thus, within this
framework, governments and different social partners from EU countries jointly with the European
Commission should work together to ensure an adequate supply of workers with the skills needed to
sustain the economy’s long-term productive potential and growth albeit social cohesion.
To successfully face this challenge, the first and major concern is being able to measure individual
occupational mismatch appropriately. Beyond educational attainment which is a reasonable candidate
to proxy individuals’ competences, individual’s skills arise as a superior and more reliable approach to
measure occupational mismatch given the greater demand for more information-processing and high-
level cognitive skills that do not necessarily need to be acquired through the educational system. The
recently released Survey of Adult Skills (PIAAC) offers a unique opportunity for simultaneously
measuring individuals’ competences and, as a result, occupational mismatch based both on education
related variables (overeducation) and on the level of proficiency on the specific skills (overskilling).
The main questions we pose in this report is whether educational and skill mismatches are equivalent
approaches to measure occupational mismatch; what are the figures of educational and skill mismatch
in the different European countries? What are the policy implications of the mismatch phenomenon and
what countries can do to face the challenges of occupational mismatch?
We find that education and skill mismatch do not seem to measure the same thing: the share of people
who are mismatched both in education and skill over the total population is pretty low (roughly around
15% of the working age population), suggesting that it is better not to focus on one single dimension
only, since most of the population is mismatched in either education or skills. Besides, due to the
different distribution of skill and education mismatch among European countries, policies focusing on
one dimension only risk to affect unevenly Member States
Moreover, there is a relevant part of the population which is over-qualified (education mismatch) but
not simultaneously over-skilled (skill mismatch). This means that they have a higher education level than
what required by the job, but on the other side, the skills they own are just enough to cope with it. This
result suggests that the educational system provides mainly general education, or at least does not
provide the type of education which enables people with the adequate level of skills required by the
labour market. This seems to imply an inappropriate investment in human capital, since these
overeducated workers have received extra-education that have proof not to be needed in the
workplace. This phenomenon is more common Southern European countries, France and Ireland which
are characterized by a low level of tracking and by more general training. In this respect policies may
79
intervene on the side of training, by providing more job-related skills to people with medium-high
educational level (those who are over-educated). Similar policies should go in the direction of making
the educational systems closer to the labour market, in particular in countries where the system is less
stratified and the education provided is general. It may go through a modernization of curricula and
teaching methods, with the aim of providing not any kind of knowledge, but the kind of knowledge
which can actually increase abilities and skills of students.
Alternatively, there is another interesting group composed of people who are over-skilled (skill
mismatched) but not over-educated. This means that while they own the proper educational
qualification, they also own more skills than what is required for the job they perform suggesting
potential improvement on their relative labour market position.
Interestingly, the highest share of skill mismatched people is in the top performing countries in both in
terms of educational outcomes provided by PISA and in terms of skills outcomes provided by PIAAC.
Thus, already top performing countries also have the potential of improving their relative position by
benefitting of a reservoir of skills owned by their working age population.
In conclusion, whatever dimension mismatch implies, it always highlights some inefficiency of the
system. In the case of education mismatch the students/workers study too much or study a kind of
knowledge which is then not transferred in skills, and in the case of skill mismatch there is an
unexploited reservoir of skills. Problems may arise due to the fact that the distribution of mismatch
seems to draw a sort of ‘two-speed’ Europe in which typically best performing countries (in several
domains: education, economics, welfare) are also those affected by a ‘positive’ mismatch: they are
endowed with a reservoir of high level skills, which potentially can even further improve their
performances, activating a virtuous cycle. On the other side, education mismatch, which is the one
generating the most negative effects (lower productivity, psychological stress, …) not only is affecting a
larger share of population (compared to skill mismatch) but it also mainly affects countries which are
already low performers in education and economics (e.g. Spain, Ireland, Estonia).
80
References
Alba-Ramírez, Alfonso. 1993. ‘Mismatch in the Spanish Labour Market: Overeducation?’ THE JO URNAL OF HUMAN RESOURCES XXVIII (2): 259–78.
Allen, Jim, and Egbert De Weert. 2007. ‘What Do Educational Mismatches Tell Us About Skill Mismatches? A Cross-Country Analysis’. European Journal of Education 42 (1): 59–73. doi:10.1111/j.1465-3435.2007.00283.x.
Allen, Jim, and Rolf van der Velden. 2001. ‘Educational Mismatches versus Skill Mismatches: Effects on Wages, Job Satisfaction, and On-the-Job Search’. Oxford Economic Papers 53 (3): 434–52.
Allen,, Jim, Rolf van der Velden, and Mark Levels. 2013. ‘Skill Mismatch and Use in Developed Countries: Evidence from the PIAAC Study’. RM/13/061. Maastricht University, School of Business and Economics.
Allmendinger, Jutta. 1989. ‘Educational Systems and Labor Market Outcomes’. European Sociological Review 5 (3): 231–50.
Baert, Stijn, Bart Cockx, and Dieter Verhaest. 2013. ‘Overeducation at the Start of the Career: Stepping Stone or Trap?’ Labour Economics 25 (December). European Association of Labour Economists 24th Annual Conference, Bonn, Germany, 20-22 September 2012: 123–40. doi:10.1016/j.labeco.2013.04.013.
Battu, H., C. R. Belfield, and P. J. Sloane. 2000. ‘How Well Can We Measure Graduate Over- Education and Its Effects?’ National Institute Economic Review 171 (1): 82–93. doi:10.1177/002795010017100107.
Bauer, Thomas K. 2002. ‘Educational Mismatch and Wages: A Panel Analysis’. Economics of Education Review 21 (3): 221–29. doi:10.1016/S0272-7757(01)00004-8.
Brynin, Malcolm. 2002. ‘Overqualification in Employment’. Work, Employment & Society 16 (4): 637–54. doi:10.1177/095001702321587406.
Buchel, Felix. 2001. ‘Overqualification: Reasons, Measurement Issues and Typological Affinity to Unemployment’. http://www.voced.edu.au/node/19993.
Cedefop. 2010. The Skill Matching Challenge: Analysing Skill Mismatch and Policy Implications. Luxembourg: Publications Office of the European Union.
Chevalier, Arnaud. 2003. ‘Measuring Over-Education’. Economica 70 (279): 509–31. doi:10.1111/1468-0335.t01-1-00296.
Chevalier, Arnaud, and Joanne Lindley. 2009. ‘Overeducation and the Skills of UK Graduates’. Journal of the Royal Statistical Society: Series A (Statistics in Society) 172 (2): 307–37. doi:10.1111/j.1467-985X.2008.00578.x.
Croce, Giuseppe, and Emanuela Ghignoni. 2012. ‘Demand and Supply of Skilled Labour and Overeducation in Europe: A Country-Level Analysis’. Comparative Economic Studies 54 (2): 413–39. doi:10.1057/ces.2012.12.
Desjardins, Richard, and Kjell Rubenson. 2011. ‘An Analysis of Skill Mismatch Using Direct Measures of Skills’. OECD Education Working Papers. Paris: Organisation for Economic Co-operation and Development. http://www.oecd-ilibrary.org/content/workingpaper/5kg3nh9h52g5-en.
Dolado, Juan J., Carlos García-Serrano, and Juan F. Jimeno. 2002. ‘Drawing Lessons from the Boom of
81
Temporary Jobs in Spain’. The Economic Journal 112 (480): F270–F295.
Dolton, Peter J., and Mary A. Silles. 2008. ‘The Effects of over-Education on Earnings in the Graduate Labour Market’. Economics of Education Review 27 (2): 125–39. doi:10.1016/j.econedurev.2006.08.008.
Dorn, David, and Alfonso Sousa-Poza. 2005. ‘Overqualification: Permanent or Transitory?’ University of St. Gallen.
Duncan, Greg J., and Saul D. Hoffman. 1981. ‘The Incidence and Wage Effects of Overeducation’. Economics of Education Review 1 (1): 75–86.
Elias, Peter, and Kate Purcell. 2004. ‘Is Mass Higher Education Working? Evidence from the Labour Market Experiences of Recent Graduates’. National Institute Economic Review 190 (1): 60–74. doi:10.1177/002795010419000107.
‘Europe’s Skill Challenge: Lagging Skill Demand Increases Risks of Skill Mismatch. Briefing Note’. 2012. Cedefop - European Centre for the Development of Vocational Training.
Freeman, Richard B. 1976. The over-Educated American. New York: Academic Press.
Frei, Christa, and Alfonso Sousa-Poza. 2012. ‘Overqualification: Permanent or Transitory?’ Applied Economics 44 (14): 1837–47. doi:10.1080/00036846.2011.554380.
Galasi, Peter. 2008. ‘The Effect of Educational Mismatch on Wages for 25 Countries’. 8-2008. Working Papers on the Labour Market. Budapest: Institute of Economics, Hungarian Academy of Sciences.
Ghignoni, Emanuela. 2001. ‘Frontiere Di Competenza Overeducation E Rendimento Economico Dell’istruzione Nel Mercato Del Lavoro Italiano Degli Anni ’90’. Rivista Di Politica Economica 91 (6): 115–58.
———. 2012. ‘Young Workers’ Overeducation and Cohort Effects in “P.I.G.S.” Countries versus the Netherlands: A Pseudo- Panel Analysis’. Rivista Di Politica Economica, no. 1: 197–243.
Green, F., and Y. Zhu. 2010. ‘Overqualification, Job Dissatisfaction, and Increasing Dispersion in the Returns to Graduate Education’. Oxford Economic Papers 62 (4): 740–63. doi:10.1093/oep/gpq002.
Green, Francis, and Steven McIntosh. 2007. ‘Is There a Genuine under-Utilization of Skills amongst the over-Qualified?’ Applied Economics 39 (4): 427–39.
Groeneveld, Sandra M. 1997. ‘Passend Meten. Over Definities En Metingen van Overscholing’. Tijdschrift Voor Arbeidsvraagstukken 13: 273–82.
Groot, Wim, and H.M. van den Brink. 2000a. ‘Skill Mismatches in the Dutch Labor Market’. International Journal of Manpower 21 (8): 584–95. doi:10.1108/01437720010379493.
Groot, Wim, and Henriëtte Maassen van den Brink. 2000b. ‘Overeducation in the Labor Market: A Meta-Analysis’. Economics of Education Review 19 (2): 149–58. doi:10.1016/S0272-7757(99)00057-6.
Halaby, Charles N. 1994. ‘Overeducation and Skill Mismatch’. Sociology of Education 67 (1): 47–59. doi:10.2307/2112749.
Hartog, Joop. 2000. ‘Over-Education and Earnings: Where Are We, Where Should We Go?’ Economics of Education Review 19: 131–47.
82
Hartog, Joop, and Hessel Oosterbeek. 1988. ‘Education, Allocation and Earnings in the Netherlands: Overschooling?’ Economics of Education Review 7 (2): 185–94.
Kiker, B.F., Maria C. Santos, and M. Mendes De Oliveira. 1997. ‘Overeducation and Undereducation: Evidence for Portugal’. Economics of Education Review 16 (2): 111–25.
Krahn, Harvey, and Graham S. Lowe. 1998. ‘Literacy Utilization in Canadian Workplaces’. Ottawa and Hull: Statistics Canada and Human Resource Development Canada.
Lainé, Frédéric, and Mahrez Okba. 2005. ‘Jeunes de Parents Immigrés : De L’école Au Métier’. Travail et Emploi 103 (3).
Leuven,, Edwin, and Hessel Oosterbeek. 2011. ‘Overeducation and Mismatch in the Labor Market’. IZA DP No. 5523. Discussion Paper Series. Institute for the Study of Labor (IZA).
Mavromaras, Kostas G., Seamus McGuinness, and Yin King Fok. 2007. ‘Assessing the Incidence and Wage Effects of Over-Skilling in the Australian Labour Market’. IZA Discussion Paper 2837. Institute for the Study of Labor (IZA). http://ideas.repec.org/p/iza/izadps/dp2837.html.
Mavromaras, Kostas, and Seamus McGuinness. 2012. ‘Overskilling Dynamics and Education Pathways’. Economics of Education Review 31 (5): 619–28. doi:10.1016/j.econedurev.2012.02.006.
Mavromaras, Kostas, Seamus McGuinness, Nigel O’Leary, Peter Sloane, and Zhang Wei. 2010. ‘Job Mismatches and Labour Market Outcomes: Panel Evidence on Australian University Graduates’. IZA DP No. 5083. Discussion Paper Series. Institute for the Study of Labor (IZA).
Mavromaras, Kostas, Seamus McGuinness, and Mark Wooden. 2007. ‘Overskilling in the Australian Labour Market’. Australian Economic Review 40 (3): 307–12. doi:10.1111/j.1467-8462.2007.00468.x.
McGoldrick, KimMarie, and John Robst. 1996. ‘Gender Differences in Overeducation: A Test of the Theory of Differential Overqualification’. American Economic Review 86 (2): 280–84.
McGuinness, Séamus. 2006. ‘Overeducation in the Labour Market’. Journal of Economic Surveys 20 (3): 387–418. doi:10.1111/j.0950-0804.2006.00284.x.
McGuinness, Seamus, and Mark Wooden. 2009. ‘Overskilling, Job Insecurity, and Career Mobility’. Industrial Relations: A Journal of Economy and Society 48 (2): 265–86. doi:10.1111/j.1468-232X.2009.00557.x.
Mendes de Oliveira, M., Maria C. Santos, and B.F. Kiker. 2000. ‘The Role of Human Capital and Technological Change in Overeducation’. Economics of Education Review 19: 199–206.
Nauze-Fichet, Emmanuelle, and Magda Tomasini. 2002. ‘Diplôme et Insertion Sur Le Marché Du Travail : Approches Socioprofessionnelle et Salariale Du Déclassement’. Economie et Statistique 354: 21–48.
OECD. 2013. OECD Skills Outlook 2013: First Results from the Survey of Adult Skills. http://dx.doi.org/10.1787/9789264204256-en.
Oosterbeek, Hessel. 2000. ‘Introduction to Special Issue on Overschooling’. Economics of Education Review 19 (2): 129–30. doi:10.1016/S0272-7757(99)00040-0.
Ortiz, Luis. 2010. ‘Not the Right Job, but a Secure One over-Education and Temporary Employment in France, Italy and Spain’. Work, Employment & Society 24 (1): 47–64. doi:10.1177/0950017009353657.
83
Pellizzari, Michele, and Anne Fichen. 2013. ‘A New Measure of Skills Mismatch’. OECD Social, Employment and Migration Working Papers. Paris: Organisation for Economic Co-operation and Development. http://www.oecd-ilibrary.org/content/workingpaper/5k3tpt04lcnt-en.
Quinn, Michael A., and Stephen Rubb. 2006. ‘Mexico’s Labor Market: The Importance of Education-Occupation Matching on Wages and Productivity in Developing Countries’. Economics of Education Review 25 (2): 147–56.
Quintini, Glenda. 2011. ‘Over-Qualified or Under-Skilled’. OECD Social, Employment and Migration Working Papers. Paris: Organisation for Economic Co-operation and Development. http://www.oecd-ilibrary.org/content/workingpaper/5kg58j9d7b6d-en.
Rumberger, Russell W. 1987. ‘The Impact of Surplus Schooling on Productivity and Earnings’. The Journal of Human Resources 22 (1): 24. doi:10.2307/145865.
Sicherman, Nachum. 1991. ‘“Overeducation” in the Labor Market’. Journal of Labor Economics 9 (2): 101–22.
Sloane, P. J., H. Battu, and P. T. Seaman. 1999. ‘Overeducation, Undereducation and the British Labour Market’. Applied Economics 31 (11): 1437–53. doi:10.1080/000368499323319.
Tsang, Mun C., and Henry M. Levin. 1985. ‘The Economics of Overeducation’. Economics of Education Review 4 (2): 93–104.
Verdugo, Richard R., and Naomi Turner Verdugo. 1989. ‘The Impact of Surplus Schooling on Earnings: Some Additional Findings’. The Journal of Human Resources 24 (4): 629. doi:10.2307/145998.
Verhaest, Dieter, and Eddy Omey. 2006. ‘The Impact of Overeducation and Its Measurement’. Social Indicators Research 77 (3): 419–48. doi:10.1007/s11205-005-4276-6.
Vieira, José A. Cabral. 2005. ‘Skill Mismatches and Job Satisfaction’. Economics Letters 89 (1): 39–47.
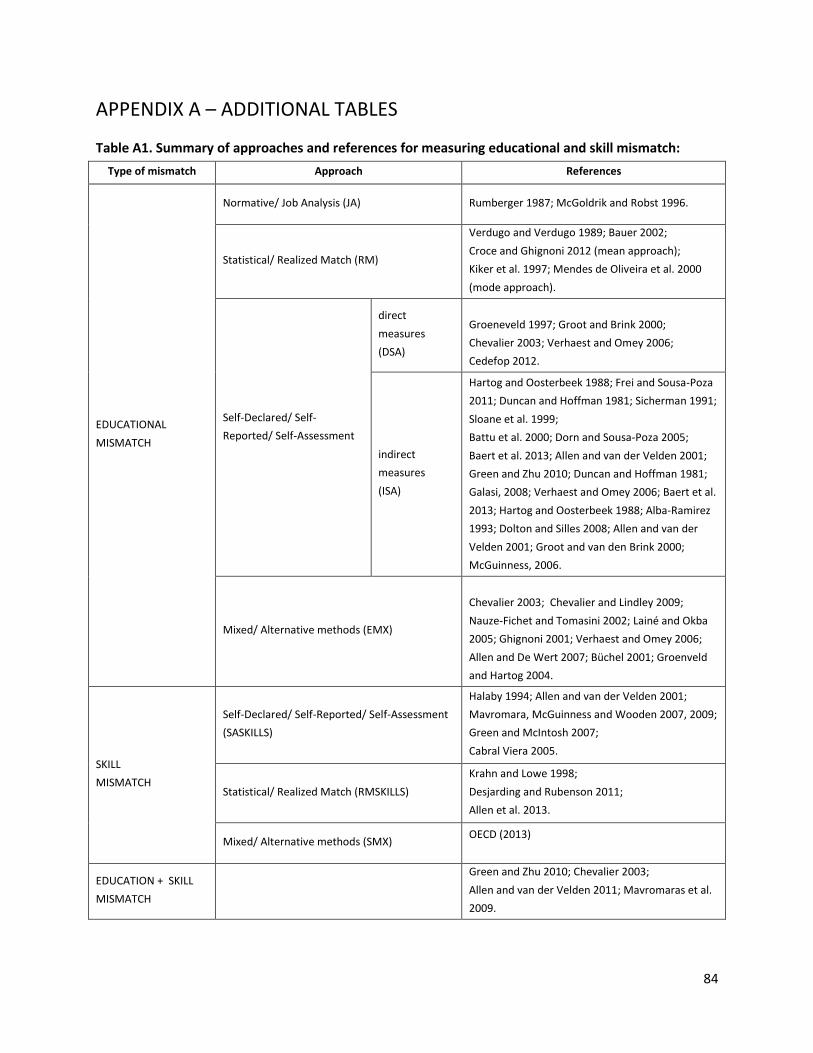
84
APPENDIX A – ADDITIONAL TABLES
Table A1. Summary of approaches and references for measuring educational and skill mismatch:
Type of mismatch Approach References
EDUCATIONAL
MISMATCH
Normative/ Job Analysis (JA) Rumberger 1987; McGoldrik and Robst 1996.
Statistical/ Realized Match (RM)
Verdugo and Verdugo 1989; Bauer 2002;
Croce and Ghignoni 2012 (mean approach);
Kiker et al. 1997; Mendes de Oliveira et al. 2000
(mode approach).
Self-Declared/ Self-
Reported/ Self-Assessment
direct
measures
(DSA)
Groeneveld 1997; Groot and Brink 2000;
Chevalier 2003; Verhaest and Omey 2006;
Cedefop 2012.
indirect
measures
(ISA)
Hartog and Oosterbeek 1988; Frei and Sousa-Poza
2011; Duncan and Hoffman 1981; Sicherman 1991;
Sloane et al. 1999;
Battu et al. 2000; Dorn and Sousa-Poza 2005;
Baert et al. 2013; Allen and van der Velden 2001;
Green and Zhu 2010; Duncan and Hoffman 1981;
Galasi, 2008; Verhaest and Omey 2006; Baert et al.
2013; Hartog and Oosterbeek 1988; Alba-Ramirez
1993; Dolton and Silles 2008; Allen and van der
Velden 2001; Groot and van den Brink 2000;
McGuinness, 2006.
Mixed/ Alternative methods (EMX)
Chevalier 2003; Chevalier and Lindley 2009;
Nauze-Fichet and Tomasini 2002; Lainé and Okba
2005; Ghignoni 2001; Verhaest and Omey 2006;
Allen and De Wert 2007; Büchel 2001; Groenveld
and Hartog 2004.
SKILL
MISMATCH
Self-Declared/ Self-Reported/ Self-Assessment
(SASKILLS)
Halaby 1994; Allen and van der Velden 2001;
Mavromara, McGuinness and Wooden 2007, 2009;
Green and McIntosh 2007;
Cabral Viera 2005.
Statistical/ Realized Match (RMSKILLS)
Krahn and Lowe 1998;
Desjarding and Rubenson 2011;
Allen et al. 2013.
Mixed/ Alternative methods (SMX) OECD (2013)
EDUCATION + SKILL
MISMATCH
Green and Zhu 2010; Chevalier 2003;
Allen and van der Velden 2011; Mavromaras et al.
2009.
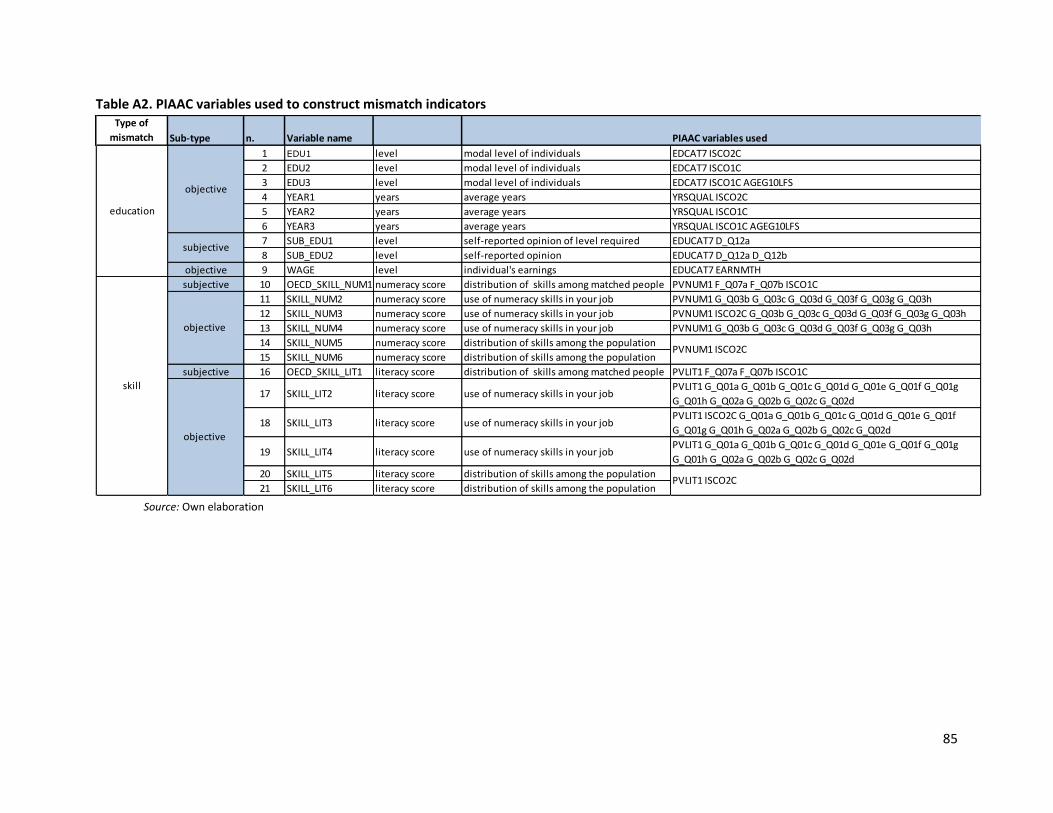
85
Table A2. PIAAC variables used to construct mismatch indicators
Source: Own elaboration
Type of
mismatch Sub-type n. Variable name PIAAC variables used
1 EDU1 level modal level of individuals EDCAT7 ISCO2C
2 EDU2 level modal level of individuals EDCAT7 ISCO1C
3 EDU3 level modal level of individuals EDCAT7 ISCO1C AGEG10LFS
4 YEAR1 years average years YRSQUAL ISCO2C
5 YEAR2 years average years YRSQUAL ISCO1C
6 YEAR3 years average years YRSQUAL ISCO1C AGEG10LFS
7 SUB_EDU1 level self-reported opinion of level required EDUCAT7 D_Q12a
8 SUB_EDU2 level self-reported opinion EDUCAT7 D_Q12a D_Q12b
objective 9 WAGE level individual's earnings EDUCAT7 EARNMTH
subjective 10 OECD_SKILL_NUM1 numeracy score distribution of skills among matched people PVNUM1 F_Q07a F_Q07b ISCO1C
11 SKILL_NUM2 numeracy score use of numeracy skills in your job PVNUM1 G_Q03b G_Q03c G_Q03d G_Q03f G_Q03g G_Q03h
12 SKILL_NUM3 numeracy score use of numeracy skills in your job PVNUM1 ISCO2C G_Q03b G_Q03c G_Q03d G_Q03f G_Q03g G_Q03h
13 SKILL_NUM4 numeracy score use of numeracy skills in your job PVNUM1 G_Q03b G_Q03c G_Q03d G_Q03f G_Q03g G_Q03h
14 SKILL_NUM5 numeracy score distribution of skills among the population
15 SKILL_NUM6 numeracy score distribution of skills among the population
subjective 16 OECD_SKILL_LIT1 literacy score distribution of skills among matched people PVLIT1 F_Q07a F_Q07b ISCO1C
17 SKILL_LIT2 literacy score use of numeracy skills in your job PVLIT1 G_Q01a G_Q01b G_Q01c G_Q01d G_Q01e G_Q01f G_Q01g
G_Q01h G_Q02a G_Q02b G_Q02c G_Q02d
18 SKILL_LIT3 literacy score use of numeracy skills in your job PVLIT1 ISCO2C G_Q01a G_Q01b G_Q01c G_Q01d G_Q01e G_Q01f
G_Q01g G_Q01h G_Q02a G_Q02b G_Q02c G_Q02d
19 SKILL_LIT4 literacy score use of numeracy skills in your job PVLIT1 G_Q01a G_Q01b G_Q01c G_Q01d G_Q01e G_Q01f G_Q01g
G_Q01h G_Q02a G_Q02b G_Q02c G_Q02d
20 SKILL_LIT5 literacy score distribution of skills among the population
21 SKILL_LIT6 literacy score distribution of skills among the population
education
subjective
objective
PVLIT1 ISCO2C
PVNUM1 ISCO2C
skill
objective
objective
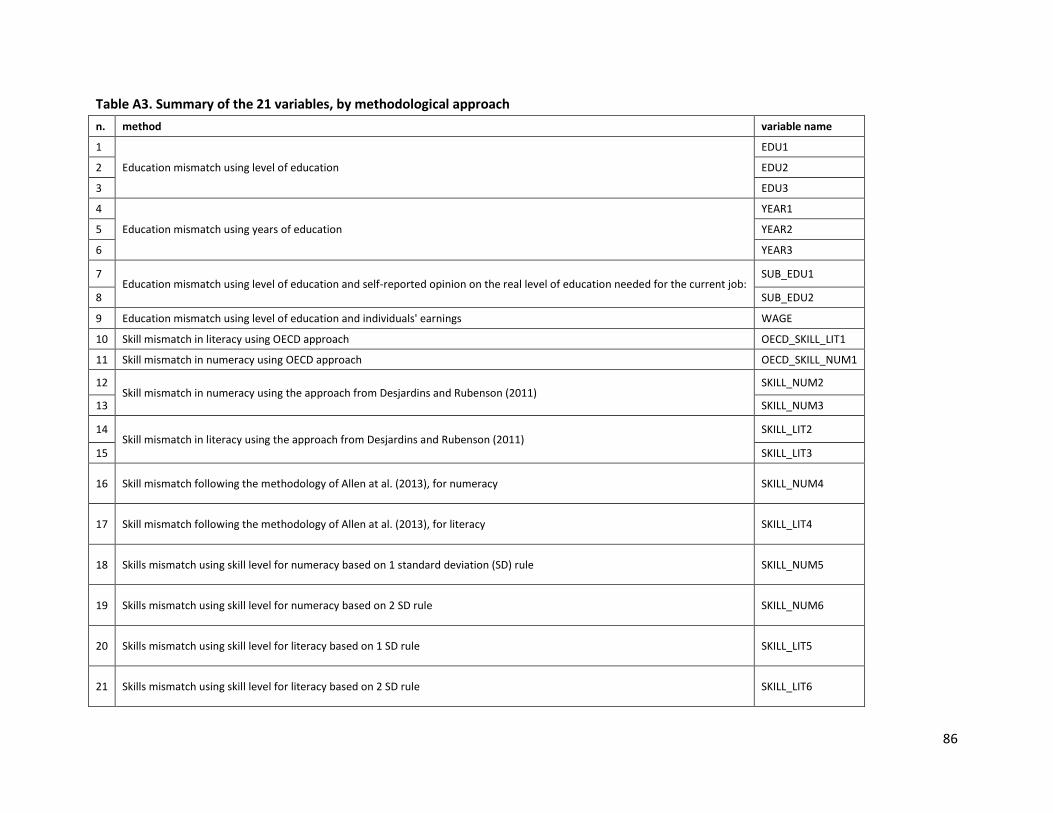
86
Table A3. Summary of the 21 variables, by methodological approach
n. method variable name
1
Education mismatch using level of education
EDU1
2 EDU2
3 EDU3
4
Education mismatch using years of education
YEAR1
5 YEAR2
6 YEAR3
7 Education mismatch using level of education and self-reported opinion on the real level of education needed for the current job:
SUB_EDU1
8 SUB_EDU2
9 Education mismatch using level of education and individuals' earnings WAGE
10 Skill mismatch in literacy using OECD approach OECD_SKILL_LIT1
11 Skill mismatch in numeracy using OECD approach OECD_SKILL_NUM1
12 Skill mismatch in numeracy using the approach from Desjardins and Rubenson (2011)
SKILL_NUM2
13 SKILL_NUM3
14 Skill mismatch in literacy using the approach from Desjardins and Rubenson (2011)
SKILL_LIT2
15 SKILL_LIT3
16 Skill mismatch following the methodology of Allen at al. (2013), for numeracy SKILL_NUM4
17 Skill mismatch following the methodology of Allen at al. (2013), for literacy SKILL_LIT4
18 Skills mismatch using skill level for numeracy based on 1 standard deviation (SD) rule SKILL_NUM5
19 Skills mismatch using skill level for numeracy based on 2 SD rule SKILL_NUM6
20 Skills mismatch using skill level for literacy based on 1 SD rule SKILL_LIT5
21 Skills mismatch using skill level for literacy based on 2 SD rule SKILL_LIT6
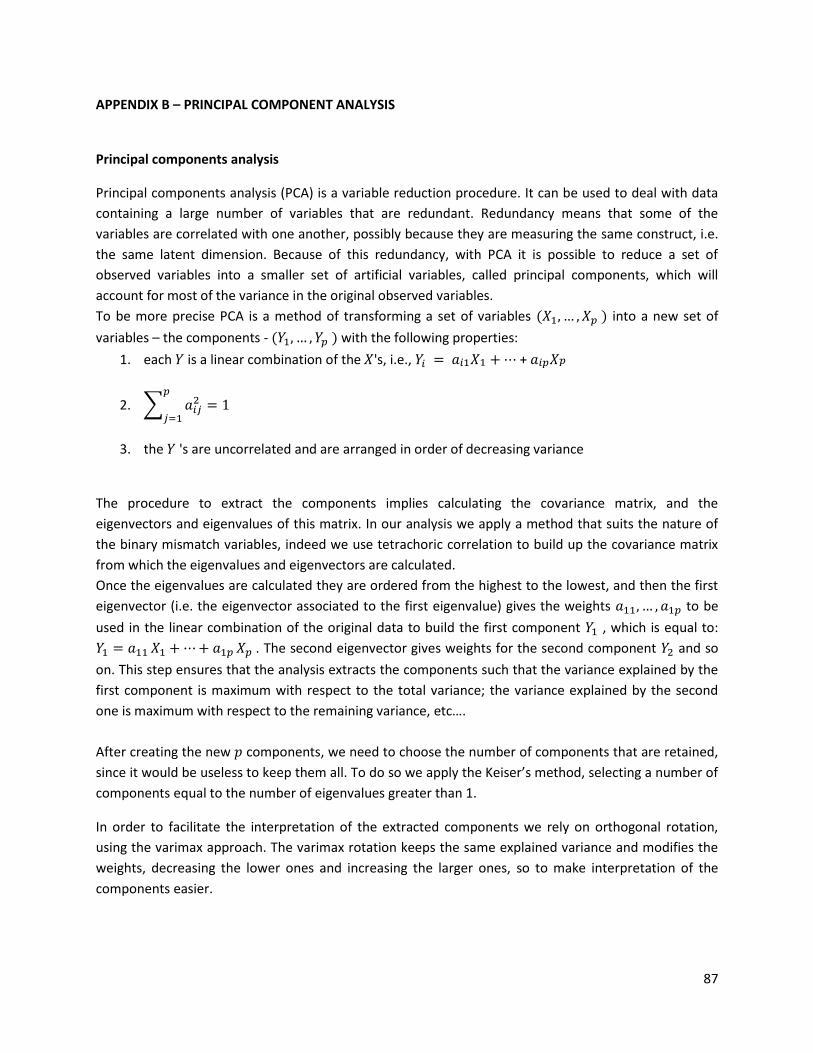
87
APPENDIX B – PRINCIPAL COMPONENT ANALYSIS
Principal components analysis
Principal components analysis (PCA) is a variable reduction procedure. It can be used to deal with data
containing a large number of variables that are redundant. Redundancy means that some of the
variables are correlated with one another, possibly because they are measuring the same construct, i.e.
the same latent dimension. Because of this redundancy, with PCA it is possible to reduce a set of
observed variables into a smaller set of artificial variables, called principal components, which will
account for most of the variance in the original observed variables.
To be more precise PCA is a method of transforming a set of variables into a new set of
variables – the components - with the following properties:
1. each is a linear combination of the 's, i.e., +
2. ∑
3. the 's are uncorrelated and are arranged in order of decreasing variance
The procedure to extract the components implies calculating the covariance matrix, and the
eigenvectors and eigenvalues of this matrix. In our analysis we apply a method that suits the nature of
the binary mismatch variables, indeed we use tetrachoric correlation to build up the covariance matrix
from which the eigenvalues and eigenvectors are calculated.
Once the eigenvalues are calculated they are ordered from the highest to the lowest, and then the first
eigenvector (i.e. the eigenvector associated to the first eigenvalue) gives the weights to be
used in the linear combination of the original data to build the first component , which is equal to:
. The second eigenvector gives weights for the second component and so
on. This step ensures that the analysis extracts the components such that the variance explained by the
first component is maximum with respect to the total variance; the variance explained by the second
one is maximum with respect to the remaining variance, etc….
After creating the new components, we need to choose the number of components that are retained,
since it would be useless to keep them all. To do so we apply the Keiser’s method, selecting a number of
components equal to the number of eigenvalues greater than 1.
In order to facilitate the interpretation of the extracted components we rely on orthogonal rotation,
using the varimax approach. The varimax rotation keeps the same explained variance and modifies the
weights, decreasing the lower ones and increasing the larger ones, so to make interpretation of the
components easier.
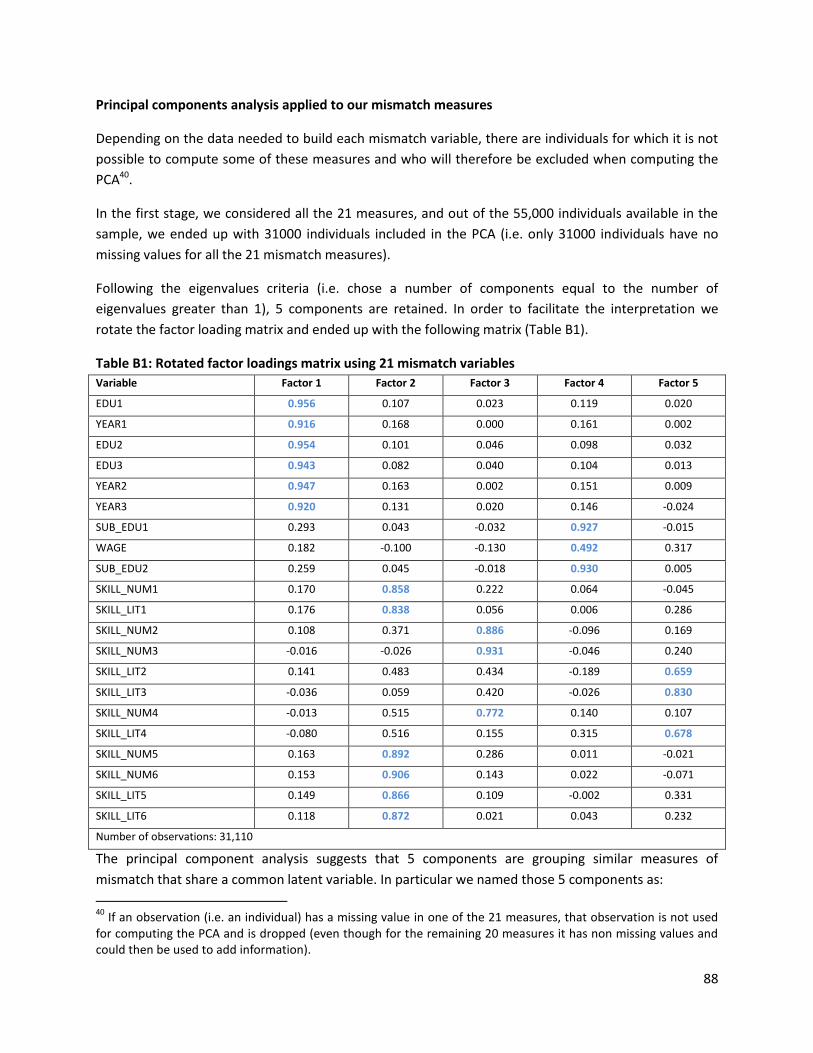
88
Principal components analysis applied to our mismatch measures
Depending on the data needed to build each mismatch variable, there are individuals for which it is not
possible to compute some of these measures and who will therefore be excluded when computing the
PCA40.
In the first stage, we considered all the 21 measures, and out of the 55,000 individuals available in the
sample, we ended up with 31000 individuals included in the PCA (i.e. only 31000 individuals have no
missing values for all the 21 mismatch measures).
Following the eigenvalues criteria (i.e. chose a number of components equal to the number of
eigenvalues greater than 1), 5 components are retained. In order to facilitate the interpretation we
rotate the factor loading matrix and ended up with the following matrix (Table B1).
Table B1: Rotated factor loadings matrix using 21 mismatch variables
Variable Factor 1 Factor 2 Factor 3 Factor 4 Factor 5
EDU1 0.956 0.107 0.023 0.119 0.020
YEAR1 0.916 0.168 0.000 0.161 0.002
EDU2 0.954 0.101 0.046 0.098 0.032
EDU3 0.943 0.082 0.040 0.104 0.013
YEAR2 0.947 0.163 0.002 0.151 0.009
YEAR3 0.920 0.131 0.020 0.146 -0.024
SUB_EDU1 0.293 0.043 -0.032 0.927 -0.015
WAGE 0.182 -0.100 -0.130 0.492 0.317
SUB_EDU2 0.259 0.045 -0.018 0.930 0.005
SKILL_NUM1 0.170 0.858 0.222 0.064 -0.045
SKILL_LIT1 0.176 0.838 0.056 0.006 0.286
SKILL_NUM2 0.108 0.371 0.886 -0.096 0.169
SKILL_NUM3 -0.016 -0.026 0.931 -0.046 0.240
SKILL_LIT2 0.141 0.483 0.434 -0.189 0.659
SKILL_LIT3 -0.036 0.059 0.420 -0.026 0.830
SKILL_NUM4 -0.013 0.515 0.772 0.140 0.107
SKILL_LIT4 -0.080 0.516 0.155 0.315 0.678
SKILL_NUM5 0.163 0.892 0.286 0.011 -0.021
SKILL_NUM6 0.153 0.906 0.143 0.022 -0.071
SKILL_LIT5 0.149 0.866 0.109 -0.002 0.331
SKILL_LIT6 0.118 0.872 0.021 0.043 0.232
Number of observations: 31,110
The principal component analysis suggests that 5 components are grouping similar measures of
mismatch that share a common latent variable. In particular we named those 5 components as:
40
If an observation (i.e. an individual) has a missing value in one of the 21 measures, that observation is not used for computing the PCA and is dropped (even though for the remaining 20 measures it has non missing values and could then be used to add information).
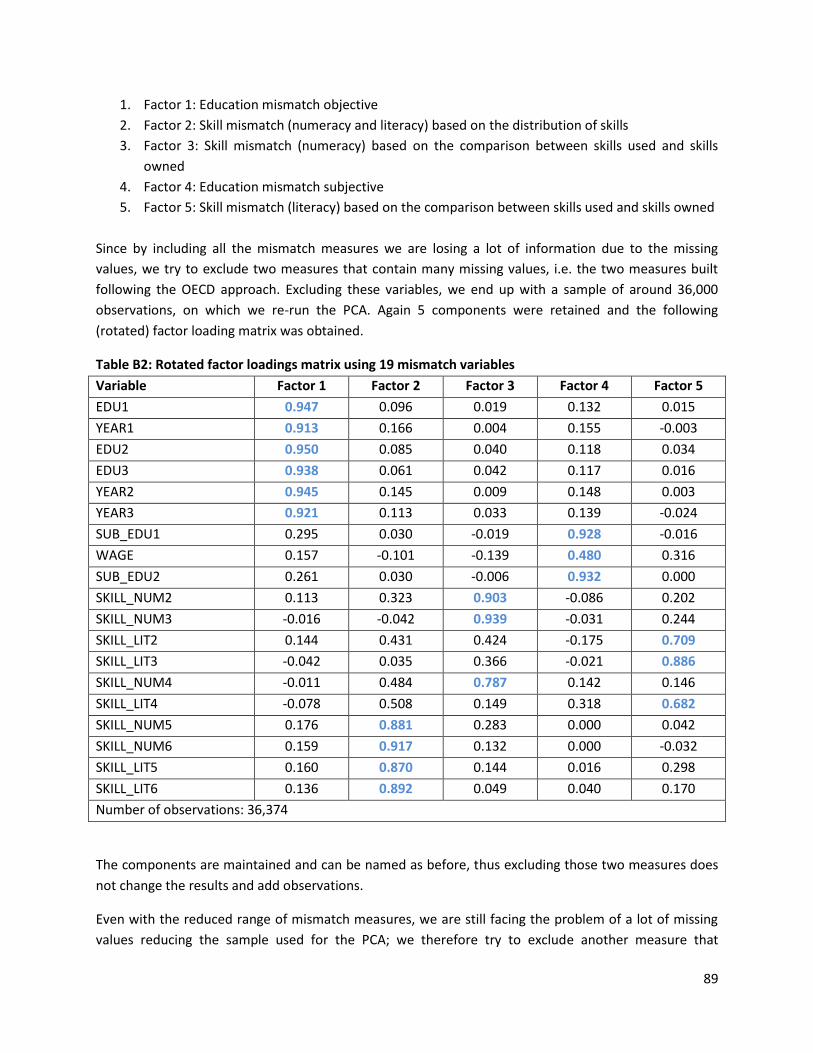
89
1. Factor 1: Education mismatch objective
2. Factor 2: Skill mismatch (numeracy and literacy) based on the distribution of skills
3. Factor 3: Skill mismatch (numeracy) based on the comparison between skills used and skills
owned
4. Factor 4: Education mismatch subjective
5. Factor 5: Skill mismatch (literacy) based on the comparison between skills used and skills owned
Since by including all the mismatch measures we are losing a lot of information due to the missing
values, we try to exclude two measures that contain many missing values, i.e. the two measures built
following the OECD approach. Excluding these variables, we end up with a sample of around 36,000
observations, on which we re-run the PCA. Again 5 components were retained and the following
(rotated) factor loading matrix was obtained.
Table B2: Rotated factor loadings matrix using 19 mismatch variables
Variable Factor 1 Factor 2 Factor 3 Factor 4 Factor 5
EDU1 0.947 0.096 0.019 0.132 0.015
YEAR1 0.913 0.166 0.004 0.155 -0.003
EDU2 0.950 0.085 0.040 0.118 0.034
EDU3 0.938 0.061 0.042 0.117 0.016
YEAR2 0.945 0.145 0.009 0.148 0.003
YEAR3 0.921 0.113 0.033 0.139 -0.024
SUB_EDU1 0.295 0.030 -0.019 0.928 -0.016
WAGE 0.157 -0.101 -0.139 0.480 0.316
SUB_EDU2 0.261 0.030 -0.006 0.932 0.000
SKILL_NUM2 0.113 0.323 0.903 -0.086 0.202
SKILL_NUM3 -0.016 -0.042 0.939 -0.031 0.244
SKILL_LIT2 0.144 0.431 0.424 -0.175 0.709
SKILL_LIT3 -0.042 0.035 0.366 -0.021 0.886
SKILL_NUM4 -0.011 0.484 0.787 0.142 0.146
SKILL_LIT4 -0.078 0.508 0.149 0.318 0.682
SKILL_NUM5 0.176 0.881 0.283 0.000 0.042
SKILL_NUM6 0.159 0.917 0.132 0.000 -0.032
SKILL_LIT5 0.160 0.870 0.144 0.016 0.298
SKILL_LIT6 0.136 0.892 0.049 0.040 0.170
Number of observations: 36,374
The components are maintained and can be named as before, thus excluding those two measures does
not change the results and add observations.
Even with the reduced range of mismatch measures, we are still facing the problem of a lot of missing
values reducing the sample used for the PCA; we therefore try to exclude another measure that
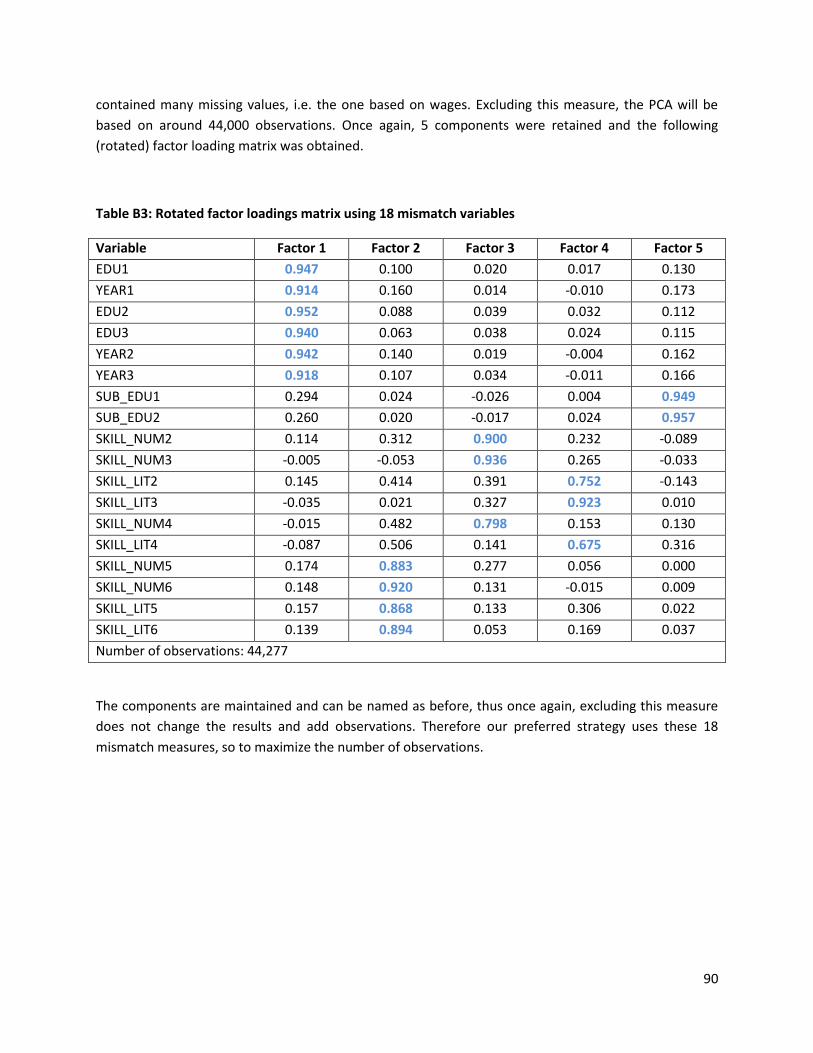
90
contained many missing values, i.e. the one based on wages. Excluding this measure, the PCA will be
based on around 44,000 observations. Once again, 5 components were retained and the following
(rotated) factor loading matrix was obtained.
Table B3: Rotated factor loadings matrix using 18 mismatch variables
Variable Factor 1 Factor 2 Factor 3 Factor 4 Factor 5
EDU1 0.947 0.100 0.020 0.017 0.130
YEAR1 0.914 0.160 0.014 -0.010 0.173
EDU2 0.952 0.088 0.039 0.032 0.112
EDU3 0.940 0.063 0.038 0.024 0.115
YEAR2 0.942 0.140 0.019 -0.004 0.162
YEAR3 0.918 0.107 0.034 -0.011 0.166
SUB_EDU1 0.294 0.024 -0.026 0.004 0.949
SUB_EDU2 0.260 0.020 -0.017 0.024 0.957
SKILL_NUM2 0.114 0.312 0.900 0.232 -0.089
SKILL_NUM3 -0.005 -0.053 0.936 0.265 -0.033
SKILL_LIT2 0.145 0.414 0.391 0.752 -0.143
SKILL_LIT3 -0.035 0.021 0.327 0.923 0.010
SKILL_NUM4 -0.015 0.482 0.798 0.153 0.130
SKILL_LIT4 -0.087 0.506 0.141 0.675 0.316
SKILL_NUM5 0.174 0.883 0.277 0.056 0.000
SKILL_NUM6 0.148 0.920 0.131 -0.015 0.009
SKILL_LIT5 0.157 0.868 0.133 0.306 0.022
SKILL_LIT6 0.139 0.894 0.053 0.169 0.037
Number of observations: 44,277
The components are maintained and can be named as before, thus once again, excluding this measure
does not change the results and add observations. Therefore our preferred strategy uses these 18
mismatch measures, so to maximize the number of observations.
91
Europe Direct is a service to help you find answers to your questions about the European Union
Freephone number (*): 00 800 6 7 8 9 10 11
(*) Certain mobile telephone operators do not allow access to 00 800 numbers or these calls may be billed.
A great deal of additional information on the European Union is available on the Internet.
It can be accessed through the Europa server http://europa.eu/.
How to obtain EU publications
Our priced publications are available from EU Bookshop (http://bookshop.europa.eu),
where you can place an order with the sales agent of your choice.
The Publications Office has a worldwide network of sales agents.
You can obtain their contact details by sending a fax to (352) 29 29-42758.
European Commission
EUR 26618 EN– Joint Research Centre – Institute for the Security and Protection of the citizens
Title: Occupational mismatch in Europe: Understanding overeducation and overskilling for policy making
Author(s): Sara Flisi, Valentina Goglio, Elena Meroni, Margarida Rodrigues, Esperanza Vera Toscano
Luxembourg: Publications Office of the European Union
EUR – Scientific and Technical Research series – ISSN 1831–9424
ISBN 978-92-79-37852-2
doi: 10.2788/61733
Abstract
This technical report presents EU-17 evidence on the extent of different measures of overeducation and overskilling among working
age population in an attempt to provide a comprehensive understanding of the relationship between education and skill mismatch
within the broader definition of occupation mismatch. It further investigates how countries differ or share common patterns in terms
of amount and typology of mismatch, while investigating the socio-economic determinants responsible for different types of
occupational mismatch considered. Lastly, at a very exploratory level, it provides average predicted probabilities for the different
types of occupational mismatch identified using CEDEFOP skill forecast by educational level and occupation for 2020. Comparing
these predicted values provides a method of measuring the overall impact on occupational mismatch of differences in age, gender
or education level while controlling for other observed characteristics. Special attention is systematically paid to the role of
educational systems and policies in the matter
92