Embed Size (px)
Citation preview
OCCUPATIONAL PROJECTIONSMISSISSIPPI
2018-2028
22222222222222222222000000000000000000001111111111111111111188888888888888888888-------------------22222222222222222220000000000000000000022222222222222222222288888888888888888888
Helping Mississippians Get Jobs
LONG- TERM
for
GULF COASTCOMMUNITY COLLEGE DISTRICT
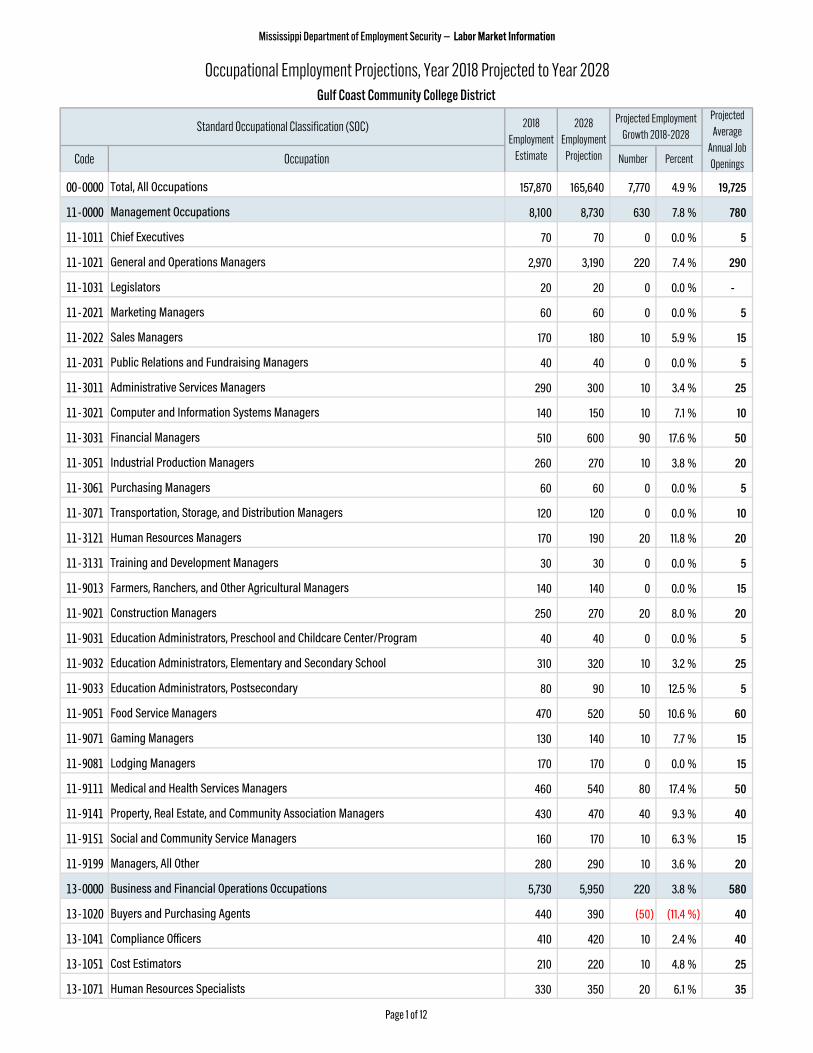
Mississippi Department of Employment Security — Labor Market Information
Code Occupation Number Percent
00-0000 Total, All Occupations 157,870 165,640 7,770 4.9 % 19,725
11-0000 Management Occupations 8,100 8,730 630 7.8 % 780
11-1011 Chief Executives 70 70 0 0.0 % 5
11-1021 General and Operations Managers 2,970 3,190 220 7.4 % 290
11-1031 Legislators 20 20 0 0.0 % -
11-2021 Marketing Managers 60 60 0 0.0 % 5
11-2022 Sales Managers 170 180 10 5.9 % 15
11-2031 Public Relations and Fundraising Managers 40 40 0 0.0 % 5
11-3011 Administrative Services Managers 290 300 10 3.4 % 25
11-3021 Computer and Information Systems Managers 140 150 10 7.1 % 10
11-3031 Financial Managers 510 600 90 17.6 % 50
11-3051 Industrial Production Managers 260 270 10 3.8 % 20
11-3061 Purchasing Managers 60 60 0 0.0 % 5
11-3071 Transportation, Storage, and Distribution Managers 120 120 0 0.0 % 10
11-3121 Human Resources Managers 170 190 20 11.8 % 20
11-3131 Training and Development Managers 30 30 0 0.0 % 5
11-9013 Farmers, Ranchers, and Other Agricultural Managers 140 140 0 0.0 % 15
11-9021 Construction Managers 250 270 20 8.0 % 20
11-9031 Education Administrators, Preschool and Childcare Center/Program 40 40 0 0.0 % 5
11-9032 Education Administrators, Elementary and Secondary School 310 320 10 3.2 % 25
11-9033 Education Administrators, Postsecondary 80 90 10 12.5 % 5
11-9051 Food Service Managers 470 520 50 10.6 % 60
11-9071 Gaming Managers 130 140 10 7.7 % 15
11-9081 Lodging Managers 170 170 0 0.0 % 15
11-9111 Medical and Health Services Managers 460 540 80 17.4 % 50
11-9141 Property, Real Estate, and Community Association Managers 430 470 40 9.3 % 40
11-9151 Social and Community Service Managers 160 170 10 6.3 % 15
11-9199 Managers, All Other 280 290 10 3.6 % 20
13-0000 Business and Financial Operations Occupations 5,730 5,950 220 3.8 % 580
13-1020 Buyers and Purchasing Agents 440 390 (50) (11.4 %) 40
13-1041 Compliance Officers 410 420 10 2.4 % 40
13-1051 Cost Estimators 210 220 10 4.8 % 25
13-1071 Human Resources Specialists 330 350 20 6.1 % 35
Occupational Employment Projections, Year 2018 Projected to Year 2028Gulf Coast Community College District
Standard Occupational Classification (SOC) 2018 Employment
Estimate
2028 Employment
Projection
Projected Employment Growth 2018-2028
Projected Average
Annual Job Openings
Page 1 of 12
Mississippi Department of Employment Security — Labor Market Information
Code Occupation Number Percent
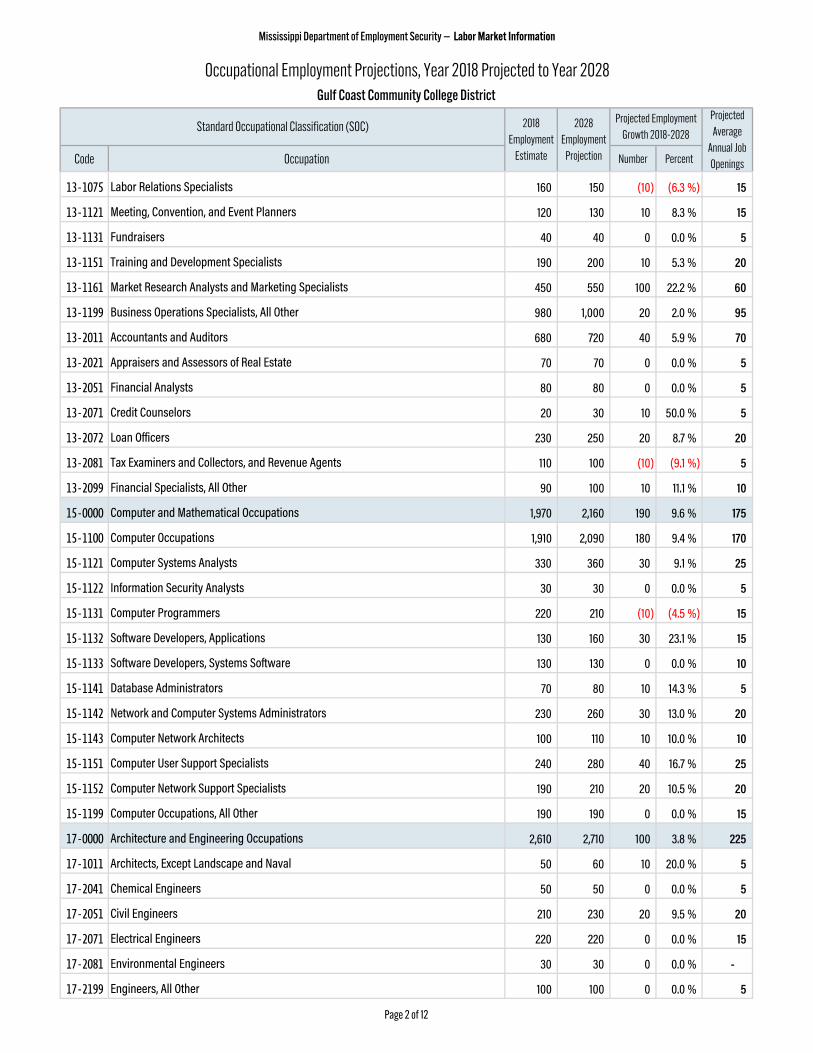
Occupational Employment Projections, Year 2018 Projected to Year 2028Gulf Coast Community College District
Standard Occupational Classification (SOC) 2018 Employment
Estimate
2028 Employment
Projection
Projected Employment Growth 2018-2028
Projected Average
Annual Job Openings
13-1075 Labor Relations Specialists 160 150 (10) (6.3 %) 15
13-1121 Meeting, Convention, and Event Planners 120 130 10 8.3 % 15
13-1131 Fundraisers 40 40 0 0.0 % 5
13-1151 Training and Development Specialists 190 200 10 5.3 % 20
13-1161 Market Research Analysts and Marketing Specialists 450 550 100 22.2 % 60
13-1199 Business Operations Specialists, All Other 980 1,000 20 2.0 % 95
13-2011 Accountants and Auditors 680 720 40 5.9 % 70
13-2021 Appraisers and Assessors of Real Estate 70 70 0 0.0 % 5
13-2051 Financial Analysts 80 80 0 0.0 % 5
13-2071 Credit Counselors 20 30 10 50.0 % 5
13-2072 Loan Officers 230 250 20 8.7 % 20
13-2081 Tax Examiners and Collectors, and Revenue Agents 110 100 (10) (9.1 %) 5
13-2099 Financial Specialists, All Other 90 100 10 11.1 % 10
15-0000 Computer and Mathematical Occupations 1,970 2,160 190 9.6 % 175
15-1100 Computer Occupations 1,910 2,090 180 9.4 % 170
15-1121 Computer Systems Analysts 330 360 30 9.1 % 25
15-1122 Information Security Analysts 30 30 0 0.0 % 5
15-1131 Computer Programmers 220 210 (10) (4.5 %) 15
15-1132 Software Developers, Applications 130 160 30 23.1 % 15
15-1133 Software Developers, Systems Software 130 130 0 0.0 % 10
15-1141 Database Administrators 70 80 10 14.3 % 5
15-1142 Network and Computer Systems Administrators 230 260 30 13.0 % 20
15-1143 Computer Network Architects 100 110 10 10.0 % 10
15-1151 Computer User Support Specialists 240 280 40 16.7 % 25
15-1152 Computer Network Support Specialists 190 210 20 10.5 % 20
15-1199 Computer Occupations, All Other 190 190 0 0.0 % 15
17-0000 Architecture and Engineering Occupations 2,610 2,710 100 3.8 % 225
17-1011 Architects, Except Landscape and Naval 50 60 10 20.0 % 5
17-2041 Chemical Engineers 50 50 0 0.0 % 5
17-2051 Civil Engineers 210 230 20 9.5 % 20
17-2071 Electrical Engineers 220 220 0 0.0 % 15
17-2081 Environmental Engineers 30 30 0 0.0 % -
17-2199 Engineers, All Other 100 100 0 0.0 % 5
Page 2 of 12
Mississippi Department of Employment Security — Labor Market Information
Code Occupation Number Percent
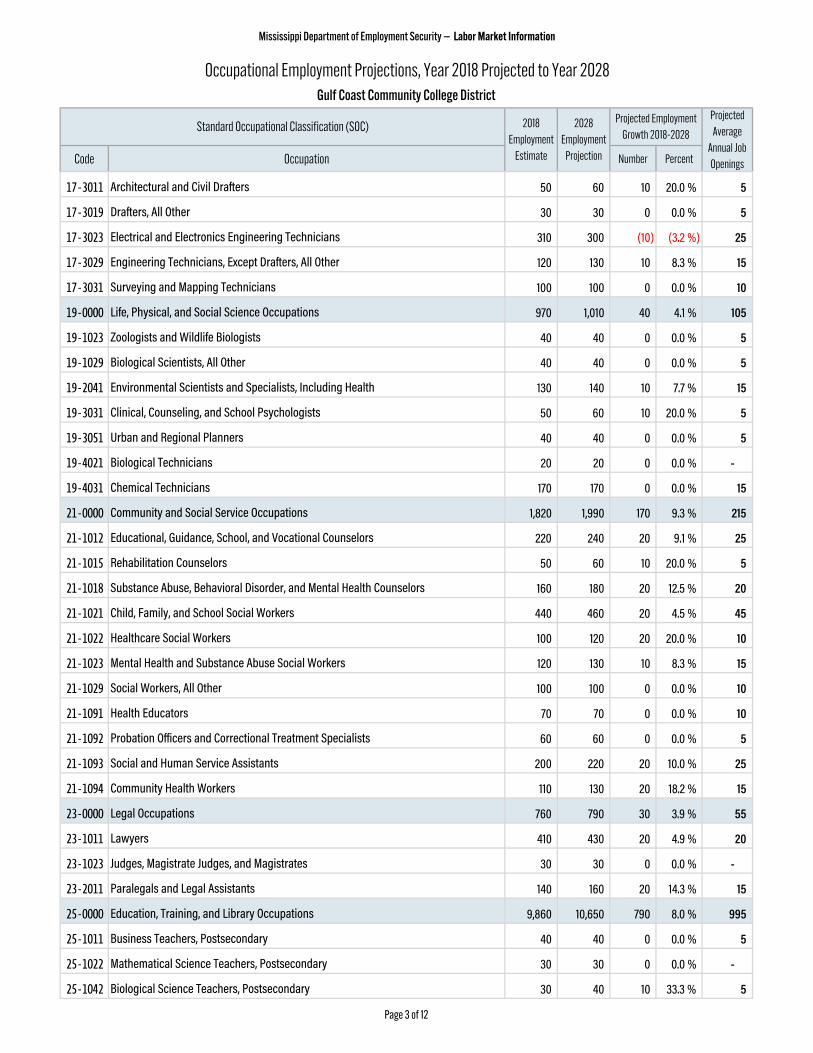
Occupational Employment Projections, Year 2018 Projected to Year 2028Gulf Coast Community College District
Standard Occupational Classification (SOC) 2018 Employment
Estimate
2028 Employment
Projection
Projected Employment Growth 2018-2028
Projected Average
Annual Job Openings
17-3011 Architectural and Civil Drafters 50 60 10 20.0 % 5
17-3019 Drafters, All Other 30 30 0 0.0 % 5
17-3023 Electrical and Electronics Engineering Technicians 310 300 (10) (3.2 %) 25
17-3029 Engineering Technicians, Except Drafters, All Other 120 130 10 8.3 % 15
17-3031 Surveying and Mapping Technicians 100 100 0 0.0 % 10
19-0000 Life, Physical, and Social Science Occupations 970 1,010 40 4.1 % 105
19-1023 Zoologists and Wildlife Biologists 40 40 0 0.0 % 5
19-1029 Biological Scientists, All Other 40 40 0 0.0 % 5
19-2041 Environmental Scientists and Specialists, Including Health 130 140 10 7.7 % 15
19-3031 Clinical, Counseling, and School Psychologists 50 60 10 20.0 % 5
19-3051 Urban and Regional Planners 40 40 0 0.0 % 5
19-4021 Biological Technicians 20 20 0 0.0 % -
19-4031 Chemical Technicians 170 170 0 0.0 % 15
21-0000 Community and Social Service Occupations 1,820 1,990 170 9.3 % 215
21-1012 Educational, Guidance, School, and Vocational Counselors 220 240 20 9.1 % 25
21-1015 Rehabilitation Counselors 50 60 10 20.0 % 5
21-1018 Substance Abuse, Behavioral Disorder, and Mental Health Counselors 160 180 20 12.5 % 20
21-1021 Child, Family, and School Social Workers 440 460 20 4.5 % 45
21-1022 Healthcare Social Workers 100 120 20 20.0 % 10
21-1023 Mental Health and Substance Abuse Social Workers 120 130 10 8.3 % 15
21-1029 Social Workers, All Other 100 100 0 0.0 % 10
21-1091 Health Educators 70 70 0 0.0 % 10
21-1092 Probation Officers and Correctional Treatment Specialists 60 60 0 0.0 % 5
21-1093 Social and Human Service Assistants 200 220 20 10.0 % 25
21-1094 Community Health Workers 110 130 20 18.2 % 15
23-0000 Legal Occupations 760 790 30 3.9 % 55
23-1011 Lawyers 410 430 20 4.9 % 20
23-1023 Judges, Magistrate Judges, and Magistrates 30 30 0 0.0 % -
23-2011 Paralegals and Legal Assistants 140 160 20 14.3 % 15
25-0000 Education, Training, and Library Occupations 9,860 10,650 790 8.0 % 995
25-1011 Business Teachers, Postsecondary 40 40 0 0.0 % 5
25-1022 Mathematical Science Teachers, Postsecondary 30 30 0 0.0 % -
25-1042 Biological Science Teachers, Postsecondary 30 40 10 33.3 % 5
Page 3 of 12
Mississippi Department of Employment Security — Labor Market Information
Code Occupation Number Percent
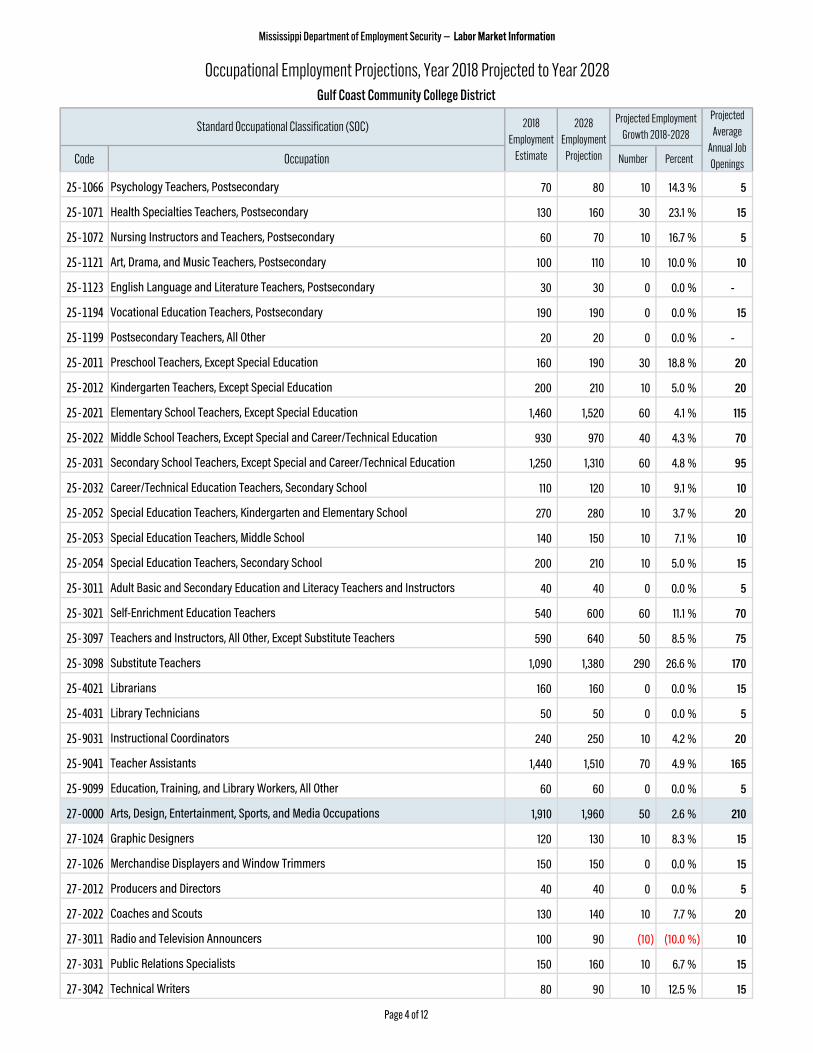
Occupational Employment Projections, Year 2018 Projected to Year 2028Gulf Coast Community College District
Standard Occupational Classification (SOC) 2018 Employment
Estimate
2028 Employment
Projection
Projected Employment Growth 2018-2028
Projected Average
Annual Job Openings
25-1066 Psychology Teachers, Postsecondary 70 80 10 14.3 % 5
25-1071 Health Specialties Teachers, Postsecondary 130 160 30 23.1 % 15
25-1072 Nursing Instructors and Teachers, Postsecondary 60 70 10 16.7 % 5
25-1121 Art, Drama, and Music Teachers, Postsecondary 100 110 10 10.0 % 10
25-1123 English Language and Literature Teachers, Postsecondary 30 30 0 0.0 % -
25-1194 Vocational Education Teachers, Postsecondary 190 190 0 0.0 % 15
25-1199 Postsecondary Teachers, All Other 20 20 0 0.0 % -
25-2011 Preschool Teachers, Except Special Education 160 190 30 18.8 % 20
25-2012 Kindergarten Teachers, Except Special Education 200 210 10 5.0 % 20
25-2021 Elementary School Teachers, Except Special Education 1,460 1,520 60 4.1 % 115
25-2022 Middle School Teachers, Except Special and Career/Technical Education 930 970 40 4.3 % 70
25-2031 Secondary School Teachers, Except Special and Career/Technical Education 1,250 1,310 60 4.8 % 95
25-2032 Career/Technical Education Teachers, Secondary School 110 120 10 9.1 % 10
25-2052 Special Education Teachers, Kindergarten and Elementary School 270 280 10 3.7 % 20
25-2053 Special Education Teachers, Middle School 140 150 10 7.1 % 10
25-2054 Special Education Teachers, Secondary School 200 210 10 5.0 % 15
25-3011 Adult Basic and Secondary Education and Literacy Teachers and Instructors 40 40 0 0.0 % 5
25-3021 Self-Enrichment Education Teachers 540 600 60 11.1 % 70
25-3097 Teachers and Instructors, All Other, Except Substitute Teachers 590 640 50 8.5 % 75
25-3098 Substitute Teachers 1,090 1,380 290 26.6 % 170
25-4021 Librarians 160 160 0 0.0 % 15
25-4031 Library Technicians 50 50 0 0.0 % 5
25-9031 Instructional Coordinators 240 250 10 4.2 % 20
25-9041 Teacher Assistants 1,440 1,510 70 4.9 % 165
25-9099 Education, Training, and Library Workers, All Other 60 60 0 0.0 % 5
27-0000 Arts, Design, Entertainment, Sports, and Media Occupations 1,910 1,960 50 2.6 % 210
27-1024 Graphic Designers 120 130 10 8.3 % 15
27-1026 Merchandise Displayers and Window Trimmers 150 150 0 0.0 % 15
27-2012 Producers and Directors 40 40 0 0.0 % 5
27-2022 Coaches and Scouts 130 140 10 7.7 % 20
27-3011 Radio and Television Announcers 100 90 (10) (10.0 %) 10
27-3031 Public Relations Specialists 150 160 10 6.7 % 15
27-3042 Technical Writers 80 90 10 12.5 % 15
Page 4 of 12
Mississippi Department of Employment Security — Labor Market Information
Code Occupation Number Percent
Occupational Employment Projections, Year 2018 Projected to Year 2028Gulf Coast Community College District
Standard Occupational Classification (SOC) 2018 Employment
Estimate
2028 Employment
Projection
Projected Employment Growth 2018-2028
Projected Average
Annual Job Openings
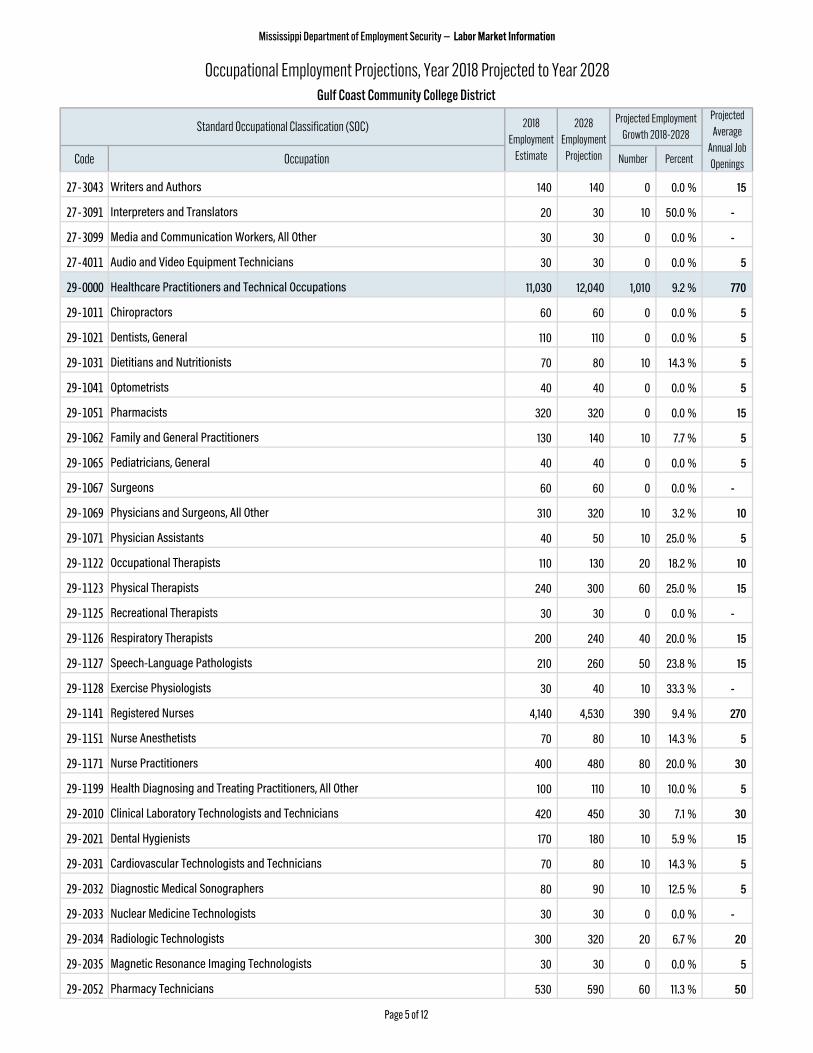
27-3043 Writers and Authors 140 140 0 0.0 % 15
27-3091 Interpreters and Translators 20 30 10 50.0 % -
27-3099 Media and Communication Workers, All Other 30 30 0 0.0 % -
27-4011 Audio and Video Equipment Technicians 30 30 0 0.0 % 5
29-0000 Healthcare Practitioners and Technical Occupations 11,030 12,040 1,010 9.2 % 770
29-1011 Chiropractors 60 60 0 0.0 % 5
29-1021 Dentists, General 110 110 0 0.0 % 5
29-1031 Dietitians and Nutritionists 70 80 10 14.3 % 5
29-1041 Optometrists 40 40 0 0.0 % 5
29-1051 Pharmacists 320 320 0 0.0 % 15
29-1062 Family and General Practitioners 130 140 10 7.7 % 5
29-1065 Pediatricians, General 40 40 0 0.0 % 5
29-1067 Surgeons 60 60 0 0.0 % -
29-1069 Physicians and Surgeons, All Other 310 320 10 3.2 % 10
29-1071 Physician Assistants 40 50 10 25.0 % 5
29-1122 Occupational Therapists 110 130 20 18.2 % 10
29-1123 Physical Therapists 240 300 60 25.0 % 15
29-1125 Recreational Therapists 30 30 0 0.0 % -
29-1126 Respiratory Therapists 200 240 40 20.0 % 15
29-1127 Speech-Language Pathologists 210 260 50 23.8 % 15
29-1128 Exercise Physiologists 30 40 10 33.3 % -
29-1141 Registered Nurses 4,140 4,530 390 9.4 % 270
29-1151 Nurse Anesthetists 70 80 10 14.3 % 5
29-1171 Nurse Practitioners 400 480 80 20.0 % 30
29-1199 Health Diagnosing and Treating Practitioners, All Other 100 110 10 10.0 % 5
29-2010 Clinical Laboratory Technologists and Technicians 420 450 30 7.1 % 30
29-2021 Dental Hygienists 170 180 10 5.9 % 15
29-2031 Cardiovascular Technologists and Technicians 70 80 10 14.3 % 5
29-2032 Diagnostic Medical Sonographers 80 90 10 12.5 % 5
29-2033 Nuclear Medicine Technologists 30 30 0 0.0 % -
29-2034 Radiologic Technologists 300 320 20 6.7 % 20
29-2035 Magnetic Resonance Imaging Technologists 30 30 0 0.0 % 5
29-2052 Pharmacy Technicians 530 590 60 11.3 % 50
Page 5 of 12
Mississippi Department of Employment Security — Labor Market Information
Code Occupation Number Percent
Occupational Employment Projections, Year 2018 Projected to Year 2028Gulf Coast Community College District
Standard Occupational Classification (SOC) 2018 Employment
Estimate
2028 Employment
Projection
Projected Employment Growth 2018-2028
Projected Average
Annual Job Openings
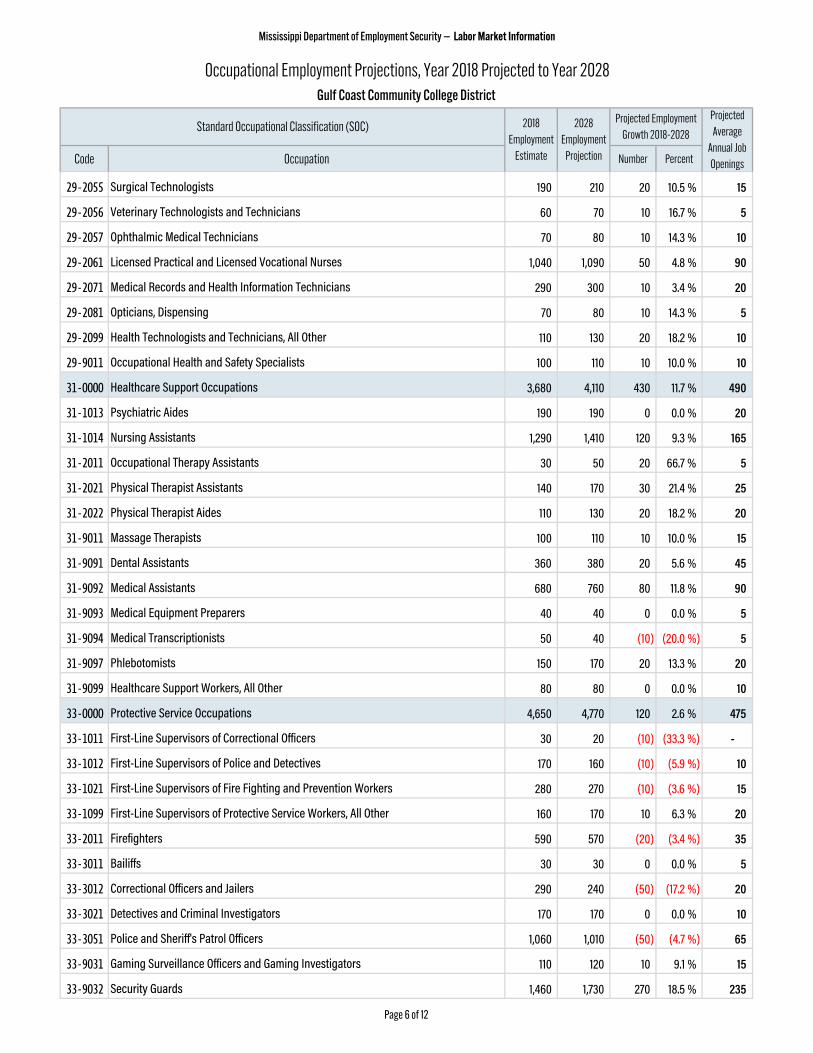
29-2055 Surgical Technologists 190 210 20 10.5 % 15
29-2056 Veterinary Technologists and Technicians 60 70 10 16.7 % 5
29-2057 Ophthalmic Medical Technicians 70 80 10 14.3 % 10
29-2061 Licensed Practical and Licensed Vocational Nurses 1,040 1,090 50 4.8 % 90
29-2071 Medical Records and Health Information Technicians 290 300 10 3.4 % 20
29-2081 Opticians, Dispensing 70 80 10 14.3 % 5
29-2099 Health Technologists and Technicians, All Other 110 130 20 18.2 % 10
29-9011 Occupational Health and Safety Specialists 100 110 10 10.0 % 10
31-0000 Healthcare Support Occupations 3,680 4,110 430 11.7 % 490
31-1013 Psychiatric Aides 190 190 0 0.0 % 20
31-1014 Nursing Assistants 1,290 1,410 120 9.3 % 165
31-2011 Occupational Therapy Assistants 30 50 20 66.7 % 5
31-2021 Physical Therapist Assistants 140 170 30 21.4 % 25
31-2022 Physical Therapist Aides 110 130 20 18.2 % 20
31-9011 Massage Therapists 100 110 10 10.0 % 15
31-9091 Dental Assistants 360 380 20 5.6 % 45
31-9092 Medical Assistants 680 760 80 11.8 % 90
31-9093 Medical Equipment Preparers 40 40 0 0.0 % 5
31-9094 Medical Transcriptionists 50 40 (10) (20.0 %) 5
31-9097 Phlebotomists 150 170 20 13.3 % 20
31-9099 Healthcare Support Workers, All Other 80 80 0 0.0 % 10
33-0000 Protective Service Occupations 4,650 4,770 120 2.6 % 475
33-1011 First-Line Supervisors of Correctional Officers 30 20 (10) (33.3 %) -
33-1012 First-Line Supervisors of Police and Detectives 170 160 (10) (5.9 %) 10
33-1021 First-Line Supervisors of Fire Fighting and Prevention Workers 280 270 (10) (3.6 %) 15
33-1099 First-Line Supervisors of Protective Service Workers, All Other 160 170 10 6.3 % 20
33-2011 Firefighters 590 570 (20) (3.4 %) 35
33-3011 Bailiffs 30 30 0 0.0 % 5
33-3012 Correctional Officers and Jailers 290 240 (50) (17.2 %) 20
33-3021 Detectives and Criminal Investigators 170 170 0 0.0 % 10
33-3051 Police and Sheriff's Patrol Officers 1,060 1,010 (50) (4.7 %) 65
33-9031 Gaming Surveillance Officers and Gaming Investigators 110 120 10 9.1 % 15
33-9032 Security Guards 1,460 1,730 270 18.5 % 235
Page 6 of 12
Mississippi Department of Employment Security — Labor Market Information
Code Occupation Number Percent
Occupational Employment Projections, Year 2018 Projected to Year 2028Gulf Coast Community College District
Standard Occupational Classification (SOC) 2018 Employment
Estimate
2028 Employment
Projection
Projected Employment Growth 2018-2028
Projected Average
Annual Job Openings
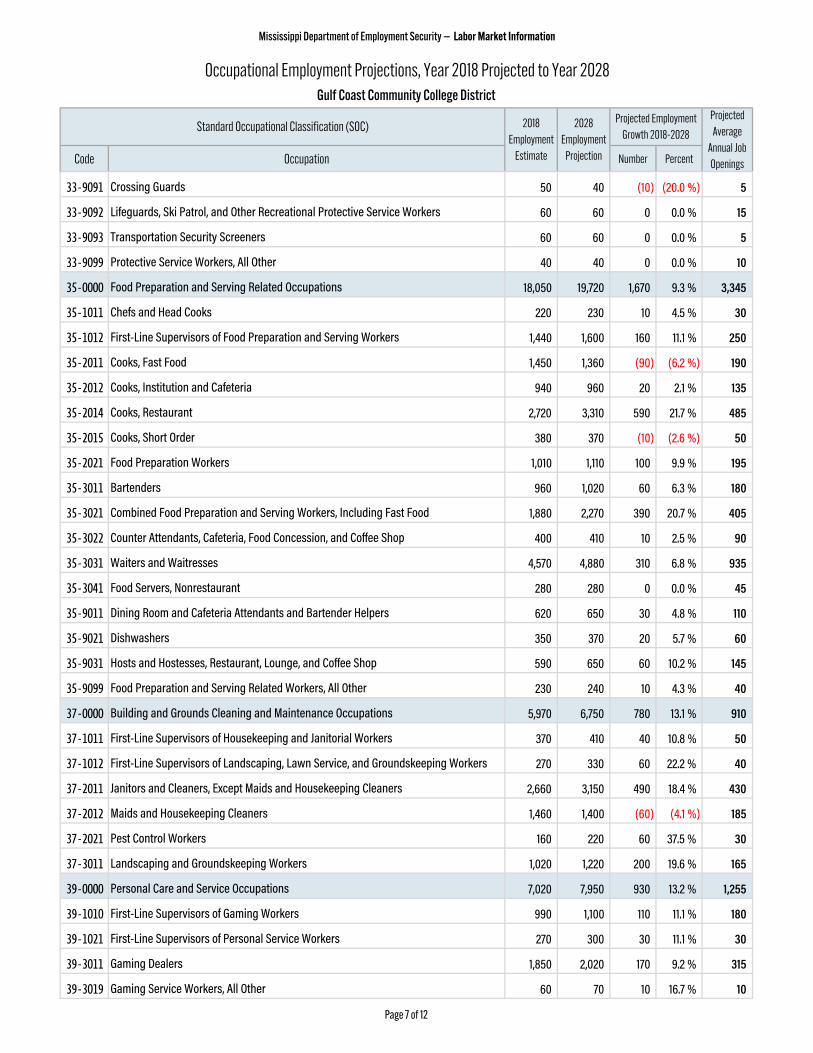
33-9091 Crossing Guards 50 40 (10) (20.0 %) 5
33-9092 Lifeguards, Ski Patrol, and Other Recreational Protective Service Workers 60 60 0 0.0 % 15
33-9093 Transportation Security Screeners 60 60 0 0.0 % 5
33-9099 Protective Service Workers, All Other 40 40 0 0.0 % 10
35-0000 Food Preparation and Serving Related Occupations 18,050 19,720 1,670 9.3 % 3,345
35-1011 Chefs and Head Cooks 220 230 10 4.5 % 30
35-1012 First-Line Supervisors of Food Preparation and Serving Workers 1,440 1,600 160 11.1 % 250
35-2011 Cooks, Fast Food 1,450 1,360 (90) (6.2 %) 190
35-2012 Cooks, Institution and Cafeteria 940 960 20 2.1 % 135
35-2014 Cooks, Restaurant 2,720 3,310 590 21.7 % 485
35-2015 Cooks, Short Order 380 370 (10) (2.6 %) 50
35-2021 Food Preparation Workers 1,010 1,110 100 9.9 % 195
35-3011 Bartenders 960 1,020 60 6.3 % 180
35-3021 Combined Food Preparation and Serving Workers, Including Fast Food 1,880 2,270 390 20.7 % 405
35-3022 Counter Attendants, Cafeteria, Food Concession, and Coffee Shop 400 410 10 2.5 % 90
35-3031 Waiters and Waitresses 4,570 4,880 310 6.8 % 935
35-3041 Food Servers, Nonrestaurant 280 280 0 0.0 % 45
35-9011 Dining Room and Cafeteria Attendants and Bartender Helpers 620 650 30 4.8 % 110
35-9021 Dishwashers 350 370 20 5.7 % 60
35-9031 Hosts and Hostesses, Restaurant, Lounge, and Coffee Shop 590 650 60 10.2 % 145
35-9099 Food Preparation and Serving Related Workers, All Other 230 240 10 4.3 % 40
37-0000 Building and Grounds Cleaning and Maintenance Occupations 5,970 6,750 780 13.1 % 910
37-1011 First-Line Supervisors of Housekeeping and Janitorial Workers 370 410 40 10.8 % 50
37-1012 First-Line Supervisors of Landscaping, Lawn Service, and Groundskeeping Workers 270 330 60 22.2 % 40
37-2011 Janitors and Cleaners, Except Maids and Housekeeping Cleaners 2,660 3,150 490 18.4 % 430
37-2012 Maids and Housekeeping Cleaners 1,460 1,400 (60) (4.1 %) 185
37-2021 Pest Control Workers 160 220 60 37.5 % 30
37-3011 Landscaping and Groundskeeping Workers 1,020 1,220 200 19.6 % 165
39-0000 Personal Care and Service Occupations 7,020 7,950 930 13.2 % 1,255
39-1010 First-Line Supervisors of Gaming Workers 990 1,100 110 11.1 % 180
39-1021 First-Line Supervisors of Personal Service Workers 270 300 30 11.1 % 30
39-3011 Gaming Dealers 1,850 2,020 170 9.2 % 315
39-3019 Gaming Service Workers, All Other 60 70 10 16.7 % 10
Page 7 of 12
Mississippi Department of Employment Security — Labor Market Information
Code Occupation Number Percent
Occupational Employment Projections, Year 2018 Projected to Year 2028Gulf Coast Community College District
Standard Occupational Classification (SOC) 2018 Employment
Estimate
2028 Employment
Projection
Projected Employment Growth 2018-2028
Projected Average
Annual Job Openings
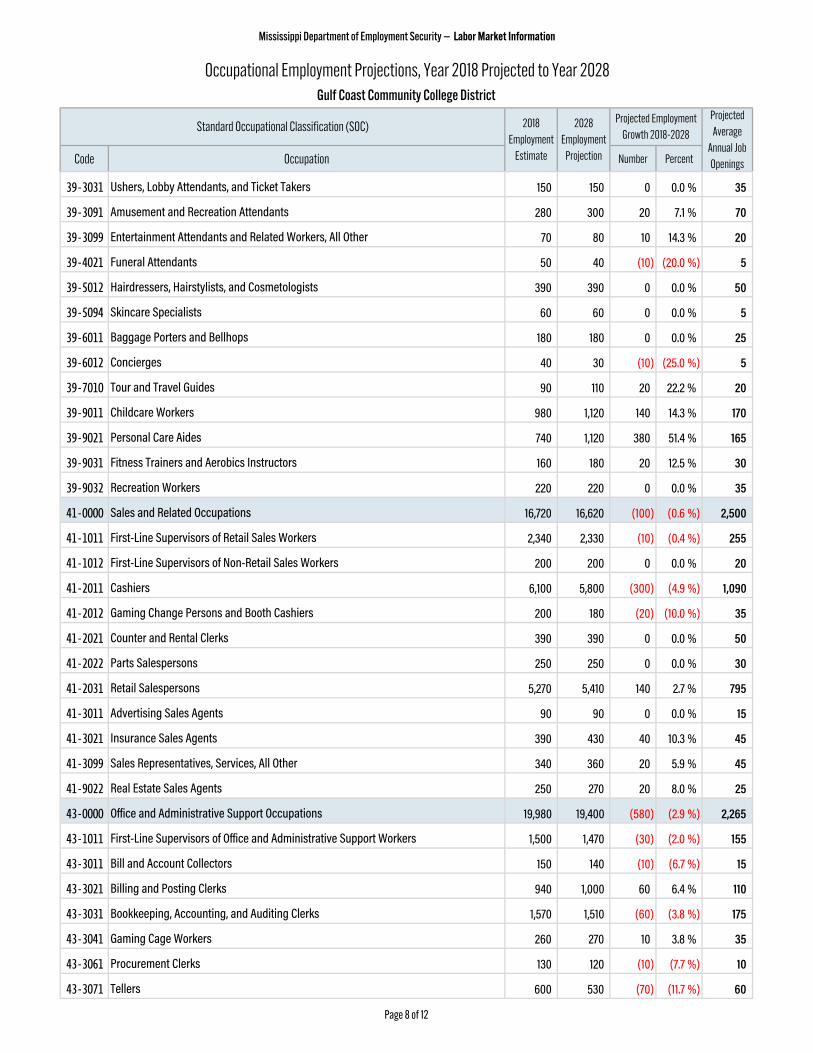
39-3031 Ushers, Lobby Attendants, and Ticket Takers 150 150 0 0.0 % 35
39-3091 Amusement and Recreation Attendants 280 300 20 7.1 % 70
39-3099 Entertainment Attendants and Related Workers, All Other 70 80 10 14.3 % 20
39-4021 Funeral Attendants 50 40 (10) (20.0 %) 5
39-5012 Hairdressers, Hairstylists, and Cosmetologists 390 390 0 0.0 % 50
39-5094 Skincare Specialists 60 60 0 0.0 % 5
39-6011 Baggage Porters and Bellhops 180 180 0 0.0 % 25
39-6012 Concierges 40 30 (10) (25.0 %) 5
39-7010 Tour and Travel Guides 90 110 20 22.2 % 20
39-9011 Childcare Workers 980 1,120 140 14.3 % 170
39-9021 Personal Care Aides 740 1,120 380 51.4 % 165
39-9031 Fitness Trainers and Aerobics Instructors 160 180 20 12.5 % 30
39-9032 Recreation Workers 220 220 0 0.0 % 35
41-0000 Sales and Related Occupations 16,720 16,620 (100) (0.6 %) 2,500
41-1011 First-Line Supervisors of Retail Sales Workers 2,340 2,330 (10) (0.4 %) 255
41-1012 First-Line Supervisors of Non-Retail Sales Workers 200 200 0 0.0 % 20
41-2011 Cashiers 6,100 5,800 (300) (4.9 %) 1,090
41-2012 Gaming Change Persons and Booth Cashiers 200 180 (20) (10.0 %) 35
41-2021 Counter and Rental Clerks 390 390 0 0.0 % 50
41-2022 Parts Salespersons 250 250 0 0.0 % 30
41-2031 Retail Salespersons 5,270 5,410 140 2.7 % 795
41-3011 Advertising Sales Agents 90 90 0 0.0 % 15
41-3021 Insurance Sales Agents 390 430 40 10.3 % 45
41-3099 Sales Representatives, Services, All Other 340 360 20 5.9 % 45
41-9022 Real Estate Sales Agents 250 270 20 8.0 % 25
43-0000 Office and Administrative Support Occupations 19,980 19,400 (580) (2.9 %) 2,265
43-1011 First-Line Supervisors of Office and Administrative Support Workers 1,500 1,470 (30) (2.0 %) 155
43-3011 Bill and Account Collectors 150 140 (10) (6.7 %) 15
43-3021 Billing and Posting Clerks 940 1,000 60 6.4 % 110
43-3031 Bookkeeping, Accounting, and Auditing Clerks 1,570 1,510 (60) (3.8 %) 175
43-3041 Gaming Cage Workers 260 270 10 3.8 % 35
43-3061 Procurement Clerks 130 120 (10) (7.7 %) 10
43-3071 Tellers 600 530 (70) (11.7 %) 60
Page 8 of 12
Mississippi Department of Employment Security — Labor Market Information
Code Occupation Number Percent
Occupational Employment Projections, Year 2018 Projected to Year 2028Gulf Coast Community College District
Standard Occupational Classification (SOC) 2018 Employment
Estimate
2028 Employment
Projection
Projected Employment Growth 2018-2028
Projected Average
Annual Job Openings
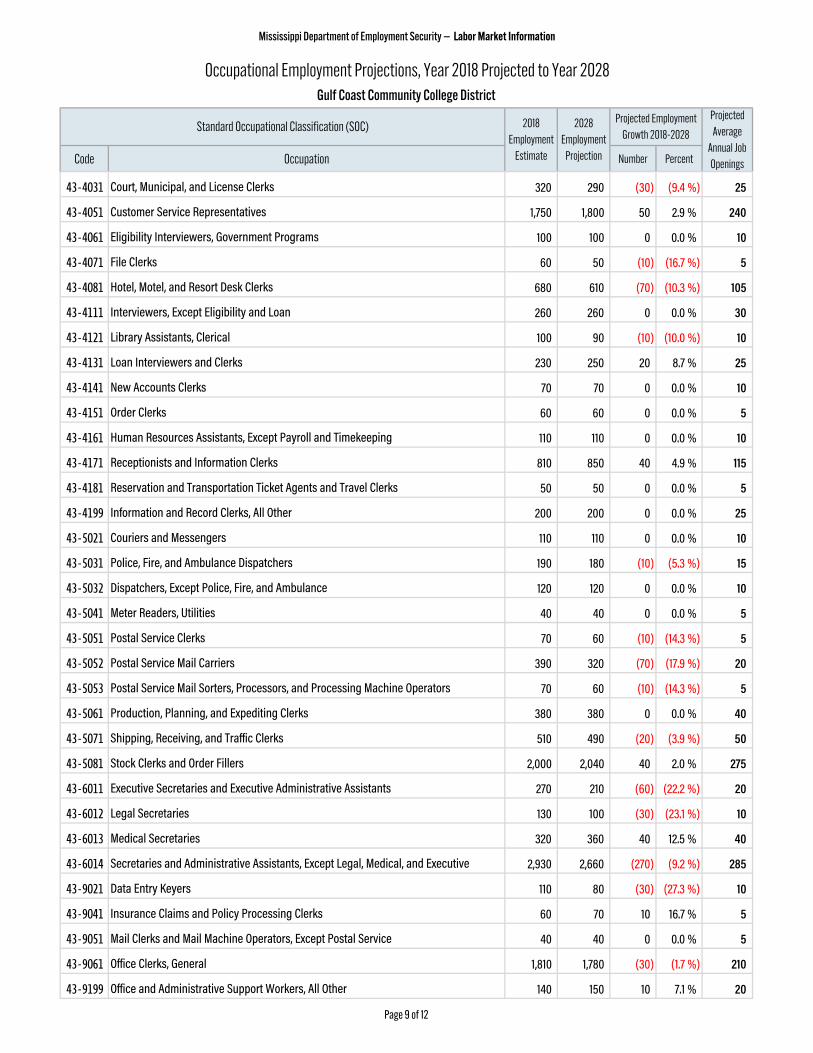
43-4031 Court, Municipal, and License Clerks 320 290 (30) (9.4 %) 25
43-4051 Customer Service Representatives 1,750 1,800 50 2.9 % 240
43-4061 Eligibility Interviewers, Government Programs 100 100 0 0.0 % 10
43-4071 File Clerks 60 50 (10) (16.7 %) 5
43-4081 Hotel, Motel, and Resort Desk Clerks 680 610 (70) (10.3 %) 105
43-4111 Interviewers, Except Eligibility and Loan 260 260 0 0.0 % 30
43-4121 Library Assistants, Clerical 100 90 (10) (10.0 %) 10
43-4131 Loan Interviewers and Clerks 230 250 20 8.7 % 25
43-4141 New Accounts Clerks 70 70 0 0.0 % 10
43-4151 Order Clerks 60 60 0 0.0 % 5
43-4161 Human Resources Assistants, Except Payroll and Timekeeping 110 110 0 0.0 % 10
43-4171 Receptionists and Information Clerks 810 850 40 4.9 % 115
43-4181 Reservation and Transportation Ticket Agents and Travel Clerks 50 50 0 0.0 % 5
43-4199 Information and Record Clerks, All Other 200 200 0 0.0 % 25
43-5021 Couriers and Messengers 110 110 0 0.0 % 10
43-5031 Police, Fire, and Ambulance Dispatchers 190 180 (10) (5.3 %) 15
43-5032 Dispatchers, Except Police, Fire, and Ambulance 120 120 0 0.0 % 10
43-5041 Meter Readers, Utilities 40 40 0 0.0 % 5
43-5051 Postal Service Clerks 70 60 (10) (14.3 %) 5
43-5052 Postal Service Mail Carriers 390 320 (70) (17.9 %) 20
43-5053 Postal Service Mail Sorters, Processors, and Processing Machine Operators 70 60 (10) (14.3 %) 5
43-5061 Production, Planning, and Expediting Clerks 380 380 0 0.0 % 40
43-5071 Shipping, Receiving, and Traffic Clerks 510 490 (20) (3.9 %) 50
43-5081 Stock Clerks and Order Fillers 2,000 2,040 40 2.0 % 275
43-6011 Executive Secretaries and Executive Administrative Assistants 270 210 (60) (22.2 %) 20
43-6012 Legal Secretaries 130 100 (30) (23.1 %) 10
43-6013 Medical Secretaries 320 360 40 12.5 % 40
43-6014 Secretaries and Administrative Assistants, Except Legal, Medical, and Executive 2,930 2,660 (270) (9.2 %) 285
43-9021 Data Entry Keyers 110 80 (30) (27.3 %) 10
43-9041 Insurance Claims and Policy Processing Clerks 60 70 10 16.7 % 5
43-9051 Mail Clerks and Mail Machine Operators, Except Postal Service 40 40 0 0.0 % 5
43-9061 Office Clerks, General 1,810 1,780 (30) (1.7 %) 210
43-9199 Office and Administrative Support Workers, All Other 140 150 10 7.1 % 20
Page 9 of 12
Mississippi Department of Employment Security — Labor Market Information
Code Occupation Number Percent
Occupational Employment Projections, Year 2018 Projected to Year 2028Gulf Coast Community College District
Standard Occupational Classification (SOC) 2018 Employment
Estimate
2028 Employment
Projection
Projected Employment Growth 2018-2028
Projected Average
Annual Job Openings
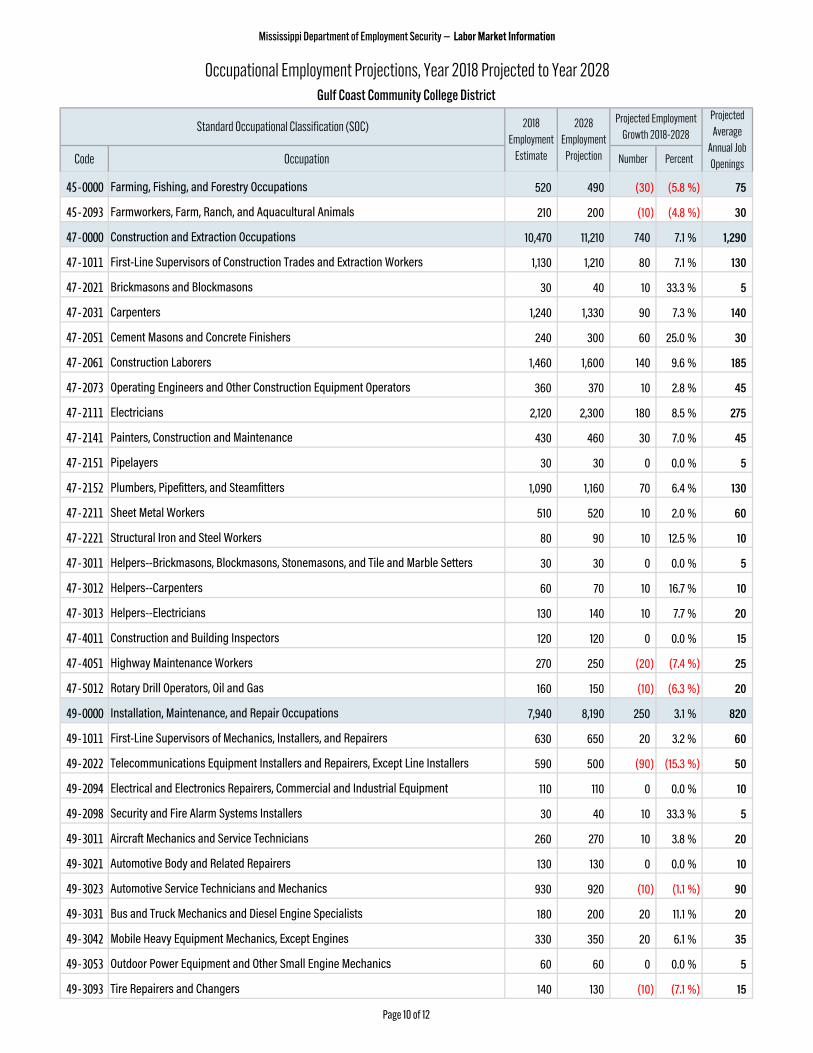
45-0000 Farming, Fishing, and Forestry Occupations 520 490 (30) (5.8 %) 75
45-2093 Farmworkers, Farm, Ranch, and Aquacultural Animals 210 200 (10) (4.8 %) 30
47-0000 Construction and Extraction Occupations 10,470 11,210 740 7.1 % 1,290
47-1011 First-Line Supervisors of Construction Trades and Extraction Workers 1,130 1,210 80 7.1 % 130
47-2021 Brickmasons and Blockmasons 30 40 10 33.3 % 5
47-2031 Carpenters 1,240 1,330 90 7.3 % 140
47-2051 Cement Masons and Concrete Finishers 240 300 60 25.0 % 30
47-2061 Construction Laborers 1,460 1,600 140 9.6 % 185
47-2073 Operating Engineers and Other Construction Equipment Operators 360 370 10 2.8 % 45
47-2111 Electricians 2,120 2,300 180 8.5 % 275
47-2141 Painters, Construction and Maintenance 430 460 30 7.0 % 45
47-2151 Pipelayers 30 30 0 0.0 % 5
47-2152 Plumbers, Pipefitters, and Steamfitters 1,090 1,160 70 6.4 % 130
47-2211 Sheet Metal Workers 510 520 10 2.0 % 60
47-2221 Structural Iron and Steel Workers 80 90 10 12.5 % 10
47-3011 Helpers--Brickmasons, Blockmasons, Stonemasons, and Tile and Marble Setters 30 30 0 0.0 % 5
47-3012 Helpers--Carpenters 60 70 10 16.7 % 10
47-3013 Helpers--Electricians 130 140 10 7.7 % 20
47-4011 Construction and Building Inspectors 120 120 0 0.0 % 15
47-4051 Highway Maintenance Workers 270 250 (20) (7.4 %) 25
47-5012 Rotary Drill Operators, Oil and Gas 160 150 (10) (6.3 %) 20
49-0000 Installation, Maintenance, and Repair Occupations 7,940 8,190 250 3.1 % 820
49-1011 First-Line Supervisors of Mechanics, Installers, and Repairers 630 650 20 3.2 % 60
49-2022 Telecommunications Equipment Installers and Repairers, Except Line Installers 590 500 (90) (15.3 %) 50
49-2094 Electrical and Electronics Repairers, Commercial and Industrial Equipment 110 110 0 0.0 % 10
49-2098 Security and Fire Alarm Systems Installers 30 40 10 33.3 % 5
49-3011 Aircraft Mechanics and Service Technicians 260 270 10 3.8 % 20
49-3021 Automotive Body and Related Repairers 130 130 0 0.0 % 10
49-3023 Automotive Service Technicians and Mechanics 930 920 (10) (1.1 %) 90
49-3031 Bus and Truck Mechanics and Diesel Engine Specialists 180 200 20 11.1 % 20
49-3042 Mobile Heavy Equipment Mechanics, Except Engines 330 350 20 6.1 % 35
49-3053 Outdoor Power Equipment and Other Small Engine Mechanics 60 60 0 0.0 % 5
49-3093 Tire Repairers and Changers 140 130 (10) (7.1 %) 15
Page 10 of 12
Mississippi Department of Employment Security — Labor Market Information
Code Occupation Number Percent
Occupational Employment Projections, Year 2018 Projected to Year 2028Gulf Coast Community College District
Standard Occupational Classification (SOC) 2018 Employment
Estimate
2028 Employment
Projection
Projected Employment Growth 2018-2028
Projected Average
Annual Job Openings
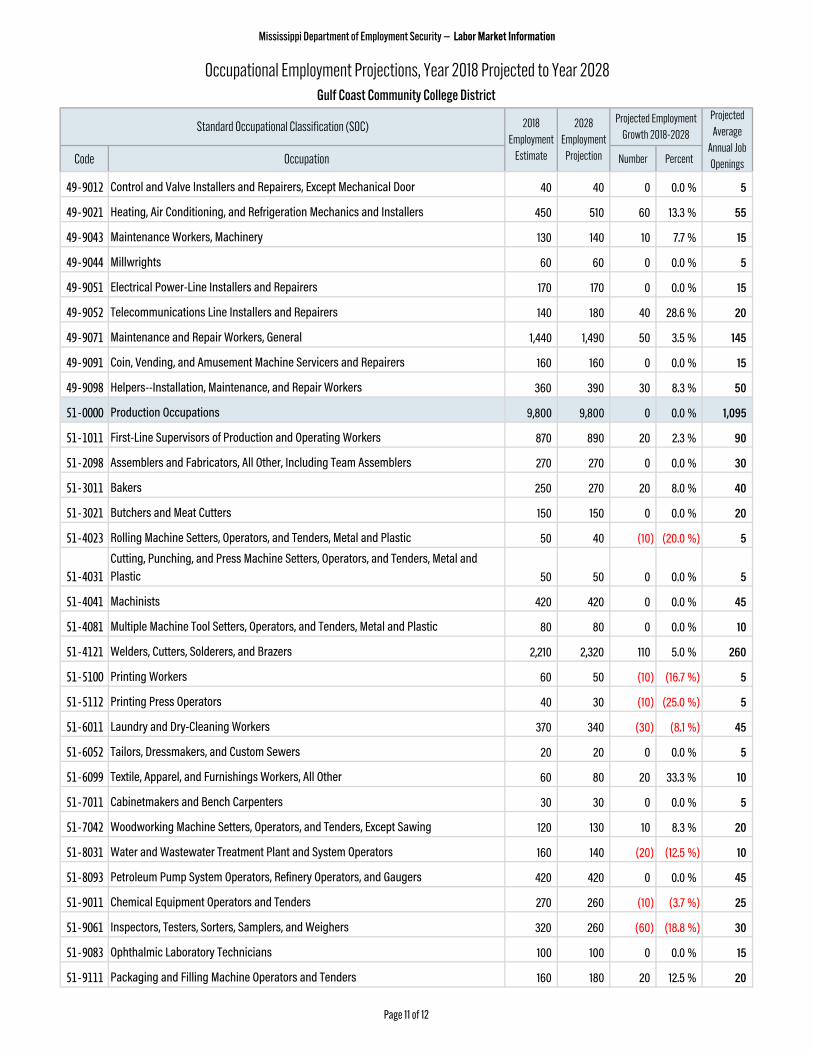
49-9012 Control and Valve Installers and Repairers, Except Mechanical Door 40 40 0 0.0 % 5
49-9021 Heating, Air Conditioning, and Refrigeration Mechanics and Installers 450 510 60 13.3 % 55
49-9043 Maintenance Workers, Machinery 130 140 10 7.7 % 15
49-9044 Millwrights 60 60 0 0.0 % 5
49-9051 Electrical Power-Line Installers and Repairers 170 170 0 0.0 % 15
49-9052 Telecommunications Line Installers and Repairers 140 180 40 28.6 % 20
49-9071 Maintenance and Repair Workers, General 1,440 1,490 50 3.5 % 145
49-9091 Coin, Vending, and Amusement Machine Servicers and Repairers 160 160 0 0.0 % 15
49-9098 Helpers--Installation, Maintenance, and Repair Workers 360 390 30 8.3 % 50
51-0000 Production Occupations 9,800 9,800 0 0.0 % 1,095
51-1011 First-Line Supervisors of Production and Operating Workers 870 890 20 2.3 % 90
51-2098 Assemblers and Fabricators, All Other, Including Team Assemblers 270 270 0 0.0 % 30
51-3011 Bakers 250 270 20 8.0 % 40
51-3021 Butchers and Meat Cutters 150 150 0 0.0 % 20
51-4023 Rolling Machine Setters, Operators, and Tenders, Metal and Plastic 50 40 (10) (20.0 %) 5
51-4031Cutting, Punching, and Press Machine Setters, Operators, and Tenders, Metal and Plastic 50 50 0 0.0 % 5
51-4041 Machinists 420 420 0 0.0 % 45
51-4081 Multiple Machine Tool Setters, Operators, and Tenders, Metal and Plastic 80 80 0 0.0 % 10
51-4121 Welders, Cutters, Solderers, and Brazers 2,210 2,320 110 5.0 % 260
51-5100 Printing Workers 60 50 (10) (16.7 %) 5
51-5112 Printing Press Operators 40 30 (10) (25.0 %) 5
51-6011 Laundry and Dry-Cleaning Workers 370 340 (30) (8.1 %) 45
51-6052 Tailors, Dressmakers, and Custom Sewers 20 20 0 0.0 % 5
51-6099 Textile, Apparel, and Furnishings Workers, All Other 60 80 20 33.3 % 10
51-7011 Cabinetmakers and Bench Carpenters 30 30 0 0.0 % 5
51-7042 Woodworking Machine Setters, Operators, and Tenders, Except Sawing 120 130 10 8.3 % 20
51-8031 Water and Wastewater Treatment Plant and System Operators 160 140 (20) (12.5 %) 10
51-8093 Petroleum Pump System Operators, Refinery Operators, and Gaugers 420 420 0 0.0 % 45
51-9011 Chemical Equipment Operators and Tenders 270 260 (10) (3.7 %) 25
51-9061 Inspectors, Testers, Sorters, Samplers, and Weighers 320 260 (60) (18.8 %) 30
51-9083 Ophthalmic Laboratory Technicians 100 100 0 0.0 % 15
51-9111 Packaging and Filling Machine Operators and Tenders 160 180 20 12.5 % 20
Page 11 of 12
Mississippi Department of Employment Security — Labor Market Information
Code Occupation Number Percent
Occupational Employment Projections, Year 2018 Projected to Year 2028Gulf Coast Community College District
Standard Occupational Classification (SOC) 2018 Employment
Estimate
2028 Employment
Projection
Projected Employment Growth 2018-2028
Projected Average
Annual Job Openings
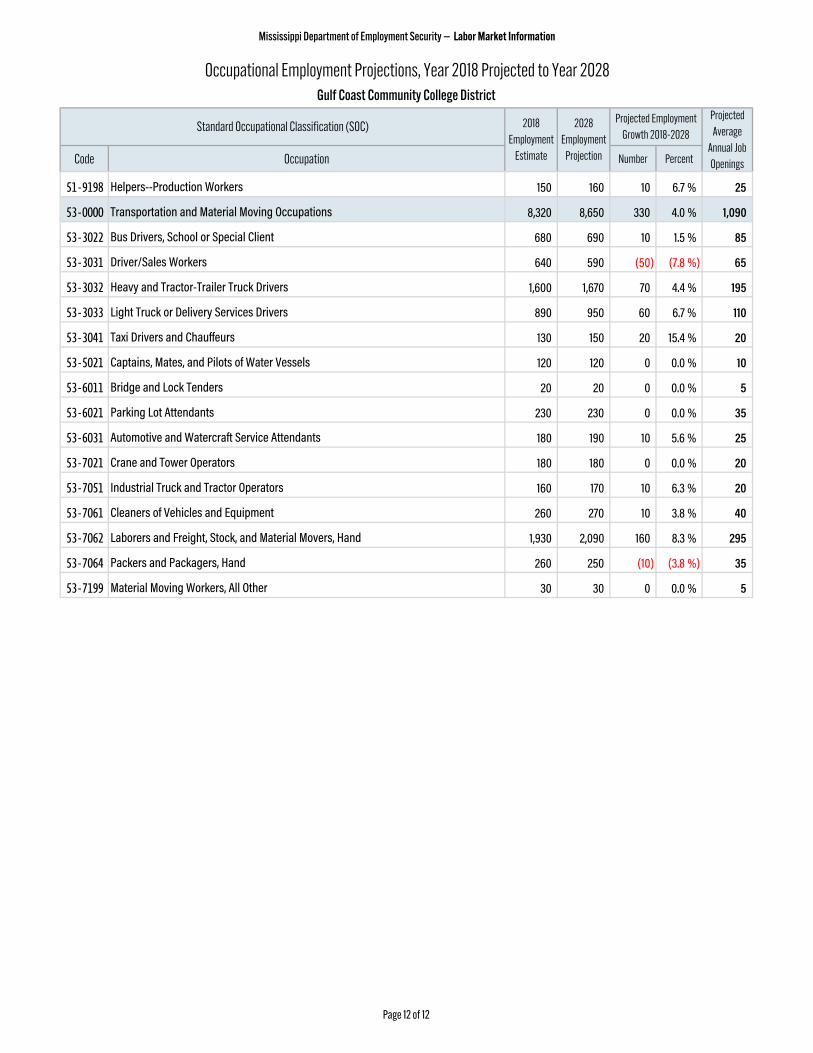
51-9198 Helpers--Production Workers 150 160 10 6.7 % 25
53-0000 Transportation and Material Moving Occupations 8,320 8,650 330 4.0 % 1,090
53-3022 Bus Drivers, School or Special Client 680 690 10 1.5 % 85
53-3031 Driver/Sales Workers 640 590 (50) (7.8 %) 65
53-3032 Heavy and Tractor-Trailer Truck Drivers 1,600 1,670 70 4.4 % 195
53-3033 Light Truck or Delivery Services Drivers 890 950 60 6.7 % 110
53-3041 Taxi Drivers and Chauffeurs 130 150 20 15.4 % 20
53-5021 Captains, Mates, and Pilots of Water Vessels 120 120 0 0.0 % 10
53-6011 Bridge and Lock Tenders 20 20 0 0.0 % 5
53-6021 Parking Lot Attendants 230 230 0 0.0 % 35
53-6031 Automotive and Watercraft Service Attendants 180 190 10 5.6 % 25
53-7021 Crane and Tower Operators 180 180 0 0.0 % 20
53-7051 Industrial Truck and Tractor Operators 160 170 10 6.3 % 20
53-7061 Cleaners of Vehicles and Equipment 260 270 10 3.8 % 40
53-7062 Laborers and Freight, Stock, and Material Movers, Hand 1,930 2,090 160 8.3 % 295
53-7064 Packers and Packagers, Hand 260 250 (10) (3.8 %) 35
53-7199 Material Moving Workers, All Other 30 30 0 0.0 % 5
Page 12 of 12
This workforce product was funded by a grant awarded by the U.S. Department of Labor’s Employment and Training Administration. The product was created by the Mississippi Department of Employment Security and does not necessarily reflect the official position of the U.S. Department of Labor. The U.S. Department of Labor makes no guarantees, warranties, or assurances of any kind, express or implied, with respect to such information, including any information on linked sites and including, but not limited to, accuracy of the information or its completeness, timeliness, usefulness, adequacy, continued availability, or ownership. This product is copyrighted by the institution that created it. Internal use by an organization and/or personal use by an individual for non-commercial purposes is permissible. All other uses require the prior authorization of the copyright owner. MDES wishes to acknowledge Mississippi State University NSPARC for their contributions in the development of this product.


![Academic Program Supply and Occupational Demand ... supply...Academic Program Supply and Occupational Demand Projections: 2008–2018 [UT Center for Business and Economic Research]](https://img.pdfslide.net/doc/110x75/5ae8b1277f8b9a0877900f35/academic-program-supply-and-occupational-demand-supplyacademic-program-supply.jpg)