Embed Size (px)
Citation preview

NEW METHODS AND DEVELOPMENTS IN NANOPARTICLE
MASS SPECTROMETRY AND MODE- AND BOND-
SPECIFIC REACTIONS OF HOD+
by
David M. Bell
A dissertation submitted to the faculty of The University of Utah
in partial fulfillment of the requirements for the degree of
Doctor of Philosophy
Department of Chemistry
The University of Utah
December 2014

Copyright © David M. Bell 2014
All Rights Reserved

The U n i v e r s i t y o f Ut ah G r a d u a t e S c h o o l
STATEMENT OF DISSERTATION APPROVAL
The dissertation of David M. Bell
has been approved by the following supervisory committee members:
Scott L. Anderson Chair 3/14/14Date Approved
Peter B. Armentrout Member 3/14/14Date Approved
Michael D. Morse Member 3/14/14Date Approved
Jennifer S. Shumaker-Parry Member 3/14/14Date Approved
Jordan Gerton MemberDate Approved
and by Cynthia J. Burrows Chair/Dean of
the Department/College/School o f ___________________ Chemistry
and by David B. Kieda, Dean of The Graduate School.

ABSTRACT
This dissertation focuses initially on development of a nanoparticle mass spectrometer
(NPMS) for single particle analysis utilizing a split ring electrode trap (SRET). Electrospray
ionization generates nanoparticle ions that are guided and trapped in the SRET. Detection of
single particles occurs by observing light scattered or fluorescence emitted from the particle.
Three methods are used to determine the secular frequency (®z) of a single trapped particle:
Fourier transform analysis of scattered light intensity, frequency sweep of the laser force, or
frequency sweep of a constant AC voltage. From ©z, the mass-to-charge ratio may be ascertained.
The AC frequency sweep method results in a peak width nearing 10 ppm. By averaging the peak
position of multiple AC frequency sweep measurements, precision approaches 1 ppm. This
method is then applied to single core-shell CdSe/ZnS quantum dots by activating their
fluorescence with a CO2 laser. The secular frequency, mass, charge, and fluorescence intensity
are tracked for a single QD over multiple days. Heating the QD sublimates the particle and causes
it to eventually go dark. Once dark, the QD remains in the trap and begins to fluoresce
intermittently.
The focus of the later half is on reactions of vibrationally state-selected HOD+. Each of
the fundamental vibrational states of HOD+ was investigated. Cross sections and product velocity
distributions were obtained for every product for each reaction and each vibrational state
investigated. Reactions of HOD+ with CO, N2O, CO2, and N2 were investigated. These reactions
were chosen because proton transfer is endoergic for each reaction or thermoneutral. Mode- and
bond-selective enhancement was observed for the cross sections of H+ and D+ transfer for the OH
and OD stretch, respectively. The bend vibration also enhances reactivity; in some cases, the total
enhancement for the bend is greater than that of the OH or OD stretches. Velocity distributions
indicated that the mechanism for H+ and D+ transfer near threshold might be complex mediated,
but it is difficult to tell because there is little energy available to the system near threshold.
However, with increasing collision energy (Ecol), the reaction becomes increasingly direct and
backward scattered.
iv

TABLE OF CONTENTS
ABSTRACT...................................................................................................................................... iii
ACKNOWLEDGEMENTS.............................................................................................................. viii
CHAPTERS
1. OVERVIEW.................................................................................................................................. 1
Brief Overview on Mass Spectrometry................................................................................ 2References............................................................................................................................ 3
2. INTRODUCTION TO NANOPARTICLE MASS SPECTROMETRY.......................................5
Pioneering Work................................................................................................................... 6Resolution and Size Limits................................................................................................... 7Using Quantum Dots............................................................................................................ 8Potential Applications of Nanoparticle Mass Spectrometry................................................. 9References............................................................................................................................ 10
3. EXPERIMENTAL SETUP FOR NANOPARTICLE MASS SPECTROMETRY AND A HIGH PRESCISION NONDESTRUCTIVE MASS SPECTRUM OF A SINGLE NANOPARTICLE............................................................................................................................ 13
Overview.............................................................................................................................. 14Introduction.......................................................................................................................... 14Experimental Setup.............................................................................................................. 16Results and Discussion......................................................................................................... 22Conclusions.......................................................................................................................... 33References............................................................................................................................ 33
4. USING A CO2 LASER TO ACTIVATE FLUORESCENCE FROM CORE-SHELL CdSe/ ZnS NANOCRYSTAL QUANTUM DOTS............................................................................................ 45
Introduction.......................................................................................................................... 46Changes in the Experimental Setup...................................................................................... 46Quantum Dot Fluorescence Activated by the CO2 Laser..................................................... 47Conclusion............................................................................................................................ 48References............................................................................................................................ 48
5. SINGLE CdSe/ZnS NANOCRYSTALS IN AN ION TRAP: CHARGE AND MASS DETERMINATION, AND PHOTOPHYSICS EVOLUTION WITH CHANGING MASS,CHARGE, AND TEMPERATURE.................................................................................................. 51
Overview.............................................................................................................................. 52Introduction.......................................................................................................................... 52Methods................................................................................................................................ 54Results.................................................................................................................................. 58Discussion............................................................................................................................ 64Conclusions.......................................................................................................................... 70References............................................................................................................................ 71
6. CONCLUSION: THE FUTURE OF NANOPARTICLE MASS SPECTROMETRY.................83
7. INTRODUCTION TO VIBRATIONALLY STATE-SELECTED ION-MOLECULE REACTIONS WITH HOD+ ............................................................................................................. 85
Introduction .......................................................................................................................... 86References............................................................................................................................ 89
8. H+ VS. D+ TRANSFER FROM HOD+ TO CO2 : BOND-SELECTIVE CHEMISTRY AND THE ANOMALOUS EFFECT OF BENDING EXCITATION....................................................... 90
Overview.............................................................................................................................. 91Introduction.......................................................................................................................... 91Experimental and Computational Methods.......................................................................... 93Results.................................................................................................................................. 95Discussion............................................................................................................................ 101Conclusion............................................................................................................................ 108References............................................................................................................................ 109
9. H+ VS. D+ TRANSFER FROM HOD+ TO N2 : MODE- AND BOND-SELECTIVE EFFECTS .. 120
Overview.............................................................................................................................. 121Introduction.......................................................................................................................... 122Experimental and Computational Methods.......................................................................... 124Results.................................................................................................................................. 127Discussion............................................................................................................................ 132Conclusion............................................................................................................................ 142References............................................................................................................................ 143
10. EFFECTS OF COLLISIONAL AND VIBRATIONAL VELOCITY ON PROTON AND DEUTERON TRANSFER IN THE REACTION OF HOD+ WITH C O .....................154
Overview.............................................................................................................................. 155Introduction.......................................................................................................................... 155Methodology........................................................................................................................ 157Results.................................................................................................................................. 160Discussion............................................................................................................................ 168Conclusion............................................................................................................................ 177References............................................................................................................................ 178
vi

11. VIBRATIONAL ENHANCED CHARGE TRANSFER AND MODE/BOND-SPECIFIC H+AND D+ TRANSFER IN THE REACTION OF HOD+ WITH N2O ................................................ 195
Overview.............................................................................................................................. 196Introduction.......................................................................................................................... 196Methodology........................................................................................................................ 198Results.................................................................................................................................. 200Discussion............................................................................................................................ 210Conclusion............................................................................................................................ 223References............................................................................................................................ 223
vii

ACKNOWLEDGEMENTS
I would like to thank Scott L. Anderson for the many opportunities he has provided me in
my time at the University of Utah. Scott gave me the opportunity to work with him during the
summer of 2007 on an REU and from that time on, I knew I wanted to study physical chemistry
and, specifically, develop new techniques in mass spectrometry. Scott has been very patient, kind,
and encouraging in the development and construction of the nanoparticle mass spectrometer over
the past two years. I am grateful for the opportunity to have built this instrument and learn from
the frustrations and joys of developing an instrument from the ground up.
I would also like to thank the members of the Anderson group throughout my time in
Utah for they have been instrumental in my development as a chemist. It has been a joy working
with everyone in the group and it has been a truly wonderful place to study chemistry. The group
has been a great place for intellectual discussions, experimental insights, enjoyment of the
outdoors, and other fun activities. I would like to specifically thank Dr. Jason M. Boyle for his
guidance and Collin R. Howder for his encouragement and his help in constructing the
nanoparticle mass spectrometer. Dieter Gerlich has been a tremendous collaborator in
encouraging the development of this project and being a source of many helpful and stimulating
discussions. I would like to thank my friends for their support throughout the various seasons of
my academic career. The encouragement and support of Shawn Soward, Matt Whitehead,
Jonathan Hickerson, and Eric Brozek have been invaluable to me over the years.
Most of all, I would like to thank my parents for loving support, giving me the
opportunity to study chemistry, and their encouragement to pursue a graduate degree.

CHAPTER 1
OVERVIEW

2
Brief Overview on Mass Spectrometry
The main challenges in the field of chemistry revolve around understanding the physical
properties of molecules and how chemical reactions take place.1 This pursuit necessitates having
or developing the right tools or techniques to investigate molecules and how they react with one
another. One of the oldest known tools is a balance, which present day has evolved greatly from
its initial crude forms. With the advent of mass spectrometry, a type of balance for ions, it is
possible to measure the mass-to-charge ratio of an ion to very high resolution, precision, and
accuracy.2 The first example of this was shown by W. Wien, who discovered the mass of the
proton.3 However, this result was not fully accepted until J. J. Thomson demonstrated the ability
to obtain a mass spectrograph of two different isotopes of Neon (20 and 22).4
Mass spectrometry was furthered by the development of ion trapping techniques put forth
by Paul5 and by ion guiding techniques demonstrated by von Zahn.6 The history of mass
spectrometry and the physics surrounding it has been discussed at length in a variety of
reviews.7-11 Mass spectrometry has developed into a very important technique and has had far
reaching applications in the realm of chemistry because knowing the mass of a molecule is an
important part of assigning its structure.12 This is especially true in organic chemistry; a mass
spectrum is a routine part of determining the structure of a molecule based on its fragmentation
pattern. Biological chemistry, specifically the omics community, routinely uses a mass
spectrometer in combination with various separations techniques to analyze complicated
biological assays and better understand what is present in these complex mixtures and the
structures of these species.13-15
Physical chemists use a mass spectrometer in a slightly different way. A mass
spectrometer can be used to prepare a well-defined system. By using a well-characterized ion
source, it is possible to know the make-up of a mass-selected ion beam. The ion beam may then
be manipulated in a variety of ways, such as: colliding it with an unreactive neutral species to
determine bond energies of the precursor ion,16-19 preparing a specific ion for spectroscopic

3
investigations,20-23 using a specific ion in ion-molecule reactions to further understand reaction
dynamics,1, 24-26 and depositing an ion of interest on a surface.27-30 Thus, the use of a mass
spectrometer makes it possible to study a wide variety of problems.
Here, this dissertation will focus on two very different uses of mass spectrometry: one
involves advances made in nanoparticle mass spectrometry (NPMS) and the other involves using
a tandem mass spectrometer to investigate vibrationally state-selected HOD+ to probe endoergic
H+/D+ transfer. NPMS will be discussed in Chapters 2 through 6. Reaction dynamics of HOD+
will be discussed in Chapters 7 through 11.
References
1. R. D. Levine, Molecular Reaction Dynamics. (Cambridge U. Pr., Cambridge, 2005).
2. H. E. Duckworth, R. C. Barber and V. S. Venkatasubramanian, Mass Spectrometry, 2nd ed. (Cambridge, Cambridge, 1986).
3. W. Wien, Annalen der Physik 5, 421 (1901).
4. J. J. Thomson, Proceedings of the Royal Soceity A 89, 1 (1913).
5. W. Paul and H. Steinwedel, Zeitschrift Naturforsh. 8A, 448 (1953).
6. U. von Zahn and H. Tatarczyk, Phys. Lett. 12, 190 (1964).
7. D. Gerlich, in State-selected and state-to-state ion-molecule reaction dynamics, Part I. Experiment, edited by C. Y. Ng and M. Baer (Wiley, New York, 1992), Vol. LXXXII, pp. 1-176.
8. D. Gerlich, Adv. Chem. Phys. 82, 1 (1992).
9. P. H. Dawson, Quadrupole Mass Spectrometry. (Elsevier Scientific Pub., Amsterdam, 1976).
10. L. D. Landau and E. M. Lifshitz, Mechanics. (Pergamon Pr., Oxford, 1960).
11. D. Gerlich, in Advances in Chemical Physics: State-Selected and State-To-State Ion- Molecule Reaction Dynamics, Part 1, edited by C. Y. Ng and M. Baer (J. Wiley & Sons, 1992), Vol. 82, pp. 1-176.
12. T. N. Sorrell, Organic Chemistry 2nd Edition. (University Science Books, 2006).
13. R. Aebersold and M. Mann, Nature 422, 198 (2003).

4
14. G. J. Patti, O. Yanes and G. Siuzdak, Nature Reviews: Molecular Cell Biology 13, 263(2012).
15. J. Zaia, OMICS 14, 401 (2010).
16. P. B. Armentrout, in The Encyclopedia o f Mass Spectrometry. Volume 1: Theory and Ion Chemistry, edited by P. B. Armentrout (Elsevier, Amsterdam, 2003), pp. 426-434.
17. R. G. Cooks, in Collision Spectroscopy, edited by R. G. Cooks (Plenum Press, New York, 1978).
18. F. Muntean and P. B. Armentrout, J. Chem. Phys 115 (3), 1213 (2001).
19. M. T. Rodgers and P. B. Armentrout, J. Chem. Phys. 109, 1787 (1998).
20. H. Yao and R. Jockusch, J. Phys. Chem. A 117, 1351 (2013).
21. Q. Bian, M. W. Forbes, F. O. Talbot and R. A. Jockusch, Physical Chemistry Chemical Physics 12, 2590 (2010).
22. S. K. Sagoo and R. A. Jockusch, Journal of Photochemistry and Photobiology A: Chemistry 220, 173 (2011).
23. A. Fujii, T. Ebata and M. Ito, Chem. Phys. Lett. 161, 93 (1989).
24. S. L. Anderson, NATO ASI Ser., Ser. C 347, 183 (1991).
25. J. M. Farrar, Annu. Rev. Phys. Chem 46, 525 (1995).
26. J. Liu and S. L. Anderson, Int. J. Mass Spectrom. 241, 173 (2005).
27. M. Aizawa, S. Lee and S. L. Anderson, Surf. Sci. 542, 253 (2003).
28. M. Aizawa, S. Lee and S. L. Anderson, J. Chem. Phys. 117, 5001 (2002).
29. W. E. Kaden, W. A. Kunkel, M. D. Kane, F. S. Roberts and S. L. Anderson, J. Am. Chem. Soc. 132, 13097 (2010).
30. W. E. Kaden, T. Wu, W. A. Kunkel and S. L. Anderson, Science 326, 826 (2009).

CHAPTER 2
INTRODUCTION TO NANOPARTICLE MASS SPECTROMETRY

6
Pioneering Work
Developments in the field of nanoparticle mass spectrometry (NPMS) have slowly
progressed since the late 1950s,1 but since 2000, renewed interest in the field spurred the
development of a number of nanoparticle mass spectrometers.2-14 NPMS was first demonstrated
by Wuerker et al. in 1959 by trapping aluminum dust in a quadrupole ion trap.1 Trapped particles,
in this experiment, were so large they were visible to the eye. Pictures of the particles were taken
by shining light on them. The pictures showed that a single particle had a lissajous orbit. When
more than one particle was present in the trap, the ensemble formed a lattice structure at high
pressures, also known as a Coulomb crystal.15-17 Lattice formation was a result of the thermal
energy of the trapped particles being significantly smaller than the Coulomb repulsion between
the particles. Coulomb crystals have been studied in detail and are observed in sympathetically
cooled atomic ions.15-19 Wuercker et al. also demonstrated that by applying a sinusoidal AC
voltage to the trap, it was possible to resonantly excite the motional (or secular) frequency (®z) of
a single particle or a swarm of particles.1 Resonantly exciting a single particle or a swarm causes
them to disappear or appear as a smear in the trap. When performed on an ensemble of particles,
the lattice structure melted and became a blur because the translational energy of the ions became
greater than the Coulomb repulsion. The frequency at which the ions were excited relates to the
mass-to-charge ratio of the micro- or nanoparticle.
NPMS relies on the special relationship between the mass-to-charge ratio of an ion in a
quadrupole field and ©z.20 In a quadrupole field, the mass-to-charge ratio is defined as:
M V2V02 Q "z^Zo (
where M is the mass of the ion, Q is the number of charges on the ion, V0 is the radio frequency
(RF) voltage amplitude, ©z is the motional (secular) frequency of the ion, Q is the RF frequency
(in radians), and z0 is a geometric parameter of the field. Since V0, Q, and z0 are known because

7
they are not changed during an experiment, it is possible to determine the mass-to-charge ratio of
an ion by measuring ©z.
Resolution and Size Limit
Although first demonstrated in 1959, questions remained: what ©z resolution could be
obtained by optical detection of a single trapped nanoparticle? What is the size limit for
detection? What is the usefulness of this technique? What types of systems would be useful to
study in this way? Unfortunately, it would be decades until this research was expanded upon. In
1995 Hars and Tass21 used a laser to scatter light off of a nanoparticle and observed that by
making the ©z an interger multiple of the RF frequency (Q), the trajectory of an ion became a
star-like lissajous orbit. This technique showed it was possible to determine ©z with a precision of
1,000 ppm, by counting the points on the trajectory of the ion’s motion. Later, Schlemmer et al.
demonstrated that Fourier transforming the time record of the scattered light signal from a 500
nm SiO2 particle determined ©z to within 100 ppm for a single measurement. By creating a
histogram of the peak positions over an hour, they achieved precision of 10 ppm.2, 22
A limitation of this method is that it requires light scattering to detect micro- and nano
particles. If a particle is too small (<25 nm), it becomes difficult to detect because it does not
scatter light efficiently. The scattered light intensity from a small particle smaller than the
wavelength of light used is governed by Rayleigh scattering and scales like d6, where d is the
diameter of the particle.23 Chang et al. used small dye-doped polystyrene particles (~25 nm) to
increase signal for smaller particle sizes, but this was a destructive technique.4, 5 It may be
possible to push this boundary further by investigating very small nanoparticles (<25 nm) if they
are sufficiently fluorescent or photoluminescent.
Image charge detection is another way to detect large particles. Recently, Jarrold and co
workers demonstrated the ability to determine both the mass and charge from a virus capsid in a
cone trap.24 They determined the charge by the amplitude of the image charge signal, and the
8
mass-to-charge ratio by the frequency at which the ion passed through the image charge detector.
Image charge detection is a robust technique used in a variety of methods25, 26 and has the
advantage that it is possible to track both bright and dark particles. Compared to an electrostatic
trap, a Paul trap has the advantage that an ion can be trapped for more than a day, which is not
true in an electrostatic trap. Image charge detection is difficult in a Paul trap because the large RF
voltages present on the trap make it difficult to observe small fluctuations in voltage due to the
trapped ion.
Using Quantum Dots
In order to decrease the size of particles detected by this method, they must be very bright
despite being small in size. Core-shell CdSe/ZnS nanocrystal quantum dots (QDs) are an
excellent candidate for such studies. QDs are generally between 2 nm - 10 nm in diameter,
significantly smaller than previous particles used for these studies. CdSe/ZnS QDs can be very
bright, having a quantum yield of 50 - 85%.27 Unfortunately, little is known about how QDs will
behave when charged with more than one charge or detached from a surface / out of solution. To
date, there has only been one study analyzing QDs detached from a surface or not in solution.28
This gas phase study examined the photoelectron spectra of neutral QDs and determined the
fraction of the evanescent wavefunction that extends past the QD surface.
However, charging QDs should have a large effect on their optical properties (i.e.,
absorption and emission spectra, fluorescence intermittency (blinking), and fluorescence
lifetime). A number of groups have shown that charging a QD on an electrode with one charge,
positive or negative, can change its optical properties.29-36 Guyot-Sionnest and co-workers
showed that putting an electron on a QD by applying a negative voltage (-0.7 V) quenched the
fluorescence of QDs. Conversely, applying a positive voltage (+0.3 V), removing the electron,
immediately restored the fluorescence.30 Galland etal. subsequently showed that there were two
blinking mechanisms, both of which could be electrochemically controlled.36 One type is due to

9
an excess electron causing Auger recombination, thus a positive voltage quenches blinking by
removing the electron from the QD. The other type is due to interaction between the Fermi level
of the substrate with dark trap states on the surface of the QD. It is hypothesized that applying a
negative voltage quenches blinking because the surface states are filled, so there may only be
radiative recombination. Since charging a QD positive or negative can both quench blinking or
fluorescence, it is difficult to predict if a charged QD will fluoresce at all in an ion trap.
Potential Applications of Nanoparticle Mass Spectrometry
Schlemmer et al. also showed it was possible to determine the absolute mass and charge
of a nanoparticle by observing discrete quantized steps in ©z that were stimulated by an electron
gun. The steps resulted from changes in the number charges present. After determining the
absolute mass, it is possible to conduct chemistry on a nanoparticle and track how the mass,
alone, changes as molecules adsorb to the surface. Schlemmer illustrated this by depositing C60
on a trapped nanoparticle and burning off the carbon layer with a CO2 laser.
There have been limited applications of studying chemical systems with NPMS so far,
but there are many potential uses of this technique. Further increases in precision and resolution
would make it possible to observe smaller changes in mass and hypothetically individual
molecules absorbing to and desorbing from the surface. Utilizing a CO2 laser can make it possible
to study high temperature surface chemistry and thermal emission from a variety of nanoparticles.
NPMS could be a useful technique to investigate high temperature chemistry on nanoparticle
surfaces. Another application of this method would be to use a bright particle to observe the
mass-to-charge ratio of a dark particle, which would increase the potential uses of this technique
dramatically. A prerequisite is that the motion of the two particles must not strongly couple (form
a Coulomb crystal), or have secular frequencies that are close to one another. Specifically, viruses
would be an interesting candidate to study with this dark particle detection scheme. A final
potential use would be to build nanostructures in the trap by trapping a positively charged

10
nanoparticle and then introducing a more negatively charged nanoparticle. The Coulomb
attraction between the particles would bring them together in the trap. This could be done
repeatedly to build very specific nanostructures and to study the optical properties of these
interesting species, such as energy transfer between two QDs.
Here, two methods were used to ascertain the mass-to-charge ratio of a >100 nm
polystyrene nanoparticle with light scattering. One of the methods exhibited precision
approaching 10 ppm for a single spectrum. Chapters 4 shows that fluorescence from QDs
enhanced when exposed to a CO2 laser (X = 10.6 ^m). Chapter 5 demonstrates that single QDs
were trapped over the course of hours and days and charge steps revealed the absolute charge and
mass. When heated, the QD sublimates until it goes dark, and once dark, the QD begins to
fluoresce intermittently or blink.
References
1. R. F. Wuerker, H. H. Shelton and R. V. Langmuir, Journal of Applied Physics 30, 342 (1959).
2. S. Schlemmer, J. Illemann, S. Wellert and D. Gerlich, AIP Conf. Proc. 457, 80 (1999).
3. Y. Cai, W. P. Peng, S. J. Kuo, Y. T. Lee and H. C. Chang, Anal. Chem. 74, 232 (2002).
4. Y. Cai, W. P. Peng and H. C. Chang, Anal. Chem. 75, 1805 (2003).
5. W. P. Peng, Y. Cai, Y. T. Lee and H. C. Chang, Int. J. Mass Spectrom. 229, 67 (2003).
6. M. Grimm, B. Langer, S. Schlemmer, T. Lischke, W. Widdra, D. Gerlich, U. Becker and E. Ruehl, AIP Conf. Proc. 705, 1062 (2004).
7. W.-P. Peng, Y.-C. Yang, M.-W. Kang, Y. T. Lee and H.-C. Chang, J. Am. Chem. Soc. 126, 11766 (2004).
8. W. Ping-Peng, Y.-C. Yang, C.-W. Ling and H.-C. Chang, Analytical Chemistry 77, 7084 (2005).
9. M. Grimm, B. Langer, S. Schlemmer, T. Lischke, U. Becker, W. Widdra, D. Gerlich, R. Flesch and E. Ruehl, Phys. Rev. Lett. 96, 066801 (2006).
10. C. Graf, B. Langer, M. Grimm, R. Lewinski, M. Grom and E. Ruehl, J. Electron Spectrosc. Relat. Phenom. 166-167, 74 (2008).

11
11. A. J. Trevitt, P. J. Wearne, E. J. Bieske and M. D. Schuder, Opt. Lett. 31, 2211 (2006).
12. A. J. Trevitt, P. J. Wearne and E. J. Bieske, International Journal of Mass Spectrometry 262, 241 (2007).
13. T. A. Smith, A. J. Trevitt, P. J. Wearne, E. J. Bieske, L. J. McKimmie and D. K. Bird, Springer Ser. Fluoresc. 4, 415 (2008).
14. A. J. Trevitt, P. J. Wearne and E. J. Bieske, J. Aerosol Sci. 40, 431 (2009).
15. M. Drewsen, I. Jensen, J. Lindballe, N. Nissen, R. Martinussen, A. Mortensen, P. Staanum and D. Voigt, Int. J. Mass Spectrom. 229, 83 (2003).
16. B. Roth, P. Blythe and S. Schiller, Phys. Rev. A: At., Mol., Opt. Phys. 75, 023402 (2007).
17. B. Szymanski, R. Dubessy, B. Dubost, S. Guibal, J. P. Likforman and L. Guidoni, Applied Physics Letters 100, 171110 (2012).
18. M. A. van Eijkelenborg, M. E. M. Storkey, D. M. Segal and R. C. Thompson, Phys. Rev. Lett. 60, 3903 (1999).
19. S. Willitsch, M. T. Bell, A. D. Gingell and T. P. Softley, Phys. Chem. Chem. Phys. 10, 7200 (2008).
20. P. H. Dawson, Quadrupole Mass Spectrometry. (Elsevier Scientific Pub., Amsterdam, 1976).
21. G. Hars and Z. Tass, J. Appl. Phys. 77, 4245 (1995).
22. S. Schlemmer, J. Illemann, S. Wellert and D. Gerlich, Journal of Applied Physics 90, 5410 (2001).
23. C. F. Bohren and D. R. Huffman, Absorption and Scattering o f Light by Small Particles. (Wiley-VCH, 19)83).
24. N. C. Contino, E. E. Pierson, D. Z. Keifer and M. F. Jarrold, J. Am. Soc. Mass Spectrom.24, 101 (2013).
25. R. H. Perry, R. G. Cooks and R. J. Noll, Mass Spectrom. Rev. 27, 661 (2008).
26. E. R. Badman, G. E. Patterson, J. M. Wells, R. E. Santini and R. G. Cooks, J. Mass Spectrom. 34, 889 (1999).
27. M. A. Hines and P. Guyot-Sionnest, J. Phys. Chem. 100, 468 (1996).
28. W. Xiong, D. D. Hickstein, K. J. Schnitzenbaumer, J. L. Ellis, B. B. Palm, K. E. Keister, C. Ding, L. Miaja-Avila, G. Dukovic, J. L. Jimenez, M. M. Murnane and H. C. Kapteyn, Nano Lett. 13, 2924 (2013).
29. P. Guyot-Sionnest, Microchim Acta 160, 309 (2008).

12
30. P. P. Jha and P. Guyot-Sionnest, J. Phys. Chem. C 114, 21138 (2010).
31. W. Qin, R. A. Shah and P. Guyot-Sionnest, ACS Nano 6, 912 (2012).
32. M. Shim, C. Wang and P. G. Sionnest, J. Phys. Chem. B 105, 2369 (2001).
33. C. Wang, B. L. Wehrenberg, C. Y. Woo and P. Guyot-Sionnest, J. Phys. Chem. B 108, 9027 (2004).
34. Z. Ding, B. M. Quinn, S. K. Haram, L. E. Pell, B. A. Korgel and A. J. Bard, Science 296, 1293 (2002).
35. N. Myung, Z. Ding and A. J. Bard, Nano Letters 2 , 1315 (2002).
36. C. Galland, T. Ghosh, A. Steinbruck, M. Sykora, J. A. Hollingsworth, V. I. Klimov andH. Htoon, Nature 479, 203 (2011).

CHAPTER 3
NONDESTRUCTIVE, HIGH PRECISION MASS DETERMINATION
FOR SINGLE, TRAPPED, GIGADALTON NANOPARTICLES

14
Overview
Several methods for nondestructive mass measurements on single, trapped nanoparticles
in the gigadalton (GDa) mass range are demonstrated, and the trade-offs between speed,
precision, and ease of use are discussed. Charged nanoparticles are introduced into vacuum by
electrospray ionization, and trapped in a quadrupole ion (Paul) trap, with detection by light
scattering. The mass/charge ratio of the particle was then probed by one or more of four
methods, all based on detecting the secular frequency for motion of the particle in the trap,
working in either the time or frequency domains. Use of selective ejection from coulomb crystals
to trap single particles, the effects of pressure on coulomb crystals and secular resonance width,
and the spectrum of simultaneously trapped particles are also discussed. Precision approaching 1
ppm for mass-to-charge ratio determination is demonstrated.
Introduction
Nanoparticle mass spectrometery (NPMS) provides a tool for precise mass measurements
on single objects such as nanoparticles1-8 and whole cells,9 which are difficult to study in
conventional mass spectrometers. Three-dimensional quadrupole (Paul) traps have been used by
several groups for nondestructive, high precision mass measurements on single nano- and micro-
3 8 10 13particles. , , - These methods utilize light scattering or laser-induced fluorescence (LIF) by the
trapped particle, to detect the particle and monitor its motions. Because detection is
nondestructive, particles can be probed for long time periods, enabling studies of surface
chemistry,2, 3 optical properties,13-16 and charging under photon flux,5, 1 17 in conjunction with
mass measurements.
The usual problem in mass spectrometry is to resolve closely spaced peaks in a spectrum
of intensity as a function of mass/charge ratio (M/Q). Common, IUPAC-defined figures of merit
are “resolving power” (AM) and “resolution” (M/AM), where AM is essentially a measure of the
peak width in the spectrum.18 For single particle mass spectrometry, a typical spectrum has, at

most, a few well-separated peaks, thus the critical figure of merit is the uncertainty with which
peak position can be determined. Peak width is still important because it affects this positional
uncertainty. Another important factor is that the detection method used here is nondestructive,
allowing repeated measurements of M/Q for a single particle. In the following, we use the term
“precision” to mean the uncertainty in M/Q, divided by M/Q, (i.e., A(M/Q)/(M/Q) determined
over multiple measurements. As defined, the precision is the reciprocal of the more typically
quoted “resolution”. We will mainly use the figure of “width” or full width at half maximum,
which refers to a single measurement of a peak, and is identical to “resolving power”. Plotting the
peak position over multiple measurements is the ideal way to obtain high precision, as
demonstrated by Gerlich and co-workers, but requires that the mass does not change slightly over
time.
Particles (or ions) are confined in a Paul trap by a combination of DC (U0) and AC
potentials (V0 at angular frequency Q). Under appropriate conditions discussed below, the
trajectories are well described as rapid driven oscillations at frequency Q, superimposed on slow,
“secular” motion. For an ideal Paul trap, the secular motion is harmonic and, as a result, has
well-defined secular frequencies ©r and ©z, for radial and axial motion, respectively, which
depend on the particle’s mass-to-charge ratio, M/Q, as well as the trap dimensions and applied
potentials.1, 3 The goal is, therefore, to measure one or both of the secular frequencies of the
trapped particle, thereby obtaining M/Q. M is determined by extracting Q, as discussed below.
Several approaches have been demonstrated for secular frequency measurement. The
secular frequency can be tuned (e.g., by adjusting V0), such that the frequency of the rapid driven
motion (at Q) is an integer multiple of the secular frequency. When this occurs, the particle’s
motion can become a Lissajous orbit, which can be imaged in scattered light or LIF, appearing as
a multilobed standing wave, the structure of which reveals the ratio ®/Q.3, 8 19, 20 The secular
frequency (thus, M/Q) can be measured with precision of between 1000 ppm and 100 ppm by this
method.19 Another approach, demonstrated by Gerlich and co-workers, is to measure scattered
15
16
light intensity as a function of time, I(t), as the trapped particle oscillates relative to a low
powered laser focused through the trap center. I(t) can then be Fourier transformed to obtain the
secular frequency spectrum. Working with 500 nm SiO2 particles, Gerlich and co-workers
demonstrated precision of ~100 ppm for a single ten second I(t) measurement. By analyzing the
spread in © from many such I(t)/FT experiments over the course of an hour, they showed that
M/Q could be determined with precision of ~10 ppm.3 A weakness of this method is that as
particle size decreases, higher signal levels are needed to give time resolution high enough to
resolve the higher secular frequency, which scales like M-1; however, light scattering signal is a
strong function of particle diameter ( I o d 6), making measurements on small particles difficult.
Here, we compare results of four different approaches to secular frequency measurement
- two in the time domain, and two in the frequency domain. The different methods involve
different compromises between measurement speed and precision, and therefore can be chosen
for the problem at hand.
Experimental Setup
Instrumentation
The experimental setup is described in detail elsewhere.12 The instrumentation comprises
a small vacuum system with two differentially pumped chambers, sitting on a pneumatically
isolated laser table, which is surrounded by a light-tight enclosure, which also attenuates acoustic
noise reaching the instrument. The turbomolecular and mechanical pumps are isolated by
bellows to minimize vibration. The instrument includes an electrospray source used to get
nanoparticles into the gas phase, several ion guides used for differential pumping and mass pre
filtering, the quadrupole trap, and optics and detectors for monitoring trapped nanoparticles by
light scattering.
17
The Particle Trap
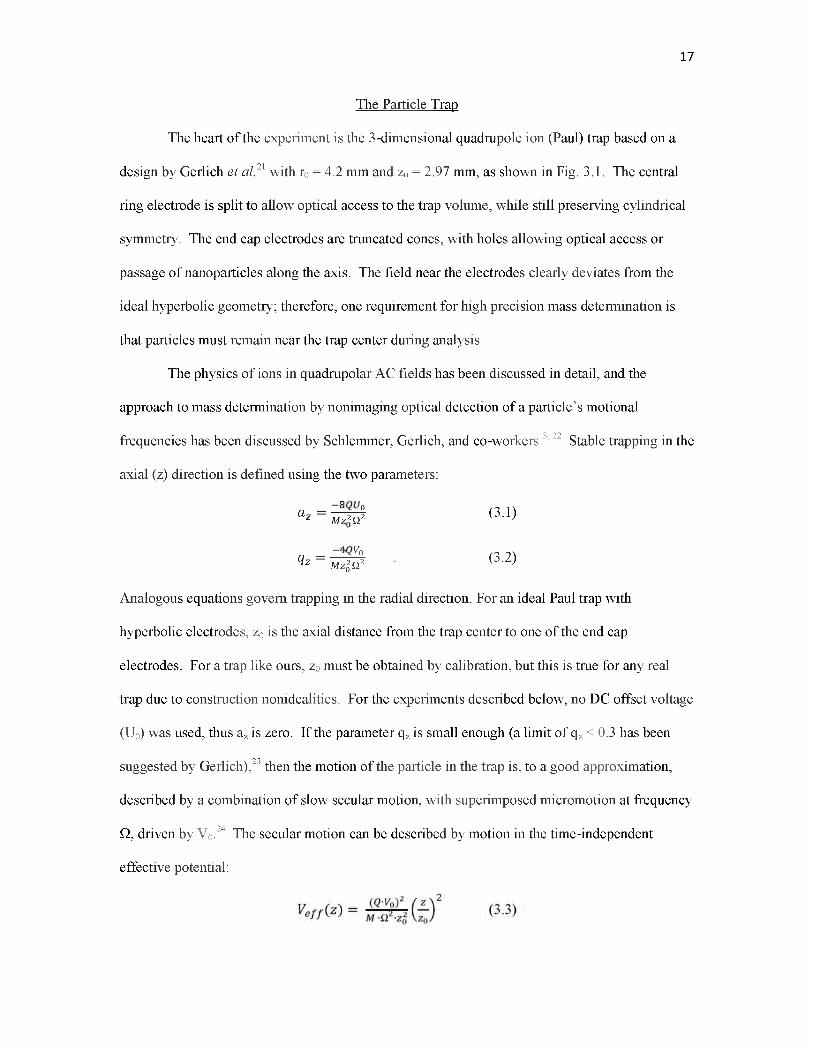
The heart of the experiment is the 3-dimensional quadrupole ion (Paul) trap based on a
design by Gerlich et a l21 with r0 = 4.2 mm and z0 = 2.97 mm, as shown in Fig. 3.1. The central
ring electrode is split to allow optical access to the trap volume, while still preserving cylindrical
symmetry. The end cap electrodes are truncated cones, with holes allowing optical access or
passage of nanoparticles along the axis. The field near the electrodes clearly deviates from the
ideal hyperbolic geometry; therefore, one requirement for high precision mass determination is
that particles must remain near the trap center during analysis.
The physics of ions in quadrupolar AC fields has been discussed in detail, and the
approach to mass determination by nonimaging optical detection of a particle’s motional
frequencies has been discussed by Schlemmer, Gerlich, and co-workers.3, 22 Stable trapping in the
axial (z) direction is defined using the two parameters:
az = —ir 2 (3.1)z Mz2 Q2 v ’
qz = —T% . (3.2)^z Mz2 Q2 v ’
Analogous equations govern trapping in the radial direction. For an ideal Paul trap with
hyperbolic electrodes, z0 is the axial distance from the trap center to one of the end cap
electrodes. For a trap like ours, z0 must be obtained by calibration, but this is true for any real
trap due to construction nonidealities. For the experiments described below, no DC offset voltage
(U0) was used, thus az is zero. If the parameter qz is small enough (a limit of qz < 0.3 has been
suggested by Gerlich),23 then the motion of the particle in the trap is, to a good approximation,
described by a combination of slow secular motion, with superimposed micromotion at frequency
Q, driven by V0.24 The secular motion can be described by motion in the time-independent
effective potential:

18
where Veff(z) is the effective potential for motion in the axial direction, and the other parameters
are defined above. The analogous expression for the effective potential governing radial motion
is:
For the ideal Paul trap geometry, Veff(r) grows more slowly with distance from the trap center
larger. The relationship between the secular frequency for axial motion (©z) and the mass-to-
charge ratio (M/Q) is:
In reality, the cylindrical symmetry of the trap is broken by construction nonidealities, gravity
(the trap axis is horizontal), and by the light pressure on the particle from the detection laser,
which passes through the trap radially. As a result, is split into x and y components, and
oir,y. In the discussion below, we report frequencies in Hertz (F = Q/2n, fz = ©z/2n, fr = ©r/2n).
The trapping voltage, V0, was generated by two different home-built sources. The first is
similar to a radio-frequency source described elsewhere,25 modified to allow operation at V0 up to
1 kV, by replacing the tetrodes used in the original design, with a pair of high voltage triode tubes
(811A). The RF frequency, F, can be varied over a wide range (100 kHz - 1 MHz), but for the
measurements discussed below, it was fixed at F = 145 kHz. In this RF generator design, V0 is
controlled by the DC voltage applied to the anodes of tubes, supplied by an HP6448B power
supply. This RF-source design becomes increasingly inefficient at lower frequencies, and to
allow operation in the 5 kHz - 70 kHz range, we constructed an amplifier system that is driven by
(3.4)
than Veff(z), thus for a given amount of energy, the amplitude of motion in the radial direction is
M _ y/T-V0 (3.5)
Because of the form of the radial and axial effective potentials, the axial and radial secular
frequencies are simply related:
(3.6)

19
the sine wave output of an Agilent 33220A function generator. For the present work, the
frequency was fixed at 15 kHz.
To obtain accurate M/Q values, all parameters in Equation 3.5 must be known accurately.
Frequencies are easily measured to better than ppm accuracy, thus the limiting factors are the
geometrical parameter z0, and measurement of the trapping amplitude, V0. We have implemented
a design by Peng et al. for a ppm-accuracy AC voltmeter designed to measure V026; however, V0
will ultimately need to be determined by mass-based calibration. Calibration is also clearly
required to obtain the z0 parameter, which depends on the construction accuracy of the trap,
estimated to be ~10 ^m, corresponding to uncertainty in z0 of 0.3 %. A proposed approach for
high accuracy mass calibration is discussed below. The focus of this report, however, is on
comparing methods for high precision (as opposed to absolute) M/Q measurements, and for this
purpose, it suffices that the trapping parameters be stable to ppm levels over several hours.
Ion Formation and Trapping
Charged nanoparticles were generated by electrospraying Nile red-doped polystyrene
particles (Invitrogen) using a capillary voltage of 3.5kV and a cone voltage of 210V, spraying a
solution obtained by diluting the 2 wt% stock solution 1:20 in methanol. The particles are non
toxic, but it is recommended to wear gloves when handling the solution. Dynamic light scattering
indicated that the average particle size in solution is 24 nm, but the solution also contained a
small fraction of aggregates in the 200nm - 400nm size range. Positively charged nanoparticles
were formed by electrospray, presumably due to excess Na+ originating from NaN3 present in the
stock solution. Particles were collected by a hexapole ion guide, operating at 24mTorr
background pressure to collisionally focus the particle beam, as demonstrated for whole virus
particles.21 The particles then passed through a linear radio-frequency quadrupole guide operated
with the same V0 and Q as the trap, thereby selectively transmitting only particles in the M/Q
range of interest for trapping. To aid trapping, 20 - 30 mTorr of argon was leaked into the

20
chamber containing the trap. Under these conditions, the trap is filled with a small swarm of
nanoparticles in ~3 seconds. After filling, an isolation valve built into an ion lens that separates
the hexapole and linear quadrupole is closed, allowing the pressure in the trapping section of the
instrument to reach 10-8 Torr. Alternatively, single particles can be gated into the trap using
either the isolation valve or one of the “Lens” electrodes (Figure 3.1).
Optical Detection
In the experiments described here, the nanoparticle ion beam was injected along the axis
of the trap, leaving the azimuthal gap in the split ring electrode available for laser passage and
light collection. The light scattering laser was a cw diode-pumped solid state laser operating at
532 nm (UltraLasers), loosely focused through the trap center along what is denoted the x-axis in
Figure 3.1. The intensity was adjusted to ~500 W/cm2 at the focus. The beam waist diameter
was measured by observing light scattering from a single particle in the trap, as the laser focal
spot was translated along the y axis. The effective “size” of the particle for this measurement is
determined by the time-averaged thermal motion of the particle in the trap, because secular
motion is much faster than the measurement time. Decker et al,28 have shown that the mean
square thermal motion amplitudes are:
r l = 8 kBT ^ 0 - , and z 2m = 2kBT ^ - , (7)v VR F v VRF
For particles in the M and Q range examined here and for V0 = 500 V and F = 145 kHz, the full
widths of the radial and axial distributions (2-rm and 2-zm) are ~7.2 ^m and ~3.6^m, respectively.
After correcting for the thermal motion, the laser beam waist is estimated to be ~260 ^m. The
loose focus allows experiments combining imaging and frequency detection.
Light scattered by trapped particles was collected and collimated by an aspheric lens
located along the y-axis, 25 mm from the trap center, passed through a beam expander, and then
either imaged onto the focal plane of a CCD camera, or focused onto the 100 ^m x 100 ^m active
21
area of an avalanche photodiode (APD) with a magnification of ~2 (i.e, the APD detected light
from a 50 ^m x 50 ^m area in the horizontal plane of the trap). The TTL pulses from the APD
were counted by a ComTec multichannel scalar with up to 219 bins, the width of which could be
varied down to 200ns.
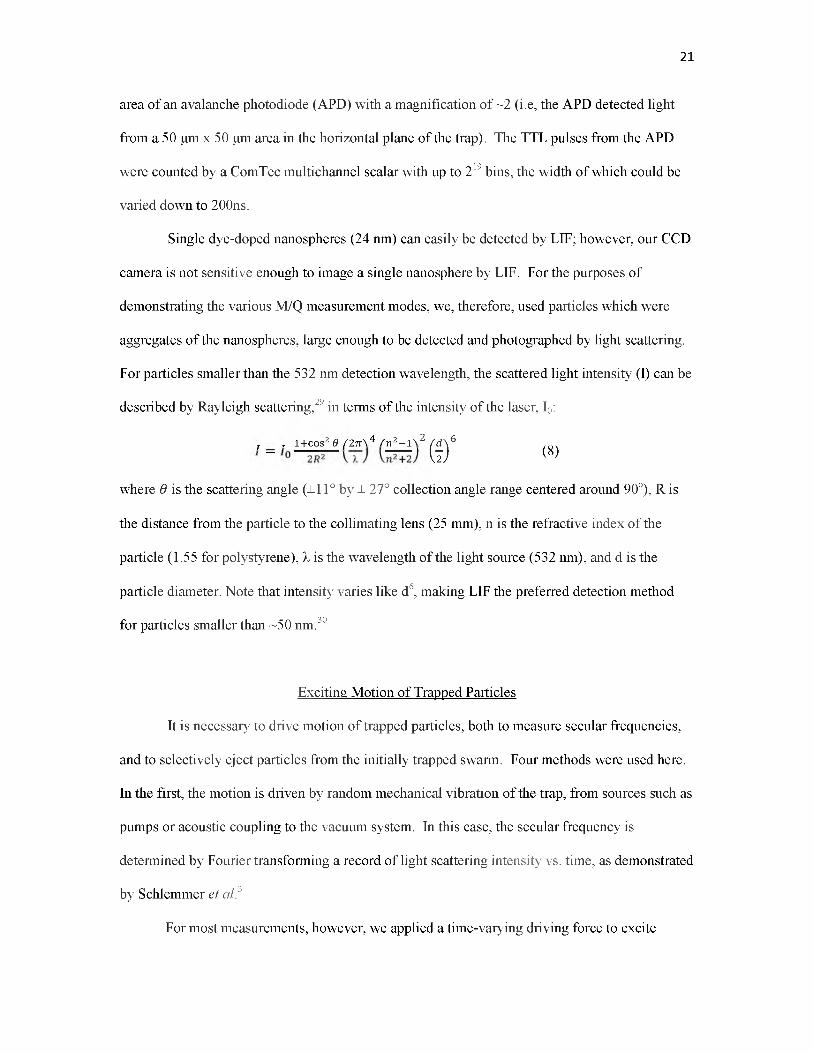
Single dye-doped nanospheres (24 nm) can easily be detected by LIF; however, our CCD
camera is not sensitive enough to image a single nanosphere by LIF. For the purposes of
demonstrating the various M/Q measurement modes, we, therefore, used particles which were
aggregates of the nanospheres, large enough to be detected and photographed by light scattering.
For particles smaller than the 532 nm detection wavelength, the scattered light intensity (I) can be
described by Rayleigh scattering,29 in terms of the intensity of the laser, I0:
T , l+cos2 8 f2n\4 / n 2-l\2 fd\6
~ l i J (8)
where 9 is the scattering angle (±11° by ± 27° collection angle range centered around 90o), R is
the distance from the particle to the collimating lens (25 mm), n is the refractive index of the
particle (1.55 for polystyrene), X is the wavelength of the light source (532 nm), and d is the
particle diameter. Note that intensity varies like d6, making LIF the preferred detection method
for particles smaller than ~50 nm.30
Exciting Motion of Trapped Particles
It is necessary to drive motion of trapped particles, both to measure secular frequencies,
and to selectively eject particles from the initially trapped swarm. Four methods were used here.
In the first, the motion is driven by random mechanical vibration of the trap, from sources such as
pumps or acoustic coupling to the vacuum system. In this case, the secular frequency is
determined by Fourier transforming a record of light scattering intensity vs. time, as demonstrated
by Schlemmer et al.3
For most measurements, however, we applied a time-varying driving force to excite
22
secular motion. In most experiments, the driving force comes from a weak sinusoidal electrical
potential, and for this purpose, an AC signal was generated by an Agilent 33220A function
generator, applied either to one of the trap end cap electrodes (for particle ejection) or to one of
the “lens” electrodes just outside the trap, relying on field penetration to provide a weak driving
force for precision measurements. Another approach was to use modulated light pressure from
the light scattering laser to drive the particle motion. Analogous approaches have been applied to
the study of trapped laser-cooled atomic ions, (e.g. Be+, Ca+, Ba+ ...) which condense into a
lattice structure (coulomb crystal), in either a Paul trap or a linear ion trap, where they are
detected by LIF.31-33
The different methods are useful in different contexts. For example, in the highest
precision method, it is only practical to probe a narrow range of secular frequency, thus it is
essential to first determine a rough (100 ppm) value of the secular frequency using some fast
method. Fast methods are also critical in experiments where either the particle or charge change
on a fast timescale, as in particle surface chemistry or collision experiments.
Results and Discussion
Preparing a Single Trapped Particle from a Trapped Ensemble
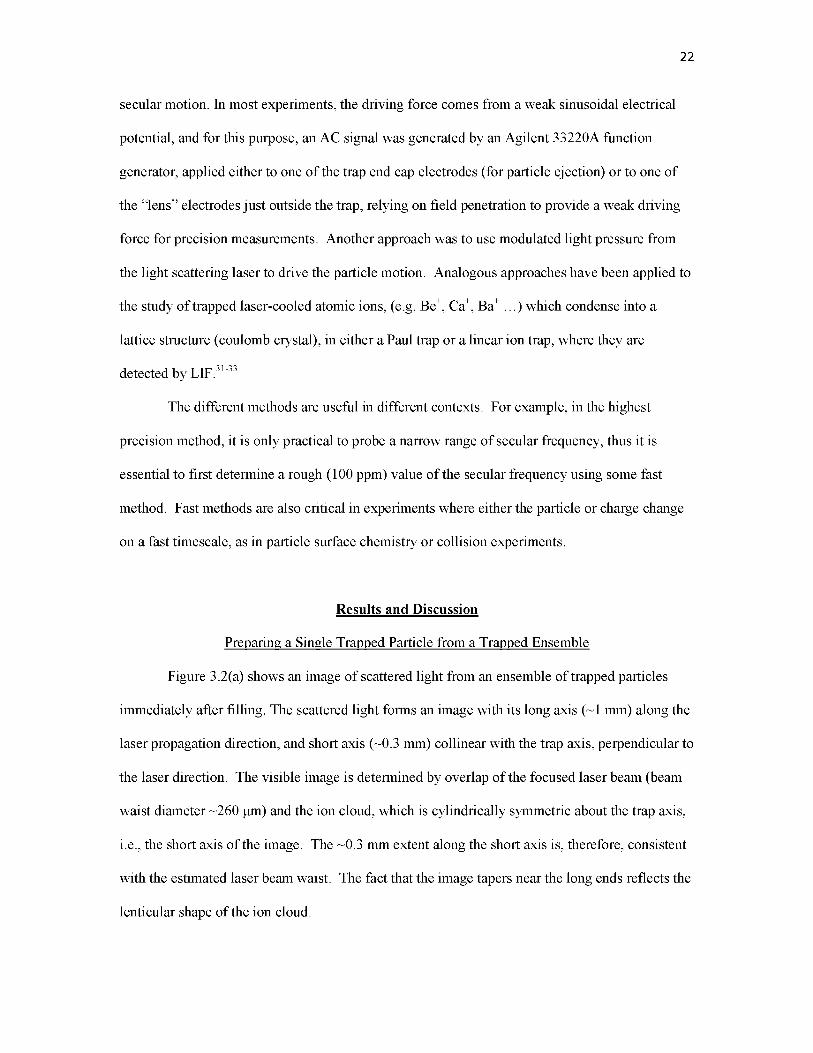
Figure 3.2(a) shows an image of scattered light from an ensemble of trapped particles
immediately after filling. The scattered light forms an image with its long axis (~1 mm) along the
laser propagation direction, and short axis (~0.3 mm) collinear with the trap axis, perpendicular to
the laser direction. The visible image is determined by overlap of the focused laser beam (beam
waist diameter ~260 ^m) and the ion cloud, which is cylindrically symmetric about the trap axis,
i.e., the short axis of the image. The ~0.3 mm extent along the short axis is, therefore, consistent
with the estimated laser beam waist. The fact that the image tapers near the long ends reflects the
lenticular shape of the ion cloud.

23
The trapped ions have obviously condensed into a lattice structure, with each particle in a
well-defined spatial position, i.e., a coulomb crystal. Coulomb crystals of trapped particles were
first observed in 1959 by Wuerker et al. for trapped aluminum dust,20 and the phenomenon has
been discussed in depth by others.34, 35 In essence, confined, charged particles crystalize into a
lattice when the coulomb repulsion between the particles is much greater than the thermal kinetic
energy. Each point represents the region an individual charged particle explores due to thermal
motion, and in these pictures, each point is ~10 - 30 ^m. One interesting point is that in order to
see discrete lattice spots, the ion cloud must be stationary, even though the cylindrical symmetry
of the trap might be expected to result in free rotation of the ion cloud. In this case, asymmetry
resulting from construction nonidealities, gravity, and light pressure from the laser was evidently
large enough to prevent rotation of the crystal.
Panels (b) - (d) show changes in the image as particles of lower M/Q are resonantly
ejected from the trap in successive steps to prepare the trap with only a single particle. The argon
pressure during particle ejection was increased to 10-3 Torr to broaden the frequency response so
that fast, high amplitude frequency sweeps could be used. To reduce the cloud to the size shown
in panel (b), a 2 V sine wave was applied (in addition to the 145 kHz trapping voltage) to one of
the end cap electrodes of the trap, and swept in 15 seconds from 30kHz to 3kHz, thereby
resonantly ejecting particles with secular frequencies in that range. As the AC frequency
approaches resonance with the lower M/Q particles in the cloud, the excitation leads to “melting”
of the lattice and ejection of the low M/Q particles. As soon as the excitation stops, the remaining
cloud immediately crystallizes again, as collisions with Ar damp the kinetic energy. To obtain
the image in panel (c), the sweep was continued to 2.5 kHz, ejecting most of the remaining
particles. Finally, after a sweep to 2.35 kHz, only a single particle, corresponding to the one with
the highest M/Q ratio, remains. By varying the range of a frequency sweep, it is possible to pick
a single particle out of any part of the initial M/Q distribution.
24
I(t)/FT Method
If the signal levels are high enough, it is possible to observe the secular frequency
directly in the time domain, as fluctuations in light scattering signal due to motion of the particle
relative to the detection volume defined by the overlap of the light scattering laser focus and the
APD imaging system. The record of intensity vs. time (I(t)) can then be Fourier transformed to
give the frequency spectrum, as demonstrated by Gerlich and co-workers,3 and illustrated in
Figure 3.3. Both here and in the original experiments by Gerlich and co-workers,3 the secular
motion was driven by instrument vibration; however, we have tried to minimize the vibration in
order to minimize precision degradation from large amplitude motion. Nonetheless, there is still
enough instrument vibration to drive secular oscillation leading to scattered light modulation of
10 - 20% as the particle moves relative to the detection volume. The top frame of Figure 3.3
shows a typical FT spectrum of an I(t) record with 524,288 bins and a bin size of 300 ^sec, for
trapping conditions of V0 = 18 V and F = 15 kHz. The two main frequency components over this
range are fr and fz (at 2 fr) and the insets show these peaks in detail. The frequencies are fr =
629.216 Hz and fz = 1258.56 Hz, and correspond to M/Q = 1.59805 MDa (uncalibrated). The
precision of these measurements is ~10 ppm, which is a roughly 5-fold improvement over the
best previous measurements by this method. In addition to the two main peaks, there is additional
weak structure. The fr and fz peaks show roughly symmetric side-bands at fr (or fz) ± 13.6 Hz,
and the 13.6 Hz frequency is also seen in the FT spectrum. There presumably is a mechanical
resonance of the instrument at this frequency leading to coupling to the particle motion.
If the bin size of the I(t) measurement is decreased to 20 ^sec to allow higher frequencies
to been seen in the FT, then the influence of the AC trapping potential (V0) can be observed. The
bottom frame of Figure 3.3 shows the frequency range from 13kHz to 11 kHz, centered about the
frequency of the trapping potential (F = 15 kHz). As shown, in addition to the peak from the
trapping potential, there are symmetric side bands corresponding to F ± fr and F ± (fr + fz). A
small peak was also observed for F - fz (~13,151 Hz), but the corresponding F + fz peak does not

rise above baseline. As discussed above, the motion of particles can be described as slow motion
at fz and fr, with small amplitude motion at F superimposed, and the peaks observed in this
frequency range are the result of modulation of the light scattering signal by the coupled motion
at F, fz, and fr. Modulation occurs only if the particle motion carries it out of the ~50 ^m x 50 ^m
viewing area of the APD detector, and the weakness of the F ± fz side bands (and the fz peak in
the top frame of Figure 3.3) is attributable to the fact that Veff(z) > Veff(r). As a result, the motion
has smaller amplitude in the axial direction, and therefore, there is less signal modulation
associated with fz.
The insets show the peak shapes for the both the central peak and one of the side bands.
From the side band positions, fr and fz can be determined. For example, from the radial side
bands at 14369.51 Hz and 15628.07 Hz and the value of F (14998.79 Hz), fr is found to be 629.28
Hz - nearly identical to the 629.276 value obtained from the direct measurement in the top frame
of Figure 3.3. Similarly, from the F ± (fr + fz) side bands at 16886.63 Hz and 13110.95 Hz, the
value of fz = 1258.56 Hz, again identical to directly measured value. The disadvantage to
extracting the secular frequencies from F ± f sidebands is that the frequencies that must be
measured are high, requiring short time bins for the I(t) measurement, increasing the effects of
noise. In this example, the secular frequency precision obtained from the side bands was ~60
ppm - ten times worse than from the direct measurement.
Beat Frequency Measurements
Ultimately, the limiting factor of the I(t)/FT method is that the signal levels need to be
high enough to give good statistics in the time bins of the I(t) record. This is not a problem for
the large particles used here for demonstration purposes, where the light scattering signal is ~106
counts/second. As particle diameter (d) decreases, however, two factors rapidly degrade the I(t)
statistics. Light scattering intensity ( I o d6) drops rapidly, and at the same time, shorter time
bins must be used to record the I(t) record because less massive particles ( tend to have
25

higher secular frequencies. We have used LIF to detect small particles, such as quantum dots13;
however, for laser intensities low enough to avoid excessive particle heating, the signal levels are
far too low for I(t)/FT measurements. It is possible, however, to extend the usability range of the
I(t)/FT approach by measuring the beat frequency between the particle secular motion, and a
fixed frequency drive signal. Because the beat frequency is much lower than the secular
frequency, longer time bins can be used, with concomitant increase in I(t) statistics.
Figure 3.4 shows an example of raw I(t) signals, for the same particle that was probed in
Figure 3.3. A 400 mV sine wave was applied to one of the “Lens” electrodes outside the trap,
creating a weak drive signal at fDrive = 1258.46 Hz. The I(t) record for the particle excited only by
random mechanical vibration is shown in the top trace, while the bottom trace shows the signal
for the particle driven at fDrive. The signal from this large particle was adequate to allow the I(t)
records to be recorded with short enough bin sizes (300 ^sec) for direct secular frequency
measurement, but in the figure, the I(t) data are rebinned with 50 msec bins to allow the low
frequency components of interest to be seen clearly. In the top trace, the fastest oscillations in
this frequency range correspond to the aforementioned 13.6 Hz mechanical resonance. When fDrive
is present (lower trace), the average signal decreases because the driven particle spends less time
in the detection volume, and strong oscillations are observed at the ~2 Hz beat frequency between
fDrive and fz. Figure 3.5 shows FTs of the two I(t) time traces. The main frame of the figure
shows the FT (of the raw signal with 300 ^sec bins) in the range near fDrive and fz (1256.53 Hz).
The inset shows the frequency range centered on the beat frequency, fDrive - fz, showing a
prominent peak at 1.931 Hz. As expected, the value of fz given by fDrive - fBeat is in excellent
agreement with the value measured directly.
There are two issues that affect the beat frequency measurement. It is possible that there
may be instrument mechanical resonances that interfere with measurement of beat frequency,
which tends to be in the same low frequency range. Indeed, it can be seen that a weak resonance
at ~2 Hz is present in the FT even when the drive signal is not present. The beat frequency signal
26
27
when the drive is present is much stronger; nonetheless, coupling to the mechanical resonance
may be responsible for broadening the beat frequency peak, resulting in precision of only ~35
ppm for fz extracted by this method. By making measurements with at several different drive
frequencies, it should be possible to shift fBeat into “quiet” ranges of the vibrational spectrum. The
beat frequency method, therefore, appears promising as a relatively fast method that can be
applied to smaller particles than direct secular frequency measurement.
Particle Oscillation Driven by Laser Modulation
The time-domain/FT approach to frequency determination is fast, but it has several
drawbacks. If mechanical vibration or some other broad-band stimulus (e.g., a voltage pulse) is
used to drive secular motion, it needs to be strong enough to stimulate motion over a wide range
of secular frequencies. Such excitations tend to result in large amplitude motions, exploring
regions where the trap potential has significant nonidealities, and causing broadening of the FT
frequency spectrum. The other issue, discussed above, is that signal levels for small particles
may be too small to allow time domain measurements. The alternative is to use frequency-domain
approaches, where a narrow-band excitation source is scanned, looking for signal changes when
the excitation is in resonance with the secular frequency.
One approach is to take advantage of the force exerted on the particle by the light
scattering laser, by modulating the laser power to provide a weak, variable frequency excitation
source. An example of this approach is shown in Figure 3.6, again probing the same particle that
was examined in Figures 3.3 - 3.5. This spectrum was taken by square-wave modulating the 532
nm light scattering laser by ~10%, and sweeping the modulation frequency (fDrive) over the
secular frequency of the particle, at a rate of 1.5 Hz/minute. A 10-8 Torr background pressure of
Ar was used to provide a moderate level of motional damping. For a particle in this size range,
the damping time constant is on the order of hundreds seconds. Before the scan, the light
scattering signal was optimized, i.e., the laser focus and light detection volume were overlapped
28
with the equilibrium particle position. Therefore, when the modulation frequency was resonant
with the secular frequency (fr for this excitation geometry), the motion of the particle caused a
drop in light scattering signal. Because the driven motion is along the axis of the laser beam, the
main loss of signal results from the particle moving out of the volume visible to the APD detector
(> ±25 ^m motion). The oscillations observed as fDrive is scanned through the secular frequency
resonance are the result of beating of the secular motion with fDrive.
To extract the secular frequency from the signal, we fit the spectrum with a Gaussian-
convoluted step function, obtaining a convoluted with a step function. The transition frequency
(i.e., fr) obtained from the sweep was 626.733 Hz with a fwhm of 0.04 Hz, corresponding to
width of 60 ppm. The M/Q value extracted from fr is 1.604 MDa/e, given the operating
parameters if F = 15 kHz and V0 = 77 V.
Note that fr measured by this method is ~0.4% lower than that measured by the I(t)/FT
method, continuing the small decrease (~0.15 % fz ) observed between the I(t)/FT and beat
frequency measurements. The I(t)/FT, beat frequency, and laser modulation experiments were
made on the same particle, but over a ~ 24 hour period. While we cannot exclude some drift in
the trapping potential (V0), such changes are not unexpected because trapped particles undergo
collisions with both charged and neutral species in the chamber background, which can change
both M and Q (see below).
AC Voltage Sweeps
For our configuration, the highest precision measurements are obtained by measuring fz
using a weak AC potential to drive axial oscillation of the particle. As noted above, this small
voltage is applied to the second electrode (“Lens”, Figure 3.1) outside the trap, because the
minimum AC amplitude (10 mV) from our function generator is too large for optimal precision if
applied directly to a trap electrode. When the AC potential is resonant with the secular frequency
(fz for axisymmetric excitation) the particle oscillation amplitude increases, so that it spends less
29
time in detection volume, resulting in a decrease in the scattered light signal similar to that for the
laser frequency sweep. At high pressures of Argon (10-3 Torr), scans over the secular frequency
cause excitation that is quickly damped by collisions after the resonance is passed. For a single
particle, the result is a dip in light scattering intensity on resonance, with width that depends on
both pressure and AC drive amplitude. Such conditions are useful in experiments (e.g.,
monitoring particle M/Q changes at high temperatures)13 where repeated fast M/Q
determinations are required.
For low pressures (10-8 Torr), the fz resonance is sharp but the signal takes hundreds of
seconds to be restored by collisions with background gas. As a result, the “spectrum” takes the
appearance of a step function, as shown in Figure 3.7. Note that this and other measurements
discussed below were done on a different particle than that probed in Figures 3.3 - 3.6. The
particle was trapped using F = 145 kHz and V0 = 500 V. A signal of 125 mV amplitude was
swept from 2336.5 to 2337 Hz over 90 seconds (~5.5 mHz/second), while the scattered light
signal was collected in 250 millisecond wide bins (~0.1mHz/bin). Between 2336.5 - 2336.6 Hz
signal oscillations were observed (similar to Figure 3.6) due to beating of the drive and secular
frequencies. The large drop in intensity when the frequency was scanned through fz was fit to a
Gaussian-convoluted step function, giving a center frequency of 2336.8342 Hz, and a full-width
at half max of 0.0343 Hz, corresponding to 14.7 ppm. Taking the trapping parameters into
account, the corresponding M/Q is 582062.44 ± 8.7 Da/e. Note: operation at higher F tends to
result in trapping of particles with lower M/Q - here about three times lower than the particle
probed in Figures 3.3 - 3.6. If we assume that the center frequency can be determined to ~10%
of the width, the “single measurement precision” would correspond to ~1.5 ppm. The entire
procedure consistent of trapping a swarm of particles, selectively ejecting all but one, using a fast
AC sweep at high pressure determine fz approximately, and finally measuring fz in with high
precision, took about 10 minutes.
30
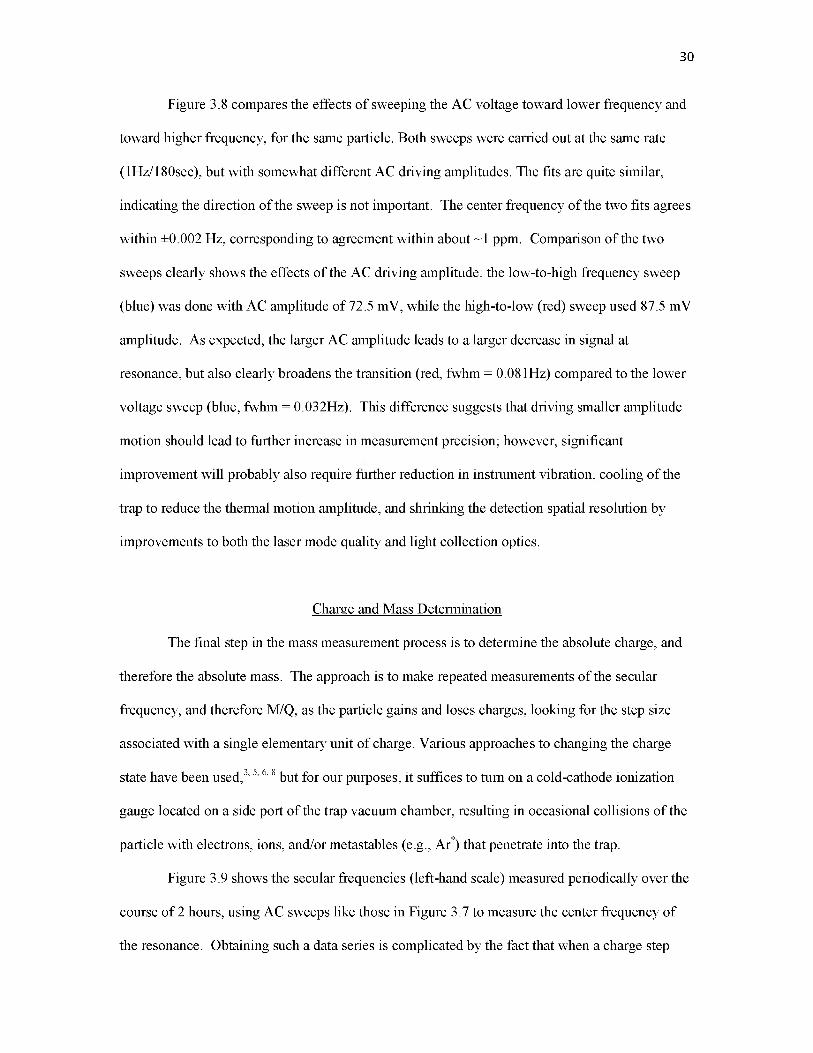
Figure 3.8 compares the effects of sweeping the AC voltage toward lower frequency and
toward higher frequency, for the same particle. Both sweeps were carried out at the same rate
(1Hz/180sec), but with somewhat different AC driving amplitudes. The fits are quite similar,
indicating the direction of the sweep is not important. The center frequency of the two fits agrees
within ±0.002 Hz, corresponding to agreement within about ~1 ppm. Comparison of the two
sweeps clearly shows the effects of the AC driving amplitude: the low-to-high frequency sweep
(blue) was done with AC amplitude of 72.5 mV, while the high-to-low (red) sweep used 87.5 mV
amplitude. As expected, the larger AC amplitude leads to a larger decrease in signal at
resonance, but also clearly broadens the transition (red, fwhm = 0.081Hz) compared to the lower
voltage sweep (blue, fwhm = 0.032Hz). This difference suggests that driving smaller amplitude
motion should lead to further increase in measurement precision; however, significant
improvement will probably also require further reduction in instrument vibration, cooling of the
trap to reduce the thermal motion amplitude, and shrinking the detection spatial resolution by
improvements to both the laser mode quality and light collection optics.
Charge and Mass Determination
The final step in the mass measurement process is to determine the absolute charge, and
therefore the absolute mass. The approach is to make repeated measurements of the secular
frequency, and therefore M/Q, as the particle gains and loses charges, looking for the step size
associated with a single elementary unit of charge. Various approaches to changing the charge
state have been used,3, 5, 6, 8 but for our purposes, it suffices to turn on a cold-cathode ionization
gauge located on a side port of the trap vacuum chamber, resulting in occasional collisions of the
particle with electrons, ions, and/or metastables (e.g., Ar*) that penetrate into the trap.
Figure 3.9 shows the secular frequencies (left-hand scale) measured periodically over the
course of 2 hours, using AC sweeps like those in Figure 3.7 to measure the center frequency of
the resonance. Obtaining such a data series is complicated by the fact that when a charge step
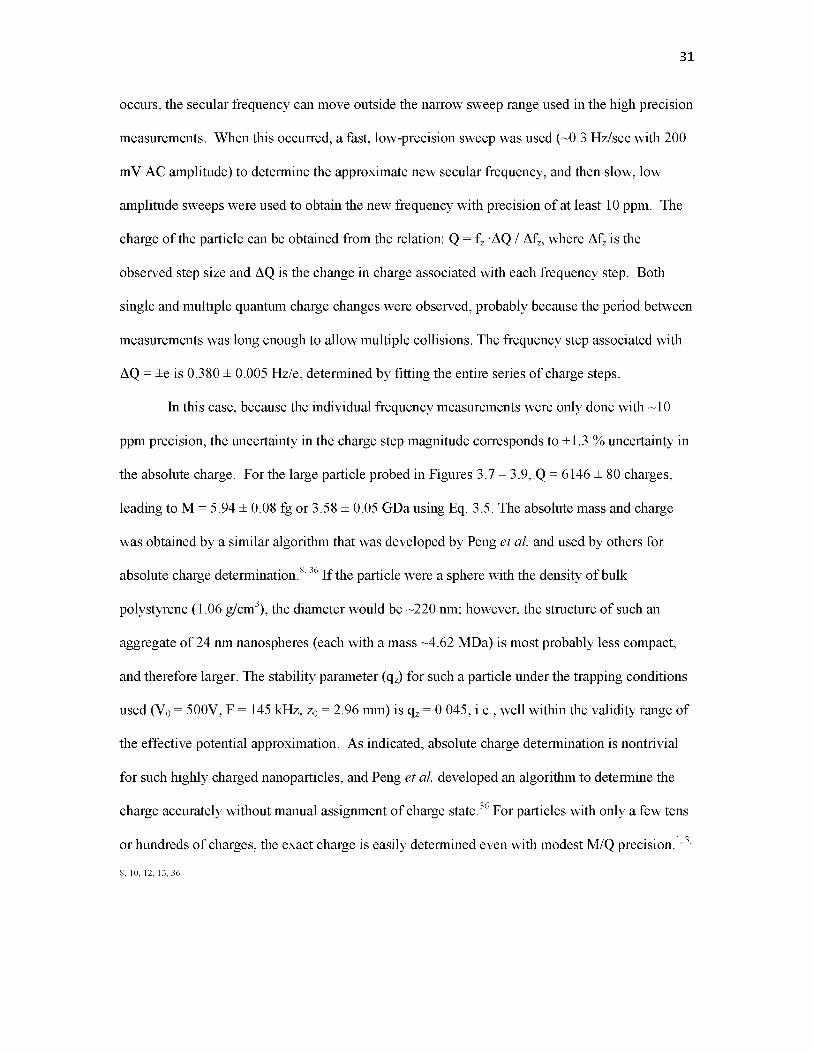
31
occurs, the secular frequency can move outside the narrow sweep range used in the high precision
measurements. When this occurred, a fast, low-precision sweep was used (~0.3 Hz/sec with 200
mV AC amplitude) to determine the approximate new secular frequency, and then slow, low
amplitude sweeps were used to obtain the new frequency with precision of at least 10 ppm. The
charge of the particle can be obtained from the relation: Q = fz •AQ / Afz, where Afz is the
observed step size and AQ is the change in charge associated with each frequency step. Both
single and multiple quantum charge changes were observed, probably because the period between
measurements was long enough to allow multiple collisions. The frequency step associated with
AQ = ±e is 0.380 ± 0.005 Hz/e, determined by fitting the entire series of charge steps.
In this case, because the individual frequency measurements were only done with ~10
ppm precision, the uncertainty in the charge step magnitude corresponds to ±1.3 % uncertainty in
the absolute charge. For the large particle probed in Figures 3.7 - 3.9, Q = 6146 ± 80 charges,
leading to M = 5.94 ± 0.08 fg or 3.58 ± 0.05 GDa using Eq. 3.5. The absolute mass and charge
was obtained by a similar algorithm that was developed by Peng et al. and used by others for
absolute charge determination.8, 36 If the particle were a sphere with the density of bulk
polystyrene (1.06 g/cm3), the diameter would be ~220 nm; however, the structure of such an
aggregate of 24 nm nanospheres (each with a mass ~4.62 MDa) is most probably less compact,
and therefore larger. The stability parameter (qz) for such a particle under the trapping conditions
used (V0 = 500V, F = 145 kHz, z0 = 2.96 mm) is qz = 0.045, i.e., well within the validity range of
the effective potential approximation. As indicated, absolute charge determination is nontrivial
for such highly charged nanoparticles, and Peng et al. developed an algorithm to determine the
charge accurately without manual assignment of charge state.36 For particles with only a few tens
or hundreds of charges, the exact charge is easily determined even with modest M/Q precision.1, 3
8, 10, 12, 13, 36

32
Approaches for Absolute Mass Calibration
These experiments have focused on demonstrating optical techniques for particle
detection and high precision mass-to-charge determination. We have, therefore, not attempted to
calibrate the absolute M/Q scale, which could be in error by up to 0.5%, due to systematic
uncertainties in the z0 geometric parameter and V0 trapping amplitude. For many applications, it
will be important to determine the absolute mass, thus it is useful to discuss possible calibration
schemes and their limitations.
The V0 and z0 parameters could, in principle, be measured by using mass-selective
ejection to record spectra for some molecular ion; however, such ions, in the process of being
ejected, make much larger radial and axial excursions, and therefore respond very differently to
nonidealities in the trap construction, compared to particles detected on the basis of small
amplitude oscillations.
A more promising approach to absolute mass calibration is suggested by analogy to the
method used for charge determination. There, Q is changed by known amounts (i.e., ±n • e)
resulting in quantized steps in the secular frequency, Af, which can be analyzed to determine Q.
By analogy, the absolute mass can be determined by observing steps in f when the particle mass
is changed by a known amount. The particle might be exposed to a beam of neutral molecules,
such as C60, measuring Af associated with adsorption on the particle. Alternatively, an ion source
could be used to inject ions with known M/Q and polarity opposite to that of the particle.
Because the particle would serve as a heat sink with many degrees of freedom, intact adsorption
would be expected in either case, leading to a calibrated change in M/Q. An example that
appears particularly attractive would be to use electrospray of dilute H3PO4 to generate sparse
spectra of cluster ions with (H3PO4)n+H+ or (H3PO4)n-H+ stoichiometries, in positive or negative
ion modes, respectively. In our instrument, the linear quadrupole would then be used as a
medium resolution mass filter to select a particular cluster size, for injection into the trap. Unlike

33
carbon-containing calibrant species, M/Q would be well defined because a single natural isotope
dominates for H, P, and O.
Conclusion
We have compared several different time and frequency domain approaches to
determining M/Q for single trapped nanoparticles. Precision approaching 10 ppm in single
measurements is enabled by vibrationally isolating the trap from its surroundings. Using
frequency sweep methods, transitions as narrow as ~15 ppm are obtained, with center frequency
repeatability approaching 1 ppm. The precision and speed of the methods described here should
enable measurements, for example, of surface adsorption/desorption/reaction kinetics with
sensitivity well below one monolayer.
Acknowledgements
We would like to thank Stephan Schlemmer for helpful discussions. The work was
supported by the Chemistry Division of the U.S. National Science Foundation, under grant CHE-
1111935.
References
1. S. Schlemmer, J. Illemann, S. Wellert and D. Gerlich, AIP Conf. Proc. 457, 80 (1999).
2. S. Schlemmer, J. Illemann, S. Wellert and D. Gerlich, in The Physics and Chemistry o f the Interstellar Medium, Proceedings o f the 3rd Cologne-Zermatt Symposium, edited by V. Ossenkopf, J. Stutzki and G. Winnewisser (GCA-Verlag Herdecke, Aachen, 1999), pp. 391-394.
3. S. Schlemmer, J. Illemann, S. Wellert and D. Gerlich, Journal of Applied Physics 90, 5410 (2001).
4. T. Henning, H. Mutschke, S. Schlemmer and D. Gerlich, NASA Conf. Publ. 2002211863, 175 (2002).
34
5. M. Grimm, B. Langer, S. Schlemmer, T. Lischke, W. Widdra, D. Gerlich, U. Becker and E. Ruehl, AIP Conf. Proc. 705, 1062 (2004).
6. S. Schlemmer, S. Wellert, F. Windisch, M. Grimm, S. Barth and D. Gerlich, Appl. Phys. A: Mater. Sci. Process. 78, 629 (2004).
7. M. Grimm, B. Langer, S. Schlemmer, T. Lischke, U. Becker, W. Widdra, D. Gerlich, R. Flesch and E. Ruehl, Phys. Rev. Lett. 96, 066801 (2006).
8. A. J. Trevitt, P. J. Wearne and E. J. Bieske, International Journal of Mass Spectrometry 262, 241 (2007).
9. W.-P. Peng, Y.-C. Yang, M.-W. Kang, Y. T. Lee and H.-C. Chang, J. Am. Chem. Soc. 126, 11766 (2004).
10. Y. Cai, W. P. Peng, S. J. Kuo, Y. T. Lee and H. C. Chang, Anal. Chem. 74, 232 (2002).
11. Y. Cai, W. P. Peng, S. J. Kuo, S. Sabu, C. C. Han and H. C. Chang, Anal. Chem. 74,4434 (2002).
12. C. R. Howder, D. M. Bell and S. L. Anderson, Rev. Sci. Instrum. 85, 014104 (2014).
13. D. M. Bell, C. R. Howder, R. C. Johnson and S. L. Anderson, ACS Nano in press (2014).
14. A. J. Trevitt, P. J. Wearne, E. J. Bieske and M. D. Schuder, Opt. Lett. 31, 2211 (2006).
15. T. A. Smith, A. J. Trevitt, P. J. Wearne, E. J. Bieske, L. J. McKimmie and D. K. Bird, Springer Ser. Fluoresc. 4, 415 (2008).
16. A. J. Trevitt, P. J. Wearne and E. J. Bieske, J. Aerosol Sci. 40, 431 (2009).
17. C. Graf, B. Langer, M. Grimm, R. Lewinski, M. Grom and E. Ruehl, J. Electron Spectrosc. Relat. Phenom. 166-167, 74 (2008).
18. IUPAC. Compendium o f Chemical Terminology, 2nd ed. (the "Gold Book”), compiled by A. D. McNaught and A. Wilkinson, 2nd ed. (Blackwell Scientific Publications, Oxford, 1997).
19. G. Hars and Z. Tass, J. Appl. Phys. 77, 4245 (1995).
20. R. F. Wuerker, H. H. Shelton and R. V. Langmuir, Journal of Applied Physics 30, 342 (1959).
21. D. Gerlich and S. Decker, Applied Physics B: Lasers and Optics 114, 257 (2014).
22. D. Gerlich, Hyperfine Interact. 146/147, 293 (2003).
35
23. D. Gerlich, in Advances in Chemical Physics: State-Selected and State-To-State Ion- Molecule Reaction Dynamics, Part 1, edited by C. Y. Ng and M. Baer (J. Wiley & Sons, 1992), Vol. 82, pp. 1-176.
24. L. D. Landau and E. M. Lifshitz, Mechanics. (Pergamon Pr., Oxford, 1960).
25. R. M. Jones and S. L. Anderson, Review of Scientific Instruments 71, 4335 (2000).
26. W.-P. Peng, Y. T. Lee, J. W. Ting and H.-C. Chang, Rev. Sci. Instrum. 76, 023108 (2005).
27. G. K. Shoemaker, E. van Duijn, S. E. Crawford, C. Uetrecht, M. Baclayon, W. H. Roos,G. J. L. Wuite, M. K. Estes, B. V. V. Prasad and A. J. R. Heck, Molecular and Cellular Proteomics 9, 1742 (2010).
28. S. Decker, TU Chemnitz, 2009.
29. C. F. Bohren and D. R. Huffman, Absorption and Scattering o f Light by Small Particles. (Wiley, New York, 1983).
30. W. P. Peng, Y. Cai, Y. T. Lee and H. C. Chang, Int. J. Mass Spectrom. 229, 67 (2003).
31. B. Szymanski, R. Dubessy, B. Dubost, S. Guibal, J. P. Likforman and L. Guidoni, Applied Physics Letters 100, 171110 (2012).
32. M. Drewsen, I. Jensen, J. Lindballe, N. Nissen, R. Martinussen, A. Mortensen, P. Staanum and D. Voigt, Int. J. Mass Spectrom. 229, 83 (2003).
33. M. Drewsen, A. Mortensen, R. Martinussen, P. Staanum and S. J. L., Physical Review Letters 93, 243201 (2004).
34. S. Ichimaru, Review of Modern Physics 54, 1017 (1982).
35. J. H. Chu and L. I., Physical Review Letters 72, 4009 (1994).
36. W. P. Peng, Y. C. Yang, C. W. Lin and H. C. Chang, Anal Chem. 77, 7084 (2005).

36
A.y-axis
y'x-axis
6
Figure 3.1: A general schmatic of the ion trap used. (A) End view of the trap looking down the z-
axis, showing the axes for the laser (x) and light collection (y). (B) Cross-sectional view of the
trap along the x-axis.

37
Figure 3.2: Images of charged nanoparticles in our ion trap. (a) An image of the trap when filled.
(b) The contents of the trap after some ions have been swept out of the trap by an AC frequency
sweep from 30 kHz - 3 kHz. (c) The contents of the trap after a sweep of 30 kHz - 2.5 kHz,
leaving 3 particles in the trap. (d) The contents of the trap after a sweep of 30 kHz - 2.35 kHz,
leaving a single particle in the trap.

38
13000 14000 15000 16000 17000
Frequency (Hz)
Figure 3.3: Typical FFT spectrum for a single trapped particle. (Top) Frequency range between 1
- 1400 Hz showing both fr and fz. (Bottom) Frequency range between 13 - 17 kHz containing the
difference frequencies with respect to F.
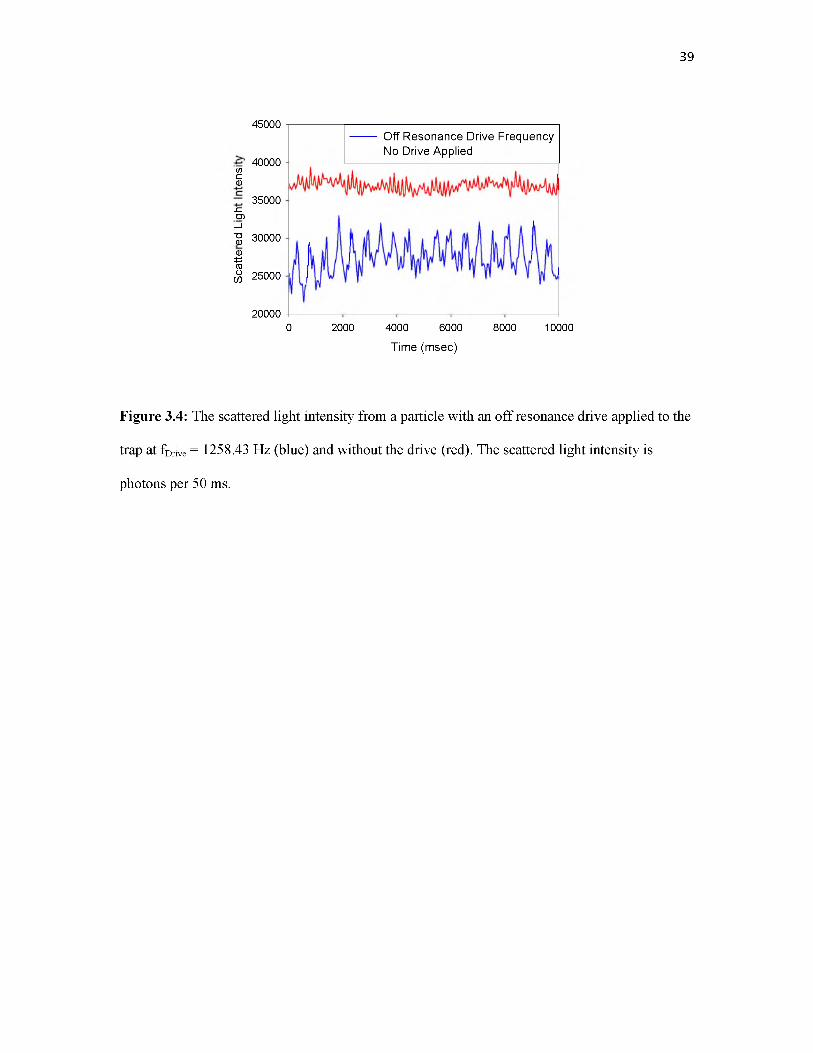
39
45000
40000</) c 035000
. c c?_J
^ 30000 0 &TO£ 25000
200000 2000 4000 6000 8000 10000
Time (msec)
Off Resonance Drive Frequency No Drive Applied
Figure 3.4: The scattered light intensity from a particle with an off resonance drive applied to the
trap at fDrive = 1258.43 Hz (blue) and without the drive (red). The scattered light intensity is
photons per 50 ms.
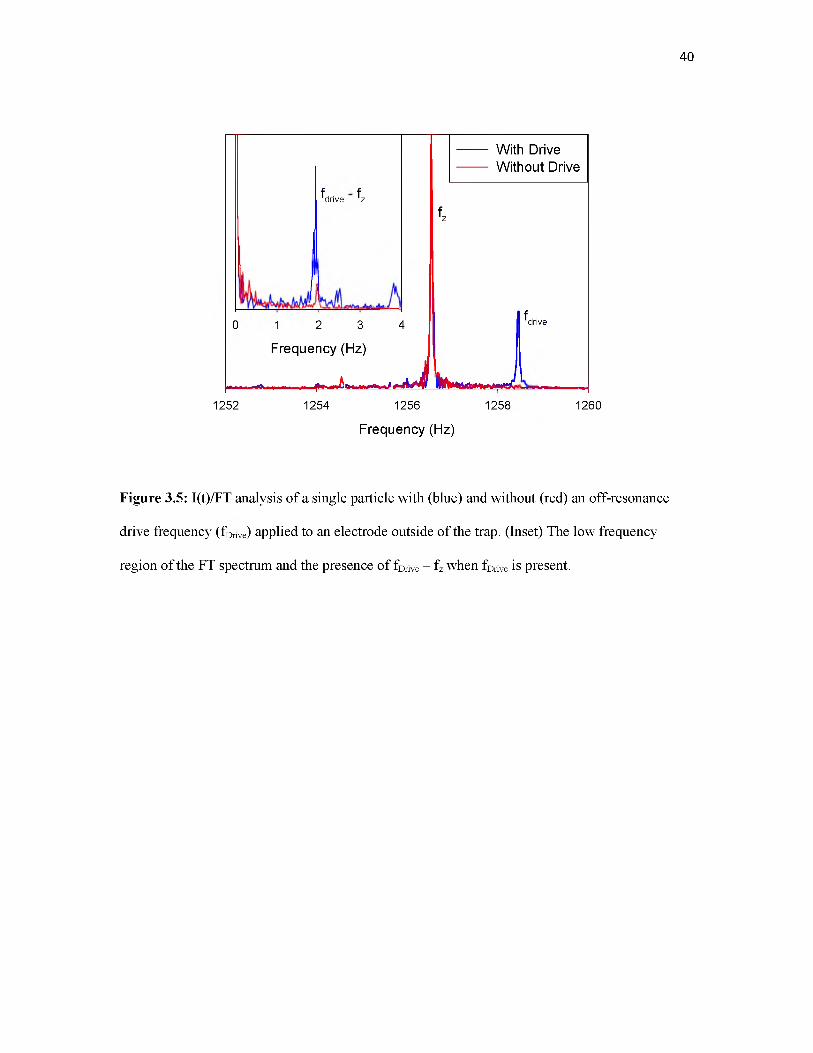
40
fdrive fz
With Drive Without Drive
fz
0 1 2 3 4
Frequency (Hz)
_________________ i _ J J
f drive
1252 1254 1256 1258 1260
Frequency (Hz)
Figure 3.5: I(t)/FT analysis of a single particle with (blue) and without (red) an off-resonance
drive frequency (fDrive) applied to an electrode outside of the trap. (Inset) The low frequency
region of the FT spectrum and the presence of fDrive - fz when fDrive is present.
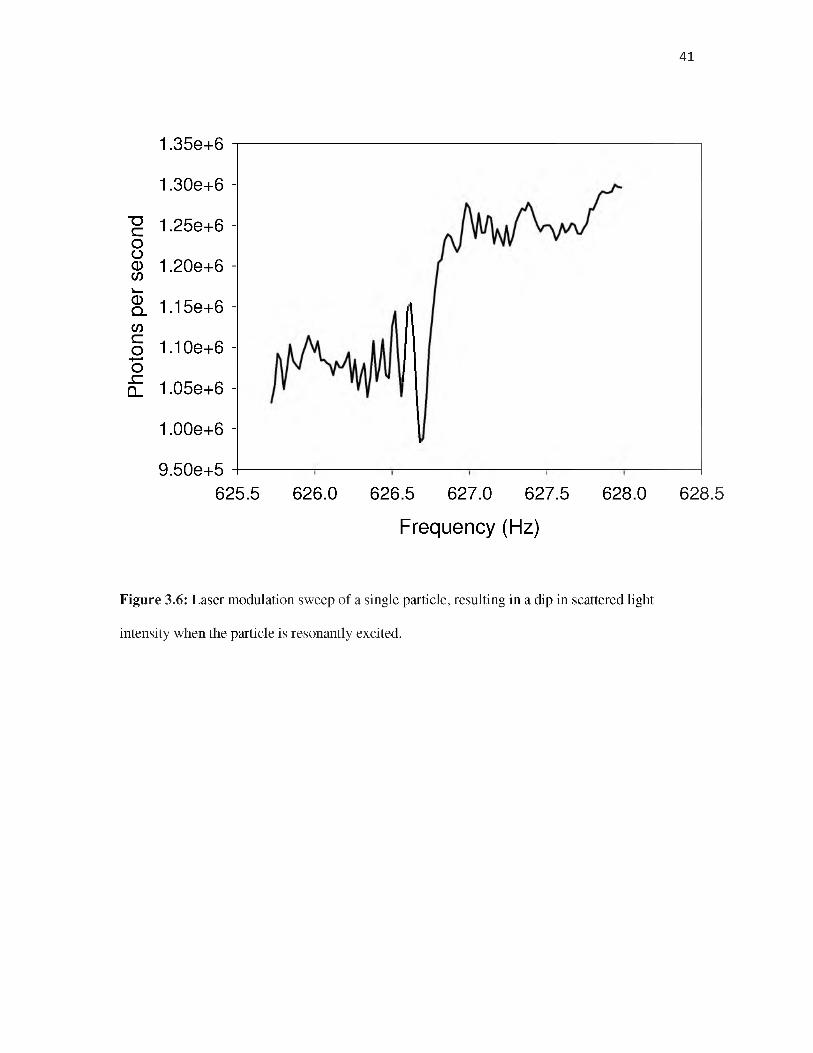
Phot
ons
per
seco
nd
41
1,35e+6 i
1,30e+6 -
1,25e+6 -
1,20e+6 -
1.15e+6 -
1.10e+6 -
1,05e+6 -
1.00e+6 -
9.50e+5 -625.5 626.0 626.5 627.0 627.5 628.0
Frequency (Hz)
Figure 3.6: Laser modulation sweep of a single particle, resulting in a dip in scattered light
intensity when the particle is resonantly excited.
628.5

42
Figure 3.7: The scattered light intensity per 250ms during an AC frequency sweep of a single
particle at 10-8 Torr. The drop corresponds to resonant excitation of the axial secular frequency of
the particle. The raw data are fit with a step function convoluted with a Gaussian with parameters
listed on the figure in red.

43
Figure 3.8: The scattered light intensity per second during an AC frequency sweep from low to
high frequency ( ) and high to low frequency ( -e—). The blue plot was carried out the AC
peak-to-peak voltage of 125mV and the red plot with AC peak-to-peak voltage of 175mV. These
plots are fit with a step function convoluted with a Gaussian to obtain the fit parameters listed in
the figure.

44
NI>Oc0)3CT0)
SS 2335 -
2338 -
2337
2336 -
2334 -
• • • •------- •
• •
6147
6145
61433be
(Q6139 e
6137
6135
Frequency sweeps over the course of 2 hours
Figure 3.9: Variation in axial secular frequency over time due to the particle gaining and losing
charge. The steps on the plot correspond to individual charge steps (0.380 Hz). From these steps,
the total charge on the particle may be determined.

CHAPTER 4
USING A CO2 LASER TO ACTIVATE FLUORESCENCE FROM
CORE-SHELL CdSe/ ZnS NANOCRYSTAL QUANTUM DOTS
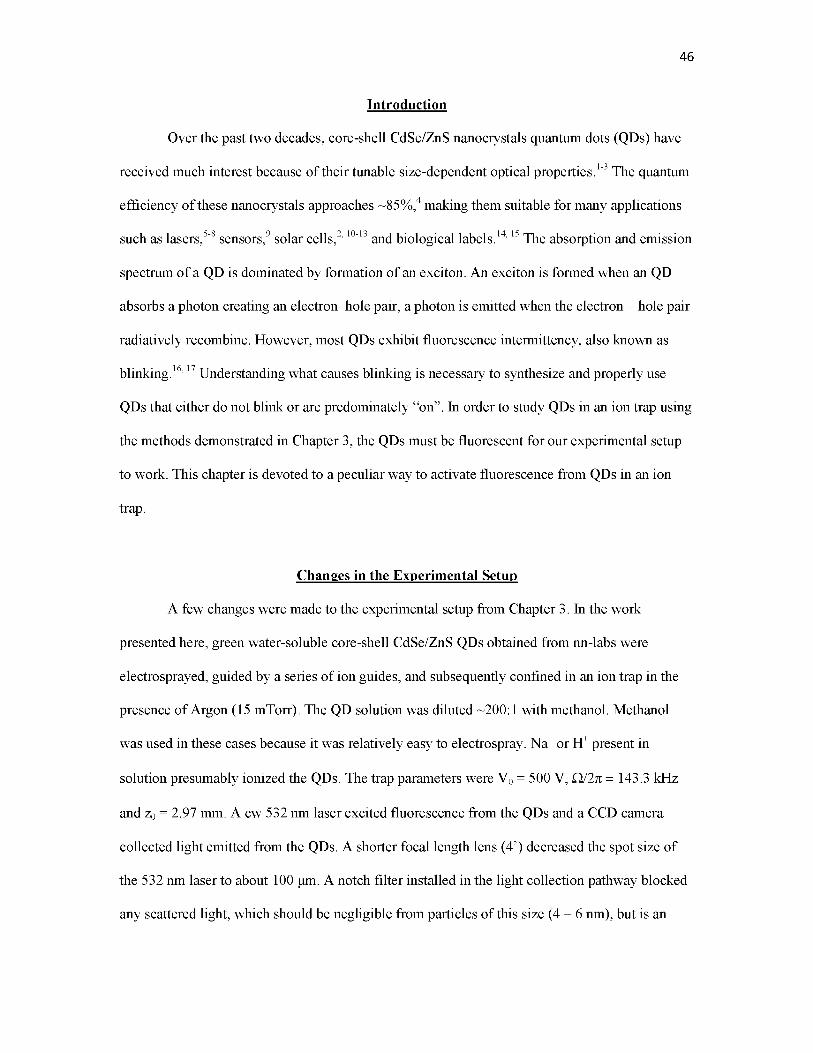
46
Introduction
Over the past two decades, core-shell CdSe/ZnS nanocrystals quantum dots (QDs) have
received much interest because of their tunable size-dependent optical properties.1-3 The quantum
efficiency of these nanocrystals approaches ~85%,4 making them suitable for many applications
such as lasers,5-8 sensors,9 solar cells,2, 10-13 and biological labels.14, 15 The absorption and emission
spectrum of a QD is dominated by formation of an exciton. An exciton is formed when an QD
absorbs a photon creating an electron-hole pair, a photon is emitted when the electron - hole pair
radiatively recombine. However, most QDs exhibit fluorescence intermittency, also known as
blinking.16, 17 Understanding what causes blinking is necessary to synthesize and properly use
QDs that either do not blink or are predominately “on”. In order to study QDs in an ion trap using
the methods demonstrated in Chapter 3, the QDs must be fluorescent for our experimental setup
to work. This chapter is devoted to a peculiar way to activate fluorescence from QDs in an ion
trap.
Changes in the Experimental Setup
A few changes were made to the experimental setup from Chapter 3. In the work
presented here, green water-soluble core-shell CdSe/ZnS QDs obtained from nn-labs were
electrosprayed, guided by a series of ion guides, and subsequently confined in an ion trap in the
presence of Argon (15 mTorr). The QD solution was diluted ~200:1 with methanol. Methanol
was used in these cases because it was relatively easy to electrospray. Na+ or H+ present in
solution presumably ionized the QDs. The trap parameters were V0 = 500 V, Q/2n = 143.3 kHz
and z0 = 2.97 mm. A cw 532 nm laser excited fluorescence from the QDs and a CCD camera
collected light emitted from the QDs. A shorter focal length lens (4’) decreased the spot size of
the 532 nm laser to about 100 ^m. A notch filter installed in the light collection pathway blocked
any scattered light, which should be negligible from particles of this size (4 - 6 nm), but is an
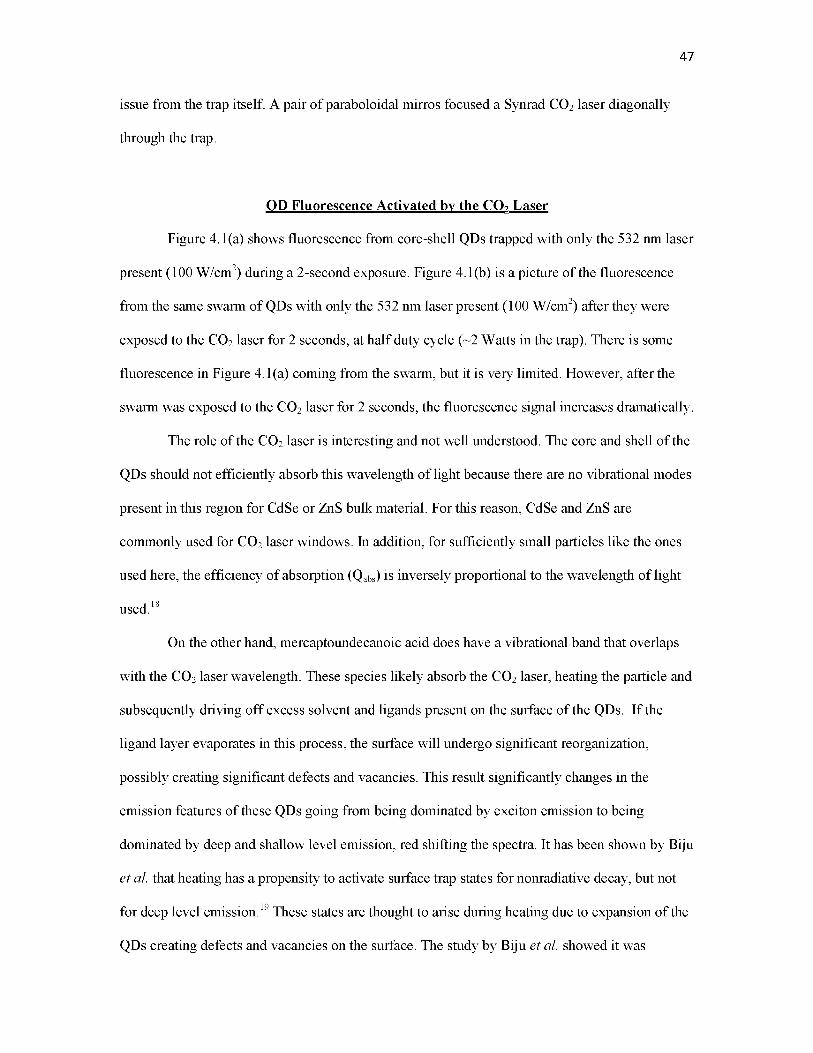
47
issue from the trap itself. A pair of paraboloidal mirros focused a Synrad CO2 laser diagonally
through the trap.
QD Fluorescence Activated by the CO2 Laser
Figure 4.1(a) shows fluorescence from core-shell QDs trapped with only the 532 nm laser
present (100 W/cm2) during a 2-second exposure. Figure 4.1(b) is a picture of the fluorescence
from the same swarm of QDs with only the 532 nm laser present (100 W/cm2) after they were
exposed to the CO2 laser for 2 seconds, at half duty cycle (~2 Watts in the trap). There is some
fluorescence in Figure 4.1(a) coming from the swarm, but it is very limited. However, after the
swarm was exposed to the CO2 laser for 2 seconds, the fluorescence signal increases dramatically.
The role of the CO2 laser is interesting and not well understood. The core and shell of the
QDs should not efficiently absorb this wavelength of light because there are no vibrational modes
present in this region for CdSe or ZnS bulk material. For this reason, CdSe and ZnS are
commonly used for CO2 laser windows. In addition, for sufficiently small particles like the ones
used here, the efficiency of absorption (Qabs) is inversely proportional to the wavelength of light
used.18
On the other hand, mercaptoundecanoic acid does have a vibrational band that overlaps
with the CO2 laser wavelength. These species likely absorb the CO2 laser, heating the particle and
subsequently driving off excess solvent and ligands present on the surface of the QDs. If the
ligand layer evaporates in this process, the surface will undergo significant reorganization,
possibly creating significant defects and vacancies. This result significantly changes in the
emission features of these QDs going from being dominated by exciton emission to being
dominated by deep and shallow level emission, red shifting the spectra. It has been shown by Biju
et al. that heating has a propensity to activate surface trap states for nonradiative decay, but not
for deep level emission.19 These states are thought to arise during heating due to expansion of the
QDs creating defects and vacancies on the surface. The study by Biju et al. showed it was
48
possible to reversibly form and heal these defects by repeated heating and cooling the sample.19 If
the QDs are being heated hot enough to evaporate the ligands attached to the surface, the QD
must be getting very hot and the sudden expansion of the surface could significantly change the
absorption and emission characteristics of the QDs.
Conclusions
The CO2 laser stimulates fluorescence from the QDs, but little is known about the process
by which it takes place. Presumably, the ligand layer absorbs the CO2 laser wavelength and
causes the ligand layer to evaporate in the process. Ligand evaporation then could cause
significant changes to the surface of the QD, changing the emission characteristics of the QD and
where the charges are located. This is an interesting result and it should be possible to determine
the source of this brightening with this experimental setup, but more studies are needed.
References
1. J. Y. Kim, O. Voznyy, D. Zhitomirsky and E. H. Sargent, Advanced Materials 25, 4986 (2013).
2. E. H. Sargent, Nature Photonics 6, 133 (2012).
3. R. Debnath, O. Bakr and E. H. Sargent, Energy and Environmental Science 4, 4870 (2011).
4. M. A. Hines and P. Guyot-Sionnest, J. Phys. Chem. 100, 468 (1996).
5. S. G. Li, Q. Gong, C. F. Cao, J. Y. Yan, Y. Wang and H. L. Wang, Infrared Physics and Technology 60, 216 (2013).
6. A. E. Zhukov, M. V. Maksimov and A. R. Kovsh, Semiconductors 46 (10), 1225 (2012).
7. L. V. Asryan, Journal of Nanophotonics 3, 31601 (2009).
8. J. Schafer, J. P. Mondia, R. Sharma, Z. H. Lu, A. S. Susha, A. L. Rogach and L. J. Wang, Nano Letters 8, 1709 (2008).
9. L. Zhang, R. Zhang, P. Cui, W. Cao and F. Gao, Chemical Communications 49, 8102(2013).
49
10. P. K. Santra and P. V. Kamat, Journal of the American Chemical Society 135, 877(2013).
11. E. Strein, A. Colbert, S. Subramaniyan, H. Nagaoka, C. W. Schlenker, E. Janke, S. A. Jenekhe and D. S. Gingera, Energy and Environmental Science 6, 769 (2013).
12. J. Wu, S. C. Mangham, V. R. Reddy, M. O. Manasreh and B. D. Weaver, Solar Energy Materials &Solar Cells 102, 44 (2012).
13. A. Kongkanand, K. Tvrdy, K. Takechi, M. Kuno and P. V. Kamat, Journal of the American Chemical Society 130, 4007 (2008).
14. Q. Huo, Colloids and Surfaces B: Biointerfaces 59, 1 (2007).
15. A. C. S. Samia, S. Dayal and C. Burda, Photochemistry and Photobiology 82, 617 (2006).
16. C. Galland, T. Ghosh, A. Steinbruck, M. Sykora, J. A. Hollingsworth, V. I. Klimov andH. Htoon, Nature 479, 203 (2011).
17. K. L. Knappenberger, Jr., D. B. Wong, Y. E. Romanyuk and S. R. Leone, Nano Letters 7, 3869 (2007).
18. C. F. Bohren and D. R. Huffman, Absorption and Scattering o f Light by Small Particles. (Wiley-VCH, 19)83).
19. V. Biju, Y. Makita, A. Sonoda, H. Yokoyama, Y. Baba and M. Ishikawa, J. Phys. Chem. B 109, 13899 (2005).
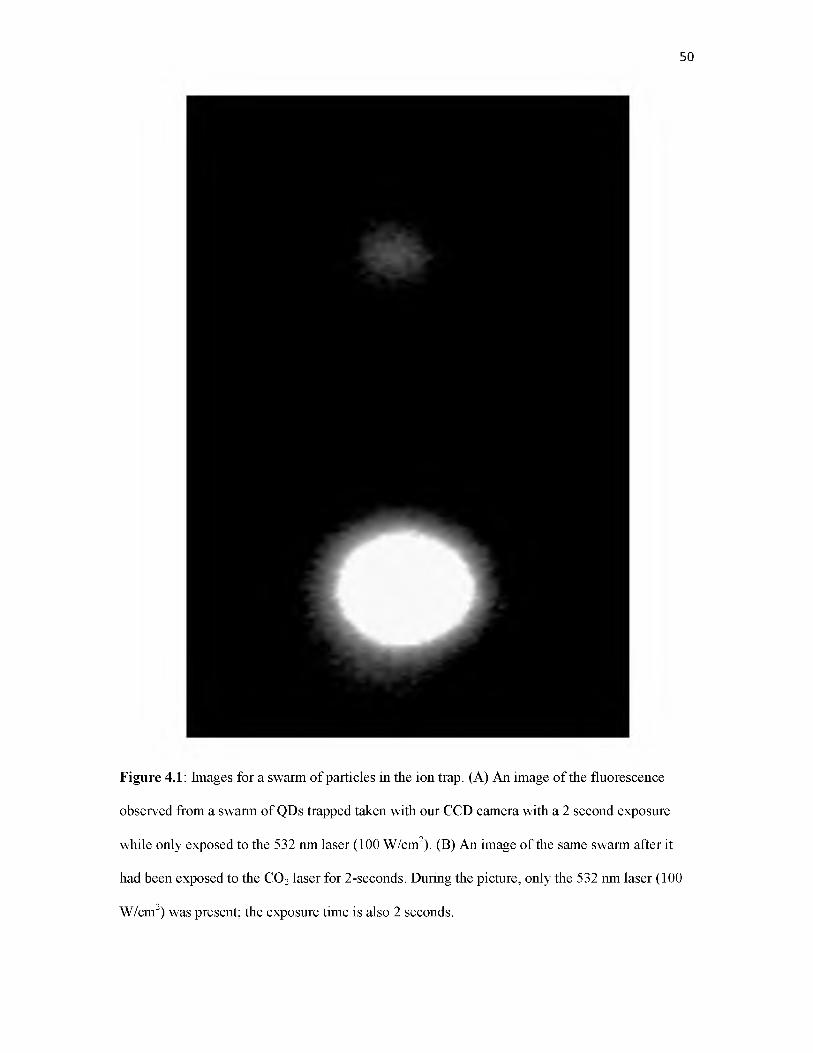
50
Figure 4.1: Images for a swarm of particles in the ion trap. (A) An image of the fluorescence
observed from a swarm of QDs trapped taken with our CCD camera with a 2 second exposure
while only exposed to the 532 nm laser (100 W/cm2). (B) An image of the same swarm after it
had been exposed to the CO2 laser for 2-seconds. During the picture, only the 532 nm laser (100
W/cm2) was present; the exposure time is also 2 seconds.
CHAPTER 5
SINGLE CdSe/ZnS NANOCRYSTALS IN AN ION TRAP: CHARGE AND MASS
DETERMINATION, AND PHOTOPHYSICS EVOLUTION WITH CHANGING
MASS, CHARGE, AND TEMPERATURE
Reprinted with permission from David M. Bell, Collin R. Howder, Ryan C. Johnson, Scott L.
Anderson, and ACS Nano DOI: 10.1021/nn405920k Copyright 2014, American Chemical
Society
52
Overview
We report the first measurements of fluorescence intermittency (blinking) and spectral
behaviors for a single semiconductor nanocrystal quantum dot (QD) isolated in the gas phase, and
discuss the effects on fluorescence of the QD charge state and heating to the point of sublimation.
Core-shell CdSe/ZnS QDs were trapped in a quadrupole ion trap, and detected by laser-induced
fluorescence (LIF). The mass (M) and charge (Q) were determined nondestructively; both were
followed continuously over the course of hours or days. Emission spectra of the trapped QDs are
significantly red-shifted relative to the solution-phase emission from the same particles. The
temperature of the trapped QDs is determined by the balance between laser heating and
collisional cooling and thermal emission, and it is possible to heat the particles to remove ligands
or to the point of sublimation. QDs are observed to be emissive during sublimation, up to 85%
mass loss. Eventually, the fluorescence quantum yield drops suddenly, and the QDs begin to
blink. The method used is versatile, and will allow studies of quantum dot optical properties as a
function of size, ligand removal, heating, surface oxidation, and other manipulations, where these
properties are continuously correlated with the mass and charge.
Introduction
Nanoparticle mass spectrometry (NPMS) allows for repeated, nondestructive
measurements of the mass, M, and charge, Q, of single trapped nanoparticles, making it possible
to study correlations between M, Q, surface chemistry, and optical properties, as particles are
manipulated by heating, exposed to reactants, etc.1-9 As discussed below, the mass and charge are
obtained by observing the particle’s motion in a quadrupole trap, using either light scattering or
fluorescence to track its the motion. In addition to obtaining M and Q, it is possible to measure
optical properties, such as the emission spectrum, temporal behavior such as blinking
(intermittent fluorescence) or bleaching, and to correlate the appearance of these optical effects
with changes in particle mass, charge, or surface chemical state. Here, we report the first
53
measurements of blinking and spectral behaviors for a single charged semiconductor nanocrystal
quantum dot (QD) isolated in the gas phase, and discuss the effects on fluorescence of charge
state, heating, and mass loss by sublimation.
The basis of the NPMS method is to trap a single, charged nanoparticle in a quadrupole
ion trap, using light scattering or laser-induced fluorescence (LIF) to detect and track the motion
of the particle. The motional secular frequency (raz) of a charged particle in such a trap is
inversely proportional to the mass/charge ratio, M/Q.10 By making repeated measurements over
the course of hours or days, it is possible to track the emission properties, and to observe how
they respond to changes in M/Q as the particle is heated, exposed to reactants, or otherwise
manipulated. By allowing occasional collisions with ions, electrons, or metastables created in a
discharge, the charge, Q, can be changed. By measuring the change in secular frequency
accompanying Q changing by one elementary charge (A©z/e), the exact value of Q is
determined.1, 3 5 With Q, we obtain M, limited only by the precision of the ©z measurement,
which can be as high as 1 ppm.1
CdSe nanocrystals, also known as quantum dots (QDs), are too small to efficiently scatter
light, but are efficient emitters (quantum yield 50 - 85%)11, 12 with interesting photophysics,
making them good candidates for NPMS. For NPMS, the QDs must be charged, so one
important issue is the effect of charging on fluorescence intensity. A number of groups have
examined the effects of charging QDs on various electrodes or in solution.13-20 Guyot-Sionnest
and co-workers attached QDs to an electrode and by applying a negative voltage (-1 V) were able
to turn a QD off. This change was reversible by then applying a slight positive (+0.3 V) to turn
the QD back on.16 Galland et al. recently used a similar approach to gather fluorescence
information while simultaneously collecting lifetimes.18 In this study, there were two types of
blinking (different lifetimes and blinking on and off statistics) that could both be controlled
electrochemically: one type due to Auger recombination and another due to interactions between
the Fermi level of the electrode and the trap states present on the QDs. Interestingly, a QD could

exhibit both types of blinking mechanisms at different times, meaning this is not due to the
chemical makeup of an individual QD, but rather is inherent to QDs.18
QDs have been studied extensively in solution21-23 or on a surface,16, 24-26 but little is
known about their optical properties when they are charged and detached from a surface.27 In
summary, it is not obvious what might be expected for fluorescence of QDs in the gas phase with
up to 20 charges, in the form of Na+ adsorbed on the surface. In this paper, we present the first
observation of fluorescence from single, trapped QDs in the gas phase, and demonstrate
determination of the absolute mass and charge for both individual QDs and QD aggregates, the
first such measurements for particles smaller than ~20 nm. In addition, we examine emission
intensities and spectral properties over time as the QDs are heated and undergo charge changes.
Methods
Ion Trap and Optical Detection
To investigate charged QDs, we used a split ring electrode trap (SRET) based on the
design by Gerlich and co-workers,28 and is shown in Figure 5.1. The SRET is a type of Paul trap,
with the center ring electrode split to allow optical access through the trap. In addition, the end
cap electrodes are truncated cones with holes to allow a particle beam to pass through along the
trap axis. We added a pair of diagonal channels that allow lasers to be focused through the trap
center, and for the work presented here, one pair was used, together with a pair of confocal off-
axis paraboloidal mirrors, to focus a CO2 laser (Synrad, 10 W, duty cycle modulated) through the
trap for particle heating. Near the electrodes, the fields are far from the fields in an ideal
hyperbolic Paul trap; however, for sufficiently small excursions from the trap center, the non
idealities are small. Under appropriate operating conditions,2, 10, 29 the motion in such a trap is
harmonic, with well-defined frequencies associated with radial and axial motion, ©r and ©z,
respectively. Either of the frequencies can be used to calculate the M/Q ratio for the trapped
particle, but in our geometry, ©z is more easily and precisely measured, and in this case:
54
55
M _ V 2 V q
Q "z^Zo ,
where V0 and Q are the amplitude and frequency of the radio-frequency voltage applied to the
trap (V0 = 500V, Q/2% = 143.3 kHz), and z0 (2.96mm) is a parameter describing the field
geometry.
Particles were detected by focusing a cw 532 nm laser (Ultra Lasers) through the trap
(into the page on Figure 5.1) with a beam waist diameter of ~100 ^m, to excite fluorescence of
the trapped QD. The effects of varying the laser intensity between roughly 100 W/cm2 and 220
W/cm2 are also examined. The laser spot size is an improvement on previous studies, which was
accomplished by moving the focus closer to the trap. Fluorescence emitted from the QDs in the
trap was collimated by an aspheric lens with a 25 mm focal length, passed through a 532 nm
notch filter to block scattered light, and focused onto an avalanche photodiode module (Laser
Components: Count™). To obtain emission spectral information, long-pass filters with cut-off
wavelengths of 590 nm, 645 nm, 695 nm, 780 nm, and 850 nm (Thorlabs) were installed in line
with the APD.
We operated a CO2 laser at a 50% duty cycle (5 W average power) during particle
injection because we find that this leads to substantial increase in fluorescence quantum yield,
making the particles much easier to detect. The mechanism of this “brightening” process is not
completely understood; however, the mercaptoundecenoic acid ligand layer has an absorption
band at 10.6 ^m, and therefore should be heated by the CO2 laser, while neither CdSe and ZnS
absorb strongly at 10.6 ^m (absorption coefficient 0.016 cm-1,30 and 0.2 cm-1, respectively).
Therefore, it appears that the brightening process involves heating the ligand layer, possibly
driving additional loss o f solvent molecules or some ligand desorption. Additional studies o f this
phenomenon are planned.

56
Method
The instrument, described in Chapter 3, consists of an electrospray source used to get
nanoparticles into the gas phase, a hexapole guide for differential pumping and desolvation, a
quadrupole ion guide used to prefilter the M/Q distribution fed to the trap, and finally the trap.
Water-soluble core-shell CdSe/ZnS (with mercaptoundecanoic acid as a ligand) QDs
were obtained from nn-labs. The QDs used in these studies have a solution-phase emission
maximum near 550nm, although it is not obvious what to expect for charged QDs in the gas
phase. The QD stock solution was diluted in methanol (1:100) and electrosprayed in a Micromass
(now Waters) z-spray source with a capillary voltage of 3.5kV and a cone voltage of 210V.
Positive ions formed by the electrospray source were guided through the hexapole ion guide at a
pressure of ~20mTorr to collisionally cool and focus the particle beam. We presume that the
presence of positive ions in the solution (mostly Na+) was responsible for charging the QDs. The
QDs passed from the hexapole, through a pneumatically operated isolation valve, and into a linear
quadrupole guide, which has similar trapping properties to those of the SRET, and therefore
functions as a prefilter to reject ions and particles outside the M/Q range of interest. From the
linear quadrupole guide, the QDs are injected into the trap, using 15 mTorr of argon buffer gas to
aid trapping, and damp the initial kinetic energy of the trapped QD. With the isolation valve
closed, the base pressure in the trap chamber is ~2 x 10⁻⁸ Torr. While trapping, both the 532nm
laser (100 W/cm2) and the CO2 laser (1000 W/cm2) was focused through the trap to enable
immediate detection of the trapped QD. To inject a QD, the isolation valve was repeated pulsed
open (open time ~ 1 second), while monitoring LIF signal, looking for the signature of a trapped
QD (~300 - 500 counts per second). TTL pulses from the APD were counted by a ComTec
multichannel scalar (P7882). As soon as signal was observed, the CO2 laser was turned off, and
the pressure was dropped to between 0.1 - 1 mTorr, and a scan of ©z was made to verify that only
a single particle was trapped (80% of the time). In the event that more than one secular frequency
resonance was observed, the trap was simply dumped and the fill process was restarted.
57
Safety
Since cadmium is toxic, precautions were taken to avoid contact with the particles. The
electrospray source is contained within a glass cylinder to ensure that CdSe/ZnS particles do not
spray into the atmosphere. The glass cylinder and other electrospray components were
periodically cleaned in methanol. Whenever handling particles or contaminated parts, it is
important to wear necessary attire (gloves, eye protection). Syringes and used solvent are
hazardous waste and must be disposed of appropriately.
Measuring the Secular Frequency
The approach we have found best for secular frequency measurement is to apply a
sinusoidal “drive” signal to one of the lens electrodes just outside the trap, creating a sinusoidal
field that penetrates to the trap center. The field is too weak to have significant effect on the
trapped QD motion, except when the drive frequency is resonant with the QD axial secular
frequency, raz. On resonance, the amplitude of the ©z oscillations becomes large enough to
reduce the fraction of time that the QD spends in the detection volume, resulting in a drop in LIF
signal. The detection volume is determined by the overlap of the LIF laser focus and APD
imaging lens focus, and has characteristic dimensions of roughly 50 - 100 ^m. It is possible to
obtain ppm mass precision in slow scans with low drive amplitudes and low pressure,1 but here
the goal was to follow changes in QD properties over time; therefore, the sweeps were fast (>1
kHz/sec) and a high (2 V) drive amplitude was used to ensure measurable response during the
short time on resonance. To measure the fast sweeps, short dwell times were also needed,
resulting in poor signal/noise. Figure 5.2 shows an example of a single sweep (data points) as
well as the average of five sweeps scanned both to higher (20 kHz to 60 kHz) and to lower (60
kHz to 20 kHz) frequency. Note that the sweeps to higher and lower frequencies both show a
sharp resonance at 32.67 kHz, and even in the single scan, the signal dip is well outside the
scatter in the data points. The raz resonance appears as a peak in these data because the

experiments were done with the trap filled to 1 mTorr with argon (Ptrap = 1 mTorr). As a result,
the driven motion excited at resonance is quickly damped by Ar collisions, resulting in quick
signal recovering. This damping also, in principle, broadens the resonance, degrading precision;
however, in this case, the factor limiting precision is the scan rate. By performing repeated
frequency sweeps, the secular frequency (i.e., M/Q) for a single QD can be tracked for many
hours. To extract the ©z values for each sweep, the negative peak, as seen in Figure 5.2, is fit
with a Gaussian, the center of which is reported as ©z.
Note that the scatter in the single scan data points is substantially greater than would be
expected for statistical noise. The scatter partly reflects oscillations (at ©r and ©z) due to thermal
(Brownian) motion of the QD. Decker has discussed the expected amplitude of thermal motion,
which scales like , and for QDs with T=300 K, the root mean square excursions are on
the order of 30 ^m and 60 ^m, respectively, in the axial and radial directions.31 These are
comparable to the dimensions of our detection volume, thus thermal motion leads real
fluctuations in LIF intensity.
The fact that a single peak is observed in the frequency spectrum indicates that there is
only one particle in the trap. The charge on these small QDs is low enough that coupling between
the particles is weak compared to thermal energy, i.e., each particle behaves quasi-independently
with its own ©z resonance. In principle, it is possible that a single peak could result from two or
more particles which coincidently happen to have nearly identical ©z’s; however, this unlikely
situation would be revealed as soon as one of the particles changed charge.
Results
Tracking M/Q and Determination of Q and M
Figure 5.3 shows an example time record for a single QD observed for 12.5 hours at low
enough LIF laser intensity (100 W/cm2) to minimize mass or other changes due to heating. The
58

secular frequency (®z) shows discrete steps corresponding to events where QD charge changed by
one elementary charge (AQ = ±e). Charge changes occur due to occasional (~1/hour) collisions
of the QD with electrons, ions, or metastables in the chamber background, and because we need
such events to determine Q and M,5 a cold cathode gauge is left on to create electrons, Ar+ and
Ar* from the 1 mTorr argon buffer gas. In this case, A©z/e = 2682 ± 44 Hz, as determined by
fitting the 16 steps observed. From ©z/A©z, we can determine Q at each step (values indicated on
the figure), and once we know Q, we can convert M/Q to M, which is also plotted on the figure.
In this case, the mass record is deliberately boring - just a gradual loss (0.5% per hour) of mass,
presumably from the ligand layer, due to mild heating from the LIF laser.
The diameter of these (nn-labs) QDs is reported to be 6 ± 0.6 nm, which corresponds to
roughly a factor of two variation in mass, with estimated masses ranging from ~480 kDa to ~1.1
MDa, not including the ligand layer. (The masses are estimated assuming a nominal ZnS shell
thickness of 1 nm, and using bulk densities for CdSe and ZnS. For the nominal 6 nm QD, the
core and shell masses are nearly equal). For core-shell CdSe/ZnS, it has been shown between 800
- 1,000 dithiocarbamate ligands are present.32 If we presume the same coverage (~18
A2/molecule) on a 6nm QD, there should be ~630 ligands present with a mass of ~137 kDa, for
the nascent QD. However, we believe that there is significant ligand desorption/decomposition
during the CO2 brightening process. In this example, the mass is near the low end of the expected
mass range, and therefore, we can safely conclude that the particle was a single QD, presumably
having lost most of the ligand mass.
Figure 5.3 also shows the LIF intensity as a function of time, and it can be seen that there
are steps in LIF intensity that track the charge steps in ©z. These do not represent real changes in
the fluorescence quantum yield with charge. Instead, they result from the effects of charge on
photon collection efficiency. Recall that the root mean square amplitude of thermal motion of the
QD scales like , and that the amplitudes are comparable to the detection volume defined
59

60
by the laser and APD foci. Therefore, when Q increases (decreases) by e, the rms thermal
amplitude decreases (increases) by 8 to 10%, resulting in a small increase (decrease) in collection
efficiency. The detection volume can be increased to avoid this effect, but decreases the
sensitivity for measuring ©z, requiring higher drive amplitudes. In the following figures, small
fluctuations in LIF, correlated with charge steps, should be ignored.
Effects of Heating and Particle Sublimation
Figure 5.4 shows the first ~83 hours of the time record for a single particle tracked for
more than 4 days, during which time we substantially changed the particle properties by driving
large mass losses. Emission spectra were acquired during several intervals, by swapping filters
on the APD, turning the laser intensity back to the initial low level as needed. These intervals are
delineated by pairs o f vertical lines. To allow the changes in particle properties to be seen more
clearly, Figure 5.5 shows the data with magnified vertical scales for the following time intervals:
0 to 2000 minutes, 2000 to 2500 minutes, and 4000 to 5000 seconds.
Consider the first 0 to 2000 minute period, where the LIF laser was left at low intensity
(100 W/cm2) to minimize QD heating. As in Figure 5.3, the secular frequency undergoes a series
of steps, with Araz /e = 733.6 ± 5 Hz, averaged over the steps observed between 0 and 2000
minutes. Q was 17e at the onset, and varied between 20 and 17 during this time period. The LIF
intensity fluctuated in concert with the charge steps, due to the collection efficiency artifact
discussed above. Just before 2000 minutes, the mass and LIF intensity measurements were
interrupted to obtain spectral information by sequentially measuring LIF through a series o f long
pass filters. During this interval, the mass and frequency series are not plotted, and the LIF
intensity is also perturbed by the filters. As in Figure 5.3, the mass simply dropped slowly (1.07
%/hour), and similar steps in LIF intensity are seen, attributed to Q-dependent collection
efficienty. The initial mass of this particle is 1877.8 ± 25.6 kDa, i.e., it is almost certainly an
aggregate o f either two or three QDs. These aggregates are probably present to some extent in

61
the methanol-diluted electrospray solution and additional aggregates may also form during
electrospray. Such aggregate particles tend to have M/Q ratios greater than single QDs, and if
desired, they can largely be filtered out by operating the linear quadrupole and trap at 280 kHz.33
At 2140 minutes, the LIF laser intensity was increased to ~216 W/cm2 in order to heat the
particle, and then reduced back to 100 W/cm2 (the original intensity) at 2380 minutes. As shown
in Figures 5.4 and 5.5b, the increase in laser power is accompanied by a sharp increase in emitted
photon intensity, and the beginning of a rapid decrease in the particle mass. The total mass loss
during this first heating period was a factor of roughly two - too large to be explained entirely by
ligand loss. In addition, a series of rapid charge steps, monotonically increasing the positive
charge by 5e, was observed at the beginning of the heating period. Since the rate of collisions
with electrons, Ar+, and Ar* should not have increased dramatically (Ptrap was not changed during
the heating period), these rapid charge steps appear to indicate charging by thermionic electron
emission. The fact that the rate of charging decreased with increasing particle charge is also
consistent with this mechanism, because electron binding energy should increase as the positive
charge left behind increases, thus reducing the emission rate. Both the rapid mass loss and
thermionic emission indicate that the temperature reached during this heating period was quite
high, as discussed below. It is also likely that a substantial fraction of the increased photon
emission at high laser intensity is thermal emission. To allow comparison with the emission
spectrum measured during the initial low temperature period, the laser intensity was briefly
reduced to the initial intensity (100 W/cm2) during the period between 2296 and 2325 minutes.
In Figure 5.5b, the effect of this interruption of the heating period is obvious. The mass and
charge state both immediately stopped changing, and then mass loss resumed as soon as the laser
intensity was increased back to 216 W/cm2. Finally, at 2380 minutes, the heating period was
terminated by reducing the laser intensity back to the original 100 W/cm2 level, and the particle
was monitored for 2000 minutes (~33 hours). During this “rest” period, the particle mass was
nearly constant, initially increasing by 3.3 % during the first few hours, presumably due to

62
adsorption of adventitious gasses. For example, the vacuum chamber undoubtedly has species
such as O2, CO, CO2, H2O, and hydrocarbons at partial pressures in the 10-9-10-8 Torr range,
which certainly might react and bind to the naked surface of the partially sublimated particle.
The charge state also showed signs of “recovering” from the high positive charge attained at high
temperature. A series of charge steps monotonically decreased the positive charge during the first
few hours, as the highly positively charged particle preferentially combined with electrons. Only
after the charge state had declined to Q = 12 - 14 did the charge begin to step bidirectionally,
indicating that steady state had been reached. To probe the effects of these charge steps and
surface reactions on the emission, spectra were acquired in two intervals, near the beginning and
near the end of this “rest” period. Note that during the rest period, the LIF intensity was only
~half that during the first 2000 minutes, roughly mirroring the reduction in particle mass.
Nonetheless, it is interesting that the particle continued to be emissive even though it had lost
such a large fraction of its mass during the heating period.
Finally, at t = 4400 minutes, the LIF laser intensity was again increased to 216 W/cm2
and left high, allowing us to observe changes in mass, charge, and emission intensity as the
particle sublimated. Note the rapid mass loss, and the rapid charge stepping, interrupted by two
brief periods where the laser intensity was reduced back to 100 W/cm2 to allow spectral
measurements. Emission was observed until at 4836 minutes, the particle abruptly went
completely dark. At that point, the mass was only 290 kDa, corresponding to loss of 84.7 % of
the initial particle mass and the charge was 13e. The simplest explanation for the final abrupt loss
of emission would be ejection of the particle from trap, and indeed, the final M/Q is outside the
range recommended by Gerlich3, 34 for safely adiabatic trapping. As discussed below, however,
there is actually still barely detectable emission after the “darkening” transition, leading us to
conclude that the particle was still present.

Emission Spectrum
As noted, during several intervals over the course o f the 83-hour particle time record,
emission spectral information was acquired using long-pass color filters on the APD detector. To
avoid contributions to the signal from thermal (“blackbody”) emission, the LIF laser intensity was
reduced to 100 W/cm2 for each of these spectral measurement intervals (see below). The data
were converted to emission spectra by taking differences between intensities measured with
successive filters, and the results are shown in Figure 5.6. Spectra are shown for each
measurement interval indicated on Figure 5.4, along with an average over all the spectra.
Because the total LIF intensity decreased as the particle sublimated, the spectra are normalized to
allow easier comparison. In addition, the spectra are corrected for the APD sensitivity variations
over the spectral range o f interest, using quantum efficiency values provided for our APD module
by the manufacturer. To test the filter/APD approach to spectral measurement, the spectrum for a
solution o f the QDs was measured using the same APD, color filters, and laser intensity, and this
control spectrum is also shown. As expected from the manufacturer’s data, the stock QD solution
has an emission maximum at 550 nm, although we also see a small peak near 750 nm.
The emission spectra for the trapped gas-phase particle are significantly red-shifted with
little intensity at 550 nm, and most of the intensity in a broad peak 590 nm and 695 nm. The
emission also rises again toward 850 nm, suggesting that there may be a substantial peak in the
near-IR. The possible origin o f these spectral features is discussed below.
We have demonstrated that single QDs, and small aggregates of QDs, isolated in the gas
phase, have substantial LIF quantum yields, and that the emission intensity is not strongly
affected by changes in the charge. Furthermore the QDs can be heated to temperatures where
sublimation and thermal emission o f electrons and photons is efficient, yet still retain significant
LIF quantum yield when the particles are allowed to cool again, to temperature well below those
required for significant thermal emission. Several points merit additional discussion.
63

Discussion
Temperature Estimates for “Heating” and “Rest” Periods
As noted above, Figure 5.5b and 5.5c show evidence that the QD aggregate reached
temperatures during the “heating” periods high enough to drive sublimation and thermal
emission. For reference, bulk ZnS is observed to sublime at about 1450 K, although the
temperature should be lower for small particles in vacuum. Bulk CdSe sublimes at about 1420 K;
however, sublimation of CdSe nanostructures has been reported at temperatures as low as 773K.35
Particle heating is via absorption of energy from the LIF laser, only part of which is
radiated as fluorescence. A rough estimate of the heat deposition rate can be made using the LIF
intensity to estimate the excitation rate. In Figure 5.3, and in the “rest” periods in Figure 5.4,
where the particles show no signs of being hot enough for thermal emission or sublimation, it is
reasonable to assume that the only significant emission process is LIF. Under these conditions,
the LIF count rate was 500/second, and if we correct for APD quantum efficiency, reflection
losses in the optics, and the collection solid angle, we can estimate that the particles were emitting
on the order of 30,000 photons/second. A lower limit on the heating rate can be obtained by
assuming that the LIF quantum yield is unity, so that the heating comes only from the Stokes shift
between the 532 nm pump and the emission spectrum (Figure 5.6). Since we have no information
on the spectral dependence of the emission at X > 850 nm, we assume that this near-IR emission
is all at 900 nm, for this estimation. With these assumptions, we reach a not unreasonable
estimate for the heat deposition rate of ~16,000 eV/second ~ 2.6 fW. If we assume that the
heating rate for the higher laser power used in the heating periods in Figure 5.4 (for LIF count
rate of 3300/second) is simply proportional to the increased laser power, the heat deposition rate
would be ~105,000 eV/second ~ 18 fW.
The particle temperature is set by the balance between these heating deposition rates and
all cooling mechanisms. Since there is no evidence for thermal emission or rapid sublimation at
the lower LIF laser intensity, the only significant cooling mechanism is via collisions with the 1
64

mTorr of Ar buffer gas. The mean free path of the argon is much larger than the trap dimensions,
and the velocities of the massive particles are negligible compared to the argon velocity.
Therefore, the collisions are essentially of argon at the trap temperature (near 300 K) with the hot
particle surface. The flux-weighted collisional cooling power can be estimated as:
P = 2kAZ(TqD — TTrap) * Accom
where k is Boltzmann’s constant, A is the surface area of the QD, Z is the collision rate per unit
surface area, T qD is the temperature of the QD, and Accom is an accommodation coefficient.36
The accommodation coefficient accounts for the inelasticity of the Ar-surface collisions, where
Accom=1 corresponds to collisions where the scattered argon is thermal at T qD, and Accom=0
means no cooling. For a noble gas, Ar is a reasonably efficient collider, with, for example,
Accom = 0.24 in collisions with a tungsten filament between 1073 - 1785 K.37 For 1mTorr of Ar
at 300 K, there would be ~450,000 collisions per second with a single QD, and roughly double
that for a QD dimer, assuming that the QDs in the dimer remain unfused, which is probably a
reasonable assumption for low temperatures. If we assume Accom = 0.24, then the collisional
cooling power equals the laser heat deposition rate at T qD = ~630 K. This is certainly (see below)
well below the temperature where thermal electron or photon emission would be expected, and
thus seems reasonable. The slow mass losses seen Figure 5.3 and the initial period in Figure 5.4
may indicate that sublimation is occurring, albeit very slowly, again, consistent with TQD being
below Tsublimation. Note that the measured mass losses of 1.0 - 1.1 % /hour correspond to a
desorption rate of less than 5.8 Da/second.
If the higher heat load at high laser intensity were balanced only by collisional cooling,
then the particle temperature would be ~2800K; however, well below this temperature, additional
cooling by sublimation and thermal emission of photons and electrons becomes significant. If the
particles behaved like black bodies, the thermal photon emission would be governed by the
Stefan-Boltzmann law:
65
P = AeoT4
where P is the radiated power, A is the surface area of the QD, s is the emissivity constant, c
Stefan’s constant, and T is the temperature.38 Subwavelength diameter particles do not behave as
black bodies, however, and have emissivities well below unity and with substantial wavelength
dependence.39-41 A number of studies suggest that e = 0.04 for refractory nanoparticles (W, Fe,
and C).42 For CdSe, e = 0.001 might be a reasonable value since it is not a refractory material and
thus provides a lower bound on the radiative cooling. Without collisional cooling, the thermal
emission would balance the heating power at ~1300 K.
Thermionic emission of electrons is governed by the Richardson-Dushman equation:
I(amps) = AT2 exp(-0/kT), where O is the material work function, and A=4nmeek2/h3, where me
and -e are the electron mass and charge, k is the Boltzmann constant, and h is Planck’s constant.
The minimum energy carried away by each electron is O, however, because the electrons leave
behind an increasingly positively charged particle, the actual energy loss per electron is
significantly higher. Nonetheless, the frequency of electron emission is small - there are only 5
emission events between 2140 and 2210 minutes. Even taking the high positive charge (starting
at 19 e, rising to 24 e) into account, the time averaged cooling power from electron emission is
only ~0.1 eV/second - negligible compare to the heating power.
Similarly, there is also contribution to cooling from subliblimation. During each high
laser power heating period in Figure 5.4, the mass loss corresponds to ~40% of the initial particle
mass; however, this corresponds to loss of only ~ 0.8 ZnS units/second or ~0.4 CdSe
units/second. The bulk heat of sublimation of CdSe and ZnS are, respectively, 405 kJ/mol (4.198
eV) and 468 kJ/mol (4.68 eV).43 If we take the average of the two values, the sublimation cooling
power is ~10 eV/second - large compared to that from thermionic emission, but still negligible
compared to the laser heating power.
The particle temperature is set by the balance between laser heating power and the total
cooling by collisions, sublimation, and thermal emission of electrons and photons; however, only
66
collisions and thermal photon emission are significant. Taking both into account, the particle
temperature is estimated to be ~1200 K; however, this estimate is certainly too high, because in
estimating the laser heating rate, we assumed that all detected photons were LIF, whereas a
significant fraction actually results from thermal emission. Correcting for this factor lowers the
estimated temperature to ~1150 K. This should still be regarded as a crude estimate, due to
uncertainties in the emissivity vs. wavelength, and other factors relating both to the laser heating
and thermal emission cooling rates. Nonetheless, the estimated temperature is not unreasonable,
in the sense that it is in the range where both sublimation and thermionic emission should be slow
but observable. Because the rates for these processes are so strongly temperature dependent, the
temperature estimate is unlikely to be in error by more than ~100 K.
One other question is the extent to which thermal (“blackbody”) photon emission
contributes to the LIF signal seen under low power laser irradiation ( T qD ~ 630 K). Figure 5.7
shows blackbody emission curves for 630 K and 1150 K. It can be seen that the thermal
contribution to the APD-sensitive wavelength range below 1000 nm is negligible at 630 K. The
absence o f thermal emission at the lower laser power was confirmed by measuring the effect o f
argon buffer gas pressure on the emission intensity, in the range from 1 mTorr to 30 mTorr. If
thermal emission were significant, it would have been quenched at higher buffer gas pressure,
because T qD is considerably lower (315 K from collisional cooling). No change in intensity was
observed, ruling out a contribution from significant thermal emission at low laser power.
The Nature of the Emission Process
The absorption and emission spectra for QDs in solution is dominated by exciton
formation, as shown in Figure 5.6. This results in an emission band around 550nm for the QDs
used. However, the emission spectra acquired at various times for the trapped QD aggregate are
significantly red-shifted with two peaks: one between 590 nm and 780 nm, and the other above
850 nm. The differences between the gas phase and solution phase spectra cannot be attributed
67

only to some effect of electrospray ionization, because it has been shown electrosprayed QDs
deposited on surfaces have optical properties similar to those of the starting material. 44
Generally, red-shifted spectra, as seen in Figure 5.6, are a result of deep level emission from
surface states, most commonly seen for small QDs where a majority of atoms are found on the
surface. In our case, the particle is likely an aggregate of 2 or 3 QDs, which possibly could
coalesce into a single sphere when heated at high laser power. Coalescence would dramatically
change the emission spectra in unknown ways because the core and the shell would mix creating
an ill-characterized nanoparticle. In this context, it is interesting that the emission spectra taken
before and after periods of high power laser heating are not very different, even though there was
mass loss and changes in charge. This insensitivity to the details of the particle structure is
consistent with emission from surface states, rather than core excitonic emission. A factor to
consider is that there is a ~12% lattice mismatch between CdSe and ZnS in the bulk.45, 46 Thus
interdiffusion/mixing of the core and shell upon heating would tend to create additional defects at
the core-shell interface.
Heating to “Darkness”
Figure 5.5d shows the final time period, where the particle is heated until it finally goes
almost “dark”. The total mass at that point is about what we would expect for a single CdSe core
(290 kDa). Emission spectra were acquired in several intervals during the final heating period,
and for these, the laser intensity was returned to the same low (100 W/cm2) level used for all the
other emission spectra, where thermal emission makes a negligible contribution (see above). As
shown in Figure 5.6, the emission spectra taken late in the sublimation process are not radically
different from those taken before significant mass loss occurred, although the intensity is
significantly lower, even before the final abrupt “darkening” transition at 4836 minutes. This
slow decrease in emission intensity may simply reflect a decrease in surface area of the particle,
particularly if surface states are involved in the observed red-shifted emission. Note that there is
68

also a slow decrease in fluorescence intensity at high laser intensity, where thermal emission is
expected to make a significant contribution, and surface area certainly plays a role in this case.
One question is whether the final abrupt near-total loss of emission at 4836 minutes
results from the particle no longer absorbing the 532 nm laser, or if the particle continues to
absorb, but with near-zero fluorescence quantum yield. If the latter explanation were true, we
would still expect to see thermal emission from the hot particle -- indeed, the temperature should
increase if the absorbed laser energy is no longer partly radiated as fluorescence. Therefore, we
tentatively conclude that the loss of emission reflects a sudden loss of absorption, which is not
unexpected. The band gap for the QD should increase with decreasing size, and at some point,
the 532 nm laser would simply no longer be able to excite the particle. Because we are not
averaging over a distribution of QDs, the drop in excitation rate could be abrupt. Note that as
soon as the particle stops absorbing, its temperature would rapidly drop to ~300 K.
Blinking after Darkening of the Particle
During the ~80 hours preceding the final darkening transition at 4836 minutes, the
particle in Figures 5.4 and 5.5 was never observed to blink, i.e., show intermittent fluorescence.
However, after the final darkening transition, the small remaining signal shows significant
intermittency, if it is binned in 1 or 10 second time intervals. Figure 5.8 shows a 14 hour
continuation of the signal record, starting just after the abrupt darkening transition, binned in 1
second intervals. Figure 5.9 shows a histogram of the intensity levels observed, and the
distributions of bright (“on”) and dark (“o ff’) time intervals. The intensity histogram is clearly
bi-modal, with the major peak simply reflecting the APD dark count rate, but with a small peak at
about twice the dark count level. The “On”/“Off” distributions show that there are reasonably
frequent “On” intervals lasting between 1 and 20 seconds, but that the “O ff’ intervals are much
longer, consistent with the histogram showing that the particle is dark most of the time.
69
70
It is not clear why this particle, having lost ~85% of its initial mass, and having
apparently ceased to absorb the 532 nm pump laser, should show intermittent emission. One
possibility is that in the nonabsorbing state, with T qD = 300 K, the particle slowly absorbs or
reacts with background gases, modifying the surface such that the band gap becomes small
enough to allow 532 nm absorption again. At that point, the particle would heat rapidly,
presumably because driving off the adsorbed surface species within seconds, increasing the band
gap, causing the particle to stop absorbing again. In this scenario, the “on” times should be short,
because surface species should desorb rapidly from the particle once it begins to absorb again.
The “o ff’ times should be much longer, determined by time it takes for adsorption of appropriate
adventitious species from the rather clean (base pressure 10-8 Torr) chamber background. Such a
scenario could go on indefinitely, and as shown in Figure 5.8, rather stable blinking behavior was
still occurring after almost 14 hours of monitoring.
Conclusion
In conclusions, we have demonstrated that it is possible to trap single QDs and small QD
aggregates in a split-ring quadrupole trap, and report the first measurements of fluorescence and
thermal emission behavior of QDs in the gas phase. It is possible to detect strong fluorescence
from a single QD, after brightening the QD by brief CO2 laser heating of the ligand layer. The
mass and charge of trapped particles are easily determined by secular frequency measurements,
and can be tracked for long times as the particles are manipulated by heating, exposure to charge
changing collisions. Obviously, other manipulations, such as exposure to reactive gases to carry
out surface chemical modification, are possible. The emission spectra of a single QD aggregate
showed a significant red shift from would be expected from solution phase measurements. More
studies are needed to understand the mechanism of fluorescence, the QD going dark, and
blinking. We are confident that NPMS is a suitable and powerful tool to uncover these
mechanisms.

71
Acknowledgements
We would like to thank D. Gerlich of TU Chemnitz, M. Bartl and J. Gerton from the
University of Utah, and J. Hollingsworth of Los Alamos National Labs for helpful discussions.
The work was supported by the Chemistry Division of the U.S. National Science Foundation,
under grant CHE- 1111935.
References
1. D. M. Bell, C. R. Howder, D. Gerlich, D. K. Lewis and S. L. Anderson, Analytical Chemistry (submitted) (2013).
2. S. Schlemmer, J. Illemann, S. Wellert and D. Gerlich, AIP Conf. Proc. 457, 80 (1999).
3. S. Schlemmer, J. Illemann, S. Wellert and D. Gerlich, Journal of Applied Physics 90, 5410 (2001).
4. M. Grimm, B. Langer, S. Schlemmer, T. Lischke, U. Becker, W. Widdra, D. Gerlich, R. Flesch and E. Ruehl, Phys. Rev. Lett. 96, 066801 (2006).
5. A. J. Trevitt, P. J. Wearne and E. J. Bieske, International Journal of Mass Spectrometry 262, 241 (2007).
6. Y. Cai, W. P. Peng, S. J. Kuo, Y. T. Lee and H. C. Chang, Anal. Chem. 74, 232 (2002).
7. Y. Cai, W. P. Peng, S. J. Kuo, S. Sabu, C. C. Han and H. C. Chang, Anal. Chem. 74, 4434 (2002).
8. W. P. Peng, Y. Cai, Y. T. Lee and H. C. Chang, Int. J. Mass Spectrom. 229, 67 (2003).
9. W.-P. Peng, Y.-C. Yang, M.-W. Kang, Y. T. Lee and H.-C. Chang, J. Am. Chem. Soc. 126, 11766 (2004).
10. P. H. Dawson, Quadrupole Mass Spectrometry. (Elsevier Scientific Pub., Amsterdam, 1976).
11. S. F. Wuister, I. Swart, F. van Driel, S. G. Hickey and C. d. M. Donega, Nano Lett. 3, 503 (2003).
12. C. D. M. Donega, S. G. Hickey, S. F. Wuister, D. Vanmaeckelbergh and A. Meijerink, J. Phys. Chem. B 107, 489 (2003).
13. M. Shim, C. Wang and P. G. Sionnest, J. Phys. Chem. B 105, 2369 (2001).
14. C. Wang, B. L. Wehrenberg, C. Y. Woo and P. Guyot-Sionnest, J. Phys. Chem. B 108, 9027 (2004).

72
15. P. Guyot-Sionnest, Microchim Acta 160, 309 (2008).
16. P. P. Jha and P. Guyot-Sionnest, J. Phys. Chem. C 114, 21138 (2010).
17. W. Qin, R. A. Shah and P. Guyot-Sionnest, ACS Nano 6, 912 (2012).
18. C. Galland, T. Ghosh, A. Steinbruck, M. Sykora, J. A. Hollingsworth, V. I. Klimov andH. Htoon, Nature 479, 203 (2011).
19. Z. Ding, B. M. Quinn, S. K. Haram, L. E. Pell, B. A. Korgel and A. J. Bard, Science 296, 1293 (2002).
20. N. Myung, Z. Ding and A. J. Bard, Nano Letters 2, 1315 (2002).
21. V. Lesnyak, N. Gaponik and A. Eychmuller, Chem. Soc. Rev. 42, 2905 (2013).
22. J. Y. Kim, O. Voznyy, D. Zhitomirsky and E. H. Sargent, Advanced Materials 25, 4986 (2013).
23. S. B. Brichkin and E. V. Chernykh, High Energy Chemistry 45, 1 (2011).
24. A. Kongkanand, K. Tvrdy, K. Takechi, M. Kuno and P. V. Kamat, Journal of the American Chemical Society 130, 4007 (2008).
25. K. Turdy, P. A. Frantsuzov and P. V. Kamat, Proceedings of the National Academy of Sciences 108, 29 (2011).
26. E. H. Sargent, Nature Photonics 6, 133 (2012).
27. W. Xiong, D. D. Hickstein, K. J. Schnitzenbaumer, J. L. Ellis, B. B. Palm, K. E. Keister, C. Ding, L. Miaja-Avila, G. Dukovic, J. L. Jimenez, M. M. Murnane and H. C. Kapteyn, Nano Lett. 13, 2924 (2013).
28. D. Gerlich and S. Decker, Applied Physics B: Lasers and Optics Published online Oct 24 (2013).
29. D. Gerlich, in Advances in Chemical Physics: State-Selected and State-To-State Ion- Molecule Reaction Dynamics, Part 1, edited by C. Y. Ng and M. Baer (J. Wiley & Sons, 1992), Vol. 82, pp. 1-176.
30. in II-VI andI-VII Compounds; Semimagnetic Compounds, edited by O. Madelung, U. Rossler and M. Schulz (Springer Berlin Heidelberg, 1999), Vol. 41B, pp. 1-7.
31. S. Decker, Tech. Univ. Chemnitz, 2010.
32. Y. Zhang, A. M. Schnoes and A. R. Clapp, Appl. Mater. Interfaces 2, 3384 (2010).
33. C. R. Howder, D. M. Bell and S. L. Anderson, Rev. Sci. Instrum. (Submitted) (2013).
34. D. Gerlich, Hyperfine Interact. 146/147, 293 (2003).

73
35. B. Goris, M. A. Van Huis, S. Bals, H. W. Zandbergen, L. Manna and G. Van Tendeloo, Small 8, 937 (2012).
36. K. Hansen, Statistical Physics o f Nanoparticles in the Gas Phase. (Spring Science+Buisness Media, Dordrecht, 2013).
37. W. Watt, R. Moreton and L. G. Carpenter, Surf. Sci. 45, 238 (1974).
38. P. Roura and J. Costa, Eur. J. Phys. 23, 191 (2002).
39. L. Landstrom, K. Elihn, M. Boman, C. G. Granqvist and P. Heszler, Appl. Phys. A 81, 827 (2005).
40. S.-J. Yu, S. J. Youn and H. Kim, Physica B 405, 638 (2010).
41. H. Odashima, M. Tachikawa and K. Takehiro, Phys. Rev. A 80, 41806 (2009).
42. Gas Phase Nanoparticle Synthesis. (Kluwer Academic Publishers, Dordrecht, 2004).
43. L. v. Szentpaly, J. Phys. Chem. A 112, 12695 (2008).
44. L. F. Pease, III, J. I. Feldblyum, S. H. D. Lacaerda, Y. Liu, A. R. H. Walker, R. Anumolu, P. B. Yim, M. L. Clarke, H. G. Kang and J. Hwang, ACS Nano 4, 6982 (2010).
45. B. O. Dabbousi, J. Rodriguez-Viejo, F. V. Mikulec, J. R. Heine, H. Mattoussi, R. Ober, K. F. Jensen and M. G. Bawendi, J. Phys. Chem. B 101, 9463 (1997).
46. A. M. Smith and S. Nie, Acc. Chem. Res. 43, 190 (2010).

74
Figure 5.1: A cross-sectional view of the trap along the x-axis. Light is collected on the vertical
axis and the 532 nm laser is introduced into the plane of the image in the center of the trap.
Diagonal channels are used to introduce the CO2 laser. The horizontal axis is used to introduce
the ions to the trap.
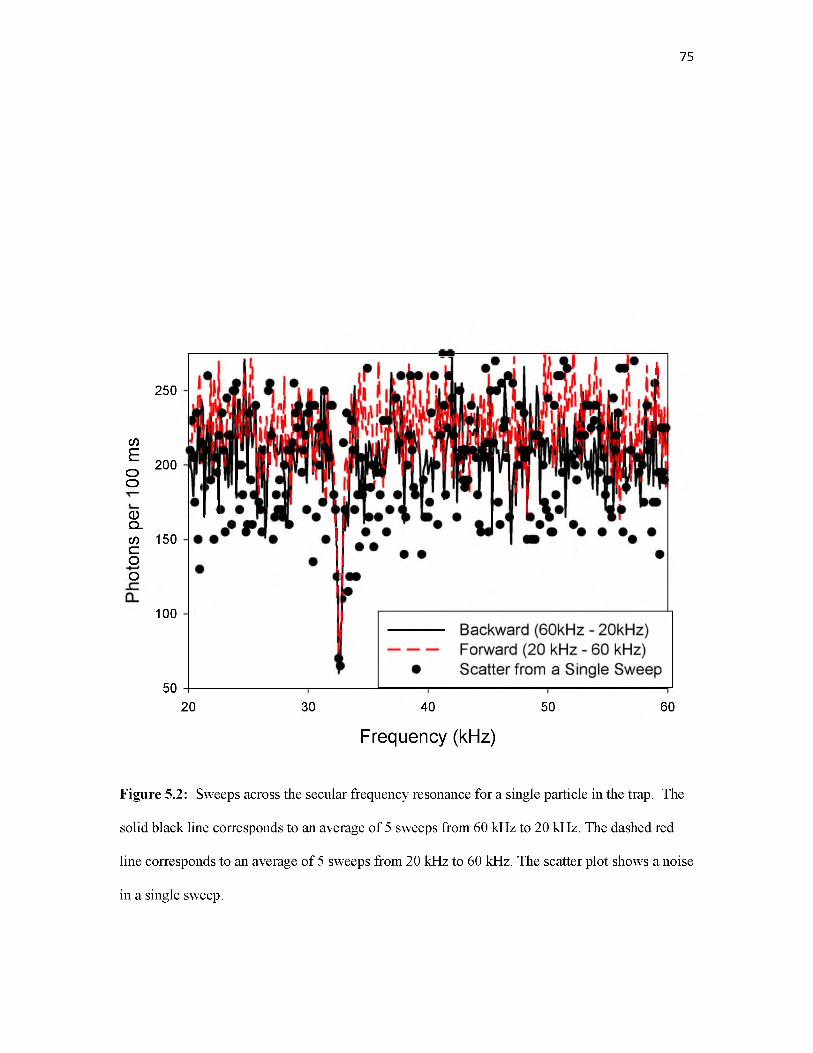
75
wEoo
(DCPWcCDO
250
200
150
100
5020 30 40 50 60
Frequency (kHz)
Figure 5.2: Sweeps across the secular frequency resonance for a single particle in the trap. The
solid black line corresponds to an average of 5 sweeps from 60 kHz to 20 kHz. The dashed red
line corresponds to an average of 5 sweeps from 20 kHz to 60 kHz. The scatter plot shows a noise
in a single sweep.

76
40
NX
> 1oc(Dcr<L>
ra=joCDCO
25
20
.*m m . ‘
13 12 ^12 p—
1111 n L
! 10 . . i
—•— Secular Frequency• Fluorescence• Mass
1
- 80
120 r 6e+5
100
- 20
5e+5
- 4e+5
m c- 3e+5 £
CDQ
- 2e+5
- 1e+5
L 0200 400
Time (Minutes)
600
Figure 5.3: 12.5 hour time record for a single trapped quantum dot, showing variations in secular
frequency (kHz - black), mass (Da - blue), and fluorescence intensity (photons per 100ms - red).
The number of charges present are shown.
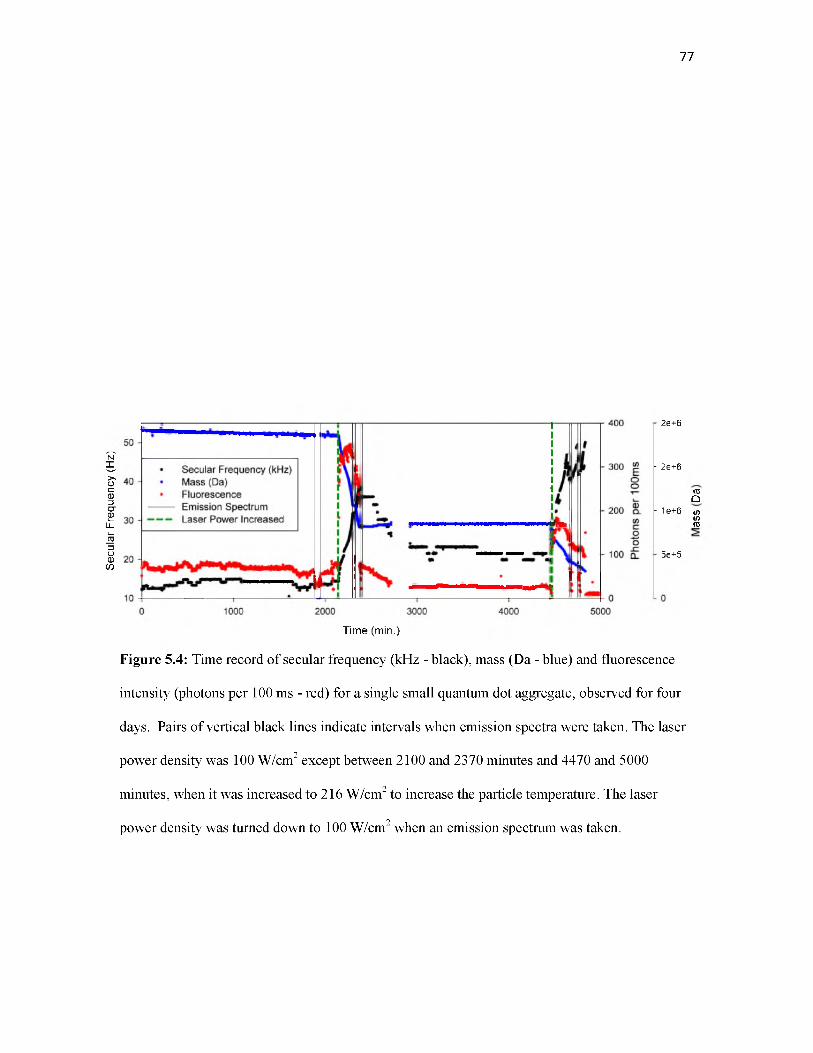
Secu
lar
Freq
uenc
y (H
z)
77
2e+6
- 2e+6
cz D- 1 e + 6 </> w ro
5e+5
Time (min.)
Figure 5.4: Time record of secular frequency (kHz - black), mass (Da - blue) and fluorescence
intensity (photons per 100 ms - red) for a single small quantum dot aggregate, observed for four
days. Pairs of vertical black lines indicate intervals when emission spectra were taken. The laser
power density was 100 W/cm2 except between 2100 and 2370 minutes and 4470 and 5000
minutes, when it was increased to 216 W/cm2 to increase the particle temperature. The laser
power density was turned down to 100 W/cm2 when an emission spectrum was taken.

Figure 5.5: Detailed
time records with
expanded vertical scales, for the
particle in
Figure 5.4, in
Secular Frequency (kHz) Secular Frequency (kHz) Secular Frequency (kHz)
Photons per 100ms Photons per 100ms Photons per 100ms
OOr°ooCD+CD
OOCD+Ui
o>ooa>+cn
Mass (Da)
00boCD+CJ1
“ I—obo
0 1
boCD+UI
ooCD
O)
cnoCD
O)
Mass (Da)
N J O
R ° S’ °CD
(J)
ooCD+cn
ooCD+o>
cnoCD+CD
Mass (Da)00
100 r
2.00e+6

79
S ' 0 8 toCOoos2t 0.6wc(D
(D>
0.4
JS 0.2joa)
0.0
Spectrum at 1870 min. Spectrum at 2300 min. Spectrum at 4660 min. Spectrum at 4750 min. AverageSolution spectrum
500 550 600 650 700 750 800
Cutoff wavelength (nm)
850 900
Figure 5.6: Emission spectra taken at the indicated times in Figures 5.4 and 5.5. An average of
the spectra is shown with error bars denoting the standard deviation of the 4 measurements. A
solution phase emission spectra was also obtained using the same optical arrangement, for
comparison (dashed line).
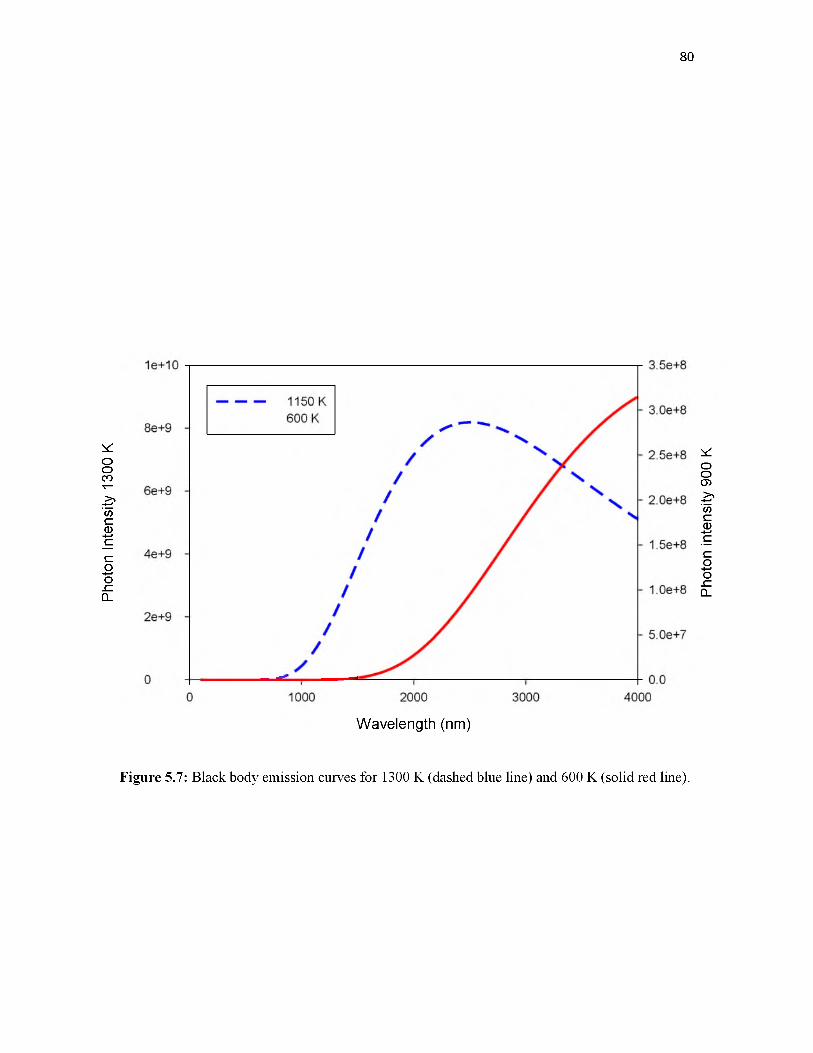
Phot
on
Inte
nsity
13
00
K
80
Wavelength (nm)
Figure 5.7: Black body emission curves for 1300 K (dashed blue line) and 600 K (solid red line).
Phot
on
inte
nsity
90
0 K

Phot
ons
per
seco
nd
81
180
160
140
120
100
80
60
10000 20000 30000
Time in Seconds40000 500000
Figure 5.8: The time record for the first 50000 seconds after the QD from Figure 5.4 and 5.5
went “dark”.

Num
ber
of E
vent
s
82
Photons per second On/Off Duration (Seconds)
Figure 5.9: A statistical view on the blinking exhibited by a single QD. Left: A histogram of
brightness levels observed in Figure 5.8. Right: The duration distributions of “On” (open red
circles) and “O ff’ times (black filled circles) in the time record in Figure 5.8. The On/Off cutoff
was chosen as 107 photons per second.
Num
ber
of E
vent
s

CHAPTER 6
CONCLUSION: THE FUTURE OF NANOPARTICLE
MASS SPECTROMETRY
84
Development of a nanoparticle mass spectrometer (NPMS) has been shown for systems
of large polystyrene particles and core-shell CdSe/ZnS quantum dots (QDs). Precision in the
measurement of ©z approached 1 ppm for a large polystyrene particle, which is an order of
magnitude better than previous measurements. Fluorescence from QDs was activated by the
presence of a CO2 laser. The ability to trap a single QD was demonstrated. For a single QD the
number of charges, mass, and fluorescence intensity was tracked as a function of time. Heating a
single aggregate QD resulted in over 85% mass loss, after which the fluorescence dropped
significantly and the QD began to blink.
The activation of QDs with the CO2 laser needs to be studied further to have a better
understanding of what is occurring. It would be ideal to study this process by trapping a pre
activated QD with a QD that is already bright. By this process, it could be possible to track how
the ©z of the dark particle changes when exposed to the CO2 laser. The ideal situation would be to
observe charge steps before activation to obtain the absolute mass and charge of the pre
brightened QD, and perform the same measurements after the QD is activated. This could show if
evaporation of the ligand layer is occurring. We have begun preliminary studies to trap a dark
particle with a bright particle and have demonstrated it is possible to trap a dark QD with a bright
one and obtained the ©z of both particles. It is exciting that this is a possible use of NPMS and
more studies are needed to determine the resolution and usefulness of this method.
Another option that would be interesting to investigate, as mentioned in Chapter 2,
would be to build nanostructures in the trap to investigate energy transfer between different types
of QDs. This could be achieved by trapping a positively charged QD and then introducing a
negatively charged QD. The two particles will be attracted to each other and form a dimer. In
principle, any number of particles could be built in such a fashion. Overall, the future is very
bright for NPMS and there are many interesting experiments that need to be completed to further
understand QDs in the gas phase.

CHAPTER 7
INTRODUCTION TO VIBRATIONALLY STATE-SELECTED
ION-MOLECULE REACTIONS WITH HOD+

86
Introduction
Reaction dynamics studies how reactions take place and what controls reactivity on a
very basic and fundamental level.1 It is a daunting task to understand how a chemical reaction
takes place as there are many variables and steps involved in a single reaction. Understanding a
chemical reaction encompasses initial approach of the reactants, the reaction coordinate,
scattering dynamics, and the deposition of energy in the products. Increasing the number of atoms
present in a reaction also in turn increases the complexity in modeling a reaction and
understanding the flow of energy. By using small model systems, it is possible to control more
variables and model what is occurring in a timely manner. For this reason, HOD+ provides an
ideal ion with which to investigate simple H+ and D+ transfer reactions.
Although it is impossible to observe a single gas phase collision, it is possible, by using a
large sample size, to build a statistically meaningful sample to understand how a reaction
proceeds. Building a statistical sample requires an instrument with a high throughput and
reproducibility. Ion guiding makes it possible to guide ions with high efficiency and very easily
control their translational energy. Use of a tandem mass spectrometer accomplishes these ideals
and couples ion guiding with mass selection of both the reactant and product ions. Laser
ionization affords vibrational state-selection of the reactant ion by utilizing resonance enhanced
multi-photon ionization (REMPI).2-4 Thus, it is possible to create an energy-, mass-, vibrational
state-selected reactant ion beam with which to study ion - molecule reactions.
In the work presented here, energy-, mass-, vibrational state-selected ions are guided to a
scattering cell where the neutral reactant resides. The product and remaining reactant ions are
guided through a time-of-flight region to allow separation and obtain product recoil velocity
distribution. The final mass spectrometer cycles through the reactant beam and the product ions to
determine the reactivity. Our detector collects the arrival times of the product ions to obtain
product velocity distributions of each species separately. Coupling this method as a function of
the reactant vibrational state allows for a fascinating view of a chemical reaction.
The purpose of using vibrationally state-selected ions is to investigate whether or not a
reaction is under dynamical or statistical control.5 Dynamical control relates to the dynamics of
how the reactants are prepared with respect to one another, while reactions that are under
statistical control are controlled by the amount of energy and angular momentum present in the
collision environment. Vibrational state-selection of the reactant ion probes the initial interaction
of the reactants. Once a bond is formed between the reactants, the vibrational energy becomes
randomized throughout the system. As a result, the only impact the vibrational state should have
as the products separate is in the additional energy present in the system.
Coupling the experimental results with ab initio calculations provides even further depth
into what is occurring on the single collision level. Ab initio calculations make it possible to
calculate the lowest energy pathway from the reactants to the products, known as the reaction
coordinate. The use of a reaction coordinate lies in its ability to explain the processes necessary
for a reaction to take place and a way to visualize how a reaction occurs. Typically, an ion -
molecule reaction coordinate has an attractive potential on the initial approach due to the ion -
induced dipole and in some cases, ion - dipole forces. The reaction coordinate consists of
reactant-like and product-like complexes and transition states coupling the change from a
reactant-like species to a product-like one. The practical use of the reaction coordinate is to
determine if the reaction is governed by a statistical mechanism or if any bottlenecks exist along
the reaction coordinate.
The recoil velocity distributions of the products give similar insight to the reaction by
probing the lifetime of the collision complex. A long-lived lifetime, longer than the rotational
period of the complex, is indicative of reaction that is complex mediated and could be complex
mediated. While a collision with a short lifetime, shorter than the rotational period of the
complex, is evidence that the reaction is direct. A direct reaction indicates there is not sufficient
time for energy to be randomized throughout the collision environment nor for the products to fall
apart in a statistical manner.
87
Here, HOD+ is used to investigate a number of reactions where endoergic H+ and D+
transfer occurs. HOD+ is an interesting molecule to use because of the wealth of information
available in reactions of vibrationally excited neutral HOD. Neutral vibrationally excited HOD
has been used to study reactions by a Zare and Crimm, most notably with H atoms.6"15 The
reaction of HOD + H ^ OH + HD or OD + H2 has a barrier of 0.93eV and is endoergic by
0.65eV. To overcome the barrier to reactivity, two methods were employed by the Zare group and
the Grim group to investigate this reaction. The Zare group utilized translationally hot H atoms,
generated by photolysis of HI, with an energy of 1.6 eV.13 By exciting HOD with 1 quanta of the
OH stretch, the reaction favored H2 formation (H transfer) over HD formation (D transfer) 25:1.13
Conversely, exciting 1 quanta of the OD stretch of HOD, the reaction preferred HD formation (D
transfer) over H2 formation 5.8:1. Grim, on the other hand, utilized highly excited HOD to
investigate this reaction, with either 5 quanta of the OD stretch or 4 quanta of the OH stretch.6
These vibrational states are energetically similar and both in excess of the endoergicity of the
reaction. In this case, the selectivity is magnified and the reaction nearly exclusively occurs by
breaking the excited OH or OD bond. The bend vibration, on the other hand, was never
investigated with the fundamental mode, but rather only through combination bands, and no
enhancement was observed because of the bend vibration.15
There is a major difference between the aforementioned reaction and endoergic H+ or D+
transfer in an ion molecule reaction. That difference is the shape of the reaction coordinate. In the
neutral-neutral reaction, there is a barrier between the reactants and products, while in an ion-
molecule reaction the reactants are stabilized by ion-induced dipole interactions, creating a
potential well between the reactants and products. The difference in the shape of the potentials
could impact the magnitude of the enhancement due to reactant vibration. Also, the reactions
presented herein investigate the true impact of the bend vibration without combination of either
stretch, with unexpected results.
88

Here, reactions of HOD+ with CO2 (Chapter 8), N2 (Chapter 9), CO (Chapter 10), and
N2O (Chapter 11) are presented. Each reaction exhibits endoergic H+ and D+ transfer, which are
the dominant processes for most of these reactions, with exception of N2O at high energies.
References
1. R. D. Levine, Molecular Reaction Dynamics. (Cambridge U. Pr., Cambridge, 2005).
2. S. Mark, T. Glenewinkel-Meyer and D. Gerlich, Int. Rev. Phys. Chem. 15, 283 (1996).
3. S. L. Anderson, D. M. Rider and R. N. Zare, Chem. Phys. Lett. 93, 11 (1982).
4. R. N. Zare, Science 279, 1875 (1998).
5. J. Liu, K. Song, W. L. Hase and S. L. Anderson, J. Am. Chem. Soc. 126, 8602 (2004).
6. A. Sinha, M. C. Hsiao and F. F. Crim, J. Chem. Phys. 92, 6333 (1990).
7. M. C. Hsiao, A. Sinha and F. F. Crim, J. Phys. Chem. 95, 8263 (1991).
8. A. Sinha, M. C. Hsiao and F. F. Crim, J. Chem. Phys. 94, 4928 (1991).
9. F. F. Crim, A. Sinha, M. C. Hsiao and J. D. Thoemke, Jerusalem Symp. Quantum Chem.25, 217 (1991).
10. A. Sinha, J. D. Thoemke and F. F. Crim, J. Chem. Phys. 96, 372 (1992).
11. R. B. Metz, J. D. Thoemke, J. M. Pfeiffer and F. F. Crim, J. Chem. Phys. 99, 1744 (1993).
12. J. D. Thoemke, J. M. Pfeiffer, R. B. Metz and F. F. Crim, J. Phys. Chem. 99, 13748 (1995).
13. M. J. Bronikowski, W. R. Simpson, B. Girard and R. N. Zare, J. Chem. Phys. 95, 8647(1991).
14. D. E. Adelman, S. V. Filseth and R. N. Zare, J. Chem. Phys. 98 (6), 4636 (1993).
15. M. J. Bronikowski, W. R. Simpson and R. N. Zare, J. Phys. Chem. 97, 2204 (1993).
89

CHAPTER 8
H+ VS. D+ TRANSFER FROM HOD+ TO CO2: BOND-SELECTIVE
CHEMISTRY AND THE ANOMALOUS EFFECT OF BENDING
EXCITATION
Reprinted with permission from David M. Bell, Jason M. Boyle, Scott L. Anderson, and Journal
of Chemical Physics 134, 064312. Copyright 2011, American Institute of Physics

Overview
Reactions of HOD+ with CO2 have been studied for HOD+ in its ground state, and with
one quantum of excitation in each of its vibrational modes: (001) - predominately OH stretch,
0.396 eV, (010) - bend, 0.153 eV, and (100) - predominately OD stretch, 0.293eV. Integral cross
sections and product recoil velocities were recorded for collision energies from threshold to 3 eV.
The cross sections for both H+ and D+ transfer rise with increasing collision energy from
threshold to ~1 eV, then become weakly dependent of collision energy. All three vibrational
modes enhance the total reactivity, but quite mode-specifically. The H+ transfer reaction is
enhanced by OH stretch excitation, whereas OD stretch excitation has little effect. Conversely,
the D+ transfer reaction is enhanced by OD stretch excitation, while the OH stretch has little
effect. Excitation of the bend strongly enhances both channels.
The effects of the stretch excitations are consistent with previous studies of neutral HOD
mode-selective chemistry, and can be at least qualitatively understood in terms of a late barrier to
product formation. The fact that bend excitation produces the largest overall enhancement is
surprising, because this is the lowest energy excitation, and is not obviously connected with the
reaction coordinates for either H+ or D+ transfer. A rationalization in terms of the effects of water
distortion on the potential surface is proposed.
Introduction
The water cation is important in chemistry of the upper atmosphere1-3 and in comet tails.4-
7 Previous studies of reactions of HOD, H2O, or D2O with H or Cl atoms have also shown that
this is an interesting reactant molecule to test ideas about mode/bond-selective chemistry.8-15 For
example, Zare and co-workers studied reaction of fast H atoms with HOD, which is endoergic by
~0.65 eV, with a 0.93 eV barrier. In this case, the H atom translational energy was well in excess
of the barrier height; nonetheless, it was found that excitation of the (001) state (predominantly
OH stretch) led to a 25 : 1 ratio of H vs. D transfer, while excitation of the (100) state
91
(predominately OD stretch) resulted in a 1 : 5.8 ratio favoring D transfer.8 Crim and co-workers
examined the same reaction at thermal collision energies, with the energy needed to drive
reaction coming mostly from excitation of HOD into either the OH stretch (004) or OD stretch
(500) overtones, which are similar in energy. Reaction occurred almost entirely by transferring
the H or D atom involved in the excited bond.11-13
In the neutral water experiments, it was not possible to excite pure bending vibrations,
but bend effects were investigated through stretch-bend combination excitations. For example,
Zare and co-workers examined the effect of bend excitation in the reaction of D2O + H, by
comparing the effects of exciting the (011) state (bend in combination with asymmetric stretch)
with those from asymmetric stretch excitation alone (001). They found that the additional energy
from the bend excitation had no effect,9 presumably because the bend motion is uncoupled to the
H transfer reaction coordinate. Similarly, Crim and co-workers studied the effects of overtone
combination excitations on the reaction of H2O with H and Cl.13, 15 The (003) (asym. str.) and
(022) (bend and asym. str.) overtone states are similar in energy. For reaction with both H and
Cl, the (003) excitation results in 3 - 4 times greater reactivity than the (022) excitation,
suggesting that bend excitation is significantly less effective than asymmetric stretch excitation.
On the other hand, in reaction with Cl, the (004) and (023) states, which are also nearly
isoenergetic, have similar reactivity, suggesting a comparable effect of bend and asymmetric
stretch excitation, at least for these very high levels of water vibrational excitation.
Using REMPI, it is possible to selectively, and independently, populate the fundamental
level of any of the three vibrational modes of HOD+,16 allowing us to examine the effects of
mode- and bond-specific excitation on ion-molecule reactions of water over a wide range of
collision energy. A major difference between neutral and ion reactions is that for ions, charge
delocalization leads to considerable stabilization of the region of the potential energy surface
where the reactants are close together. As a consequence, ion reactions tend not to have barriers
in excess of the endoergicity. In this paper, we report a guided ion beam study of the reaction of
92

mode-selectively excited HOD+ with CO2. The endoergic H+ and D+ transfer reactions are
analogous to the H/D transfer reactions observed in the neutral studies mentioned above, and
because the energy rises only as the products begin to separate, it is similar to a neutral reaction
with a late barrier, like HOD + H. A major difference is that there is also a potential energy well
corresponding to hydrogen-bonded reactants, which may have a significant effect on the
dynamics.
This reaction has been studied in Selected Ion Flow Tubes (SIFT) under thermal
conditions by Karpas et al.17 and Shul et al.1S. Karpas et al. observed no reaction, which is
reasonable given that both H+ and D+ transfer are endoergic. Shul et al. observed association to
form CO2(H2O)+, which is also reasonable, given the collisional stabilization possible in the SIFT.
H+ transfer is observed at thermal energies in ICR, due to the presence of vibrationally hot H2O+,
and this reaction used to monitor radiative decay.19 We are unaware of any previous beam
studies.
Experimental and Computational Methods
The guided ion beam tandem mass spectrometer used in this study has been described
previously, along with experimental and analysis protocols.20, 21 Helium is bubbled through a
50/50 mixture of H2O and D2O to generate 96% He with 4% water, half of which is HOD. HOD+
can be generated in selected vibrational states by REMPI through the C (1B1) state.16. In this
study, HOD+ was generated in the following states: (000), (001) - predominately OH stretch,
0.396 eV, (010) - bend, 0.153 eV, and (100) - predominately OD stretch, 0.293eV. The state
selection purity is near 100% for the OH and OD stretch modes, but only ~56% for the bend, with
the remaining 44% in produced in the ground state, as determined by photoelectron
spectroscopy.16 Because we also measure cross sections for the ground state reaction, the bend
cross sections can be corrected, and this has been done for all the results reported below.
93

Ionization occurred between a pair of planar electrodes, and the resulting ions were
injected into a quadrupole ion guide, which focused them into a quadrupole mass filter to remove
any fragment ions or H2O+/D2O+ ions produced in the REMPI process. A time-of-flight (TOF)
gating electrode pair at the end of this quadrupole mass filter was used to narrow the ion beam
kinetic energy spread, which was ~0.2 eV. The mass-, state-, and kinetic energy-selected primary
ions were injected into a system of 8-pole ion guides,22 the first of which guided the ions through
a 10 cm long scattering cell containing CO2 (Matheson, 99%) at 1 x 10⁻⁴ Torr. Unreacted HOD+
ions, together with product ions, were collected by the guide and passed into the second, longer
guide section for TOF velocity analysis, before being mass analyzed and detected. Products that
were backward-scattered in the laboratory frame were reflected at the entrance of the guide
system, and detected at long times, corresponding to apparent low velocities. Ions were counted
using a P7882 FAST ComTec multichannel scalar, controlled by a LabView program that cycled
through collision energies and masses of interest, and switched the target gas flow between the
scattering cell and chamber background. Integral cross sections were calculated from the ratio of
reactant and product ion intensities, corrected for ions formed outside the scattering cell, using the
calibrated effective length of the scattering cell and the pressure was measured with a capacitance
manometer.
TOF was used both to measure the energy of the reactant ion beam, as well as the axial
projection of the recoil velocity distribution of the products (vaxial). Several complete sets of cross
sections for both product channels were measured for all reactant states of HOD+ as a function of
collision energy, taking several days each. To avoid systematic errors comparing reactions of
different vibrational states, the ground state cross sections were collected every day as a check on
possible changes in instrument conditions. All measurements of the ground state cross sections
were within 10% of the average of the set, and therefore, all data sets were retained and averaged
to generate the data presented below. The standard deviation of cross section values over the set
of runs is ~20%, and is indicated by error bars in the figures. Note, however, that the run-to-run
94

variations include effects of systematic errors, such as changes in relative detection efficiency for
CO2H and CO2 D+ relative to HOD+, or pressure measurement errors. This type of error affects
both CO2H+ and CO2D+ identically, and thus does not influence the relative cross sections for the
two channels, thus we estimate that the relative error is about half what is indicated by the error
bars. To some extent, the same is true in comparing cross sections for different reactant states,
although in some cases, these were split across multiday data sets, and thus subject to the
systematic issues mentioned above. Therefore, we conservatively give the uncertainty in
comparing results for different vibrational states as 20%. This is also our best estimate for the
uncertainty in the absolute magnitude of the cross sections.
To map out the reaction coordinate, electronic structure calculations were performed at
several levels of theory using GAUSSIAN03.23 Geometries were optimized by calculating force
constants at every step. For the reactants, complexes, and product species, we also calculated the
structure and energies at the G3 level of theory. Because the PBE1PBE/6-311++G** level of
theory was found to be in reasonable agreement with experiment and with the G3 calculations, we
used this method in mapping out regions of the potential surface of interest for interpreting the
dynamics.
Results
Computational Results
The reaction coordinate in this system is shown in the inset to Figure 8.1, and the
computed energetics are summarized in Table 8.1. The energies shown in the figure are
experimental for the reactants and products,24 and the energy of the complex is from a G3
calculation, referenced to G3 calculations for the reactants. The complex has H2O+ hydrogen
bonded to O of CO2, with an OCO-H bond distance of 1.37 A and COH bond angle of 149.5°.
Note that the water moiety in the complex has HOH bond angle of 110.7o, and the length of the
OH bond involved in the hydrogen bond is 1.08 A. These values can be compared to the bond
95

angle (109.9°) and OH bond length (1.00 A) in free H2O+, calculated at the same level of theory.
In the CO2H+ product, the OCO-H distance is 0.98 A, and the COH angle is 120.4o. Because no
significant rearrangement is needed to form this complex from reactants, a barrier to complex
formation is not expected. Similarly, we would not expect a barrier separating the complex from
products, in excess of the endoergicity. These expectations are confirmed by potential energy
scans discussed below.
Integral Cross Sections
Product ions were observed at masses 47 and 48, corresponding to CO2H and CO2D+,
and the integral cross sections for both channels from reaction of ground state HOD+ are given in
Figure 8.1 over a center-of-mass (CM) collision energy (Ecol) range from 0.25 to 2.87 eV. The
reactions are:
HOD+ + CO2 ^ OCOH+ + OD (H+ transfer) ArH = 0.548 eV
^ OCOD+ + OH (D+ transfer) ArH = 0.561 eV
where the energetics for H+ transfer are experimental24 corrected to 0 K, and the D+ transfer value
is derived from the 0 K H+ transfer enthalpy using zero point energies calculated at the B3LYP/6-
311G(df,p) level, scaled by 1.0167.25
Given the Ecol distribution resulting from the energy spread of the ion beam (~0.2 eV),
and the thermal kinetic and rotational energy of the CO2 target, the threshold behavior of the
cross sections is consistent with the endoergicity of the reactions, indicating that there are no
barriers in excess of the product channel energy, as expected. The H+ and D+ transfer cross
sections both rise rapidly from threshold with nearly identical cross sections, but then plateau
above ~1 eV. In this high energy region, the CO2H+ signal is significantly higher than the CO2D+
signal, and the sum of the two cross sections, atotal, ranges from 15% to 23% of the collision cross
96

section, ocol. ocol was taken as the greater of either the ion-induced dipole capture cross section,
or the hard sphere cross section, and oHardsphere was estimated using the angle-averaged contact
distance and covalent radii. Over the plateau energy range from 1 eV to 3 eV, ocol ranges from 27
to 19 A .26
One interesting observation is that while the cross sections for CO2H+ and CO2D+ are
essentially superimposable in threshold region, the CO2H+ cross section is >30% larger than the
CO2D+ cross section at high Ecol. At high energies, effects from zero point energy differences
should be negligible, thus the difference must result from some kinematic/dynamic effect. One
such effect is common if the primary product is weakly bound, such that its survival depends on
its internal energy. In that case, there can be substantial isotope effects on the survival
probability, a good example of which is the branching between VH+ and VD+ channels in reaction
of V+ with HD at high Ecol.27 In the HOD+ + CO2 reaction, however, this effect is irrelevant
because there are no energetically accessible decomposition pathways for CO2H+ and CO2D+. A
related effect also seen in systems such as M + HD, is that angular momentum conservation
imposes greater restrictions on the MD + H channel, because the reduced mass of those products
is much lower than that for MH + D products. For the HOD+ + CO2 system, the difference in
reduced mass between the H+ and D+ transfer channels is only ~5% -- unlikely to result in a 30%
difference in cross section.
In a statistical mechanism, product branching tends to favor product channels with higher
densities-of-state (DOS), all else being equal. Such DOS effects are unlikely to be important at
high energies, where the mechanism is clearly direct. Nonetheless, we used the direct state count
algorithm in the Rice-Ramsperget-Kassel-Marcus (RRKM) program of Zhu and Hase28 to
calculate the DOS for the CO2D+ + OH and CO2H+ + OD channels at 2 eV. Both sets of products
have both OH and OD stretch modes. However, the CO2D+ + OH products also have OD bend
modes with lower frequencies than the analogous OH bend modes in CO2H+ + OD. As a result,
97
the DOS for the CO2D+ + OH channel is ~7% higher than that for CO2H+ + OH channel, contrary
to observation.
Note that the two channels have essentially identical rapidly rising cross sections below
~1 eV, at which point the CO2 D+ channel abruptly stops rising, becoming nearly Ecol independent.
The CO2H+ cross section continues to rise to ~1.5 eV, at which point it also plateaus. This Ecol
dependence suggests that the H+ and D+ transfer reach some kind of high energy limiting
behavior, and that the limit is reached sooner for CO2D+ , compared to CO2H+. In the limit of
spectator stripping dynamics (see Levine29), the relevant interaction is between OCO and either
an H or D atom on HOD+. In this limit, the effective collision energy of OCO-D is nearly twice as
great as for OCO-H. Thus, one might expect the CO2 D+ channel to reach its high energy limit at
lower Ecol than the CO2H+ channel. On the other hand, the recoil dynamics, see below, while
direct, are nowhere near the spectator stripping limit at Ecol = 1 - 1.5 eV. Most likely, the unequal
CO2H+/CO2D+ branching is related to the details of how the system gets through the critical part
of the potential energy surface, and mass effects on this kind of dynamics are not unexpected. For
example, the skew angle of the mass-weighted potential surface29 is somewhat smaller for CO2H+
(15.8°) than for CO2D+ (22.3°). This issue will be one target of detailed quasiclassical trajectory
study that we are beginning.
Recoil Velocity Distributions
The lab frame vaxial distributions for the CO2H+ and CO2D+ product ions from reaction of
ground state HOD+ are given in Figures 8.2 and 8.3, respectively. The solid vertical line in each
figure shows the velocity of the CM frame with respect to the lab, <VCM>, averaged over the
distributions of reactant velocities. vaxial distributions are simply projections of the full recoil
velocity distributions on the ion guide axis. Because our experiment is axially symmetric, the lab
frame vaxial distributions are related to the CM frame distributions by simple subtraction of
<VCM>, i.e., vaxial greater than <VCM> corresponds to forward scattering and vaxial less than <VCM>
98
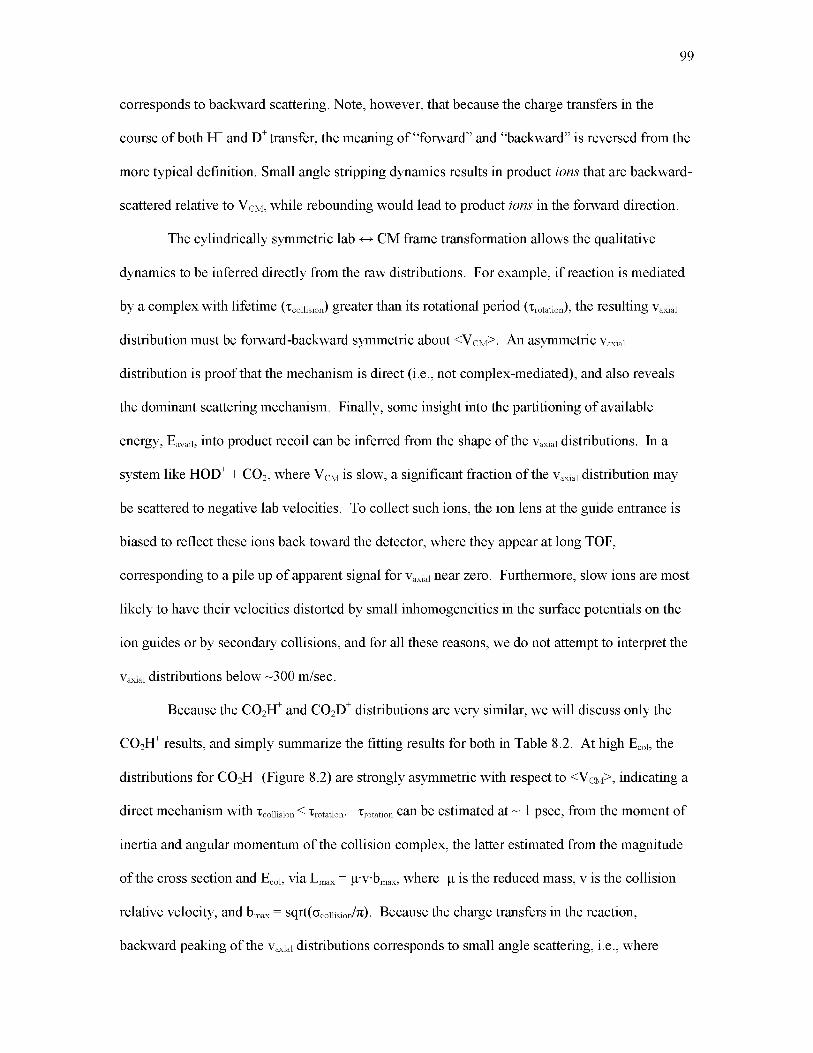
corresponds to backward scattering. Note, however, that because the charge transfers in the
course of both H+ and D+ transfer, the meaning of “forward” and “backward” is reversed from the
more typical definition. Small angle stripping dynamics results in product ions that are backward-
scattered relative to VCM, while rebounding would lead to product ions in the forward direction.
The cylindrically symmetric lab ^ CM frame transformation allows the qualitative
dynamics to be inferred directly from the raw distributions. For example, if reaction is mediated
by a complex with lifetime (t^ u ) greater than its rotational period (t, - ^ ^ , the resulting vaxial
distribution must be forward-backward symmetric about <VCM>. An asymmetric vaxial
distribution is proof that the mechanism is direct (i.e., not complex-mediated), and also reveals
the dominant scattering mechanism. Finally, some insight into the partitioning of available
energy, Eavail, into product recoil can be inferred from the shape of the vaxial distributions. In a
system like HOD+ + CO2, where VCM is slow, a significant fraction of the vaxial distribution may
be scattered to negative lab velocities. To collect such ions, the ion lens at the guide entrance is
biased to reflect these ions back toward the detector, where they appear at long TOF,
corresponding to a pile up of apparent signal for vaxial near zero. Furthermore, slow ions are most
likely to have their velocities distorted by small inhomogeneities in the surface potentials on the
ion guides or by secondary collisions, and for all these reasons, we do not attempt to interpret the
vaxial distributions below ~300 m/sec.
Because the CO2H+ and CO2D+ distributions are very similar, we will discuss only the
CO2H+ results, and simply summarize the fitting results for both in Table 8.2. At high Ecol, the
distributions for CO2H+ (Figure 8.2) are strongly asymmetric with respect to <VCM>, indicating a
direct mechanism with t^ u < t, ^ ^ . t^ ^ can be estimated at ~ 1 psec, from the moment of
inertia and angular momentum of the collision complex, the latter estimated from the magnitude
of the cross section and Ecol, via Lmax = ^-v-bmax, where ^ is the reduced mass, v is the collision
relative velocity, and bmax = sqrtfacdHs^/n). Because the charge transfers in the reaction,
backward peaking of the vaxial distributions corresponds to small angle scattering, i.e., where
99
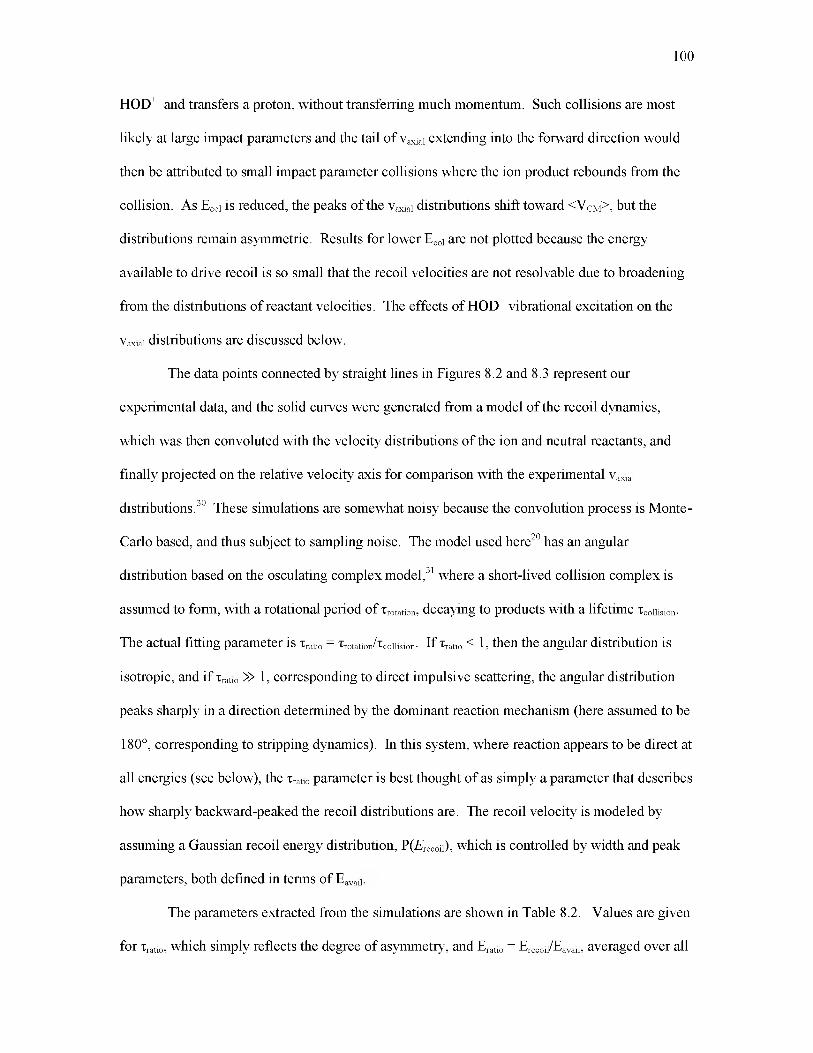
HOD+ and transfers a proton, without transferring much momentum. Such collisions are most
likely at large impact parameters and the tail of vaxial extending into the forward direction would
then be attributed to small impact parameter collisions where the ion product rebounds from the
collision. As Ecol is reduced, the peaks of the vaxial distributions shift toward <VCM>, but the
distributions remain asymmetric. Results for lower Ecol are not plotted because the energy
available to drive recoil is so small that the recoil velocities are not resolvable due to broadening
from the distributions of reactant velocities. The effects of HOD+ vibrational excitation on the
vaxial distributions are discussed below.
The data points connected by straight lines in Figures 8.2 and 8.3 represent our
experimental data, and the solid curves were generated from a model of the recoil dynamics,
which was then convoluted with the velocity distributions of the ion and neutral reactants, and
finally projected on the relative velocity axis for comparison with the experimental vaxial
distributions.30 These simulations are somewhat noisy because the convolution process is Monte-
Carlo based, and thus subject to sampling noise. The model used here20 has an angular
distribution based on the osculating complex model,31 where a short-lived collision complex is
assumed to form, with a rotational period of Tr^m, decaying to products with a lifetime T^mam.
The actual fitting parameter is Tratio = T ikm/Tc Hs™. If Tratio < 1, then the angular distribution is
isotropic, and if Tratio >> 1, corresponding to direct impulsive scattering, the angular distribution
peaks sharply in a direction determined by the dominant reaction mechanism (here assumed to be
180°, corresponding to stripping dynamics). In this system, where reaction appears to be direct at
all energies (see below), the Tratro parameter is best thought of as simply a parameter that describes
how sharply backward-peaked the recoil distributions are. The recoil velocity is modeled by
assuming a Gaussian recoil energy distribution, PCE^cdO, which is controlled by width and peak
parameters, both defined in terms of Eavail.
The parameters extracted from the simulations are shown in Table 8.2. Values are given
for Tratio, which simply reflects the degree of asymmetry, and Eratio = Erecoil/Eavail, averaged over all
100
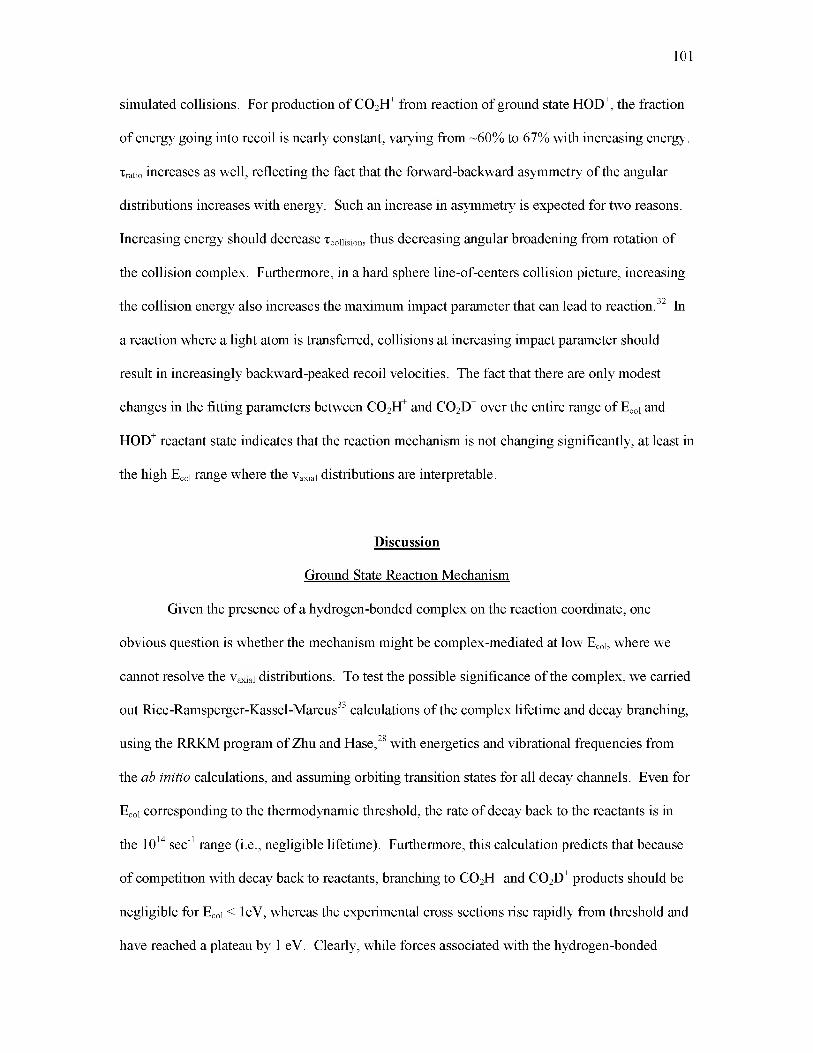
simulated collisions. For production of CO2H+ from reaction of ground state HOD+, the fraction
of energy going into recoil is nearly constant, varying from ~60% to 67% with increasing energy.
Tratio increases as well, reflecting the fact that the forward-backward asymmetry of the angular
distributions increases with energy. Such an increase in asymmetry is expected for two reasons.
Increasing energy should decrease xcollision, thus decreasing angular broadening from rotation of
the collision complex. Furthermore, in a hard sphere line-of-centers collision picture, increasing
the collision energy also increases the maximum impact parameter that can lead to reaction.32 In
a reaction where a light atom is transferred, collisions at increasing impact parameter should
result in increasingly backward-peaked recoil velocities. The fact that there are only modest
changes in the fitting parameters between CO2H+ and CO2D+ over the entire range of Ecol and
HOD+ reactant state indicates that the reaction mechanism is not changing significantly, at least in
the high Ecol range where the vaxial distributions are interpretable.
Discussion
Ground State Reaction Mechanism
Given the presence of a hydrogen-bonded complex on the reaction coordinate, one
obvious question is whether the mechanism might be complex-mediated at low Ecol, where we
cannot resolve the vaxial distributions. To test the possible significance of the complex, we carried
out Rice-Ramsperger-Kassel-Marcus33 calculations of the complex lifetime and decay branching,
using the RRKM program of Zhu and Hase,28 with energetics and vibrational frequencies from
the ab initio calculations, and assuming orbiting transition states for all decay channels. Even for
Ecol corresponding to the thermodynamic threshold, the rate of decay back to the reactants is in
the 1014 sec-1 range (i.e., negligible lifetime). Furthermore, this calculation predicts that because
of competition with decay back to reactants, branching to CO2H+ and CO2D+ products should be
negligible for Ecol < 1eV, whereas the experimental cross sections rise rapidly from threshold and
have reached a plateau by 1 eV. Clearly, while forces associated with the hydrogen-bonded
101

102
potential well may affect the scattering dynamics, the complex itself is insignificant from a
mechanistic perspective. Reaction is direct at all energies.
Vibrational Mode Effects
The cross sections for CO2 H+ and CO2 D+ production for the four different HOD+ reactant
states are plotted as a function of Ecol in Figure 8.4, and as a function of total energy (Etotal ~ Ecol +
EvftratimO in Figure 8.5. We omit rotational energy from Etotal, because the HOD+ has negligible
rotational energy (low J selected by REMPI), and the contribution from CO2 thermal rotational
energy is small (~25 meV) and independent of HOD+ state.
First, consider the plots vs. Ecol in Figure 8.4. Here, exciting HOD+ vibration increases
the total energy available to reactants, thus it is not surprising that all modes of HOD+ excitation
enhance both reactions at low Ecol, where much of the available energy is needed to overcome the
endoergicity. It is clear, however, that the enhancement is mode-specific. As shown in the top
frame of the figure, bend excitation (Evib=153 meV) results in an enhancement for the CO2H+
channel greater than that from the OD stretch (293 meV), and nearly as large as that from the OH
stretch (396 meV). The vibrational effects are biggest in the threshold energy range, peaking
around Ecol =1 eV. At higher energies, where Ecol effects are small, the OH stretch and bend, but
not the OD stretch, continue to have substantial effects, even though the vibrational contribution
to the total energy becomes negligible. The CO2D+ cross sections, shown in the bottom frame,
are qualitatively similar to those for CO2 H+ with two exceptions. For CO2 D+, it is the OD stretch
that gives the largest enhancement, and the OH stretch is now the least effective. The bend still
has a large enhancing effect, almost as big as that of the OD stretch.
The plots as a function of Etotal in Figure 8.5 allow direct comparison of the effects of
partitioning the available energy into Ecol and different modes of HOD+ vibration. Note that for
both CO2 H+ and CO2 D+, the four reactant states have similar cross sections in the energy range
close to the threshold energy. This indicates, not surprisingly, that all forms of energy are at least
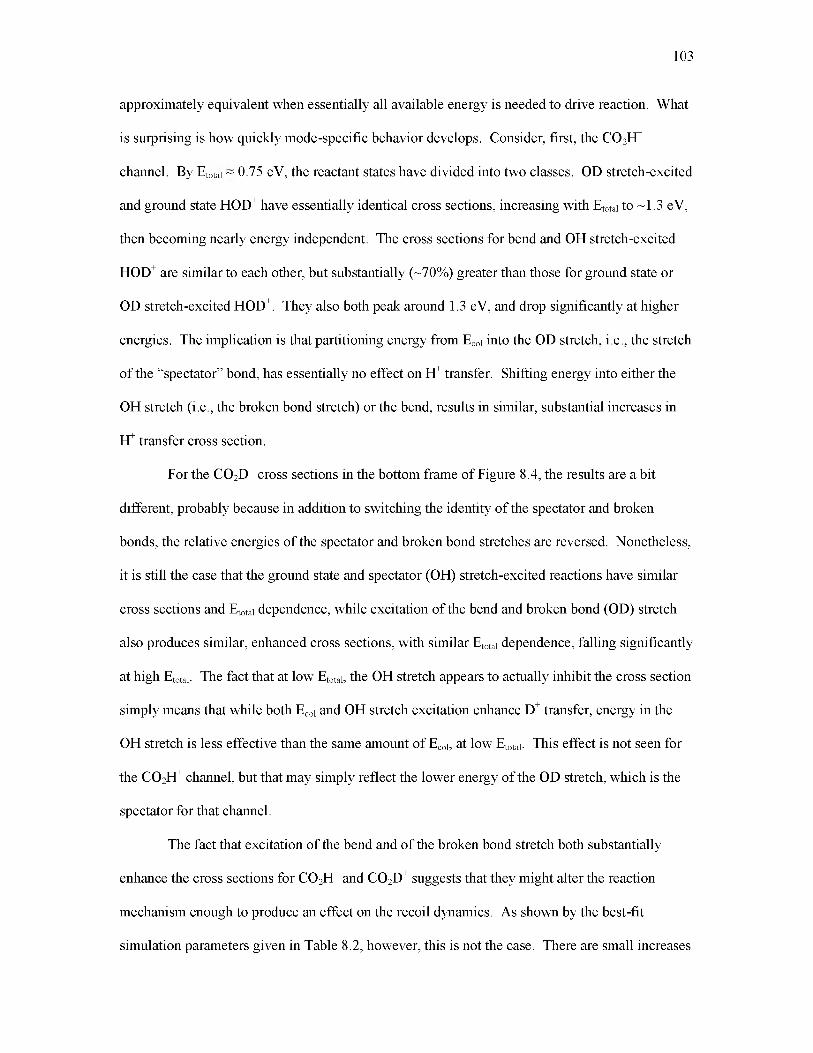
approximately equivalent when essentially all available energy is needed to drive reaction. What
is surprising is how quickly mode-specific behavior develops. Consider, first, the CO2H+
channel. By Etotal ~ 0.75 eV, the reactant states have divided into two classes. OD stretch-excited
and ground state HOD+ have essentially identical cross sections, increasing with Etotal to ~1.3 eV,
then becoming nearly energy independent. The cross sections for bend and OH stretch-excited
HOD+are similar to each other, but substantially (~70%) greater than those for ground state or
OD stretch-excited HOD+. They also both peak around 1.3 eV, and drop significantly at higher
energies. The implication is that partitioning energy from Ecol into the OD stretch, i.e., the stretch
of the “spectator” bond, has essentially no effect on H+ transfer. Shifting energy into either the
OH stretch (i.e., the broken bond stretch) or the bend, results in similar, substantial increases in
H+ transfer cross section.
For the CO2D+ cross sections in the bottom frame of Figure 8.4, the results are a bit
different, probably because in addition to switching the identity of the spectator and broken
bonds, the relative energies of the spectator and broken bond stretches are reversed. Nonetheless,
it is still the case that the ground state and spectator (OH) stretch-excited reactions have similar
cross sections and Etotal dependence, while excitation of the bend and broken bond (OD) stretch
also produces similar, enhanced cross sections, with similar Etotal dependence, falling significantly
at high Etotal. The fact that at low Etotal, the OH stretch appears to actually inhibit the cross section
simply means that while both Ecol and OH stretch excitation enhance D+ transfer, energy in the
OH stretch is less effective than the same amount of Ecol, at low Etotal. This effect is not seen for
the CO2H+ channel, but that may simply reflect the lower energy of the OD stretch, which is the
spectator for that channel.
The fact that excitation of the bend and of the broken bond stretch both substantially
enhance the cross sections for CO2H+ and CO2D+ suggests that they might alter the reaction
mechanism enough to produce an effect on the recoil dynamics. As shown by the best-fit
simulation parameters given in Table 8.2, however, this is not the case. There are small increases
103

in the amount of recoil energy, but the fraction Eavail going into recoil (Eratio) is independent of
HOD+ state within the experimental uncertainty, as is the degree of forward-backward asymmetry
(Tratio).
It is not surprising that OD stretch excitation enhances CO2D+ production, and OH stretch
excitation enhances CO2H+ production, because these vibrations stretch the bond that must break.
Polanyi and co-workers investigated the effects of barrier position on the relative effects from Ecol
and stretching vibration in model A + BC systems, and predicted that for late barriers, energy in
the BC stretch should be more effective than Ecol, because the momentum associated with the
bend was along the right coordinate to drive the system over the barrier.34, 35 An endoergic
reaction, like HOD+ + CO2, has a late barrier in the sense that energy rises only as the system
moves into the product channel. Because the barrier is related to breaking an OH or OD bond,
stretch excitation of that bond clearly corresponds to momentum in the right coordinate to help
drive the system up the potential slope leading to products, and thus is consistent with the
“Polanyi rule”. The observation that excitation of the spectator bond has little effect on reactivity
is also consistent with this argument, because the spectator stretch is essentially orthogonal to the
coordinate required to drive the reaction. Similar arguments can be made for the H/D transfer
reaction studies from neutral HOD by the Zare and Crim groups.10, 15
In this context, the large effect of the bend is quite surprising. As shown in the bottom
frame of Figure 8.5, which plots ototal vs. Etotal for the four reactant states, the effect of the bend is
larger than those from either of the stretch modes, because it enhances both H+ and D+ transfer.
As discussed in the Introduction, experiments on neutral water found no effect of bend excitation
for some combination states, but at very high levels of water vibrational excitation, the effects of
energy in the bend and asymmetric stretch overtones was comparable.9, 15
The “Polanyi rule” predicting vibrational enhancement in late barrier A + BC reactions is,
essentially, based on considering the momentum associated with the stretching vibration, which is
in the correct coordinate to help surmount the barrier. In polyatomic reactions, modes that might
104

105
at first appear to be unrelated to the reaction coordinate may actually be strongly coupled if they
distort one of the reactants toward a more product-like geometry. For example, the reactions
H2CO+ + CH4 ^ H2COH+ + CH3,36 and C2H2+ + CH4 ^ C2H3+ + CH3,20 are strong enhanced by
excitation of bending modes that might seem irrelevant to breaking methane CH bonds. In the
first case, it is the low frequency methane bending modes that have a large effect, and the
coupling results from the fact that the CH3 product is planar, and thus distortion of the CH4 is a
necessary part of the reaction coordinate. In the second case, it is the cis-bend of C2H2+ that
greatly enhances H transfer, but again, because the product (C2H3 ) requires bending and
rehybridization at the carbon center(s) where the H attaches, the cis-bend is clearly coupled to the
H-transfer reaction coordinate. In both systems, we were able to use detailed analysis of quasi-
classical trajectories to identify and project out the important coordinates on the 21 dimensional
potential surfaces, constructing reduced surfaces where the bending dynamics are seen to drive
transition to products.37, 38 When trajectories are projected onto these reduced surfaces, they are
quite reminiscent of late barrier “Polanyi rule” behavior.
For H2O+ + CO2 ^ CO2 H + OH, this approach seems inapplicable, because the reaction
eliminates the bend coordinate. One might expect that H2O+ bending excitation would simply
carry over into rotation of the products, and there is no reason to expect this effect to enhance
reactivity. We intend to carry out a detailed trajectory analysis of this system, but for the present,
we offer the following speculation about the bend enhancement.
“Polanyi rules” are based on an essentially kinematic approach to thinking about the
problem, where vibration puts momentum into the correct coordinate to carry the system over a
barrier, or through some bottleneck on the potential energy surface. Another approach is to
consider the effects of the vibrationally-induced molecular distortions on the shape of the
potential energy surface. This approach is applicable to fast (i.e., high energy) collisions, where
the collision time is short compared to the vibrational period (~53 fsec for the HOD+ bend). For
comparison, the final column in Table 8.2 gives Tfyby, which is intended as an estimate of the total
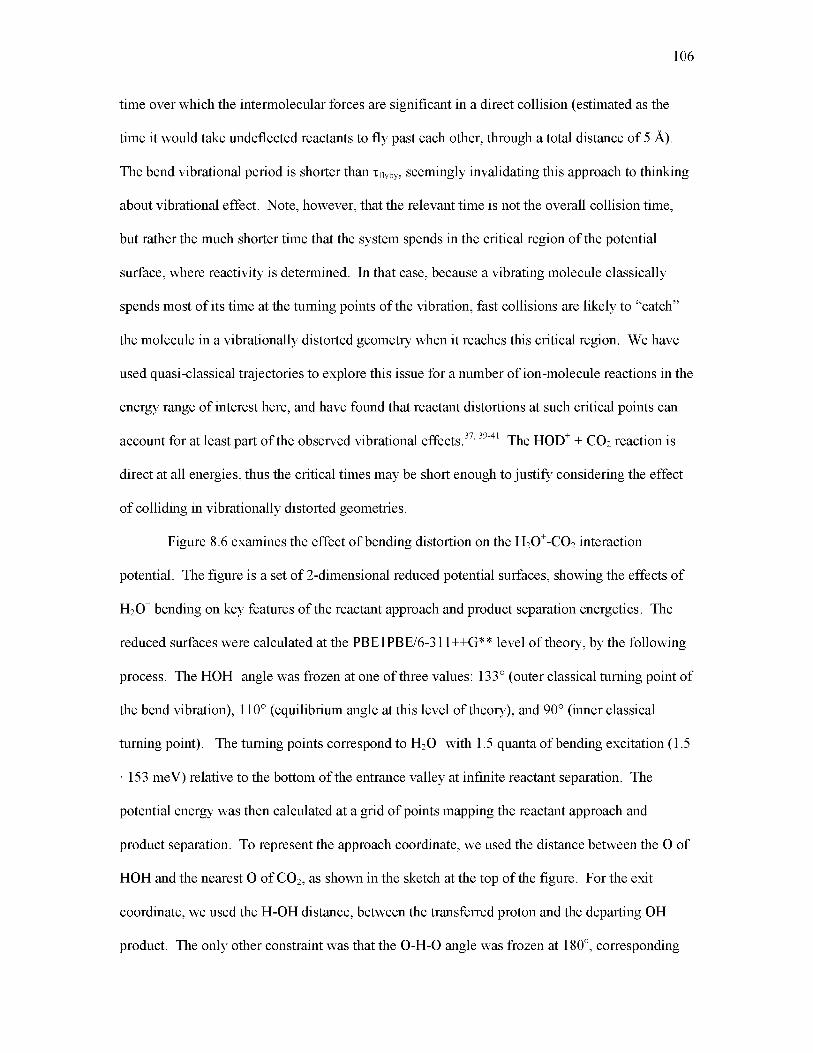
106
time over which the intermolecular forces are significant in a direct collision (estimated as the
time it would take undeflected reactants to fly past each other, through a total distance of 5 A).
The bend vibrational period is shorter than Tfyby, seemingly invalidating this approach to thinking
about vibrational effect. Note, however, that the relevant time is not the overall collision time,
but rather the much shorter time that the system spends in the critical region of the potential
surface, where reactivity is determined. In that case, because a vibrating molecule classically
spends most of its time at the turning points of the vibration, fast collisions are likely to “catch”
the molecule in a vibrationally distorted geometry when it reaches this critical region. We have
used quasi-classical trajectories to explore this issue for a number of ion-molecule reactions in the
energy range of interest here, and have found that reactant distortions at such critical points can
account for at least part of the observed vibrational effects.37, 39-41 The HOD+ + CO2 reaction is
direct at all energies, thus the critical times may be short enough to justify considering the effect
of colliding in vibrationally distorted geometries.
Figure 8.6 examines the effect of bending distortion on the H2O+-CO2 interaction
potential. The figure is a set of 2-dimensional reduced potential surfaces, showing the effects of
H2O+ bending on key features of the reactant approach and product separation energetics. The
reduced surfaces were calculated at the PBE1PBE/6-311++G** level of theory, by the following
process. The HOH+ angle was frozen at one of three values: 133° (outer classical turning point of
the bend vibration), 110° (equilibrium angle at this level of theory), and 90° (inner classical
turning point). The turning points correspond to H2O+ with 1.5 quanta of bending excitation (1.5
• 153 meV) relative to the bottom of the entrance valley at infinite reactant separation. The
potential energy was then calculated at a grid of points mapping the reactant approach and
product separation. To represent the approach coordinate, we used the distance between the O of
HOH and the nearest O of CO2, as shown in the sketch at the top of the figure. For the exit
coordinate, we used the H-OH distance, between the transferred proton and the departing OH
product. The only other constraint was that the O-H-O angle was frozen at 180o, corresponding

to the minimum energy path, where there is an attractive hydrogen bonding interaction between
approaching reactants (HO-H--OCO) and separating products (HO—H-OCO). All other
coordinates were optimized at each point, so that these surfaces, in essence, show the minimum
energy paths for reaction under the constraint of fixed HOH bend angles. Along the reactant
approach, it turns out that the OCO-HO axis is near linear, as shown in the sketch above the
entrance valley, but during the product separation, the transferred proton is most stable at an
angle of ~120° with respect to the OCO axis, similar to the equilibrium geometry of the CO2H+
product (see sketch above the exit valley).
There are two effects evident from this analysis. Fixing the bend angle at the turning
point raises the energy of the entrance valley by the value of the vibrational quantum, but because
the bend coordinate correlates to rotation of the products, there is almost no effect of this angle
constraint on the product channel. In effect, therefore, the vibrational distortion reduces the
effective endoergicity of the reaction. Note however, that the same argument could be made for
excitation of the stretch of the broken bond, because this mode correlates to translation in the
products. On the other hand, if the spectator bond stretch remains as stretching excitation of the
OH product, then the effective endoergicity would actually increase slightly, because the energy
of the isolated OH stretch is ~67 meV higher in energy than the OH stretch in H2O+.
Given that bend excitation has a larger effect on total reactivity than either stretch,
despite being the lowest energy mode, it seems that there must be an additional factor at work.
One obvious possibility is a change in the shape of the potential in the vicinity of the repulsive
wall, that might tend to increase the probability that the system exits the collision into the product
valley. Note that with the bend angle frozen at the outer turning point, the energy rises more
slowly (i.e., the forces are weaker) as the system moves into the product channel, compared the
situation for the equilibrium bend angle. The same effect occurs, but to a lesser extent, when the
bend angle is at the inner turning point. We might anticipate that this change in potential shape
might the probability of exiting to products.
107

This analysis is speculative because reactions, particularly at high Ecol, do not tend to
follow the minimum energy path, and thus it is quite possible that some other feature of the
potential surface, not observable along the minimum energy path, is actually responsible for the
bend enhancement. This kind of effect is a natural target for analysis by quasi-classical
trajectories, which sample the actual reaction paths. Such a study is planned.
Conclusions
We have presented a detailed study of the reaction of mode/bond-selectively excited
HOD+ with CO2. Excitation in the OH stretch (001) mode substantially enhances H+ transfer,
with greater efficiency than Ecol, but has little effect on the D+ transfer reaction. Conversely, OD
stretch (100) excitation enhances D+ transfer, but has little effect on H+ transfer. Surprisingly,
excitation of the HOD+ bend (010) enhances both channels with high efficiency, such that the
bend has the largest overall effect. The stretch effects can be rationalized in terms similar to
those introduced by Polanyi for late barrier A + BC reactions. The bend and breaking bond
stretch effects may also be at least partly attributable to the fact that these vibrational modes are
absent in the product, so that excitation energy in those modes effectively lowers the endoergicity
of the reaction. In addition, however, there appear to be effects of bend distortion on the shape of
the potential energy surface that may help promote transition from reactants into the product
valley.
108
Acknowledgments
This work was supported by a grant from the Chemistry Division of the National Science
Foundation (CHE-0647124)

109
References
1. G. Herzberg, Ann. Geophys. 36, 605 (1980).
2. W. T. Huntress, Jr., Astrophys. J., Suppl. Ser. 33 (4), 495 -514 (1977).
3. R. A. Morris, A. A. Viggiano, J. M. V. Doren and J. F. Paulson, J. Phys. Chem. 96, 3051(1992).
4. P. Gammelgaard and B. Thomsen, Astron.Astrophys. 197, 320 (1988).
5. M. E. Brown, A. H. Bouchez, H. Spinrad and C. M. Johns-Krull, Astron.Astrophys. 301, L1 (1995).
6. H. Balsiger, K. Altwegg, F. Buehler, J. Geiss, A. G. Ghielmetti, B. E. Goldstein, R. Goldstein, W. T. Huntress and W. H. Ip, Nature London 321, 330 (1986).
7. K. Jockers, T. Credner and T. Bonev, Astronomy and Astrophysics 335, L56 (1998).
8. M. J. Bronikowski, W. R. Simpson, B. Girard and R. N. Zare, J. Chem. Phys. 95, 8648 (1991).
9. M. J. Bronikowski, W. R. Simpson and R. N. Zare, J. Phys. Chem. 97, 2204 (1993).
10. M. J. Bronikowski, W. R. Simpson and R. N. Zare, J. Phys. Chem. 97, 2194 (1993).
11. A. Sinha, M. C. Hsiao and F. F. Crim, J. Chem. Phys. 92, 6333 (1990).
12. A. Sinha, M. C. Hsiao and F. F. Crim, J. Chem. Phys. 92, 6337 (1990).
13. A. Sinha, M. C. Hsiao and F. F. Crim, J. Chem. Phys. 94, 4928 (1991).
14. D. H. Zhang, M. A. Collins and S.-Y. Lee, Science 290, 961 (2000).
15. J. D. Thoemke, J. M. Pfeiffer, R. B. Metz and F. F. Crim, J. Phys. Chem. 99, 13748 (1995).
16. B. W. Uselman, J. M. Boyle and S. L. Anderson, Chem. Phys. Lett. 440, 171 (2007).
17. Z. Karpas and J. W. T. Huntress, Chem. Phys. Lett. 59, 87 -89 (1978).
18. R. J. Shul, R. Passarella, L. T. DiFazio, Jr., R. G. Keesee and A. W. Castleman, Jr., J. Phys. Chem. 92, 4947-4951 (1988).
19. M. Heninger, J. Lemaire, G. Mauclaire, S. Fenistein, S. Jullien and M. R., Journal of Chemical Physics 101 (3), 1923-1929 (1994).
20. Y.-H. Chiu, H. Fu, J.-T. Huang and S. L. Anderson, J. Chem. Phys. 102, 1199 -1216 (1995).
21. J. Liu, B. W. Uselman, B. Van Devener and S. L. Anderson, Phys. Chem. Chem. Phys. 8, 4575 (2006).
110
22. D. Gerlich, Adv. Chem. Phys. 82, 1 (1992).
23. M. J. Frisch, G. W. Trucks, H. B. Schlegel, G. E. Scuseria, M. A. Robb, J. R. Cheeseman, J. J. A. Montgomery, T. Vreven, K. N. Kudin, J. C. Burant, J. M. Millam, S. S. Iyengar,J. Tomasi, V. Barone, B. Mennucci, M. Cossi, G. Scalmani, N. Rega, G. A. Petersson, H. Nakatsuji, M. Hada, M. Ehara, K. Toyota, R. Fukuda, J. Hasegawa, M. Ishida, T. Nakajima, Y. Honda, O. Kitao, H. Nakai, M. Klene, X. Li, J. E. Knox, H. P. Hratchian, J. B. Cross, C. Adamo, J. Jaramillo, R. Gomperts, R. E. Stratmann, O. Yazyev, A. J. Austin, R. Cammi, C. Pomelli, J. W. Ochterski, P. Y. Ayala, K. Morokuma, G. A. Voth, P. Salvador, J. J. Dannenberg, V. G. Zakrzewski, S. Dapprich, A. D. Daniels, M. C. Strain, O. Farkas, D. K. Malick, A. D. Rabuck, K. Raghavachari, J. B. Foresman, J. V. Ortiz, Q. Cui, A. G. Baboul, S. Clifford, J. Cioslowski, B. B. Stefanov, G. Liu, A. Liashenko, P. Piskorz, I. Komaromi, R. L. Martin, D. J. Fox, T. Keith, M. A. Al-Laham, C. Y. Peng, A. Nanayakkara, M. Challacombe, P. M. W. Gill, B. Johnson, W. Chen, M. W. Wong, C. Gonzalez and J. A. Pople, (Gaussian, Inc., Pittsburgh PA, 2003).
24. S. G. Lias, in NIST Standard Reference Database Number 69, edited by P. J. Linstrom and W. G. Mallard (National Institute of Standards and Technology, Gaithersburg, MD, 2003), pp. http://webbook.nist.gov.
25. A. P. Scott and L. Radom, J. Phys. Chem. 100, 16502 (1996).
26. W. M. Hayne, Handbook o f Chemistry and Physics, 91 ed. (CRC Press/Taylor and Francis, Boca Raton, FL, 2004).
27. J. L. Elkind and P. B. Armentrout, J. Phys. Chem. 89, 5626 (1985).
28. L. Zhu and W. L. Hase, in Quamtum Chemistry Program Exchange (Chemistry Department, Indiana University Bloomington, 1993).
29. R. D. Levine, Molecular Reaction Dynamics. (Cambridge U. Pr., Cambridge, 2005).
30. J. Liu, B. Van Devener and S. L. Anderson, J. Chem. Phys. 116, 5530 (2002).
31. G. A. Fisk, J. D. McDonald and D. R. Herschbach, Discuss. Faraday Soc. 44, 228 (1967).
32. R. D. Levine and R. B. Bernstein, Molecular Reaction Dynamics and Chemical Reactivity. (Oxford University Press, New York, 1987).
33. W. Forst, Theory o f Unimolecular Reactions. (Academic Press, New York, 1973).
34. M. H. Mok and J. C. Polanyi, J. Chem. Phys. 51, 1451 (1969).
35. J. C. Polanyi and W. H. Wong, J. Chem. Phys. 51, 1439 (1969).
36. J. Liu, B. V. Devener and S. L. Anderson, J. Chem. Phys. 119, 200 (2003).
37. J. Liu, K. Song, W. L. Hase and S. L. Anderson, J. Am. Chem. Soc. 126, 8602 (2004).
38. J. Liu and S. L. Anderson, Phys. Chem. Chem. Phys. 11, 8721 (2009).
39. J. Liu, K. Song, W. L. Hase and S. L. Anderson, J. Chem. Phys. 119, 3040 (2003).

111
40. J. Liu, K. Song, W. L. Hase and S. L. Anderson, J. Phys. Chem. A 109, 11376 (2005).
41. J. Liu, B. W. Uselman, J. M. Boyle and S. L. Anderson, J. Chem. Phys. 125, 133111 (2006).
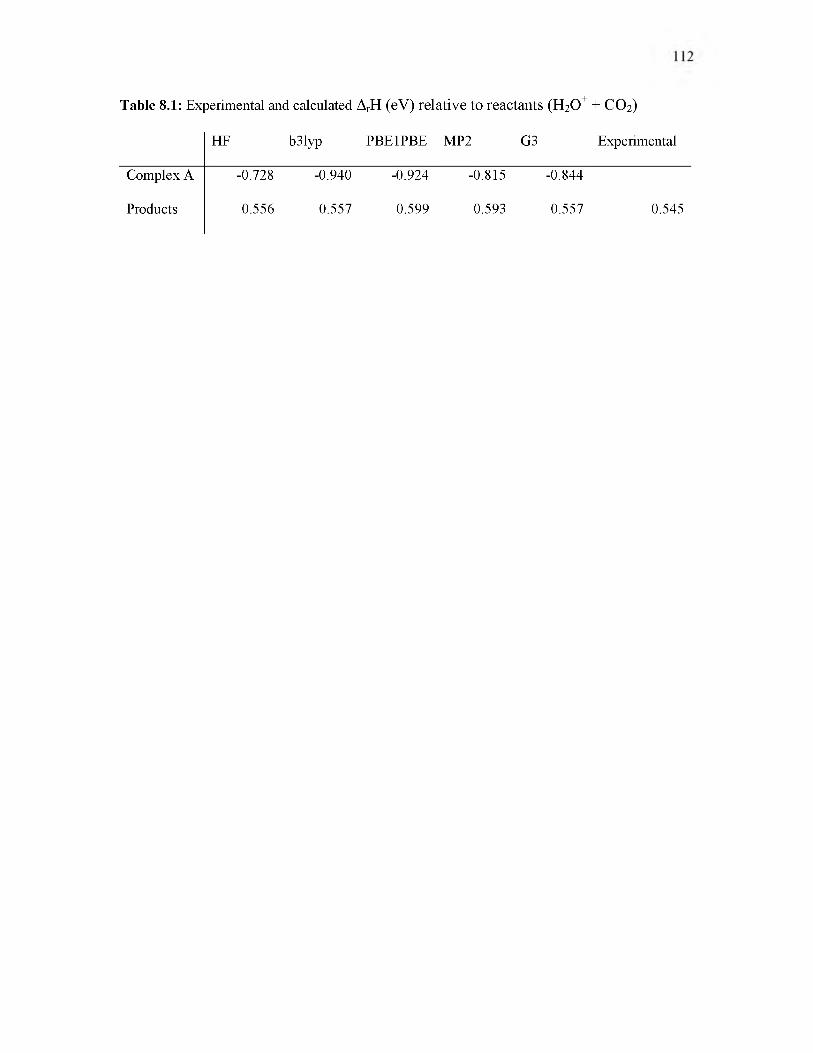
Table 8.1: Experimental and calculated ArH (eV) relative to reactants (H2O+ + CO2)
HF b3lyp PBE1PBE MP2 G3 Experimental
Complex A -0.728 -0.940 -0.924 -0.815 -0.844
Products 0.556 0.557 0.599 0.593 0.557 0.545

113
Table 8.2: Product ion velocity distribution fit results
CO2H+ (000) (001) (100) (010)
Ecol F aEratio bTratio Ecol Eratio Tratio Ecol Eratio Tratio Ecol Eratio Tratio Tflyby
0.63 60.1 3 0.63 60.1 3 0.63 59.9 3 0.63 59.7 3 164
0.98 63.8 4.5 0.98 63.7 4.5 0.98 63.6 4.5 0.98 64.0 4.5 137
1.48 66.9 7 1.48 67.0 7 1.48 66.2 5 1.48 67.0 5 113
1.87 69.8 9 1.87 67.0 8 1.87 67.0 8 1.87 67.0 8 97
2.87 67.0 12 2.87 67.0 12 2.87 67.0 12 2.87 67.1 12 79
CO2D+ (000) (001) (100) (010)
Ecol Eratio Tratio Ecol Eratio Tratio Ecol Eratio Tratio Ecol Eratio Tratio
0.63 60.0 3 0.63 60.1 3 0.63 60.0 3 0.63 60.1 3
0.98 64.1 4.5 0.98 64.0 4.5 0.98 63.7 4.5 0.98 63.8 4.5
1.48 67.0 7 1.48 67.0 5 1.48 67.0 7 1.48 67.1 5
1.87 67.0 9 1.87 67.0 8 1.87 67.0 8 1.87 67.0 8
2.87 67.1 12 2.87 67.1 12 2.87 67.1 12 2.87 67.0 12
a Eratio = <Erecoil>/<Eavail> = average fraction of available energy in recoil
b Tratio = measure of forward-backward asymmetry. Increasing values indicate increasing
asymmetry
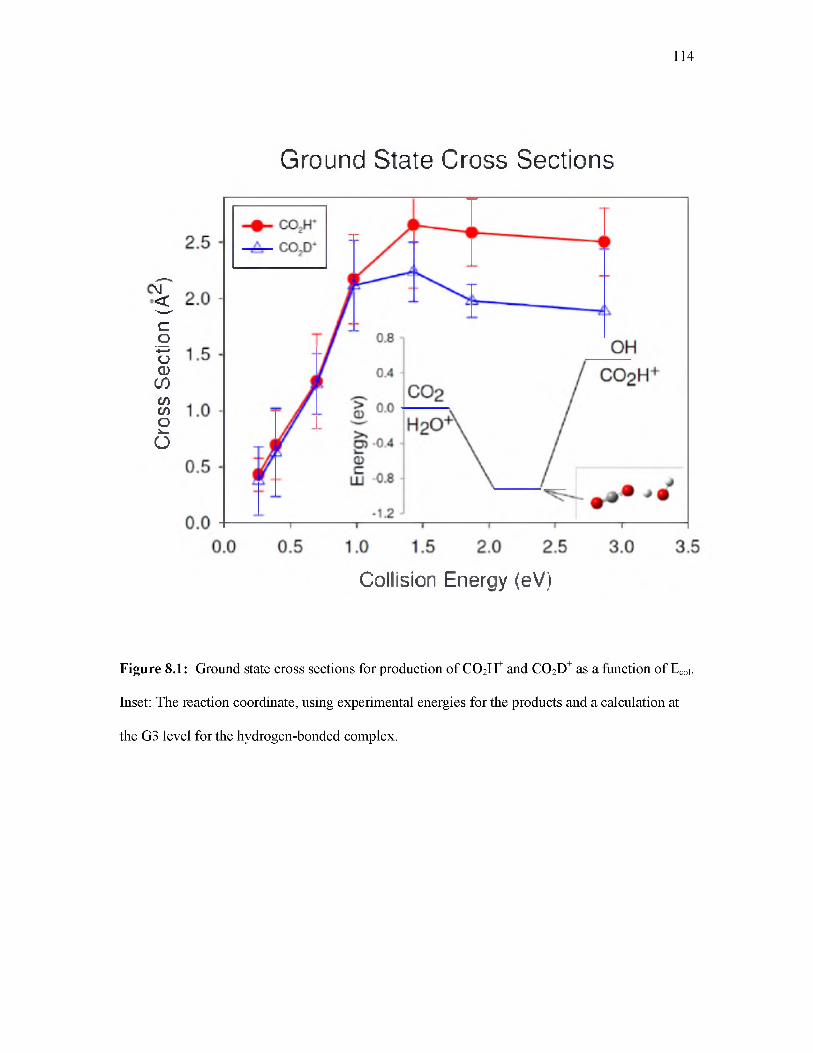
Cross
Sectio
n (A
^)
114
Ground State Cross Sections
Collision Energy (eV)
Figure 8.1: Ground state cross sections for production of CO2H+ and CO2D+ as a function of Ecol. Inset: The reaction coordinate, using experimental energies for the products and a calculation at the G3 level for the hydrogen-bonded complex.

115
Figure 8.2: Lab frame axial velocity (vaxial) distribution for CO2H+ produced in reaction of
ground state HOD+. Experimental data denoted by * ; Simulations denoted by Heavy vertical lines indicate the lab frame velocity of the center-of-mass frame (<VCM>).

116
---------------------- --------------------CC>2D+V
Ecol = 0.92
Y - v
Ecol = 1.38
•
----------------------w----------------------------
\ ^ a 'Ecol = 1.82
•
I I
Ecol = 2.82
^ 4 AI
-1000 0 1000 2000 3000Lab frame velocity (m/s)
Figure 8.3: Lab frame axial velocity (vaxial) distribution for CO2D+ produced in reaction of
ground state HOD+. Experimental data denoted by * ; Simulations denoted by .Heavy vertical lines indicate the lab frame velocity of the center-of-mass frame (<VCM>).

Cross
Sectio
n (A^
) Cro
ss Se
ction
(A*)
117
Collision Energy (eV)
Figure 8.4: The effect reactant vibration has on reactivity for each reaction. Top: Cross sections for production of CO2H+ in reaction of HOD+ in the indicated initial vibrational states, plotted as a function of collision energy (Ecol). Bottom: Analogous cross sections for the CO2D+ channel.
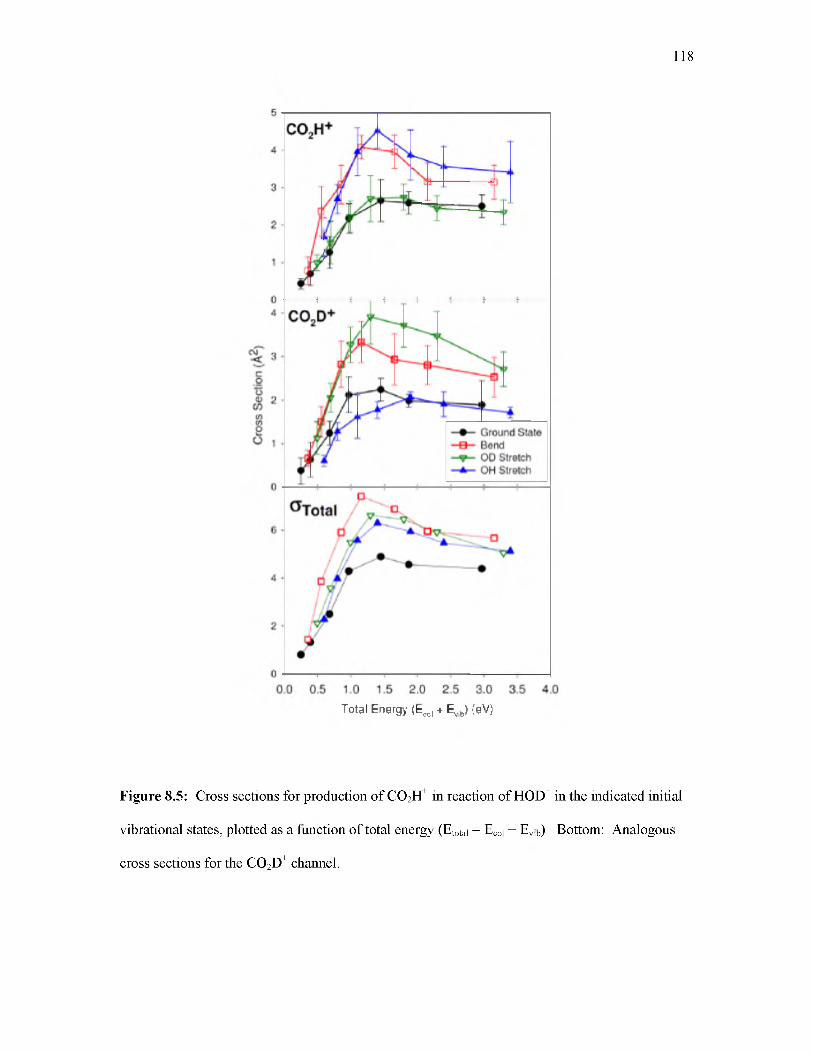
118
Total Energy (Eeol + E ^ ) (eV)
Figure 8.5: Cross sections for production of CO2H+ in reaction of HOD+ in the indicated initial vibrational states, plotted as a function of total energy (Etotal = Ecol + Evib) Bottom: Analogous cross sections for the CO2 D+ channel.

119
Figure 8.6: Reduced potential energy surfaces showing the minimum energy path for reactant approach and product separation in reaction of H2O+ with CO2. The three frames were calculated with the H2O+ bond angle frozen at the indicated values.

CHAPTER 9
H+ VS. D+ TRANSFER FROM HOD+ TO N2: MODE- AND BOND-SELECTIVE EFFECTS
Reprinted with permission from David M. Bell, Jason M. Boyle, Scott L. Anderson, and Journal of Chemical Physics 135, 044305. Copyright 2011, American Institute of Physics

OverviewReactions of HOD+ with N2 have been studied for HOD+ in its ground state, and with one
quantum of excitation in each of its vibrational modes: (001) - predominately OH stretch, 0.396 eV, (010) - bend, 0.153 eV, and (100) - predominately OD stretch, 0.293eV. Integral cross sections and product recoil velocities were recorded for collision energies from threshold to 4 eV. The cross sections for both H+ and D+ transfer rise slowing from threshold with increasing collision energy; however, all three vibrational modes enhance reaction much more strongly than equivalent amounts of collision energy, and the enhancements remain large even at high collision energy, where the vibration contributes less than 10% of the total energy. Excitation of the OH stretch enhances H+ transfer by a factor of ~5, but the effect on D+ transfer is only slightly larger than that from an equivalent increase in collision energy, and smaller than the effect from the much lower energy bend excitation. Similarly, OD stretch excitation strongly enhances D+ transfer, but has essentially no effect beyond that of the additional energy on H+ transfer. The effects of the two stretch vibrations are consistent with the expectation that stretching the bond that is broken in the reaction puts momentum in the correct coordinate to drive the system into the exit channel. From this perspective, it is quite surprising that bend excitation also results in large (factor of 2) enhancements of both H+ and D+ transfer channels, such that its effect on the total cross section at collision energies below ~2 eV is comparable to those from the two stretch modes, even though the bend excitation energy is much smaller. For collision energies above ~2 eV, the vibrational effects become approximately proportional to the vibrational energy, though still much larger than the effects of equivalent additional of collision energy. Measurements of the product recoil velocity distributions show that reaction is direct at all collision energies, with roughly half the products in a sharp peak corresponding to stripping dynamics, and half with a broad and approximately isotropic recoil velocity distribution. Despite the large effects of vibrational excitation on reactivity, the effects on recoil dynamics are small, indicating that
121

122
vibrational excitation does not cause qualitative changes in reaction mechanism or in the distribution of reactive impact parameters.
IntroductionThe water cation is important in chemistry of the upper atmosphere1-3 and in comet tails.4-
7 There is considerable literature on the thermal kinetics of water cation reactions,8 but relatively little is known about the dynamics of these reactions, outside of two crossed beam experiments on reactions of H2O+/D2O+ with NH3 and C2H4.9, 10 We recently reported studies of the reactions of HOD+ with CO211 and NO2,12 examining the effects on reactivity and product branching, of varying collision energy (Ecol) and of exciting each of the three HOD+ vibrational modes. In the HOD+ isotopolog of water cation, the amplitude of the D atom motion in the (100) vibrational mode is ~9.5 times greater than that of the H atom, hence this mode is well described as the “OD stretch” (293 meV). Similarly, the (001) mode has H motion amplitude >30 times that of the D atom motion, and thus is well described as the “OH stretch” (396 meV). Finally, the (010) bend mode (153 meV) excites yet another type of nuclear motion, where both H and D atoms move with comparable amplitudes.
As discussed below, one of the interesting questions is how excitation of the OH and OD stretch modes influences the cross sections for H+ and D+ transfer, and how such mode/bond- specific effects vary with the energetics of the process. H+/D+ transfer in the HOD+ + NO2 system is essentially thermoneutral; however, analysis of the dynamics in that system is quite complex because H+/D+ transfer can take place on both triplet and singlet surfaces, and is in competition with exoergic charge transfer, dissociative charge transfer (NO+ + O 3P + HOD), and production of NO+ + 2 OH. In that system, all channels except NO+ production are inhibited by all modes of HOD vibration, and the only clear mode/bond-specific effect was is a propensity for energy in the OH or OD stretch of the bond broken in H+/D+ transfer (the “broken-bond stretch”) to go into internal energy of the NO2H+/NO2D+ product, while energy in the stretch of the
“spectator bond” tended to remain as internal energy of the OD or OH product. The reaction with CO2 is much simpler - the only channels are H+ and D+ transfer, which are endoergic by ~0.55 eV. In this system, there are strong mode/bond specific effects. Excitation of the OH stretch roughly doubles the cross section for H+ transfer, while having almost no effect on D+ transfer, and OD stretch excitation doubles the cross section for D+ transfer, but has little effect on H+ transfer. As discussed below, this behavior is in line with expectations based on “Polanyi rules”,13, 14 and with results for neutral HOD reactions. The surprise was the bend excitation nearly doubles the cross sections for both H+ and D+ transfer, and thus results in the largest enhancement of the total cross section, ototal, even though the bend mode provides considerably less energy to drive the reaction, compared to the two stretches. The origin of this bend enhancement was not clear, as one would not expect the bending motion to be coupled to the reaction coordinate. One motivation for the current study was to study mode/bond-selective effects in a simpler system, and one with higher endoergicity.
Mode/bond selective chemistry involving the preferential breaking of the stretch-excited OH or OD bonds of water and isotopologs was first shown in studies of neutral water reactions with H and Cl atoms by the Zare and Crim groups.15-21 These effects are consistent with expectations, first outlined by Polanyi and co-workers,13, 14 that reactions should be enhanced by energy that puts momentum in the coordinate that corresponds to motion over the rate-limiting barrier. For endoergic reactions, this barrier is late in the collision, and the appropriate coordinate is the stretch of the bond being broken in the reaction. In the neutral experiments, it was not possible to excite the bend mode alone, but stretch-bend combination excitations did provide some insight into bending effects. Zare and co-workers22 examined bend effects by comparing reaction with H atoms, of D2O excited to the (011) and (001) levels. They found little effect of the additional bend excitation, suggesting that the bend motion was not coupled to the reaction coordinate, as might be expected from the nature of the motion. Crim and co-workers studied overtone combination effects on the reaction of H2O with H and Cl.20, 23 They found that the
123
124
(003) (asym. str.) overtone was considerably more reactive than the (022) (bend and asym. str.) overtone, which has similar energy. This comparison suggests that energy in bending vibration is considerably less effective than energy in stretching of the bond being broken, again consistent with expectations. On the other hand, the reactivity of water excited to the (004) and (023) levels (also similar in energy) was found to be similar, which would tend to imply that energy in the bend and asymmetric stretch have similar effects, at least for these very high levels of vibrational excitation.
In this paper, we report a guided ion beam study of the reaction of mode-selectively excited HOD+ with N2. The proton transfer (N2H+, AHrxn(0 K) = 1.03 eV) and deuteron transfer (N2D+, 1.02 eV) reactions are roughly twice as endoergic as analogous reactions for CO2, and thus comparison provides insight into how energetics relate to vibrational effects. This reaction has been studied previously in a Selected Ion Flow Tube (SIFT) apparatus under thermal conditions by Anicich and co-workers24 and with an Ion Cyclotron Resonance (ICR) apparatus by Karpas et al.25 No reaction was observed in either case, due to the significant endoergicity of the reaction. We are unaware of any previous beam studies.
Experimental and Computational MethodsThe guided ion beam tandem mass spectrometer used in this study has been described
previously, along with experimental and analysis protocols.26, 27 Helium is bubbled through a 50/50 mixture of H2O and D2O to generate 96% He with 4% water, half of which is HOD. HOD+ can be generated in selected vibrational states by REMPI through the C (1B1 ) state.28 The HOD+ was prepared in the following states: (000) ground state, (001) OH stretch 0.396eV, (010) bend0.153eV, and (100) OD stretch 0.293eV. The state selection purity, measured by photoelectron spectroscopy, is 100% for the ground state, OH stretch, and OD stretch, but only 56% for the bend, with the remaining 44% produced in the ground state. The bend-excited cross sections
reported below have been corrected for this admixture of ground state HOD+, using the cross sections separately measured for pure ground state HOD+.
The HOD+ ions were formed between a pair of planar electrodes, and the resulting ions were injected into a quadrupole ion guide, which focused them into a quadrupole mass filter to remove any unwanted ions produced in the REMPI process (e.g., OH+, OD+, H2O+, D2O+...). If significant amounts of H3O+ were produced by ion-molecule reactions in the source, then proton transfer from H3O+ to N2 might contribute spurious signal to the N2H+ channel for Ecol > 2.07 eV, where this reaction becomes energetically possible. To avoid this problem, the source was operated under conditions that produced negligible intensities of HD2O+ and D3O+, i.e., the H3O+ isotopologs that can be detected with no mass interferences. A time-of-flight (TOF) gating electrode pair at the end of the primary beam mass filter was used to narrow the ion beam kinetic energy spread to ~0.15 eV, compensating for the space charge broadening that resulted from the need to tightly focus the REMPI laser to pump through the short-lived C state. The mass-, state-, and kinetic energy-selected ions were injected into a system of 8-pole ion guides,29 the first of which guided the ions through a 10cm long scattering cell containing N 2 (from liquid N 2 boil-off) at 1 x 10⁻⁴ Torr, measured by a capacitance manometer. Unreacted HOD+ ions, along with any product ions, were collected by the guide and passed into a second, longer guide section for TOF velocity analysis, before being mass analyzed and detected. Products that were backward- scattered in the laboratory frame were reflected at the entrance of the guide system, and subsequently detected at long times, corresponding to apparent long velocities. Ions were counted using a P7882 FAST ComTec multichannel scalar, controlled by a LabView program that cycled through collision energies and masses of interest, and switched the target gas flow between the scattering cell and chamber background. Integral cross sections were calculated from the ratio of reactant and product ion intensities (integrated from the TOF measurements), corrected for ions formed outside the scattering cell, using the calibrated effective length of the scattering cell and the pressure was measured with a capacitance manometer.
125

TOF was used both to measure the energy of the reactant ion beam, as well as the axial projection of the recoil velocity distribution of the products (vaxial). Several complete sets of cross sections for both product channels were measured for all reactant states of HOD+ as a function of collision energy, each set taking a day. Because the cross sections are small in this system, separate, longer TOF acquisitions were done for selected collision energies for each HOD+ vibrational state. To avoid systematic errors due to possible day-to-day variations in instrument conditions, the ground state reaction cross sections were compared for each data set, before averaging. In all cases, the ground state cross sections agreed within the statistical uncertainty, thus all data sets were averaged to generate the data presented below.
The cross section uncertainties are estimated as follows. The standard deviation of the cross sections over the set of runs was < 20 %; however, this run-to-run variation also includes systematic error sources that do not affect the relative uncertainty for comparing cross sections for N2H+ vs. N2D+, or for reaction of different HOD+ vibrational states. For example, error in N2 pressure measurement affects both channels identically, and differences in relative detection efficiency for product vs. primary ions would also tend to have similar effects on both channels because the product masses are similar. For this reason, we estimate that 20% is an upper limit on the relative uncertainty. The exception is the data for collision energies near the reaction threshold, where, from the data scatter, we estimate that the cross section uncertainty is ~0.05 A2. The main sources of uncertainty in the absolute scale of the cross sections are absolute pressure calibration, and possible differences in detection efficiency for primary and product ions, and our usual methods for calibrating are described elsewhere.26, 30, 31 In this case, we checked our calibration by measuring the cross sections for HOD+ + CO —— COH+/COD+ under identical conditions. With no adjustments to the calibration, the measured total cross section at low collision energy matches the capture collision cross section within 3%. For that system, unit reaction efficiency is expected from the reported thermal rate constant.32
126
127
To map out the reaction coordinate, electronic structure calculations were performed at several levels of theory using GAUSSIAN03.33 For stable points (reactants, complexes, products), energies were calculated at the G3 level of theory. Because the PBE1PBE/6-311++G** method was found to be in reasonable agreement with experimental energetics, and with the G3 calculations of complexes, this method was used in mapping out the reaction coordinate. In addition to optimizing stationary points (transition state, complexes), we also mapped out parts of the potential energy surface, with emphasis on coordinates associated with reactant approach, product recoil, and select vibrational modes.
ResultsComputational Results
The reaction coordinate for this system is shown in the inset to Figure 9.1. More detail regarding the potential energy surface is given in the discussion. The energies shown in the figure are experimental for the reactants and products,34, 35 and the energy of the complex is from a G3 calculation, referenced to the G3 calculations for the reactants. The complex has the H2O+ forming a weak hydrogen bond to the end of the N2 moiety with a N-H bond distance of 1.656 A and a NNH bond angle of 177.7°. The OH bond length for the H atom bound to N2 is 1.05 A, which is only slightly elongated relative to the 1.00 A OH bond length calculated for free H2O+ at the same level of theory. Similarly, the HOH bond angle in the complex (110.8°) is quite close to that calculated for free H2O+ (109.9o). In the N2H+ product, the N-H distance is 1.04, and the NNH angle is 180o. Because no significant rearrangements are needed to form the complex from reactants, it is unlikely that there should be any activation barrier to inhibit its formation. Similarly, we would not anticipate any barrier in excess of the endoergicity, separating the complex from the product channel.
Ground State Integral Cross Sections Product ions were observed at masses 29 and 30, corresponding to N 2 H+ and N 2 D+,
respectively. The integral cross sections for both channels from reaction with ground state HOD+ are given in Figure 9.1 over a center-of-mass (CM) collision energy (Ecol) range of 0.48 eV to 3.85 eV. The reactions are:
HOD+ + N2 ^ N2H+ + OD (H+ transfer) ArH = 1.03 eV^ N 2 D+ + OH (D+ transfer) ArH = 1.02 eV
where the enthalpy of reaction given is obtained using the experimental 0 K enthalpy for reaction of H2O+ with N2, corrected for the effects of deuteration using zero point energies from the G3 level calculations on the reactants and products. The threshold energy difference between N2H+ and N 2 D+ is far too small to have detectable effects on the experimental cross sections, which are broadened by both thermal motion of the N2 target and the ~0.15 eV energy spread of the HOD+ ion beam (full width at half maximum of the Gaussian distribution obtained by fitting TOF data). The fact that products are seen below the ~1 eV thermodynamic threshold also reflects these broadening factors. Because the threshold energies are not in question for this system, we did not attempt to extract cross sections corrected for the broadening. We did, however, verify that the experimental cross sections are consistent with the thermodynamic thresholds, i.e., they can be fit within experimental error using a simulation36 based on the assumption of a modified line-of- centers threshold model37-40 using 0.15 eV as the primary beam energy spread, and 300 K as the N 2 target temperature.
Vibrational Mode Effects on Integral Cross Sections The cross sections for the N 2 H+ and N 2 D+ products for the four different HOD+ reactant
states are plotted as a function of total energy (Etot) in Figure 9.2. The three modes examined
128
(OH stretch = 396meV, OD stretch = 293meV, Bend = 153meV) differ by more than a factor of 2 in energy, and all three significantly change the available energy, especially in the threshold energy range. To allow the effects of the vibrational modes to be compared directly, and to allow easy comparison with the effects of adding equivalent amounts of collision energy, Figure 9.2 plots the cross sections vs. total energy. If vibrational excitation had effects equivalent to collision energy, then the cross section curves would all be superimposable on the ground state cross section. With one exception (OD stretch excitation, N2H+ product) the vibrational effects are substantially larger than those from Ecol, and the effects on both ototal and N2H+/N2D+ branching are quite mode specific. In the following discussion, we will refer to the stretch of the bond broken in the H+/D+ transfer as the “broken-bond stretch”, and the stretch of the other bond as the “spectator” bond stretch. For example, in the reaction HOD+ + N 2 ^ N 2 H + D, the (001) mode is the broken-bond (i.e., OH) stretch, and the (100) mode is the spectator (OD) stretch.
Product Recoil Velocity Distributions Additional insight into the reaction mechanism can be obtained by considering the
product ion recoil velocity distributions. Because our experiment is axially symmetric, considerable dynamical insight can be extracted by simply measuring the projections of the full 2D velocity distributions on the axis of the experiment, i.e., vaxial distributions. Selected lab frame vaxial distributions for the N2H+ and N2D+ product ions from reaction of HOD+ in various states are given in Figures 9.3 and 9.4, respectively. In each frame, the distributions are scaled so that their integrals are equal to the magnitude of the corresponding integral cross sections. In our geometry, the average relative velocity of the collisions and the average velocity of the CM frame with respect to the lab, <VCM>, lie along the axis of the ion guide. Therefore, products that are forward scattered in the CM frame have lab velocities greater than <VCM>, and backward- scattered products have lab velocities below <VCM>. In the figure, the values of <VCM> at each Ecol are indicated by heavy vertical lines. If the reaction proceeds via a complex with a lifetime
129

(xcollision) greater than its rotational period (Trotation), the resulting vaxial distribution must be forward- backward symmetric about <VCM>; an asymmetric vaxial distribution is proof the mechanism is direct (fast compared to the complex rotational period), and also reveals the dominant scattering mechanism. Finally, the shape of the distributions provides insight into partitioning of the available energy (Eavail) into recoil energy (Erecoil).
Two experimental factors must be kept in mind when considering the distributions. The velocity distributions of the reactant ions and N2 target result in a distribution of collision energy and geometry, which broadens the vaxial distributions significantly. Analysis of the distributions to correct for this broadening is discussed below. The other issue for the present system is that some product ions are scattered at very low lab velocities where they are highly susceptible to small potential or effective potential distortions in the ion guides.41 As a result of these distortions, a fraction of the slow ions tends to arrive at the detector at very long times (due to reflections in the ion guide), contributing to artifactual vaxial peaks with apparently near-zero lab velocities. While the ion optics are biased to ensure that such reflected ions are collected and counted in the integral cross sections, we ignore ions with apparent vaxial below 500 m/sec in fitting of the vaxial distributions.
In this system, the distributions are strongly asymmetric, indicating that proton transfer is direct at all Ecol examined. Direct scattering is not surprising given the reaction coordinate shown in Figure 9.1. The well depth is small compared to the endoergicity, ensuring that even for collisions near threshold, the lifetime of the collision complex should be small. The distributions are strongly backward-peaked, but with a significant tail extending well into the forward hemisphere (vaxial > <VCM>). Note that because we measure scattering of the ionic products, “backward” corresponds to small angle, stripping-type dynamics, while large angle, rebound scattering would produce forward-scattered product ions. To interpret the distributions more quantitatively, the data were simulated/fit in order to account for broadening from the distributions of ion beam kinetic energy and N2 thermal motion. The simulation26, 42 takes a
130
model recoil angular and energy distribution, and convolutes it with the experimental broadening factors, then projects the results to create a vaxial distribution for comparison with experiment.The model distribution is varied until the simulation matches the data. For this system, we used a two component model - one to fit the sharp backward-scattered peak, and one to fit the broad tail extending into the forward hemisphere. Each component was represented by a simple three parameter model, where the osculating complex model43 was used to represent the angular distribution, and the Erecoil distribution was assumed to be a Gaussian, defined by Eratio and fwidth parameters which give the peak energy and width as a fraction of Eavail ( = Ecol + Evib + Erot - AHrxn(0K)). The Erecoil distribution is truncated at Eavail, if necessary, to ensure energy conservation. The osculating complex model assumes that there is a preferred scattering direction (assumed to be 180° here), but that the scattering is broadened by rotation of the collision complex, with the broadening determined by the parameter t, ^ (= T^tim / x^m^). For the present system, where reaction is direct at all energies, the angular distribution probably depends as much on impact parameter as on collision time. Therefore, we consider the osculating complex model and its t^ parameter as simply means to generate model distributions with controllable shape, and do not attribute any particular significance in terms of collision time.
It turns out that good fits (the solid curves in Figures 9.3 and 9.4) can be generated for the entire data set (i.e., both N2H+ and N2D+, all collision energys, and for all HOD+ states) using rather similar sets of simulation parameters. In each case, the backward peak was fit using a narrow backward-peaked component (10 < t^ < 18), with a recoil energy distribution peaking sharply at the maximum available energy (Eratio = 1, fwidth = 0.25 - 0.5). Because the distributions are truncated at Eavail, the resulting recoil energy distribution is really a half Gaussian peaking at Erecoil = Eavail. The broad tail extending into the forward direction was fit by an isotropic component (t, ^ = 0.1), with a broad Erecoil distribution (Eratio = 0, fwidth = 10) that has substantial intensity for energies up to where it is truncated at Eavail. Furthermore, the coefficients of the sharp backward, and broad isotropic components are also similar across the entire data set,
131

varying only from 40:60 to 55:45. The similarities in the simulation parameters imply that the scattering dynamics are not strongly influenced by either Ecol or HOD+ state, in contrast to the strong effects on ototal and product branching. Table 9.1 summarizes the results. Values are given for <Erecoil>/<Eavail>, i.e., the average fraction of available energy appearing in recoil, and for <Erecoil>, the average recoil energy. In addition to these simulation results, the table also lists values for Rasym (Ibackward/Iforward), which is simply the ratio of integrated experimental intensity below and above <VCM>, provided to give a model-independent measure of the forward- backward asymmetry.
DiscussionGround State Mechanism
Given the tiny difference in energetics for N2H+ vs. N2D+ formation, it is not surprising that the ground state cross sections for N 2 H+ and N 2 D+ are identical with experimental error near threshold, where available energy is expected to be the most important factor determining reactivity. At higher energies, dynamical effects have the potential to cause isotope effects. For example, in the analogous reaction of ground state HOD+ with CO2 (~0.55 endoergic), the cross section for CO2H+ production is ~30% larger than that for CO2D+ for Ecol > 2 eV.11 For N2, the difference in H+/D+ transfer cross sections is insignificant (~5%), indicating that such dynamical isotope effects are small for this reaction in the energy range probed. For the ground state reaction, the total cross section rises quite slowly from threshold, such that it is only ~0.5 A2 (~3.5% of oCollision) and still rising at ECol = 4 eV. At this energy, Ocollision = OHardSphere = ~14 A2 calculated using covalent radii44 for the atoms. In contrast, the ground state cross section for the proton transfer reaction with CO2 rises rapidly to ~ 5 A2 at Ecol of only 1 eV, and then levels off at higher energies.11
There are a number of reasons why a simple proton transfer reaction like this might be quite inefficient (more than an order of magnitude less efficient than the analogous reaction with

133
CO2). For example, if reaction were facile only in a narrow range of reactant orientations, a drastic reduction of efficiency would result.42, 45 One would not expect any steric hindrance in either the N 2 or CO2 cases, but it might be that the energetics are only favorable in a narrow range of angles. Both N2 and CO2 are 'Eg+ molecules, thus reaction cannot depend on azimuthal angle. We might expect that the structures of the N2H+ or CO2H+ product ions, or possibly the structures of the intermediate complexes, might provide insight into the geometries that are most favorable for the proton transfer event (i.e., the structure of the rate-limiting transition state). Furthermore, the magnitude of the frequency corresponding to H-NN or H-OC bending in the product ions should provide some idea of how rapidly the reaction coordinate energy might increase upon distortion away from the most favorable geometry. The H2 O+-N2 complex has a near-linear HNN bond, as shown in Figure 9.1, and the N2H+ product ion is linear, suggesting that the preferred proton transfer geometry also has linear HNN. For H2O+ + CO2, there is an analogous complex with similar bond lengths11; however, the HOC angle is ~146° in the H2O+-CO2 complex, and ~120° in the HOCO+ product ion, suggesting that the preferred proton transfer geometry has water attacking from the side with HOC angle somewhere in the 120 - 150° range (the CO2 moiety remains essentially linear in the complex and HOCO+ product). The fact that the HOC bending mode of HOCO+ (997 cm-1) has higher frequency than that of the corresponding HNN+ bend (823 cm-1) would tend to suggest that reaction with N2 might be slightly less sensitive to orientation than CO2 ; however, a requirement for HNN to be linear would result in a severe bottleneck to reaction. Assuming that reaction can occur only when reactants approach with HNN or HCO polar angles within d0 of the most energetically favorable angle (6Emin), the reaction probability would scale (in the limit as d0 ^ 0) like sin(0Emin) • d0. The fact that 0Emin is almost certainly near 0° for N2, implies that only a small fraction of collisions occur with near-optimal geometries, which would account for the very low reactivity. At low Ecol, there may be some orientational steering as reactants approach; however, such effects are unlikely to be significant for Ecol > 1 eV, where reaction is possible. The increase in reactivity with increasing Ecol may

134
relate to decreasing sensitivity to approach geometry as the available energy increases above threshold. As shown below, it does not appear that increases in the range of reactive impact parameters (i.e., the opacity function) can be responsible for increasing reactivity.
Velocity Distributions We first consider the velocity distributions for the ground state reaction (Figures 9.3 &
9.4). Several points are obvious. Based on the simulations (Table 9.1), the average amount of energy appearing in recoil increases from ~0.3 eV at Ecol = 1.4 eV, to ~2 eV at Ecol = 3.8 eV; however, the average fraction of energy appearing in recoil is constant at ~70% for both N2H+ and N2D+, independent of Ecol. The 70% reflects the average of the contributions from the backward peak (Erecoil ~ Eavail) and the broad tail, where Erecoil is in a broad distribution ranging from zero to Eavail. If we assume, as is almost certainly true at high Ecol, that the recoil behavior is strongly influenced by impact parameter, then the results indicate that H+/D+ stripping in large impact parameter collisions leads to nearly all available energy appearing in recoil, i.e., not much excitation of product internal energy. More central collisions, recoiling to generate the broad forward tail, lead to broad distributions of recoil energy, with correspondingly large variation in partitioning Eavail between internal and recoil energy. The Rasym values are also similar for N2H+ and N2D+; however, they do change significantly with Ecol. At the highest Ecol, the ratio is ~5.5, increasing to ~10 at Ecol = 2 eV, where there are hardly any forward-scattered product ions from the ground state reaction. At Ecol = 1.4 eV, the ratio apparently decreases to ~2.4; however, this decrease is at least partly an artifact of experimental broadening. Consider that for energies just above threshold, the CM frame recoil velocities must be near zero (i.e., lab velocities near <VCM>); therefore, experimental broadening will tend to generate apparently forward-backward symmetric distributions (Rasym = 1), regardless of how asymmetric the true vaxial distributions might be. By Ecol = 1.4 eV (0.4 eV above threshold), the vaxial distributions are clearly
asymmetric, but the recoil velocities are still low enough that the apparent backward/forward ratio is significantly reduced by broadening.
The line-of-centers model is commonly used to simulate the cross sections for endoergic reactions near threshold.46 In this model, the increase in cross section as Ecol is increased above threshold results from an increase in the maximum impact parameter leading to reaction. For the HOD+ + N2 system, the maximum reactive impact parameter predicted by the line-of-centers model, bmax, increases from ~0.53 • RHardsphere for ECol = 1.4 eV, to ~0.87 • RHardsphere for ECol = 4 eV, and if scattering were also hard sphere-like, this would set a limit on how large the scattering angle could be: 0max = n - 2acos(bmax/RHardSphere), where the factor of n is included because the charge is transferred in the reaction, and we are detecting the product ions. This maximum scattering angle would be only ~64° for 1.4 eV, which would imply only forward-scattered ions; clearly inconsistent with the strongly backward-peaked vaxial distributions. Even at 3.8 eV, the maximum angle would be ~120°, and the resulting vaxial peak would be considerably closer to VCM than what we observe. Rather than this slow evolution from forward to backward-peaked distributions with increasing energy, we observe strong backward peaking at all energies, indicating that a line-of-centers/hard sphere scattering model is not even approximately reasonable for this reaction in the under 4 eV Ecol range.
In fact, between Ecol = 2 and 3.8 eV, Rasym drops significantly, which is opposite to what would be expected if the maximum reactive impact parameter increased with Ecol. The sharpness of the backward-peaked (stripping-like) component of the distribution does increase, which would tend to suggest reaction at larger impact parameters; however, the broad tail extending into the forward hemisphere increases as well. In an impulsive scattering mechanism, this tail would correspond to increased reactivity at small impact parameters, and such an increase is not unreasonable, given that the reaction efficiency is so small for the ground state reaction (<3.5% at 4 eV). The conclusion is that reaction occurs over a broad range of impact parameters at all energies, but with low probability that increases slowly with Ecol.
135
The factor of 3 to 5 enhancements in N 2 H+ and N 2 D+ production when the broken-bond stretch is excited, and the doubling of the cross sections observed upon bend excitation, suggest that there might be some qualitative change in the reaction mechanism enabled by vibrational excitation. Figures 9.3 and 9.4 show the vaxial distributions for the two channels for all four HOD+ reactant states, at Ecol from 1.4 to 3.8 eV. These data are at energies well below, near, and well above the Etotal ~ 2 eV breakpoint where the Ecol and vibrational mode dependence of the integral cross sections (Figure 9.2) undergo qualitative changes, suggesting the possibility of a change in reaction mechanism. The effects of HOD+ vibrational excitation on the recoil behavior are quite small but do provide some indication of how energy in different initial states is partitioned in the products. For example, when HOD+ is vibrationally excited, the average energy appearing in recoil increases. The effect is seen most easily for the lower Ecol data, where the contribution of vibration to Eavail is most significant. For example, at 1.4 eV, Eavail ~ 0.4 + Evib, i.e., OH and OD stretch excitation (396 and 293 meV) nearly double Eavail, and even bend excitation (153 meV) increases Eavail by 50%. The average energy appearing in recoil (according to the simulations) does increase, but by a smaller factor, such that the ratio, <Erecoil>/<Eavail>, decreases from ~70% for the ground state, to ~60% for the OH stretch excited reaction. Based on the breaking bond - spectator bond picture, we might also expect that there should be a difference in the fraction of energy going to recoil in the N2H+ and N2D+ products, for excitation of the OH and OD stretch modes. Such an effect, if present, is within the uncertainty of the Erecoil values extracted by fitting the distributions (uncertainty estimated at 10% - 16%).
It is somewhat surprising that HOD+ vibrational excitation can have such dramatic effects on the integral cross sections, without more obvious effects on the recoil behavior. The fact that reaction efficiency is strongly mode-dependent implies that the rate-limiting step in the reaction is early in the collisions, where the system still “remembers” the initial state. In contrast, product recoil is affected by dynamics through the entire collision, including rotation during the collision time, energy redistribution between Ecol and internal modes, and interactions between products as
136

137
they separate. Nonetheless, one might expect that the large vibrational enhancements might imply significant changes in the distribution of reactive impact parameters, and that would almost certainly result in obvious changes in the vaxial distributions. In this system, the results suggest, instead, that vibrational excitation increases the probably of reaction at all impact parameters, such that scattering at all angles is enhanced.
Vibrational EffectsAs shown in the top frame of the Figure 9.2, excitation of the broken-bond (i.e., OH)
stretch results in a ~5x enhancement of the N2H+ channel, excitation of the bend roughly doubles the cross section, but excitation of the spectator bond (i.e., OD) stretch has no effect beyond that from adding available energy. For N 2 D+ production (middle frame), the situation is approximately reversed. Broken-bond (i.e., OD) stretch excitation results in a large (3x - 4x) enhancement, and bend excitation, again, roughly doubles the cross section. Excitation of the spectator (OH) stretch does enhance the D+-transfer reaction, presumably because it provides such a large increase in Eavail; however, the effect is smaller than that of the much lower energy bend mode. In essence, the observation is that stretch excitation of the OH or OD bonds greatly enhances the probability of transferring H+ or D+, respectively, while having little or no effect on transfer of the D+ or H+ of the spectator bond. As described in the Introduction, and in our previous paper on HOD+ + CO2,n this is just the effect that might be expected from consideration of the reaction coordinates for H+ or D+ transfer. On the other hand, the relatively large, 2x enhancement from bend excitation (153 meV) is unexpected, as this mode is not obviously coupled to the H+/D+ transfer reaction coordinate, and is considerably lower in energy than two stretch modes.
The bottom frame of Figure 9.2 shows the effects of vibrational excitation on ototal. The energy dependence of the cross sections suggests that there may be two mechanistic regimes. For Etot below ~2 eV, all modes of vibration excitation, as well as collision energy, strongly enhance
reactivity, with effects that depend on mode, not just energy. Note, for example, that bend excitation gives a larger enhancement than OD stretch excitation, even though the OD stretch has nearly twice the energy of the bend. Above ~2 eV, vibrational excitation continues to cause large enhancements; however, the relative effect of the different modes changes considerably. By Etotal ~ 4 eV, the enhancements become roughly proportional to the energy of the modes.
This pattern is just the opposite of what might be expected. The strongest mode-specific effects are seen near threshold, yet this is where we might expect the energy content of the vibrational modes to be most important. At energies well above threshold, the energy of the vibrations is negligible compared to Etot, yet this is where the enhancements of ototal are proportional to Evib. In fact, we argue that vibrational dynamics, rather than Evib, are the important factor at all energies. Several features of the data show the strong influence of dynamics even at high energies. Obviously, the branching between H+ and D+ is still strongly mode specific, which implies control by dynamics, rather than energetics. Furthermore, even for ototal, the vibrational effects at high energies remain much larger than the collision energy effects, which become weak and variable in the high energy range. For HOD+ in its ground state or with OD stretch excitation, Ecol still enhances reaction, but weakly. For HOD+ with bend or OH stretch excitation, Ecol actually slightly inhibits reaction. Extrapolating the dependence of the vibrational effects on Etot, it seems likely that as energy continues to increase, the effects of OH and OD stretch excitation will remain significant, and the bend enhance appears to be disappearing.
Origin of the Vibrational EffectsIn this system, the reaction coordinate (Figure 9.1) is attractive for reactant approach, and
the endoergicity is manifest as the products separate. In this sense, the reaction could be described as being controlled by a late barrier, and as discussed by Polanyi and co-workers13, 14 for A + BC model reactions. The mechanism for the enhancement shown in these classic studies
138
is that stretching motion of the BC bond gives the system momentum along the correct coordinate to get around the bend on the potential energy surface so that the available energy is effective in driving the system over the late barrier. For a late barrier system, partitioning energy into Ecol was predicted to be less effective, because the momentum is perpendicular to the product exit channel, and the system is likely to simply reflect off the repulsive wall, exiting back to reactants. This last point, at least, is true for the HOD+ + N2 system, where Ecol is much less efficient than vibrational excitation in driving reaction.
There are several factors to keep in mind when considering how vibrational excitation might affect this reaction. The fact that the effects are strongly mode-specific implies that the critical point where vibration affects reactivity must be early enough on the reaction coordinate that the system still “remembers” the initial mode of excitation. For polyatomic reactants, the different vibrational modes correspond to momentum along different coordinates, which may be coupled differently to the reaction coordinate. Finally, note that all of the vibrations in this system have energies well below the threshold energy for reaction, thus reaction is driven by some combination of energy initially in vibration and collision energy. Furthermore, the vibrational enhancements are much larger than the effects of similar amounts of Ecol, which suggests that vibrational excitation must greatly increase the efficiency with which momentum initially in relative motion is converted to momentum up the slope into one of the product channels.
In hopes of providing additional insight into the origins of the vibrational effects, we calculated a reduced potential energy surface (PES) for the reaction, using the PBE1PBE/6- 311++G(d,p) level of theory and referencing the energy to the reactants at the same level of theory. The result is shown in Figures 9.5 and 9.6 for H+ and D+ transfer, respectively. The zero of the PES is in reference to the reactants at infinite separation at their equilibrium geometries. The idea is to try to focus on coordinates that represent reactant motions and distortions of interest (reactant approach, product separation, vibrations of interest), either freezing or
139
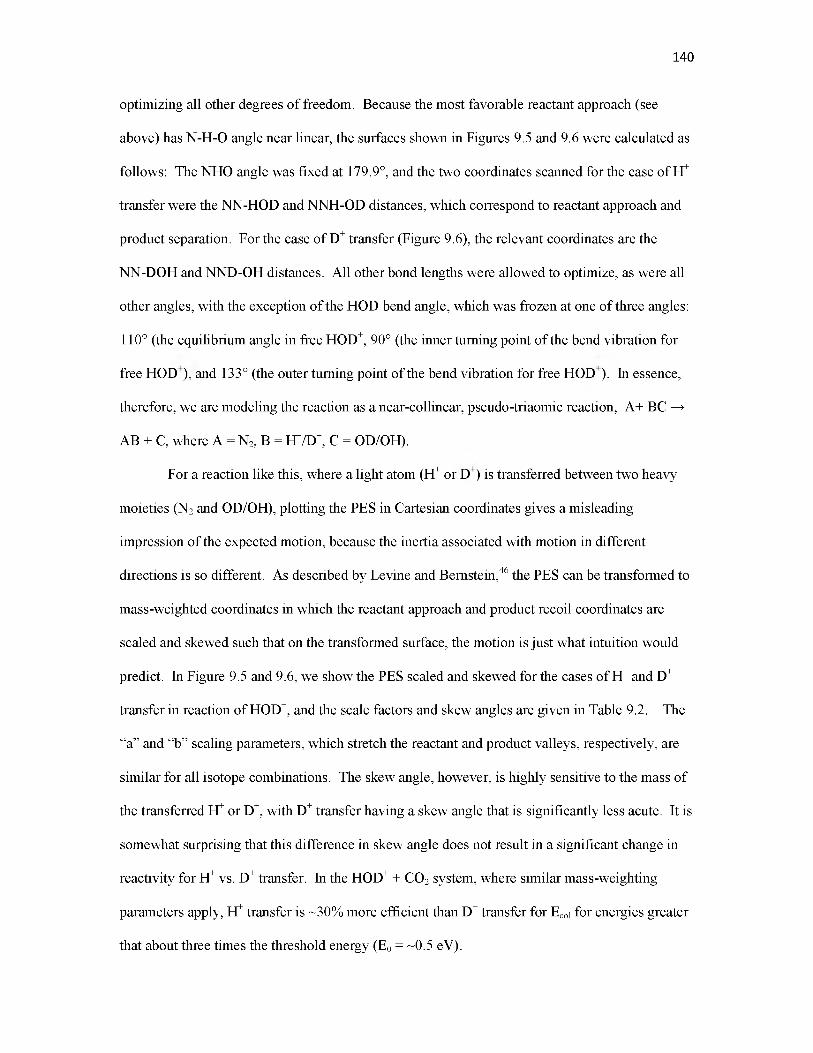
optimizing all other degrees of freedom. Because the most favorable reactant approach (see above) has N-H-O angle near linear, the surfaces shown in Figures 9.5 and 9.6 were calculated as follows: The NHO angle was fixed at 179.9°, and the two coordinates scanned for the case of H+ transfer were the NN-HOD and NNH-OD distances, which correspond to reactant approach and product separation. For the case of D+ transfer (Figure 9.6), the relevant coordinates are the NN-DOH and NND-OH distances. All other bond lengths were allowed to optimize, as were all other angles, with the exception of the HOD bend angle, which was frozen at one of three angles: 110° (the equilibrium angle in free HOD+, 90° (the inner turning point of the bend vibration for free HOD), and 133° (the outer turning point of the bend vibration for free HOD). In essence, therefore, we are modeling the reaction as a near-collinear, pseudo-triaomic reaction, A+ BC ^ AB + C, where A = N 2 , B = H+/D+, C = OD/OH).
For a reaction like this, where a light atom (H+ or D ) is transferred between two heavy moieties (N2 and OD/OH), plotting the PES in Cartesian coordinates gives a misleading impression of the expected motion, because the inertia associated with motion in different directions is so different. As described by Levine and Bernstein,46 the PES can be transformed to mass-weighted coordinates in which the reactant approach and product recoil coordinates are scaled and skewed such that on the transformed surface, the motion is just what intuition would predict. In Figure 9.5 and 9.6, we show the PES scaled and skewed for the cases of H+ and D+ transfer in reaction of HOD+, and the scale factors and skew angles are given in Table 9.2. The “a” and “b” scaling parameters, which stretch the reactant and product valleys, respectively, are similar for all isotope combinations. The skew angle, however, is highly sensitive to the mass of the transferred H+ or D+, with D+ transfer having a skew angle that is significantly less acute. It is somewhat surprising that this difference in skew angle does not result in a significant change in reactivity for H+ vs. D+ transfer. In the HOD+ + CO2 system, where similar mass-weighting parameters apply, H+ transfer is ~30% more efficient than D+ transfer for Ecol for energies greater that about three times the threshold energy (E0 = ~0.5 eV).
140
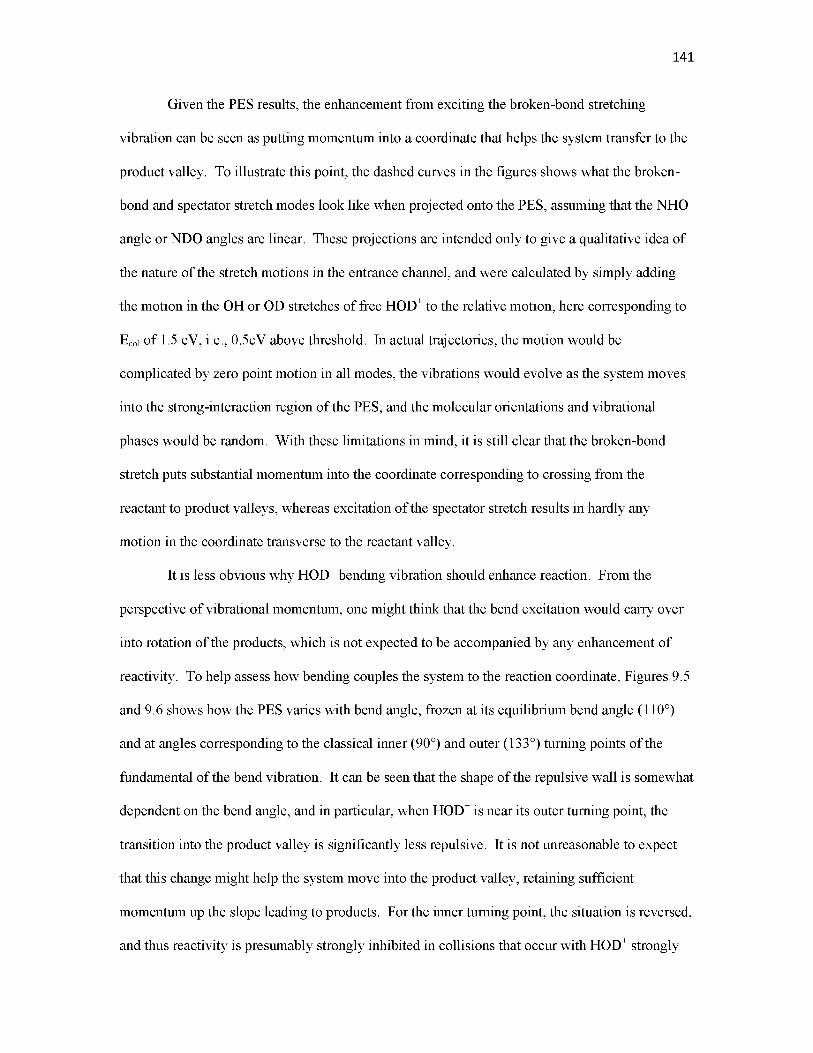
Given the PES results, the enhancement from exciting the broken-bond stretching vibration can be seen as putting momentum into a coordinate that helps the system transfer to the product valley. To illustrate this point, the dashed curves in the figures shows what the broken- bond and spectator stretch modes look like when projected onto the PES, assuming that the NHO angle or NDO angles are linear. These projections are intended only to give a qualitative idea of the nature of the stretch motions in the entrance channel, and were calculated by simply adding the motion in the OH or OD stretches of free HOD+ to the relative motion, here corresponding to Ecol of 1.5 eV, i.e., 0.5eV above threshold. In actual trajectories, the motion would be complicated by zero point motion in all modes, the vibrations would evolve as the system moves into the strong-interaction region of the PES, and the molecular orientations and vibrational phases would be random. With these limitations in mind, it is still clear that the broken-bond stretch puts substantial momentum into the coordinate corresponding to crossing from the reactant to product valleys, whereas excitation of the spectator stretch results in hardly any motion in the coordinate transverse to the reactant valley.
It is less obvious why HOD+ bending vibration should enhance reaction. From the perspective of vibrational momentum, one might think that the bend excitation would carry over into rotation of the products, which is not expected to be accompanied by any enhancement of reactivity. To help assess how bending couples the system to the reaction coordinate, Figures 9.5 and 9.6 shows how the PES varies with bend angle, frozen at its equilibrium bend angle (110°) and at angles corresponding to the classical inner (90°) and outer (133°) turning points of the fundamental of the bend vibration. It can be seen that the shape of the repulsive wall is somewhat dependent on the bend angle, and in particular, when HOD+ is near its outer turning point, the transition into the product valley is significantly less repulsive. It is not unreasonable to expect that this change might help the system move into the product valley, retaining sufficient momentum up the slope leading to products. For the inner turning point, the situation is reversed, and thus reactivity is presumably strongly inhibited in collisions that occur with HOD+ strongly
141

bent. Because overall reaction efficiency is so low, however, it would not take a very large enhancement of reaction for HOD+ near its outer (more linear) turning point, to offset a total loss of reaction for HOD+ colliding in strongly bent geometries.
It would be interesting to examine trajectories of the HOD+ +N2 system to see if the qualitative rationalizations proposed to explain the vibrational effects are borne out by in more detailed calculations. For a reasonable hope of understanding the origins of the vibrational effects, our experience has been that several hundred reactive trajectories are needed for each reactant state. In the N2 system, the vaxial results indicate that reaction occurs over a wide range of impact parameters, but with < ~3% efficiency, thus on the order of twenty thousand trajectories would be needed. This size trajectory set is not feasible if the force and Hessian calculations are carried out at a high enough level of theory to reproduce subtle effects like vibrational mode effects. In principle, microscopic reversibility applied to a trajectory study of the reverse reaction (which is presumably more efficient), could shed some light on the vibrational effects; however, it is far from obvious what initial conditions (partitioning of Eavail between NNH+/OD vibrations, rotations, translation) should be used to connect to the reactant states we have studied for the forward reaction. Fortunately, the reactions of HOD+ with N2 and CO2 appear to be dynamically quite similar, but reaction efficiency with CO2 is an order of magnitude higher. We are currently completing a large set of ab initio trajectories of HOD+ + CO2 collisions, in an attempt to understand the origins of the dynamical effects more clearly.
ConclusionWe have presented a detailed study of the mode and bond selective reaction of HOD+ +
N2. Exciting the OH stretch (001) mode enhances H+ transfer much more efficiently than adding collision energy, but has little effect on D+ transfer. The converse is true when the OD stretch (100) mode is excited. These effects are consistent with expectations, and reflect the fact that the OH and OD stretch modes correlate directly the corresponding H+/D+ transfer reaction
142
143
coordinates. Surprisingly, excitation of the bend results in a factor-of-two enhancement for both channels, and the origin of this effect is unclear, but may relate to effects of water cation distortion on the shape of the repulsive wall and product channels on the potential energy surface.
AcknowledgmentThis work was supported by a grant from the Chemistry Division of the National Science
Foundation (CHE-0647124).
References1. G. Herzberg, Ann. Geophys. 36, 605 (1980).2. W. T. Huntress, Jr., Astrophys. J., Suppl. Ser. 33, 495 (1977).3. R. A. Morris, A. A. Viggiano, J. M. V. Doren and J. F. Paulson, J. Phys. Chem. 97, 3051
(1992).4. P. Gammelgaard and B. Thomsen, Astron.Astrophys. 197, 320 (1988).5. M. E. Brown, A. H. Bouchez, H. Spinrad and C. M. Johns-Krull, Astron. Astrophys. 301,
L1 (1995).6. H. Balsiger, K. Altwegg, F. Buehler, J. Geiss, A. G. Ghielmetti, B. E. Goldstein, R.
Goldstein, W. T. Huntress and W. H. Ip, Nature 321, 330 (1986).7. K. Jockers, T. Credner and T. Bonev, Astronomy and Astrophysics 335, L56 (1998).8. V. G. Anicich, An Index o f the Literature for Bimolecular Gas Phase Cation-Molecule
Reaction Kinetics. (National Aeronautics and Space Administration, and Jet Propulsion Laboratory,California Institute of Technology, Pasadena, California, 2003).
9. Y. Li and J. M. Farrar, J. Phys. Chem. A 108, 9876 (2004).10. L. Liu, X. Cai, Y. Li, E. R. O'Grady and J. M. Farrar, J. Chem. Phys. 121, 3495 (2004).11. D. M. Bell, J. M. Boyle and S. L. Anderson, J. Chem. Phys 134, 64312 (2011).12. J. M. Boyle, D. M. Bell, S. L. Anderson and A. A. Viggiano, J. Phys. Chem. A 115, 1172
(2011).13. M. H. Mok and J. C. Polanyi, J. Chem. Phys. 51, 1451 (1969).14. J. C. Polanyi and W. H. Wong, J. Chem. Phys. 51, 1439 (1969).

144
15. M. J. Bronikowski, W. R. Simpson, B. Girard and R. N. Zare, J. Chem. Phys. 95, 8647 (1991).
16. M. J. Bronikowski, W. R. Simpson and R. N. Zare, J. Phys. Chem. 97, 2194 (1993).17. A. Sinha, M. C. Hsiao and F. F. Crim, J. Chem. Phys. 92, 6333 (1990).18. F. F. Crim, A. Sinha, M. C. Hsiao and J. D. Thoemke, Jerusalem Symp. Quantum Chem.
24, 217 (1991).19. R. B. Metz, J. D. Thoemke, J. M. Pfeiffer and F. F. Crim, J. Chem. Phys. 99, 1744
(1993).20. J. D. Thoemke, J. M. Pfeiffer, R. B. Metz and F. F. Crim, J. Phys. Chem. 99, 13748
(1995).21. J. M. Pfeiffer, J. D. Thoemke, R. B. Metz, A. Sinha, M. C. Hsiao, E. Woods and F. F.
Crim, Springer Ser. Chem. Phys. 61, 32 (1996).22. M. J. Bronikowski, W. R. Simpson and R. N. Zare, J. Phys. Chem. 97, 2204 (1993).23. A. Sinha, M. C. Hsiao and F. F. Crim, J. Chem. Phys. 94, 4928 (1991).24. G. B. I. Scott, D. A. Fairley, C. G. Freeman, M. J. McEwan and V. G. Anicich, J. Chem.
Phys. 109, 9010 (1998).25. Z. Karpas and J. W. T. Huntress, Chem. Phys. Lett. 59, 87 (1978).26. Y.-H. Chiu, H. Fu, J.-T. Huang and S. L. Anderson, J. Chem. Phys. 102, 1199 (1995).27. J. Liu, B. Van Devener and S. L. Anderson, J. Chem. Phys. 116, 5530 (2002).28. B. W. Uselman, J. M. Boyle and S. L. Anderson, Chem. Phys. Lett. 440, 171 (2007).29. D. Gerlich, in State-selected and state-to-state ion-molecule reaction dynamics, Part I.
Experiment, edited by C. Y. Ng and M. Baer (Wiley, New York, 1992), Vol. LXXXII, pp. 1-176.
30. J. M. Boyle, D. M. Bell and S. L. Anderson, Journal of Chemical Physics 134, 034311 (2011).
31. J. Liu, B. W. Uselman, B. Van Devener and S. L. Anderson, Phys. Chem. Chem. Phys. 8, 4575 (2006).
32. J. D. C. Jones, K. Birkinshaw and N. D. Twiddy, Chem. Phys. Lett. 77, 484 (1981).33. M. J. Frisch, G. W. Trucks, H. B. Schlegel, G. E. Scuseria, M. A. Robb, J. R. Cheeseman,
J. J. A. Montgomery, T. Vreven, K. N. Kudin, J. C. Burant, J. M. Millam, S. S. Iyengar,J. Tomasi, V. Barone, B. Mennucci, M. Cossi, G. Scalmani, N. Rega, G. A. Petersson, H. Nakatsuji, M. Hada, M. Ehara, K. Toyota, R. Fukuda, J. Hasegawa, M. Ishida, T. Nakajima, Y. Honda, O. Kitao, H. Nakai, M. Klene, X. Li, J. E. Knox, H. P. Hratchian, J. B. Cross, C. Adamo, J. Jaramillo, R. Gomperts, R. E. Stratmann, O. Yazyev, A. J. Austin,

145
R. Cammi, C. Pomelli, J. W. Ochterski, P. Y. Ayala, K. Morokuma, G. A. Voth, P. Salvador, J. J. Dannenberg, V. G. Zakrzewski, S. Dapprich, A. D. Daniels, M. C. Strain, O. Farkas, D. K. Malick, A. D. Rabuck, K. Raghavachari, J. B. Foresman, J. V. Ortiz, Q. Cui, A. G. Baboul, S. Clifford, J. Cioslowski, B. B. Stefanov, G. Liu, A. Liashenko, P. Piskorz, I. Komaromi, R. L. Martin, D. J. Fox, T. Keith, M. A. Al-Laham, C. Y. Peng, A. Nanayakkara, M. Challacombe, P. M. W. Gill, B. Johnson, W. Chen, M. W. Wong, C. Gonzalez and J. A. Pople, (Gaussian, Inc., Pittsburgh PA, 2003).
34. S. G. Lias, in NIST Standard Reference Database Number 69, edited by P. J. Linstrom and W. G. Mallard (National Institute of Standards and Technology, Gaithersburg, MD, 2003), pp. http://webbook.nist.gov.
35. M. W. Chase, Jr., NIST-JANAF thermochemical tables, 4th ed. (American Chemical Society, and American Institute of Physics for the National Institute of Standards and Technology, 1998).
36. J. Liu, B. W. Uselman, J. M. Boyle and S. L. Anderson, J. Chem. Phys. 125, 133115 (2006).
37. L. Hanley, S. A. Ruatta and S. L. Anderson, J. Chem. Phys. 87, 260 (1987).38. P. B. Armentrout, in The Encyclopedia o f Mass Spectrometry. Volume 1: Theory and Ion
Chemistry, edited by P. B. Armentrout (Elsevier, Amsterdam, 2003), pp. 417-426.39. P. B. Armentrout, in The Encyclopedia o f Mass Spectrometry. Volume 1: Theory and Ion
Chemistry, edited by P. B. Armentrout (Elsevier, Amsterdam, 2003), pp. 426-434.40. P. B. Armentrout, Int. J. Mass Spectrometry 200, 219 (2000).41. D. Gerlich, Adv. Chem. Phys. 82, 1 (1992).42. J. Liu, B. V. Devener and S. L. Anderson, J. Chem. Phys. 119, 200 (2003).43. G. A. Fisk, J. D. McDonald and D. R. Herschbach, Discuss. Faraday Soc. 44, 228 (1967).44. W. M. Hayne, Handbook o f Chemistry and Physics, 91 ed. (CRC Press/Taylor and
Francis, Boca Raton, FL, 2004).45. J. Liu, K. Song, W. L. Hase and S. L. Anderson, J. Am. Chem. Soc. 126, 8602 (2004).46. R. D. Levine and R. B. Bernstein, Molecular Reaction Dynamics and Chemical
Reactivity. (Oxford University Press, New York, 1987).

146
Table 9.1. Product ion velocity distribution fit resultsEcol = 1.4
n2h+ n2d+Ecol = 2.0
n2h+ n2d+Ecol = 4.0
n2h+ n2d+Ground
State<Erecoil> / <Eavail>
<Erecoil> (eV)R aRasym
0.70 0.70 0.30 0.29 2.4 2.4
0.70 0.75 0.60 0.63 9.1 10.0
0.70 0.68 2.00 1.95 5.5 5.6
Bend<Erecoil> / <Eavail>
<Erecoil> (eV) Rasym
0.68 0.68 0.39 0.36 2.6 4.0
0.68 0.76 0.70 0.78 4.6 5.0
0.68 0.68 2.1 2.1 4.3 3.2
ODStretch
<Erecoil> / <Eavail> <Erecoil> (eV)
Rasym
0.61 0.68 0.38 0.42 2.3 1.8
0.65 0.67 0.74 0.76 3.9 6.0
0.68 0.69 2.1 2.1 6.6 4.4
OHStretch
<Erecoil> / <Eavail> <Erecoil> (eV)
Rasym
0.58 0.61 0.45 0.48 2.5 3.8
0.62 0.64 0.79 0.81 4.9 5.0
0.72 0.70 2.2 2.2 6.0 5.0
a Rasym = experimental value of forward-backward asymmetry. A larger value indicates a larger value of backward-scattered products (slower than the velocity center of mass).
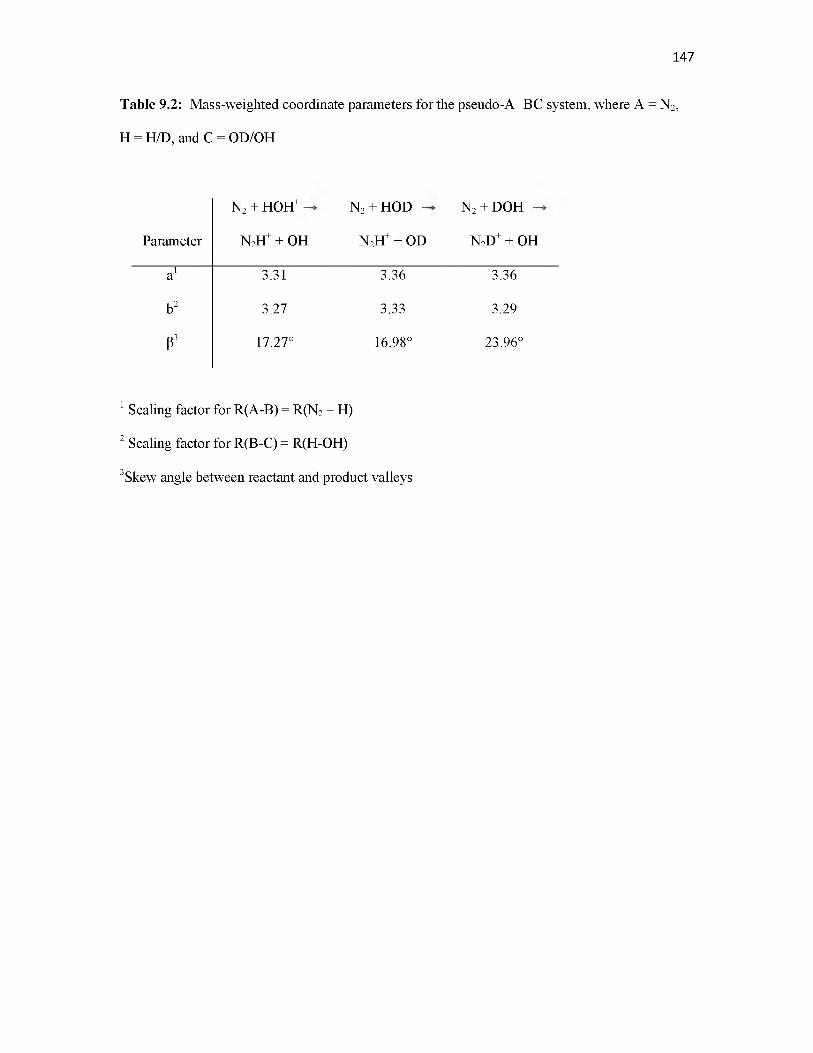
147
Table 9.2: Mass-weighted coordinate parameters for the pseudo-A+BC system, where A = N2, H = H/D, and C = OD/OH
ParameterN2 + HOH+ —
N 2 H+ + OHN2 + HOD+ —
N2H+ + ODN2 + DOH+ —
N2D+ + OHa1 3.31 3.36 3.36b2 3.27 3.33 3.29
P3 17.27° 16.98° 23.96°
1 Scaling factor for R(A-B) = R(N2 - H)2 Scaling factor for R(B-C) = R(H-OH)3Skew angle between reactant and product valleys
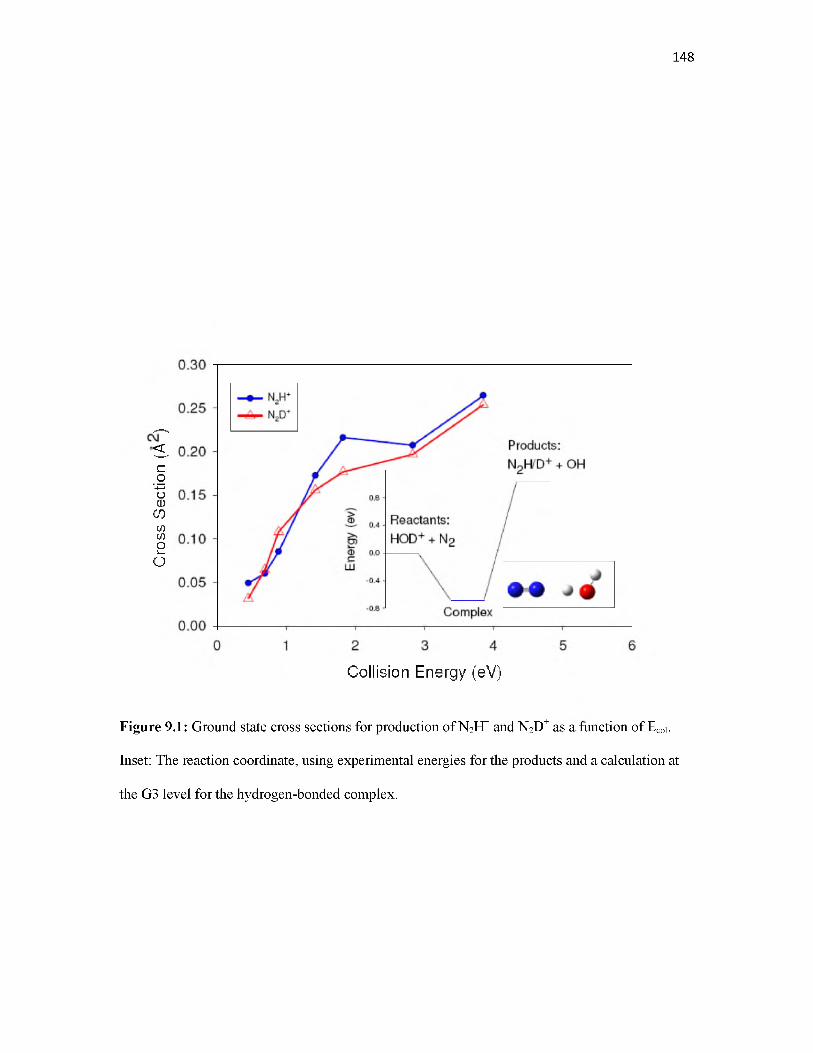
Cros
s Se
ction
(A )
148
Collision Energy (eV)
Figure 9.1: Ground state cross sections for production of N2H+ and N2D+ as a function of Ecol. Inset: The reaction coordinate, using experimental energies for the products and a calculation at the G3 level for the hydrogen-bonded complex.
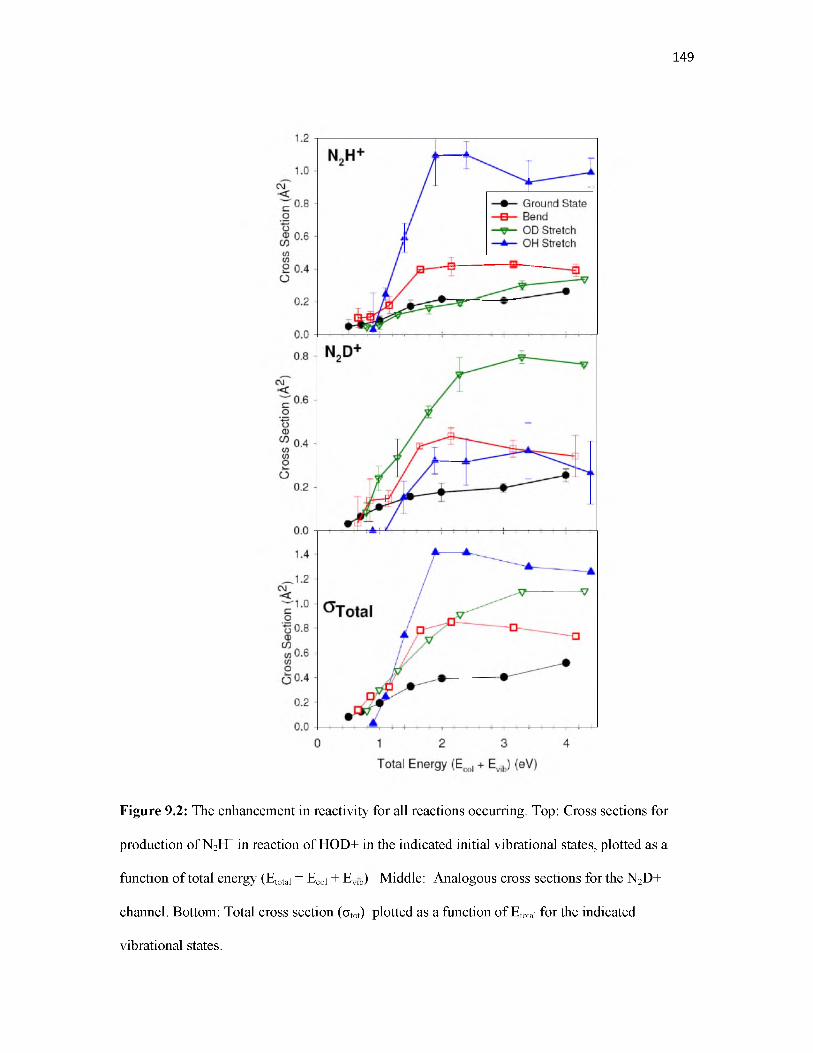
149
Figure 9.2: The enhancement in reactivity for all reactions occurring. Top: Cross sections for production of N2H+ in reaction of HOD+ in the indicated initial vibrational states, plotted as a function of total energy (Etotal = Ecol + Evib) Middle: Analogous cross sections for the N2D+ channel. Bottom: Total cross section (otot) plotted as a function of Etotal for the indicated vibrational states.

150
0 1000 2 0 0 0 3 0 00 4 0 0 0 5 0 0 0 6000
Lab Frame Velocity (m/s)
Figure 9.3: Lab frame axial velocity (vaxial) distribution for N2H+ produced in reaction of HOD+.
Experimental data denoted by * Ground State, D Bend, v OD Stretch, and o OH Stretch; Simulations denoted by the curves passing through the data. Heavy vertical lines indicate the lab frame velocity of the center-of-mass frame (<VCM>).
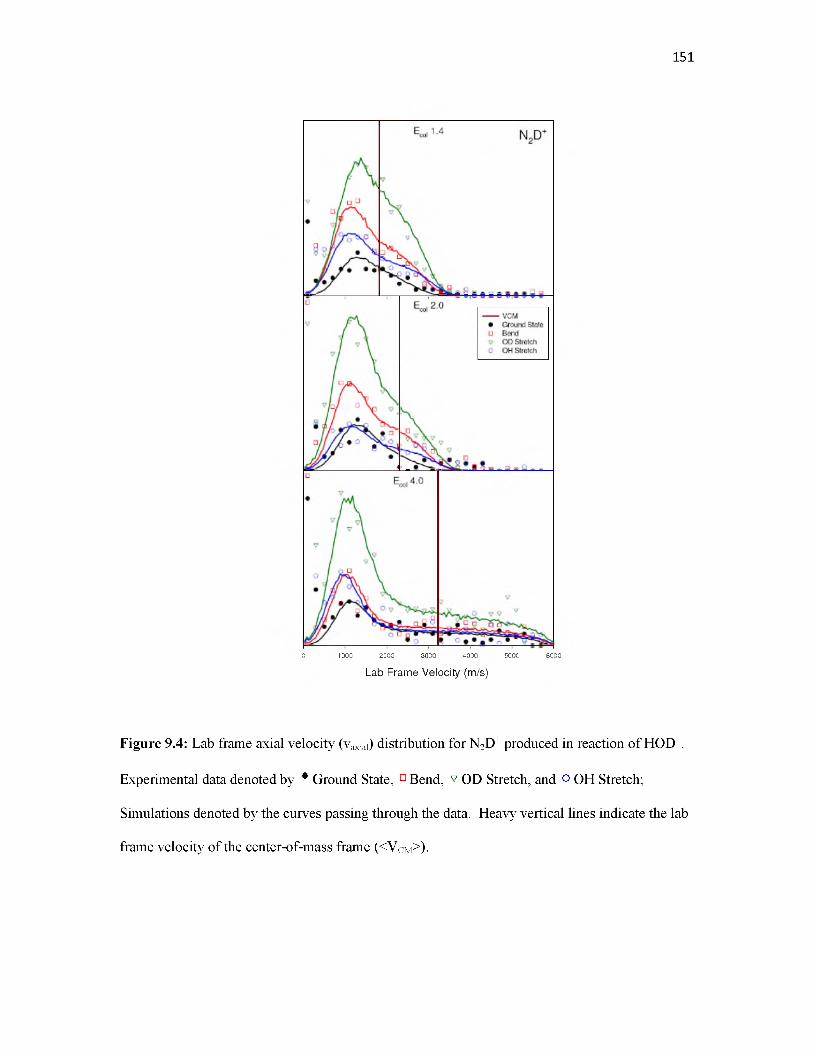
151
0 1000 2000 3000 4000 5000 6000
Lab Frame Velocity (m/s)
Figure 9.4: Lab frame axial velocity (vaxial) distribution for N2D+ produced in reaction of HOD+.
Experimental data denoted by * Ground State, D Bend, v OD Stretch, and o OH Stretch; Simulations denoted by the curves passing through the data. Heavy vertical lines indicate the lab frame velocity of the center-of-mass frame (<VCm>).
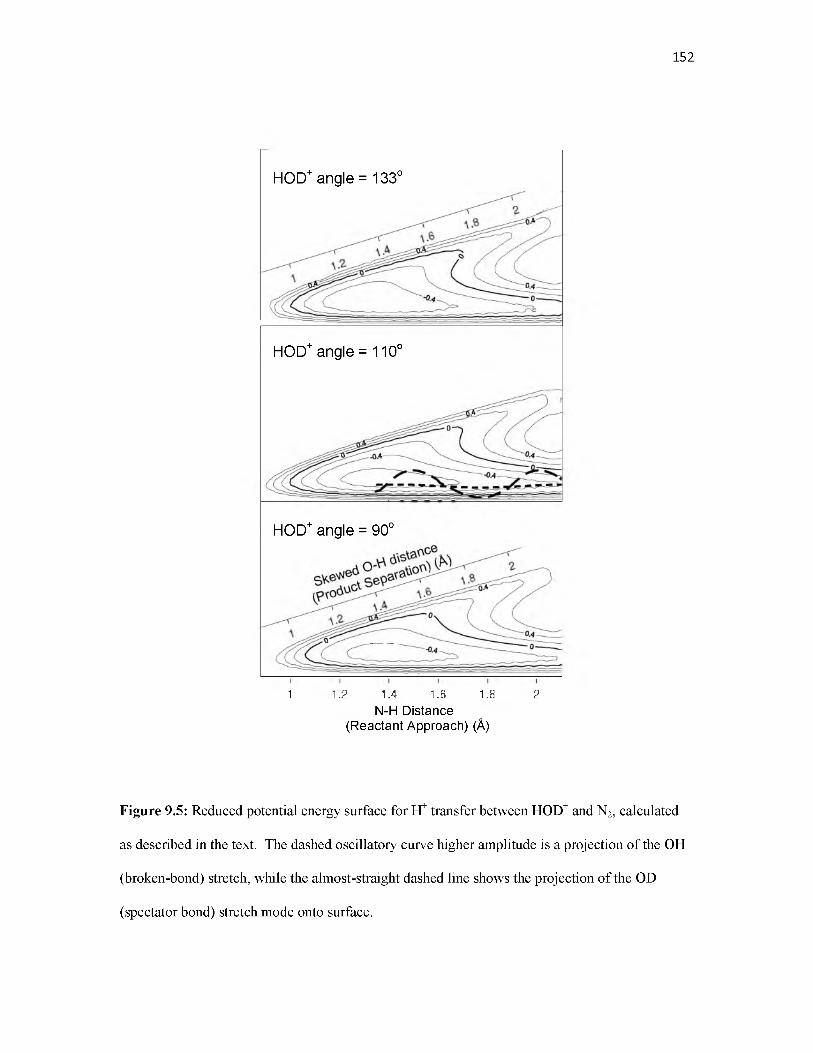
152
HOD+ angle = 133o
HOD+ angle = 110o
HOD+ angle = 90o
1 1.2 1.4 1.6 1.8 2N-H Distance
(Reactant Approach) (A)
Figure 9.5: Reduced potential energy surface for H+ transfer between HOD+ and N2 , calculated as described in the text. The dashed oscillatory curve higher amplitude is a projection of the OH (broken-bond) stretch, while the almost-straight dashed line shows the projection of the OD (spectator bond) stretch mode onto surface.
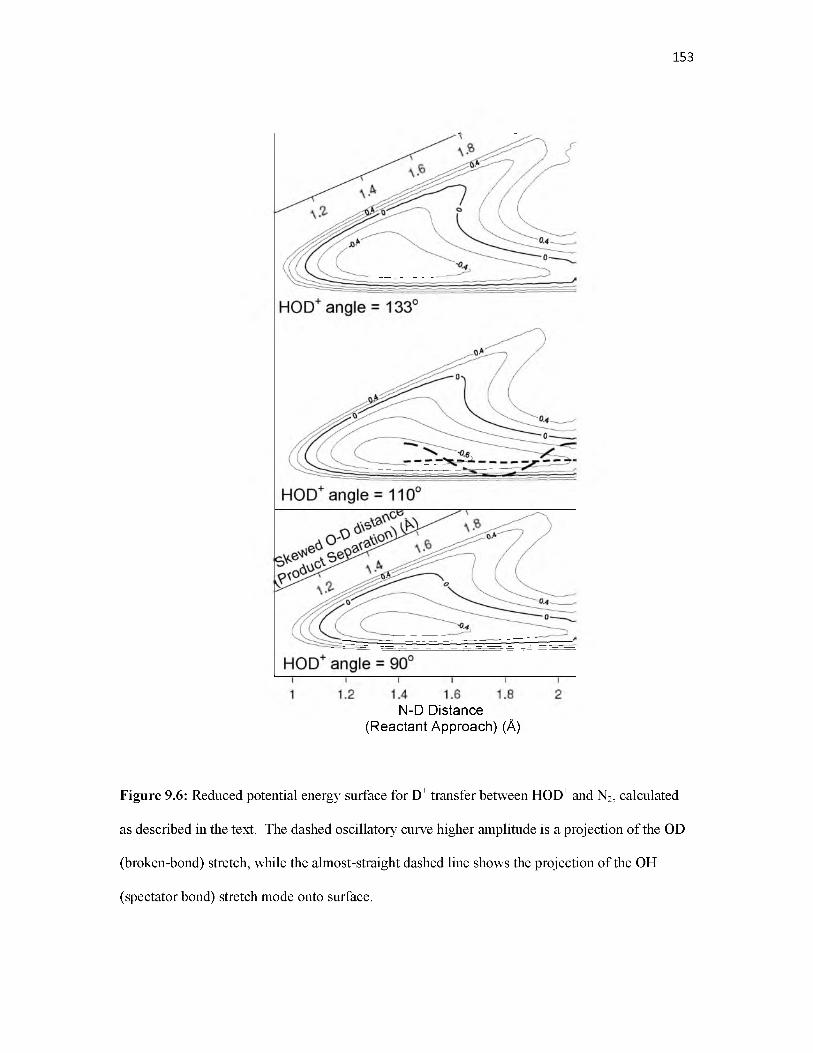
153
N-D Distance (Reactant Approach) (A)
Figure 9.6: Reduced potential energy surface for D+ transfer between HOD+ and N2, calculated as described in the text. The dashed oscillatory curve higher amplitude is a projection of the OD (broken-bond) stretch, while the almost-straight dashed line shows the projection of the OH (spectator bond) stretch mode onto surface.
CHAPTER 10
EFFECTS OF COLLISIONAL AND VIBRATIONAL VELOCITY ON PROTON AND DEUTERON TRANSFER IN THE REACTION OF HOD+
WITH CO
Reprinted with permission from David M. Bell, Scott L. Anderson, and Journal of Physical Chemistry A 117, 1083. Copyright 2013, American Chemical Society

OverviewReaction of HOD+ with CO was studied over the collision energy (Ecol) range between
0.18 eV and 2.87 eV, for HOD+ in its ground state and with one quantum in each of its vibrational modes: (001) - predominately OH stretch; (010) - bend, and (100) - predominately OD stretch. In addition to integral cross sections, product recoil velocity distributions were also measured for each initial condition. The dominant reactions are near-thermoneutral proton and deuteron transfer, generating HCO+ and DCO+ product ions by a predominantly direct mechanism. The HCO+ and DCO+ channels occur with combined efficiency of 76% for ground state HOD+ at our lowest Ecol, increasing to 94% for Ecol around 0.33 eV, then falling at high Ecol to ~40%. The HCO+ and DCO+ channels have a complicated dependence on HOD+ vibrational state. Excitation of the OH or OD stretch modes enhances H+ or D+ transfer, respectively, and inhibits D+ or H+ transfer. Bend excitation preferentially enhances H+ transfer, with no effect on D+ transfer.There is no coupling of energy initially in any HOD+ vibrational mode to recoil velocity of either of the product ions, even at low Ecol where vibrational excitation doubles or triples the energy available to products. The results suggest that transfer of H or D atoms is enhanced if the atom in question has a high vibrational velocity, and that this effect offsets what is otherwise a general inhibition of reactivity by added energy. HOCO+ + D and DOCO+ + H products are also observed, but as minor channels despite being barrierless and exoergic. These channels appear to be complex-mediated at low Ecol, essentially vanish at intermediate Ecol, then reappear with a direct reaction mechanism at high Ecol.
IntroductionThe singly-deuterated water cation (HOD) is interesting from a dynamical perspective
because the break in symmetry converts what would be the symmetric and asymmetric stretches in H2O+ into a pair of modes that have substantial local character. In the (100) mode (293 meV), the OD bond displacement is ~9.5 times greater than that of the OH bond, and conversely the OH
155

displacement in the (001) mode (396 meV) is ~30 times greater than the OD displacement. We will, therefore, refer to the (100) vibration in HOD+ as the “OD stretch”, and the (001) vibration as the “OH stretch”. In addition to the two stretches, there is the (010), bend mode (153 meV), which is also local in the sense that the amplitude, hence velocity, of the H atom is twice that of the D atom.
By preparing HOD+ with selected excitation in the three modes, we are able to examine how motion localized in specific bonds, as well as bending, may lead to mode- and bond-specific effects on H+ and D+ transfer reactions. In the reaction of HOD+ + CO2 (0.55eV endoergic),1 exciting the OH stretch doubles the cross section for H+ transfer, while having little effect on D+ transfer, while OD stretch excitation preferentially enhances D+ transfer and has little effect on H+ transfer. Both the OH and OD stretch effects are substantially larger than the effect of equivalent increases in the collision energy (Ecol). Such effects are in line with what might be expected from considering vibrational motion driving the system toward the H+ or D+ transfer product channels, and similar bond-specific stretching effects have been reported for reactions of neutral HOD.2-8 For the HOD+ + CO2 system, bending excitation enhances both H+ and D+ transfer, such that bending gives the largest enhancement of the total cross section, despite having no obvious coupling to the reaction coordinate. HOD+ reaction with N2 (1.03eV endoergic)9 has stronger, and qualitatively different, vibrational effects. OH stretch excitation enhances the cross section for H+ transfer by a factor of five, but also results in a ~70 - 90% enhancement of the D+ transfer channel. Excitation of the lower energy OD stretch enhances the D+ transfer channel by a factor of 3.5, and has essentially no effect on H+ transfer. In this system, bend excitation also enhances both H+ and D+ transfer by about a factor of two; because the OH stretch effects are so large, this mode has the largest effect on total reactivity. All three modes produce much larger enhancements than equivalent increases in Ecol, except near threshold, where all forms of energy are equally effective.
156

157
Reactions of the water cation are of interest both for the dynamical reasons discussed above, and because water is common in both terrestrial and interstellar environments.10’ 11 The reaction of H2O+ with CO has been investigated under thermal conditions in selected ion flow tubes12-14 and using ion cyclotron resonance,15 as part of the process of developing a table of proton affinities. As discussed above, in systems where H+ and D+ transfer are substantially endothermic, the vibrational effects are large and strongly bond/mode-specific. Conversely, exothermic proton transfer in ion-molecule reactions is often found to occur with essentially unit efficiency,16 implying that the reaction is insensitive to initial conditions, and suggesting that bond- or mode-specific effects might vanish. The HOD+ + CO system is interesting because the proton affinities of CO (594 kJ/mol) and OH (593.2 kJ/mol) are virtually identical,17 such that proton transfer in this system is thermoneutral, within the uncertainty of the thermochemistry. From our perspective, therefore, this system is ideal for examining how mode- or bond-specific effects evolve as the energetics change from endothermic to exothermic. We previously reported a study of the reaction of HOD+ with NO2, where H+ and D+ transfer are also near thermoneutral18; however, that system is quite different because reaction occurs on both triplet and singlet potential energy surfaces, and because charge transfer is exoergic by over 3 eV, and dominates the chemistry. Here we report a study of the reaction of mode-selectively excited HOD+ with CO. Integral cross sections and product recoil velocity distributions are reported for all products over the center-of-mass collision energy (Ecol) range from 0.18eV to 2.87 eV.
MethodologyThe experiments were done using a guided ion beam tandem mass spectrometer that has
been described previously.1, 19 To produce the HOD molecular beam, we mixed 50% H2O and 50% D2O, creating a mixture that contains 25% H2O, 50% HOD, and 25% D2O. Helium was bubbled through the mixture to generate a gas mixture that is 96% He, 1% H2O, 2% HOD, and 1% D2O. This gas mixture was pulsed into our experiment as a skimmed supersonic beam, in
158
order to internally cool HOD. The HOD was subsequently ionized by REMPI through the C (1B1) state, allowing the HOD+ to be produced in the following states: (000) - ground state, (001)- OH stretch, 0.396eV, (010) - bend, 0.153eV, and (100) - OD stretch, 0.293eV.20 The purity of these ion states was measured by photoelectron spectroscopy, which found that the (000), (001), and (100) states are 100% pure, while ionizing through the bend level of the C state produces a mixture of 56 % ions in the bend state (010), with the balance in the ground state. Because we also measure cross sections for ground state HOD+, it is straightforward to subtract out the contribution from the ground state contamination, and the data presented below have been so corrected.
The REMPI laser intersected the water molecular beam between a pair of planar electrodes, and the ions generated were first injected into a quadrupole ion guide and then into a quadrupole mass filter. The mass filter was used to produce a beam of pure HOD+, at 19 amu, and the ion source was operated under conditions to avoid formation of H3O+ (also 19 amu), as shown by absence of signal for isotopologs of H3O+ such as HD2O+ or D3O+ which can be detected without interference. The primary beam was then passed through a time-of-flight (TOF) gating electrode set that was used to narrow the kinetic energy spread of the primary beam to ~0.15 eV. The state-, mass-, and energy- selected ions were guided into a series of 8-pole ion guides,21 powered by a pair of homemade radio-frequency generators22 operating at 3.1 MHz. The first ion guide passed through a 10 cm long scattering cell containing 1x10⁻⁴ Torr of CO, measured by a capacitance manometer. Product ions, together with remaining reactant ions, were then passed into a longer ion guide for TOF velocity analysis. Finally, the ions were passed through a quadrupole mass filter and then detected by an electron multiplier. The ion signal was counted with a P7882 FAST ComTec multichannel scalar, controlled by a LabView program. Integral cross sections were calculated from the ratio of reactant and product ion intensities (integrated from the TOF measurements), using the calibrated effective length of the scattering cell and the pressure of the scattering cell. To allow subtraction of reactions occurring with CO
in the chamber background outside the scattering cell, the gas inlet system alternately injects CO into the cell, and into the chamber background.
To check reproducibility and determine uncertainty, several complete data sets were taken on different days, each set including reactions of the four HOD+ vibrational states of interest. The data below consist of average values, with uncertainty determined from the standard deviation of the cross sections. In addition to random errors indicated by error bars in the figures, there are possible systematic effects that are harder to quantify. Error in the absolute scattering cell pressure and length calibration would result in an error in the absolute scale of the cross sections, but would have no effect on the most dynamically important results, including branching ratios, vibrational effects, velocity distributions, and collision energy dependences.We estimate that the absolute cross section scale is within ±20% of the correct value, and this assessment is consistent with thermal rate measurements in the literature,12, 13 discussed below. If detection efficiency varies with ion mass, there might be errors in both the absolute cross section scale, and the relative intensities of different products. To minimize these effects, we operated at the lowest possible mass spectrometer resolution. Because the corresponding product ion masses are nearly identical, the effects should be insignificant for comparing cross sections for production of products that differ only in whether they contain H vs. D, but there might be some effect on the relative cross sections for heavy (HOCO+/DOCO+) vs. light (HCO+/DCO+) products. Again, such errors would not affect comparison of data for different vibrational states.
To map out the reaction coordinate, electronic structure calculations were performed at the B3LYP/6-311++G** level of theory, using Gaussian03.23 The vibrational frequencies and zero-point energies were scaled by factors of 0.9613 and 0.9804, respectively.24 Transition states were verified to be first order saddle points by frequency calculations. When necessary, intrinsic reaction coordinate (IRC) calculations were used to determine which minima are connected by each TS.
159

160
To determine the kinetics and product branching that would result from statistical breakup of the various complexes identified on the reaction coordinate, Rice-Ramsperger-Kassel- Marcus (RRKM) rate and density of state calculations were performed using a program developed by Zhu and Hase.25 Direct state counting was used and the energetics, moments of inertia, and vibrational frequencies (scaled as mentioned above) were obtained from the B3LYP/6-311++G** calculations.
ResultsGround State Results
Products were observed at mass-to-charge ratios (m/z) of 29, 30, 45, and 46, corresponding to HCO+, DCO+, HOCO+, and DOCO+, respectively. The integral cross sections for the reaction of ground state HOD+ with CO are shown in Figure 10.1 over the center-of-mass (CM) collision energy (Ecol) range from 0.18 eV to 2.87 eV. For reference, Figure 10.1 also shows the total reaction cross section (ototal) and the collision cross section (ocollision). The hard sphere cross section (oHardsphere), calculated from reactant geometries and atomic radii26 with appropriate angle averaging, provides a reasonable estimate for the collision cross section at high Ecol. For lower Ecol, the attractive long range ion-dipole and ion-induced-dipole interactions increase the collision cross section by deflecting (capturing) large impact parameter collisions that would otherwise “miss”. Therefore, we use the capture cross section (ocapture), as formulated by Troe,27 to estimate Ocollision for ECol < ~1.6 eV, where ocapture exceeds OHardSphere, switching to OHardSphere higher energies.
The reactions generating these products are as follows:

161
HOD+ + CO (PT) ArH = 0.072 ± 0.042eV(DT) ArH = 0.061 ± 0.042eV(DL) ArH = -0.422 eV(HL) ArH = -0.485 eV
where the enthalpies of reaction are calculated for 0 K, determined using 0 K heats of formation, and corrected for deuteration effects by using zero point energies from G3 level calculations on the reactants and products. The heat of formation of HCO+ was determined from the 0 K proton affinity of CO.17 The major reaction channels are proton and deuteron transfer (PT and DT), which are both calculated to be slightly endoergic using 0 K energetics; however, at 298 K, the thermochemistry shifts such that PT is 8 meV endothermic and DT 4 meV exothermic, i.e., both are thermoneutral within the uncertainty. In our experiment, the CO is thermal at ~298K, but the ion beam should be rotationally cold and in its vibrational ground state. The observation that the cross section for DT is ~6% greater than that for PT at Ecol = 0.18 eV, may reflect the 12 meV energy difference between the two channels.
For low collision energies (<~0.33 eV), ototal is within experimental uncertainty of ocollision, i.e., reaction efficiency is near unity, overwhelmingly dominated by the combination of PT and DT. At high Ecol, the total reaction efficiency drops to ~40%. There is also some suggestion, although not outside our error limits, that reaction efficiency drops slightly at our lowest lowest Ecol (ototal/ ocollision ~76%). Such an apparent drop could simply reflect collection efficiency problems with slow product ions; however, a drop is consistent with the expectation that for thermoneutral, barrierless reactions like PT and DT, the total reaction efficiency should be about 2/3rd in the low energy limit, because the density of states (DOS) is roughly equal in the three arrangements: HOD+ + CO, HCO+ + OD, and DCO+ + OH. In fact, room temperature measurements of the H2O+ + CO ^ HCO+ + OH kinetics indicate that reaction occurs at only ~55% of the collision rate,12, 13 possibly because the reaction is not exactly thermoneutral, but also

because H2O+ is nonlinear, and therefore, the reactant arrangement has an additional rotational degree of freedom (vibrational degrees of freedom are inaccessible at thermal energies).
The other pair of products observed are HOCO+ and DOCO+, which correspond to hydrogen loss (HL) and deuterium loss (DL) from a [HDOCO]+ complex. Despite the fact that both channels are substantially exoergic, their cross sections are quite small. The low reaction efficiency is clearly not due to an energy barrier above the reactant asymptote, because both cross sections rise sharply with decreasing energy in the low Ecol ranges. The HL and DL cross sections go through minima around 0.75 eV, where the reaction efficiency is below 1%, then increase slowly at higher Ecol. One interesting question is why HOCO+ was not observed in any of the thermal energy experiments, despite being barrierless (as shown below) and considerably more energetically favorable than the HCO+ channel.12-15 This product presumably formed to some extent in the thermal energy experiments, but was probably destroyed by secondary reactions with the CO neutral reactant to form HCO+ + CO2. Because this secondary reaction occurs with unit efficiency at thermal energies,15 it is likely that HOCO+ product ions were simply detected as HCO+ (the major product ion).
Computational ResultsThe computational results for HOD+ + CO are summarized in Figure 10.2 and Table 10.1,
where energetics are reported as A rHo(298K) in order to allow direct comparison with both the experimental results (where the neutral reactant is thermal) and literature data compiled by Lias et al.2 For simplicity, Figure 10.2 shows the low energy reaction pathways for the undeuterated H2O+ + CO system, with energetics for transition states and complexes calculated at the B3LYP/6-311++G** level of theory, referenced to experimental values for reactants and products. Table 10.1 gives the energetics for the various isotopic and isomeric analogs that are possible in the HOD+ + CO system. There is a reactant-like complex (RC) bound by 1.41 eV with respect to reactants, which has the oxygen of HOD bound to the carbon end of CO, at a
162
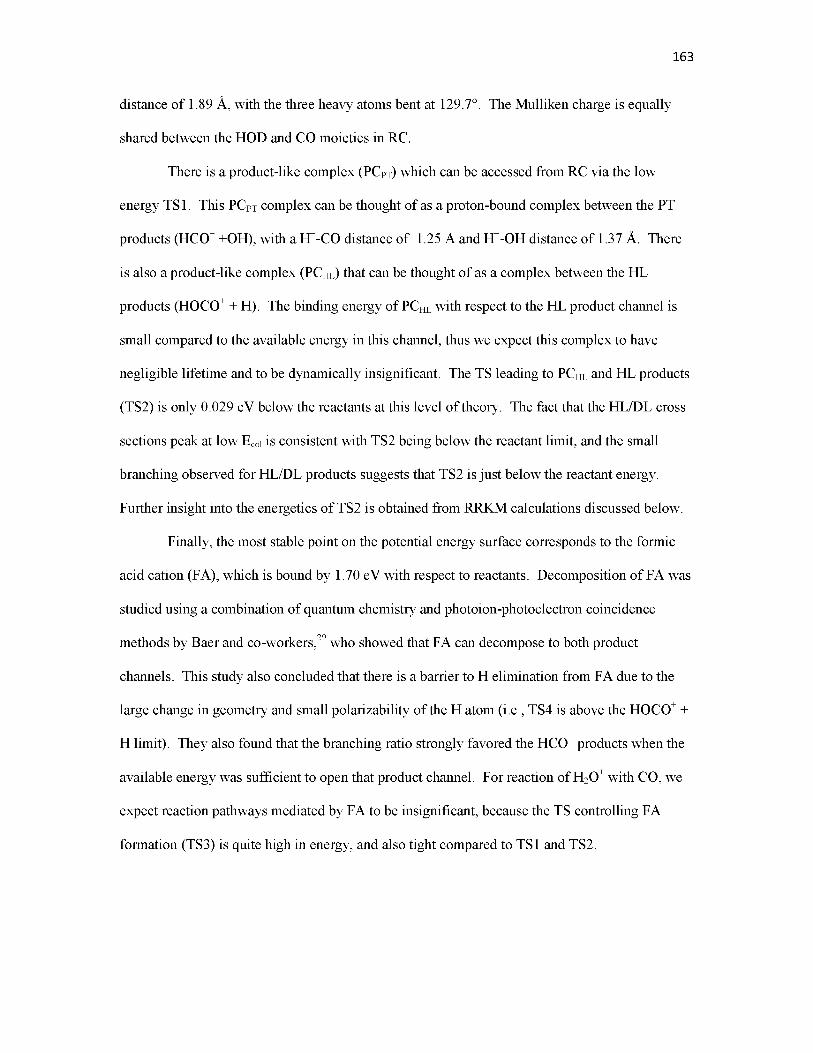
distance of 1.89 A, with the three heavy atoms bent at 129.7°. The Mulliken charge is equally shared between the HOD and CO moieties in RC.
There is a product-like complex (PCPT) which can be accessed from RC via the low energy TS1. This PCPT complex can be thought of as a proton-bound complex between the PT products (HCO+ +OH), with a H+-CO distance of 1.25 A and H+-OH distance of 1.37 A. There is also a product-like complex (PCHL) that can be thought of as a complex between the HL products (HOCO+ + H). The binding energy of PCHL with respect to the HL product channel is small compared to the available energy in this channel, thus we expect this complex to have negligible lifetime and to be dynamically insignificant. The TS leading to PCHL and HL products (TS2) is only 0.029 eV below the reactants at this level of theory. The fact that the HL/DL cross sections peak at low Ecol is consistent with TS2 being below the reactant limit, and the small branching observed for HL/DL products suggests that TS2 is just below the reactant energy. Further insight into the energetics of TS2 is obtained from RRKM calculations discussed below.
Finally, the most stable point on the potential energy surface corresponds to the formic acid cation (FA), which is bound by 1.70 eV with respect to reactants. Decomposition of FA was studied using a combination of quantum chemistry and photoion-photoelectron coincidence methods by Baer and co-workers,29 who showed that FA can decompose to both product channels. This study also concluded that there is a barrier to H elimination from FA due to the large change in geometry and small polarizability of the H atom (i.e., TS4 is above the HOCO+ + H limit). They also found that the branching ratio strongly favored the HCO+ products when the available energy was sufficient to open that product channel. For reaction of H2O+ with CO, we expect reaction pathways mediated by FA to be insignificant, because the TS controlling FA formation (TS3) is quite high in energy, and also tight compared to TS1 and TS2.
163

Velocity DistributionsTo provide insight into the dynamics of the reactions in this system, including possible
mediation by complexes, we measured the axial component (vaxial) of the product recoil velocity distributions for the entire range of reactant initial conditions (vibrational state and Ecol). Figures 10.3 - 10.7 show the lab frame vaxial distributions for HCO+, DCO+, HOCO+, and DOCO+, respectively, formed in reaction of ground state HOD+ with CO. In each figure, the experimental data are shown by solid circles connected by thin lines, and the heavy solid curves show simulations of the data, discussed below. The heavy vertical lines indicate <VCM>, i.e., the velocity of the center-of-mass frame with respect to the lab, averaged over the distributions of ion beam and target velocities. Velocity distributions were also measured for the HOCO+ and DOCO+ products, and are presented in Figure 10.5 and 10.6. As expected for a product channel where the neutral product is much lighter than the product ion being measured, the HOCO+/DOCO+ vaxial distributions are centered on VCM, and provide no dynamical insight.
Collisions in our experiment are, on average, co-axial with the ion guide, and therefore, both <VCM> and the average relative velocity vector of the collisions, <vrel>, are also co-axial with the ion guide. For this reason, considerable dynamical insight can be inferred directly from the lab frame vaxial distributions. For example, ions that appear with vaxial slower than <VCM> correspond to ions that are backward-scattered in the center-of-mass frame, while vaxial faster than <VCM> corresponds to forward scattering. If reaction is mediated by a complex with lifetime, Tc0mplex, greater than the rotational period of the complex, Trotation, then the vaxial distribution must be forward-backward symmetric about <VCM>. Therefore, a distribution that is not symmetric about <VCM> is a sign that reaction is not mediated by a long-lived complex. Finally, the width and displacement of the measured vaxial values from <VCM> provide insight into energy partitioning into recoil.
Note that we define “forward” and “backward” in terms of the direction of the product ion velocity relative to the reactant ion beam velocity in the center-of-mass frame. For reactions
164

like PT and DT, where the charge is transferred, this definition leads to a reversal of the usual meaning of “forward” and “backward”. For example, a large impact parameter “stripping” collision of DO-H+ with CO, where H+ transfers with little deflection of the heavy DO and CO moieties, will result in HCO+ product ions that are backward-scattered relative to the reactant ion beam. Conversely, a head-on collision in which the heavy moieties rebound at 180° with respect to their initial direction will give rise to HCO+ that is forward-scattered with respect <VCM>. In both PT and DT channels, there is a clear propensity toward backward scattering at high Ecol, which suggests stripping-like dynamics.
One issue for this system is that, due to the thermal velocity of the CO reactant, a small fraction of the product ions are scattered with negative lab frame velocities (i.e., moving away from the detector). To insure that these ions are collected, the electrode used to inject ions into the scattering ion guide is always biased slightly positive with respect to the scattering ion guide, reflecting these ions toward the detector. Clearly, the TOF values measured for these ions are distorted by the reflection process, contributing to an artificial peak at positive, but near-zero lab velocity. In addition, slow ions are particularly susceptible to any distortions in the surface potential of the ion guides, which can result in additional perturbation of the low velocity portion of the vaxial distributions. For this reason, we ignore the vaxial range below 500m/s in fitting of the distributions.
To obtain insight into energy disposal in the reactions, and correct for the broadening from the reactant velocity distributions, the data are fit to a model of the scattering dynamics.The fits are done using a Monte Carlo simulation of the experiment that samples the distributions of HOD+ energy and angle, and the thermal distribution of CO velocities, and convolutes these with recoil velocity and angle values sampled from the scattering dynamics model.30 This model has three adjustable parameters. The recoil energy distribution is modeled as a Gaussian, with peak energy and width expressed as fractions (fpeak, fwidth) of the energy available to the products, Eavail. For the angular distribution, we use the osculating complex model,31 where it is assumed
165

166
that there is a preferred scattering direction, but that the angular distribution is broadened by rotation of a short-lived collision complex. The degree of broadening is controlled by the parameter Tratio, which is the ratio of the complex rotational period, xrotation, to its lifetime, xc0mplex. In energy ranges where collision complexes are expected to have negligible lifetimes, Tratio can be considered as a simple indicator of the asymmetry of the vaxial distributions. Tratio, fpeak, and fwidth are varied until the simulated vaxial distribution is in good agreement with experiment.
The quality of the fits can be judged in Figures 10.3 and 10.4, and the results are summarized in Table 10.2 for reaction of ground state HOD+. For each reactant initial condition, the table reports <Eavail>, which is the average available energy including collisional, vibrational, and rotational energy. Eratio is simply the average fraction of Eavail appearing as recoil energy(<Erecoil>/<Eavail>), and Tratio, as noted, is essentially a measure of the forward-backward asymmetry of the angular distribution (asymmetry increases with increasing Tratio).
For Ecol values greater than 0.35 eV, the vaxial distributions for both HCO+ and DCO+ products are clearly asymmetric, and become increasingly backward-scattered with increasing Ecol. As noted above, backward-scattered product ions correspond to small angle scattering, indicating that reaction at high Ecol is dominated by stripping-like collisions at large impact parameters (b). For reference, Figures 10.3 and 10.4 also indicate, with vertical dashed lines, the spectator-stripping limit velocities at each Ecol. Clearly, the distributions become increasingly stripping-like at high Ecol; however, there continues to be significant intensity in the forward direction, indicating that H+ and D+ transfer also occur in small b, rebounding collisions. As shown in the table, Eratio is roughly constant at ~40 - 50%. For these thermoneutral reactions, Ecol is the dominant contribution to Eavail, thus it appears that approximately half the initial collision energy is retained in product recoil over the entire range of Ecol. Eratio of 40 - 50 % is much larger than what would be expected from equipartition of Eavail into all the energetically accessible degrees of freedom (translation plus four rotations at low Ecol, adding vibrational modes with increasing Ecol).
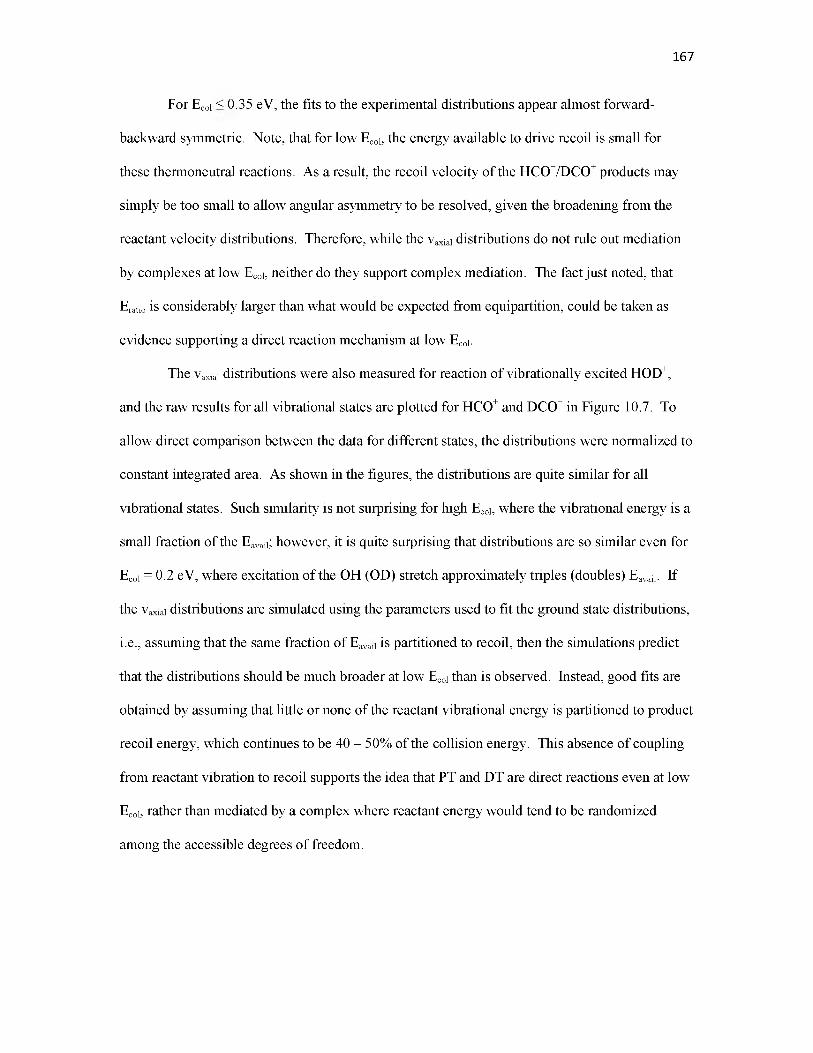
For Ecol < 0.35 eV, the fits to the experimental distributions appear almost forward- backward symmetric. Note, that for low Ecol, the energy available to drive recoil is small for these thermoneutral reactions. As a result, the recoil velocity of the HCO+/DCO+ products may simply be too small to allow angular asymmetry to be resolved, given the broadening from the reactant velocity distributions. Therefore, while the vaxial distributions do not rule out mediation by complexes at low Ecol, neither do they support complex mediation. The fact just noted, that Eratio is considerably larger than what would be expected from equipartition, could be taken as evidence supporting a direct reaction mechanism at low Ecol.
The vaxial distributions were also measured for reaction of vibrationally excited HOD+, and the raw results for all vibrational states are plotted for HCO+ and DCO+ in Figure 10.7. To allow direct comparison between the data for different states, the distributions were normalized to constant integrated area. As shown in the figures, the distributions are quite similar for all vibrational states. Such similarity is not surprising for high Ecol, where the vibrational energy is a small fraction of the Eavail; however, it is quite surprising that distributions are so similar even for Ecol = 0.2 eV, where excitation of the OH (OD) stretch approximately triples (doubles) Eavail. If the vaxial distributions are simulated using the parameters used to fit the ground state distributions,i.e., assuming that the same fraction of Eavail is partitioned to recoil, then the simulations predict that the distributions should be much broader at low Ecol than is observed. Instead, good fits are obtained by assuming that little or none of the reactant vibrational energy is partitioned to product recoil energy, which continues to be 40 - 50% of the collision energy. This absence of coupling from reactant vibration to recoil supports the idea that PT and DT are direct reactions even at low Ecol, rather than mediated by a complex where reactant energy would tend to be randomized among the accessible degrees of freedom.
167

Vibrational Mode Effects on the Integral Cross Sections Although vibrational excitation is uncoupled to product recoil, HOD+ vibration has
significant mode- and bond-specific effects on the cross sections for HCO+ and DCO+, as shown in Figure 10.8. Note that each channel is enhanced by stretch excitation of the bond broken in the collision (the “broken-bond stretch”), and inhibited by stretch excitation of the other bond (the “spectator bond stretch”). Bend excitation enhances HCO+ production at low Ecol, and DCO+ production appears to be slightly inhibited, but the inhibition is within the experimental uncertainty. In Figure 10.9, the HOCO+ and DOCO+ cross sections are plotted for the same range of Ecol and HOD+ vibrational state. For these minor channels, vibration appears to inhibit reaction at low Ecol, and may enhance reaction at high Ecol; however, it should be noted that these cross sections are quite small, thus the uncertainties in the comparisons are relatively large at low energies (~20%) and increases with increasing energy (up to ~60%). The vibrational effects on Ototai are shown in Figure 10.10. The effects on ototal are relatively small, because the effects of broken-bond and spectator bond stretch excitation largely cancel. In other words, the total cross section is relatively insensitive to reactant initial state, as might be expected from the near-unit total reaction efficiency; however, the PT/DT branching ratio changes by over a factor of three, depending on which stretch is excited.
DiscussionHOCO+ and DOCO+
We will begin by discussing the mechanism for the minor HOCO+ and DOCO+ channels. Their collision energy dependences are quite distinct from those of the major HCO+ and DCO+ channels, suggesting that they may be dynamically distinct as well. The Ecol dependence for both channels is bi-modal, with a component at low Ecol that is strongly inhibited by both Ecol and vibrational excitation, and a high Ecol component that is enhanced by Ecol, and possibly by HOD+ vibration as well. This kind of bimodal Ecol dependence is similar to that observed in reactions of
168
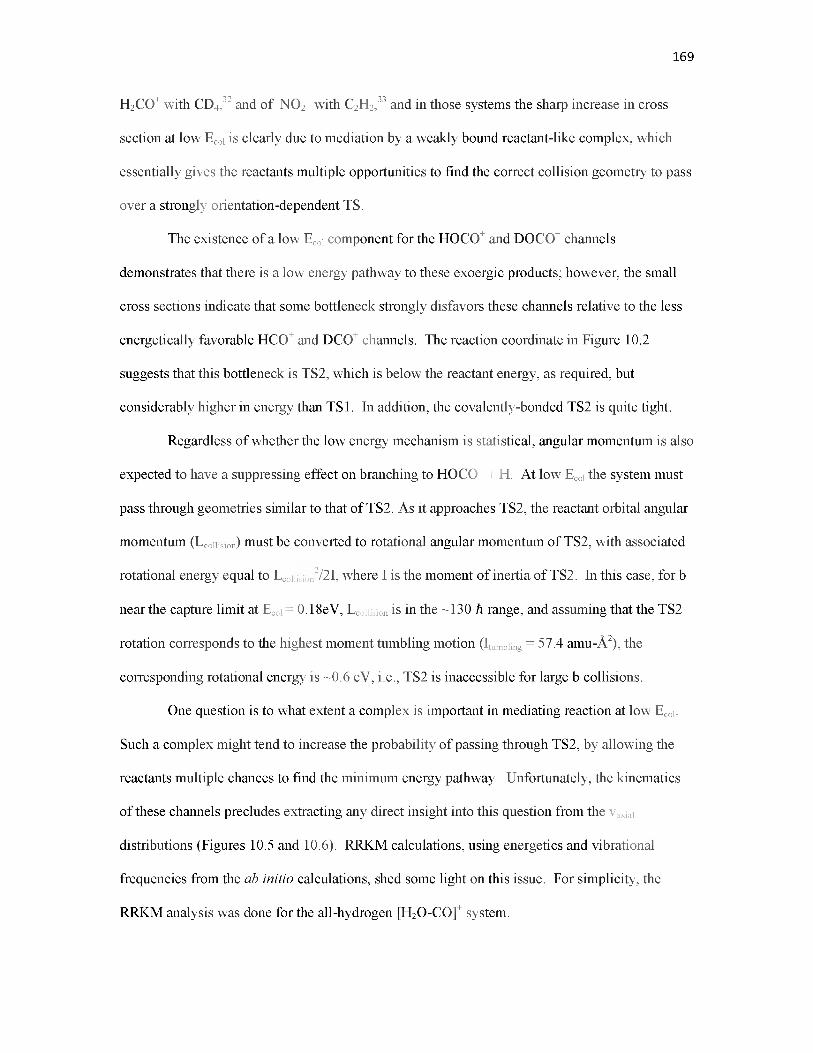
I ^'2, 33H2CO+ with CD4,32 and of NO2+ with C2H2,33 and in those systems the sharp increase in cross section at low Ecol is clearly due to mediation by a weakly bound reactant-like complex, which essentially gives the reactants multiple opportunities to find the correct collision geometry to pass over a strongly orientation-dependent TS.
The existence of a low Ecol component for the HOCO+ and DOCO+ channels demonstrates that there is a low energy pathway to these exoergic products; however, the small cross sections indicate that some bottleneck strongly disfavors these channels relative to the less energetically favorable HCO+ and DCO+ channels. The reaction coordinate in Figure 10.2 suggests that this bottleneck is TS2, which is below the reactant energy, as required, but considerably higher in energy than TS1. In addition, the covalently-bonded TS2 is quite tight.
Regardless of whether the low energy mechanism is statistical, angular momentum is also expected to have a suppressing effect on branching to HOCO+ + H. At low Ecol the system must pass through geometries similar to that of TS2. As it approaches TS2, the reactant orbital angular momentum (Lcollision) must be converted to rotational angular momentum of TS2, with associated rotational energy equal to Lcollision2/2I, where I is the moment of inertia of TS2. In this case, for b near the capture limit at Ecol = 0.18eV, Lcollision is in the ~130 h range, and assuming that the TS2 rotation corresponds to the highest moment tumbling motion (Itumbling = 57.4 amu-A2), the corresponding rotational energy is ~0.6 eV, i.e., TS2 is inaccessible for large b collisions.
One question is to what extent a complex is important in mediating reaction at low Ecol. Such a complex might tend to increase the probability of passing through TS2, by allowing the reactants multiple chances to find the minimum energy pathway. Unfortunately, the kinematics of these channels precludes extracting any direct insight into this question from the vaxial distributions (Figures 10.5 and 10.6). RRKM calculations, using energetics and vibrational frequencies from the ab initio calculations, shed some light on this issue. For simplicity, the RRKM analysis was done for the all-hydrogen [H2O-CO]+ system.
169

First, consider the complexes RC and PCPT, which as Figure 10.2 shows, are the only complexes likely to have both formation probabilities and lifetimes that might be significant at low Ecol. Because TS1 is low in energy compared to both reactants and PT products, the interconversion rates between RC and PCPT should be fast compared to the decay rates leading back to reactants or on to PT products, and this point was confirmed by RRKM calculations, where the rates for interconversion are ~8 times faster than the decay rate, over the low Ecol and Lcollision range where complexes are likely to be significant. The RRKM calculation also indicates that the density of states in RC is significantly higher than in PCPT, thus the interconverting R C ^PC pt complex would spend most of its lifetime in the more stable RC well. The lifetime of the R C ^PC pt complex is the inverse of the sum of the rates for decay via the three exit channels, viz back to reactants, on to PT products, and over TS2 to HL products. The lifetime of the R C ^PC pt complex is given in Table 10.3 for various Ecol and Lcollision values. In addition, the table also gives the RRKM branching into PT and HL product channels, calculated as the rates for decay into the two product channels, divided by the total decay rate (including decay back to reactants).
The lifetime of the complex is a few picoseconds at low Ecol, but drops below a picosecond by ~0.3 eV. For reference, note that at Ecol = 0.18 eV, it takes ~0.3 ps for reactants to travel 5 A of relative distance, which we give as a rough measure of the timescale for a completely direct collision. The RRKM results, therefore, suggest that the complex has dynamically significant lifetime only for our lowest collision energies, and even there, the lifetime is significant only for low Lcollision, i.e., low impact parameter collisions.
The branching ratios are also strongly dependent on Ecol and Lcollision. The orbiting TSs leading back to reactants and to PT products have several low energy degrees of freedom that are absent in the R C ^PC pt complex, while the covalently bound TS2 has both frequencies and rotational constants that are somewhat higher than the complex. As a consequence, increasing either Ecol or Lcollision leads to rapidly increasing rates for decay to reactants and to PT products.
170

The PT branching ratio, which is determined primarily by competition with decay back to reactants, is nearly constant except for very large Lcollision values, where PT is favored by an orbiting TS with slightly larger Itumbling than that for the TS controlling decay to reactants. In contrast, while increasing Ecol increases the branching to HOCO+, increasing Ecol also increases Lcollision, which strongly suppresses the HOCO+ branching. In summary, if mediation by the R C ^PC pt complex is important for the HOCO+/DOCO+ channels, the RRKM results suggest that the cross section should be significant only at our lowest Ecol, should drop with increasing Ecol, and should never be very large. The low Ecol component of the HOCO+ and DOCO+ channels have just this behavior.
The effects of reactant vibration on production of HOCO+ and DOCO+ are shown in Figure 10.9. The cross sections for these channels are small, thus there is considerable uncertainty in making these comparisons. The most consistent trend is that HOD+ vibrational excitation clearly inhibits both channels at low Ecol, and furthermore, the inhibition is proportional to the energy of the vibrational state, within experimental error. The inhibition from vibrational energy is somewhat smaller than that from equivalent increases of Ecol; however, adding collision energy also increases Lcollision, which is expected to suppress these channels, as discussed above. Based on the RRKM results, and the measured effects of vibration and Ecol, we conclude that it is likely that the R C ^PC PT complex is dynamically significant, and is responsible for the low Ecol component of the HOCO+ and DOCO+ channels. The small magnitude of this component reflects the strong suppression of the branching and complex lifetime by Lcollision, which restricts this mechanism to the small fraction of low impact parameter collisions.
Note that the branching to HL calculated from complex decay is lower than what we observe (0.07% calculated vs. 2% measured at 0.18 eV). It is likely that this discrepancy simply reflects error in the energy of TS2, which was calculated to be only 0.029 eV below the reactants and PT products at the level of theory used to map out the reaction coordinate. Lowering the
171
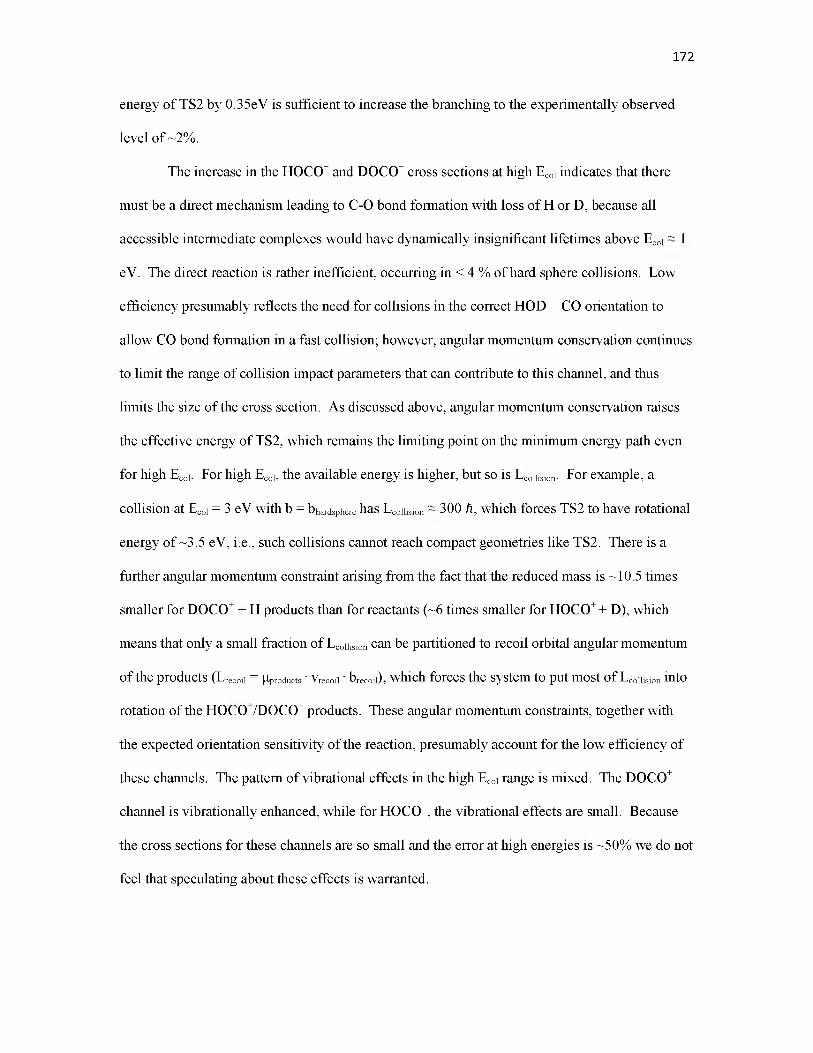
energy of TS2 by 0.35eV is sufficient to increase the branching to the experimentally observed level of ~2%.
The increase in the HOCO+ and DOCO+ cross sections at high Ecol indicates that there must be a direct mechanism leading to C-O bond formation with loss of H or D, because all accessible intermediate complexes would have dynamically insignificant lifetimes above Ecol ~ 1 eV. The direct reaction is rather inefficient, occurring in < 4 % of hard sphere collisions. Low efficiency presumably reflects the need for collisions in the correct HOD - CO orientation to allow CO bond formation in a fast collision; however, angular momentum conservation continues to limit the range of collision impact parameters that can contribute to this channel, and thus limits the size of the cross section. As discussed above, angular momentum conservation raises the effective energy of TS2, which remains the limiting point on the minimum energy path even for high Ecol. For high Ecol, the available energy is higher, but so is Lcollision. For example, a collision at Ecol = 3 eV with b = bhardsphere has Lcollision ~ 300 h, which forces TS2 to have rotational energy of ~3.5 eV, i.e., such collisions cannot reach compact geometries like TS2. There is a further angular momentum constraint arising from the fact that the reduced mass is ~10.5 times smaller for DOCO+ + H products than for reactants (~6 times smaller for HOCO+ + D), which means that only a small fraction of Lcollision can be partitioned to recoil orbital angular momentum of the products (Lrecoil = products • vrecoil • brecoil), which forces the system to put most of Lcollision into rotation of the HOCO/DOCO+ products. These angular momentum constraints, together with the expected orientation sensitivity of the reaction, presumably account for the low efficiency of these channels. The pattern of vibrational effects in the high Ecol range is mixed. The DOCO+ channel is vibrationally enhanced, while for HOCO+, the vibrational effects are small. Because the cross sections for these channels are so small and the error at high energies is ~50% we do not feel that speculating about these effects is warranted.
172
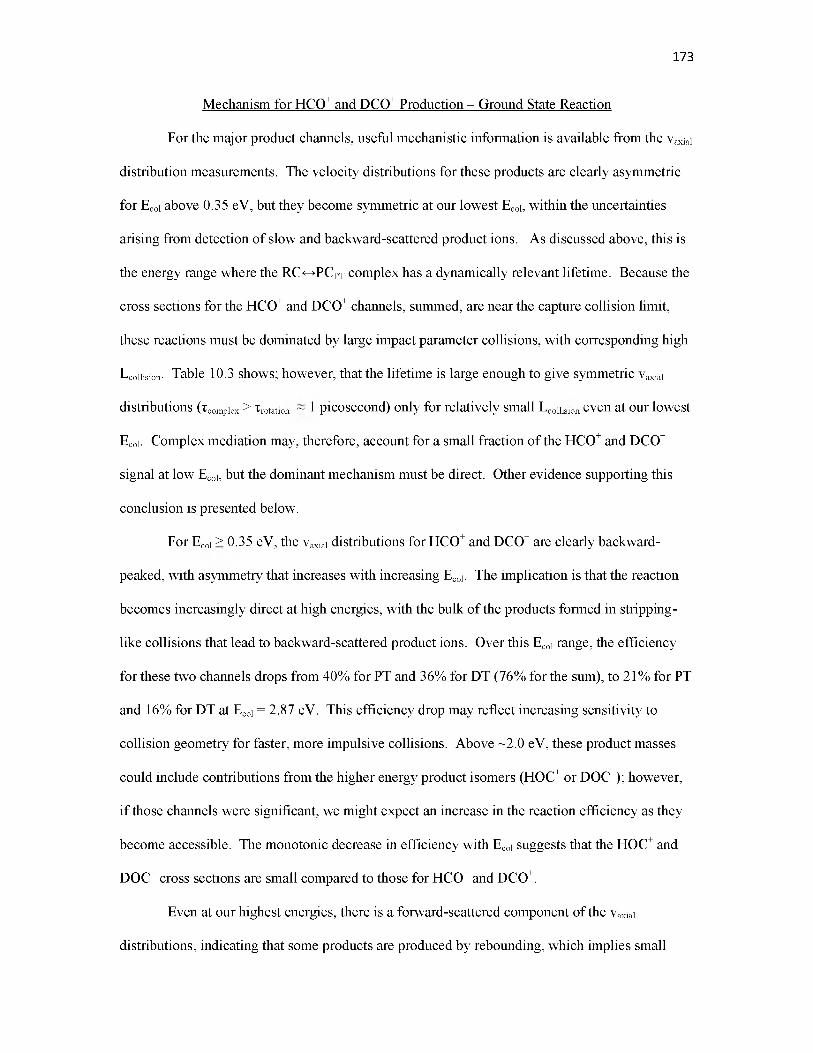
173
Mechanism for HCO+ and DCO+ Production - Ground State ReactionFor the major product channels, useful mechanistic information is available from the vaxial
distribution measurements. The velocity distributions for these products are clearly asymmetric for Ecol above 0.35 eV, but they become symmetric at our lowest Ecol, within the uncertainties arising from detection of slow and backward-scattered product ions. As discussed above, this is the energy range where the R C ^PC pt complex has a dynamically relevant lifetime. Because the cross sections for the HCO+ and DCO+ channels, summed, are near the capture collision limit, these reactions must be dominated by large impact parameter collisions, with corresponding high Lc0llision. Table 10.3 shows; however, that the lifetime is large enough to give symmetric vaxial distributions (xcomplex > Trotation ~ 1 picosecond) only for relatively small Lcollision even at our lowest Ecol. Complex mediation may, therefore, account for a small fraction of the HCO+ and DCO+ signal at low Ecol, but the dominant mechanism must be direct. Other evidence supporting this conclusion is presented below.
For Ecol > 0.35 eV, the vaxial distributions for HCO+ and DCO+ are clearly backward- peaked, with asymmetry that increases with increasing Ecol. The implication is that the reaction becomes increasingly direct at high energies, with the bulk of the products formed in strippinglike collisions that lead to backward-scattered product ions. Over this Ecol range, the efficiency for these two channels drops from 40% for PT and 36% for DT (76% for the sum), to 21% for PT and 16% for DT at Ecol = 2.87 eV. This efficiency drop may reflect increasing sensitivity to collision geometry for faster, more impulsive collisions. Above ~2.0 eV, these product masses could include contributions from the higher energy product isomers (HOC+ or DOC+); however, if those channels were significant, we might expect an increase in the reaction efficiency as they become accessible. The monotonic decrease in efficiency with Ecol suggests that the HOC+ and DOC+ cross sections are small compared to those for HCO+ and DCO+.
Even at our highest energies, there is a forward-scattered component of the vaxial distributions, indicating that some products are produced by rebounding, which implies small

impact parameter collisions. Evidently, reaction occurs over a wide range of impact parameters, ranging from head-on to grazing, and the observation that the vaxial distributions are backward- peaked simply reflects the fact that the probability of a collision at a given value of b is proportional to b. Competition with the HOCO+/DOCO+ channels, which require collisions at low b, also tends to deplete the HCO+/DCO+ velocity distributions in the forward-scattered hemisphere; however, those channels are too weak to have much effect on the major channels.
Vibrational Effects on the Total Cross Section The vibrational effects on ototal are shown in Figure 10.10, with an inset that shows just
the low Ecol region, where the total reaction efficiency approaches unity. Note that for reaction of ground state HOD+, the efficiency is closest to unity (~94%) for Ecol around 0.33 eV. At lower energies, the efficiency drops to ~76%, and as pointed out above, this drop is consistent with the 55% efficiency observed in thermal energy studies. In the Ecol range below ~0.33 eV, excitation of both the OD and OH stretch modes of HOD+ enhances reactivity, such that ototal ~ ocollision.Bend excitation has a somewhat smaller enhancing effect than the two stretches in the low energy regime. As Ecol increases above 0.33 eV, the total reaction efficiency gradually drops, eventually reaching below 40%, and over the same Ecol range, the vibrational effects on ototal also become smaller. The highest energy OH stretch mode appears to continue enhancing ototal. The bend appears to inhibit ototal slightly, but these effects are not outside of the error limits. The weak dependence on reactant vibrational state at high Ecol may be partly a function of the fact that the vibrational energy becomes small compared to Eavail; however, we note that for the endothermic reactions of HOD+ with CO2,' and N2,9 the vibrational effects remain large and mode-specific even at high Ecol. We infer that for this system, high Ecol reactivity is more a function of factors such as collision geometry.
174

175
Vibrational Mode- and Bond-Specific Effects on HCO+ and DCO+ Formation
The cross sections for HCO+ and DCO+ are presented for each of the four reactant
vibrational states of HOD+ in Figure 10.8. It is apparent that there are mode- and bond-specific
effects for these product channels, which continue into the high Ecol range where vibration has
little effect on ototal. Both OH and OD stretch excitations show the same pattern of strongly
enhancing the probability of the PT or DT channel that breaks the excited bond, while inhibiting
the channel that corresponds to breaking the other bond. In other words, transferring H+ or D+
from HOD+ is enhanced by exciting the broken-bond stretch, while exciting the spectator bond
stretch actually inhibits the reaction. This effect can be seen more clearly in Figure 10.11 which
shows the vibrational enhancement (cvib state / c ground state) for the three HOD+ vibrational levels
studied. The mode/bond specificity seen for PT and DT are similar to what is seen for PT and DT
from HOD+ to CO2 and N2,1, 9 with one difference. In those systems, excitation of the spectator
bond stretch leads to small enhancements, whereas for HOD+ + CO, the spectator stretch
excitation actually inhibits both channels. This difference may simply reflect the difference in
energetics of these reactions. For N2 and CO2, PT and DT are substantially endoergic, and
reaction is direct at all energies above threshold. For endoergic reactions, it is not unreasonable
that any form of additional energy might enhance reactivity to some extent. PT or DT in the
HOD++ CO system is essentially thermoneutral, so reactivity presumably is less dependent on
available energy. In addition, there is probably some contribution to the PT and DT channels at
low Ecol from a complex-mediated mechanism, and we expect both the formation probability and
the lifetime of the complex to be decreased by reactant vibrational excitation.
A somewhat surprising effect is that HOD+ bend excitation significantly enhances the
HCO++ OD channel at very low collision energies, but has essentially no effect on the DCO+ OH
channel. In sum, HOD+ bend excitation favors PT over DT at all Ecol, and because the reactions
are identical aside from the mass of the transferred atom, it seems logical that this effect on
PT/DT branching must result from a mass effect associated with the bend vibration. The obvious
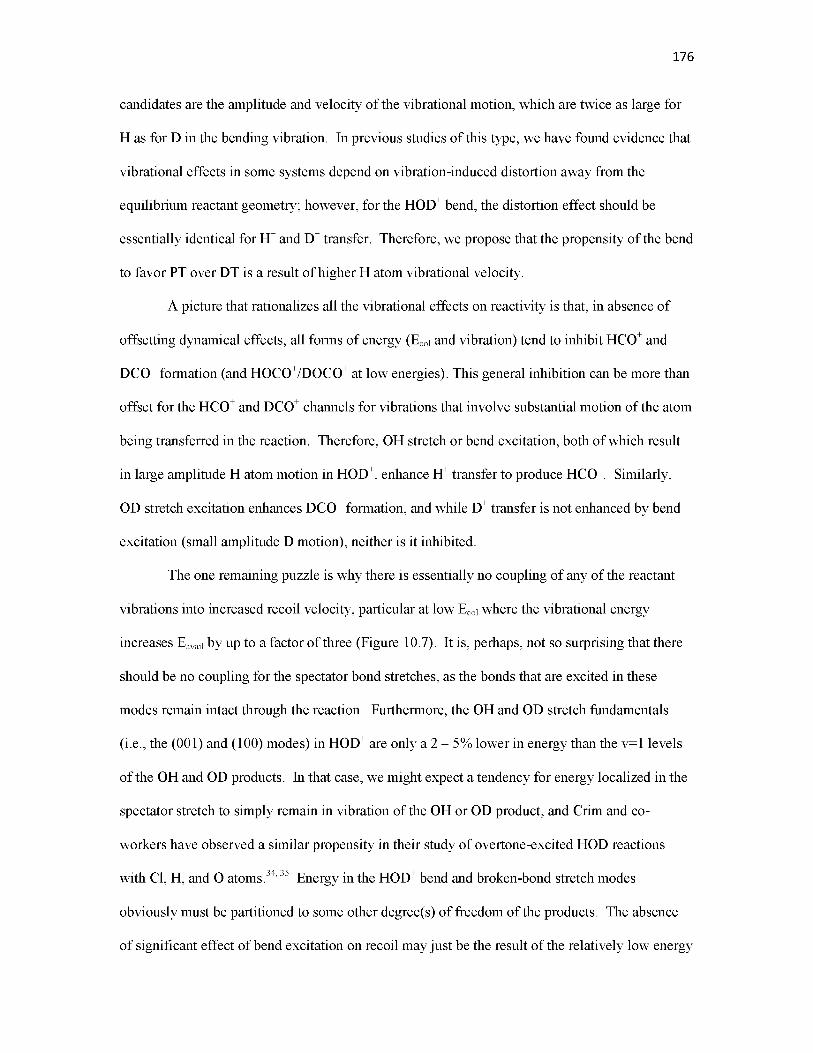
candidates are the amplitude and velocity of the vibrational motion, which are twice as large for
H as for D in the bending vibration. In previous studies of this type, we have found evidence that
vibrational effects in some systems depend on vibration-induced distortion away from the
equilibrium reactant geometry; however, for the HOD+ bend, the distortion effect should be
essentially identical for H+ and D+ transfer. Therefore, we propose that the propensity of the bend
to favor PT over DT is a result of higher H atom vibrational velocity.
A picture that rationalizes all the vibrational effects on reactivity is that, in absence of
offsetting dynamical effects, all forms of energy (Ecol and vibration) tend to inhibit HCO+ and
DCO+ formation (and HOCO+/DOCO+ at low energies). This general inhibition can be more than
offset for the HCO+ and DCO+ channels for vibrations that involve substantial motion of the atom
being transferred in the reaction. Therefore, OH stretch or bend excitation, both of which result
in large amplitude H atom motion in HOD+, enhance H+ transfer to produce HCO+. Similarly,
OD stretch excitation enhances DCO+ formation, and while D+ transfer is not enhanced by bend
excitation (small amplitude D motion), neither is it inhibited.
The one remaining puzzle is why there is essentially no coupling of any of the reactant
vibrations into increased recoil velocity, particular at low Ecol where the vibrational energy
increases Eavail by up to a factor of three (Figure 10.7). It is, perhaps, not so surprising that there
should be no coupling for the spectator bond stretches, as the bonds that are excited in these
modes remain intact through the reaction. Furthermore, the OH and OD stretch fundamentals
(i.e., the (001) and (100) modes) in HOD+ are only a 2 - 5% lower in energy than the v=1 levels
of the OH and OD products. In that case, we might expect a tendency for energy localized in the
spectator stretch to simply remain in vibration of the OH or OD product, and Crim and co
workers have observed a similar propensity in their study of overtone-excited HOD reactions
with Cl, H, and O atoms.34, 35 Energy in the HOD+ bend and broken-bond stretch modes
obviously must be partitioned to some other degree(s) of freedom of the products. The absence
of significant effect of bend excitation on recoil may just be the result of the relatively low energy
176

of this mode; however, the broken-bond stretch, particularly when this is the OH stretch, should
result in obvious changes in vaxial if there is significant coupling to recoil. Because the transition
state controlling PT is bent, it could be that the stretch energy has a propensity to be converted to
counter rotation of the two products. For example, the energy of the OH stretch, if converted to
rotation of OD and HCO+ with equal and opposite angular momentum, would correspond to J~16
for both. It is also possible that the broken-bond stretch energy is partitioned to vibrational
energy of the HCO+ or DCO+ products. For example, in reaction of HOD with Cl, H, and O
atoms,2, 34, 36 a tendency was found to partition energy into vibration of the bond formed. In HOD
+ O 87% of the energy available was partitioned into the O-H bond formed in the reaction. In
that example, the free OH stretch is 140cm-1 lower in energy than the OH stretch in HOD and the
free OD stretch is 100cm-1 below the OD stretch in HOD. For the HOD+ + CO system, the
“t- 1 “t- 20 37nascent CH stretch in HCO is —110 cm- lower in energy than the OH stretch in H O D , , and
the CD stretch in DCO+ is —220 cm-1 higher in energy than the OD stretch in H O D .38 In the
reactions of HOD with H and Cl, the vibrational frequency for the stretch of the nascent bond
does not match as well to that of the broken-bond, and less of the initial vibrational energy was
retained in vibration of the products.2, 34, 36
Conclusion
We presented a detailed study of the effects of vibrationally mode-specific excitation, as
well as collision energy, on reaction of HOD+ with CO. The dominant mechanism for H+ and D+
transfer is direct at all Ecol as indicated by product recoil velocities and RRKM calculations.
Excitation of the OH or OD stretch modes result in enhancement of H+ or D+ transfer,
respectively, and inhibition of D+ or H+ transfer. Bend excitation preferentially enhances H+
transfer, having no significant effect on D+ transfer. The energy associated with these vibrational
excitations does not appear in recoil energy, even at low Ecol, where vibrational excitation doubles
or triples the energy available to products. The vibrational effects suggest that vibrational energy,
177
like collision energy, tends to inhibit H+ and D+ transfer, but this general inhibitory effect can be
offset if the excited mode causes high velocity motion of the H or D atoms being transferred. A
pair of minor product channels (HOCO+ and DOCO+) was observed that has not previously been
observed in thermal energy studies, probably because the products were lost to secondary
reactions. These channels are complex-mediated at low Ecol and low Lcollision and direct at
elevated Ecol. Despite being barrierless and exoergic, these reactions are quite inefficient,
presumably due to a combination of a tight transition state, angular momentum constraints, and
requirement for collision in a narrow range of orientations.
Acknowledgements
This work was supported by grants from the Chemistry Division of the National Science
Foundation (CHE-0647124 and CHE-1111935).
References
1. D. M. Bell, J. M. Boyle and S. L. Anderson, J. Chem. Phys 134, 64312 (2011).
2. M. C. Hsiao, A. Sinha and F. F. Crim, J. Phys. Chem. 95, 8263 (1991).
3. A. Sinha, M. C. Hsiao and F. F. Crim, J. Chem. Phys. 92, 6333 (1990).
4. A. Sinha, M. C. Hsiao and F. F. Crim, J. Chem. Phys. 94, 4928 (1991).
5. A. Sinha, M. C. Hsiao and F. F. Crim, J. Chem. Phys. 92, 6337 (1990).
6. M. J. Bronikowski, Z. Rong, D. J. Rakestraw and R. N. Zare, Sci. Tech. Aerosp. Rep. 27, N89 (1989).
7. M. J. Bronikowski, W. R. Simpson, B. Girard and R. N. Zare, J. Chem. Phys. 95, 8647 (1991).
8. M. J. Bronikowski, W. R. Simpson and R. N. Zare, J. Phys. Chem. 97, 2194 (1993).
9. D. M. Bell, J. M. Boyle and S. L. Anderson, J. Chem. Phys 135, 044305 (2011).
10. H. Gupta, P. Rimmer, J. C. Pearson, S. Yu, E. Herbst, N. Harada, E. A. Bergin, D. A. Neufeld, G. J. Melnick, R. Bachiller Astron. Astrophyss 521, L47 (2010).
178

179
11. V. Ossenkopf, H. S. P. Muller, D. C. Lis, P. Schilke, T. A. Bell, S. Bruderer, E. Bergin,C. Ceccarelli, C. Comito, J. Stutzki and e. al., Astron. Astrophys. 518, L111 (2010).
12. D. K. Bohme, G. I. Mackay and H. I. Schiff, J. Chem. Phys. 73, 4976 (1980).
13. J. D. C. Jones, K. Birkinshaw and N. D. Twiddy, Chem. Phys. Lett. 77, 484 (1981).
14. R. J. Shul, R. Passarella, L. T. DiFazio, Jr., R. G. Keesee and A. W. Castleman, Jr., J. Phys. Chem. 92, 4947 (1988).
15. W. T. Huntress, Jr., M. J. McEwan, Z. Karpas and V. G. Anicich, Astrophys. J., Suppl. Ser. 44, 481 (1980).
16. V. G. Anicich, An Index o f the Literature for Bimolecular Gas Phase Cation-Molecule Reaction Kinetics. (National Aeronautics and Space Administration, and Jet Propulsion Laboratory,California Institute of Technology, Pasadena, California, 2003).
17. G. b. Czako , E. Matyus, A. C. Simmonett, A. G. Csaszar, H. F. Schaefer III and W. D. Allen, J. Chem. Theory Comput 4, 1220 (2008).
18. J. M. Boyle, D. M. Bell, S. L. Anderson and A. A. Viggiano, J. Phys. Chem. A 115, 1172 (2011).
19. S. L. Anderson, Acct. Chem. Res. 30, 28 (1997).
20. B. W. Uselman, J. M. Boyle and S. L. Anderson, Chemical Physics Letters 440 (4-6), 171(2007).
21. D. Gerlich, Adv. Chem. Phys. 82, 1 (1992).
22. R. M. Jones, D. Gerlich and S. L. Anderson, Rev. Sci. Instrum. 68, 3357 (1997).
23. M. J. Frisch, G. W. Trucks, H. B. Schlegel, G. E. Scuseria, M. A. Robb, J. R. Cheeseman, J. J. A. Montgomery, T. Vreven, K. N. Kudin, J. C. Burant, J. M. Millam, S. S. Iyengar,J. Tomasi, V. Barone, B. Mennucci, M. Cossi, G. Scalmani, N. Rega, G. A. Petersson, H. Nakatsuji, M. Hada, M. Ehara, K. Toyota, R. Fukuda, J. Hasegawa, M. Ishida, T. Nakajima, Y. Honda, O. Kitao, H. Nakai, M. Klene, X. Li, J. E. Knox, H. P. Hratchian, J. B. Cross, C. Adamo, J. Jaramillo, R. Gomperts, R. E. Stratmann, O. Yazyev, A. J. Austin, R. Cammi, C. Pomelli, J. W. Ochterski, P. Y. Ayala, K. Morokuma, G. A. Voth, P. Salvador, J. J. Dannenberg, V. G. Zakrzewski, S. Dapprich, A. D. Daniels, M. C. Strain, O. Farkas, D. K. Malick, A. D. Rabuck, K. Raghavachari, J. B. Foresman, J. V. Ortiz, Q. Cui, A. G. Baboul, S. Clifford, J. Cioslowski, B. B. Stefanov, G. Liu, A. Liashenko, P. Piskorz, I. Komaromi, R. L. Martin, D. J. Fox, T. Keith, M. A. Al-Laham, C. Y. Peng, A. Nanayakkara, M. Challacombe, P. M. W. Gill, B. Johnson, W. Chen, M. W. Wong, C. Gonzalez and J. A. Pople, (Gaussian, Inc., Pittsburgh PA, 2003).
24. A. P. Scott and L. Radom, J. Phys. Chem. 100, 16502 (1996).
25. L. Zhu and W. L. Hase, in Quamtum Chemistry Program Exchange (Chemistry Department, Indiana University Bloomington, 1993).

180
26. W. M. Hayne, Handbook o f Chemistry and Physics, 91 ed. (CRC Press/Taylor and Francis, Boca Raton, FL, 2004).
27. J. Troe, Chem. Phys. Lett. 122, 425 (1985).
28. S. G. Lias, J. E. Bartmess, J. F. Liebman, J. L. Holmes, R. D. Levin and W. G. Mallard, J. Phys. Chem. Ref. Data 17, 1 (1988).
29. N. S. Shuman, , M. Johnson, , W. R. Stevens, , M. E. Harding, , J. F. Stanton, and T. Baer, J. Phys. Chem. A 114, 10016 (2010).
30. H. Fu, J. Qian, R. J. Green and S. L. Anderson, J. Chem. Phys. 108, 2395 (1998).
31. G. A. Fisk, J. D. McDonald and D. R. Herschbach, Discuss. Faraday Soc. 44, 228 (1967).
32. J. Liu, B. V. Devener and S. L. Anderson, J. Chem. Phys. 119, 200 (2003).
33. J. M. Boyle, B. W. Uselman, J. Liu and S. L. Anderson, J. Chem. Phys 128, 114304(2008).
34. J. D. Thoemke, J. M. Pfeiffer, R. B. Metz and F. F. Crim, J. Phys. Chem. 99, 13748 (1995).
35. A. Sinha, J. D. Thoemke and F. F. Crim, J. Chem. Phys. 96, 372 (1992).
36. J. M. Pfeiffer, E. Woods, R. B. Metz and F. F. Crim, J. Chem. Phys. 113, 7892 (2000).
37. J. C. Owrutsky, E. R. Kleim, J. V. Coe and R. J. Saykally, J. Phys. Chem. 93, 5960 (1989).
38. K. Kawaguchi, A. R. W. McKellar and E. Hirota, J. Chem. Phys 84 (1986).

Table 10.1: Energetics for stationary points on the reaction coordinate in Figure 10.2, calculated
at the B3LYP/6-311++G** level of theory, for HOD+ + CO. The energetics vary, as shown,
depending on whether the H or D atom is involved in the bonding. Values are in eV.
181
H loss or PT D loss or DT
Reactant Like Complex (RC) -1.407 -1.407
TS1 -0.831 -0.819
Proton Transfer Product Like Complex ( P C p t ) -1.017 -1.003
TS2 -0.029 -0.038
Hydrogen Loss Product like Complex HC -0.747 -0.693
TS3 0.402 0.44
Formic Acid (FA) (cis) -1.693 -1.682
Formic Acid (FA) (trans) -1.709 -1.701
TS4 -0.498 -0.433
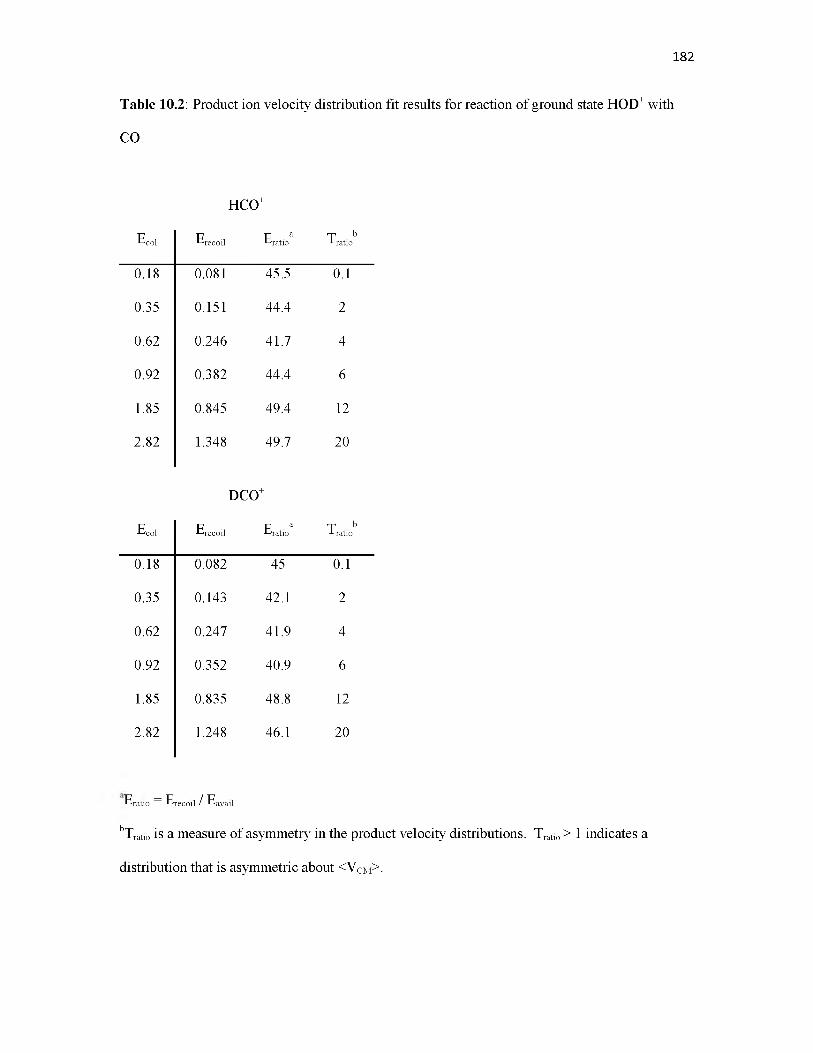
182
Table 10.2: Product ion velocity distribution fit results for reaction of ground state HOD+ with
CO.
HCO+
Ecol Erecoil E aratio ry b Tratio
0.18 0.081 45.5 0.1
0.35 0.151 44.4 2
0.62 0.246 41.7 4
0.92 0.382 44.4 6
1.85 0.845 49.4 12
2.82 1.348 49.7 20
DCO+¥
Ecol Erecoil E aratio bTratio
0.18 0.082 45 0.1
0.35 0.143 42.1 2
0.62 0.247 41.9 4
0.92 0.352 40.9 6
1.85 0.835 48.8 12
2.82 1.248 46.1 20
Eratio = Erecoil / Eavail
bTratio is a measure of asymmetry in the product velocity distributions. Tratio > 1 indicates a
distribution that is asymmetric about <VCM>.

183
Table 10.3: RRKM lifetime of the R C ^PC pt complex and branching to HCO+ and HOCO+
products.
Lifetime (ps)
Ecol L=1 L=26 L=51 L=76 L=101 L=126 L=151
0.18 1.83 1.34 0.75 0.48 0.34 0.27
0.25 1.20 0.89 0.53 0.36 0.28 0.27
0.34 0.80 0.61 0.38 0.28 0.26 0.30
0.62 0.36 0.28 0.18 0.13 0.12 0.13 0.17
Branching to HCO+
Ecol L=1 L=26 L=51 L=76 L=101 L=126 L=151
0.18 12.3 12.4 12.6 13.0 13.8 15.6
0.25 12.8 13.0 13.7 14.9 17.4 23.4
0.34 13.4 13.8 15.0 17.7 23.3 37.9
0.62 14.7 15.1 16.3 18.8 23.4 33.2 57 .5
Branching to HOCO+
Ecol L=1 L=26 L=51 L=76 L=101 L=126 L=151
0.18 0.05 0.02 0.01
0.25 0.07 0.04 0.01 0.01
0.34 0.09 0.05 0.02 0.01 0.01
0.62 0.19 0.13 0.06 0.03 0.02 0.01

184
Figure 10.1: Ground state cross sections for production of HCO+, DCO+, HOCO+, and DOCO+
are plotted as a function of collision energy (Ecol). The total cross section (otot) is plotted along
with the collision cross section, which is the greater of the hard sphere cross section and capture
cross section.
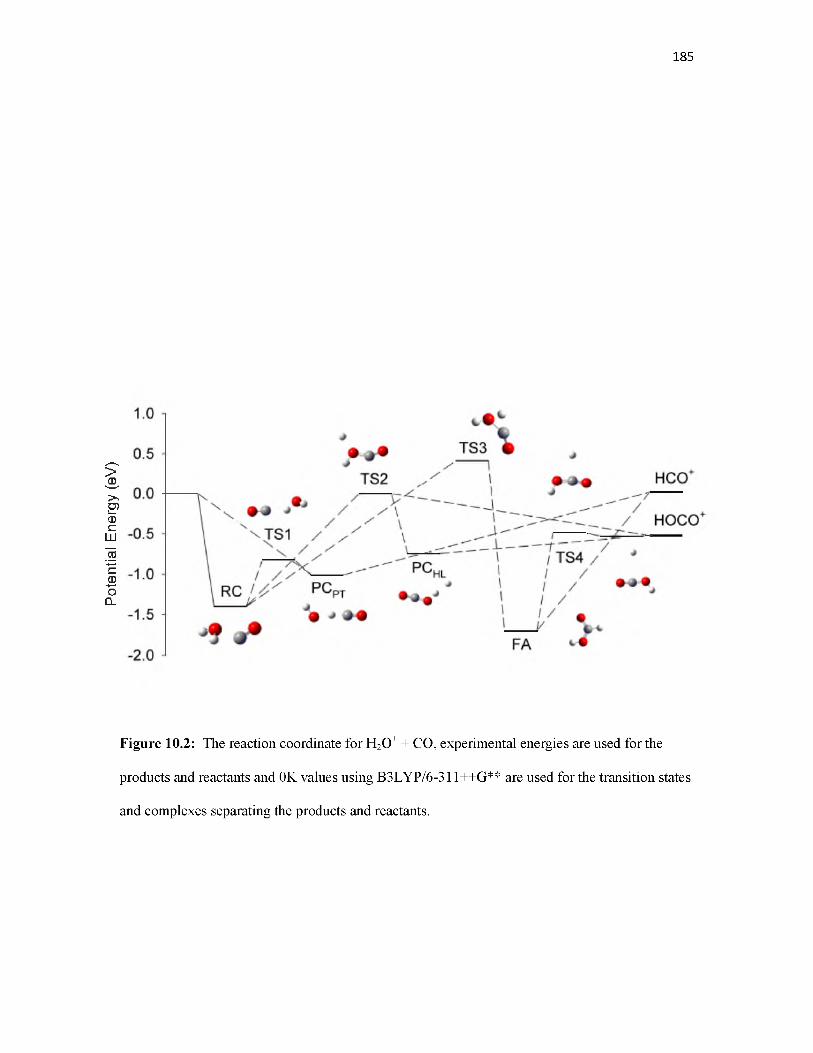
Poten
tial E
nergy
(eV)
185
Figure 10.2: The reaction coordinate for H2O+ + CO, experimental energies are used for the
products and reactants and 0K values using B3LYP/6-311++G** are used for the transition states
and complexes separating the products and reactants.
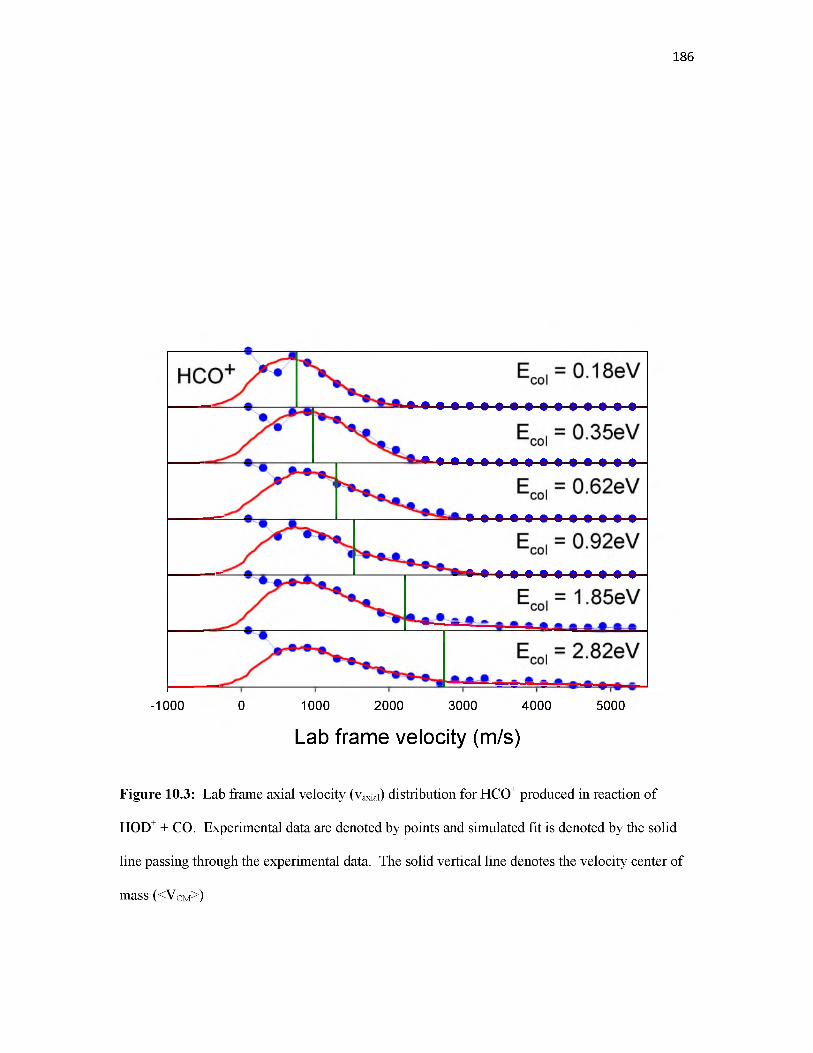
186
-1000 0 1000 2000 3000 4000 5000
Lab frame velocity (m/s)
Figure 10.3: Lab frame axial velocity (vaxial) distribution for HCO+ produced in reaction of
HOD++ CO. Experimental data are denoted by points and simulated fit is denoted by the solid
line passing through the experimental data. The solid vertical line denotes the velocity center of
mass ( < V c m > )

187
-1000 0 1000 2000 3000 4000 5000
Lab frame velocity (m/s)
Figure 10.4: Lab frame axial velocity (vaxial) distribution for DCO+ produced in reaction of
HOD+ + CO. Experimental data are denoted by points and simulated fit is denoted by the solid
line passing through the experimental data. The solid vertical line denotes the velocity center of
mass (<VCM>)
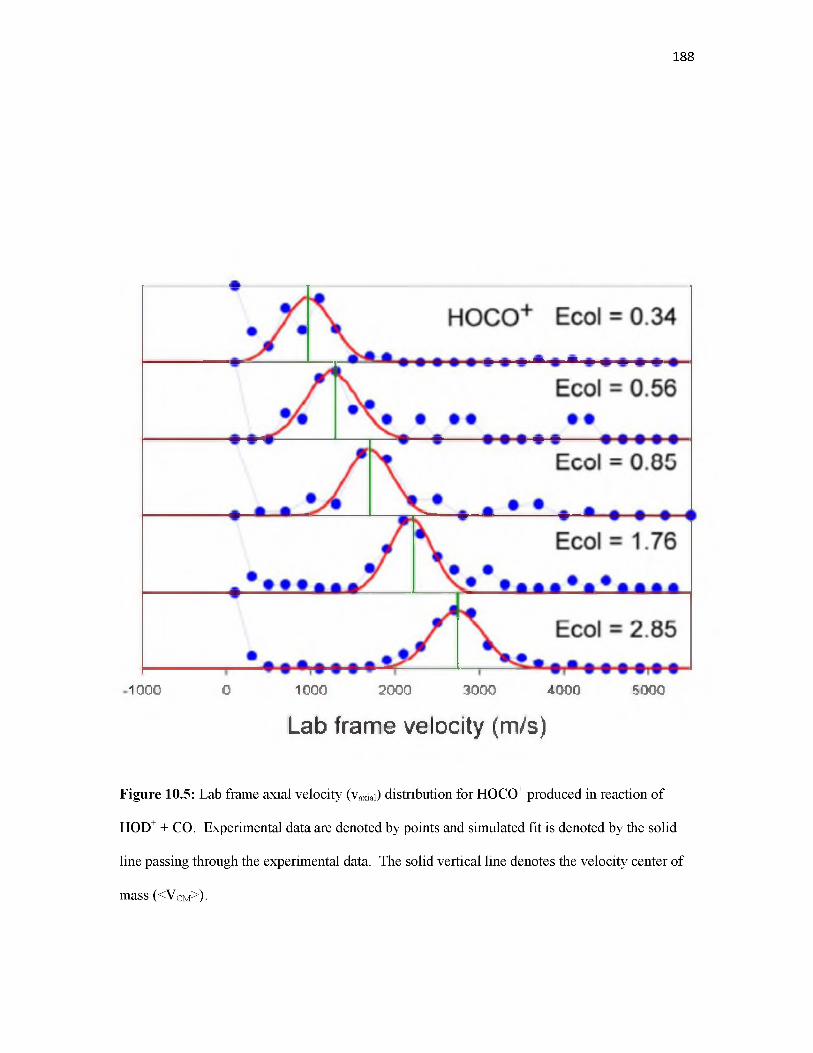
188
1000 0 1000 2000 3000 4000 5000
Lab frame velocity (m/s)
Figure 10.5: Lab frame axial velocity (vaxial) distribution for HOCO+ produced in reaction of
HOD+ + CO. Experimental data are denoted by points and simulated fit is denoted by the solid
line passing through the experimental data. The solid vertical line denotes the velocity center of
mass ( < V c m > ) .
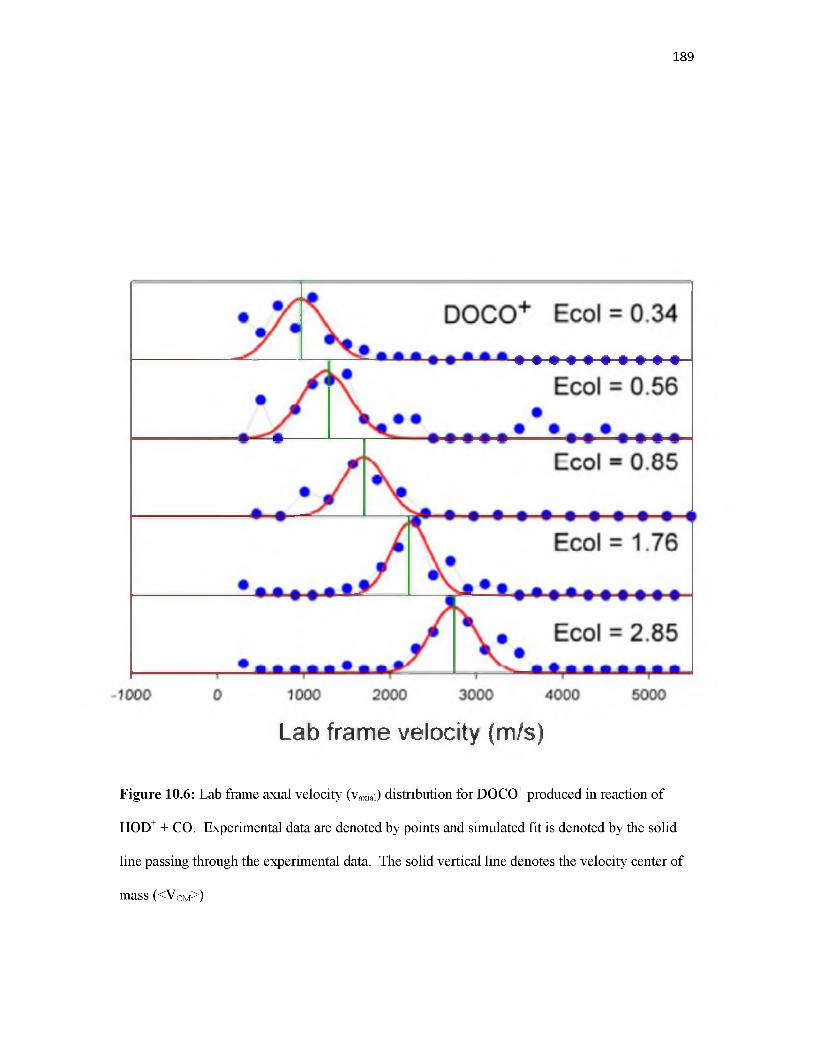
189
Lab frame velocity (m/s)
Figure 10.6: Lab frame axial velocity (vaxial) distribution for DOCO+ produced in reaction of
HOD+ + CO. Experimental data are denoted by points and simulated fit is denoted by the solid
line passing through the experimental data. The solid vertical line denotes the velocity center of
mass ( < V c m > )

190
Figure 10.7: Lab frame axial velocity (vaxial) distribution for HCO+ and DCO+ produced in
reaction of HOD+ + CO at two representative Ecol for each reactant vibrational state.
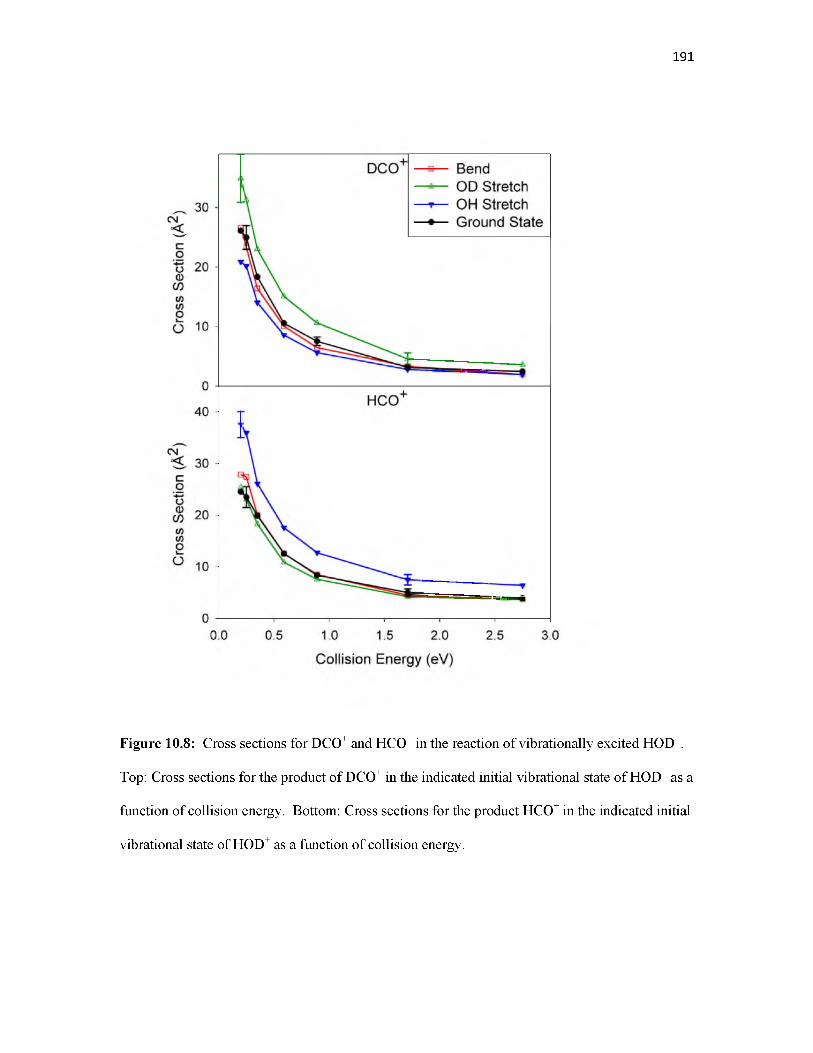
191
Figure 10.8: Cross sections for DCO+ and HCO+ in the reaction of vibrationally excited HOD+.
Top: Cross sections for the product of DCO+ in the indicated initial vibrational state of HOD+ as a
function of collision energy. Bottom: Cross sections for the product HCO+ in the indicated initial
vibrational state of HOD+ as a function of collision energy.

192
Collision Energy (eV)
Figure 10.9: Cross sections for DOCO+ and HOCO+ in the reaction of vibrationally excited
HOD+. Top: Cross sections for the product of DOCO+ in the indicated initial vibrational state of
HOD+ as a function of collision energy. Bottom: Cross sections for the product HOCO+ in the
indicated initial vibrational state of HOD+ as a function of collision energy.
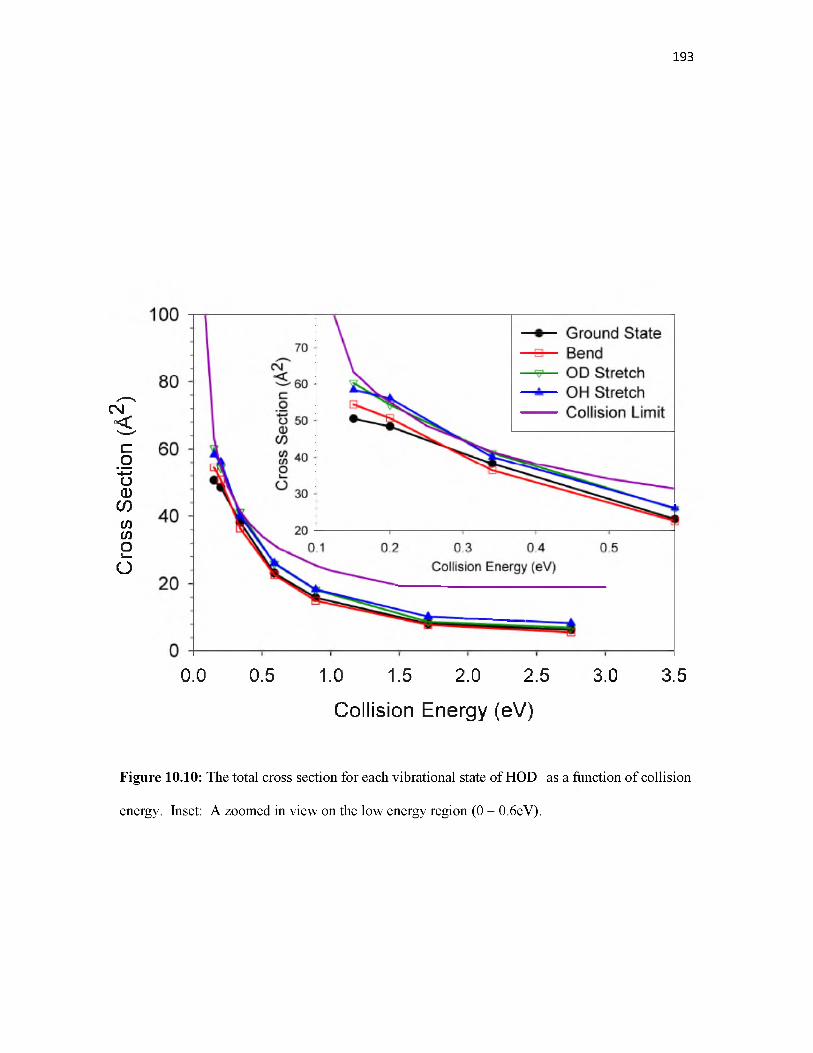
Cross
Sectio
n (A
^)
193
0.0 0.5 1.0 1.5 2.0 2.5 3.0 3.5Collision Energy (eV)
Figure 10.10: The total cross section for each vibrational state of HOD+ as a function of collision
energy. Inset: A zoomed in view on the low energy region (0 - 0.6eV).
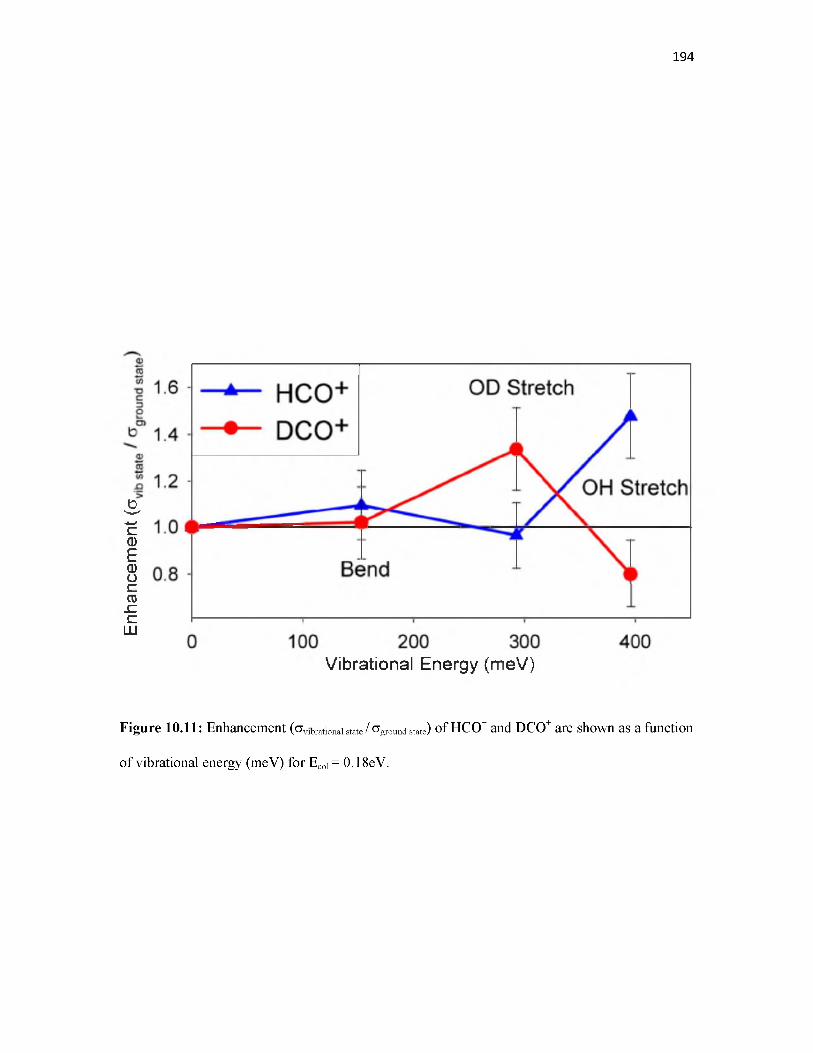
Enha
ncem
ent (
o
194
Vibrational Energy (meV)
Figure 10.11: Enhancement (avibrational state / c ground state) of HCO+ and DCO+ are shown as a function
of vibrational energy (meV) for Ecol = 0.18eV.
CHAPTER 11
VIBRATIONAL ENHANCED CHARGE TRANSFER AND
MODE/BOND-SPECIFIC H+ AND D+ TRANSFER IN THE
REACTION OF HOD+ WITH N 2 O
Reprinted with permission from David M. Bell, Scott L. Anderson, and The Journal of Chemical
Physics 139, 114305. Copyright 2013, American Institute of Physics

Abstract
The reaction of HOD+ with N2O was studied over the collision energy (Ecol) range from
0.20eV to 2.88eV, for HOD+ in its ground state and in each of its fundamental vibrational states:
bend (010), OD stretch (100), and OH stretch (001). The dominant reaction at low Ecol is H+ and
D+ transfer, but charge transfer becomes dominant for Ecol > 0.5 eV. Increasing Ecol enhances
charge transfer only in the threshold region (Ecol < 1 eV), but all modes of HOD+ v0069brational
excitation enhance this channel over the entire energy range, by up to a factor of 3. For reaction
of ground state HOD+, the H+ and D+ transfer channels have similar cross sections, enhanced by
increasing collision energy for Ecol < 0.3 eV, but suppressed by Ecol at higher energies. OD
stretch excitation enhances D+ transfer by over a factor of 2, but has little effect on H+ transfer,
except at low Ecol where a modest enhancement is observed. Excitation of the OH stretch
enhances H+ transfer by up to a factor of 2.5, but actually suppresses D+ transfer over most of the
Ecol range. Excitation of the bend mode results in ~60% enhancement of both H+ and D+ transfer
at low Ecol, but has little effect at higher energies. Recoil velocity distributions at high Ecol are
strongly backward-scattered in the center-of-mass frame, indicating direct reaction dominated by
large impact parameter collisions. At low Ecol, the distributions are compatible with mediation by
a short-lived collision complex. Ab initio calculations find several complexes that may be
important in this context, and RRKM calculations predict lifetimes and decay branching that are
consistent with observations. The recoil velocity distributions show that HOD+ vibrational
excitation enhances reactivity in all collisions at low Ecol, while for high Ecol enhancement comes
entirely from the subset of collisions that generate strongly backward-scattered product ions.
Introduction
Vibrational effects on chemistry have long been of interest from a fundamental
standpoint as they further our understanding of what factors control reactivity. Polanyi and co
workers investigated how vibrational and translational energy affect barrier crossing in the model
196

A + BC system.1 It was determined that a barrier early on the reaction coordinate is more
efficiently overcome by translational energy, while a late barrier is more efficiently overcome by
vibrational energy. For polyatomic reactants, the situation is complicated by presence of multiple
vibrational modes which may or may not couple to the reaction coordinate. The singly deuterated
water molecule (HOD) and its cation are interesting in this respect because the two stretch modes
are largely localized in either the OH or OD bond, making it possible to think in terms of both
mode- and bond-selective chemistry. For example, the Crim group utilized overtone-excited
HOD with either 4 quanta of the OD stretch or 3 quanta of the OH stretch to overcome the barrier
to reaction with H atoms, and observed that when the OD stretch was excited, breaking the OD
bond was 200 times more likely than breaking the OH bond.2-5 Conversely, excitation of the OH
stretch made it 220 times more likely that the OH bond would break, compared to the OD bond.
The Zare group examined the same reaction with HOD with only 1 quantum of OH or OD stretch
excitation, with translationally hot H atoms supplying most of the energy required to drive the
reaction.6, 7 They found similar trends in enhancements for the respective stretches, but the
enhancement was smaller, suggesting that vibrational energy was more efficient than translational
energy in driving the reaction, as confirmed in a theoretical study.8
We have reported studies of reactions of mode-selectively excited HOD+ with the neutral
reactants N29, CO2,10 and CO.11 In these reactions, the dominant channels are endoergic H+ and
D+ transfer (with endoergicity decreasing to near zero for CO), and it was found that OH stretch
excitation enhances H+ transfer, while having either a negligible or inhibitory effect on D+
transfer. The converse is true for the OD stretch; this behavior is in line with the results of the
neutral HOD experiments mentioned above. A surprising result was that for reaction with CO2
and N2, excitation of the bend vibration (010) of HOD+ gives the largest overall enhancement,
because bend excitation strongly enhances both H+ and D+ transfer. The effect of the bend
vibration in reaction of neutral HOD was probed by Zare and co-workers via excitation of the
(110) combination band, with the result that there was little effect from the additional bend
197
excitation. We proposed that the large bend enhancements observed in the endoergic H+ and D+
transfer reactions with CO2 and N2, are due to changes in the shape of the potential surface in the
region of closest approach, enhancing the probability of transitioning into the exit channel as the
bend angle opens.10
The reaction of HOD+ with N2O is of interest because the proton affinity of N2O is such
that H+ and D+ transfer are endoergic by ~0.2 eV, and there are reactant-like complexes that
might mediate the reaction at low collision energy (Ecol). Also, in addition to the H+ and D+
transfer channels, charge transfer is only ~0.27eV endoergic, and thus should be a significant
competing channel that may affect the vibrational dependence. Previous work on this system
includes studies of the photo-induced dissociation (PID) and collision-induced dissociation (CID)
of the (N2O • H2O)+ cluster ion as well as its deuterated analog.12-14 As discussed below, the
dissociation experiments observed similar product channels that are observed in this bimolecular
collision; however, the product branching is quite different. A detailed study of the potential
energy surface for the (N2O • H2O)+ system was reported by Stevens et al. who examined both
ground and low-lying electronically excited surfaces,15 relevant to both the dissociation and
bimolecular reaction experiments.
Methodology
The experiments were done using a guided ion beam tandem mass spectrometer that has
been described previously.16-18 Helium was bubbled through a thermostatted 1:1 mixture of H2O
and D2O, to generate a mixture of roughly 96% He, 1% H2O, 2% HOD, and 1% D2O. This
mixture was pulsed into the experiment as a skimmed supersonic molecular beam. HOD was
ionized by resonance-enhanced multiphoton ionization (REMPI) through the C (1B1) state,19
allowing production of HOD+ in the following states: (000) ground state; (001) OH stretch -
0.396 eV, (010) bend - 0.153 eV, and (100) OD stretch - 0.293 eV. The state purity was checked
by photoelectron spectroscopy, and the only state with significant impurity is the bend, where
198
56% of the ions are produced in the (010) state, with the remaining 44% in the ground vibrational
state. Because we also measure cross sections for reaction of ground state ions, the bend results
are easily corrected for the ground state impurity, and this has been done in the data presented
below.
HOD+ ions were created between a pair of planar electrodes, collected and focused by a
quadrupole ion guide, then passed through a quadrupole mass filter to remove any fragment ions,
as well as the small amount of H2O+ and D2O+ produced. The ionization conditions were
optimized so that no D3O+ was formed by ion-molecule reactions in the source, and therefore, it
should be a good assumption that the HOD+ beam has negligible contamination from H3 O+,
which would be produced by analogous reactions. If there were H3O+ in the beam, the only
energetically possible reaction would be H3O+ + N 2 O ^ N 2 OH+ + H2O, which would contribute
to the N2OH+ product channel for Ecol above 1.2 eV. As shown below, the data show no sign of
any new contribution to the N2OH+ cross section appearing above 1.2 eV.
After mass selection, the beam of HOD+ was passed through a time-of-flight (TOF)
gating electrode to narrow the kinetic energy distribution of the ion beam, and then injected into
an 8-pole ion guide system.20 The first ion guide was surrounded by a 10 cm long scattering cell
containing 1x10⁻⁴ Torr of N2O, measured by a capacitance manometer. All ions (product and
unreacted HOD+) were collected by the first guide and passed into a second, longer guide to allow
TOF velocity analysis. The ions were then passed through a final mass filter and detected by an
electron multiplier. The ion signal was counted with a P7882 FAST ComTec multichannel scalar,
controlled by a LabView program. Integral cross sections were calculated from the reactant and
product ion intensities (integrated from the TOF measurements), using the calibrated effective
length of the scattering cell and the pressure of the scattering cell. The TOF distributions were
also converted to velocity distributions and used both to establish the actual collision energy and
energy spread at each nominal energy, and provide insight into the recoil dynamics of the product
ions.
199

Multiple sets of data were taken on different days, and the results presented below are the
averages, with error bars calculated from the standard deviations. In addition to random errors
indicated by error bars in the figures, there are possible systematic effects that are harder to
quantify. Error in the absolute scattering cell pressure and length calibration would result in an
error in the absolute scale of the cross sections, but would have no effect on comparisons between
different product channels or vibrational states, which are the most important source of dynamical
insight. We used reactions of Ar+ + D2, HOD+ + CO, and HOD+ + CO2 to calibrate our scattering
cell length. We estimate that the absolute cross section scale is within ±20% of the correct value.
To map out the reaction coordinate, electronic structure calculations were performed at
the B3LYP/6-311++G(d,p) level of theory, using Gaussian03.21 The vibrational frequencies and
zero-point energies were scaled by factors of 0.9613 and 0.9804, respectively. Transition states
were verified to be first order saddle points by frequency calculations. To determine the kinetics
and product branching that would result from statistical breakup of the various complexes
identified on the reaction coordinate, Rice-Ramsperger-Kassel-Marcus (RRKM) rate and density
of state calculations were performed using a program developed by Zhu and Hase.22 Direct state
counting was used and the energetics, moments of inertia, and vibrational frequencies were
obtained from the B3LYP/6-311++G(d,p) calculations.
Results
Ground State Cross Sections
Product ions were observed with masses of 44, 45, and 46, corresponding with N2O+,
N2OH+, and N2OD+ respectively. Integral cross sections for reaction of HOD+ in its ground
vibrational state are presented in the top frame of Figure 11.1, for center-of-mass (CM) collision
energies (Ecol) ranging from 0.15eV to 2.88eV. Possible reactions and the associated energetics
observed are:
200
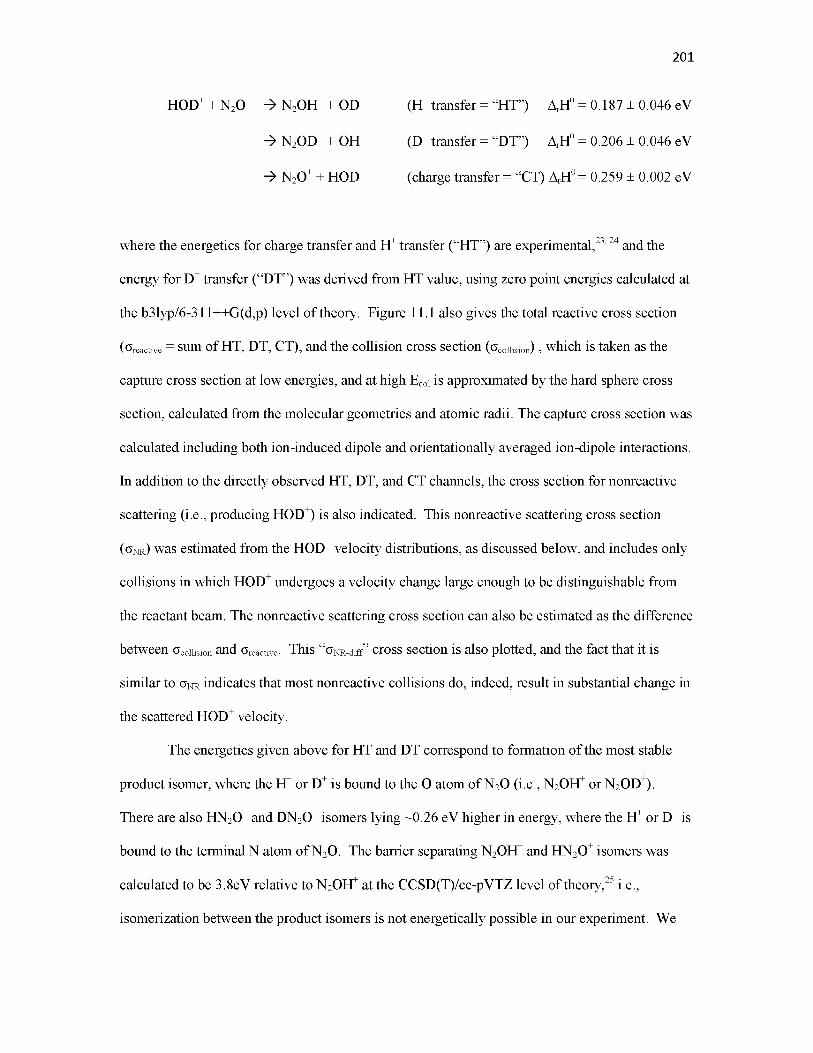
HOD+ + N2O ^ N2OH+ + OD (H+ transfer = “HT”) ArH° = 0.187 ± 0.046 eV
^ N 2 OD+ + OH (D+ transfer = “DT”) ArH0 = 0.206 ± 0.046 eV
^ N 2 O+ + HOD (charge transfer = “CT) ArH0 = 0.259 ± 0.002 eV
where the energetics for charge transfer and H+ transfer (“HT”) are experimental,23’ 24 and the
energy for D+ transfer (“DT”) was derived from HT value, using zero point energies calculated at
the b3lyp/6-311++G(d,p) level of theory. Figure 11.1 also gives the total reactive cross section
(oreactive = sum of HT, DT, CT), and the collision cross section (ocollision) , which is taken as the
capture cross section at low energies, and at high Ecol is approximated by the hard sphere cross
section, calculated from the molecular geometries and atomic radii. The capture cross section was
calculated including both ion-induced dipole and orientationally averaged ion-dipole interactions.
In addition to the directly observed HT, DT, and CT channels, the cross section for nonreactive
scattering (i.e., producing H O D ) is also indicated. This nonreactive scattering cross section
( o r r ) was estimated from the HOD+ velocity distributions, as discussed below, and includes only
collisions in which HOD+ undergoes a velocity change large enough to be distinguishable from
the reactant beam. The nonreactive scattering cross section can also be estimated as the difference
between ocollisi0n and oreactive. This “oNR-diff” cross section is also plotted, and the fact that it is
similar to o n r indicates that most nonreactive collisions do, indeed, result in substantial change in
the scattered HOD+ velocity.
The energetics given above for HT and DT correspond to formation of the most stable
product isomer, where the H+ or D+ is bound to the O atom of N2O (i.e., N2OH+ or N2OD).
There are also HN2O+ and DN2O+ isomers lying ~0.26 eV higher in energy, where the H+ or D+ is
bound to the terminal N atom of N2O. The barrier separating N2OH+ and HN2O+ isomers was
calculated to be 3.8eV relative to N2OH+ at the CCSD(T)/cc-pVTZ level of theory,25 i.e.,
isomerization between the product isomers is not energetically possible in our experiment. We
201
observe no increase in HT or DT cross sections at the thresholds for the higher energy isomers,
suggesting that they are not major products; however, to the extent that these isomers form, they
are included in the HT and DT cross sections.
The Ecol dependence of the HT, DT, and CT cross sections is consistent with the
endoergicities of the product channels, taking the experimental collision energy spread (~0.15eV)
into account. The HT and DT cross sections increase with Ecol up to ~0.34eV, but then decrease
at higher Ecol. Because of its higher endoergicity, CT is a minor channel at low Ecol, rapidly
increasing for Ecol up to ~0.88eV, then becoming nearly Ecol-independent at higher energies.
The lower frame of Figure 11.1 gives the branching ratios observed for scattering of
ground state HOD+ from N 2 O, including the HT, DT, CT, and nonreactive scattering channels
(i.e., oNR). Because the HT and DT cross sections are very similar for the ground state reaction,
they are lumped together for the branching ratio calculation.
Computational Results
Stevens et a l 1 reported a detailed reaction coordinate for this system, and we simply re
calculated the part relevant to our bimolecular collision system at the B3LYP/6-311++G(d,p)
level of theory. The recalculation was needed to obtain vibrational and rotational frequencies for
the monodeuterated system, and these were calculated for all possible isotopologs of each
structure. Because deuteration only affects the energetics slightly, for simplicity, the reaction
coordinate shown in Figure 11.2 is given for the all-H analog of the system.
The lowest energy product channel for the [H2O-N2O]+ system corresponds to H2O2+ +
N2; however, because H2O2+ was not observed in either our results, or in previous studies,12-14 this
channel is omitted from the reaction coordinate in Figure 11.2. There are three reactant-like
complexes (designated “RC1”, “RC2”, and “RC3” in Figure 11.2) bound by 1.42eV, 1.40eV, and
1.16eV, respectively, with respect to reactants. RC1 and RC2 correspond to electrostatic
interactions of the O atom in HOD+ with either terminus of N2O. RC3 corresponds to HOD+
202

hydrogen-bonded to the N terminus of N2O; however, the O-H and H-N bond lengths are
calculated to be 0.998A, and 1.798 A, respectively, i.e., RC3 is still quite reactant-like. In all
three RC complexes, the charge is roughly equally shared between the two reactant moieties. The
RC3 complex was not directly observed in the CID and PID work, but it was hypothesized12-14
that such a complex might form to some extent as an intermediate to the HN2O+ + OH product
channels, and that there was a high barrier between RC2 and RC3. In fact, the barrier (TS-23) is
small compared to the dissociation limits.
From the perspective of our bimolecular collision experiment, the key point is that all
three complexes are similar in energy, with barriers to interconversion that are small compared to
the available energy (i.e., well depth + Ecol). Therefore, even in our lowest Ecol range, where such
complexes might be dynamically significant (see below), the three complexes are better
considered as a single complex that samples many geometries, including RC1, RC2, and RC3, via
internal rotation of the loosely coupled HOD and N2O moieties.
In addition to the ground state structures in Figure 11.2, Stevens et a l.15 calculated the
vertical excitation energies of the RC1 and RC2 complexes to the first two electronically excited
doublet states. In Cs symmetry, the ground electronic state has 2A ” symmetry, and will be
denoted 12A ” , following their nomenclature. The vertical excitation energies were calculated to
be between 0.8eV and 2.4eV, depending on the structure and level of theory, i.e., well within the
range of our available energy. One excited state is optically bright (denoted 22A ” ) and has 63%
of the charge on the water moiety. The other excited state (12A') has 90% of the charge residing
on N2O, and in Cs symmetry, this state correlates to the CT products. In randomly oriented
collisions; however, all three states have 2A symmetry, and therefore can be mixed in the
collisions, suggesting that there should be adiabatic pathways connecting reactants to the CT
product channel.
203
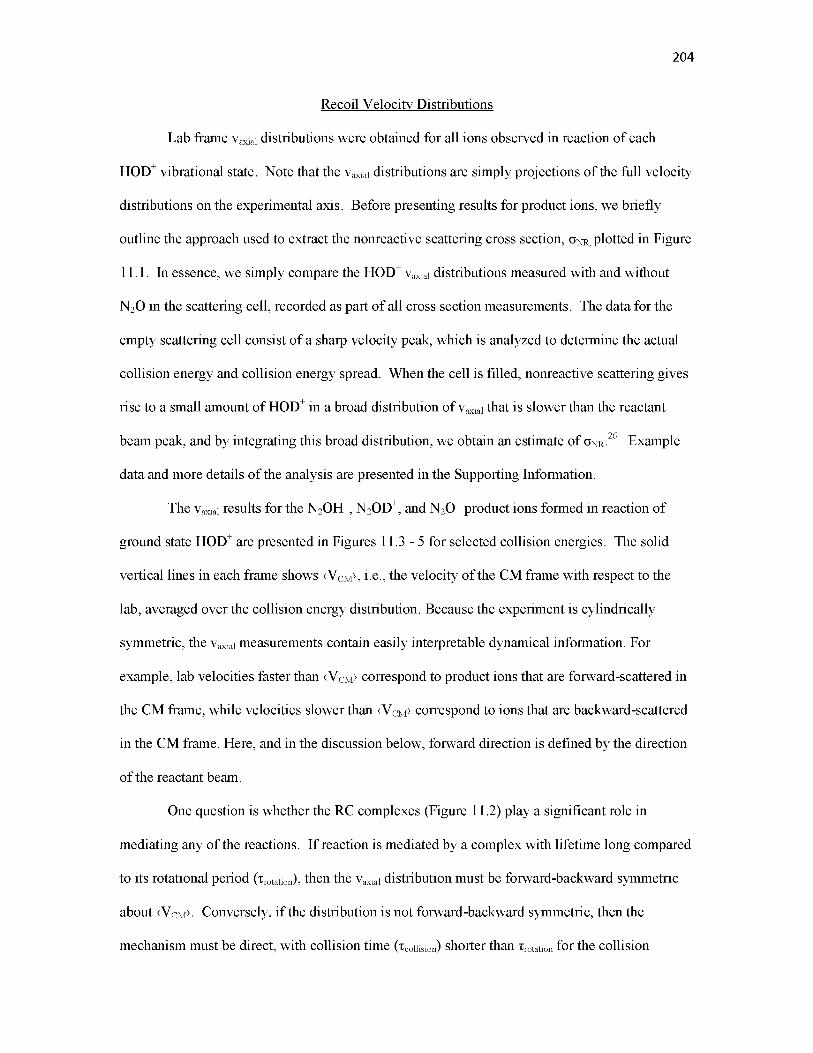
Recoil Velocity Distributions
Lab frame vaxial distributions were obtained for all ions observed in reaction of each
HOD+ vibrational state. Note that the vaxial distributions are simply projections of the full velocity
distributions on the experimental axis. Before presenting results for product ions, we briefly
outline the approach used to extract the nonreactive scattering cross section, a ^ , plotted in Figure
11.1. In essence, we simply compare the HOD+ vaxial distributions measured with and without
N2O in the scattering cell, recorded as part of all cross section measurements. The data for the
empty scattering cell consist of a sharp velocity peak, which is analyzed to determine the actual
collision energy and collision energy spread. When the cell is filled, nonreactive scattering gives
rise to a small amount of HOD+ in a broad distribution of vaxial that is slower than the reactant
beam peak, and by integrating this broad distribution, we obtain an estimate of aNR.26 Example
data and more details of the analysis are presented in the Supporting Information.
The vaxial results for the N 2 OH+, N 2 OD+, and N 2 O+ product ions formed in reaction of
ground state HOD+ are presented in Figures 11.3 - 5 for selected collision energies. The solid
vertical lines in each frame shows <VCM>, i.e., the velocity of the CM frame with respect to the
lab, averaged over the collision energy distribution. Because the experiment is cylindrically
symmetric, the vaxial measurements contain easily interpretable dynamical information. For
example, lab velocities faster than <VCM> correspond to product ions that are forward-scattered in
the CM frame, while velocities slower than <VCM> correspond to ions that are backward-scattered
in the CM frame. Here, and in the discussion below, forward direction is defined by the direction
of the reactant beam.
One question is whether the RC complexes (Figure 11.2) play a significant role in
mediating any of the reactions. If reaction is mediated by a complex with lifetime long compared
to its rotational period (xrotation), then the vaxial distribution must be forward-backward symmetric
about <VCM>. Conversely, if the distribution is not forward-backward symmetric, then the
mechanism must be direct, with collision time (xcollision) shorter than Trotation for the collision
204

205
complex. In that case, the propensity toward forward- or backward-scattering reveals the
dominance of rebounding or stripping dynamics, and the position of the velocity peak provides
insight into the partitioning of energy in the products.
It can be seen that for all three reactions, the vaxial distributions are strongly backward-
peaked for high Ecol, indicating that the dominant mechanism in this energy range is direct, with
short collision times. Note that “forward” and “backward” are defined with respect to the initial
CM frame direction of the HOD+ ions. Because all reactions in this system involve transfer of the
charge (as e", H+, or D ), strongly backward-scattered product ions correspond to stripping type
dynamics, occurring in large impact parameter collisions. In addition to the backward peak, the
vaxial distributions at high Ecol also have a broad component that extends well forward of <VCM>,
indicating that reaction also occurs in collisions at smaller impact parameters that produce ions
that are sideways- or forward-scattered. As the collision energy is lowered, the distributions
broaden, and <VCM> moves to lower vaxial. As a result, the distributions become more symmetric
looking, although for experimental reasons, we are unable to tell if they actually become
symmetric at our lowest Ecol.
The problem is that product ions with low lab frame velocities are easily perturbed by
potential barriers in the ion guide system and also have a higher probability of secondary
collisions in the scattering cell,27 which also perturb the velocity. (In this system, secondary
collisions cannot change the product identity.) In exothermic reactions, product ions may recoil
with enough energy to appear at negative lab frame velocities (moving away from the detector).
Here, where all reactions are endoergic, negative lab velocities are only possible for reactions of
vibrationally excited HOD+. To ensure that all ions are collected, the ion lens just before the
scattering ion guide is biased to prevent ions from exiting in that direction; however, the TOFs of
ions with very low or negative lab velocities tend to be artificially long, contributing to an
artificial peak at near zero vaxial (off scale in Figures 11.3 - 11.5, see below). The TOF
measurements extend 8 ms after the laser pulse, which appears to be long enough to collect even
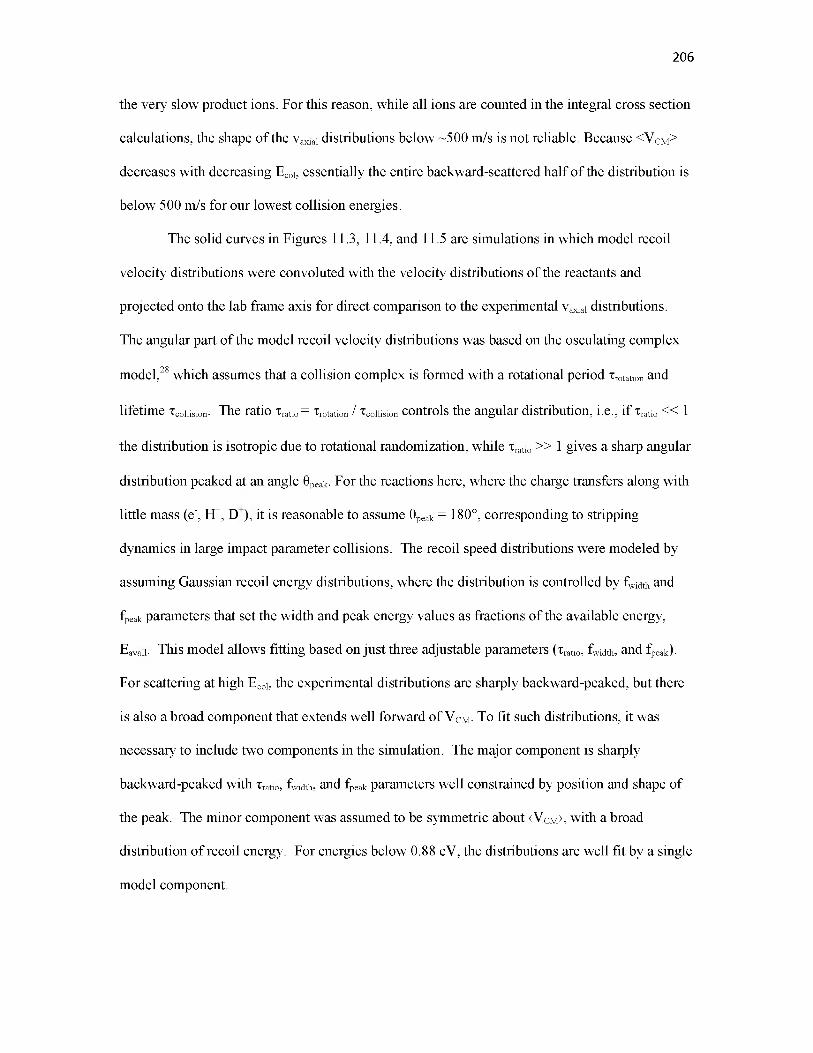
the very slow product ions. For this reason, while all ions are counted in the integral cross section
calculations, the shape of the vaxial distributions below ~500 m/s is not reliable. Because <VCM>
decreases with decreasing Ecol, essentially the entire backward-scattered half of the distribution is
below 500 m/s for our lowest collision energies.
The solid curves in Figures 11.3, 11.4, and 11.5 are simulations in which model recoil
velocity distributions were convoluted with the velocity distributions of the reactants and
projected onto the lab frame axis for direct comparison to the experimental vaxial distributions.
The angular part of the model recoil velocity distributions was based on the osculating complex
model,28 which assumes that a collision complex is formed with a rotational period xrotation and
lifetime TComsion. The ratio xratio = x ^ o n / collision controls the angular distribution, i.e., if xratio << 1
the distribution is isotropic due to rotational randomization, while xratio >> 1 gives a sharp angular
distribution peaked at an angle 0peak. For the reactions here, where the charge transfers along with
little mass (e-, H+, D ), it is reasonable to assume 0peak = 180°, corresponding to stripping
dynamics in large impact parameter collisions. The recoil speed distributions were modeled by
assuming Gaussian recoil energy distributions, where the distribution is controlled by fwidth and
fpeak parameters that set the width and peak energy values as fractions of the available energy,
Eavail. This model allows fitting based on just three adjustable parameters (xratio, fwidth, and fpeak).
For scattering at high Ecol, the experimental distributions are sharply backward-peaked, but there
is also a broad component that extends well forward of VCM. To fit such distributions, it was
necessary to include two components in the simulation. The major component is sharply
backward-peaked with xratio, fwidth, and fpeak parameters well constrained by position and shape of
the peak. The minor component was assumed to be symmetric about <VCM>, with a broad
distribution of recoil energy. For energies below 0.88 eV, the distributions are well fit by a single
model component.
206

We are primarily interested in two results from the vaxial distribution fits, and these are
presented in Table 11.1. One question is how energy initially in Ecol and in various reactant
vibrational modes is partitioned to the products. To address this question, Table 11.1 provides
results for the average percent of Eavail partitioned into recoil: %Erecoil = 100 • <Erecoil> /< Eavail>,
where the average recoil energy, <Erecoil>, is obtained from the fits, and < Eavail> is Ecol + Evib + Erot
- ArH°, with Evib equal to the excitation energy for each state studied, and Ecol and Erot averaged
over the appropriate experimental distributions. We are also interested in the extent to which the
products are forward- or backward-scattered, as an indication of the reaction mechanism. Table
11.1 also gives the backward/forward ratio (“B/F”), which is simply the ratio of the intensities for
vaxial faster and slower, respectively, than <VCM>. For a complex mediated mechanism, B/F must
be ~1; therefore, if B/F is very different than unity, the mechanism must be direct. “Direct”, in
this context, means that the collision time is short compared to the rotational period, xrotation, of
any complexes that might form during the collision. The rotational periods can be estimated from
the complex moment of inertia, and the angular momentum, L = ^ • vrel • (ocollision /n) )1/2), where
^ is the reduced mass of the reactants, vrel is the relative velocity of the reactants, and ocollisi0n is
given in Figure 11.1. Table 11.2 gives estimates of xrotation assuming that the moment of inertia is
equal to those for the reactant-like complexes (RC1, RC2, and RC3). Roughly, xrotation drops from
~1 ps for Ecol = 0.2eV to ~0.5 psec at 2.88 eV. For reference, Table 11.2 also gives xfly_by, which
is simply the time it would take undeflected reactants to fly past each other over a relative
distance of 5A.
Effects of HOD' Vibrational Excitation
Integral cross sections for N 2 O+, N 2 OH+, and N 2 OD+ are shown for all four HOD+
reactant states in Figures 11.6 and 11.7. In Figure 11.6, the cross sections for CT are plotted as a
function of Ecol in the top frame, and as a function of total energy (Etot) in the bottom frame. The
207

only significant source of rotational energy is thermal rotation of the N2O reactant, and because
this is small (~75 meV) and independent of the HOD+ vibrational state, it has been omitted to
focus on the comparison of the effects of Ecol and Evib. For CT, all modes of HOD+ vibrational
excitation lead to substantial enhancements, and these effects persist to high Ecol, where the
collision energy no longer enhances CT.
The effects of HOD+ vibrational excitation on the HT and DT channels are quite
mode/bond selective, as shown in the top and middle frames of Figure 11.7. The bottom frame
shows how the branching between HT and DT varies with Ecol and HOD+ vibrational state. In the
discussion below, the stretch of the bond that is broken in reaction will be referred to as the
“broken-bond stretch” and the stretch of the opposite bond will be called the “spectator stretch”,
i.e., the OH stretch is the broken-bond stretch for HT, but is the spectator stretch for DT. It can be
seen that for both HT and DT, the vibrational effects are mode-specific, and vary qualitatively
with Ecol.
To provide additional insight into the origins of the vibrational effects, we also measured
and simulated vaxial distributions for reaction of HOD+ in all vibrational states, and the %Erecoil and
B/F results are summarized in Table 11.1. In most systems we have studied previously, reactant
vibrational excitation has little if any effect on recoil behavior, most likely because the vibrational
energy is relatively small, and tends to be randomized in reactive collisions. Figure 11.8 shows
that for this system, vibrational excitation leads to significant differences in the shape of the vaxial
distributions. For two representative Ecol values, data are shown for reaction for HOD+ in its
ground state, with one quanta of the OD stretch (0.293eV), and with one quantum of OH stretch
excitation (0.396 eV). The intensities have been normalized so that the integrated area of the
distributions (including the low vaxial spike due to slow ions, which was off-scale in Figures 11.3 -
11.5) is proportional to the integral cross section, allowing the absolute intensities in different
velocity ranges to be compared directly. For CT (left side of figure), it can be seen that in the
threshold energy range (Ecol < 0.62 eV), the vaxial distributions for all the HOD+ reactant states
208
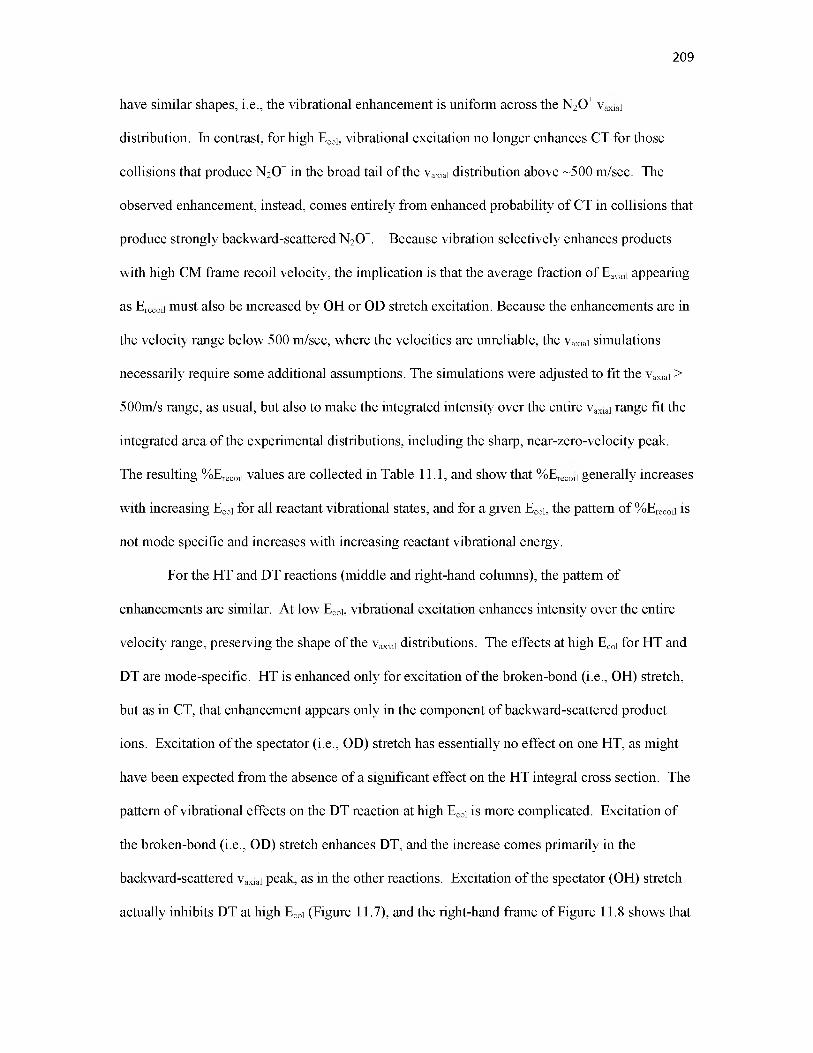
have similar shapes, i.e., the vibrational enhancement is uniform across the N2O+ vaxial
distribution. In contrast, for high Ecol, vibrational excitation no longer enhances CT for those
collisions that produce N2O+ in the broad tail of the vaxial distribution above ~500 m/sec. The
observed enhancement, instead, comes entirely from enhanced probability of CT in collisions that
produce strongly backward-scattered N2O+. Because vibration selectively enhances products
with high CM frame recoil velocity, the implication is that the average fraction of Eavail appearing
as Erecoil must also be increased by OH or OD stretch excitation. Because the enhancements are in
the velocity range below 500 m/sec, where the velocities are unreliable, the vaxial simulations
necessarily require some additional assumptions. The simulations were adjusted to fit the vaxial >
500m/s range, as usual, but also to make the integrated intensity over the entire vaxial range fit the
integrated area of the experimental distributions, including the sharp, near-zero-velocity peak.
The resulting %Erecoil values are collected in Table 11.1, and show that %Erecoil generally increases
with increasing Ecol for all reactant vibrational states, and for a given Ecol, the pattern of %Erecoil is
not mode specific and increases with increasing reactant vibrational energy.
For the HT and DT reactions (middle and right-hand columns), the pattern of
enhancements are similar. At low Ecol, vibrational excitation enhances intensity over the entire
velocity range, preserving the shape of the vaxial distributions. The effects at high Ecol for HT and
DT are mode-specific. HT is enhanced only for excitation of the broken-bond (i.e., OH) stretch,
but as in CT, that enhancement appears only in the component of backward-scattered product
ions. Excitation of the spectator (i.e., OD) stretch has essentially no effect on one HT, as might
have been expected from the absence of a significant effect on the HT integral cross section. The
pattern of vibrational effects on the DT reaction at high Ecol is more complicated. Excitation of
the broken-bond (i.e., OD) stretch enhances DT, and the increase comes primarily in the
backward-scattered vaxial peak, as in the other reactions. Excitation of the spectator (OH) stretch
actually inhibits DT at high Ecol (Figure 11.7), and the right-hand frame of Figure 11.8 shows that
209
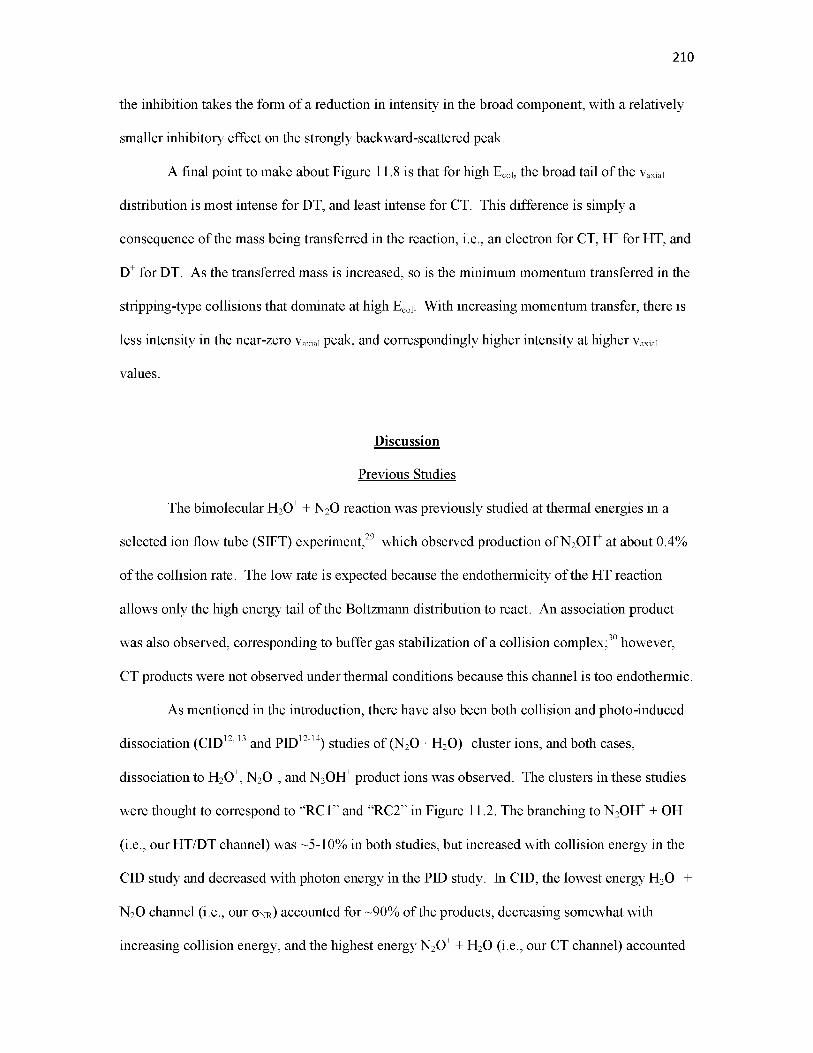
the inhibition takes the form of a reduction in intensity in the broad component, with a relatively
smaller inhibitory effect on the strongly backward-scattered peak.
A final point to make about Figure 11.8 is that for high Ecol, the broad tail of the vaxial
distribution is most intense for DT, and least intense for CT. This difference is simply a
consequence of the mass being transferred in the reaction, i.e., an electron for CT, H+ for HT, and
D+ for DT. As the transferred mass is increased, so is the minimum momentum transferred in the
stripping-type collisions that dominate at high Ecol. With increasing momentum transfer, there is
less intensity in the near-zero vaxial peak, and correspondingly higher intensity at higher vaxial
values.
Discussion
Previous Studies
The bimolecular H2O+ + N2O reaction was previously studied at thermal energies in a
selected ion flow tube (SIFT) experiment,29 which observed production of N2OH+ at about 0.4%
of the collision rate. The low rate is expected because the endothermicity of the HT reaction
allows only the high energy tail of the Boltzmann distribution to react. An association product
was also observed, corresponding to buffer gas stabilization of a collision complex;30 however,
CT products were not observed under thermal conditions because this channel is too endothermic.
As mentioned in the introduction, there have also been both collision and photo-induced
dissociation (CID12, 13 and PID12-14) studies of (N2O • H2O)+ cluster ions, and both cases,
dissociation to H2O+, N2O+, and N2OH+ product ions was observed. The clusters in these studies
were thought to correspond to “RC1” and “RC2” in Figure 11.2. The branching to N2OH+ + OH
(i.e., our HT/DT channel) was ~5-10% in both studies, but increased with collision energy in the
CID study and decreased with photon energy in the PID study. In CID, the lowest energy H2O+ +
N2O channel (i.e., our okr) accounted for ~90% of the products, decreasing somewhat with
increasing collision energy, and the highest energy N2O+ + H2O (i.e., our CT channel) accounted
210

for only 5 - 10% of the products. For PID, the highest energy N2O+ + H2O channel was initially
reported to dominate12, 14; however, after correction of a detection discrimination problem, its
branching was reduced to ~30% and the corresponding branching to the lowest energy H2O+ +
N2O channel was increased to ~60%, increasing with increasing photon energy.13
The branching ratios observed here (lower frame of Figure 11.1) are quite different,
particularly at high Ecol; however, the differences are not unexpected because the three types of
experiments activate the system quite differently. For low Ecol, we observe primarily nonreactive
scattering (i.e., HOD+ + N2O), similar to what is observed in both CID and PID, but the branching
simply reflects the fact that the CT, HT, and DT channels are all endoergic and therefore
inaccessible for all but the high energy tail of our collision energy distribution. As these channels
open with increasing Ecol, we see roughly equal branching for all three channels (i.e., ~30% each
for CT, HT/DT, and no reaction) for Ecol around 1 eV, then at high energies, the HT/DT
branching drops below 20%, and HOD+ + N2O (oNR) and N2O+ + HOD (CT) both increase to
~40%. This contrasts with the 60% - 90% branching for H2O+ + N2O observed in PID, and CID,
respectively.
One important difference between bimolecular collisions compared to CID or PID is that
those experiments start with a complex which is then activated to drive dissociation, while in our
experiment, complexes are only dynamically significant at our lowest energies, as shown by the
vaxial distributions. A related factor is that the angular momentum (Lcollision) associated with
bimolecular collisions is high, and all of this angular momentum is available to affect dissociation
of the collision complex. Lcollision = ^ v b, where ^ is the reduced mass of the reactants, v is the
collision relative velocity, and b is the impact parameter, which ranges from zero to bmax =
(ocollision/n)12 , so that the corresponding Lcollision < 175 h for Ecol = 0.25eV, rising to 318 h at our
highest energy. In PID, the angular momentum comes from the thermal rotation of the initial
complex ion, and is much lower. In CID, the complex is activated by collisions with an inert
target atom, and these collisions also have high Lcollision, ranging from < 197 h near threshold up to
211
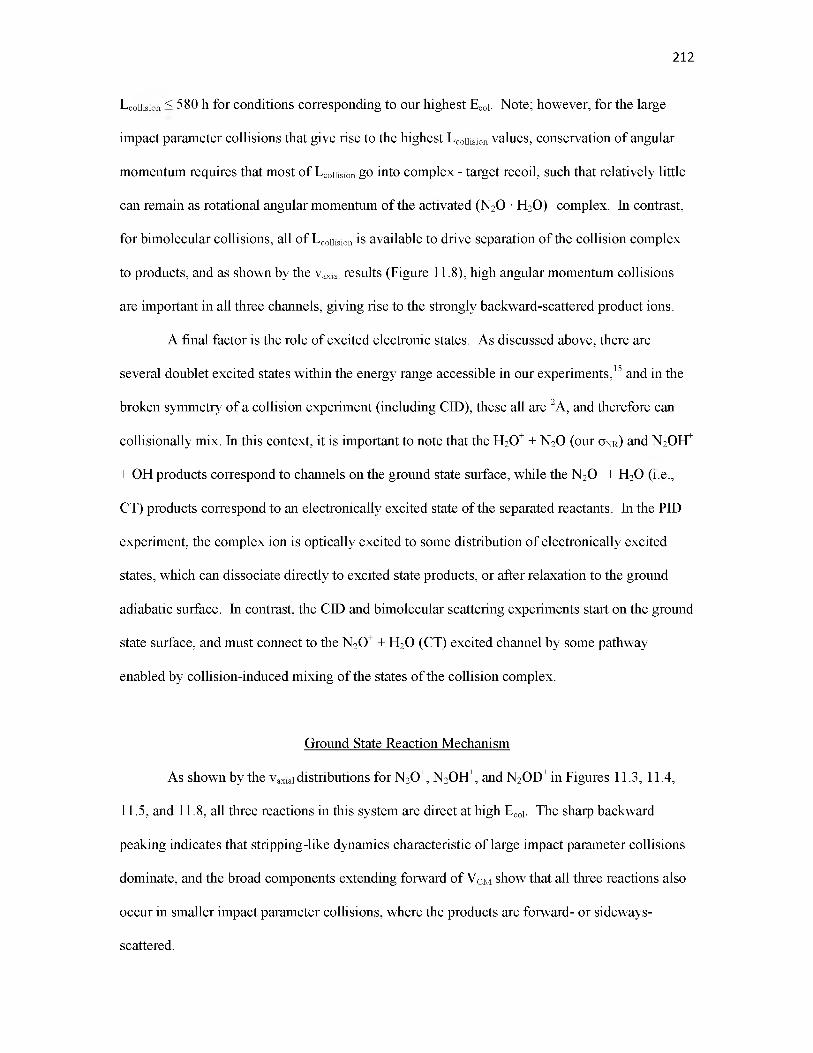
Lcollision < 580 h for conditions corresponding to our highest Ecol. Note; however, for the large
impact parameter collisions that give rise to the highest Lcollision values, conservation of angular
momentum requires that most of Lcollision go into complex - target recoil, such that relatively little
can remain as rotational angular momentum of the activated (N2O • H2O)+ complex. In contrast,
for bimolecular collisions, all of Lcollision is available to drive separation of the collision complex
to products, and as shown by the vaxial results (Figure 11.8), high angular momentum collisions
are important in all three channels, giving rise to the strongly backward-scattered product ions.
A final factor is the role of excited electronic states. As discussed above, there are
several doublet excited states within the energy range accessible in our experiments,15 and in the
broken symmetry of a collision experiment (including CID), these all are 2A, and therefore can
collisionally mix. In this context, it is important to note that the H2O+ + N2O (our o n r ) and N2OH+
+ OH products correspond to channels on the ground state surface, while the N 2 O+ + H 2 O (i.e.,
CT) products correspond to an electronically excited state of the separated reactants. In the PID
experiment, the complex ion is optically excited to some distribution of electronically excited
states, which can dissociate directly to excited state products, or after relaxation to the ground
adiabatic surface. In contrast, the CID and bimolecular scattering experiments start on the ground
state surface, and must connect to the N2O+ + H2O (CT) excited channel by some pathway
enabled by collision-induced mixing of the states of the collision complex.
Ground State Reaction Mechanism
As shown by the vaxial distributions for N2O+, N2OH+, and N2OD+ in Figures 11.3, 11.4,
11.5, and 11.8, all three reactions in this system are direct at high Ecol. The sharp backward
peaking indicates that stripping-like dynamics characteristic of large impact parameter collisions
dominate, and the broad components extending forward of VCM show that all three reactions also
occur in smaller impact parameter collisions, where the products are forward- or sideways-
scattered.
212

213
At low Ecol, the distributions broaden in a way that suggests that they might become
forward-backward symmetric for Ecol near threshold. Symmetry could indicate mediation by a
complex; however, direct reaction mechanisms can also give symmetric distributions. Therefore,
while the RC geometries in Figure 11.2 might plausibly stabilize a complex, we need to examine
other features to tell if such complexes are actually dynamically important at low Ecol. If complex
mediation is important, then the RC complexes would need to have significant lifetimes, and the
observed product branching should also be consistent with branching in decay of the complexes.
To test this proposition, statistical unimolecular decay lifetimes were calculated for the collision
complex, using the RRKM program developed by Zhu and Hase.22 Because the available energy
is far in excess of the barriers to interconversion of the RC1, RC2, and RC3 complexes (Figure
11.2), it is more reasonable to treat the problem as a single interconverting complex (“RC”) with
density of states equal to the sum of the density of states of the three complexes. The decay to
products or reactants was assumed to be governed by an orbiting transition state, since there are
no barriers to these pathways. Decay rates were calculated over the range of collisional angular
momenta appropriate to each Ecol, and then the rates were appropriately averaged under the
assumption that all capture collisions contribute to complex formation. The lifetimes (xc0mplex) as
a function of Ecol were calculated as the inverse of the sum of the rates for decay into each
channel, averaged over Lcollision with appropriate weighting assuming all capture collisions form
complexes. The branching was calculated from the ratios of the rates for each channel, also with
appropriate averaging over the Lcollision distribution. For comparison, the experimental branching
at each collision energy is also given. The calculations were done only for Ecol = 0.20eV, 0.34eV,
and 0.62eV, i.e., for the range of Ecol where complexes might plausibly be significant. The
calculated lifetimes vary from ~15 psec for Ecol = 0.20eV to ~1.5 ps for Ecol = 0.62 eV. These
complex lifetimes are longer than the rotational periods (Table 11.2), which is consistent with the
apparently symmetric vaxial distributions for Ecol < 0.34 eV. As noted; however, symmetry is a
necessary, but not sufficient condition to show that the mechanism is complex-mediated.
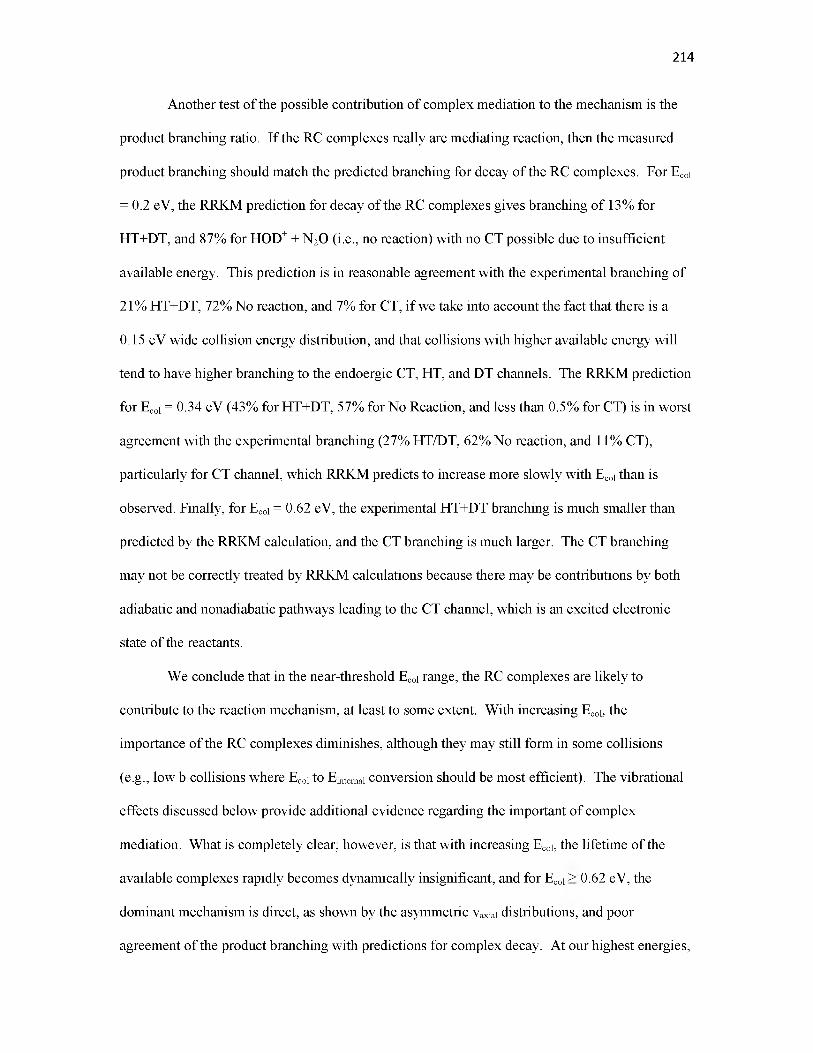
214
Another test of the possible contribution of complex mediation to the mechanism is the
product branching ratio. If the RC complexes really are mediating reaction, then the measured
product branching should match the predicted branching for decay of the RC complexes. For Ecol
= 0.2 eV, the RRKM prediction for decay of the RC complexes gives branching of 13% for
HT+DT, and 87% for HOD+ + N2O (i.e., no reaction) with no CT possible due to insufficient
available energy. This prediction is in reasonable agreement with the experimental branching of
21% HT+DT, 72% No reaction, and 7% for CT, if we take into account the fact that there is a
0.15 eV wide collision energy distribution, and that collisions with higher available energy will
tend to have higher branching to the endoergic CT, HT, and DT channels. The RRKM prediction
for Ecol = 0.34 eV (43% for HT+DT, 57% for No Reaction, and less than 0.5% for CT) is in worst
agreement with the experimental branching (27% HT/DT, 62% No reaction, and 11% CT),
particularly for CT channel, which RRKM predicts to increase more slowly with Ecol than is
observed. Finally, for Ecol = 0.62 eV, the experimental HT+DT branching is much smaller than
predicted by the RRKM calculation, and the CT branching is much larger. The CT branching
may not be correctly treated by RRKM calculations because there may be contributions by both
adiabatic and nonadiabatic pathways leading to the CT channel, which is an excited electronic
state of the reactants.
We conclude that in the near-threshold Ecol range, the RC complexes are likely to
contribute to the reaction mechanism, at least to some extent. With increasing Ecol, the
importance of the RC complexes diminishes, although they may still form in some collisions
(e.g., low b collisions where Ecol to Einternal conversion should be most efficient). The vibrational
effects discussed below provide additional evidence regarding the important of complex
mediation. What is completely clear; however, is that with increasing Ecol, the lifetime of the
available complexes rapidly becomes dynamically insignificant, and for Ecol > 0.62 eV, the
dominant mechanism is direct, as shown by the asymmetric vaxial distributions, and poor
agreement of the product branching with predictions for complex decay. At our highest energies,

where the available energy is much larger than the well depths on the potential surface, scattering
is probably impulsive, and the shapes of the vaxial distributions are probably determined primarily
by the distributions of impact parameter (b) contributing to each channel. Since all three channels
have similar vaxial distributions at high energies, we conclude that all three occurs in large b
collisions that give rise to strongly backward-scattered products, as well as in small and medium
b collisions which give rise to products in the broad tail that extends into the forward direction.
The reactions observed in this system involve transfer of either a light atom (HT or DT)
or an electron (CT), and the very similar vaxial distributions suggest that they are in competition
for collisions at all impact parameters. The ratio of HT+DT to CT is ~3 at low Ecol, as might be
expected because CT is slightly more endoergic than HT or DT, but the ratio drops to ~0.33 at
Ecol = 2.88 eV, i.e., probability of transferring an electron is 3 times greater than the combined
probability of transferring H+ or D+. It should be noted that for this system, there are no
energetically accessible secondary reactions that might lead to loss of HT or DT products, or that
might contribute to the CT product signal. For example, the N2O+ + OH + D and N2O+ + OD +
H channels are >5.3 eV endoergic. Dissociation of the HT (DT) product ion by OH+ (OD+)
elimination is ~2.85 eV endoergic, and in principle could lead to some loss of HT or DT signal;
however, this could occur only at our highest Ecol, and only if nearly all the available energy were
partitioned to internal energy of the N2OH+ (N2OD+) product ion. In fact, as shown by the vaxial
distributions, these product ions have substantial recoil energy, and therefore, this dissociation
process is negligible in the Ecol range studied. We can conclude, therefore, that the predominance
of CT at high energies reflects the dynamics of the HOD+ - N2O collisions.
Another ratio of interest is the HT/DT ratio (bottom frame of Figure 11.7). As noted, for
the threshold Ecol range, where reaction may be mediated by a statistical complex, the ratio is
~1.05, as might be expected because HT is ~20 meV less endoergic than DT. At high energies,
where reaction appears to occur in impulsive collisions, the ratio rises to nearly 1.4. There are a
number of mechanisms which might tend to favor either H+ transfer or D+ transfer in impulsive
215

collisions. In HOD, the center of mass is offset from the center of charge, thus the long-range
attractive force during reactant approach might tend to orient the HOD+ to impact H on N2O.
Because the offset is small due to the presence of the massive O atom, it seems unlikely that this
effect could result in a 40% enhancement of HT, particularly at high Ecol where the approach time
is short.
For an endoergic stripping reaction in the impulsive limit, it may be useful to think about
the energy associated with collision of N2O with either the H or D atom which is being
transferred. Because the N2O-D reduced mass is nearly a factor of two greater than that for N2O-
H, the “local” collision energy is also much greater for D+ stripping, compared to H+ stripping,
thus if collisional energy transfer is the limiting factor in HT/DT, this effect would favor DT, in
contrast to the observed enhanced HT branching. It might be thought that this same factor would
tend to result in higher internal energy of the DT product ion, which might therefore be depleted
by secondary dissociation; however, as mentioned above, there are no energetically accessible
dissociation channels in the Ecol range studied.
In the impulsive limit, HT (DT) in the HOD+ + N2O system can be thought of as an A +
BC system, where A = OD (OH), B = H+/D+, and C = N2O, i.e., light atom transfer between two
heavy groups (a HLH system). Because the reduced mass associated with the light atom transfer
is much lower than for approach and recoil of the system, it is useful to think about the dynamics
in terms of motion on a mass weighted, scaled, and skewed potential energy surface.31 Here, the
main effect is that the skew angle between the reactant and product valleys is 15.7° for HT and
22.3° for DT, i.e., HT requires the system to negotiate a tighter bend than DT. One might think
that this effect might favor DT; however, it could be that the shape of the repulsive wall favors
rebounding around the tighter bend associated with HT. It is possible that HT is enhanced by
tunneling through the “ridge” that separates the reactant and product valleys; however, tunneling
effects are usually more important at low energies, as was observed in HT vs. DT in the Cl + HCl
and Cl + DCl (HLH) systems.32
216
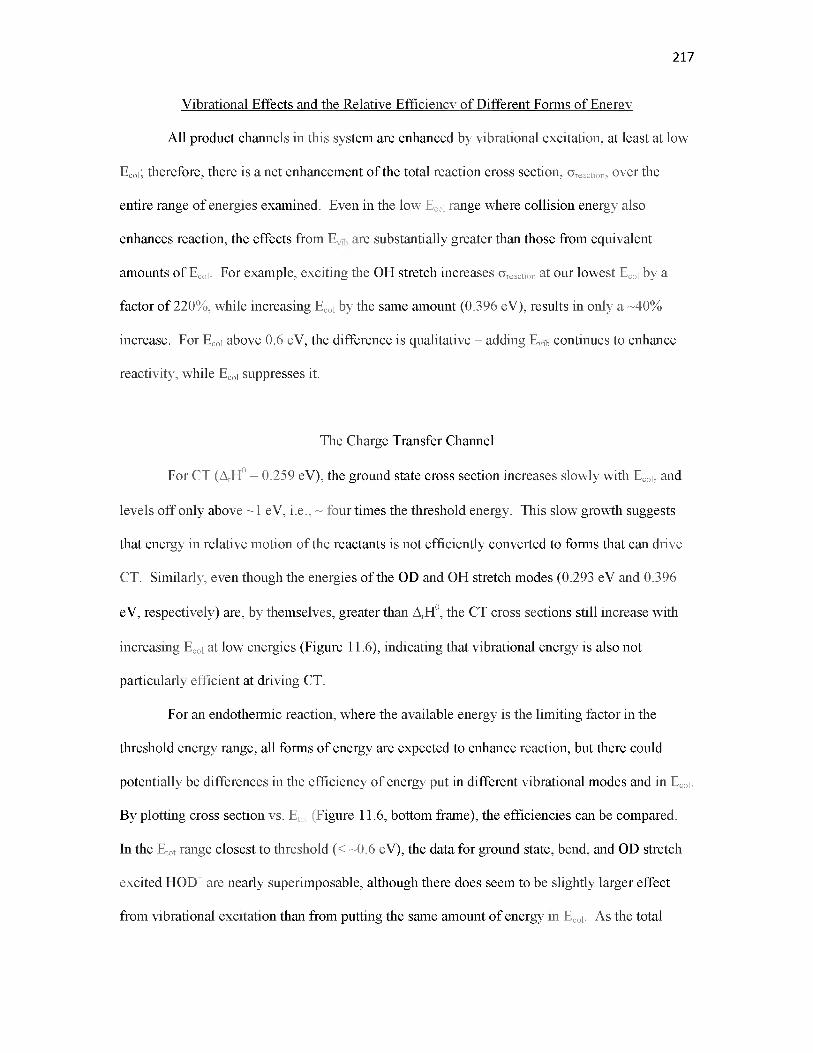
217
Vibrational Effects and the Relative Efficiency of Different Forms of Energy
All product channels in this system are enhanced by vibrational excitation, at least at low
Ecol; therefore, there is a net enhancement of the total reaction cross section, oreaction, over the
entire range of energies examined. Even in the low Ecol range where collision energy also
enhances reaction, the effects from Evib are substantially greater than those from equivalent
amounts of Ecol. For example, exciting the OH stretch increases oreaction at our lowest Ecol by a
factor of 220%, while increasing Ecol by the same amount (0.396 eV), results in only a ~40%
increase. For Ecol above 0.6 eV, the difference is qualitative - adding Evib continues to enhance
reactivity, while Ecol suppresses it.
The Charge Transfer Channel
For CT (ArH0 = 0.259 eV), the ground state cross section increases slowly with Ecol, and
levels off only above ~1 eV, i.e., ~ four times the threshold energy. This slow growth suggests
that energy in relative motion of the reactants is not efficiently converted to forms that can drive
CT. Similarly, even though the energies of the OD and OH stretch modes (0.293 eV and 0.396
eV, respectively) are, by themselves, greater than ArH0, the CT cross sections still increase with
increasing Ecol at low energies (Figure 11.6), indicating that vibrational energy is also not
particularly efficient at driving CT.
For an endothermic reaction, where the available energy is the limiting factor in the
threshold energy range, all forms of energy are expected to enhance reaction, but there could
potentially be differences in the efficiency of energy put in different vibrational modes and in Ecol.
By plotting cross section vs. Etot (Figure 11.6, bottom frame), the efficiencies can be compared.
In the Etot range closest to threshold (< ~0.6 eV), the data for ground state, bend, and OD stretch
excited HOD+ are nearly superimposable, although there does seem to be slightly larger effect
from vibrational excitation than from putting the same amount of energy in Ecol. As the total
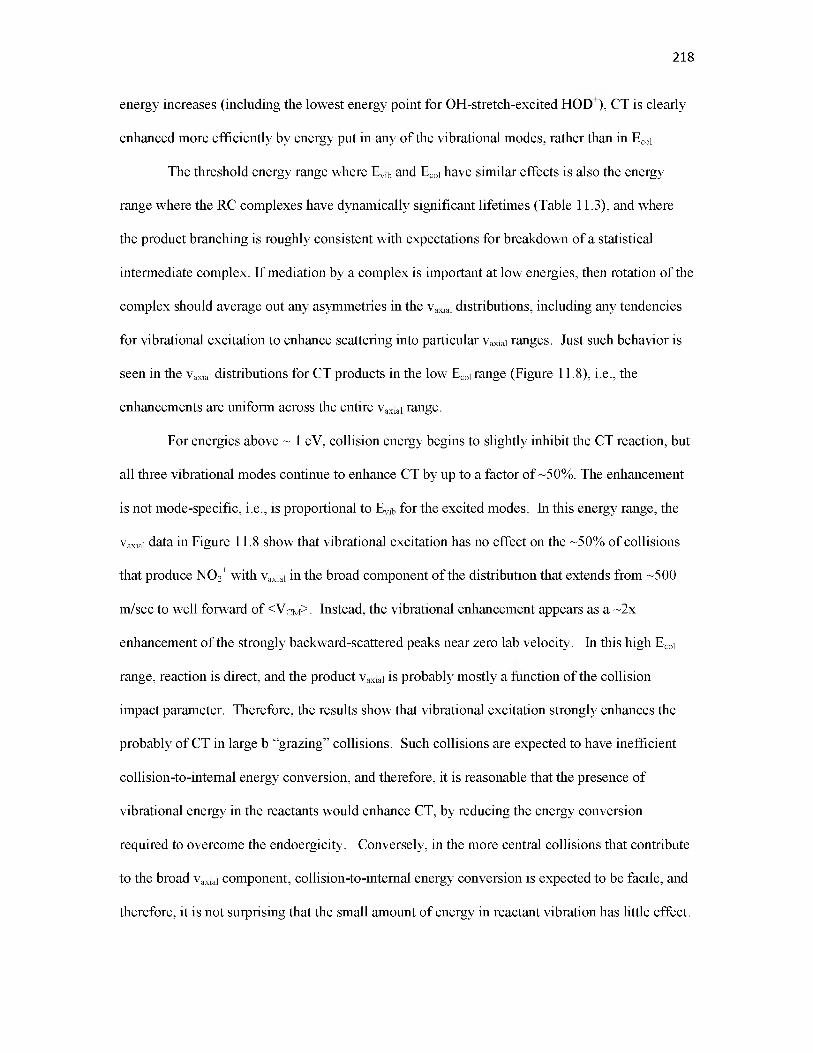
energy increases (including the lowest energy point for OH-stretch-excited H OD ), CT is clearly
enhanced more efficiently by energy put in any of the vibrational modes, rather than in Ecol.
The threshold energy range where Evib and Ecol have similar effects is also the energy
range where the RC complexes have dynamically significant lifetimes (Table 11.3), and where
the product branching is roughly consistent with expectations for breakdown of a statistical
intermediate complex. If mediation by a complex is important at low energies, then rotation of the
complex should average out any asymmetries in the vaxial distributions, including any tendencies
for vibrational excitation to enhance scattering into particular vaxial ranges. Just such behavior is
seen in the vaxial distributions for CT products in the low Ecol range (Figure 11.8), i.e., the
enhancements are uniform across the entire vaxial range.
For energies above ~ 1 eV, collision energy begins to slightly inhibit the CT reaction, but
all three vibrational modes continue to enhance CT by up to a factor of ~50%. The enhancement
is not mode-specific, i.e., is proportional to Evib for the excited modes. In this energy range, the
vaxial data in Figure 11.8 show that vibrational excitation has no effect on the ~50% of collisions
that produce NO2+ with vaxial in the broad component of the distribution that extends from ~500
m/sec to well forward of <VCM>. Instead, the vibrational enhancement appears as a ~2x
enhancement of the strongly backward-scattered peaks near zero lab velocity. In this high Ecol
range, reaction is direct, and the product vaxial is probably mostly a function of the collision
impact parameter. Therefore, the results show that vibrational excitation strongly enhances the
probably of CT in large b “grazing” collisions. Such collisions are expected to have inefficient
collision-to-internal energy conversion, and therefore, it is reasonable that the presence of
vibrational energy in the reactants would enhance CT, by reducing the energy conversion
required to overcome the endoergicity. Conversely, in the more central collisions that contribute
to the broad vaxial component, collision-to-internal energy conversion is expected to be facile, and
therefore, it is not surprising that the small amount of energy in reactant vibration has little effect.
218

H+/D+ Transfer
The cross sections for N 2 OH+ and N 2 OD+ production for each HOD+ vibrational state are
shown vs. Ecol in Figure 11.7, which also gives the HT/DT branching. All modes of HOD+
excitation and Ecol enhance the endoergic HT and DT at the lowest Ecol, which is not surprising
for an endoergic reaction. Unlike CT, the enhancements from vibrational excitation are much
larger than the effects from increasing Ecol, even at our lowest energies. Indeed, Ecol inhibits both
HT and DT except at our lowest energy. In addition, the vibrational effects on HT and DT are
quite mode-specific, even at low Ecol, where it appears that mediation by complexes may be
important in the reaction mechanism.
In a complex-mediated mechanism, we might expect the initial mode of vibrational
excitation to be scrambled, and in that case, reactivity should depend only on the total energy, and
possibly the total angular momentum. The fact that strongly mode-specific vibrational
enhancements are observed for HT and DT may, therefore, appear to preclude significant
participation of the RC complexes in the reaction mechanism, even at low Ecol. In fact; however,
there are many examples of ion-molecule reactions that clearly proceed via intermediate
17 33 34complexes, but which nonetheless show strong mode selective vibrational effects. , , The
complexes in these cases are weakly bound reactant-like structures, which can form from
reactants without breaking or forming any covalent bonds. In such complexes, the reactant
moieties are loosely coupled and therefore, formation of a complex does not necessarily lead to
rapid scrambling of the reactant vibrations. Therefore, the system can still “remember” the initial
vibrational excitation when it passes through the rate-limiting step on the reaction coordinate,
which comes as the reactant-like complex transitions either to one of the product channels, or to a
product-like complex that leads eventually to one of the product channels. In the HOD+ + N2O
system, the RC complexes are bound by over an electron volt; however, the energy appears to
depend weakly on the geometry, and thus it is not unreasonable to expect that vibrational mode
scrambling may be slow.
219
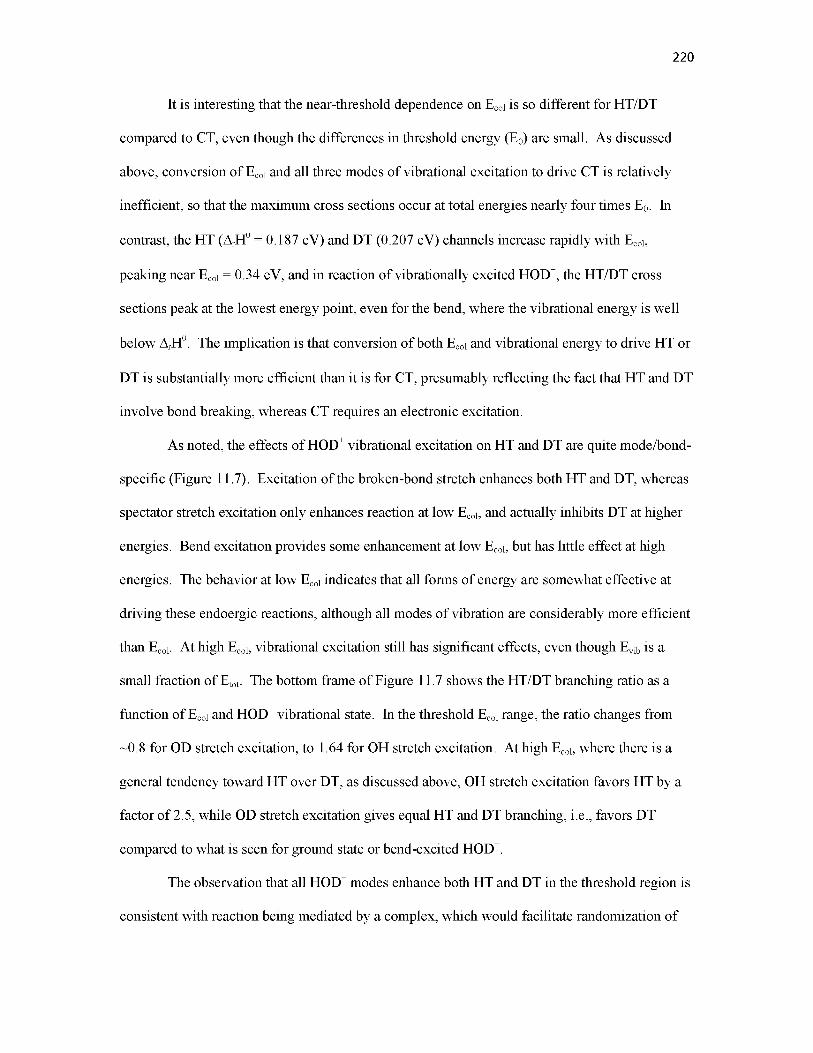
It is interesting that the near-threshold dependence on Ecol is so different for HT/DT
compared to CT, even though the differences in threshold energy (E0) are small. As discussed
above, conversion of Ecol and all three modes of vibrational excitation to drive CT is relatively
inefficient, so that the maximum cross sections occur at total energies nearly four times E0. In
contrast, the HT (ArH° = 0.187 eV) and DT (0.207 eV) channels increase rapidly with Ecol,
peaking near Ecol = 0.34 eV, and in reaction of vibrationally excited HOD+, the HT/DT cross
sections peak at the lowest energy point, even for the bend, where the vibrational energy is well
below ArH0. The implication is that conversion of both Ecol and vibrational energy to drive HT or
DT is substantially more efficient than it is for CT, presumably reflecting the fact that HT and DT
involve bond breaking, whereas CT requires an electronic excitation.
As noted, the effects of HOD+ vibrational excitation on HT and DT are quite mode/bond-
specific (Figure 11.7). Excitation of the broken-bond stretch enhances both HT and DT, whereas
spectator stretch excitation only enhances reaction at low Ecol, and actually inhibits DT at higher
energies. Bend excitation provides some enhancement at low Ecol, but has little effect at high
energies. The behavior at low Ecol indicates that all forms of energy are somewhat effective at
driving these endoergic reactions, although all modes of vibration are considerably more efficient
than Ecol. At high Ecol, vibrational excitation still has significant effects, even though Evib is a
small fraction of Etot. The bottom frame of Figure 11.7 shows the HT/DT branching ratio as a
function of Ecol and HOD+ vibrational state. In the threshold Ecol range, the ratio changes from
~0.8 for OD stretch excitation, to 1.64 for OH stretch excitation. At high Ecol, where there is a
general tendency toward HT over DT, as discussed above, OH stretch excitation favors HT by a
factor of 2.5, while OD stretch excitation gives equal HT and DT branching, i.e., favors DT
compared to what is seen for ground state or bend-excited HOD+.
The observation that all HOD+ modes enhance both HT and DT in the threshold region is
consistent with reaction being mediated by a complex, which would facilitate randomization of
220

vibrational energy allowing all modes to couple to the reaction coordinate, albeit with very
different efficiencies. As Ecol increases and reaction becomes direct, the broken-bond stretch
continues to have a substantial effect, consistent with this mode being directly coupled to the
reaction coordinate, as might be expected. The spectator stretch enhancement disappears for Ecol
> 0.6 eV for HT, and switches to a significant inhibition for Ecol > 0.3 eV for DT. It is not clear
why energy in the spectator bond should inhibit reaction; however, we note that Ecol also inhibits
HT and DT in this energy range. Bend excitation continues to enhance HT and DT up to Ecol ~ 1
eV, even though we would expect that this mode should not couple to the reaction coordinate.
An unexpected enhancement from bend excitation was also observed for HT and DT in reaction
of HOD+ with CO210 and N2,9 and in that case, it was attributed to a bend-induced distortion of the
potential surface, which facilitated scattering into the product channel.10
As shown in Figure 11.8, at low Ecol, both OH and OD stretch excitations enhance HT for
all vaxial, with a larger increase from the higher energy OH stretch, which is also the broken-bond
stretch. As in CT, the fact that the enhancement appears over the entire vaxial distribution is
consistent with reaction being mediated by a complex that lives long enough to rotationally
average out any angular dependence of the enhancement. In contrast, the DT reaction at Ecol =
0.34 eV is enhanced across the entire distribution by the OD (broken-bond) stretch, but the OH
(spectator) stretch has no effect. This lack of effect is coincidental. Ecol = 0.34 eV just happens to
be energy where the OH stretch vibrational effect crosses over from enhancement at low Ecol to
inhibition at high Ecol (Figure 11.7). Indeed, the vaxial distributions at Ecol = 0.2 eV show that OH
stretch excitation enhances the entire distribution, with an effect roughly half that from the OD
stretch.
At high Ecol, the effects on HT and DT are also quite different. For HT, the OH (broken-
bond) stretch enhances the integral cross section by ~30 % (Figure 11.7 top), but the
enhancement is only for collisions that lead to strongly backward-scattered product ions,
indicating that OH stretching only enhances stripping in large impact parameter collisions
221

(Figure 11.8 center). The OD (spectator) stretch has no significant effect on either the integral
cross section or vaxial distribution for HT. In contrast, the integral cross section for DT at 2.88 eV
(Figure 11.7) is still enhanced ~40% by OD (broken-bond) stretch excitation, but Figure 11.8
shows that the enhancement occurs in collisions producing N2OD+ in a broader, but still
backward-scattered, range of vaxial. The implication is that reactivity is enhanced for a wider
range of impact parameters, though still all leading to backward-scattered product ions.
Excitation of the OH (spectator) stretch inhibits DT (Figure 11.7), and Figure 11.8 shows that the
inhibition primarily affects the broad component of the vaxial distribution, with only a small
decrease in the sharply backward-scattered peak. This suggests that OH stretching inhibits
reaction for small to medium impact parameters, but has little effect on stripping at the largest
reactive impact parameters.
The observation that at high Ecol, HT and DT are enhanced selectively by the stretch of
the bond that is broken in reaction, and either inhibited or unaffected by the spectator stretch, is
consistent with the “Polanyi rules” developed for A + BC reactions, that were briefly mentioned
in the introduction1. The “rules” state that translational energy should be more efficient than
vibrational energy at overcoming an early barrier in the reaction coordinate and that vibrational
energy (in the BC stretch) should be more efficient than translational energy at overcoming a late
barrier in the reaction coordinate. As shown in Figure 11.2, there are no (early) barriers to
reactant approach in typical ion-molecule reactions, but since the reaction is endoergic, there is a
late barrier to HT and DT. For polyatomic reactants, of course, only vibrations that correspond to
the barrier crossing motion are effective, and in this case, it should be clear that the vibration of
interest is the broken-bond stretch. The spectator stretch is, to zeroth order, not coupled to the
reaction coordinate, but obviously there is some coupling even when reaction is direct, as shown
by the inhibition of DT by excitation of the OH stretch at high Ecol. At low Ecol, where collision
times are long, and complexes may be mediating reaction to some extend, vibrational mode
scrambling allows all modes to couple to drive HT and DT.
222

Conclusion
Reaction of HOD+ with N2O appears to be complex-mediated at low Ecol and is clearly
direct at high Ecol. Vibrationally exciting HOD+ enhances CT nonspecifically, i.e., with effects
that are proportional to the energy of the vibration, but larger than the effects of equivalent
amounts of Ecol. Increasing Evib also increases the partitioning of energy to Erecoil. The vibrational
results for HT/DT are strongly mode- and bond-selective. The broken-bond stretch enhances HT
and DT by a factor of ~2 at low Ecol with enhancement diminishing with increasing energy. The
broken-bond stretch also increases the partitioning of energy to Erecoil. Exciting the spectator
stretch results in smaller enhancement at low Ecol, and either no effect or inhibition at higher Ecol.
The recoil vaxial distributions shows that for low Ecol, vibrational excitation enhances reaction in
all collision, while at high Ecol, the enhancement mainly occurs in large impact parameter
collisions, with little effect, or even inhibition, in smaller impact parameter collisions.
Acknowledgements
This work was supported by grants CHE-0647124 and CHE-1111935 from the Chemistry
division of the National Science Foundation.
References
1. J. C. Polanyi and W. H. Wong, J. Chem. Phys. 51, 1439 (1969).
2. M. C. Hsiao, A. Sinha and F. F. Crim, J. Phys. Chem. 95, 8263 (1991).
3. R. B. Metz, J. D. Thoemke, J. M. Pfeiffer and F. F. Crim, J. Chem. Phys. 99, 1744 (1993).
4. A. Sinha, M. C. Hsiao and F. F. Crim, J. Chem. Phys. 92, 6333 (1990).
5. A. Sinha, M. C. Hsiao and F. F. Crim, J. Chem. Phys. 94, 4928 (1991).
6. M. J. Bronikowski, W. R. Simpson, B. Girard and R. N. Zare, J. Chem. Phys. 95, 8647(1991).
7. M. J. Bronikowski, W. R. Simpson and R. N. Zare, J. Phys. Chem. 97, 2204 (1993).
223

224
8. D. H. Zhang, M. A. Collins and S.-Y. Lee, Science 290, 961 (2000).
9. D. M. Bell, J. M. Boyle and S. L. Anderson, J. Chem. Phys 135, 044305 (2011).
10. D. M. Bell, J. M. Boyle and S. L. Anderson, J. Chem. Phys 134, 64312 (2011).
11. D. M. Bell and S. L. Anderson, J. Phys. Chem. A 117, 1083 (2012).
12. M. J. Bastian, R. A. Dressler, D. J. Levandier, E. Murad, F. Muntean and P. B. Armentrout, J. Chem. Phys. 106, 9570 (1997).
13. S. Williams, Y.-H. Chiu, D. J. Levandier and R. A. Dressler, J. Chem. Phys. 108, 9383 (1998).
14. S. T. Graul, H.-S. Kim and M. T. Bowers, Int. J. Mass Spectrom. Ion Proc. 117, 507(1992).
15. J. E. Stevens, M. C. Holthausen and K. Morokuma, J. Chem. Phys. 111, 7766 (1999).
16. Y.-H. Chiu, H. Fu, J.-T. Huang and S. L. Anderson, J. Chem. Phys. 102, 1199 (1995).
17. J. Liu, B. V. Devener and S. L. Anderson, J. Chem. Phys. 119, 200 (2003).
18. J. M. Boyle, D. M. Bell and S. L. Anderson, Journal of Chemical Physics 134, 034313 (2011).
19. B. W. Uselman, J. M. Boyle and S. L. Anderson, Chemical Physics Letters 440, 171 (2007).
20. D. Gerlich, in State-selected and state-to-state ion-molecule reaction dynamics, Part I. Experiment, edited by C. Y. Ng and M. Baer (Wiley, New York, 1992), Vol. LXXXII, pp. 1-176.
21. M. J. Frisch, G. W. Trucks, H. B. Schlegel, G. E. Scuseria, M. A. Robb, J. R. Cheeseman, J. J. A. Montgomery, T. Vreven, K. N. Kudin, J. C. Burant, J. M. Millam, S. S. Iyengar,J. Tomasi, V. Barone, B. Mennucci, M. Cossi, G. Scalmani, N. Rega, G. A. Petersson, H. Nakatsuji, M. Hada, M. Ehara, K. Toyota, R. Fukuda, J. Hasegawa, M. Ishida, T. Nakajima, Y. Honda, O. Kitao, H. Nakai, M. Klene, X. Li, J. E. Knox, H. P. Hratchian, J. B. Cross, C. Adamo, J. Jaramillo, R. Gomperts, R. E. Stratmann, O. Yazyev, A. J. Austin, R. Cammi, C. Pomelli, J. W. Ochterski, P. Y. Ayala, K. Morokuma, G. A. Voth, P. Salvador, J. J. Dannenberg, V. G. Zakrzewski, S. Dapprich, A. D. Daniels, M. C. Strain, O. Farkas, D. K. Malick, A. D. Rabuck, K. Raghavachari, J. B. Foresman, J. V. Ortiz, Q. Cui, A. G. Baboul, S. Clifford, J. Cioslowski, B. B. Stefanov, G. Liu, A. Liashenko, P. Piskorz, I. Komaromi, R. L. Martin, D. J. Fox, T. Keith, M. A. Al-Laham, C. Y. Peng, A. Nanayakkara, M. Challacombe, P. M. W. Gill, B. Johnson, W. Chen, M. W. Wong, C. Gonzalez and J. A. Pople, (Gaussian, Inc., Pittsburgh PA, 2003).
22. L. Zhu and W. L. Hase, in Quamtum Chemistry Program Exchange (Chemistry Department, Indiana University Bloomington, 1993).
225
23. S. G. Lias, J. E. Bartmess, J. F. Liebman, J. L. Holmes, R. D. Levin and W. G. Mallard, J. Phys. Chem. Ref. Data 17, 1 (1988).
24. S. G. Lias, in NIST Standard Reference Database Number 69, edited by P. J. Linstrom and W. G. Mallard (National Institute of Standards and Technology, Gaithersburg, MD, 2003), pp. http://webbook.nist.gov.
25. J. M. L. Martin and T. J. Lee, J. Chem. Phys. 98, 7951 (1993).
26. J. Liu, B. Van Devener and S. L. Anderson, J. Chem. Phys. 123, 204313 (2005).
27. J. M. Boyle, D. M. Bell, S. L. Anderson and A. A. Viggiano, J. Phys. Chem. A 115, 1172 (2011).
28. G. A. Fisk, J. D. McDonald and D. R. Herschbach, Discuss. Faraday Soc. 44, 228 (1967).
29. J. D. C. Jones, K. Birkinshaw and N. D. Twiddy, Chemical Physics Letters 77, 484 (1981).
30. C. B. Moore and P. F. Zittel, Science 182, 541 (1973).
31. R. D. Levine, Molecular Reaction Dynamics. (Cambridge U. Pr., Cambridge, 2005).
32. B. C. Garrett, D. G. Truhlar, A. F. Wagner and T. H. Dunning, Jr., J. Chem. Phys. 78 , 4400 (1983).
33. J. Liu and S. L. Anderson, Int. J. Mass Spectrom. 241, 173 (2005).
34. Y.-H. Chiu, H. Fu, J.-T. Huang and S. L. Anderson, J. Chem. Phys. 101, 5410 (1994).
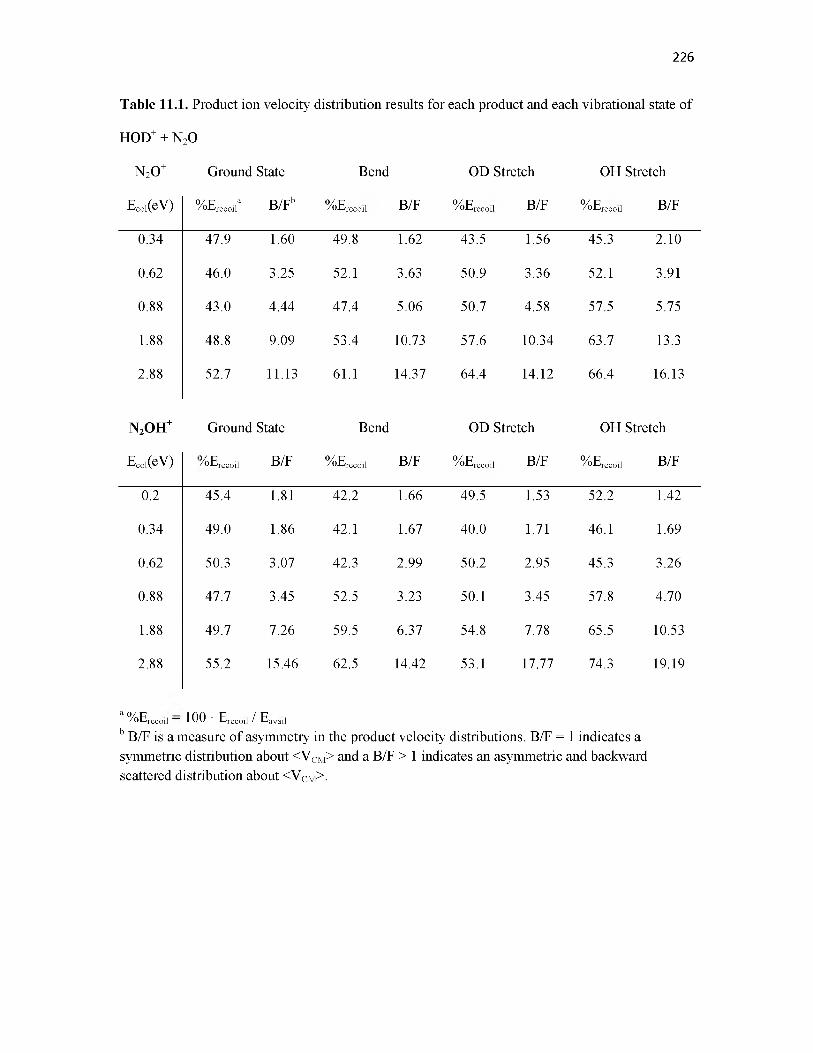
Table 11.1. Product ion velocity distribution results for each product and each vibrational state of
HOD+ + N2O
N2O+ Ground State Bend OD Stretch OH Stretch
226
Ecol(eV) %Erecoila B/Fb %Erecoil B/F %Erecoil B/F %Erecoil B/F
0.34 47.9 1.60 49.8 1.62 43.5 1.56 45.3 2.10
0.62 46.0 3.25 52.1 3.63 50.9 3.36 52.1 3.91
0.88 43.0 4.44 47.4 5.06 50.7 4.58 57.5 5.75
1.88 48.8 9.09 53.4 10.73 57.6 10.34 63.7 13.3
2.88 52.7 11.13 61.1 14.37 64.4 14.12 66.4 16.13
N2 OH+ Ground State Bend OD Stretch OH Stretch
Ecol(eV) %Erecoil B/F %Erecoil B/F %Erecoil B/F %Erecoil B/F
0.2 45.4 1.81 42.2 1.66 49.5 1.53 52.2 1.42
0.34 49.0 1.86 42.1 1.67 40.0 1.71 46.1 1.69
0.62 50.3 3.07 42.3 2.99 50.2 2.95 45.3 3.26
0.88 47.7 3.45 52.5 3.23 50.1 3.45 57.8 4.70
1.88 49.7 7.26 59.5 6.37 54.8 7.78 65.5 10.53
2.88 55.2 15.46 62.5 14.42 53.1 17.77 74.3 19.19
3 %Erecoil = 100 • Erecoil / Eavailb B/F is a measure of asymmetry in the product velocity distributions. B/F = 1 indicates a symmetric distribution about <VCM> and a B/F > 1 indicates an asymmetric and backward scattered distribution about <VCM>.

227
Table 11.2 Rotational lifetimes of reactant-like complexes
Ecol(eV)RC 1/2
xrotation
RC3
xrotation
axfly-by
0.2 0.85 1.27 0.29
0.34 0.74 1.11 0.22
0.62 0.64 0.96 0.17
0.88 0.59 0.88 0.14
1.88 0.49 0.73 0.1
2.88 0.44 0.66 0.08
All lifetime values are in picoseconds. a Time it takes the reactants to travel 5A.

228
Table 11.3 RRKM lifetime and branching ratios
Ecol(eV) complex(ps)Branching
HT+DT : CT : No Rxn
0.2 15.0 12.7 : 0 : 87.3 RRKM
21.3 : 6.5 : 72.3 Exp.
0.34 7.0 42.6 : 0.5 : 56.9 RRKM
27.5 : 11.1 : 61.3 Exp.
0.62 1.45 73.6 : 3.4 : 23.0 RRKM
33.6 : 24.5 : 41.8 Exp.
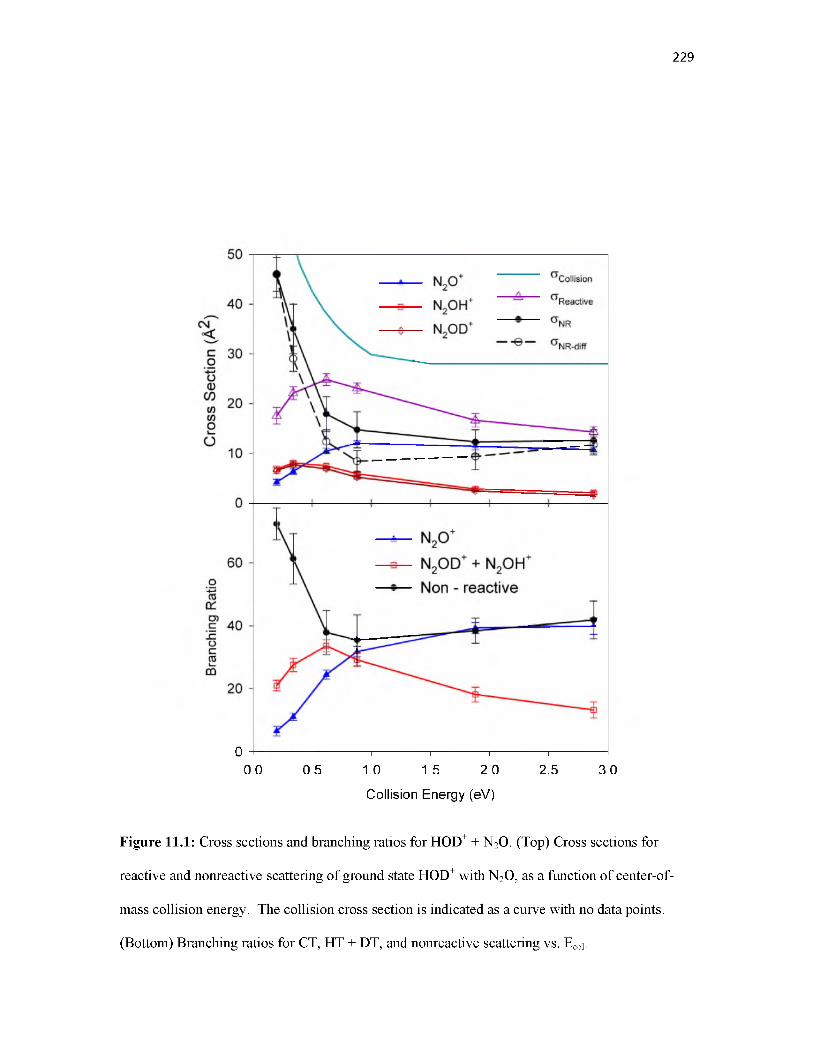
229
0 "1------------------------ I------------------------ 1------------------------ I------------------------ I------------------------ 1------------------------
0.0 0.5 1.0 1.5 2.0 2.5 3.0
Collision Energy (eV)
Figure 11.1: Cross sections and branching ratios for HOD+ + N2O. (Top) Cross sections for
reactive and nonreactive scattering of ground state HOD+ with N2O, as a function of center-of-
mass collision energy. The collision cross section is indicated as a curve with no data points.
(Bottom) Branching ratios for CT, HT + DT, and nonreactive scattering vs. Ecol.

Energ
etics
<eV
)
230
Figure 11.2: Reaction coordinate based on experimental energies for products and reactants and
b3lyp/6-311++G(d,p) calculations for complexes and transitions states

231
Figure 11.3: Lab frame axial velocity (vaxial) distributions for N2OH+ produced in the reaction of
ground state HOD+. Points - experimental data. Solid curves - simulations. Solid vertical lines
indicate <VCM>.

232
Lab frame Velocity (m/s)
Figure 11.4: Lab frame axial velocity (vaxial) distributions for N2OD+ produced in the reaction of
ground state HOD+. Points - experimental data. Solid curves - simulations. Solid vertical lines
indicate <VCM>.

233
n 2o + V Ecol = 0.34
v ..........................................................................w----------------
S . Ecol = 0.62 ...........................................................
>
Ecol = 0.88
• • • ....... ...............................................................---------------------- W-----------------------------------------------
Ecol = 1.79
• • • . —t
1 i
Ecol = 2.88— ____ .
n--------- • • •-1000 0 1000 2000 3000 4000
Lab frame Velocity (m/s)
Figure 11.5: Lab frame axial velocity (vaxial) distributions for N2O+ produced in the reaction of
ground state HOD+. Points - experimental data. Solid curves - simulations. Solid vertical lines
indicate <VCM>.

234
Figure 11.6: Cross sections for CT in the reaction of HOD+ + N2O. (Top) Cross sections for
production of N2O+ from reaction of HOD+ in the indicated vibrational states as a function of
collision energy. (Bottom) Analogous cross sections vs. Etot = Ecol + Evib.
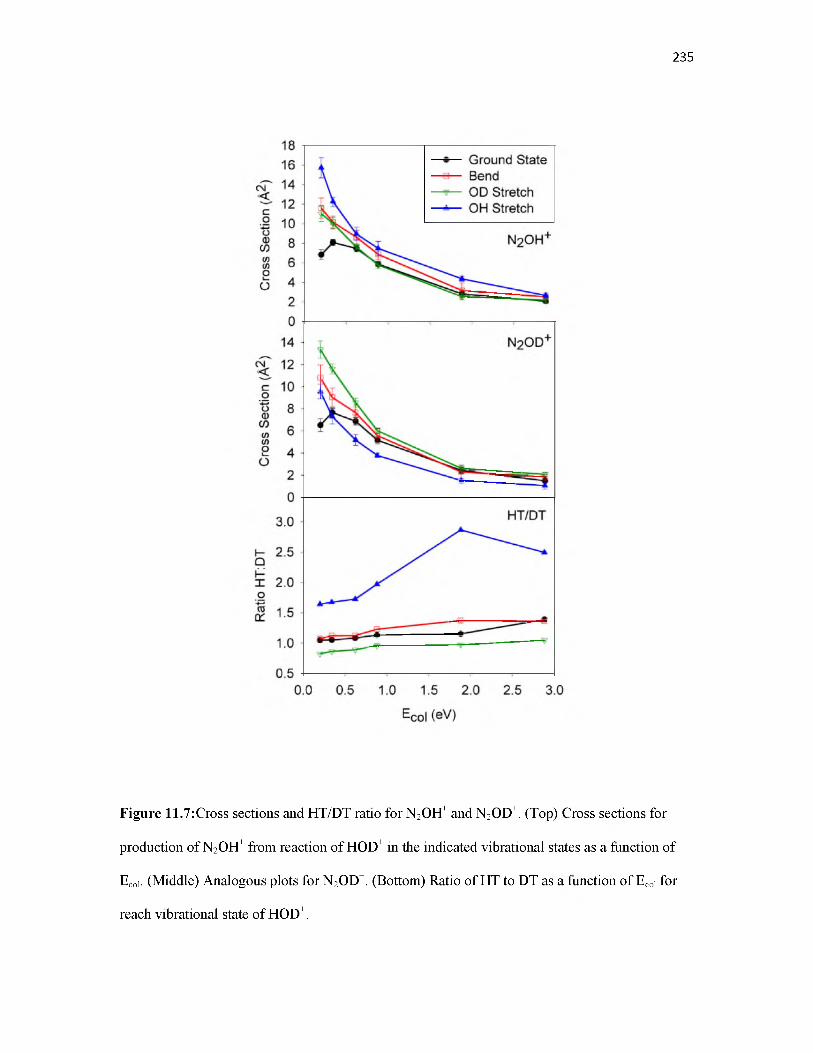
235
Figure 11.7:Cross sections and HT/DT ratio for N2OH+ and N2OD+. (Top) Cross sections for
production of N2OH+ from reaction of HOD+ in the indicated vibrational states as a function of
Ecol. (Middle) Analogous plots for N2OD+. (Bottom) Ratio of HT to DT as a function of Ecol for
reach vibrational state of HOD+.

236
0 500 10001500 2000 0 500 1000 1500 2000 0 500 10001500 2000 2500Lab Frame Velocity (m/s)
Figure 11.8: Axial velocity (vaxial) distributions for N2O+ (right), N2OH+ (middle), and N2OD+
(left) produced from reaction of HOD+ in its ground state, and with one quantum of either the OD
stretch of the OH stretch. The vertical line in each frame indicates <VCM>.