Embed Size (px)
Citation preview
lable at ScienceDirect
Ocean & Coastal Management xxx (2016) 1e10
Contents lists avai
Ocean & Coastal Management
journal homepage: www.elsevier .com/locate/ocecoaman
Evaluation of status of commercial fish stocks in European marinesubareas using mean trophic levels of fish landings and spawningstock biomass
R.P. Prabath K. Jayasinghe a, b, c, *, Upali S. Amarasinghe d, Alice Newton c, e
a Marine Biological Resources Division, National Aquatic Resources Research and Development Agency, Crow Island, Colombo 15, Sri Lankab Fundaci�on Universidad Empresa de la provincia de C�adiz (FUECA), University of C�adiz, 11003 C�adiz, Spainc CIMA, Gambelas Campus, University of Algarve, Faro 8005-139, Portugald Department of Zoology and Environmental Management, University of Kelaniya, Kelaniya, Sri Lankae NILU-IMPEC, Box 100, 2027 Kjeller, Norway
a r t i c l e i n f o
Article history:Received 15 October 2015Received in revised form23 June 2016Accepted 3 July 2016Available online xxx
Keywords:Mean trophic levelsLandingsSpawning stock biomassFish stocksCFPMSFD
* Corresponding author. Marine Biological ResourcResources Research and Development Agency, Crow I
E-mail addresses: [email protected] (U.S. Amarasinghe), [email protected]
http://dx.doi.org/10.1016/j.ocecoaman.2016.07.0020964-5691/© 2016 The Authors. Published by Elsevier
Please cite this article in press as: Jayasinghmean trophic levels of fish landings andj.ocecoaman.2016.07.002
a b s t r a c t
Most of the fish stocks in the world, including European fish stocks, are threatened by overfishing and/ordegraded environmental conditions. Although the Common Fisheries Policy (CFP) is the main policyinstrument managing fish stocks in Europe, there is continued concern as to whether commercial fishstocks will achieve Good Environmental Status (GEnS) in 2020 in accordance with the Marine StrategyFramework Directive (MSFD). In this context, the evaluation of the status of fish stocks in the subareas ofFAO fishing area 27 was carried out using mean trophic levels (MTL) in fish landings and spawning stockbiomass (SSB). Comparisons were made before and after 2008 to establish whether the trend is positiveor negative. The main data sources for landings and SSB were the International Council for the Explo-ration of the Sea (ICES) advisory reports. MTLs in landing and SSB were determined for each subarea andthe subareas were categorized into four groups, according to MTLs after 2008. The first group (subareasI þ II, V) had higher MTL in landings and higher MTL in SSB after 2008. Therefore, fisheries in thesesubareas appear sustainable. The second group was subareas VIII þ IX, for which the fish stocks havehigher MTL in landings but low MTL in SSB, indicating that SSB was being overfished. The third wassubarea (VI), where fish stocks have lower MTL in landings than those in SSB after 2008, which mayindicate that fish stocks are recovering. Fish stocks in the fourth group (subareas III, IV and VII) had lowMTL in landings and the MTL in SSB was lower than that of landings before 2008. This may be due toheavy fishing. In addition, we estimated the harvest rate (HR) of the fish stocks before and after 2008. Theresults showed that most of the fish stocks have lower HR after 2008, indicating that the status hasimproved, perhaps due to improvements in the implementation of CFP. However, some fish stocksshowed high HR even after 2008, so that new management options are still needed. Other factors such aseutrophication, seafloor disturbances, marine pollution, invasive species etc., influence SSB ecosystemhealth options and should also be incorporated in the management criteria. Most of these environmentalpressures are of high priority in the MSFD, and therefore the findings of this study will be useful for bothCFP and MSFD.© 2016 The Authors. Published by Elsevier Ltd. This is an open access article under the CC BY-NC-ND
license (http://creativecommons.org/licenses/by-nc-nd/4.0/).
1. Introduction
The Common Fisheries Policy (CFP) is the main policy document
es Division, National Aquaticsland, Colombo 15, Sri Lanka.(R.P.P.K. Jayasinghe), zoousa@(A. Newton).
Ltd. This is an open access article u
e, R.P.P.K., et al., Evaluation ofspawning stock biomass,
to manage European fisheries resources. It was adopted in 1983 andhas since been revised every 10 years (Aanesen et al., 2012). Thelatest version was approved by the European Parliament in 2013(Pastoors, 2014). The main modus operandi of the CFP for managingfisheries is to decrease the fishing capacity (Villasante, 2010;Gascuel et al., 2011). However, the very high fishing pressureexerted by EU fishing fleets has been insufficiently reduced by theCFP to achieve healthy stocks and maximum sustainable yield
nder the CC BY-NC-ND license (http://creativecommons.org/licenses/by-nc-nd/4.0/).
status of commercial fish stocks in European marine subareas usingOcean & Coastal Management (2016), http://dx.doi.org/10.1016/
R.P.P.K. Jayasinghe et al. / Ocean & Coastal Management xxx (2016) 1e102
(MSY) (Villasante, 2010). Furthermore, the EU has a legal re-sponsibility under the United Nations Convention on the Law of theSea (UNCLOS) to restore fish stocks by maintaining fishing mor-tality at a level of producingMSY that reached a critical milestone in2015 (Froese and Proelß, 2010). As a further governance response,the European Marine Strategic Framework Directive (MSFD) wasestablished in 2008 by European nations with coastal boarders (EU,2008). The main objective of MSFD is to achieve good environ-mental status (GEnS) by 2020 through 11 qualitative descriptors(Borja et al., 2010; Foley, 2013). Descriptor number three (D3) ad-dresses populations of commercially exploited fish/shellfishemphasizing that these should be within safe biological limits,while exhibiting population age and size distribution pertaining tohealthy stocks (EU, 2008). Furthermore, Member States areresponsible to conserve, improve and restore the marine ecosys-tems, including fish populations, to achieve the UNCLOS milestonein conjunction with the CFP and MSFD.
Both the CFP (EU, 2013; Prellezo and Curtin, 2015) and MSFD(EU, 2008) use ecosystem-based management approaches. Garciaet al. (2003), Browman and Stergiou (2004) and Pauly et al.(2002) have shown the importance of ecosystem-based fisheriesmanagement (EBM) to obtain a sustainable harvest from marinefish stocks. Additionally, Brodziak and Link (2002) stated thatmaintaining a healthy trophic structure (food web) is one of themain objectives of EBM. Furthermore, trophic level based indicatorsare useful to understand complex interactions between fisheriesand marine ecosystems (Pauly and Watson, 2005).
Pitcher et al. (2001) suggested that reinventing fisheries man-agement where and when the fisheries are in a crisis, such as thecurrent situation in European Regional Seas. The contention is thatEBM directed towards fisheries sustainability should rebuild fishcommunities, whereas the conventional fisheries managementapproaches do not reverse the depleted fisheries because of theover-exploitation of species of higher trophic levels (Pitcher et al.,2001). Thus, a fish community trophic level approach, in accor-dance with the EBM, would better fulfil the objectives of both theCFP and MSFD.
The present study was focused on how trophic level based in-dicators of fisheries can be used to assess andmanage EU fish stocksin marine subareas of FAO area 27, through the evaluation of thestatus of some commercially exploited fish stocks. The mainobjective of the study was to determine whether the adoption ofnew policy instruments (MSFD and CFP) are successfully reversingthe negative trend of fisheries. One difficulty is to set the thresholddate for comparison of “before” and “after” effective implementa-tion of policy instruments. Any date is arbitrary since the adoptionof a policy is not the same as its effective implementation. However,we opted to compare pre and post 2008 data for the purposes ofthis study. After adoption of the MSFD, member states weremandated to draw up cost-effective plans by 2015, prior to the fullimplementation of the MSFD (Long, 2011). Additionally, the latestversion CFP is effective from 1st January 2014, and hence we useddata until 2013, to show the status of fish stocks prior to the newversion of the CFP. The findings of the present study may thus beuseful to monitor the progress due to both the CFP and MSFDimplementation.
The present study addresses the following research questions:
(i) Is there a change in fishing pressure over trophic levels in thecontext of the implementation of the policy instruments?
(ii) Are fish stocks showing signs of recovery since 2008?
Please cite this article in press as: Jayasinghe, R.P.P.K., et al., Evaluation ofmean trophic levels of fish landings and spawning stock biomass,j.ocecoaman.2016.07.002
2. Materials and Methods
2.1. Area, fish stocks and data sources
2.1.1. Study areaSub areas of FAO fishing area 27 (Baltic and NE Atlantic) were
selected for the present analysis (Fig. 1). Table 1 describes themarine subareas considered in this analysis.
2.1.2. Selection of fish stocks and data sourcesCommercially important fish stocks that are listed in the Inter-
national Council for the Exploration of the Sea (ICES) advisory re-ports were selected for the present analysis. The species evaluatedwere cod (Gadus morhua), haddock (Melanogrammus aeglefinus),saithe (Pollachius virens), herring (Clupea harengus), sole (Soleasolea), plaice (Pleuronectes platessa), whiting (Merlangius merlan-gius), hake (Merluccius merluccius) and sprat (Sprattus sprattus).These stocks represent about 25% of the fish stocks in the Europeanregion. They are considered as the most important in Europeancommercial fisheries and these data are considered to be rich andreliable by ICES (Cardinale et al., 2013).
Data on fish landings and spawning stock biomass (SSB) ofconcerned fish stocks from the ICES scientific advisory reports for2014 (http://www.ices.dk/community/advisory-process/Pages/Latest-advice.aspx) were accessed on 20.10.2014 and used in thestudy. In these reports, catch data were available up to andincluding 2013.
2.2. Data analysis
2.2.1. Mean trophic levels in SSB and fish landings in differentsubareas
Mean trophic levels (TLi) of fish communities were calculatedbased on the feeding habits of constituent species and according toEquation (1) (Pauly and Palomares, 2005), which are reported inwww.fishbase.org (Froese and Pauly, 2014).
TLi ¼ 1þXj
�TLj$DCij
�(1)
where TLj is trophic level of the prey j and DCij is the fraction of j inthe diet of i. For the present analysis, TLi values for the spawningstock biomass and landings of constituent species in the fishingareas (Table 1) were extracted from the www.fishbase.org (Froeseand Pauly, 2014). Accordingly, TLi values used in the analysis were4.29 for cod, 3.56 for haddock, 3.61 for saithe, 3.29 for herring, 3.30for sole, 3.23 for plaice, 3.57 for whiting, 3.84 for horse mackerel,4.30 for hake and 3.01 for sprat (Jayasinghe et al., 2015).
Seven subareas (Iþ II, III, IV, V, VI, VII, VIIIþ IX) were considered,based on the availability of ICES advisory reports. For each area, theMean trophic level for year y (MTLy) was computed from 2009 to2013 to observe whether there are any trends before and after the2008. The fish stocks that were considered for each subarea forMTLanalysis are given in Table 2. The data availability of each fish stockwas inconsistent, and therefore, the analysis was performed for theperiods when data were available for all fish stocks in severalconsecutive years before and after 2008. Accordingly, the analysiswas for the periods commencing in 1960, 1991, 1990, 1987, 1992,1987, and 1992 for the I þ II, III, IV, V, VI, VII and VIII þ IX subareasrespectively, and until 2013. The formulae are given below.
MTLy ¼Xi
�TLi$Yiy
�,Xi
Yiy (2)
status of commercial fish stocks in European marine subareas usingOcean & Coastal Management (2016), http://dx.doi.org/10.1016/
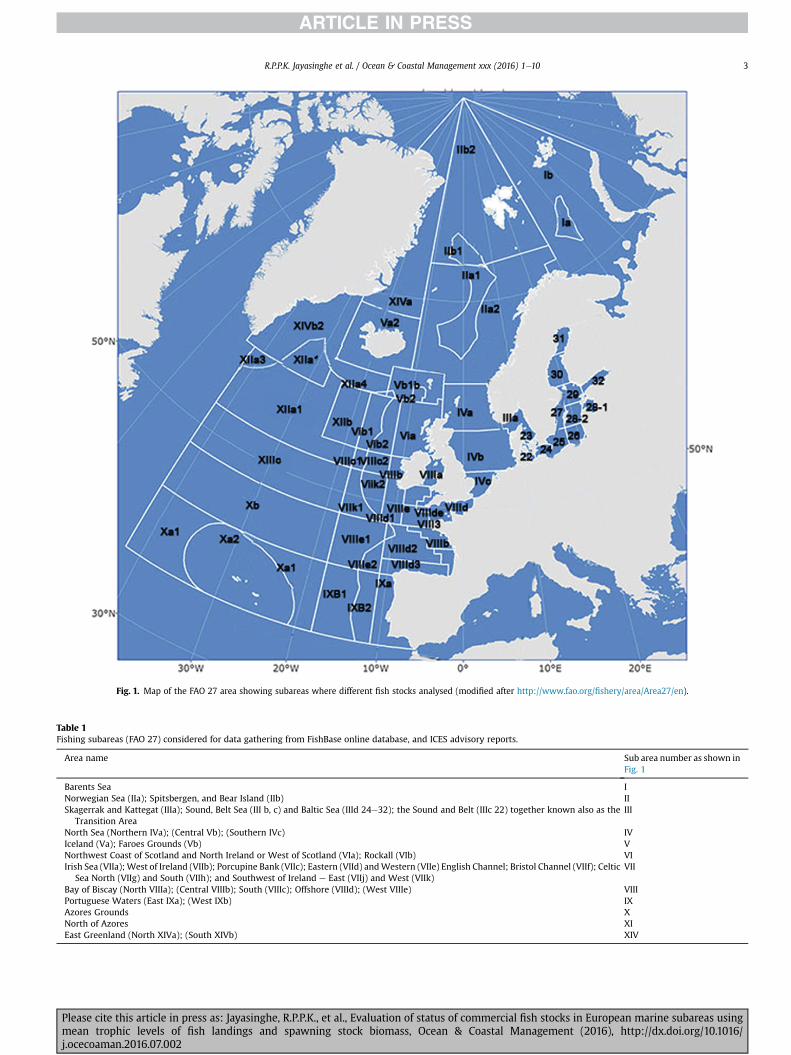
Fig. 1. Map of the FAO 27 area showing subareas where different fish stocks analysed (modified after http://www.fao.org/fishery/area/Area27/en).
Table 1Fishing subareas (FAO 27) considered for data gathering from FishBase online database, and ICES advisory reports.
Area name Sub area number as shown inFig. 1
Barents Sea INorwegian Sea (IIa); Spitsbergen, and Bear Island (IIb) IISkagerrak and Kattegat (IIIa); Sound, Belt Sea (III b, c) and Baltic Sea (IIId 24e32); the Sound and Belt (IIIc 22) together known also as the
Transition AreaIII
North Sea (Northern IVa); (Central Vb); (Southern IVc) IVIceland (Va); Faroes Grounds (Vb) VNorthwest Coast of Scotland and North Ireland or West of Scotland (VIa); Rockall (VIb) VIIrish Sea (VIIa);West of Ireland (VIIb); Porcupine Bank (VIIc); Eastern (VIId) andWestern (VIIe) English Channel; Bristol Channel (VIIf); Celtic
Sea North (VIIg) and South (VIIh); and Southwest of Ireland e East (VIIj) and West (VIIk)VII
Bay of Biscay (North VIIIa); (Central VIIIb); South (VIIIc); Offshore (VIIId); (West VIIIe) VIIIPortuguese Waters (East IXa); (West IXb) IXAzores Grounds XNorth of Azores XIEast Greenland (North XIVa); (South XIVb) XIV
R.P.P.K. Jayasinghe et al. / Ocean & Coastal Management xxx (2016) 1e10 3
Please cite this article in press as: Jayasinghe, R.P.P.K., et al., Evaluation of status of commercial fish stocks in European marine subareas usingmean trophic levels of fish landings and spawning stock biomass, Ocean & Coastal Management (2016), http://dx.doi.org/10.1016/j.ocecoaman.2016.07.002

Table 2Fish stocks considered for mean trophic level analysis in each subarea.
Area (s) Fish stocks
I þ II Cod, Haddock, SaitheIII Cod (SDs 22e24), Herring IIIa and (SDs 22e24)
Herring IIId (SD 30), Herring IIId (SDs 25e29)Herring IIId (28.1), IIId (SD 31), Sole IIIa
IV Cod (IV,VIId, IIIa), Haddock (IV,IIIA (West)),Herring (IV, VIId, IIIa West), Sole, Plaice, Whiting (IV, VIId), Sprat
V Cod, Haddock, Saithe, HerringVI Whiting (VIa), Herring (VIa North), Haddock (VIb)VII Cod (VIIe-k), Cod (VIIa), Herring (VIIa)
Sole (VIId), Sole (VIIf,g), Plaice (VIIe)VIII þ IX Sole (VIIIa,b), Horse Mackerel (IXa)
Hake (VIIIc, IXa)
Note: fish stocks were allocated to each subarea following Cardinale et al. (2013).
R.P.P.K. Jayasinghe et al. / Ocean & Coastal Management xxx (2016) 1e104
where Yiy is the catch of species i.Similarly, the MTL in SSB was estimated using Equation (3).
MTLðSSBÞy ¼Xi
�TLi$SSBiy
�,Xi
SSBiy (3)
where SSBiy is the SSB of species i (obtained from ICES advisoryreports) in year y.
The MTL in fish landings (L) is given by Equation (4).
MTLðLÞy ¼Xi
�TLi$Liy
�,Xi
Liy (4)
where Liy is the landings of species i (obtained from ICES advisoryreports) in year y.
To determine whether the MTL in landings was high or low ineach subarea after 2008, a reference level of MTL in 3.75(Christensen et al., 2003) was used.
2.2.2. Difference between mean trophic levels in SSB and fishlandings
The difference of MTL (D) in fish landings [TL(L)y] and SSB[TL(SSB)y] was determined by following equation:
D ¼ MTLðLÞy � MTLðSSBÞy (5)
Subareas showing higher MTL in SSB than that in landings after2008 were identified.
2.2.3. Categorization of fishing subareasThe subareas were grouped based on the MTL in landings (high
or low) and the difference betweenMTL in SSB andMTL of landingsafter 2008.
2.2.4. Distribution of MTL among SSB and fish landings (L) beforeand after 2008
The following equations were used to analyze the effect ofadopting the MSFD on tropic levels in SSB and fish landings (L).
TLi for SSB before MSFD
Mean SSBTLi ¼X
SSBTLiðy1�2008Þ
.ny (6)
TLi for SSB after MSFD
Mean SSBTLi ¼X
SSBTLið2009�2013Þ
.ny (7)
where SSBTLi is SSB of fish with trophic level i, y1 is first dataavailable year and ny is number of years.
TLi for fish landings before MSFD
Mean LTLi ¼X
LTLiðy1�2008Þ
.ny (8)
TLi for fish landings after MSFD
Mean LTLi ¼X
LTLið2009�2013Þ.ny (9)
where LTLi is landings of fish with trophic level i, y1 is first dataavailable year and ny is number of years.
2.2.5. Harvest rate of fish stocks before and after2008The Harvest rate (HR) of fish stocks was calculated (Piet et al.,
2010) for fish stocks before and after 2008.
Please cite this article in press as: Jayasinghe, R.P.P.K., et al., Evaluation ofmean trophic levels of fish landings and spawning stock biomass,j.ocecoaman.2016.07.002
HR for before 2008 ðHRy1� 2008Þ¼
XLiðy1�2008Þ
.XSSBiðy1�2008Þ (10)
HR for 2009� 2013 ðHRy2009� 2013Þ¼
XLið2009�2013Þ
.XSSBið2009�2013Þ (11)
3. Results
3.1. MTL in fish landings and SSB
HigherMTL values (>3.75) in the landings after 2008were foundfor fishing subareas I þ II, V and VIII þ IX (Fig. 2). Lower values ofMTL (<3.75) in landings since 2008 were found in subareas III, IV, VIand VII (Fig. 2).
In addition, Fig. 2 illustrates that in most cases, the MTL inlandings were higher than theMTL in SSB, showing the high fishingdemand for fish species of higher trophic levels. Nevertheless, theMTL in SSB exceeded the MTL in landings in some instances, in thesubareas I þ II, IV, V, VI and VII (Fig. 2).
3.2. Differences between MTL in fish landings and SSB
In Fig. 3, various levels of differences between MTL in fishlandings and SSB can be seen for the subareas. Moreover, subareassuch as I þ II, V and VI (Fig. 3) had higher MTL in SSB than that oflandings after 2008, while other subareas (III, IV, VII and VIII þ IX)did not have higher MTL in SSB than of landings (Fig. 3). Further-more, Fig. 3 indicates that MTL in landings in subareas III, VIII andVIIIþ IX were always higher thanMTL in SSB. Also, the difference ofMTL of these two mean trophic levels was remarkably large insubareas VIII þ IX (Fig. 3), especially after year 2005.
3.3. Categorization of fishing subareas based on MTL in landing anddifferences between MTL in SSB and landings
The fishing subareas could be classified into four groups basedon the MTL in landings (high or low) and the difference betweenMTL in SSB and MTL in landings after 2008 (Table 3).
3.4. Distribution of SSB and landings among different trophic values(before and after 2008)
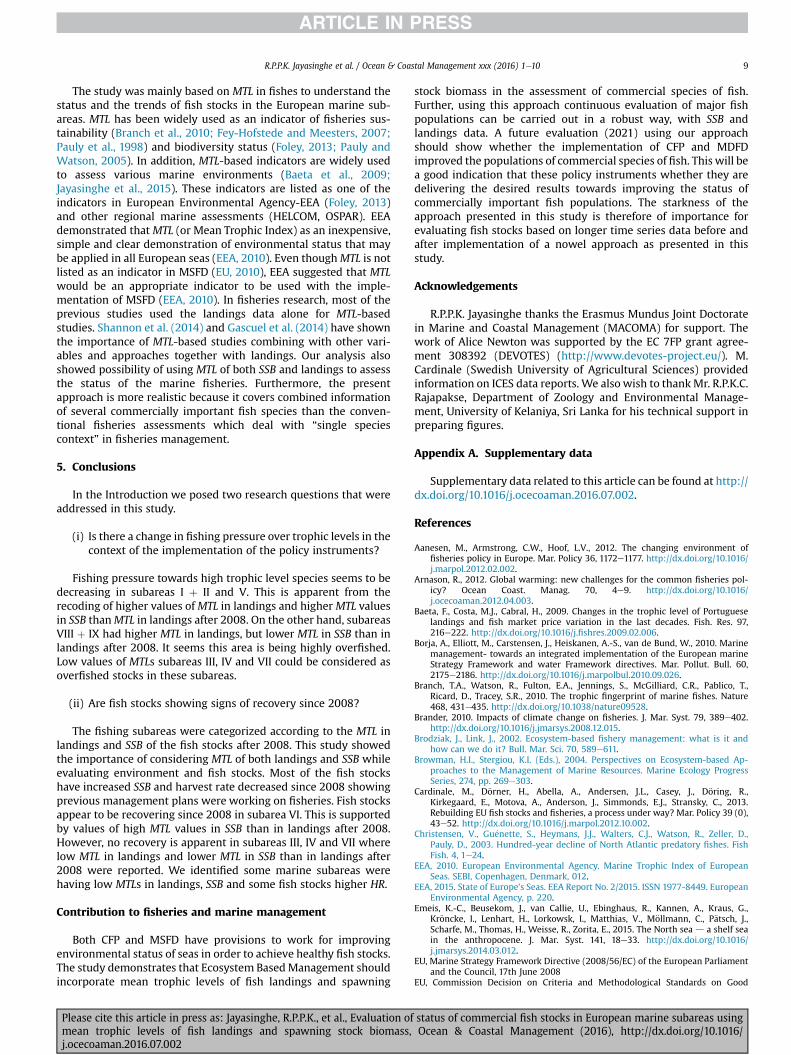
3.4.1. Subareas I þ IIIn subareas I þ II, cod was the main species in SSB and landings.
status of commercial fish stocks in European marine subareas usingOcean & Coastal Management (2016), http://dx.doi.org/10.1016/
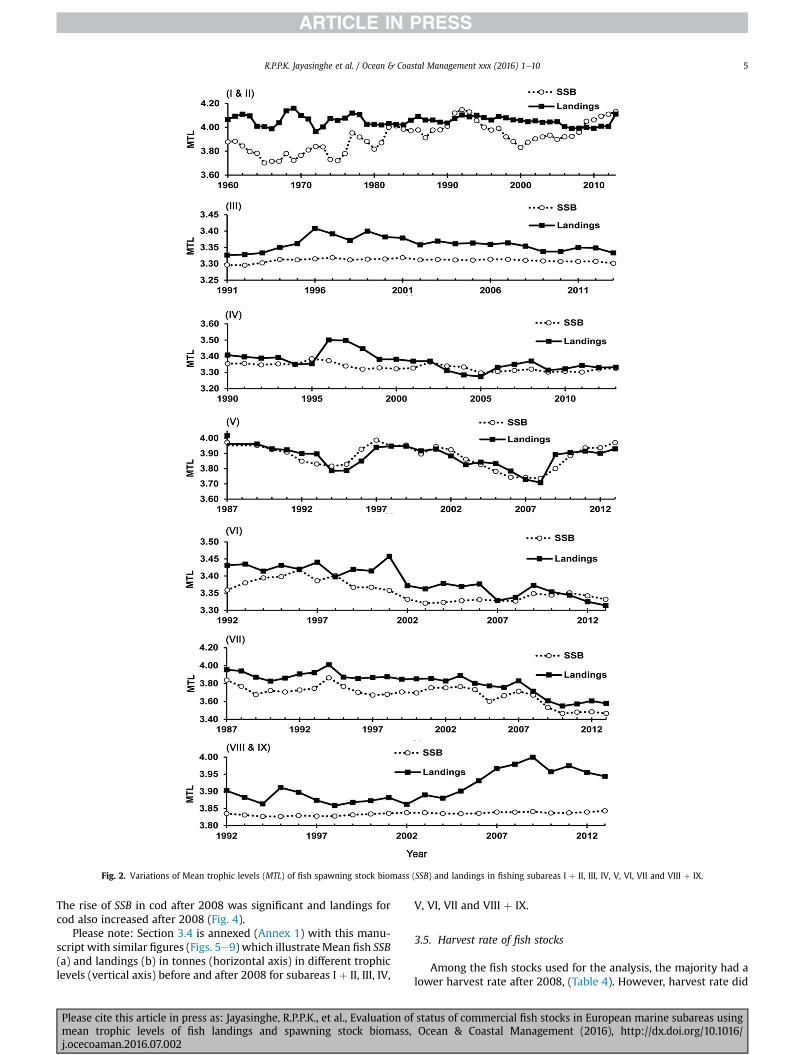
Fig. 2. Variations of Mean trophic levels (MTL) of fish spawning stock biomass (SSB) and landings in fishing subareas I þ II, III, IV, V, VI, VII and VIII þ IX.
R.P.P.K. Jayasinghe et al. / Ocean & Coastal Management xxx (2016) 1e10 5
The rise of SSB in cod after 2008 was significant and landings forcod also increased after 2008 (Fig. 4).
Please note: Section 3.4 is annexed (Annex 1) with this manu-script with similar figures (Figs. 5e9) which illustrateMean fish SSB(a) and landings (b) in tonnes (horizontal axis) in different trophiclevels (vertical axis) before and after 2008 for subareas I þ II, III, IV,
Please cite this article in press as: Jayasinghe, R.P.P.K., et al., Evaluation ofmean trophic levels of fish landings and spawning stock biomass,j.ocecoaman.2016.07.002
V, VI, VII and VIII þ IX.
3.5. Harvest rate of fish stocks
Among the fish stocks used for the analysis, the majority had alower harvest rate after 2008, (Table 4). However, harvest rate did
status of commercial fish stocks in European marine subareas usingOcean & Coastal Management (2016), http://dx.doi.org/10.1016/

Fig. 3. Difference (D) between MTL in fish landings and MTL in spawning stock biomass (SSB) in fishing subareas I þ II, III, IV, V, VI, VII and VIII þ IX.
R.P.P.K. Jayasinghe et al. / Ocean & Coastal Management xxx (2016) 1e106
Please cite this article in press as: Jayasinghe, R.P.P.K., et al., Evaluation of status of commercial fish stocks in European marine subareas usingmean trophic levels of fish landings and spawning stock biomass, Ocean & Coastal Management (2016), http://dx.doi.org/10.1016/j.ocecoaman.2016.07.002

Table 3Categorization of fishing subareas and fish stocks based in MTL in the landing and differences between MTL of SSB and landings after 2008.
High MTL(L) Low MTL(L)
MTL(SSB)>MTL(L) 2008e2013
I þ II: Cod, Saithe, Haddock VI: Whiting (VIa), Haddock (VIb), Herring (VIa North)V: Cod, Saithe, Haddock, Herring
MTL(SSB)<MTL(L) 2008e2013
VIII þ IX: Hake (VIIIc, IXa), Horse Mackerel (IXa),Sole (VIIIa,b)
III: Cod (SDs 22e24), Sole (IIIa), Herring in IIIa and (SDs 22e24), IIId (SD 30), IIId (SDs 25e29),IIId (28.1)IV: Cod (IV,VIId, IIIa), Whiting (IV,VIId), Haddock (IV,IIIA (West), Sole, Herring (IV, VIId, IIIaWest) Plaice, Sprat,VII: Cod in (VIIa), (VIIe-k), Sole in (VIId), (VIIf,g) Herring (VIIa), Plaice (VIIe)
0 1000000 2000000 3000000
3.56
3.61
4.29
(a - Prior to 2008)
0 500000
3.56
3.61
4.29
(b - Prior to 2008)
0 1000000 2000000 3000000
3.56
3.61
4.29
(a - A er 2008)
0 500000
3.56
3.61
4.29
(b -A er 2008)
Fig. 4. Mean fish SSB (a) and landings (b) in tonnes (horizontal axis) in different trophic levels (vertical axis) in before and after 2008 in subareas I þ II.
R.P.P.K. Jayasinghe et al. / Ocean & Coastal Management xxx (2016) 1e10 7
increase in some fish stocks. The highest harvest rates were foundin cod fisheries in the North Sea (subarea IV) before and after 2008.
4. Discussion
SSB and landings are considered as important indicators inevaluating the status of commercial fish stocks. Trophic level basedindicators are also useful indicators to understand complex in-teractions between fisheries and marine ecosystems (Pauly andWatson, 2005). In the present study, we attempted to use trophicstatus of SSB and landings to categorize marine subareas in Europe.
Our analysis showed that theMTL of landings in subareas Iþ II, Vand VIII þ IX were higher, while other subareas (III, IV, VI and VII)had lowerMTL landings. Additionally, Jayasinghe et al. (2015) foundsimilar results for these subareas while evaluating environmentalstatus based on trophic levels and life history information on fishes.As a step forward, we computed MTL in SSB in each subarea tocompare with those of fish landings. The study revealed that sub-areas I þ II and V had higher MTL in landings as well as higher MTLin SSB than MTL in landings after 2008.
In the first group of subareas (I þ II and V), the anthropogenicstresses on the fish stocks such as shipping, sea bed disturbancesare not excessive (EEA, 2015), and perhaps these conditions mayhave supported the increase of fish biomasses. Subareas wherehigher MTL in SSB and landings are evident appear to be “safe” interms of fisheries.
Please cite this article in press as: Jayasinghe, R.P.P.K., et al., Evaluation ofmean trophic levels of fish landings and spawning stock biomass,j.ocecoaman.2016.07.002
The second group (Subareas VIII þ IX) had highMTL in landings,but not in SSB after 2008. This is probably due to by a severedependence of the fishery on new recruits, a majority of immatureindividuals in the landings, inhibition of breeding and recruitmentsbecause of overexploitation over the past decades (Gu�enette andGascuel, 2012). Here, the landings of high trophic level species,such as hake, increased after 2008. Gu�enette and Gascuel (2012)reported that extremely heavy fishing mortality in Bay of Biscayarea (subarea VIII) before 2008, and it seems that fishing pressuretowards hake in these subareas is still high. In addition, the esti-mated harvest rate for hake in these subareas was 1.10 (presentanalysis) signifying that this stock is being overfished.
Subarea VI was grouped in the third category, which was havinglow MTL in SSB and landings. However, in this subarea after 2008,MTL of SSB has been higher than in landings perhaps due to thedrop of landings specially whiting. Though theMTL in landings low,increasing MTL in SSB is a positive sign of recovery of fish stocks inthis subarea.
The last category of subareas (III, IV and VII) had lowMTL in bothlandings and SSB after 2008. As such, these subareas can beconsidered as the poorest status of fish stocks in terms MTLs. TheSSB has not improved during the recent years and high trophic levelspecies also was dominant in the landings. In these subareas, therewas no prominence of SSB for cod, but for herrings both SSB andlandings increased after 2008, showing a dominance of low trophicspecies in subarea III. Similarly, subarea IV also had larger
status of commercial fish stocks in European marine subareas usingOcean & Coastal Management (2016), http://dx.doi.org/10.1016/

Table 4Harvest rates (HR) of fish stocks before and after 2008 and stock status.
Subarea Fish stock HR Stock status
Before 2008 2009e2013
I þ II Cod 1.688 0.429 ImprovedSaithe 0.499 0.547 Not improvedHaddock 0.955 0.759 Improved
III Cod (SDs 22e24) 1.156 0.462 ImprovedSole IIIa 0.364 0.320 ImprovedHerringsIIIa and (SDs 22e24) 0.752 0.471 ImprovedIIId (SD 30) 0.139 0.423 Not ImprovedIIId (SDs 25e29) 0.286 0.724 Not ImprovedIIId (28.1) 0.408 1.604 Not Improved
IV Cod (IV,VIId, IIIa) 2.018 1.032 ImprovedWhiting (IV,VIId) 0.200 0.098 ImprovedHaddock (IV,IIIA (West) 0.631 0.226 ImprovedSole 0.519 0.343 ImprovedHerring (IV, VIId, IIIa West) 0.298 0.142 ImprovedPlaice 0.601 0.240 ImprovedSprat 0.814 0.434 Improved
V Cod 0.332 0.196 ImprovedSaithe 0.627 0.535 ImprovedHaddock 0.553 0.413 ImprovedHerring 0.249 0.120 Improved
VI Whiting (VIa) 0.419 0.123 ImprovedHaddock (VIb) 0.650 0.269 ImprovedHerring (VIa North) 0.245 0.249 Not improved
VII Cod (VIIa) 0.809 0.159 ImprovedCod (VIIe-k) 0.806 0.512 ImprovedSole (VIId) 0.420 0.386 ImprovedSole (VIIf,g) 0.421 0.331 ImprovedHerring (VIIa) 0.458 0.053 ImprovedPlaice (VIIe) 0.023 0.017 Improved
VIII þ IX Hake (VIIIc, IXa) 1.173 1.110 ImprovedHorse Mackerel (IXa) 0.075 0.080 Not ImprovedSole (VIIIa,b) 0.426 0.295 Improved
R.P.P.K. Jayasinghe et al. / Ocean & Coastal Management xxx (2016) 1e108
proportions of low trophic level fish species such as herring, plaiceand sprat both in SSB and landings. The high tropic level species(cod) showed overfishing status even after 2008. Shannon et al.(2014) and Emeis et al. (2015) reported that most of high trophiclevel species in the North Sea have already been fished out. Insubarea VII, even though landings of cod have dropped after 2008,no improvement could be seen in SSB. This is probably due to someother factors affecting recruitment and mortality of fishes likephysical damage of sea floor (EEA, 2015), which is common insubarea VII (Foden et al., 2011). Furthermore, eutrophication is alsocommon in this subarea (EEA, 2015), and has negative impacts onfish populations (HELCOM, 2009).
In the present analysis, we illustrated that MTL in SSB of fishspecies can be considered as an ecosystem-based indicator forassessing trophic structure of commercially important fish com-munities (Rombouts et al., 2013). However, growth, development,reproduction, recruitment, migration, predation and natural mor-tality also affect SSB in fish stocks. According to the EEA (2015), inaddition to fishing pressure, various qualitative descriptors of MSFDsuch as eutrophication (Descriptor 5), habitat separation, distur-bances to sea floor (Descriptor 6), invasive species (Descriptor 2),and contaminants (Descriptor 8) cause negative impacts on fishpopulations. Moreover, global climatic changes have impacts onfish stocks (Brander, 2010; Arnason, 2012) affecting SSB and land-ings. Importantly, most of these pressures are being considered asqualitative descriptors of MSFD which will be helpful to improveenvironmental health.
Harvest Rate (HR) is considered as one of the best indicatorsassessing status of SSB of fish stocks (Probst and Oesterwind, 2014).Piet et al. (2010) mentioned that HR is suitable for commercialcatches (landings) too. Most of the fish stocks in the present
Please cite this article in press as: Jayasinghe, R.P.P.K., et al., Evaluation ofmean trophic levels of fish landings and spawning stock biomass,j.ocecoaman.2016.07.002
analysis had lower HR after 2008 than before, indicating thatmanagement strategies implemented by ICES such as TACs, con-trolling fishing effort etc. have resulted in positive signs forrebuilding the fish stocks. However, some fish stocks are beingharvested with HR of greater than unity, indicating that immatureindividuals are present in the landings. Even though someHR of fishstocks in some areas (like subareas VIII and IX) had improved after2008, the MTL of landings and SSB still recorded low. Therefore,further improvement of fish stocks status is still needed. From thepresent analysis, it is possible to postulate that MTLs in SSB andlandings are also useful to be considered for implementing newmanagement strategies. This is of particular importance becausethere are difficulties in assigning reference levels for indicators likeHR (Piet et al., 2010). Nevertheless, Rosenberg (1995) suggested that0.20 of fishing rate of current level is appropriate to avoid decliningof fisheries aftermaximumharvest. Cardinale et al. (2013) have alsogiven some suggestions and strategies to improve fish stocks inEurope, such as creating large marine reserves, specific fishing gearregulations, integrated maritime management, balanced harvest-ing and banning discards, etc.
Pauly and Palomares (2005) have shown that “fishing downmarine food webs” is a widespread trend in many fisheries of theworld, and European marine areas are no exception. This trend hasbeen shown to take place in Portuguese seas (Baeta et al., 2009);Icelandic waters (Valtysson and Pauly, 2003); Spain (S�anchez andOlaso, 2004) and the UK (Molfese et al., 2014). Prior to 2008, fish-ing pressure was high on higher trophic level species in somesubareas of FAO Area 27, which resulted in the dominance of lowtrophic level species. The North Sea (sub area IV), where excessivefishing has occurred in the past (Emeis et al., 2015), is an example inthis study.
status of commercial fish stocks in European marine subareas usingOcean & Coastal Management (2016), http://dx.doi.org/10.1016/
R.P.P.K. Jayasinghe et al. / Ocean & Coastal Management xxx (2016) 1e10 9
The study was mainly based on MTL in fishes to understand thestatus and the trends of fish stocks in the European marine sub-areas. MTL has been widely used as an indicator of fisheries sus-tainability (Branch et al., 2010; Fey-Hofstede and Meesters, 2007;Pauly et al., 1998) and biodiversity status (Foley, 2013; Pauly andWatson, 2005). In addition, MTL-based indicators are widely usedto assess various marine environments (Baeta et al., 2009;Jayasinghe et al., 2015). These indicators are listed as one of theindicators in European Environmental Agency-EEA (Foley, 2013)and other regional marine assessments (HELCOM, OSPAR). EEAdemonstrated that MTL (or Mean Trophic Index) as an inexpensive,simple and clear demonstration of environmental status that maybe applied in all European seas (EEA, 2010). Even thoughMTL is notlisted as an indicator in MSFD (EU, 2010), EEA suggested that MTLwould be an appropriate indicator to be used with the imple-mentation of MSFD (EEA, 2010). In fisheries research, most of theprevious studies used the landings data alone for MTL-basedstudies. Shannon et al. (2014) and Gascuel et al. (2014) have shownthe importance of MTL-based studies combining with other vari-ables and approaches together with landings. Our analysis alsoshowed possibility of using MTL of both SSB and landings to assessthe status of the marine fisheries. Furthermore, the presentapproach is more realistic because it covers combined informationof several commercially important fish species than the conven-tional fisheries assessments which deal with “single speciescontext” in fisheries management.
5. Conclusions
In the Introduction we posed two research questions that wereaddressed in this study.
(i) Is there a change in fishing pressure over trophic levels in thecontext of the implementation of the policy instruments?
Fishing pressure towards high trophic level species seems to bedecreasing in subareas I þ II and V. This is apparent from therecoding of higher values ofMTL in landings and higherMTL valuesin SSB thanMTL in landings after 2008. On the other hand, subareasVIII þ IX had higher MTL in landings, but lower MTL in SSB than inlandings after 2008. It seems this area is being highly overfished.Low values of MTLs subareas III, IV and VII could be considered asoverfished stocks in these subareas.
(ii) Are fish stocks showing signs of recovery since 2008?
The fishing subareas were categorized according to the MTL inlandings and SSB of the fish stocks after 2008. This study showedthe importance of considering MTL of both landings and SSB whileevaluating environment and fish stocks. Most of the fish stockshave increased SSB and harvest rate decreased since 2008 showingprevious management plans were working on fisheries. Fish stocksappear to be recovering since 2008 in subarea VI. This is supportedby values of high MTL values in SSB than in landings after 2008.However, no recovery is apparent in subareas III, IV and VII wherelow MTL in landings and lower MTL in SSB than in landings after2008 were reported. We identified some marine subareas werehaving low MTLs in landings, SSB and some fish stocks higher HR.
Contribution to fisheries and marine management
Both CFP and MSFD have provisions to work for improvingenvironmental status of seas in order to achieve healthy fish stocks.The study demonstrates that Ecosystem BasedManagement shouldincorporate mean trophic levels of fish landings and spawning
Please cite this article in press as: Jayasinghe, R.P.P.K., et al., Evaluation ofmean trophic levels of fish landings and spawning stock biomass,j.ocecoaman.2016.07.002
stock biomass in the assessment of commercial species of fish.Further, using this approach continuous evaluation of major fishpopulations can be carried out in a robust way, with SSB andlandings data. A future evaluation (2021) using our approachshould show whether the implementation of CFP and MDFDimproved the populations of commercial species of fish. This will bea good indication that these policy instruments whether they aredelivering the desired results towards improving the status ofcommercially important fish populations. The starkness of theapproach presented in this study is therefore of importance forevaluating fish stocks based on longer time series data before andafter implementation of a nowel approach as presented in thisstudy.
Acknowledgements
R.P.P.K. Jayasinghe thanks the Erasmus Mundus Joint Doctoratein Marine and Coastal Management (MACOMA) for support. Thework of Alice Newton was supported by the EC 7FP grant agree-ment 308392 (DEVOTES) (http://www.devotes-project.eu/). M.Cardinale (Swedish University of Agricultural Sciences) providedinformation on ICES data reports. We also wish to thankMr. R.P.K.C.Rajapakse, Department of Zoology and Environmental Manage-ment, University of Kelaniya, Sri Lanka for his technical support inpreparing figures.
Appendix A. Supplementary data
Supplementary data related to this article can be found at http://dx.doi.org/10.1016/j.ocecoaman.2016.07.002.
References
Aanesen, M., Armstrong, C.W., Hoof, L.V., 2012. The changing environment offisheries policy in Europe. Mar. Policy 36, 1172e1177. http://dx.doi.org/10.1016/j.marpol.2012.02.002.
Arnason, R., 2012. Global warming: new challenges for the common fisheries pol-icy? Ocean Coast. Manag. 70, 4e9. http://dx.doi.org/10.1016/j.ocecoaman.2012.04.003.
Baeta, F., Costa, M.J., Cabral, H., 2009. Changes in the trophic level of Portugueselandings and fish market price variation in the last decades. Fish. Res. 97,216e222. http://dx.doi.org/10.1016/j.fishres.2009.02.006.
Borja, A., Elliott, M., Carstensen, J., Heiskanen, A.-S., van de Bund, W., 2010. Marinemanagement- towards an integrated implementation of the European marineStrategy Framework and water Framework directives. Mar. Pollut. Bull. 60,2175e2186. http://dx.doi.org/10.1016/j.marpolbul.2010.09.026.
Branch, T.A., Watson, R., Fulton, E.A., Jennings, S., McGilliard, C.R., Pablico, T.,Ricard, D., Tracey, S.R., 2010. The trophic fingerprint of marine fishes. Nature468, 431e435. http://dx.doi.org/10.1038/nature09528.
Brander, 2010. Impacts of climate change on fisheries. J. Mar. Syst. 79, 389e402.http://dx.doi.org/10.1016/j.jmarsys.2008.12.015.
Brodziak, J., Link, J., 2002. Ecosystem-based fishery management: what is it andhow can we do it? Bull. Mar. Sci. 70, 589e611.
Browman, H.I., Stergiou, K.I. (Eds.), 2004. Perspectives on Ecosystem-based Ap-proaches to the Management of Marine Resources. Marine Ecology ProgressSeries, 274, pp. 269e303.
Cardinale, M., D€orner, H., Abella, A., Andersen, J.L., Casey, J., D€oring, R.,Kirkegaard, E., Motova, A., Anderson, J., Simmonds, E.J., Stransky, C., 2013.Rebuilding EU fish stocks and fisheries, a process under way? Mar. Policy 39 (0),43e52. http://dx.doi.org/10.1016/j.marpol.2012.10.002.
Christensen, V., Gu�enette, S., Heymans, J.J., Walters, C.J., Watson, R., Zeller, D.,Pauly, D., 2003. Hundred-year decline of North Atlantic predatory fishes. FishFish. 4, 1e24.
EEA, 2010. European Environmental Agency. Marine Trophic Index of EuropeanSeas. SEBI, Copenhagen, Denmark, 012.
EEA, 2015. State of Europe’s Seas. EEA Report No. 2/2015. ISSN 1977-8449. EuropeanEnvironmental Agency, p. 220.
Emeis, K.-C., Beusekom, J., van Callie, U., Ebinghaus, R., Kannen, A., Kraus, G.,Kr€oncke, I., Lenhart, H., Lorkowsk, I., Matthias, V., M€ollmann, C., P€atsch, J.,Scharfe, M., Thomas, H., Weisse, R., Zorita, E., 2015. The North sea d a shelf seain the anthropocene. J. Mar. Syst. 141, 18e33. http://dx.doi.org/10.1016/j.jmarsys.2014.03.012.
EU, Marine Strategy Framework Directive (2008/56/EC) of the European Parliamentand the Council, 17th June 2008
EU, Commission Decision on Criteria and Methodological Standards on Good
status of commercial fish stocks in European marine subareas usingOcean & Coastal Management (2016), http://dx.doi.org/10.1016/
R.P.P.K. Jayasinghe et al. / Ocean & Coastal Management xxx (2016) 1e1010
Environmental Status of Marine Waters (2010/477/EU), 01st September 2010EU, 2013. Regulation (EU) No 1380/2013 of the European Parliament and of the
Council of 11 December 2013 on the Common Fisheries Policy. AmendingCouncil Regulations (EC) No 1954/2003 and (EC) No 1224/2009 and RepealingCouncil Regulations (EC) No 2371/2002 and (EC) No 639/2004 and CouncilDecision 2004/585/EC Official Journal of the European Union, Brussels.
Fey-Hofstede, F.E., Meesters, H.W.G., 2007. Indicators for the ‘Convention onBiodiversity 2010’ Exploration of the Usefulness of the Marine Trophic Index(MTI) as an Indicator for Sustainability of Marine Fisheries in the Dutch Part ofthe North Sea. Wekdocument 53.8, Wageningen.
Foden, J., Rogers, S.I., Jones, A.P., 2011. Human pressures on UK seabed habitats: acumulative impact assessment. Mar. Ecol. Prog. Ser. 428, 33e47. http://dx.doi.org/10.3354/meps09064.
Foley, C.M.R., 2013. Management implications of fishing up, down, or through themarine food web. Mar. Policy 37, 176e182. http://dx.doi.org/10.1016/j.marpol.2012.04.016.
Froese, R., Pauly, D., 2014. FishBase. World Wide Web electronic publication version(08/2014). www.fishbase.org.
Froese, R., Proelß, A., 2010. Rebuilding fish stocks no later than 2015: will Europemeet the deadline? Fish Fish. 11, 194e202. http://dx.doi.org/10.1111/j.1467-2979.2009.00349.x.
Garcia, S.M., Zerbi, A., Aliaume, C., Do Chi, T., Lasserre, G., 2003. The EcosystemApproach to Fisheries. Issues, Terminology, Principles, Institutional Founda-tions, Implementation and Outlook. FAO, Rome. FAO Fisheries Technical Paper.No. 443.
Gascuel, D., Bez, N., Forest, A., Guillotreau, P., Lalo€e, F., Lobry, J., Mah�evas, S.,Mesnil, B., Rivot, E., Rochette, S., Trenkel, V., 2011. A future for marine fisheriesin Europe (manifesto of the association Françaised’Halieum�etrie). Fish. Res. 109,1e6. http://dx.doi.org/10.1016/j.fishres.2011.02.002.
Gascuel, D., Coll, M., Fox, C., Gu�enette, S., Guitton, J., Kenny, A., Knittweis, L.,Nielsen, J.R., Piet, G., Raid, T., Travers-Trolet, M., Shephard, S., 2014. Fishingimpact and environmental status in European seas: a diagnosis from stockassessments and ecosystem indicators. Fish Fish. 17, 31e55. http://dx.doi.org/10.1111/faf.120.90.
Gu�enette, S., Gascuel, 2012. Shifting baselines in European fisheries: the case of theceltic sea and Bay of Biscay. Ocean Coast. Manag. 70, 10e21. http://dx.doi.org/10.1016/j.ocecoaman.2012.06.010.
HELCOM, 2009. Eutrophication in the Baltic Sea e an integrated assessment of theeffects of nutrient enrichment in the Baltic Sea region. Balt. Sea Environ. Proc.115B.
Jayasinghe, R.P.P.K., Amarasinghe, U.S., Newton, A., 2015. Evaluation of marinesubareas of Europe using life history parameters and trophic levels of selectedfish populations. Mar. Environ. Res. 112, 81e90. http://dx.doi.org/10.1016/j.marenvres.2015.08.002.
Long, R., 2011. The Marine Strategy Framework Directive: a new European approachto the regulation of the marine environment, marine natural resources andmarine ecological services. J. Energy Nat. Resour. Law 29 (1), 1e44. http://dx.doi.org/10.1080/02646811.2011.11435256.
Molfese, C., Beare, D., Hall-Spencer, J.M., 2014. Overfishing and the replacement ofdemersal finfish by shellfish: an Example from the English Channel. PLoS One 9(7), e101506. http://dx.doi.org/10.1371/journal.pone.0101506.
Pastoors, M.A., 2014. Exponential growth in the number of words used for theEuropean Common Fisheries Policy (CF P): does better management requiremore text? Mar. Policy 46, 101e104. http://dx.doi.org/10.1016/
Please cite this article in press as: Jayasinghe, R.P.P.K., et al., Evaluation ofmean trophic levels of fish landings and spawning stock biomass,j.ocecoaman.2016.07.002
j.marpol.2014.01.008.Pauly, D., Palomares, M.L., 2005. Fishing down marine food web: it is far more
pervasive than we thought. Bull. Mar. Sci. 76 (2), 197e211.Pauly, D., Watson, R., 2005. Background and interpretation of the ‘marine trophic
Index’ as a measure of biodiversity. Phil. Trans. R. Soc. B Biol. Sci. 360, 415e423.http://dx.doi.org/10.1098/rstb.2004.1597.
Pauly, D., Christensen, V., Dalsgaard, J., Froese, R., Torres Jr., F.C., 1998. Fishing downmarine food webs. Science 279, 860e863. http://dx.doi.org/10.1126/science.279.5352.860.
Pauly, D., Christensen, V., Gu�enette, S., Pitcher, T.J., Sumaila, U.R., Walters, C.J.,Watson, R., Zeller, D., 2002. Towards sustainability in world fisheries. Nature418, 689e695. http://dx.doi.org/10.1038/n ature01017.
Piet, G.J., Albella, A.J., Aro, E., Farrugio, H., Lleonart, J., Lordan, C., Mesnil, B.,Petrakis, G., Pusch, C., Radu, G., Ratz, H.J., 2010. Marine Strategy FrameworkDirective e Task Group 3 Report. Commercially Exploited Fish and Shellfish.EUR 24316 EN e Joint Research Centre. Office for Official Publications of theEuropean Communities, Luxembourg, p. 82.
Pitcher, T.J., Hart, P.J.B., Pauly, D., 2001. Reinventing Fisheries Management. KluwerAcademic Publishers, Dordrecht/Boston/London.
Prellezo, R., Curtin, R., 2015. Confronting the implementation of marine ecosystem-based management within the Common Fisheries Policy reform. Ocean Coast.Manag. 117, 43e51. http://dx.doi.org/10.1016/j.ocecoaman.2015.03.005.
Probst, W.N., Oesterwind, D., 2014. How good are alternative indicators forspawning-stock biomass (SSB) and fishing mortality (F)? ICES J. Mar. Sci. http://dx.doi.org/10.1093/icesjms/fst207.
Rombouts, I., Beaugrand, G., Fizzala, X., Gaill, F., Greenstreet, S.P.R., Lamare, S., LeLoc’h, F., McQuatters-Gollop, A., Mialet, B., Niquil, N., Percelay, J., Renaud, F.,Rossberg, A.G., F�eral, J.P., 2013. Food web indicators under the marine StrategyFramework directive: from complexity to simplicity? Ecol. Indic. 29, 246e254.http://dx.doi.org/10.1016/j.ecolind.2012.12.021.
Rosenberg, A.A., 1995e1996. Precautionary Management Reference Points andManagement Strategies. In Precautionary Approach to Fisheries. Part 2: Scien-tific Papers. Prepared for the Technical Consultation on the PrecautionaryApproach to Capture Fisheries (Including Species Introductions). Lysekil, Swe-den, 6e13 June 1995. FAO Fisheries Technical Paper. No. 350, Part 2. FAO, Rome,p. 210. Available online: http://www.fao.org/docrep/003/w1238e/W1238E00.htm#TOC.
S�anchez, F., Olaso, I., 2004. Effects of fisheries on the Cantabrian Sea shelfecosystem. Ecol. Model. 172, 151e174. http://dx.doi.org/10.1016/j.ecolmodel.2003.09.005.
Shannon, L., Coll, M., Bundy, A., Gascuel, D., Heymans, J.J., Kleisner, K., Lynam, C.P.,Piroddi, C., Tam, J., Travers-Trolet, M., Shin, Y., 2014. Trophic level-based in-dicators to track fishing impacts across marine ecosystems. Mar. Ecol. Prog. Ser.512, 115e140. http://dx.doi.org/10.3354/meps10821.
Valtysson, H., Pauly, D., 2003. Fishing down food web: an Icelandic case study. InCompetitiveness within the global fisheries. In: Guomundsson, E., Villasante, S.(Eds.), Proceedings of a Conference Held in Akureyri, Iceland. April 6-7 2000.University of Akureyri, Akureyri, Iceland, pp. 12e24. Available online: http://www.seaaroundus.org/researcher/dpauly/PDF/2003/Books&Chapters/FishingDownTheFoodWebIcelandicCaseStudy.pdf.
Villasante, S., 2010. Global assessment of the European Union fishing fleet: an up-date. Mar. Policy 34 (3), 663e670. http://dx.doi.org/10.1016/j.marpol.2009.12.007.
status of commercial fish stocks in European marine subareas usingOcean & Coastal Management (2016), http://dx.doi.org/10.1016/