Embed Size (px)
Citation preview
BGD10, 3849–3889, 2013
Ocean Colourremote sensing in theSouthern Laptev Sea
B. Heim et al.
Title Page
Abstract Introduction
Conclusions References
Tables Figures
J I
J I
Back Close
Full Screen / Esc
Printer-friendly Version
Interactive Discussion
Discussion
Paper
|D
iscussionP
aper|
Discussion
Paper
|D
iscussionP
aper|
Biogeosciences Discuss., 10, 3849–3889, 2013www.biogeosciences-discuss.net/10/3849/2013/doi:10.5194/bgd-10-3849-2013© Author(s) 2013. CC Attribution 3.0 License.
EGU Journal Logos (RGB)
Advances in Geosciences
Open A
ccess
Natural Hazards and Earth System
Sciences
Open A
ccess
Annales Geophysicae
Open A
ccess
Nonlinear Processes in Geophysics
Open A
ccess
Atmospheric Chemistry
and Physics
Open A
ccess
Atmospheric Chemistry
and Physics
Open A
ccess
Discussions
Atmospheric Measurement
Techniques
Open A
ccess
Atmospheric Measurement
Techniques
Open A
ccess
Discussions
Biogeosciences
Open A
ccess
Open A
ccess
BiogeosciencesDiscussions
Climate of the Past
Open A
ccess
Open A
ccess
Climate of the Past
Discussions
Earth System Dynamics
Open A
ccess
Open A
ccess
Earth System Dynamics
Discussions
GeoscientificInstrumentation
Methods andData Systems
Open A
ccess
GeoscientificInstrumentation
Methods andData Systems
Open A
ccess
Discussions
GeoscientificModel Development
Open A
ccess
Open A
ccess
GeoscientificModel Development
Discussions
Hydrology and Earth System
Sciences
Open A
ccess
Hydrology and Earth System
Sciences
Open A
ccess
Discussions
Ocean ScienceO
pen Access
Open A
ccess
Ocean ScienceDiscussions
Solid Earth
Open A
ccess
Open A
ccess
Solid EarthDiscussions
The Cryosphere
Open A
ccess
Open A
ccess
The CryosphereDiscussions
Natural Hazards and Earth System
Sciences
Open A
ccess
Discussions
This discussion paper is/has been under review for the journal Biogeosciences (BG).Please refer to the corresponding final paper in BG if available.
Ocean Colour remote sensing in theSouthern Laptev Sea: evaluation andapplicationsB. Heim1, E. Abramova5,6, R. Doerffer2, F. Gunther1, J. Holemann1,6, A. Kraberg1,H. Lantuit1, A. Loginova3,4,6, F. Martynov4,6, P. P. Overduin1, and C. Wegner3
1Alfred-Wegener-Institut Helmholtz-Zentrum fur Polar- und Meeresforschung, Germany2Helmholtz Centre Geesthacht HZG, Institute for Coastal Research, Geesthacht, Germany3GEOMAR Helmholtz Centre for Ocean Research, Kiel, Germany4St. Petersburg University, St. Petersburg, Russia5Lena Tiksi Reservate, Russia6Otto Schmidt Laboratory OSL, St. Petersburg, Russia
Received: 21 December 2012 – Accepted: 21 January 2013 – Published: 28 February 2013
Correspondence to: B. Heim ([email protected])
Published by Copernicus Publications on behalf of the European Geosciences Union.
3849
BGD10, 3849–3889, 2013
Ocean Colourremote sensing in theSouthern Laptev Sea
B. Heim et al.
Title Page
Abstract Introduction
Conclusions References
Tables Figures
J I
J I
Back Close
Full Screen / Esc
Printer-friendly Version
Interactive Discussion
Discussion
Paper
|D
iscussionP
aper|
Discussion
Paper
|D
iscussionP
aper|
Abstract
Enhanced permafrost warming and increased arctic river discharges have heightenedconcern about the input of terrigeneous matter into Arctic coastal waters. We used op-tical operational satellite data from the Ocean Colour sensor MERIS onboard the EN-VISAT satellite mission for synoptic monitoring of the pathways of terrigeneous matter5
in the southern Laptev Sea. MERIS satellite data from 2006 on to 2011 were processedusing the Case2Regional Processor, C2R, installed in the open-source software ESABEAM-VISAT.
Since optical remote sensing using Ocean Colour satellite data has seen little appli-cation in Siberian Arctic coastal and shelf waters, we assess the applicability of the10
calculated MERIS parameters with surface water sampling data from the Russian-German ship expeditions LENA2010 and TRANSDRIFT-XVII taking place in Augustand September 2010 in the southern Laptev Sea. The surface waters of the southernLaptev Sea are characterized by low transparencies, due to turbid river water input, ter-restrial input by coastal erosion, resuspension events and, therefore, high background15
concentrations of Suspended Particulate Matter, SPM, and coloured Dissolved OrganicMatter, cDOM.
The mapped calculated optical water parameters, such as the first attenuation depth,Z90, the attenuation coefficient, k, and Suspended Particulate Matter, SPM, visualizeresuspension events that occur in shallow coastal and shelf waters indicating verti-20
cal mixing events. The mapped optical water parameters also visualize that the hy-drography of the Laptev Sea is dominated by frontal meanders with amplitudes up to30 km and eddies and filaments with diameters up to 100 km that prevail throughout theice-free season. The meander crests, filaments and eddy-like structures that becomevisible through the mapped MERIS C2R parameters indicate enhanced vertical and25
horizontal transport energy for the transport of terrigenous and living biological matterin the surface waters during the ice-free season.
3850
BGD10, 3849–3889, 2013
Ocean Colourremote sensing in theSouthern Laptev Sea
B. Heim et al.
Title Page
Abstract Introduction
Conclusions References
Tables Figures
J I
J I
Back Close
Full Screen / Esc
Printer-friendly Version
Interactive Discussion
Discussion
Paper
|D
iscussionP
aper|
Discussion
Paper
|D
iscussionP
aper|
1 Introduction
The aim of this study is to apply Ocean Colour remote sensing to gather informa-tion on the hydrodynamics in the Laptev Sea, Siberian Arctic. Ocean Colour remotesensing uses optical satellite data from Ocean Colour satellite missions and appliesOcean Colour algorithms for Case-1 and Case-2 surface waters: useful operational5
Ocean Colour remote sensing products are optical parameters such as attenuationand absorption, and optically visible water constituents, such as chlorophyll (Chl a),Suspended Particulate Matter (SPM), and coloured Dissolved Organic Matter (cDOM).The 3rd report (2000) of the International Ocean Colour Coordinating Group (IOCCG,http://www.ioccg.org/) described the phenomenon of optically complex surface waters10
(coastal waters, fluvial and limnic systems) designating such surface waters as Case-2waters in contrast to Case-1 waters dominated optically by phytoplankton with coupledorganic and particulate matter concentrations from autochthonous production. In gen-eral, in Case-2 surface waters the phytoplankton does not vary proportionally with otheroptically visible constituents, because cDOM and particles originate from allochthonous15
sources (Morel and Prieur, 1977; Lee and Hu, 2006). The Ocean Colour processinglinked to Case-2 waters requires sophisticated atmospheric correction schemes dueto non-zero upwelling radiances in the NIR wavelength region and sophisticated bio-optical algorithms to account for cDOM and particulates in particular.
Optical remote sensing applications in polar regions are also limited by the prevail-20
ing low solar elevations, and the persistence of clouds and fog (International OceanColour Coordinating Group (IOCCG), http://www.ioccg.org/). Since 2010, the COAST-Colour project (http://www.coastcolour.org/) of the European space Agency, ESA, hasincorporated the Kara Sea and Laptev Sea regions into its program for evaluating theapplicability of Ocean Colour remote sensing in Arctic coastal waters. For the Laptev25
Sea, the Ocean Colour remote sensing analyses are carried out within the frameworkof this study and Orek et al. (2013).
3851
BGD10, 3849–3889, 2013
Ocean Colourremote sensing in theSouthern Laptev Sea
B. Heim et al.
Title Page
Abstract Introduction
Conclusions References
Tables Figures
J I
J I
Back Close
Full Screen / Esc
Printer-friendly Version
Interactive Discussion
Discussion
Paper
|D
iscussionP
aper|
Discussion
Paper
|D
iscussionP
aper|
Within this study, the optical remote sensing parameters were calculated from opticalMedium Resolution Imaging Spectrometer (MERIS) data. MERIS is the Ocean Coloursensor on board the ENVIronment SATellite (ENVISAT), an ESA satellite mission thatcould operate until early 2012. We used the Regional Case2 (C2R) Processor Module(developed by Doerffer and Schiller, 2007, 2008), Brockmann Consult (DE), in coop-5
eration with the Norwegian Institute for Water Research and the Canadian Instituteof Ocean Sciences) installed in the open source software BEAM-VISAT (BrockmannConsult) provided by ESA. C2R processes the MERIS Top-Of-Atmosphere (TOA) radi-ances to water leaving reflectances, and calculated optical coefficients and concentra-tions of optically visible water constituents (Chl a, SPM, cDOM).10
We evaluated the applicability of the optical parameters calculated from the MERISsatellite data by investigating the ranges of concentrations of optically visible parame-ters from field-based sampling and by comparing the field-based data with the remotesensing-derived data. Field-based useful parameters are turbidity, transmissivity, SPM,cDOM, and phytoplankton via its optical proxy Chl a.15
Since ship-based sampling is logistically constrained in spatial and temporal cov-erage, optical satellite data provide additional data in space and time, visualising thehydrodynamical spatial structures. By examining the spatial pattern of Ocean Colourparameters, we hope to gain insights from optically visible events towards informationon surface water processes in the sea ice-free season.20
2 Hydrography of the Laptev Sea
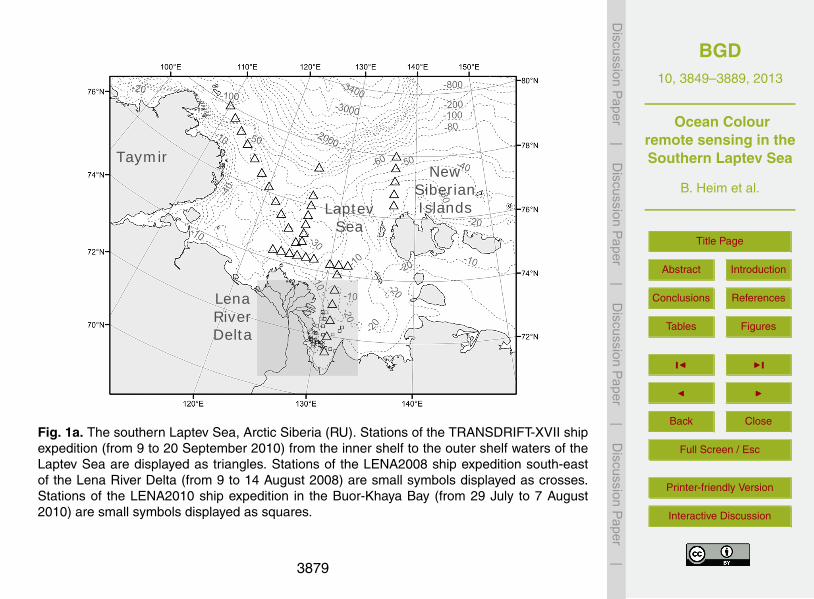
The Laptev Sea is an open marginal sea of the Arctic Ocean bounded by the TaimyrPeninsula on the west and the New Siberian Islands on the east (Fig. 1a). Togetherwith the Eastern Siberian shelf the Laptev Sea region is part of the world’s broadestshelf system. Atmospheric forcing, sea ice dynamics, freshwater river input and terres-25
trial fluxes from the coastal zone strongly influence the shallow shelf waters and theirbiogeochemistry. Sea-ice processes affect the early freshwater runoff, the erosion of
3852
BGD10, 3849–3889, 2013
Ocean Colourremote sensing in theSouthern Laptev Sea
B. Heim et al.
Title Page
Abstract Introduction
Conclusions References
Tables Figures
J I
J I
Back Close
Full Screen / Esc
Printer-friendly Version
Interactive Discussion
Discussion
Paper
|D
iscussionP
aper|
Discussion
Paper
|D
iscussionP
aper|
coastal cliffs and the erosion of shallow submarine tectonic horsts and islands. Sed-iments scraped up from shallows and suspended particulate matter from the watercolumn are incorporated and transported via the sea ice (Aagaard and Armack, 1989;Eicken et al., 1997; Wegner et al., 2005).
The Siberian river systems deliver large volumes of freshwater and dissolved and5
particulate matter into the Arctic Siberian Shelf system (Gordeev et al., 1996; Racholdet al., 2000; Lobbes et al., 2000). The Lena River is the second largest Arctic river anddischarges 581 km3 freshwater annually (Holmes et al., 2012), delivering an averageannual sediment input of 20.7 Mtyr−1 (Rachold et al., 2004). Most of the water is dis-charged during end of May and beginning of June when the ice in the rivers breaks up10
but the Laptev Sea is still covered by sea-ice (Holmes et al., 2012). The Lena RiverDelta is the largest Arctic delta and undergoes considerable block uplift that controlsthe delta’s topography and drainage system (Fig. 1b). The main modern Lena riverbranches enter the Buor Khaya Gulf through the northern and eastern part of the LenaRiver Delta: the Sardakhsko-Trofimovskaya channel systems with 60–75 % of the Lena15
River water discharge, and the Bykovskaya channel up to 25 % of water discharge(Charkin et al., 2011). The Olenyeksky and Tumatskaya branches with up to 10 % ofwater discharge flow westwards, emptying southwards of the western Lena River Deltainto the Laptev Sea (in Charkin et al., 2011). Elevated Pleistocene terraces without anactive drainage system build up the north-western part of the Lena River Delta.20
Large parts of the Central and Eastern Siberian coastline are characterized by thehighly erosive sedimentary ice-rich Yedoma (Ice-Complex) (Lantuit et al., 2011, 2012).The Ice Complex is a pleistocene stratigraphic unit composed of very ice-rich (usu-ally > 80 % by volume) organic-rich deposits (Schirrmeister et al., 2002). The deliveryof terrestrial and dissolved organic material from this permafrost coastal zone con-25
siderably contributes to the carbon pool in Arctic coastal waters (e.g. Charkin et al.,2011; Vonk et al., 2011, 2012; Rachold et al., 2004). Karlsson et al. (2011), Sanchez-Garcıa et al. (2011) and Vonk et al. (2012) discuss the input of terrigeneous ParticulateOrganic Matter (POC) with old POC originating from Yedoma, the younger to modern
3853
BGD10, 3849–3889, 2013
Ocean Colourremote sensing in theSouthern Laptev Sea
B. Heim et al.
Title Page
Abstract Introduction
Conclusions References
Tables Figures
J I
J I
Back Close
Full Screen / Esc
Printer-friendly Version
Interactive Discussion
Discussion
Paper
|D
iscussionP
aper|
Discussion
Paper
|D
iscussionP
aper|
POC originating from the fluvial discharges. Terrestrial markers such as lignin, andother markers are present over the Siberian shelf area (Vonk et al., 2012; Gustavsonet al., 2011; Lobbes et al., 2000) proving a large-scale spatial distribution of terrestrialmatter.
All described processes deliver large volumes of organic-rich terrestrial matter in5
particulate and dissolved form into the Laptev Sea shelf system.
3 Material and methods
3.1 Surface water sampling and analyses
In August 2008, the Russian–German ship expedition LENA08 sampled water alongthe coast of the Bykovsky Peninsula Ice Complex in the western Buor Khaya Bay10
(Fig. 1a, b) (Wagner et al., 2012). In summer 2010, from 29 July to 8 August 2010, theRussian–German LENA10 ship expedition sampled in the Buor Khaya Bay (Figs. 1a, b,2 and Appendix I, Table 1a). The Russian–German ship expedition TRANSDRIFT-XVIItook place in September 2010 from 9 to 20 September 2010 (Kassens et al., 2010)(Figs. 1a, 3 and Appendix I, Table 1b).15
On the LENA2010 and the TRANSDRIFT-XVII expeditions hydrographical investi-gations were carried out with Conductivity, Temperature, Depth meter (CTD) sensorcasts with a Sea and Sun Technology GmbH (USA) on the LENA2010 expedition, anda SeaBird Electronics (USA) SBE19+ connected to a carousel water sampler SBE32Con the TRANSDRIFT-XVII expedition. The CTD SBE19+ was equipped with additional20
sensors for measuring water turbidity (Seapoint OBS), dissolved oxygen concentrationand Chl a fluorescence (WETlabs WETstar, USA). A second CTD cast was operatedwith a WETstar CDOM sensor (WETlabs, USA). According to previous work the WET-labs in-situ Chl a fluorescence (mgm−3) shows an overestimation of a factor of 3.5compared to in-situ Chl a by direct sampling and is accordingly corrected by this factor.25
3854
BGD10, 3849–3889, 2013
Ocean Colourremote sensing in theSouthern Laptev Sea
B. Heim et al.
Title Page
Abstract Introduction
Conclusions References
Tables Figures
J I
J I
Back Close
Full Screen / Esc
Printer-friendly Version
Interactive Discussion
Discussion
Paper
|D
iscussionP
aper|
Discussion
Paper
|D
iscussionP
aper|
The water samples were filtered and prepared at site. 0.5 L was filtered for SPMthrough 0.45 µm pore size MILLIPORE Durapore membrane filters, for Chl a through0.7 µm pore size Whatman GF filters with a pressure of not more than 0.2 bar. Onelitre was filtered through 0.45 µm-pore size preweighed cellulose-acetate (CA) filtersfor SPM and through 0.7 µm-pore size glass-fibre (GF) filters for DOC and cDOM. The5
Chl a filters were immediately frozen on site. cDOM filtrates were stored in brown quartzglass bottles and kept cooled and in the dark.
cDOM was measured immediately following each expedition at the Russian–GermanOtto-Schmidt Laboratory (OSL) in St. Petersburg using a Specord200 (Jena Analytik).Optical Density (OD) spectra of the filtrates were measured from 300 nm to 750 nm in10
1 nm steps using 5 cm and 10 cm cuvettes, according to the absorption capacity of thesamples (Scott et al., 2000). Absorption per m was calculated using 2.303×OD/0.1 forthe 10 cm-cuvette, and 2.303×OD/0.05 for the 5 cm-cuvette, respectively. Chl a fromthe filters was measured at the OSL in St. Petersburg (RU) using a TD-700 fluorimeter.
3.2 Satellite data processing and analyses15
Ocean Colour remote sensing uses spectro-radiometrically highly-performing opticalsatellite sensors (http://www.ioccg.org/). The two Moderate Resolution Imaging Spec-troradiometer (MODIS) missions on the platforms TERRA and AQUA are currently op-erating Ocean Colour missions (http://modis.gsfc.nasa.gov/). MERIS was operated onESA’s ENVISAT from 2002 to early 2012 as a wide field-of-view imaging spectrometer20
with a swath width of 1150 km. MERIS measured the solar radiation reflected by theEarth’s surface in the visible (VIS) and near infrared (NIR) wavelength ranges in fifteenspectral bands from 390 nm to 1040 nm.
MERIS Reduced Resolution (RR) is approximately 1 km at nadir (1040m×1200mpixel) and available with a global daily coverage until 2012. We found for the time25
window of the sea-ice free season from 2006 to 2011 in the months of July, August,September between five and fifteen MERIS acquisitions per year that show relativelylarge cloud-free areas of the Laptev Sea region. MERIS-RR Level 1B TOA radiances
3855
BGD10, 3849–3889, 2013
Ocean Colourremote sensing in theSouthern Laptev Sea
B. Heim et al.
Title Page
Abstract Introduction
Conclusions References
Tables Figures
J I
J I
Back Close
Full Screen / Esc
Printer-friendly Version
Interactive Discussion
Discussion
Paper
|D
iscussionP
aper|
Discussion
Paper
|D
iscussionP
aper|
were processed using BEAM-VISAT4.9© with the MERIS Case-2 Regional Processorfor coastal application (C2R; Doerffer and Schiller, 2007, 2008). The C2R processingmodules use neural networks to inversely model water leaving reflectances of MERISspectral bands 1–8 from calculated TOA reflectances after ozone, water vapour andsurface pressure correction. Inverse modelling using neural networks is then used to5
derive aquatic parameters from the water leaving reflectances. The bio-optical forwardmodel is parameterized with spectro-radiometric coefficients specific to coastal Case-2waters (Doerffer and Schiller, 2007, 2008). The C2R processing modules are con-tinuously updated and optimized (http://www.brockmann-consult.de/cms/web/BEAM/software).10
C2R output parameters are estimated atmospheric and aquatic parameters, suchas the water-leaving radiances and reflectances, the attenuation, absorption andbackscattering coefficients, and calculated concentrations of Chl a (C2R Chl a), To-tal Suspended Matter, TSM (C2R TSM) equalling SPM, and gelbstoff absorption(C2R a gelbstoff) equalling cDOM. The three optical components calculated for the15
MERIS band 2 (central wavelength at 443 nm): absorption of phytoplankton pigments(C2R a pig); scattering of all particles b tsm, (C2R TSM); and absorption of dissolvedorganic material (C2R a gelbstoff) form the basis for calculating the concentrations.Chl a concentration is determined from an empirically derived relationship betweenabsorption (a pig) and Chl a concentration, and the dry weight of TSM from its em-20
pirically derived relationship with b tsm, equals the operational parameter SPM withmgL−1 a gelbstoff, absorption of gelbstoff at 442.5 nm equals cDOM absorption (Do-erffer and Schiller, 2007, 2008).
The properties of Beer’s Law describe that each dimensionless unit of optical depthcorresponds exponentially to a reduction of the intensity to e−1 or ∼ 37 % of its initial25
value. The vertical attenuation of sun light with depth can be described by the expo-nential equation, where the coefficient k is called the attenuation coefficient and ismeasured in m−1. C2R kmin, the diffuse coefficient of the minimum attenuation, is cal-culated within the Photosynthetically Active Radiation, PAR, wavelength region. All the
3856
BGD10, 3849–3889, 2013
Ocean Colourremote sensing in theSouthern Laptev Sea
B. Heim et al.
Title Page
Abstract Introduction
Conclusions References
Tables Figures
J I
J I
Back Close
Full Screen / Esc
Printer-friendly Version
Interactive Discussion
Discussion
Paper
|D
iscussionP
aper|
Discussion
Paper
|D
iscussionP
aper|
calculated remote sensing optical parameters and concentrations are representativefor the first attenuation depth that is equivalent to the water depth layer wherefrom90 % of the water leaving signal originates, Z90. It is the depth at which the surface lightfield reduces to e−1 or ∼ 37 % of its initial value. The C2R parameter of the first attenu-ation depth, C2R Z90, is calculated according to the two-flow model from Gordon and5
McCluney (1975) by:
Z90(λ) =2.3
2Kd(λ), m (1)
The euphotic depth, ZEu, down to which significant phytoplankton photosynthesis canoccur, is set to the depth where the incident surface light falls to 1 % of that just belowthe surface. ZEu is not a C2R-processed parameter but can be calculated from the10
remote sensing C2R kmin as:
ZEu(λ) =4.6K (λ)
, m (2)
For the Laptev Sea region, a problem is undetected thin cloud coverage and thin fogsthat cannot be detected within the automatic processing. These artefacts are visiblein the atmospherically processed Level-2 products as highly sharply-outlined features15
with under-and overestimated magnitudes of parameters. In the current state, these ar-eas are manually excluded according to their sharply-outlined features before matchingthem with field-based data. There is the choice of raising the cloud-detection thresholdlevel for the TOA radiances. However, coastal turbid waters would be excluded usinghigher thresholds for TOA radiances. Investigations are on-going to automatically cor-20
rect for thin cloud coverage and thin fog covers. The Figs. 2, 3, 8 and 9 display themapped C2R parameters with the background of the Google EarthTM land mosaicand the IBCAO bathymetry (©2010 Google, Image©2012 TerraMetrics, Image IBCAO)with the land and detected clouds transparently masked.
3857
BGD10, 3849–3889, 2013
Ocean Colourremote sensing in theSouthern Laptev Sea
B. Heim et al.
Title Page
Abstract Introduction
Conclusions References
Tables Figures
J I
J I
Back Close
Full Screen / Esc
Printer-friendly Version
Interactive Discussion
Discussion
Paper
|D
iscussionP
aper|
Discussion
Paper
|D
iscussionP
aper|
4 Results
4.1 Ranges of optically visible water parameters in the Southern Laptev Sea
The investigated near shore and offshore water types in the Buor Khaya Bay werecharacterized by low transparencies. Lena river waters had high turbidity, with in-situSecchi depths of less than 0.5 m. Onshore waters in the Buor Khaya Bay (up to 2 to5
∼ 5 m water depth) showed in-situ Secchi depth transparencies of 1 to 1.5 m in 2008,and measured transmissivity ranging from 60 to 75 % in 2010. Offshore waters (> 8 mwater depth) had in-situ Secchi depth transparencies of up to 2 m in 2008. In 2010, thesampling covered a much larger region that included also transparent surface waters.
Measured cDOM values in Lena river waters and in the surface waters of the Buor10
Khaya Bay of the LENA2008 and LENA2010 expeditions were of high magnitudes in2008 and 2010. Ranges for the absorption of cDOM at 443 nm, a443cDOM, were: LenaRiver, a443cDOM: 1.3–3.5 m−1; mixed onshore waters, a443cDOM: 2.5–4 m−1; offshorewaters (stratified waters, > 8 m water depth), a443cDOM: 2–3 m−1, coastal waters closeto meltwater outflows of the permafrost-coast showed considerable highest a443cDOM15
values: 3–7 m−1.The TRANSDRIFT-XVII samples also show elevated surface water cDOM concentra-
tions in onshore and offshore inner shelf waters. Because the spectro-photometricallymeasured cDOM covered more sampling stations, the data analyses presented in thispaper used the spectrophotometrical cDOM data. The spectrophotometrically mea-20
sured cDOM absorption correlated also well with the in-situ cDOM fluorescence (Qui-nine Sulphate Dihydrate units) measured with WETSTAR (R2 = 0.94), demonstratingthe instrument’s good performance in the waters of the Laptev Sea. The cDOM re-sults, both spectrometrically measured and by fluorescence, showed a nearly conser-vative mixing within a wide salinity range (0–32). The range of cDOM concentrations25
of the TRANSDRIFT-XVII transect going northwards through the Buor Khaya Bay werea443cDOM 2.2 m−1 and 1.5 m−1 for samples 1 to 3 and 5 to 6, respectively. More than
3858
BGD10, 3849–3889, 2013
Ocean Colourremote sensing in theSouthern Laptev Sea
B. Heim et al.
Title Page
Abstract Introduction
Conclusions References
Tables Figures
J I
J I
Back Close
Full Screen / Esc
Printer-friendly Version
Interactive Discussion
Discussion
Paper
|D
iscussionP
aper|
Discussion
Paper
|D
iscussionP
aper|
100 km north of the Lena River Delta along the east-west transect, high cDOM concen-trations of a443cDOM = 1.2 m−1 were still encountered (samples 8–17). The mid-shelfto outer-shelf transects had background concentrations of a443cDOM = 0.6 m−1. North-westward to the Taymir Peninsula a443cDOM was 0.4 m−1. A a443cDOM maximum of1.7 m−1 occurred north of the New Siberian Islands (sample 19).5
In summary, cDOM background concentrations were high, also in the surface waterlayer of the stratified off-shore waters and connected to the freshwater signal. ThecDOM concentration of the Lena River in August 2008, and August 2010 was of thesame magnitude as the cDOM concentrations of the coastal waters that surrounded theeastern Lena River Delta and the cDOM concentrations in Buor Khaya Bay in August10
2008, August 2010, and September 2010.On the mid- and outer shelf surface waters vary between 0.5 and 1 mgL−1.
TRANSDRIFT-XVII SPM ranges in 2010 showed concentrations from 1.5 to 2 mgL−1
in Buor Khaya Bay (samples 1–3) with peaks of SPM concentrations within the first 2m water layer of 5 to 6 mgL−1 further north (samples 4, 10, 16). Wegner et al. (2013)15
describe the spatial variability of surface SPM distribution on the Laptev Sea shelf be-tween years from multi-year TRANSDRIFT expedition data. Within the turbid surfacewater layer the SPM concentrations varied between 1 mgL−1 at the front between theriver-dominated and shelf waters and up to 18 mgL−1 near the Lena Delta.
Investigations on phytoplankton (filter and in-situ fluorescence-derived Chl a) of20
multi-year TRANSDRIFT expedition data report always medium Chl a concentrationsin surface waters from onshore to offshore waters. In 2010, the concentrations ofTRANSDRIFT-XVII Chl a were from 1.9 µgL−1 to 2.5 µgL−1 Chl a in the Buor KhayaBay (samples 1–3) and strongly connected to the freshwater signal. The thickness ofthe layer was about 12 m with a temperature of 7.8 ◦C and a salinity (Practical Salinity25
Unit, PSU) of 6 to 9. The east-west transect north of the Lena River Delta (samples8–17) showed transitional hydrological values with temperatures around 3 ◦C, an av-eraged salinity of 22.6 and about 1 µgL−1 Chl a at the stations. An exceptional highChl a concentration occurred at station 12 (128◦ E, 74.20◦ N) with a maximum value of
3859
BGD10, 3849–3889, 2013
Ocean Colourremote sensing in theSouthern Laptev Sea
B. Heim et al.
Title Page
Abstract Introduction
Conclusions References
Tables Figures
J I
J I
Back Close
Full Screen / Esc
Printer-friendly Version
Interactive Discussion
Discussion
Paper
|D
iscussionP
aper|
Discussion
Paper
|D
iscussionP
aper|
8 µgL−1. In deeper shelf waters Chl a concentrations of the surface layer varied around0.5 µgL−1 Chl a. An area of elevated Chl a concentrations in surface waters of the outershelf had concentrations of 1.5 to 2 µgL−1 Chl a (samples 30–34) in marine waters of32 salinity.
4.2 Evaluation of MERIS C2R parameters5
The MERIS acquisitions on 31 July, 3–6 August and 10 August 2010 show low cloudcoverage and are close in time to the LENA2010 ship expedition in Buor Khaya Baythat took place from 29 July to 7 August 2010. A MERIS acquisition on 7 September2010 is the cloud-free acquisition closest in time to the TRANSDRIFT-XVII expeditionthat took part from 9–20 September 2010. The next usable MERIS acquisitions on 1810
and 20 September 2010, have higher cloud coverage.The in-situ data taken for the evaluation of the MERIS C2R parameters are aver-
aged over the first 2 m water layer for transmissivity, cDOM, SPM and Chl a. CTDdata from the LENA2010 and the TRANSDRIFT-XVII expedition show a homogenous,mixed layer covering this depth: stratification due to the riverine freshwater occurred in15
the Buor Khaya Bay with a sharp halocline below 5 to 8 m in August 2010 during theLENA2010 expedition (Kraberg et al., 2013), and below 10 m in September 2010 dur-ing the Buor Khaya transect and the east-west transect north of the Lena River Deltaof TRANSDRIFT-XVII (Kassens et al., 2010).
Exact match-up analyses take the remote sensing value from the pixel location on20
the same day of the ship-based in-situ measurement. For the Laptev Sea region this isnot feasible due to frequent cloud coverage. Match-up analyses using spatial averagesof pixels could be a technical solution. However, for the Laptev Sea, the high-spatialand high-temporal horizontal heterogeneity confounds the spatially averaged match-up analyses. The analyses of matching pairs of cloud-free pixels and the LENA201025
expedition data cover a range of values of the optical parameters connected to turbiditywithin the Buor Khaya Bay, but no types of highly transparent waters. The matching of
3860
BGD10, 3849–3889, 2013
Ocean Colourremote sensing in theSouthern Laptev Sea
B. Heim et al.
Title Page
Abstract Introduction
Conclusions References
Tables Figures
J I
J I
Back Close
Full Screen / Esc
Printer-friendly Version
Interactive Discussion
Discussion
Paper
|D
iscussionP
aper|
Discussion
Paper
|D
iscussionP
aper|
pairs of cloud-free pixels and TRANSDRIFT-XVII expedition data cover a larger varietyof optical surface water types including transparent water types of the outer shelf.
Figure 2a–c show the high spatial- and temporal variability of MERIS C2R Z90 on3, 4, 5 August 2010. For example, the LENA2010 sampling stations 1 to 3 and 25 areof the turbid water-type with values of C2R Z90 ∼ 1 m on 3 August 2010, changing to5
more transparency with values of C2R Z90 ∼ 2 m only within 1 to 2 days due to frontalchanges.
The best matching coordinate pairs in time from the LENA2010 expedition (Table 1)and the TRANSDRIFT-XVII expedition (table 2) were selected for the match-up analy-ses. The match-up analyses using SPM data show a well-developed relationship be-10
tween the optical C2R parameters connected to suspended matter (e.g. C2R kmin,C2R b tsm (scattering of TSM), C2R Z90, C2R TSM) although there is a temporal dif-ference of 2 to 11 days between the in-situ sampling and the MERIS acquisition on 7September 2010.
Figure 4a shows the relationship TRANSDRIFT-XVII SPM versus C2R Z9015
(7 September 2010), and Fig. 5 the relationship TRANSDRIFT-XVII SPM versusC2R TSM (7 September 2010). The match-up analyses based on LENA2010 in-situdata in the Buor Khaya Bay showed the limits of relating to concomitant pixels of C2Rparameters in optically highly heterogeneous and dynamic coastal waters.
The match-up analyses for cDOM and SPM versus C2R kmin and C2R Z90 show for20
near-coast on-shore waters that the major direct relationship exists between transmis-sivity and SPM. This optimal relationship (e.g. Fig. 4a, C2R Z90 versus SPM) indicatesthat the turbidity/particulate matter is the dominating Ocean Colour producing aquaticcomponent in the water-leaving spectral reflectances. The relationship C2R Z90 ver-sus cDOM (e.g. Fig. 4b) shows that cDOM influences the transparency parameters25
(C2R kmin, C2R Z90), but is not as dominating as SPM (Fig. 4a).The derived concentration parameter C2R Chl a processed with the standard BEAM
VISAT C2R Chl a conversion factor= 21 from C2R a pig are overestimated by an or-der of magnitude. In general, calculated C2R Chl a concentrations in Buor Khaya Bay
3861
BGD10, 3849–3889, 2013
Ocean Colourremote sensing in theSouthern Laptev Sea
B. Heim et al.
Title Page
Abstract Introduction
Conclusions References
Tables Figures
J I
J I
Back Close
Full Screen / Esc
Printer-friendly Version
Interactive Discussion
Discussion
Paper
|D
iscussionP
aper|
Discussion
Paper
|D
iscussionP
aper|
during the ice-free season show up to 20 to 30 µgL−1 C2R Chl a for all the years 2006to 2011. Chl a overestimation by the order of one magnitude is also characteristicto the global standard NASA SeaWiFS and MODIS Chl a products. As an example,we also included the match-ups of the MODIS Level3 binned Chl a averaged prod-uct for September 2010 (9 km spatial pixel resolution) versus the TRANSDRIFT-XVII5
Chl a data (Fig. 6). Figure 7 indicates how the magnitude of cDOM concentration cor-respondingly influences the calculated values of MERIS C2R Chl a.
4.3 Spatio-temporal Ocean Colour synoptic information
The spatial distribution of different water types in the southern Laptev Sea can be visu-alized using the mapped MERIS C2R-parameters. For the Laptev Sea region, the tem-10
poral resolution of usable MERIS satellite data time series lies between daily resolution(in case of low cloud coverage) to monthly (in case of high cloud coverage, as is com-mon during the ice-free season). The mapped optical parameters and concentrationparameters provide information on the hydrodynamical meso-scale structures, such asmeanders with amplitudes of 20 to 30 km and of filaments and eddies with diameters15
up to 100 km (e.g. Figs. 2, 3, 9). Filaments of the turbid water type with low trans-parencies (low C2R Z90, high C2R kmin) and high SPM (high C2R TSM) frequentlydeveloped within Buor Khaya Bay. MERIS C2R-time series show that the filamentsmay be cut off the front and travel through the southern part of Buor Khaya Bay. Thetemporal resolution of all these spatially well-defined features is very high between one20
or few days. During this time span, filaments and meanders may change abruptly (e.g.Fig. 2). Figure 8 shows the mapped calculated MERIS C2R-parameters C2R TSM(mgL−1), C2R Z90 (m), and C2R absorption (m−1), of a cloud-free MERIS acquisi-tion on Sep 25, 2009. High absorption is wide-spread in the Southern Laptev Sea. In-tense meandering between turbid waters and less turbid waters is predominately found25
around the Lena River Delta and in zones of shallow banks and regions. The range ofMERIS C2R TSM range (2006 to 2010) in turbid regions shows concentrations from 5
3862
BGD10, 3849–3889, 2013
Ocean Colourremote sensing in theSouthern Laptev Sea
B. Heim et al.
Title Page
Abstract Introduction
Conclusions References
Tables Figures
J I
J I
Back Close
Full Screen / Esc
Printer-friendly Version
Interactive Discussion
Discussion
Paper
|D
iscussionP
aper|
Discussion
Paper
|D
iscussionP
aper|
to 12 mgL−1 and ZEu from C2R Z90 of maximal 5 m. Calculated ZEu ranges outside theturbid water zones in the off-shore surface waters of Buor Khaya Bay showed valuesdown to a 10 m euphotic water layer. In August 2010, an irregularly-shaped, transpar-ent eddy system showed up in central Buor Khaya Bay (Fig. 2) with C2R ZEu valuesof 13 m of the euphotic depth layer.5
High turbidity is regularly visible on the shallow banks around the Lena River Deltaand in the vicinity around the New Siberian Islands. The mapped C2R-parameters indi-cate that frequently, the turbidity zones considerably enlarge along the coastlines andalso occur above shallow banks. The turbidity zones suggest that considerable remobi-lization of sea surface sediments due to resuspension events occur on the Laptev Sea10
and the Eastern Siberian shallow shelfs.We also investigated if the outline of the Lena River freshwater plume is visible in
the mapped MERIS C2R-parameters expecting to detect high SPM, high attenuationand absorption and low transparencies. Unfortunately, the event of the spring freshetis mostly hidden for optical remote sensing applications under the continuous cloud15
coverage in the months of June and early July. From 2006 to 2011, only very few ac-quisitions in early summer, 1 July 2009, and 3 July 2011, capture the spring freshet.Orek et al. (2013) describe the Lena River outflow during the spring freshet into thesurrounding ice-free waters in early July. During the spring freshet, elevated parame-ters of SPM, absorption and attenuation and low transparencies with the spatial outline20
of a plume are visible only in the case of no low-ice coverage, such is the case in 2011,but not in 2009 with sea ice.
From mid of July until the end of September in all investigated years, the LenaRiver fresh water plume is not outlined and detectable as a spatially-outlined plumestructure. Instead, on the wide shallow bench around the Lena River delta and on the25
shallow banks directly north-east of the Lena River Delta, elevated SPM-related C2R-parameters are regularly visible (Figs. 2, 3, 8). Northeast of the Lena River Delta at theoutlets of the Lena River branches, regularly, meanders and filaments, sometimes of
3863
BGD10, 3849–3889, 2013
Ocean Colourremote sensing in theSouthern Laptev Sea
B. Heim et al.
Title Page
Abstract Introduction
Conclusions References
Tables Figures
J I
J I
Back Close
Full Screen / Esc
Printer-friendly Version
Interactive Discussion
Discussion
Paper
|D
iscussionP
aper|
Discussion
Paper
|D
iscussionP
aper|
a dipole type (with meander crests and filaments developing in more than one direc-tion), are developing and being pushed outwards.
The LENA2010 expedition data show that a strong stratification with a mixed layerwith a 5 to 8 m depth existed in Buor Khaya Bay in the beginning of August 2010. Theon-shore transects (stations 15 to 18) occurred on 1 August 2010 within the fully mixed5
layer of high turbidity. At the LENA2010 expedition, the turbidity zone in coastal wa-ters above the shallow Lena River Delta banks incorporated both, freshwater surfacestations (< 1 salinity) and freshwater-influenced stations (< 5 salinity). Stations withbelow-brackwater salinities (< 5 salinity) can be found within all ranges of turbidity. Thisindicates that the Lena River freshwater signal (< 5 salinity) is not directly linked to ele-10
vated SPM-related C2R parameters in coastal waters. The riverine turbidity of the LenaRiver is optically hidden in the turbidity of coastal waters influenced by resuspensionabove the shallow Lena River Delta bench. The eastern Buor Khaya coast deliveredfluvial discharge (e.g. station 8, < 1 PSU). A brackish surface water layer (> 8 PSU) ofsurface waters occurred outside the Buor Khaya Bay (stations 6, 7, 24; Fig. 2).15
The MERIS acquisitions in early August 2010 (e.g. Figs. 2, 9a) show transparentcoastal waters along the eastern coastline of Buor Khaya Bay indicating no intenseresuspension within this coastal region of steeper submarine slopes. Therefore, on 8August 2010, mapped C2R parameters could visualize ta turbid river inflow into thenon-turbid coastal waters of eastern Buor Khaya Bay (Fig. 9a). However, after several20
storm events (http://www.ncep.noaa.gov/) in the southern Laptev Sea region in Augustand September 2010, we assume that the mixed upper layer became deeper and wentdown to a depth of at least 10 to 12 m in September 2010, as it was measured on theTRANSDRIFT XVII expedition. We can see that the MERIS acquisition on 27 August2010, makes resuspension visible along all of the eastern coastline of the Buor Khaya25
Bay (Fig. 9b) and the turbid river inflows can no more be distinguished from the turbidcoastal waters. The high spatial resolution extracted from the Rapid-Eye satellite data(5 m per pixel at nadir) on 8 and 27 August 2010, confirm the hydrodynamic interpre-tation of the coarser-scale MERIS satellite data for the more shallow mixed layer in
3864
BGD10, 3849–3889, 2013
Ocean Colourremote sensing in theSouthern Laptev Sea
B. Heim et al.
Title Page
Abstract Introduction
Conclusions References
Tables Figures
J I
J I
Back Close
Full Screen / Esc
Printer-friendly Version
Interactive Discussion
Discussion
Paper
|D
iscussionP
aper|
Discussion
Paper
|D
iscussionP
aper|
early August and on the deeper vertical mixing and resuspension events late in August(Fig. 9a, b).
5 Discussion
5.1 Evaluation of MERIS C2R parameters
The evaluation suggests that due to highly dynamic hydrography in the Southern5
Laptev Sea region, match-up analyses are difficult. Exact match-up analyses (thatthe remote sensing value is exactly taken from the pixel location on the same dayof the ship-based in-situ measurement) seem mostly not to be feasible due to frequentcloud coverage and the high-spatial and high-temporal horizontal heterogeneity of thesurface mixed layer. Also, match-up analyses using averages of pixels would be mis-10
leading along frontal zones. Therefore, we used the cloud-free pixels most closely intime that was feasible for match-ups based on the LENA2010 expedition data in earlyAugust 2010 and with a temporal difference of more than one week for the match-upanalyses based on the TRANSDRIFT2010 expedition data.
Optical C2R parameters such as C2R Z90 and concentration parameters such as15
C2R TSM could be reasonably used to trace the surface hydrodynamics of the LaptevSea region. The cDOM is underestimated as C2R a gelbstoff. The strong absorptionin the visible wavelength range that occurs due to the high cDOM concentrations isoperationally attributed towards high Chl a concentration. The over-estimation of theorder of one magnitude of Chl a occurs with all standard NASA and ESA processing20
algorithms because the standard assumption in all operational Ocean Colour algo-rithms contributes the main absorption towards the phytoplankton absorption. Also,the bio-optical measurements of the LENA2011 expedition in the organic-rich LenaRiver waters indicate that the regional specific phytoplankton absorption coefficient isaround 3 times higher and more effective (Orek et al., 2013) than the value of a global25
mean. We propose that due to elevated cDOM background concentrations and the
3865
BGD10, 3849–3889, 2013
Ocean Colourremote sensing in theSouthern Laptev Sea
B. Heim et al.
Title Page
Abstract Introduction
Conclusions References
Tables Figures
J I
J I
Back Close
Full Screen / Esc
Printer-friendly Version
Interactive Discussion
Discussion
Paper
|D
iscussionP
aper|
Discussion
Paper
|D
iscussionP
aper|
very effective phytoplankton absorption all global ESA and NASA Chl a products showChl a concentrations of one magnitude too high for the Siberian inner shelf regions(e.g. Fig. 6).
For an Ocean Colour investigation in the Kara Sea, Pozdnyakov et al. (2005) pro-cessed Ocean Colour MODIS time series from the ice-free season in 2003 combin-5
ing the neural network and Levenberg-Marquardt multivariate processing. To obtainsynoptic spatial distributions, temporally merged image mosaics based on calculatedarithmetic means were generated. The authors compared the magnitude of MODIScalculated parameters of summer averages to ranges in the literature and showed thatthey had produced realistic DOC and SPM concentrations. Hessen et al. (2010) de-10
scribed match-ups of these Levenberg-Marquadt based processed MODIS productsfrom summer 2003 with field-based data. While the range and distribution of DOCassessed from MODIS and in-situ sampling were in relative agreement with the de-viation of the order of half a magnitude, the MODIS-derived Chl-concentrations werean order of magnitude too high. Hessen et al. (2010) assumed that the reason of the15
over-estimation is that in-situ sampling was performed in late-summer compared to thecalculated MODIS summer average. However, as it is an outcome of this study, weassume that the Chl a overestimation by one order of magnitude described in Hessenet al. (2010) for the Ob Estuary in the southern Kara Sea is technically also due to thehigh background of cDOM (> 5 mgL−1 DOC for the coastal Kara Sea waters).20
A further confirmation gives Orek et al. (2013) undertaking bio-optical measurementsat the LENA2011 expedition in early July 2011 to provide new field-based coefficientsfor a specified Ocean Colour processing for the Laptev Sea region. The authors discussthe difficulty of the calculation of Chl a from the water-leaving reflectances becausephytoplankton absorption only contributed < 10 % to the overall absorption that was25
dominated by absorption of the terrestrial organic.
3866
BGD10, 3849–3889, 2013
Ocean Colourremote sensing in theSouthern Laptev Sea
B. Heim et al.
Title Page
Abstract Introduction
Conclusions References
Tables Figures
J I
J I
Back Close
Full Screen / Esc
Printer-friendly Version
Interactive Discussion
Discussion
Paper
|D
iscussionP
aper|
Discussion
Paper
|D
iscussionP
aper|
5.2 Spatial hydrodynamical pattern of the Southern Laptev Sea
We did not observe a well-defined Lena River plume in the spatial distribution ofC2R a gelbstoff and C2R TSM or related turbidity parameters (C2R kmin, C2r Z90).However, multi-year expedition data show that the southern Laptev Sea is charac-terised by a wide-spread high freshwater signal and background cDOM concentrations5
(e.g. a443cDOM range in Buor Khaya Bay is 2 to 2.5 m−1) and that the cDOM concen-tration of the Lena River in August is of the same magnitude as in the surface watersaround the Lena River Delta and in Buor Khaya Bay in the August and Septembermonths. That the magnitude of concentrations is of the same order or higher in thecoastal waters around the Lena River Delta and in Buor Khaya Bay then in the Lena10
River water is also a finding related to POC, nutrients (NO3, PO4) pCO2 and oxygensaturation from multi-year expedition data (Semiletov et al., 2013). For the Laptev Searegion, Semiletov et al. (2013) show how high cDOM always correlated with low-salinityand how POC, nutrients and pCO2 correlated with different ranges of salinity. The au-thors relate high cDOM to fluvial discharge and terrestrial POC and nutrients to coastal15
erosion. In summary, the high background DOC surrounding the Lena River Delta andin Buor Khaya Bay represents the wide-spread fresh water on the Laptev Sea shelfseem to be cover riverine DOC signals in the summer months of July, August andSeptember.
Wegner et al. (2013) describe a SPM-enriched fresh water surface layer up to lat-20
itude of 76.8◦ N north of the Lena River Delta and 77.8◦ N on the eastern shelf dueto dominating offshore winds, in September 2008, a non-normal year of anti-cyclonicatmospheric circulation pattern. Even in September 2007, in a quasi-normal year of cy-clonic atmospheric circulation pattern, with dominating onshore winds and eastward,non cross-shelf transport of the riverine freshwater, Wegner et al. (2013) describe that25
SPM-enriched fresh water was measured up to latitude of 75◦ N. The authors showedthat this contrasting fresh-water transport could also be made visible in the mappedMERIS C2R-parameters: in 2008, the outer shelf areas showed less transmissivity
3867
BGD10, 3849–3889, 2013
Ocean Colourremote sensing in theSouthern Laptev Sea
B. Heim et al.
Title Page
Abstract Introduction
Conclusions References
Tables Figures
J I
J I
Back Close
Full Screen / Esc
Printer-friendly Version
Interactive Discussion
Discussion
Paper
|D
iscussionP
aper|
Discussion
Paper
|D
iscussionP
aper|
(higher C2R kmin, lower C2R Z90) compared to more transparent waters on the outershelf in 2007 (Wegner et al., 2013).
Due to obscuring continuous cloud coverage north of 75◦ N at a longitude of 130◦ Eand westwards of it, the most transparent, lowest cDOM and SPM-water type is lim-ited to be visible only within a few small cloud-free patches in the MERIS time series.5
Regularly, the high gradient between high-cDOM freshwater-influenced surface wa-ters to low-cDOM marine-background waters seems to lie northwards of the cloud-freemapped areas under a continuous cloud coverage over the sea-ice free waters in sum-mer. However, still under these limited conditions do the MERIS snapshots indicate thatthe spatial pattern of the transparent waters and the different types of less transparent10
waters do outline a coastal turbid meandering zone of several 100 km. Only in the yearof prevailing anti-cyclonic atmospheric circulation in 2008, this week turbidity spatialpattern was partly hidden due to higher far-reaching diffuse turbidity of surface waterson the outer shelf.
The horizontal meander-fields and filament-fields in the Southern Laptev Sea sug-15
gest that a high frontal instability is continuously being generated. The frontal instabilitymay be shed from the Lena River inflow and from unstable coastal currents. Meanders,filaments and eddies horizontally transport material in the surface water layer due tohydrodynamical equilibrium forces. Hydrodynamical model simulations and mooringcurrent measurements show that these horizontal structures also provide vertical mo-20
tion and indicate the vertical mixing of a surface layer (e.g. Chao and Shaw, 2002,Ralph 2002, Sutherland et al., 2011, Fong et al., 2002). Kraberg et al. (2013) showa well-mixed fresh-water influenced upper layer of 5 to 8 m depth in the Buor KhayaBay. The rich hydrographic spatio-temporal pattern of filament-fields, meander-fieldsand eddies suggests that they carry chemical and biological fields and could trigger25
a high patchiness of phytoplankton and zooplankton in the Laptev See region. Kraberget al. (2013) discuss a high spatial heterogeneity in phytoplankton composition in Au-gust 2010 in the Buor Khaya Bay.
3868
BGD10, 3849–3889, 2013
Ocean Colourremote sensing in theSouthern Laptev Sea
B. Heim et al.
Title Page
Abstract Introduction
Conclusions References
Tables Figures
J I
J I
Back Close
Full Screen / Esc
Printer-friendly Version
Interactive Discussion
Discussion
Paper
|D
iscussionP
aper|
Discussion
Paper
|D
iscussionP
aper|
The visualisation of resuspension events in the mapped MERIS C2R parametershighlights vertical mixing events down to the sea bottom of shallow banks in the south-ern Laptev Sea region. A turbidity belt around the Lena River delta is always visible.Reimnitz (2000) describes the high-latitudinal specific shallow bench around the LenaRiver Delta and other Arctic deltas that has been most probably generated by bottom-5
fast ice cover. Eicken et al. (2005) describe that the presence of the wide shallow bencharound the Lena River Delta is in line with the mostly extensional sea-ice regime in thisarea.
Several shallow banks are delineated by the 5 m, 10 m and 15 m isobaths (State Ge-ological Map of Russian Federation, 1999) on the Laptev Sea shelf and in the western10
part of the East Siberian Sea shelf. Gavrilov et al. (2003) discuss that the present-day shallow banks represent former Ice-Complex islands that have been destroyedby coastal thermal erosion and thermal abrasion during the last 1000 yr. Gavrilovet al. (2003) cite observations made on Russian seismic expeditions during the sum-mer months that described the local turbidity on these shallow banks (in Lisitsin et al.,15
2000; Dmitrenko et al., 2001).Charkin et al. (2011) discuss that for the shallow Laptev Sea, the impacted zone by
resuspension events should be on average down to the 10 m bathymetry (with an esti-mation of average wave height of 1 m), accounting for the only short durability of strongwaves. They describe how the dominating sand to sandy silt fraction that they found20
on the shallows and on the shallow bench around the Lena River Delta supports thetheory of vertical mixing events that bring velocity currents down to these bathymetricdepths. Vonk et al. (2012) confine a potential sedimentational regime to the shelf ar-eas below 30 m depth, thereby excluding half of the shelf area of the Laptev Sea andEastern Siberian shelf. Wegner et al. (2013) discuss that sediment entrainment due to25
resuspension at depths around 30 m take place mainly after storm events. Their dataare based on current speeds of the ANABAR mooring station (74◦ 30′ N, 127◦ 20′ E) inthe Laptev Sea. To further understand the processes of deposition of terrestrial mate-rial on the Laptev Sea and Eastern Siberian shelf regions the Ocean Colour remote
3869
BGD10, 3849–3889, 2013
Ocean Colourremote sensing in theSouthern Laptev Sea
B. Heim et al.
Title Page
Abstract Introduction
Conclusions References
Tables Figures
J I
J I
Back Close
Full Screen / Esc
Printer-friendly Version
Interactive Discussion
Discussion
Paper
|D
iscussionP
aper|
Discussion
Paper
|D
iscussionP
aper|
sensing may provide the information on hydrodynamic structures during the ice-freeseason. analyzing the resuspension events visible in the Ocean Colour satellite datamay allow to spatially distinguish between the submarine depths of regular submarineseabed erosion and entrainment and the submarine depths where abrasion occursonly caused by strong storm events.5
Ocean Colour remote sensing proves to provide new hydrodynamic information forthe shallow Siberian inner shelf waters and coastal waters. The synoptic information onresuspension events, meandering and filamenting cannot be made visible from sam-pling from shipborne platforms because high-sea Arctic ship expeditions are forced tostay in deeper waters due to the draft of the ocean-going ships. Even with grid sampling10
from shallow-water going ships it would be difficult to capture these spatial features assampling cannot logistically be done on a small enough spatial frequency. Deploymentof drifting sensors could provide in future measurements on fronts, meanders, eddies,and filaments and support the validation of the remote sensing derived information.
The known main aquatic sediment transport during the ice-free seasons is regulated15
as a submarine sediment transport within the bottom nepheloid layer inside North–South running submarine valley structures that serve as transport pipes (Wegner et al.,2003, 2005). This submarine transport mechanism escapes the detection possibilitiesbased on optical satellite data. However, the meanders, eddies and filaments also visu-alize a wide-spread lateral surface water transport of dissolved and particulate matter20
in the sea-ice free season. On the other hand, the hydrodynamical structures and re-suspension zones also potentially indicate local blockades of cross-shelf horizontaltransport and wide-spread processes for vertical transport pathways of nutrients, car-bon, sediments and heat to the submarine sea bottom of at least 10 m depth.
3870
BGD10, 3849–3889, 2013
Ocean Colourremote sensing in theSouthern Laptev Sea
B. Heim et al.
Title Page
Abstract Introduction
Conclusions References
Tables Figures
J I
J I
Back Close
Full Screen / Esc
Printer-friendly Version
Interactive Discussion
Discussion
Paper
|D
iscussionP
aper|
Discussion
Paper
|D
iscussionP
aper|
6 Conclusions
Despite limitation due to high cloud coverage during the sea-ice free season, OceanColour remote sensing provides highly useful time-resolved information on the hydro-graphic dynamics of the shallow Siberian shelf regions.
During the ice-free season, the Lena River flows out in coastal and onshore waters5
of similar or even higher concentrations of SPM and cDOM. For SPM this is due toresuspension events of the shallow bench around the Lena River delta and on thenumerous shallows of the shallow Laptev Sea bathymetry. The expedition data showthat high cDOM concentrations are distributed all over in Buor Khaya Bay and in thecoastal and inner shelf waters northeast of the Lena River Delta. Care must be taken in10
terms of Ocean-Colour derived Chl a concentrations that are highly overestimated bythe order of one magnitude due to the elevated cDOM concentrations in coastal watersand the inner shelf surface waters.
Known lateral transport pathways in the Laptev Sea do function by transport withinand on the sea-ice (Eicken et al., 1997, 2000) and submarine via the bottom nepheolid15
layer (Wegner et al., 2003, 2005). In addition, the spatio-temporal patterns of the OceanColour parameters indicate the lateral advection of terrestrial (dissolved and fine partic-ulates) and living biological material during the ice-free season. Large meander crests,filaments and eddy-like structures is a critical point because the water masses carriedinside these features will be less intensively horizontally mixed for longer periods of20
time during lateral advection processes.This is an important result as it also explains the high heterogeneity of coastal phy-
toplankton and zooplankton communities. Furthermore it indicates potential verticalpathways for downward and upward transport of material. Resuspension events thatwere made visible in the Ocean Colour parameters show that the shallow regions,25
specifically the shallow bench around the Lena River, but also the wide-spread sub-marine shallows are regularly influenced by resuspension that indicates vertical mixingand vertical transport pathways of nutrients, carbon, sediments and heat.
3871
BGD10, 3849–3889, 2013
Ocean Colourremote sensing in theSouthern Laptev Sea
B. Heim et al.
Title Page
Abstract Introduction
Conclusions References
Tables Figures
J I
J I
Back Close
Full Screen / Esc
Printer-friendly Version
Interactive Discussion
Discussion
Paper
|D
iscussionP
aper|
Discussion
Paper
|D
iscussionP
aper|
Acknowledgements. This work is supported by the German Science Foundation (DFG 4575)and the Helmholtz Climate Initiative REKLIM (Regionale Klimaaenderungen/Regional climatechange). The Russian–German LENA08, and LENA10 ship expeditions are supported andorganized by the AWI (Germany) and the Arctic and Antarctic Research Institute, AARI (St.-Petersburg, RU). The vessels used were the Russian river vessel Puteyski 405 in 2008 and5
2010, and PTS TB-0012 in Buor Khaya Bay in 2010. The TRANSDRIFT expedition is an in-tegral part of the joined Russian–German project “Laptev Sea System”. It is funded by theGerman Federal Ministry for Education and Research and the Russian Ministry of Educationand Science. The vessel used for the TRANSDRIFT-XVII expedition in September 2010 wasthe RV NIKOLAY EVGENOV. We thank the captains and the crews for their support.10
We thank Ruth Flerus, AWI/GEOMAR, who sampled and prepared the cDOM samples at theLENA2010 ship expedition and the OSL, St.-Petersburg (RU), specifically Elena Dobrotina, forthe support for the cDOM-measurements of all expeditions. We thank Bennet Juhls, Universityof Kiel/GEOMAR, for the NCEP wind analyses.
The ESA ENVISAT project (MERIS-ID 5504) granted the used MERIS data. The ESA ENVISAT15
project (MERIS-ID 5504) granted the used MERIS data. We thank the German AerospaceAgency (DLR) for providing RapidEye data by the RESA (RapidEye Science Archive) program(grant number 424 Geomonitoring PROGRESS).
References
Aagaard, K. and Armack, E.: The role of sea ice and other fresh water in the Arctic circulation,20
J. Geophys. Res., 94, 14485–14489, 1989.Bauch, D., Dmitrenko, I. A., Wegner, C., Holemann, J. A., Kirillov, S. A., Timokhov, L. A., and
Kassens, H.: Exchange of Laptev Sea and Arctic Ocean halocline waters in response toatmospheric forcing, J. Geophys. Res., 114, C05008, 2156–2202, 2009.
Chao, S.-Y. and Shaw, P. T.: Nonhydrostatic aspects of coastal upwelling meanders and fila-25
ments off eastern ocean boundaries, Tellus A, 54, 63–75, 2002.Charkin, A. N., Dudarev, O. V., Semiletov, I. P., Kruhmalev, A. V., Vonk, J. E., Sanchez-
Garcıa, L., Karlsson, E., and Gustafsson, O.: Seasonal and interannual variability of sedi-mentation and organic matter distribution in the Buor-Khaya Gulf: the primary recipient of
3872
BGD10, 3849–3889, 2013
Ocean Colourremote sensing in theSouthern Laptev Sea
B. Heim et al.
Title Page
Abstract Introduction
Conclusions References
Tables Figures
J I
J I
Back Close
Full Screen / Esc
Printer-friendly Version
Interactive Discussion
Discussion
Paper
|D
iscussionP
aper|
Discussion
Paper
|D
iscussionP
aper|
input from Lena River and coastal erosion in the southeast Laptev Sea, Biogeosciences, 8,2581–2594, doi:10.5194/bg-8-2581-2011, 2011.
Dmitrenko, I. A., Hoelemann, J., Kirillov, S. A., Wegner, C., Gribanov, V. A., Berezovskaya, S. L.,and Kassens, H. M.: Thermal regime of the bottom water layer in the Laptev Sea and deter-mining processes, Kriosfera Zemli, 5, 40–55, 2001 (in Russian).5
Doerffer, R. and Schiller, H.: The MERIS case 2 water algorithm, Int. J. Remote Sens., 28, 3–4,517–535, 2007.
Doerffer, R. and Schiller, H.: MERIS Regional Coastal and Lake Case 2 Water Project At-mospheric Correction, GKSS-KOF-MERIS-ATBD01, Institute for Coastal Research, GKSSResearch Center, Geesthacht, 42 pp., 2008.10
Eicken, H., Reimnitz, E., Alexandrov, V., Martin, T., Kassens, H., and Viehoff, T.: Sea-ice pro-cesses in the Laptev Sea and their importance for sediment export, Cont. Shelf Res., 17,205–233, 1997.
Eicken, H., Kolatschek, J., Freitag, J., Lindemann, F., Kassens, H., and Dmitrenko, I.: Identifyinga major source area and constraints on entrainment for basin-scale sediment transport by15
Arctic sea ice, Geophys. Res. Lett., 27, 1919–1922, 2000.Eicken, H., Dmitrenko, I., Tyshko, K., Darovskikh, A., Dierking, W., Blahak, U., Groves, J., and
Kassens, H.: Zonation of the Laptev Sea landfast ice cover and its importance in a frozenestuary, Global Planet. Change, 48, 55–83, 2005.
Fong, D. A. and Geyer, W. R.: The alongshore transport of freshwater in a surface-trapped river20
plume, J. Phys. Oceanogr., 32, 957–972, 2002.Gavrilov, A. V., Romanovskii, N. N., Romanovsky, V. E., Hubberten, H.-W., and Tumskoy, V. E.:
Reconstruction of ice complex remnants on the Eastern Siberian Arctic shelf, PermafrostPeriglac., 14, 187–198, 2003.
Gordeev, V. V., Martin, J.-M., Sidorov, I. S., and Sidorova, M. N.: A reassessment of the Eurasian25
river input of water, sediment, major elements and nutrients to the Arctic Ocean, Am. J. Sci.,296, 664–691, 1996.
Gustafsson, O., van Dongen, B. E., Vonk, J. E., Dudarev, O. V., and Semiletov, I. P.: Widespreadrelease of old carbon across the Siberian Arctic echoed by its large rivers, Biogeosciences,8, 1737–1743, doi:10.5194/bg-8-1737-2011, 2011.30
Hessen, D. O., Carroll, J. L., Kjeldstad, B., Korosov, A. A., Pettersson, L. H., Pozdnyakov, D.,and Sørensen, K.: Input of organic carbon as determinant of nutrient fluxes, light climate andproductivity in the Ob and Yenisey estuaries, Estuar. Coast. Shelf Sci., 88, 53–66, 2010.
3873
BGD10, 3849–3889, 2013
Ocean Colourremote sensing in theSouthern Laptev Sea
B. Heim et al.
Title Page
Abstract Introduction
Conclusions References
Tables Figures
J I
J I
Back Close
Full Screen / Esc
Printer-friendly Version
Interactive Discussion
Discussion
Paper
|D
iscussionP
aper|
Discussion
Paper
|D
iscussionP
aper|
Holmes, R. M., McClelland J. W., Peterson, B. J., Tank, S. E., Bulygina, E., Eglinton, T. I.,Gordeev, V. V., Gurtovaya, T. Y., Raymond, P. A., Repeta, D. J., Staples, R., Striegl, R. G.,Zhulidov, A. V., and Zimov, S. A.: Seasonal and annual fluxes of nutrients and organic matterfrom large rivers to the Arctic Ocean and surrounding seas, Estuar. Coast., 35, 369–382,2012.5
International Ocean Colour Coordinating Group (IOCCG): Remote Sensing of Ocean Colour inCoastal, and Other Optically-Complex Waters, edited by: Sathyendranath, S., Reports of theInternational Ocean-Colour Coordinating Group, 3, IOCCG, Dartmouth, Canada, 2000.
Karlsson, E. S., Charkin, A., Dudarev, O., Semiletov, I., Vonk, J. E., Sanchez-Garcıa, L., Ander-sson, A., and Gustafsson, O.: Carbon isotopes and lipid biomarker investigation of sources,10
transport and degradation of terrestrial organic matter in the Buor-Khaya Bay, SE LaptevSea, Biogeosciences, 8, 1865–1879, doi:10.5194/bg-8-1865-2011, 2011.
Kassens, H., Holemann, J., Klagge, T., and Novikhin, A.: Russian–German Cooperation LaptevSea: Expeditions TRANSDRIFT XII, XIV, XVI, Summer 2007, 2008, 2009, 2010, unpubl.cruise reports, 2010.15
Kraberg, A. C., Druzhkova, E., Heim, B., Loeder, M. J. G., and Wiltshire, K. H.: Phytoplanktoncommunity structure in the Lena Delta (Siberia, Russia) in relation to hydrography, Biogeo-sciences Discuss., 10, 2305–2344, doi:10.5194/bgd-10-2305-2013, 2013.
Lantuit, H., Atkinson, D., Overduin, P. P., Grigoriev, M., Rachold, V., Grosse, G., and Hub-berten, H.-W.: Coastal erosion dynamics on the permafrost-dominated Bykovsky Peninsula,20
north Siberia, 1951–2006, Polar Res., 30, 7341, doi:10.3402/polar.v30i0.7341, 2011.Lantuit, H., Overduin, P. P., Couture, N., Wetterich, S., Are, F., Atkinson, D., Brown, J.,
Cherkashov, G., Drozdov, D., Forbes, D., Graves-Gaylord, A., Grigoriev, M., Hub-berten, H. W., Jordan, J., Jorgenson, T., Ødegard, R. S., Ogorodov, S., Pollard, W.,Rachold, V., Sedenko, S., Solomon, S., Steenhuisen, F., Streletskaya, I., and Vasiliev, A.:25
The Arctic Coastal Dynamics database, a new classification scheme and statistics on arcticpermafrost coastlines, Estuar. Coast., 35, 383–400, 2012.
Lee, Z. P. and Hu, C. M.: Global distribution of Case-1 waters: an analysis from SeaWiFSmeasurements, Remote Sens. Environ., 101, 270–276, 2006.
Lisitsin, A. P., Shevchenko, V. P., and Burenkov, V. I.: Hydrooptics and suspended matter of30
Arctic seas, Atmos. Ocean. Opt., 13, 61–71, 2000.
3874
BGD10, 3849–3889, 2013
Ocean Colourremote sensing in theSouthern Laptev Sea
B. Heim et al.
Title Page
Abstract Introduction
Conclusions References
Tables Figures
J I
J I
Back Close
Full Screen / Esc
Printer-friendly Version
Interactive Discussion
Discussion
Paper
|D
iscussionP
aper|
Discussion
Paper
|D
iscussionP
aper|
Lobbes, J. M., Fitznar, H. P., and Kattner, G.: Biogeochemical characteristics of dissolvedand particulate organic matter in Russian rivers entering the Arctic Ocean, Geochim. Cos-mochim. Acta, 64, 2973–2983, 2000.
Loginova, A.N: Chromophoric dissolved organic matter in the Laptev Sea (Siberian Arctic):a comparison of in-situ observations, laboratory measurements, and remote sensing, MSc5
thesis “Applied Polar and Marine Sciences”, POMOR, St. Petersburg State University (RU),and University of Hamburg (DE), 98 pp., 2011.
Morel, A. and Prieur, L.: Analysis of variations in ocean color, Limnol. Oceanogr., 22, 709–722,1977.Orek, H., Doerffer, R., Rottgers, R., Boersma, M., and Wiltshire, K. H.: A Bio-optical model10
for remote sensing of Lena water, submitted to Biogeosciences, 2013.Pozdnyakov, D. V., Korosov, A. A., Pettersson, L. H., and Johannessen, O. M.: MODIS evi-
dences the river run-off impact on the Kara Sea trophy, Int. J. Remote Sens., 26, 364–368,2005.
Rachold, V., Grigoriev, M. N., Are, F. E., Solomon, S., Reimnits, E., Kassens, H., and15
Antonov, M.: Coastal erosion vs riverine sediment discharge in the Arctic Shelf seas, Int.J. Earth Sci., 89, 450–460, 2000.
Rachold, V., Eicken, H., Gordeev, V. V., Grigoriev, M. N., Hubberten, H.-W., Lisitzin, A. P.,Shevchenko, V. P., and Schirrmeister, L.: Modern terrigenous organic carbon input to theArctic Ocean, in: Organic Carbon Cycle in the Arctic Ocean: Present and Past, edited by:20
Stein, R. and Macdonald, R. W., 33–55, 2004.Reimnitz, E.: Interactions of river discharge with sea ice in proximity of Arctic Deltas: a review,
Polarforschung, 70, 123–134, 2000.Schirrmeister, L., Siegert, C., Kunitzky, V. V., Grootes, P., and Erlenkeuser, H.: Late quaternary
ice rich permafrost sequences as a palaeoenvironmental archive for the Laptev Sea region25
in northern Siberia, Int. J. Earth Sci., 91, 154–167, 2002.Scott, P., Zaneveld, J. R. V., Mitchell, B. G., Mueller, J. L., Kahru, M., Wieland, J., and Stram-
ska, M.: Inherent optical properties: instruments, characterizations, field measurements anddata analysis protocols, in: Ocean Optics Protocols For Satellite Ocean Color Sensor Vali-dation, vol. IV, edited by: Mueller, J. L., Fargion, G. S., and McClain C. R., NASA/TM-2003-30
211621/Rev4, 4, 76 pp., 2000.Semiletov, I. P., Pipko, I. I., Shakhova, N. E., Dudarev, O. V., Pugach, S. P., Charkin, A. N.,
McRoy, C. P., Kosmach, D., and Gustafsson, O.: Carbon transport by the Lena River from
3875
BGD10, 3849–3889, 2013
Ocean Colourremote sensing in theSouthern Laptev Sea
B. Heim et al.
Title Page
Abstract Introduction
Conclusions References
Tables Figures
J I
J I
Back Close
Full Screen / Esc
Printer-friendly Version
Interactive Discussion
Discussion
Paper
|D
iscussionP
aper|
Discussion
Paper
|D
iscussionP
aper|
its headwaters to the Arctic Ocean, with emphasis on fluvial input of terrestrial particulateorganic carbon vs. carbon transport by coastal erosion, Biogeosciences, 8, 2407–2426,doi:10.5194/bg-8-2407-2011, 2011.
Semiletov, I. P., Shakhova, N. E., Pipko, I. I., Pugach, S. P., Charkin, A. N., Dudarev, O. V.,Kosmach, D. A., and Nishino, S.: Space-time dynamics of carbon stocks and environmental5
parameters related to carbon dioxide emissions in the Buor-Khaya Bay of the Laptev Sea,Biogeosciences Discuss., 10, 2159–2204, doi:10.5194/bgd-10-2159-2013, 2013.
Stern, M. E., Chassignet, E. P., and Whitehead, J. A.: The wall jet in a rotating fluid, J. FluidMech., 335, 1–28, 1997.
Sutherland, D. A., Straneo, F., Lentz, S., and St-Laurent, P.: Observations of fresh, anticyclonic10
eddies in the Hudson Strait outflow, J. Mar. Syst., 88, 375–384, 2011.Vonk, J. E., Sanchez-Garcıa, L., Semiletov, I., Dudarev, O., Eglinton, T., Andersson, A., and
Gustafsson, O.: Molecular and radiocarbon constraints on sources and degradation of ter-restrial organic carbon along the Kolyma paleoriver transect, East Siberian Sea, Biogeo-sciences, 7, 3153–3166, doi:10.5194/bg-7-3153-2010, 2010.15
Vonk, J. E., Sanchez-Garcıa, L., van Dongen, B. E., Alling, V., Kosmach, D., Charkin, A.,Semiletov, I. P., Dudarev, O. V., Shakhova, N., Roos, P., Eglinton, T., Andersson, A., andGustafsson, O.: Activation of old carbon by erosion of coastal and subsea permafrost inArctic Siberia, Nature, 489, 137–140, 2012.
Wagner, D., Overduin, P. P., Grigoriev, M. N., Knoblauch, C., and Bolshiyanov, D. Y.: Russian–20
German cooperation System Laptev Sea: the expedition LENA 2008, Berichte zur Polar- undMeeresforschung, Alfred Wegener Institute for Polar and Marine Research, Bremerhaven,642, 132 pp., 2012.
Wegner, C., Holemann, J. A., Dmitrenko, I., Kirillov, S. A., Tuschling, K., Abramova, E., andKassens, H.: Suspended particulate matter on the Laptev Sea shelf (Siberian Arctic) during25
ice-free conditions, Estuar. Coast. Shelf Sci., 57, 55–64, 2003.Wegner, C., Holemann J. A., Dmitrenko, I., Kirillov, S. A., and Kassens, H.: Seasonal variations
in sediment dynamics on the Laptev Sea shelf (Siberian Arctic), Global Planet. Change, 48,126–140, 2005.
Wegner, C., Bauch, D., Holemann, J. A., Janout, M. A., Heim, B., Novikhin, A., Kirillov, S.,30
Kassens, H., and Timokhov, L.: Interannual variability of surface and bottom sediment trans-port on the Laptev Sea shelf during summer, Biogeosciences Discuss., 9, 13053–13084,doi:10.5194/bgd-9-13053-2012, 2012.
3876
BGD10, 3849–3889, 2013
Ocean Colourremote sensing in theSouthern Laptev Sea
B. Heim et al.
Title Page
Abstract Introduction
Conclusions References
Tables Figures
J I
J I
Back Close
Full Screen / Esc
Printer-friendly Version
Interactive Discussion
Discussion
Paper
|D
iscussionP
aper|
Discussion
Paper
|D
iscussionP
aper|
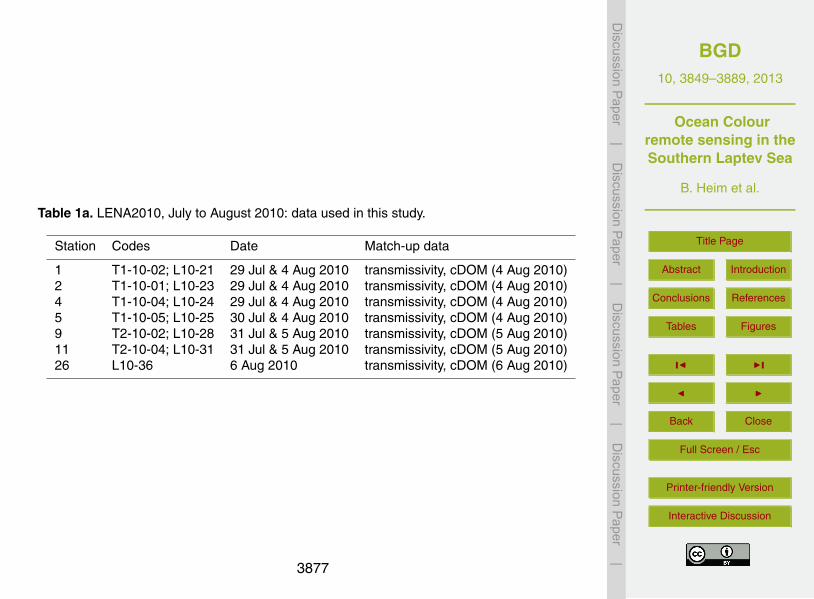
Table 1a. LENA2010, July to August 2010: data used in this study.
Station Codes Date Match-up data
1 T1-10-02; L10-21 29 Jul & 4 Aug 2010 transmissivity, cDOM (4 Aug 2010)2 T1-10-01; L10-23 29 Jul & 4 Aug 2010 transmissivity, cDOM (4 Aug 2010)4 T1-10-04; L10-24 29 Jul & 4 Aug 2010 transmissivity, cDOM (4 Aug 2010)5 T1-10-05; L10-25 30 Jul & 4 Aug 2010 transmissivity, cDOM (4 Aug 2010)9 T2-10-02; L10-28 31 Jul & 5 Aug 2010 transmissivity, cDOM (5 Aug 2010)11 T2-10-04; L10-31 31 Jul & 5 Aug 2010 transmissivity, cDOM (5 Aug 2010)26 L10-36 6 Aug 2010 transmissivity, cDOM (6 Aug 2010)
3877
BGD10, 3849–3889, 2013
Ocean Colourremote sensing in theSouthern Laptev Sea
B. Heim et al.
Title Page
Abstract Introduction
Conclusions References
Tables Figures
J I
J I
Back Close
Full Screen / Esc
Printer-friendly Version
Interactive Discussion
Discussion
Paper
|D
iscussionP
aper|
Discussion
Paper
|D
iscussionP
aper|
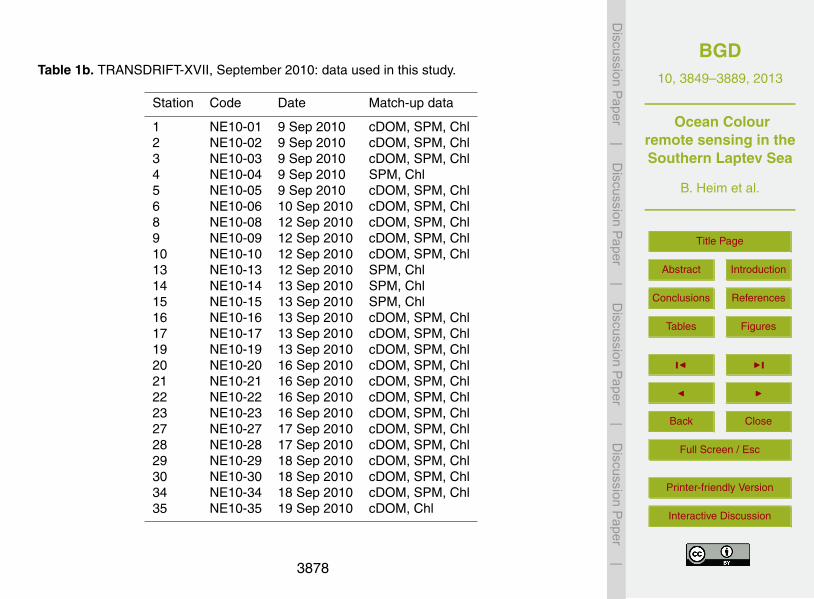
Table 1b. TRANSDRIFT-XVII, September 2010: data used in this study.
Station Code Date Match-up data
1 NE10-01 9 Sep 2010 cDOM, SPM, Chl2 NE10-02 9 Sep 2010 cDOM, SPM, Chl3 NE10-03 9 Sep 2010 cDOM, SPM, Chl4 NE10-04 9 Sep 2010 SPM, Chl5 NE10-05 9 Sep 2010 cDOM, SPM, Chl6 NE10-06 10 Sep 2010 cDOM, SPM, Chl8 NE10-08 12 Sep 2010 cDOM, SPM, Chl9 NE10-09 12 Sep 2010 cDOM, SPM, Chl10 NE10-10 12 Sep 2010 cDOM, SPM, Chl13 NE10-13 12 Sep 2010 SPM, Chl14 NE10-14 13 Sep 2010 SPM, Chl15 NE10-15 13 Sep 2010 SPM, Chl16 NE10-16 13 Sep 2010 cDOM, SPM, Chl17 NE10-17 13 Sep 2010 cDOM, SPM, Chl19 NE10-19 13 Sep 2010 cDOM, SPM, Chl20 NE10-20 16 Sep 2010 cDOM, SPM, Chl21 NE10-21 16 Sep 2010 cDOM, SPM, Chl22 NE10-22 16 Sep 2010 cDOM, SPM, Chl23 NE10-23 16 Sep 2010 cDOM, SPM, Chl27 NE10-27 17 Sep 2010 cDOM, SPM, Chl28 NE10-28 17 Sep 2010 cDOM, SPM, Chl29 NE10-29 18 Sep 2010 cDOM, SPM, Chl30 NE10-30 18 Sep 2010 cDOM, SPM, Chl34 NE10-34 18 Sep 2010 cDOM, SPM, Chl35 NE10-35 19 Sep 2010 cDOM, Chl
3878
BGD10, 3849–3889, 2013
Ocean Colourremote sensing in theSouthern Laptev Sea
B. Heim et al.
Title Page
Abstract Introduction
Conclusions References
Tables Figures
J I
J I
Back Close
Full Screen / Esc
Printer-friendly Version
Interactive Discussion
Discussion
Paper
|D
iscussionP
aper|
Discussion
Paper
|D
iscussionP
aper|
28
1
Figure 1a: The southern Laptev Sea, Arctic Siberia (RU). Stations of the TRANSDRIFT-2
XVII ship expedition (from Sep 9 to 20, 2010) from the inner shelf to the outer shelf waters of 3
the Laptev Sea are displayed as triangles. Stations of the LENA2008 ship expedition south-4
east of the Lena River Delta (from Aug 9 to 14, 2008) are small symbols displayed as crosses. 5
Stations of the LENA2010 ship expedition in the Buor-Khaya Bay (from Jul 29 to Aug 7, 6
2010) are small symbols displayed as squares. 7
Taymir New
Siberian Islands
Lena River Delta
Laptev Sea
Fig. 1a. The southern Laptev Sea, Arctic Siberia (RU). Stations of the TRANSDRIFT-XVII shipexpedition (from 9 to 20 September 2010) from the inner shelf to the outer shelf waters of theLaptev Sea are displayed as triangles. Stations of the LENA2008 ship expedition south-eastof the Lena River Delta (from 9 to 14 August 2008) are small symbols displayed as crosses.Stations of the LENA2010 ship expedition in the Buor-Khaya Bay (from 29 July to 7 August2010) are small symbols displayed as squares.
3879
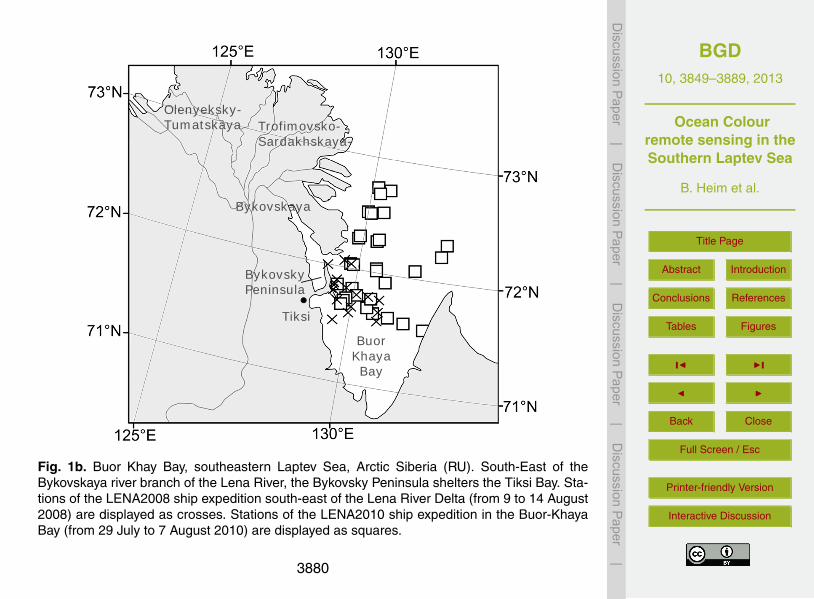
BGD10, 3849–3889, 2013
Ocean Colourremote sensing in theSouthern Laptev Sea
B. Heim et al.
Title Page
Abstract Introduction
Conclusions References
Tables Figures
J I
J I
Back Close
Full Screen / Esc
Printer-friendly Version
Interactive Discussion
Discussion
Paper
|D
iscussionP
aper|
Discussion
Paper
|D
iscussionP
aper|
29
1
Figure 1b: Buor Khay Bay, southeastern Laptev Sea, Arctic Siberia (RU). South-East of the 2
Bykovskaya river branch of the Lena River, the Bykovsky Peninsula shelters the Tiksi Bay. 3
Stations of the LENA2008 ship expedition south-east of the Lena River Delta (from Aug 9 to 4
14, 2008) are displayed as crosses. Stations of the LENA2010 ship expedition in the Buor-5
Khaya Bay (from Jul. 29 to Aug 7, 2010) are displayed as squares. 6
7
8
Bykovsky Peninsula
Buor Khaya Bay
Bykovskaya
Olenyeksky- Tumatskaya
Tiksi
Trofimovsko- Sardakhskaya-
Fig. 1b. Buor Khay Bay, southeastern Laptev Sea, Arctic Siberia (RU). South-East of theBykovskaya river branch of the Lena River, the Bykovsky Peninsula shelters the Tiksi Bay. Sta-tions of the LENA2008 ship expedition south-east of the Lena River Delta (from 9 to 14 August2008) are displayed as crosses. Stations of the LENA2010 ship expedition in the Buor-KhayaBay (from 29 July to 7 August 2010) are displayed as squares.
3880
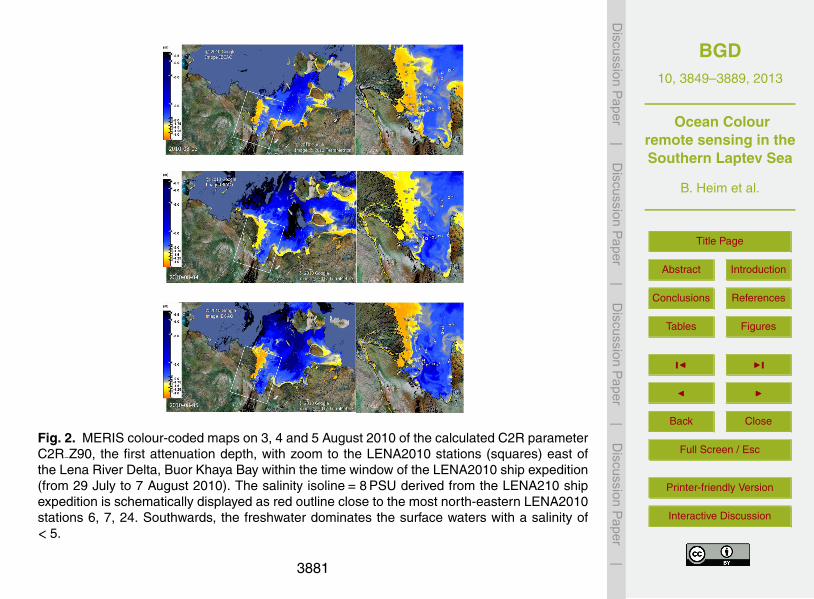
BGD10, 3849–3889, 2013
Ocean Colourremote sensing in theSouthern Laptev Sea
B. Heim et al.
Title Page
Abstract Introduction
Conclusions References
Tables Figures
J I
J I
Back Close
Full Screen / Esc
Printer-friendly Version
Interactive Discussion
Discussion
Paper
|D
iscussionP
aper|
Discussion
Paper
|D
iscussionP
aper|
30
Figure 2: MERIS colour-coded maps on Aug 3,4 and 5 2010 of the calculated C2R parameter 1
C2R_Z90, the first attenuation depth, with zoom to the LENA2010 stations (squares) east of 2
the Lena River Delta, Buor Khaya Bay within the time window of the LENA2010 ship 3
expedition (from Jul 29 to Aug 7, 2010). The salinity isoline = 8 PSU derived from the 4
Fig. 2. MERIS colour-coded maps on 3, 4 and 5 August 2010 of the calculated C2R parameterC2R Z90, the first attenuation depth, with zoom to the LENA2010 stations (squares) east ofthe Lena River Delta, Buor Khaya Bay within the time window of the LENA2010 ship expedition(from 29 July to 7 August 2010). The salinity isoline= 8 PSU derived from the LENA210 shipexpedition is schematically displayed as red outline close to the most north-eastern LENA2010stations 6, 7, 24. Southwards, the freshwater dominates the surface waters with a salinity of< 5.
3881
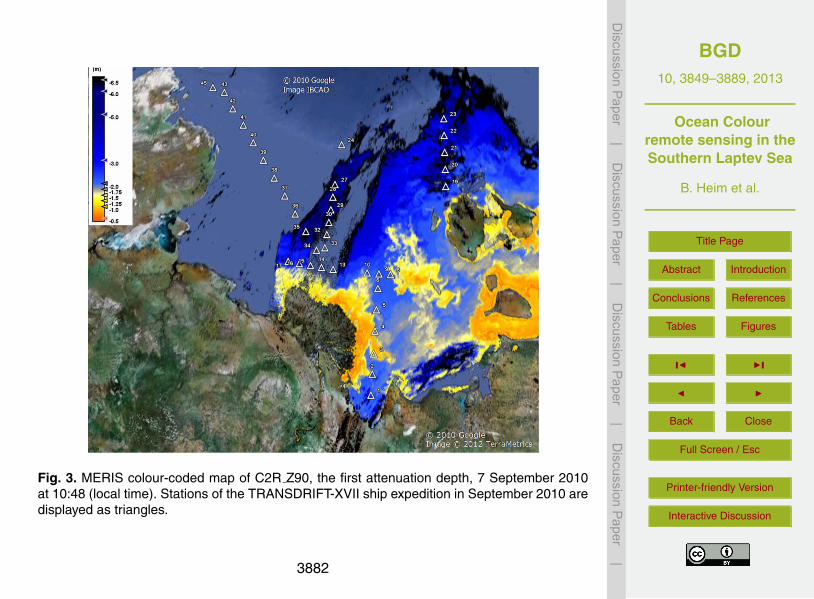
BGD10, 3849–3889, 2013
Ocean Colourremote sensing in theSouthern Laptev Sea
B. Heim et al.
Title Page
Abstract Introduction
Conclusions References
Tables Figures
J I
J I
Back Close
Full Screen / Esc
Printer-friendly Version
Interactive Discussion
Discussion
Paper
|D
iscussionP
aper|
Discussion
Paper
|D
iscussionP
aper|
32
1
Figure 3: MERIS colour-coded map of C2R_Z90, the first attenuation depth, Sept. 7, 2010 at 2
10:48 (local time). Stations of the TRANSDRIFT-XVII ship expedition in September 2010 3
are displayed as triangles. 4
Fig. 3. MERIS colour-coded map of C2R Z90, the first attenuation depth, 7 September 2010at 10:48 (local time). Stations of the TRANSDRIFT-XVII ship expedition in September 2010 aredisplayed as triangles.
3882
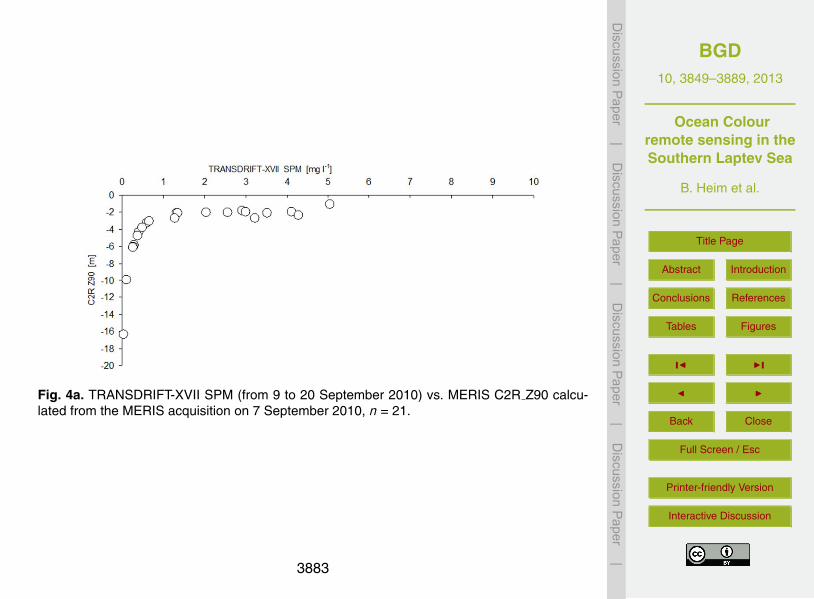
BGD10, 3849–3889, 2013
Ocean Colourremote sensing in theSouthern Laptev Sea
B. Heim et al.
Title Page
Abstract Introduction
Conclusions References
Tables Figures
J I
J I
Back Close
Full Screen / Esc
Printer-friendly Version
Interactive Discussion
Discussion
Paper
|D
iscussionP
aper|
Discussion
Paper
|D
iscussionP
aper|
33
1
Figure 4a: TRANSDRIFT-XVII SPM (from Sep 9 to 20, 2010) vs. MERIS C2R_Z90 2
calculated from the MERIS acquisition on Sept 7, 2010, n=21. 3
4
Figure 4b: TRANSDRIFT-XVII & LENA2010 cDOM440 vs. MERIS C2R-Z90. LENA2010: 5
C2R_Z90 was taken from the most MERIS concomitant acquisitions closest in time to the 6
sampling: Aug 3, Aug 4, Aug 6 2010 and was matched with LENA2010 cDOM440 7
respectively, n=7. TRANSDRIFT-XVII: C2R_Z90 was taken from Sep 7, 2010, and matched 8
with cDOM440 (Sep 9 to 12, 2010) using all available pixels within relatively homogenous 9
environments, but of satellite acquisition 2 to 5 days later, n=22. 10
11
Fig. 4a. TRANSDRIFT-XVII SPM (from 9 to 20 September 2010) vs. MERIS C2R Z90 calcu-lated from the MERIS acquisition on 7 September 2010, n = 21.
3883
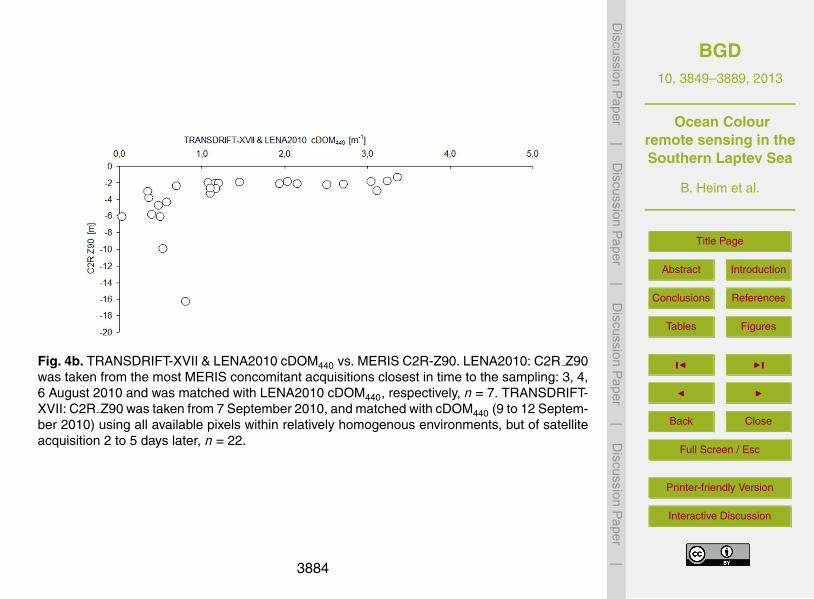
BGD10, 3849–3889, 2013
Ocean Colourremote sensing in theSouthern Laptev Sea
B. Heim et al.
Title Page
Abstract Introduction
Conclusions References
Tables Figures
J I
J I
Back Close
Full Screen / Esc
Printer-friendly Version
Interactive Discussion
Discussion
Paper
|D
iscussionP
aper|
Discussion
Paper
|D
iscussionP
aper|
33
1
Figure 4a: TRANSDRIFT-XVII SPM (from Sep 9 to 20, 2010) vs. MERIS C2R_Z90 2
calculated from the MERIS acquisition on Sept 7, 2010, n=21. 3
4
Figure 4b: TRANSDRIFT-XVII & LENA2010 cDOM440 vs. MERIS C2R-Z90. LENA2010: 5
C2R_Z90 was taken from the most MERIS concomitant acquisitions closest in time to the 6
sampling: Aug 3, Aug 4, Aug 6 2010 and was matched with LENA2010 cDOM440 7
respectively, n=7. TRANSDRIFT-XVII: C2R_Z90 was taken from Sep 7, 2010, and matched 8
with cDOM440 (Sep 9 to 12, 2010) using all available pixels within relatively homogenous 9
environments, but of satellite acquisition 2 to 5 days later, n=22. 10
11
Fig. 4b. TRANSDRIFT-XVII & LENA2010 cDOM440 vs. MERIS C2R-Z90. LENA2010: C2R Z90was taken from the most MERIS concomitant acquisitions closest in time to the sampling: 3, 4,6 August 2010 and was matched with LENA2010 cDOM440, respectively, n = 7. TRANSDRIFT-XVII: C2R Z90 was taken from 7 September 2010, and matched with cDOM440 (9 to 12 Septem-ber 2010) using all available pixels within relatively homogenous environments, but of satelliteacquisition 2 to 5 days later, n = 22.
3884
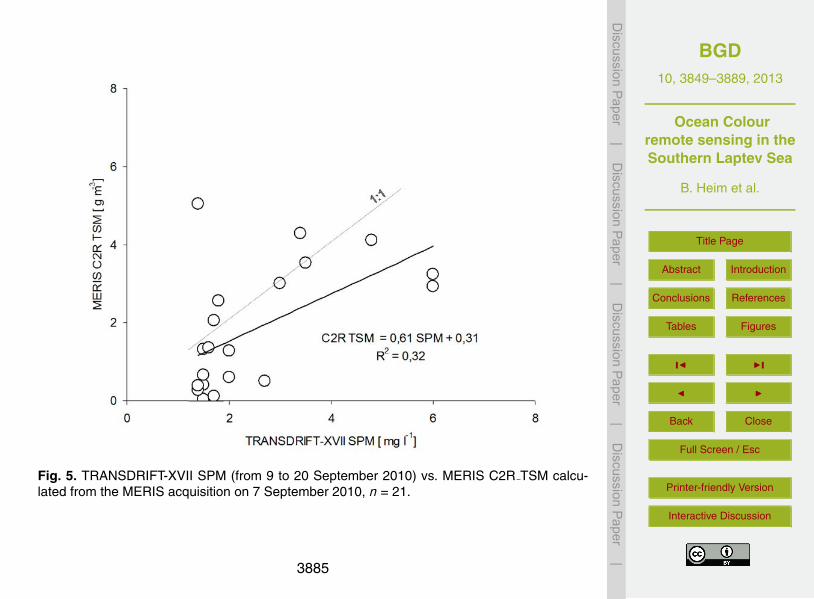
BGD10, 3849–3889, 2013
Ocean Colourremote sensing in theSouthern Laptev Sea
B. Heim et al.
Title Page
Abstract Introduction
Conclusions References
Tables Figures
J I
J I
Back Close
Full Screen / Esc
Printer-friendly Version
Interactive Discussion
Discussion
Paper
|D
iscussionP
aper|
Discussion
Paper
|D
iscussionP
aper|
34
1
Figure 5: TRANSDRIFT-XVII SPM (from Sep 9 to 20, 2010) vs. MERIS C2R_TSM 2
calculated from the MERIS acquisition on Sept. 7, 2010, n=21. 3
4
Fig. 5. TRANSDRIFT-XVII SPM (from 9 to 20 September 2010) vs. MERIS C2R TSM calcu-lated from the MERIS acquisition on 7 September 2010, n = 21.
3885
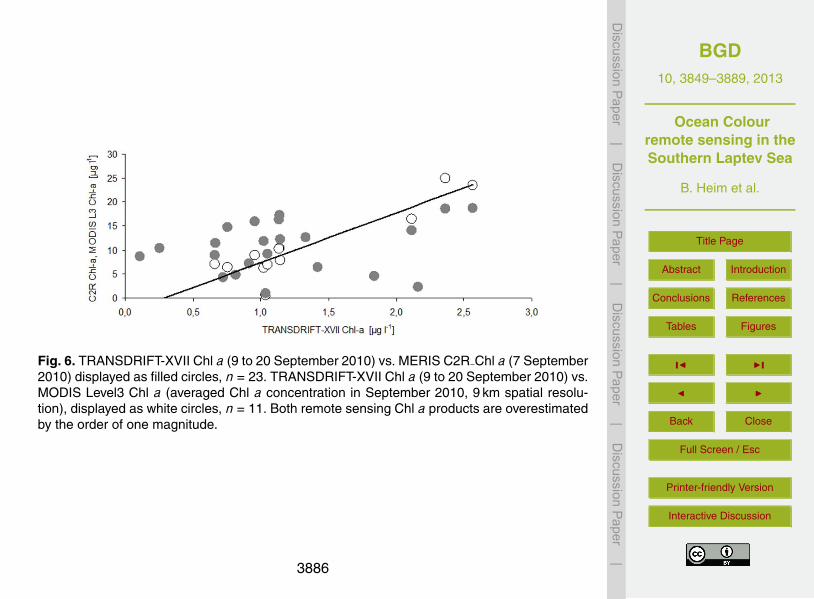
BGD10, 3849–3889, 2013
Ocean Colourremote sensing in theSouthern Laptev Sea
B. Heim et al.
Title Page
Abstract Introduction
Conclusions References
Tables Figures
J I
J I
Back Close
Full Screen / Esc
Printer-friendly Version
Interactive Discussion
Discussion
Paper
|D
iscussionP
aper|
Discussion
Paper
|D
iscussionP
aper|
35
1
Figure 6: TRANSDRIFT-XVII Chl-a (Sep 9 to 20, 2010) vs. MERIS C2R_Chl-a (Sep 7, 2
2010) displayed as filled circles, n=23. TRANSDRIFT-XVII Chl-a (Sep 9 to 20, 2010) vs. 3
MODIS Level3 Chl-a (averaged Chl-a concentration in September 2010, 9 km spatial 4
resolution), displayed as white circles, n=11. Both remote sensing Chl-a products are 5
overestimated by the order of one magnitude. 6
7
Figure 7: TRANSDRIFT-XVII acDOM440 (from Sep 9 to 20, 2010) vs. MERIS C2R_Chl-a 8
calculated from the MERIS acquisition on Sept. 7, 2010, n=23. 9
10
Fig. 6. TRANSDRIFT-XVII Chl a (9 to 20 September 2010) vs. MERIS C2R Chl a (7 September2010) displayed as filled circles, n = 23. TRANSDRIFT-XVII Chl a (9 to 20 September 2010) vs.MODIS Level3 Chl a (averaged Chl a concentration in September 2010, 9 km spatial resolu-tion), displayed as white circles, n = 11. Both remote sensing Chl a products are overestimatedby the order of one magnitude.
3886
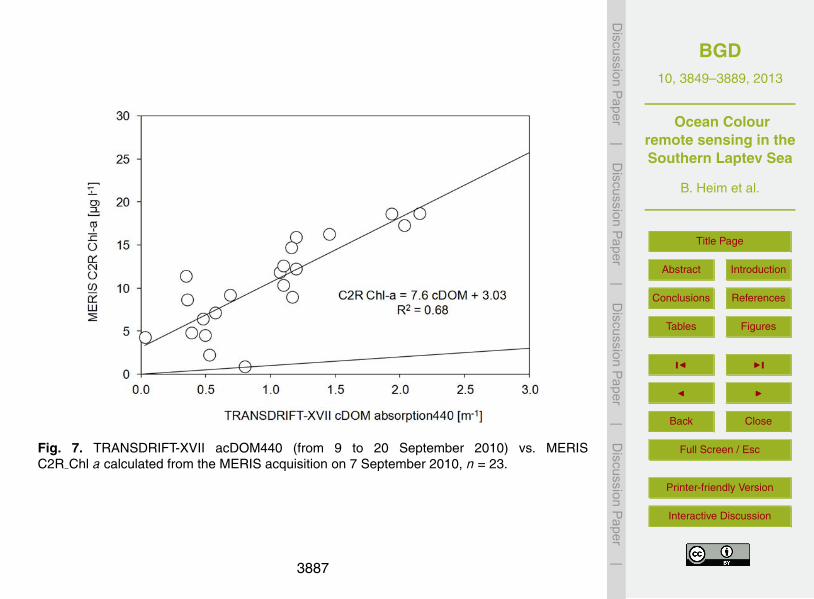
BGD10, 3849–3889, 2013
Ocean Colourremote sensing in theSouthern Laptev Sea
B. Heim et al.
Title Page
Abstract Introduction
Conclusions References
Tables Figures
J I
J I
Back Close
Full Screen / Esc
Printer-friendly Version
Interactive Discussion
Discussion
Paper
|D
iscussionP
aper|
Discussion
Paper
|D
iscussionP
aper|
35
1
Figure 6: TRANSDRIFT-XVII Chl-a (Sep 9 to 20, 2010) vs. MERIS C2R_Chl-a (Sep 7, 2
2010) displayed as filled circles, n=23. TRANSDRIFT-XVII Chl-a (Sep 9 to 20, 2010) vs. 3
MODIS Level3 Chl-a (averaged Chl-a concentration in September 2010, 9 km spatial 4
resolution), displayed as white circles, n=11. Both remote sensing Chl-a products are 5
overestimated by the order of one magnitude. 6
7
Figure 7: TRANSDRIFT-XVII acDOM440 (from Sep 9 to 20, 2010) vs. MERIS C2R_Chl-a 8
calculated from the MERIS acquisition on Sept. 7, 2010, n=23. 9
10
Fig. 7. TRANSDRIFT-XVII acDOM440 (from 9 to 20 September 2010) vs. MERISC2R Chl a calculated from the MERIS acquisition on 7 September 2010, n = 23.
3887
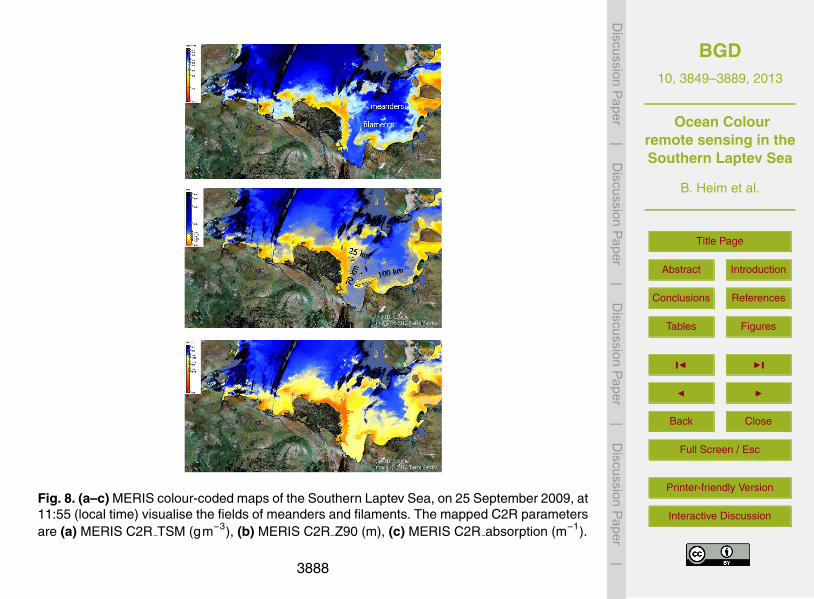
BGD10, 3849–3889, 2013
Ocean Colourremote sensing in theSouthern Laptev Sea
B. Heim et al.
Title Page
Abstract Introduction
Conclusions References
Tables Figures
J I
J I
Back Close
Full Screen / Esc
Printer-friendly Version
Interactive Discussion
Discussion
Paper
|D
iscussionP
aper|
Discussion
Paper
|D
iscussionP
aper|
36
1
Fig. 8. (a–c) MERIS colour-coded maps of the Southern Laptev Sea, on 25 September 2009, at11:55 (local time) visualise the fields of meanders and filaments. The mapped C2R parametersare (a) MERIS C2R TSM (gm−3), (b) MERIS C2R Z90 (m), (c) MERIS C2R absorption (m−1).
3888
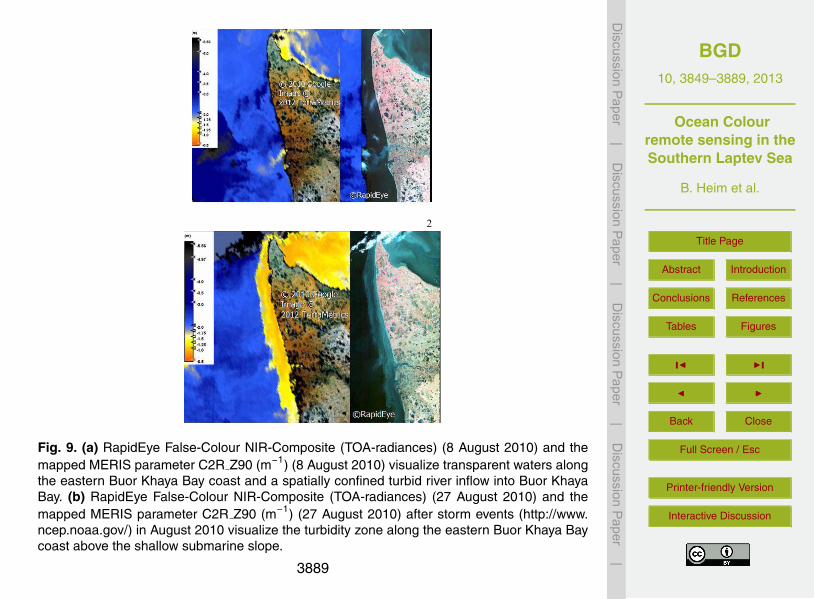
BGD10, 3849–3889, 2013
Ocean Colourremote sensing in theSouthern Laptev Sea
B. Heim et al.
Title Page
Abstract Introduction
Conclusions References
Tables Figures
J I
J I
Back Close
Full Screen / Esc
Printer-friendly Version
Interactive Discussion
Discussion
Paper
|D
iscussionP
aper|
Discussion
Paper
|D
iscussionP
aper|
38
1
. 2
3
4
5
6
7
8
9
10
Figure 9a: RapidEye False-Colour NIR-Composite (TOA-radiances) (Aug 8, 2010) and the 11
mapped MERIS parameter C2R_Z90 (m-1) (Aug 8, 2010) visualize transparent waters along 12
the eastern Buor Khaya Bay coast and a spatially confined turbid river inflow into Buor 13
Khaya Bay. Figure 9b: RapidEye False-Colour NIR-Composite (TOA-radiances) (Aug 27, 14
2010) and the mapped MERIS parameter C2R_Z90 (m-1) (Aug 27, 2010) after storm events 15
(http://www.ncep.noaa.gov/) in August 2010 visualize the turbidity zone along the eastern 16
Buor Khaya Bay coast above the shallow submarine slope. 17
18
Fig. 9. (a) RapidEye False-Colour NIR-Composite (TOA-radiances) (8 August 2010) and themapped MERIS parameter C2R Z90 (m−1) (8 August 2010) visualize transparent waters alongthe eastern Buor Khaya Bay coast and a spatially confined turbid river inflow into Buor KhayaBay. (b) RapidEye False-Colour NIR-Composite (TOA-radiances) (27 August 2010) and themapped MERIS parameter C2R Z90 (m−1) (27 August 2010) after storm events (http://www.ncep.noaa.gov/) in August 2010 visualize the turbidity zone along the eastern Buor Khaya Baycoast above the shallow submarine slope.
3889