Embed Size (px)
Citation preview

Ocean Dimensions and Shapes
Reading: Talley et al. (2011): Chapter 2

Geography
The oceans are basins in the surface of the solid earth containing salt water
• Major ocean areasThe Southern Ocean (south of 30o-40oS) The Atlantic Ocean (Younger, expanding, a few centimeters/year) The Pacific Ocean (Older, ringed with trenches and volcanoes)The Indian Ocean The Arctic Ocean
These regions are distinguished in terms of land masses (last four) and oceanographic characteristics (circulations, the Southern Ocean)
• Other smaller water basin - Marginal seas (fairly large basins of salt water that are bounded by land or island chains and connected to the open ocean by one or more fairly narrow channels, sometimes called Mediterranean seas)
Mediterranean SeaThe Caribbean SeaThe Sea of Japan (The East Sea)The Bering Sea(The Arctic Ocean)etc………
• Areas of open oceans are sometimes also referred to as "seas", mainly for historical reasons and geographical convenience, or local distinguishing oceanographic characteristics (examples: Greenland, Norwegian, Iceland, Labrador, Weddell, Ross, Arabian Seas, Bay of Bengal etc.)

FIGURE 2.1
TALLEY Copyright © 2011 Elsevier Inc. All rights reserved
Map of the world based on ship soundings and satellite altimeter derived gravity at 30 arc-second resolution. Data from Smith & Sandwell (1997); Becker et al. (2009); and SIO (2008).

FIGURE 2.8
Map of the Pacific Ocean. Etopo2 bathymetry data from NOAA NGDC (2008).
TALLEY Copyright © 2011 Elsevier Inc. All rights reserved
Numerous marginal sease.g.,Bering SeaOkhotsk SeaJapan or East SeaYellow SeaEast China SeaSouth China SeaCoral SeaTasman SeaGulf of Californiaetc

Map of the Atlantic Ocean. Etopo2 bathymetry data from NOAA NGDC (2008).
TALLEY Copyright © 2011 Elsevier Inc. All rights reserved
FIGURE 2.9

FIGURE 2.10
Map of the Indian Ocean. Etopo2 bathymetry data from NOAA NGDC (2008).
TALLEY Copyright © 2011 Elsevier Inc. All rights reserved
Major Marginal Seas
Anaman SeaRed SeaPersian Gulf

FIGURE 2.11
The Arctic Ocean. Etopo2 bathymetry data from NOAA NGDC (2008).
TALLEY Copyright © 2011 Elsevier Inc. All rights reserved
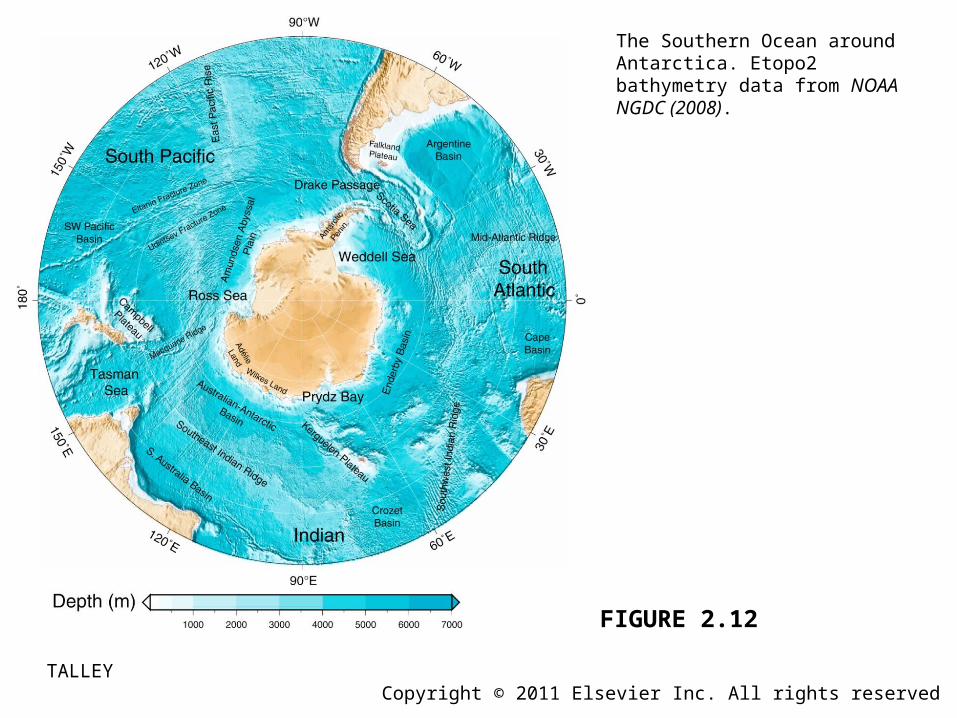
FIGURE 2.12
The Southern Ocean around Antarctica. Etopo2 bathymetry data from NOAA NGDC (2008).
TALLEY Copyright © 2011 Elsevier Inc. All rights reserved
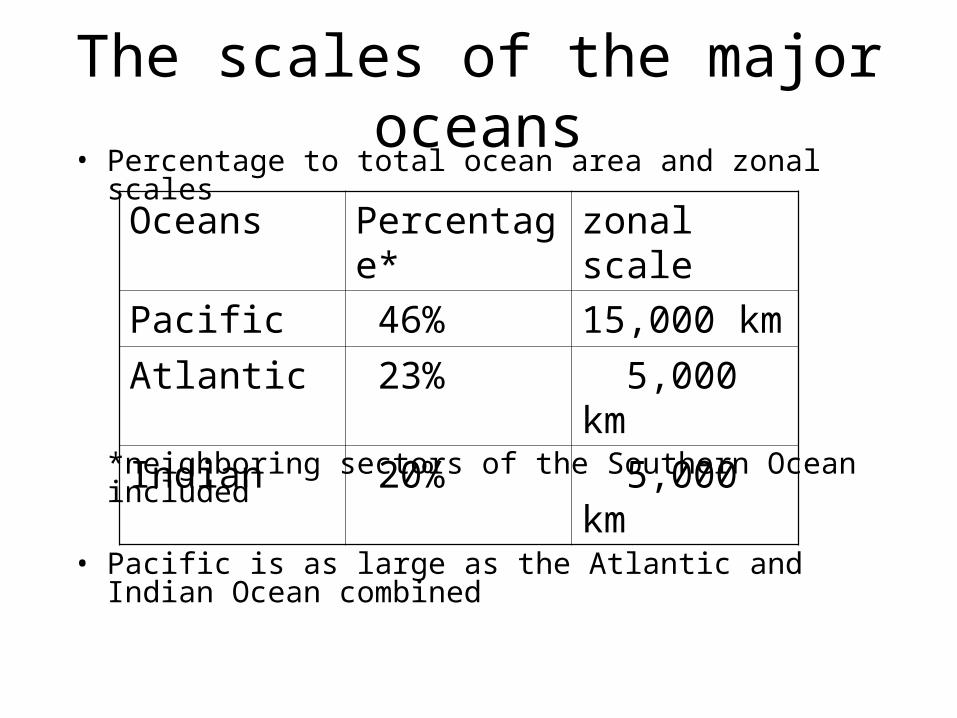
The scales of the major oceans• Percentage to total ocean area and zonal scales
*neighboring sectors of the Southern Ocean included
• Pacific is as large as the Atlantic and Indian Ocean combined
Oceans Percentage* zonal scale
Pacific 46% 15,000 km
Atlantic 23% 5,000 km
Indian 20% 5,000 km

Basic Ocean-Land Comparison• Percentage of earth covered by sea (71%) and by land (29%).
(70.96% Becker et al., 2009)Land-sea ratio:
Southern hemisphere (1:4) Northern hemisphere (1:1.5)
• The oceans are much deeper than the land is highThe average ocean depth: ~4000 meters (3730 m)
Marginal seas: 1200 meters or less(the ratio of the horizontal and vertical scales are very large
generally scaled by 1/1000 in vertical sections)The average land elevation: 840 m (The smaller seas are generally about 1200 m deep or less)84% sea bottom is more than 2000 m deep (11% land surface is more than 2000 m)
• Maximum depth in the oceans: Mariana Trench (11,034 m)
• Maximum height on land: Mt. Everest: 8840 m

Histogram of elevations of land and depth of the sea floor as percentage of area of the Earth, in 50 m intervals showing the clear distinction between continents and sea floor. Right: Cumulative frequency curve of height. The curves are calculated from the ETOPO 30’ data set (Stuart 2007).

FIGURE 2.2
Areas of Earth’s surface above and below sea level as a percentage of the total area of Earth (in 100 m intervals). Data from Becker et al. (2009).
TALLEY Copyright © 2011 Elsevier Inc. All rights reserved

Sea Floor Charts and Data SetsETOPO-2: The sea-floor topography of the ocean with 3km resolution produced from satellite altimeter observations of the shape of the sea surface. From Smith and Sandwell.

Mid-ocean ridges

FIGURE 2.3
Sea floor age (millions of years). Black lines indicate tectonic plate boundaries. Source: From Müller, Sdrolias, Gaina, and Roest (2008).
TALLEY Copyright © 2011 Elsevier Inc. All rights reserved
Rate of spreadingMAR 2 cm/yearEPR 16 cm/year

FIGURE 2.4
Seafloor topography for a portion of (a) the fast-spreading EPR and (b) the slow-spreading MAR. Note the ridge at the EPR spreading center and rift valley at the MAR spreading center. This figure can also be found in the color insert. (Sandwell, personal communication, 2009.)
TALLEY Copyright © 2011 Elsevier Inc. All rights reserved
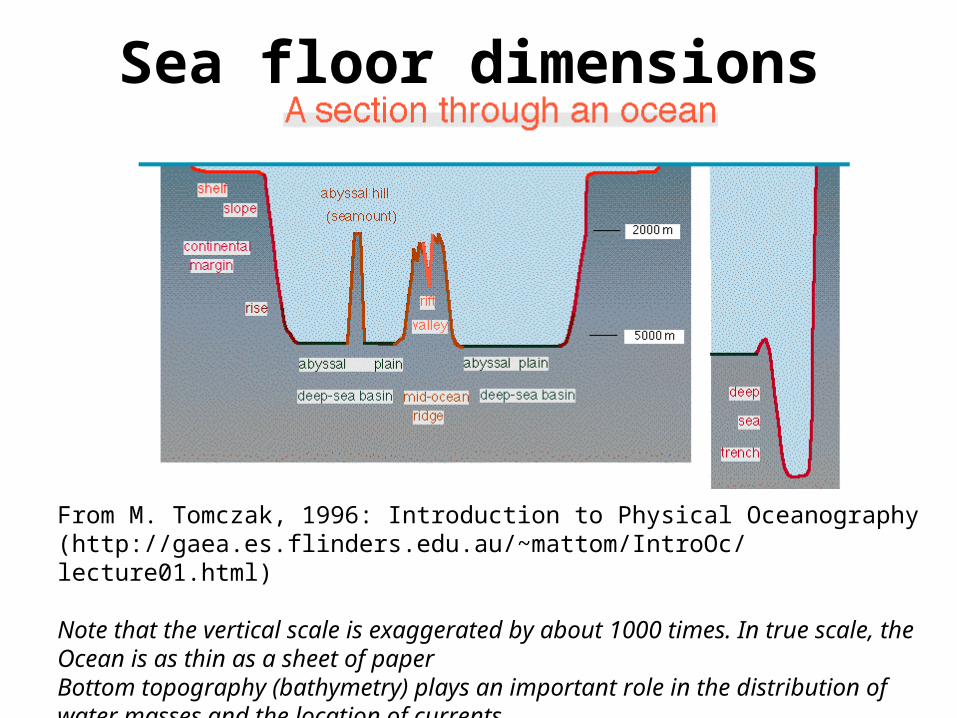
Sea floor dimensions
From M. Tomczak, 1996: Introduction to Physical Oceanography(http://gaea.es.flinders.edu.au/~mattom/IntroOc/lecture01.html)
Note that the vertical scale is exaggerated by about 1000 times. In true scale, the Ocean is as thin as a sheet of paperBottom topography (bathymetry) plays an important role in the distribution of water masses and the location of currents

FIGURE 2.5
(a) Schematic section through ocean floor to show principal features. (b) Sample of bathymetry, measured along the South Pacific ship track shown in (c).
TALLEY Copyright © 2011 Elsevier Inc. All rights reserved

Cross-Section of the South Atlantic along 25S showing the continental shelf offshore of South America, a seamount near 35W, the mid-Atlantic Ridge near 14W, the Walvis Ridge near 6E, and the narrow continental shelf off South America. Upper: Vertical exaggeration of 180:1. Lower: Vertical exaggeration of 30:1. If shown with true aspect ratio, the plot would be the thickness of the line at the sea surface in the lower plot (Stuart 2007).

Nomenclature of Topography• Continental margins:
Topography Width (km) Depth (m) Gradient
shelf 65 (up to 300) 130 (up to 200) 1/500~1/20
slope 20-100 200-4000 ~1/20
rise up to 300 4000-5000 1/700~1/1000
Continental rise is the lower part of the continental slope.
In general, continental slope is considerably steeper than the slope from lowland to highland on land.
A typical feature of the shelf and slope is the submarine canyons, carved by rivers usually in hard granite rocks or by the turbidity currents in softer sedimentary rocks.

FIGURE 2.7
Turbidity current evidence south of Newfoundland resulting from an earthquake in 1929. Source: FromHeezen, Ericson, and Ewing (1954).
TALLEY Copyright © 2011 Elsevier Inc. All rights reserved

• Deep-sea bottom: 3000-6000 m (74%, deeper 1%)Topography Horizontal scale Vertical scale Character
Abyssal plain very flat 2m/100km
Seamount ~1000m
Trench arch of a circle
narrow width
up to 11,000m deep
land or islands on one side
Mid-ocean ridge up to 400km wide
rise to1000-3000 m
global with fractured zones
Central rift valley 20-50 km wide cuts 1000-3000 m deep into ridge
Bottom topography is mapped by echo sounders, which measures the time taken for a pulse of sound to travel from the surface to the bottom, and, more recently, inferred from satellite measurements of the earth gravity fields.
Movement of the earth’s tectonic plates shapes the sea floor.
Mid-ocean ridge is a tectonic spreading center. There are narrow gaps in the ridge, called fracture zones.
Seamounts are virtually all volcanic in origin.
Trenches are the active locations where oceanic plates are sinking beneath other plates.
Sills refers to ridges beneath the sea level that separates one basin from another.

An example of a seamount, the Wilde guyot. A guyot is a seamount with a flat top created by wave action when the seamount extended above sea level. As the seamount is carried by plate motion, it gradually sinks deeper below sea level. The depth was contoured from echo sounder data collected along the ship track (thin straight lines) supplemented with side-scan sonar data. Depths are in units of 100 m. From William Sager, Texas A&M University.
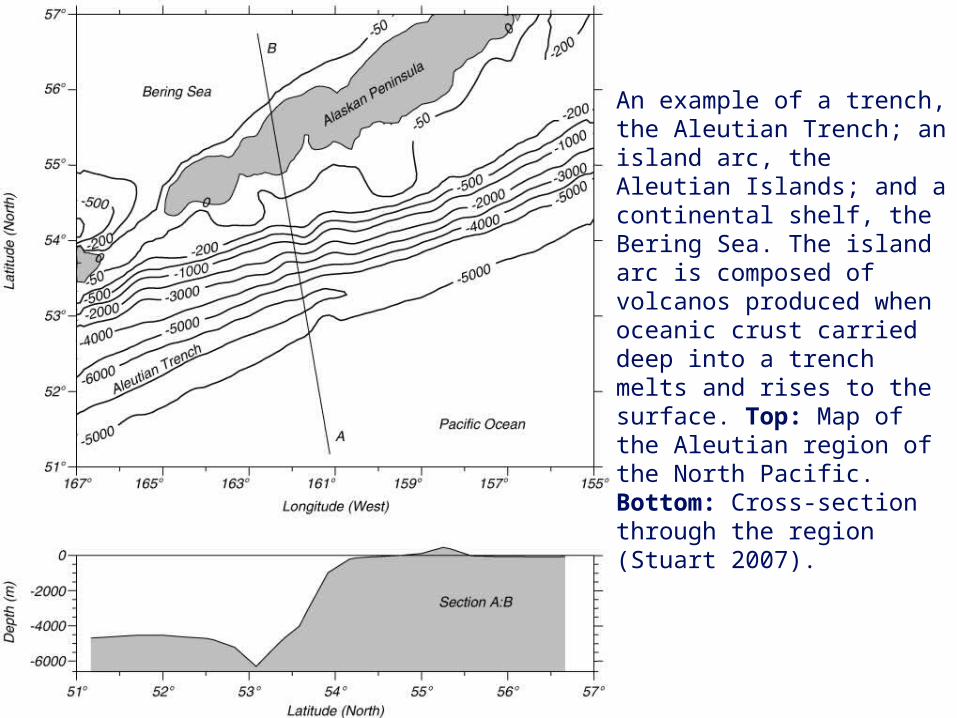
An example of a trench, the Aleutian Trench; an island arc, the Aleutian Islands; and a continental shelf, the Bering Sea. The island arc is composed of volcanos produced when oceanic crust carried deep into a trench melts and rises to the surface. Top: Map of the Aleutian region of the North Pacific. Bottom: Cross-section through the region (Stuart 2007).

Left: Echo sounders measure depth of the ocean by transmitting pulses of sound and observing the time required to receive the echo from the bottom. Right: The time is recorded by a spark burning a mark on a slowly moving roll of paper. From Dietrich, et al. (1980).The accuracy of depth also depends on the sound speed (c≈1480m/s), which is also a function primarily of temperature, less of pressure, and, to a much lesser extent, salinity. Errors also tend to be larger in regions of rapid depth change.

Figure 3.11 Locations of echo-sounder data used for mapping the ocean near Australia. Note the large areas where depths have not been measured from ships. From Sandwell.
Echo sounders make the most accurate measurements of ocean depth. Their accuracy is ±1%. The tracks, however, are not evenly distributed. In some areas, the sampling error can be large.

Seamounts are more dense than sea water,and they increase local gravity causing a plumb line at the sea surface (arrows) to be deflected toward the seamount. Because the surface of an ocean at rest must be perpendicular to gravity, the sea surface and the local geoid must have a slight bulge as shown. Such bulges are easily measured by satellite altimeters. As a result, satellite altimeter data can be used to map the sea floor. Note, the bulge at the sea surface is greatly exaggerated, a two-kilometer high seamount would produce a bulge of approximately 10m.Typical seamounts produce a bulge that is 1-20 m high over distances of 100-200 kilometers. By combining data from echo sounders with data from GEOSAT and ERS–1 altimeter systems, Smith and Sandwell (1997) produced maps of the sea floor with horizontal resolution of 3 km and depth accuracy of ±100 m.

Mean slope of the ocean bottom, calculated from shipboard bathymetry and interpolated to a 0.5 degree grid. Source: From Becker and Sandwell (2008).
TALLEY Copyright © 2011 Elsevier Inc. All rights reserved
FIGURE 2.6

• Property of pure water• Pressure• Temperature• Salinity• Density• Equation of State• Potential temperature• Static Stability
Physical Properties of Sea Water
Reading: Talley et al. (2011): Chapter 3Pond and Pickard (1983): Chapter 5

Definition of TermsDetermination: the actual direct measurement of a variable
Estimation: a value for one variable derived from the determination of one or more others
Accuracy: the difference between a result obtained and the true value
Precision: the difference between one result and the mean of several obtained by the same method, i.e., reproducibility
Systematic error: one which results from a basic (but unrealized) fault in the method and which causes values to be consistently different from the true value (cannot be detected by statistical analysis of values obtained and affects Accuracy)
Random error: one which results from basic limitations in the method. It is possible to determine a value for this type of error by statistical analysis of a sufficient number of measurements. It affects precision

Property of pure water
• Sea water is a mixture of 96.5% pure water and 3.5% other material, such as salts, dissolved gases, organic substances, and undissolved particles.
• Many physical properties of sea waters are determined by the 96.5% pure water.

Left diagram: Arrangement of the oxygen atom (O) and the two hydrogen atoms (H) in the water molecule. The angle between the positively charged hydrogen atoms is 105°, which is very close to the angles in a regular tetrahedron (109° 28'). Right diagram: Interaction of two water molecules in the tetrahedral arrangement of the hydrogen bond. The hydrogen atoms of the blue water molecule attach to the red water molecule in such a way that the four hydrogen atoms form a tetrahedron.
Consequences:1. The water molecule is an electric dipole (leads to water’s high dialectric constant). 2. Water has an unusually strong dissolving power, i.e. it splits dissolved material into electrically charged ions.3. Oxygen atoms in water try to have four hydrogen atoms attached to them to form a "hydrogen bond".

Water molecules form aggregates of single, two, four and eight molecules. At high temperatures the one and two molecule aggregates dominate; as the temperature falls the larger clusters begin to dominate. The larger clusters occupy less space than the same number of molecules in smaller clusters. As a result, the density of water shows a maximum at 4°C.
About 90% of all molecules form chains in normal temperatures.
Due to the energy that goes into chain formation, water has quite high heat capacity
Density decreases as the freezing point is approached. (Ice floats). In the sea water, salt tends to inhibit chain formation, the max density is at the freezing point, below 0oC.
Water has high heat of vaporization (liquid to gas) and fusion (solid to liquid), as well as high surface tension

Pressure (p)• Pressure is the normal force per unit area exerted by water
(or air in the atmosphere) on either side of the unit area.• Unit: 1 Pascal = 1 Newton/m2 = 10 dynes/cm2, or 1 bar = 105
Pascal = 106 dynes/cm2.• Force due to pressure difference is down the pressure
gradient.• Vertically, upward pressure gradient force is largely balanced
by gravity (the hydrostatic balance). p~0-1000 bar (A pressure change of 1 decibar (0.1bar) occurs over a depth change of slightly less than 1 meter).
• Horizontal variation of pressure is in the order of 0.1 bar (1 dbar) over 102-103 kilometers, much smaller than pressure change with depth.
• Accuracy of pressure measurement is 3 dbar.

Hydrostatic pressure:
where d is depth (instead of height)If we choose:=1000 kg/m3 (2-4% lower than of sea-water)g=10 m/s2 (2% higher than gravity)then p=1 decibar (db) is equivalent to 1 m of depth(p=1 db = 0.1 bar = 105 dyn/cm2 = 104 Pa (N/m2))• True d is 1-2% less than the equivalent decibar depth.• A pressure change of 1 dbar occurs over a depth change
of slightly less than 1 meter.
Pressure and Depth

Temperature: (T or t)
• Unit: Celsius scale (oC) in oceanography (sometimes Kelvin, K for heat content calculation, 0oC = 273.16K)
• Ocean range: -1.7oC (freezing point) to 30~31oC• Primary parameter determining density. especially in
mid- and lower latitude upper ocean• Major factor in influencing the atmosphere at the surface • Temperature profile provides information on circulation
features and sound speed distribution (primary parameter from surface to 500m)
• easier to measure than other oceanic properties

Temperature MeasurementThermometer (accuracy 0.004oC, precision 0.002oC)Thermistor (0.002oC, 0.0005-0.001oC)
In Situ Sea Surface temperature (SST) Measurements• Bucket-sample (prior to 1950s, thermometer)
wooden to canvas (1880-1890) bucket sampling causes cold bias of
SST in 1900s-1940s from the level between 1850s-1880s (accuracy
~0.1oC) • “Injection temperature” (1950s, thermistor)
measurements in the engine cooling intake water from 2m to 5m,
partially causes a warm bias after 1940 (accuracy 0.5-1oC)
• Bottles, XBTs, and CTDs
• In situ observations measure “bulk” temperature (0.5-5m)

Satellite SST measurement• Thermal infrared (IR) sensors (0.5-0.8K, textbook value)
Scanning Radiometer (SR), 8km resolution (early 1970s)Advanced Very High Resolution Radiometer (AVHRR), 1km, local precision 0.1oCCloud blocks IR totally and water vapor attenuates it (polar orbiting satellite since 1978)Atmospheric moisture correction using measurements from different channelA “blended SST analysis” combining AVHRR and in situ SST with 100km resolution is in wide use (Reynolds 1988; Reynolds and Smith 1994, 1995), Estimated Accuracy, ±0.3oC in the tropics, ±0.5oC near the western boundary (Reynolds, 2002)
• Passive microwave sensors (6-12GHz)Tropical Rainfall Mapping Mission (TRMM) Microwave Imager (TMI)through cloud layerslower resolution (25-50 km)
• Satellite measures the “skin layer” temperature “skin layer” is a very thin (< 1mm)“skin” temperature is usually more than 0.3o colder than bulk temperature
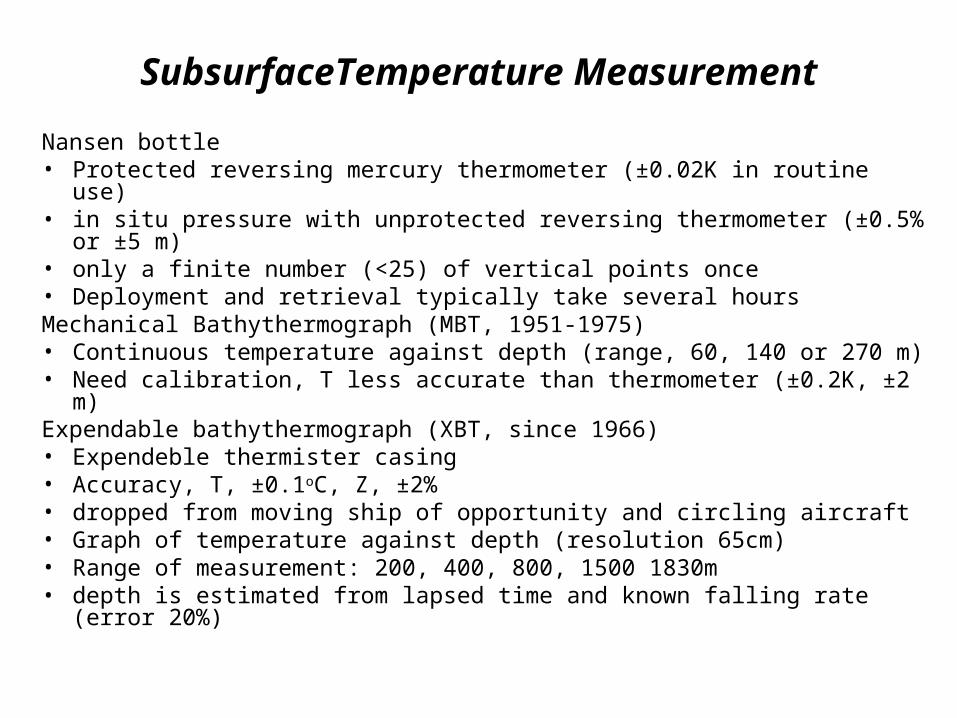
SubsurfaceTemperature Measurement
Nansen bottle• Protected reversing mercury thermometer (±0.02K in routine use) • in situ pressure with unprotected reversing thermometer (±0.5% or ±5
m)• only a finite number (<25) of vertical points once• Deployment and retrieval typically take several hours Mechanical Bathythermograph (MBT, 1951-1975) • Continuous temperature against depth (range, 60, 140 or 270 m) • Need calibration, T less accurate than thermometer (±0.2K, ±2 m)Expendable bathythermograph (XBT, since 1966) • Expendeble thermister casing • Accuracy, T, ±0.1oC, Z, ±2%• dropped from moving ship of opportunity and circling aircraft• Graph of temperature against depth (resolution 65cm)• Range of measurement: 200, 400, 800, 1500 1830m• depth is estimated from lapsed time and known falling rate (error 20%)

Bottle measurement: An ExampleFrom Knauss: Introduction to Physical Oceanography

Expendable bathythermograph (XBT)

Heat Content of Seawater
• Heat content of seawater is its thermodynamic energy• Heat content per unit volume (Joules ~ J)• T-measured temperature (K), ~ measured (derived)
sea water density (kg/m3)
• cp – specific heat of sea water (dependent on temperature, salinity and pressure, determined by lab experiments, Joules/(kg K))
• Flux of heat through the surface of the volume changes heat content (if there is no source inside the volume). Heat flux per unit area per unit time has the unit of (Joules/(m2 s))=Watts/m2 ~ W/m2

Specific heat of sea water at atmospheric pressure cp in joules per gram per degree Celsius as a function of temperature in Celsius and salinity in practical salinity units, calculated from the empirical formula given by Millero et al., (1973) using algorithms in Fofonoff and Millard (1983). The lower line is the freezing point of salt water.
cp 4.0 X 10³ J · kg-1 · °C-1
Heat Content

Simple Example
• What surface heat flux can cause a 100 m thick layer of seawater to cool by 1oC in 30 days?
• The total heat loss in 30 days is
• Typical values of
• Given values
• Surface heat flux