Embed Size (px)
Citation preview
June 2015
Liping Sun
Ocean Engineering Model Test at Harbin Engineering University
1. Introduction to DERC
2. Deepwater Offshore Basin in the World
3. Platform Motion Model Test
4. Riser Model Test
Outline
The Deepwater Engineering Research Center (DERC)
was established at HEU in the end of 2005.
In 2006 DERC got funding from Chinese Education
Ministry and Foreign Expert Bureau to build “Base on
Science and Technology of Deepwater Engineering ”
An active team of 15 foreign members and 15
internal members has been established.
Domestic members are from HEU whose major in
various NA&ME such as hydrodynamics, structure ,
CFD and so on.
Deepwater Engineering Research Center
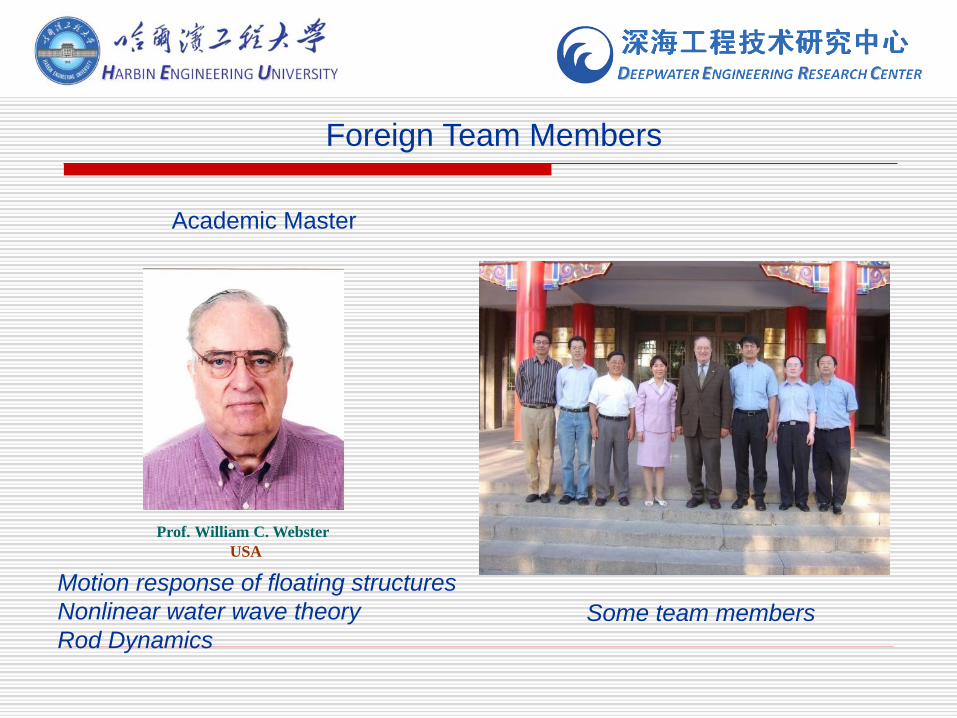
Academic Master
Foreign Team Members
Motion response of floating structures
Nonlinear water wave theory
Rod DynamicsSome team members
Prof. William C. Webster
USA
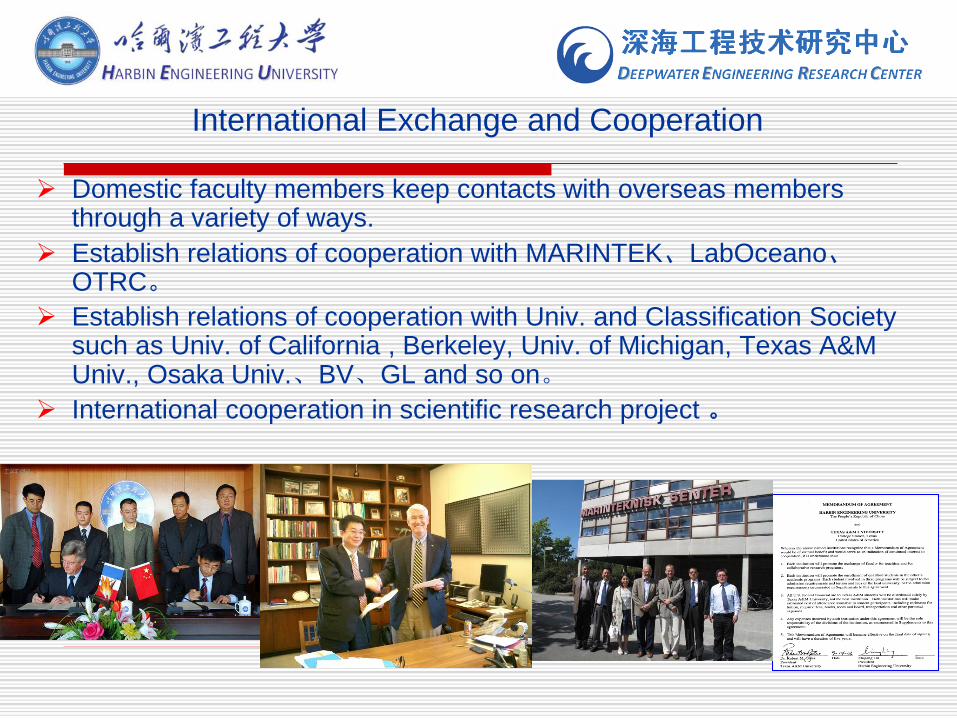
Domestic faculty members keep contacts with overseas members through a variety of ways.
Establish relations of cooperation with MARINTEK、LabOceano、OTRC。
Establish relations of cooperation with Univ. and Classification Society such as Univ. of California , Berkeley, Univ. of Michigan, Texas A&M Univ., Osaka Univ.、BV、GL and so on。
International cooperation in scientific research project 。
International Exchange and Cooperation
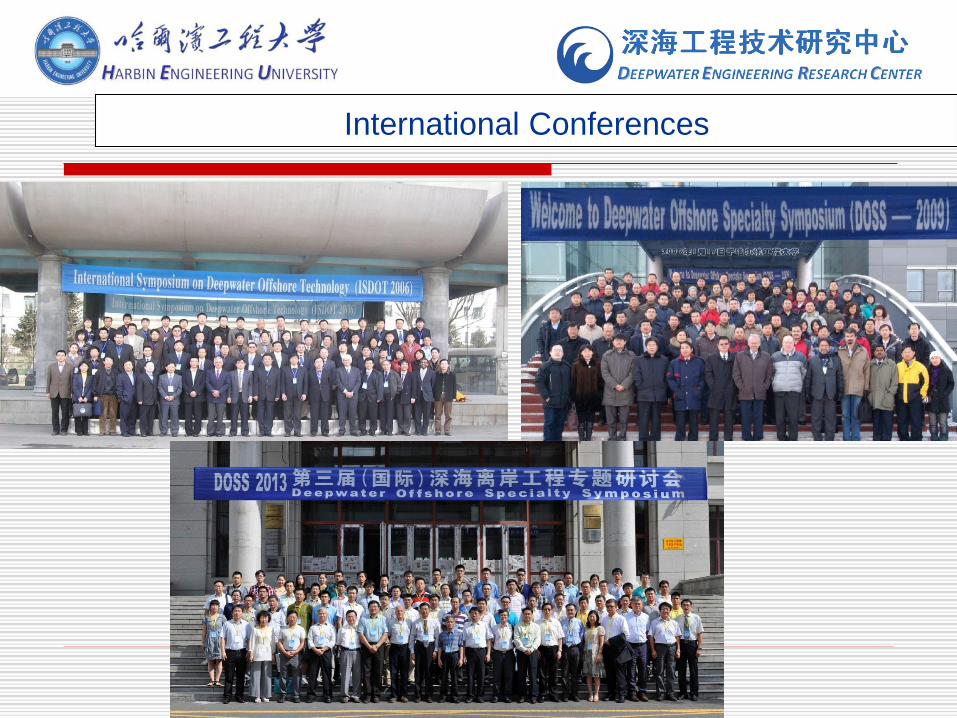
International Conferences
1. Introduction to DERC
2. Deepwater Offshore Basin in the
World
3. Platform Motion Model Test
4. Riser Model Test
Outline

MARIN Basin in Netherlands
Built in 2000,main dimensions 45m× 36m ×10.5m, pit:5mX 30m
Simulate wind, wave and current; on the 10.5m depth there is six layers
pipe to simulate shear current
Carriage moves in both X and Y direction,max. speed 3.2 m/s
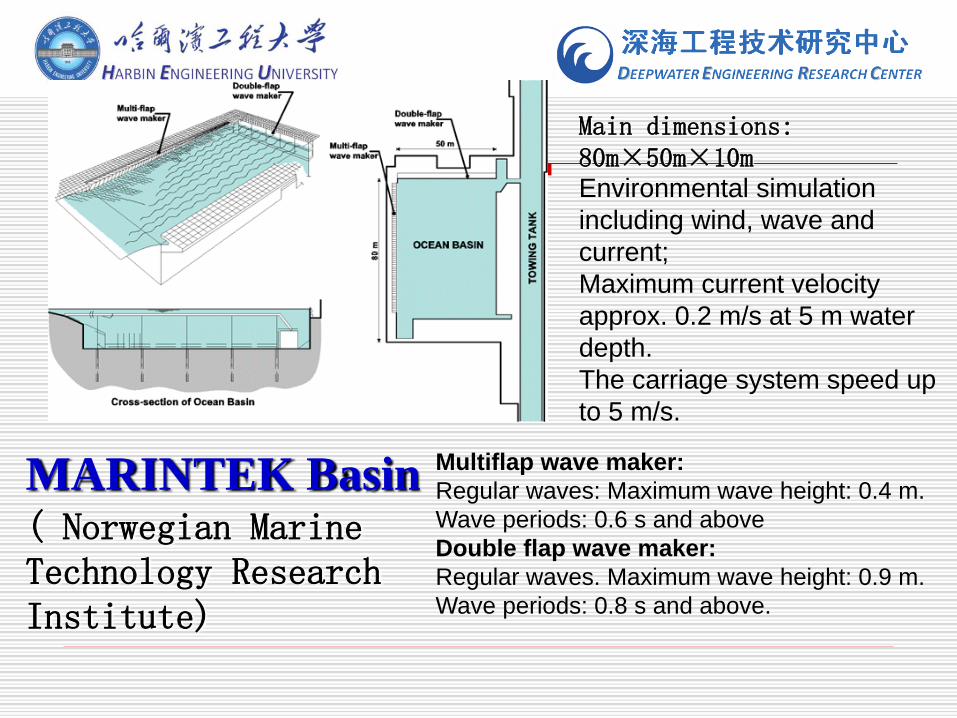
MARINTEK Basin( Norwegian Marine Technology Research Institute)
Main dimensions: 80m×50m×10mEnvironmental simulation
including wind, wave and
current;
Maximum current velocity
approx. 0.2 m/s at 5 m water
depth.
The carriage system speed up
to 5 m/s.
Multiflap wave maker:
Regular waves: Maximum wave height: 0.4 m.
Wave periods: 0.6 s and above
Double flap wave maker:
Regular waves. Maximum wave height: 0.9 m.
Wave periods: 0.8 s and above.
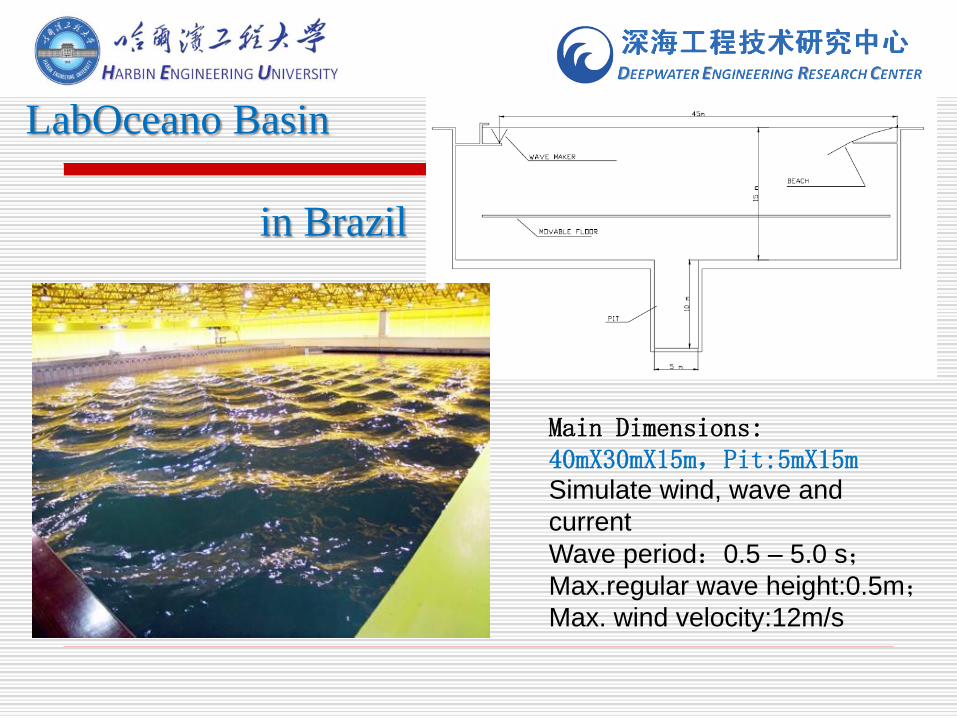
LabOceano Basin
in Brazil
Main Dimensions: 40mX30mX15m,Pit:5mX15mSimulate wind, wave and
current
Wave period:0.5 – 5.0 s;Max.regular wave height:0.5m;Max. wind velocity:12m/s
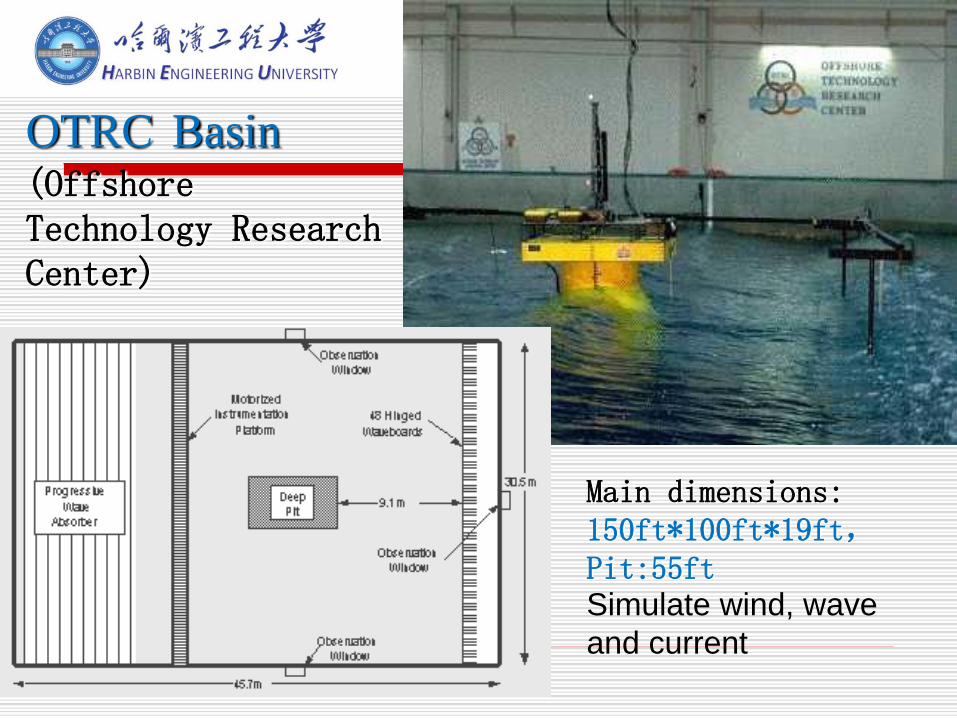
Main dimensions:150ft*100ft*19ft,Pit:55ftSimulate wind, wave
and current
OTRC Basin(Offshore Technology Research Center)
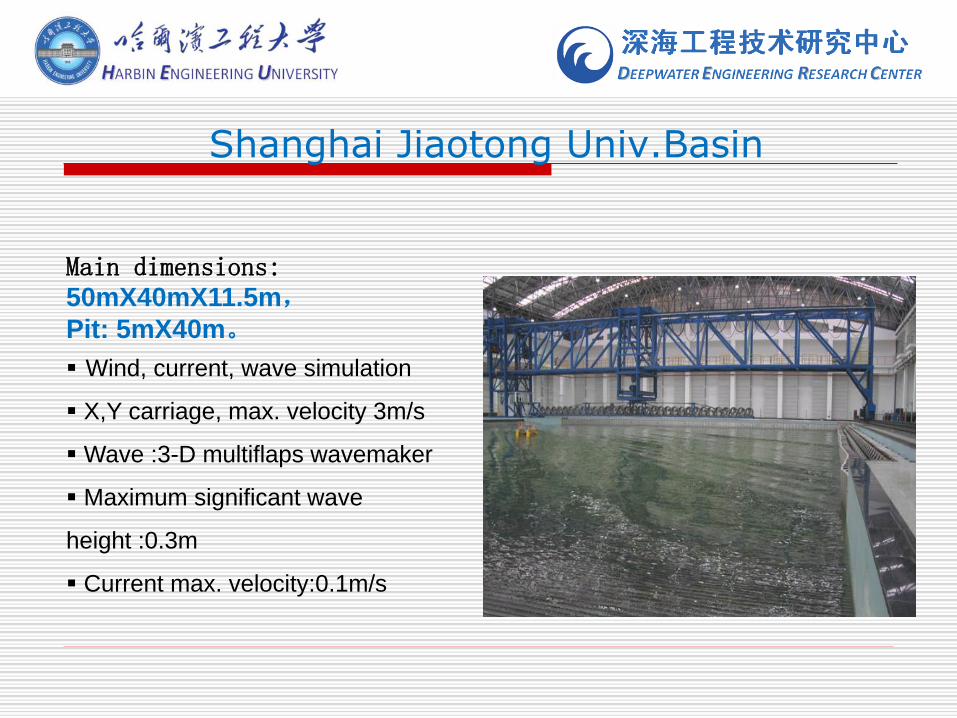
Shanghai Jiaotong Univ.Basin
Main dimensions:50mX40mX11.5m,Pit: 5mX40m。
Wind, current, wave simulation
X,Y carriage, max. velocity 3m/s
Wave :3-D multiflaps wavemaker
Maximum significant wave
height :0.3m
Current max. velocity:0.1m/s
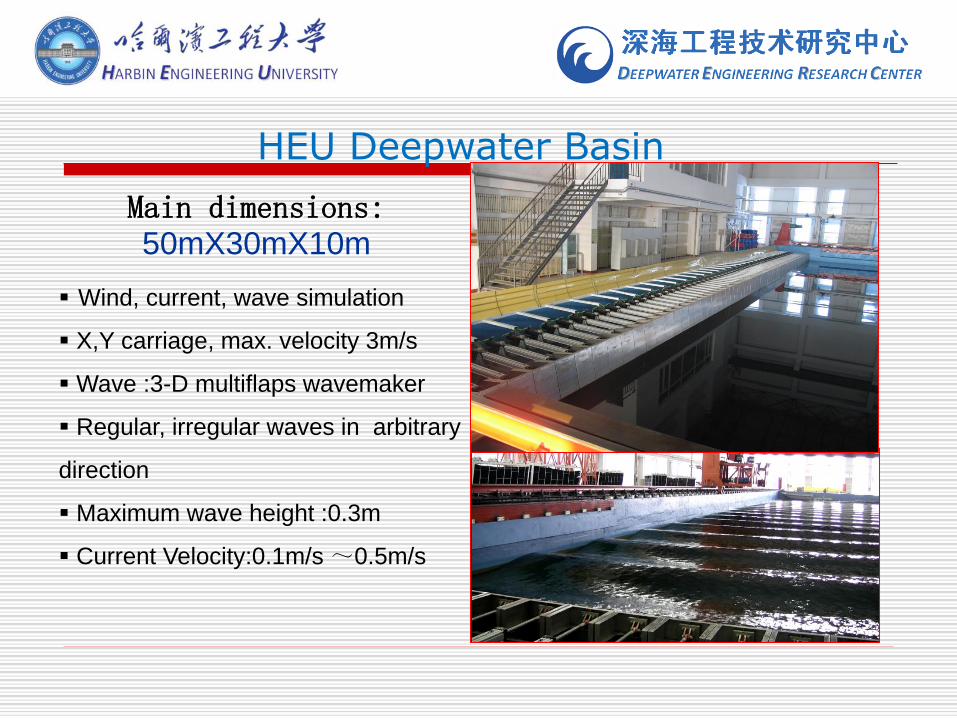
Main dimensions:50mX30mX10m
50m x 30m x 10m Wind, current, wave simulation
X,Y carriage, max. velocity 3m/s
Wave :3-D multiflaps wavemaker
Regular, irregular waves in arbitrary
direction
Maximum wave height :0.3m
Current Velocity:0.1m/s ~0.5m/s
HEU Deepwater Basin
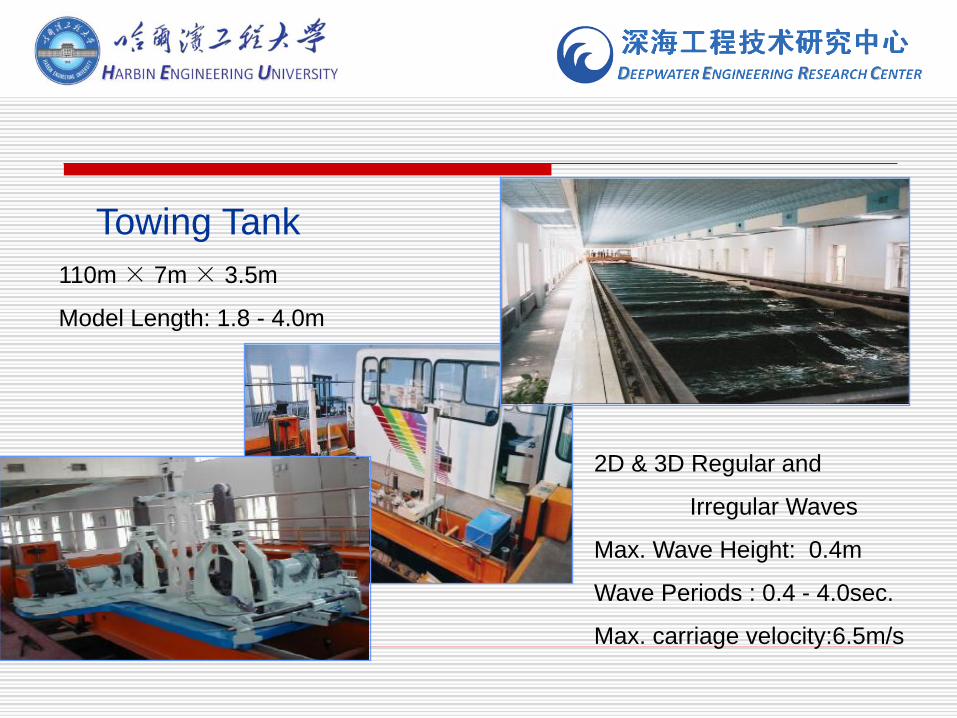
Towing Tank
110m × 7m × 3.5m
Model Length: 1.8 - 4.0m
2D & 3D Regular and
Irregular Waves
Max. Wave Height: 0.4m
Wave Periods : 0.4 - 4.0sec.
Max. carriage velocity:6.5m/s
1. Introduction to DERC
2. Offshore Basin in the World
3. Platform Motion Model Test
4. Riser Model Test
Outline

To demonstrate proof of concept
To verify design assumptions, factors and
allowances
Substantiate analytical technique
Problem difficult to handle analytically
To obtain empirical coefficients
To verify offshore operation
To validate the numerical model and design
analysis tools
To independently confirm the accuracy of
hydrodynamic performance of a particular design
The Purpose of Model Test
Size of model & facility -- depth limitation
Physical size of the basin requires mooring line
truncation. For a deepwater system of 3000m, the
deepest basin(15m) can only model the whole system
using a scale of about 1:200 which is far too small
Environment generation(e.g. current turbulence)
Instruments -- measurement accuracy
The number of test cases are limited
Scale distortion
catenary mooring & taut lines; risers & tendons
Model Tests Considerations
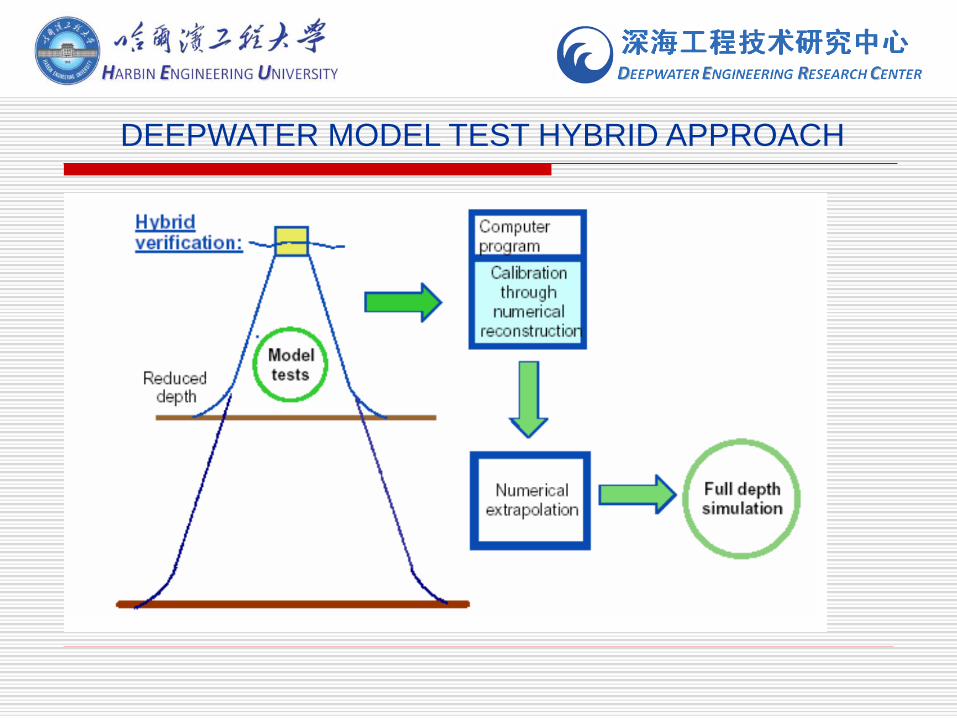
DEEPWATER MODEL TEST HYBRID APPROACH
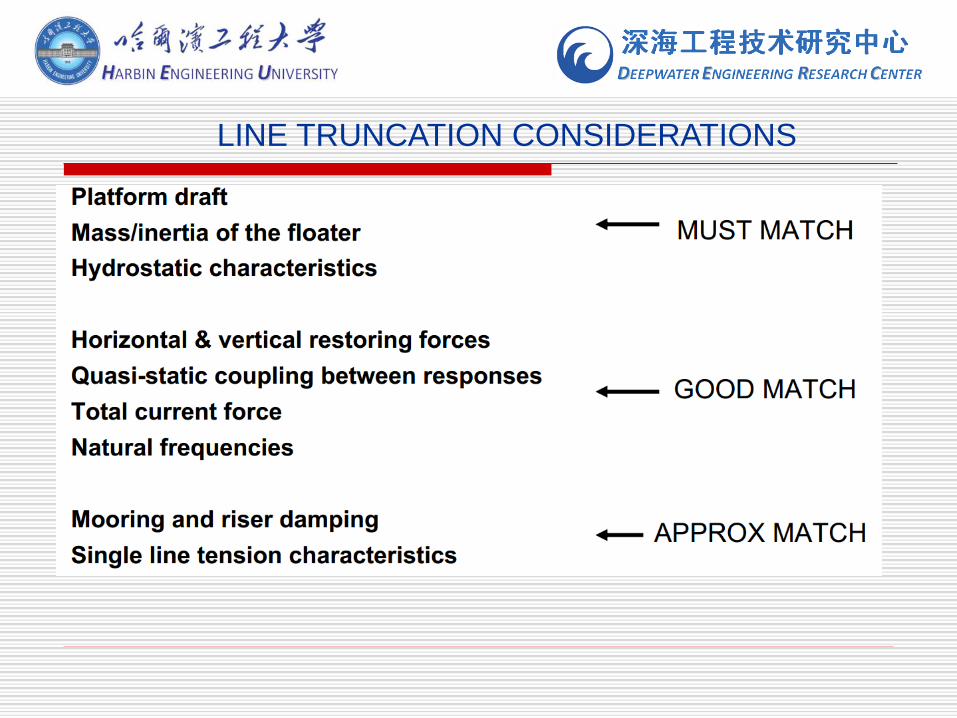
LINE TRUNCATION CONSIDERATIONS

Numerical Simulation and Model Test Study of FPSO and CALM System
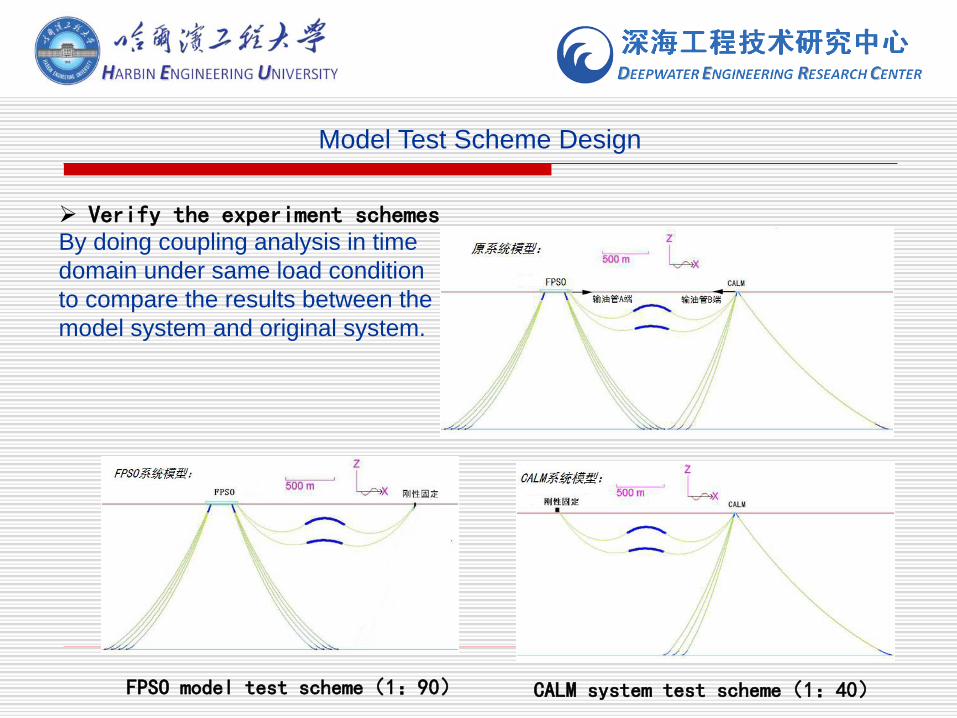
Verify the experiment schemesBy doing coupling analysis in time
domain under same load condition
to compare the results between the
model system and original system.
FPSO model test scheme(1:90) CALM system test scheme(1:40)
Model Test Scheme Design
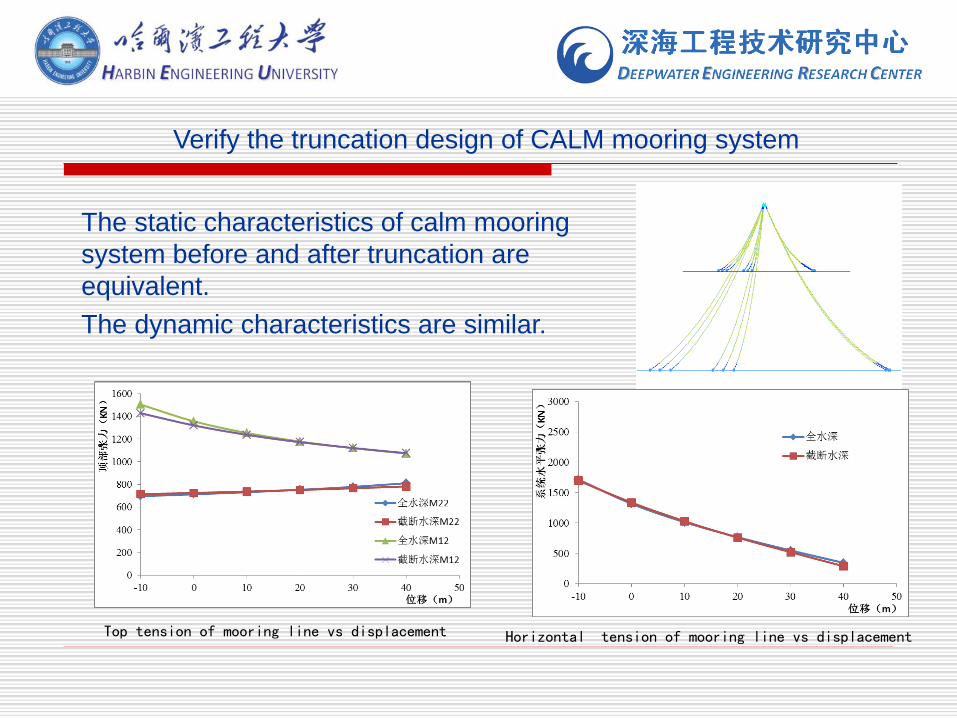
Top tension of mooring line vs displacement Horizontal tension of mooring line vs displacement
The static characteristics of calm mooring
system before and after truncation are
equivalent.
The dynamic characteristics are similar.
Verify the truncation design of CALM mooring system

(1)The coupling of CALM motion to FPSO can be
ignored for the FPSO preliminary design because of
the far distance of two bodies.
(2) The coupling effect of FPSO and OOL(Oil
Offloading Line) must be considered in the analysis of
FPSO's response because the top tension of the OOL
and the mooring line of FPSO have the same order of
magnitude.
(3)The influence of the FHSR on the movement
and the force of the FPSO system is minimal. It’s
influences on FPSO can be ignored.
Results
(4)Under West Africa environment FPSO’s motion is
controlled by Squall . So it’s the ultimate condition for the
FPSO strength check.
(5)The OOL is strongly influenced by the CALM
because the pipeline weight and the drainage volume of
buoy have the same order of magnitude.
(6) Plane motion of shuttle tanker will increase the
motion amplitude of the CALM buoy. But for the ultimate
strength check there is no need to consider effect of the
shuttle tanker because oil external operation usually
done in mild environment.
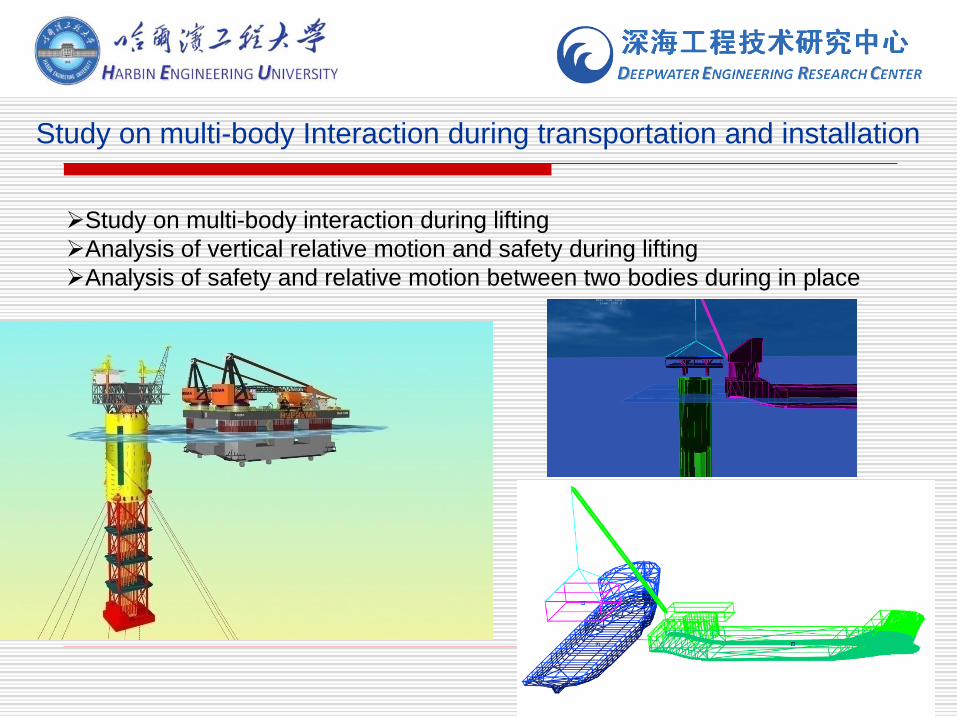
Study on multi-body Interaction during transportation and installation
Study on multi-body interaction during lifting
Analysis of vertical relative motion and safety during lifting
Analysis of safety and relative motion between two bodies during in place

Test of multi-body Response
Test scale: 1:60
Lifting test In-Place test
• The experimental purpose is to verify the numerical analysis model of
multi floating bodies.

multi-body system including,
• SPAR tank
• crane ship
• upper module
In the stage of in-place operation

Some safe operation environmental
conditions are suggested.
The maximum significant wave height
is suggested to be less than 2.0m
both for the lifting and in-place
operation。
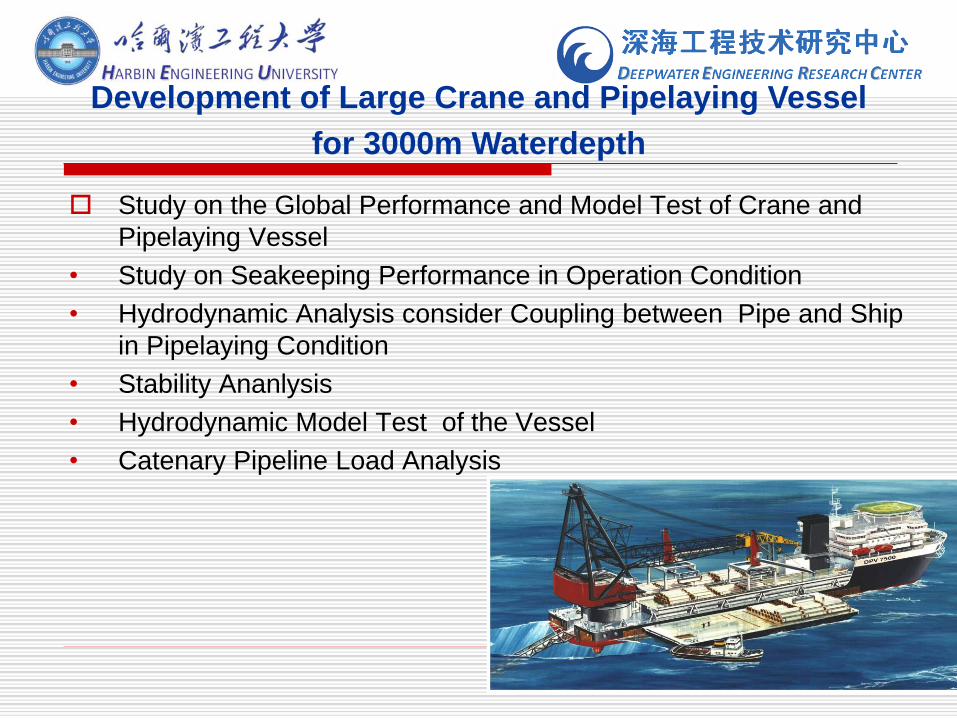
Study on the Global Performance and Model Test of Crane and
Pipelaying Vessel
• Study on Seakeeping Performance in Operation Condition
• Hydrodynamic Analysis consider Coupling between Pipe and Ship
in Pipelaying Condition
• Stability Ananlysis
• Hydrodynamic Model Test of the Vessel
• Catenary Pipeline Load Analysis
Development of Large Crane and Pipelaying Vessel
for 3000m Waterdepth

1、Max. Wind and Wave 2、Wind and Swell 3、Standby Condition
Wind Velocity:16m/s; Wind Velocity:8m/s; Wind Velocity :26m/s;
Wave height:Hs=2.5m Wave height:Hs=2.0m Wave height:Hs=8.2m
Wave period:Tp=6.0~9.0s
Wave period:Tp=10.0~12.0s
Wave period:Tp=11~15s
Current Velocity:2.0 knot Current Velocity:2.0 knot Current Velocity:3.0 knot
Jonswap Spectrum Jonswap Spectrum Jonswap Spectrum
Environmental Conditions

model for shallow water
model for deepwater
Test scale: 1:50

Test the pitch,roll,heave and acceleration
response of the ship under dynamic positioning
condition.
Wave direction 180 degrees,
the self-propelled condition
Wave direction 165 degrees, 50%
pipelaying, shallow water condition
Motion Test in Operation Condition

1)In the beam condition the heave is significant . So it should be avoided
to lay pipe in this condition.
2)During pipelaying the roll motion is less in deepwater than in shallow
water.
3) During pipelaying the pitch and heave amplitude are biggest in 150
degrees wave direction. But there is no big difference both in deepwater
and in shallow water.
4)The vertical acceleration of the stinger bottom changes most. Followed
by the position connected with ship. The smallest position is at the
midship.
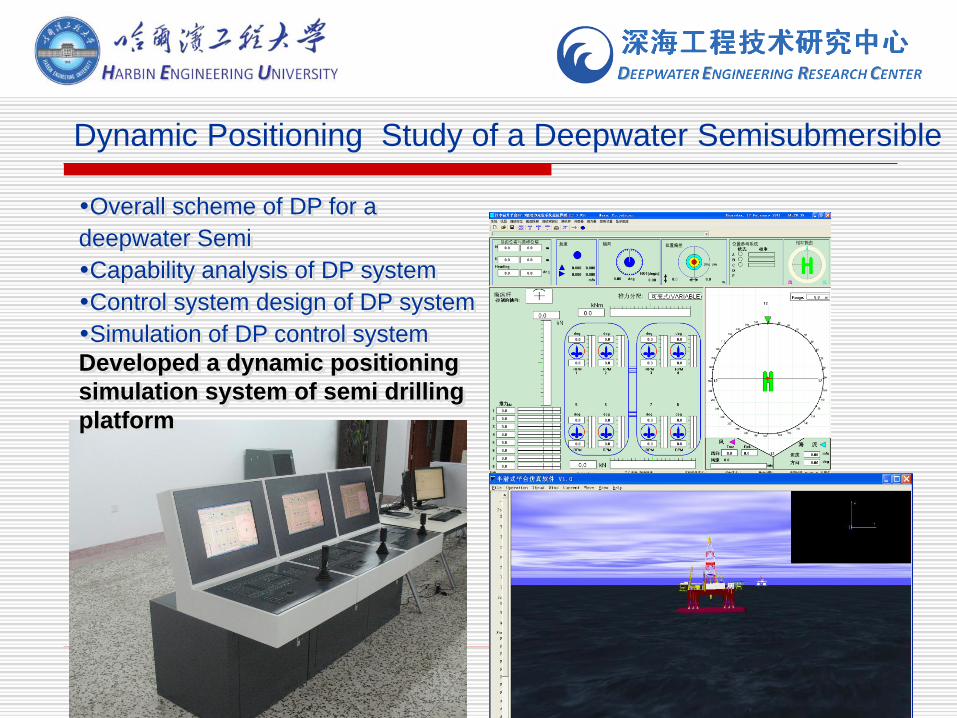
Overall scheme of DP for a
deepwater Semi
Capability analysis of DP system
Control system design of DP system
Simulation of DP control system
Developed a dynamic positioning
simulation system of semi drilling
platform
Dynamic Positioning Study of a Deepwater Semisubmersible
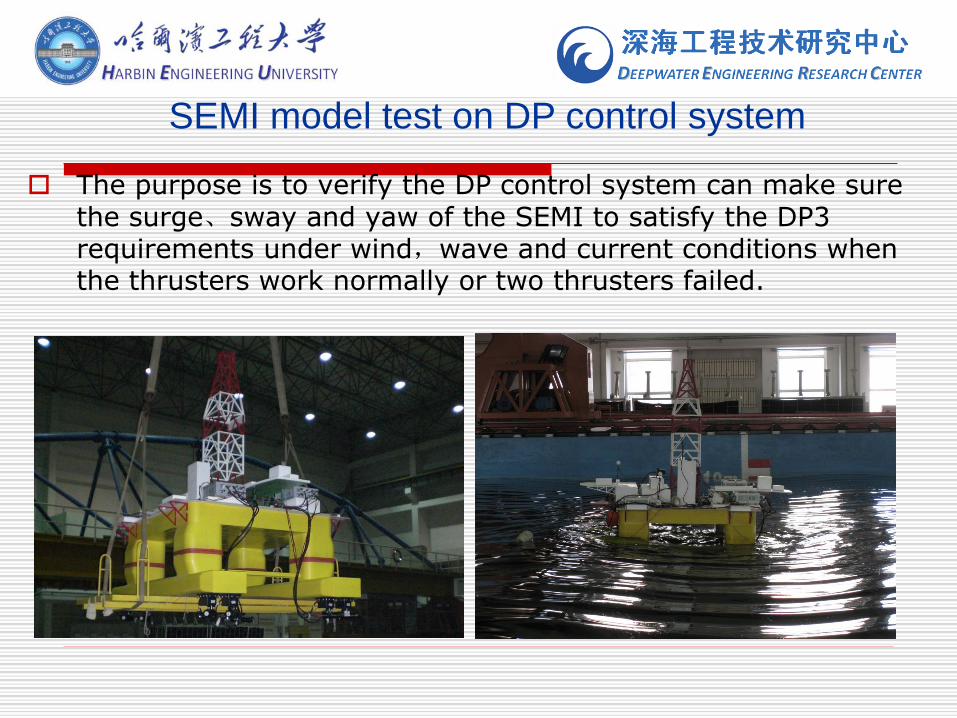
SEMI model test on DP control system
The purpose is to verify the DP control system can make sure the surge、sway and yaw of the SEMI to satisfy the DP3 requirements under wind,wave and current conditions when the thrusters work normally or two thrusters failed.

load ParameterStandby Condition Operation Condition
SEMI 981 model SEMI 981 model
Wave
SpectrumISSC
Spectrum
ISSC
Spectrum
ISSC
Spectrum
ISSC
Spectrum
Hs(m) 6 0.12 6 0.12
Tp(s) 11.2 1.58 11.2 1.58
Ts(s) 9.5 1.34 9.5 1.34
WindVelocity
(m/min)25.7 3.67 23.2 3.28
CurrentVelocity
(m/s)1.03 0.146 0.93 0.132
模型试验的海洋环境条件
Load Conditions

SurgeSway Yaw
Test Results
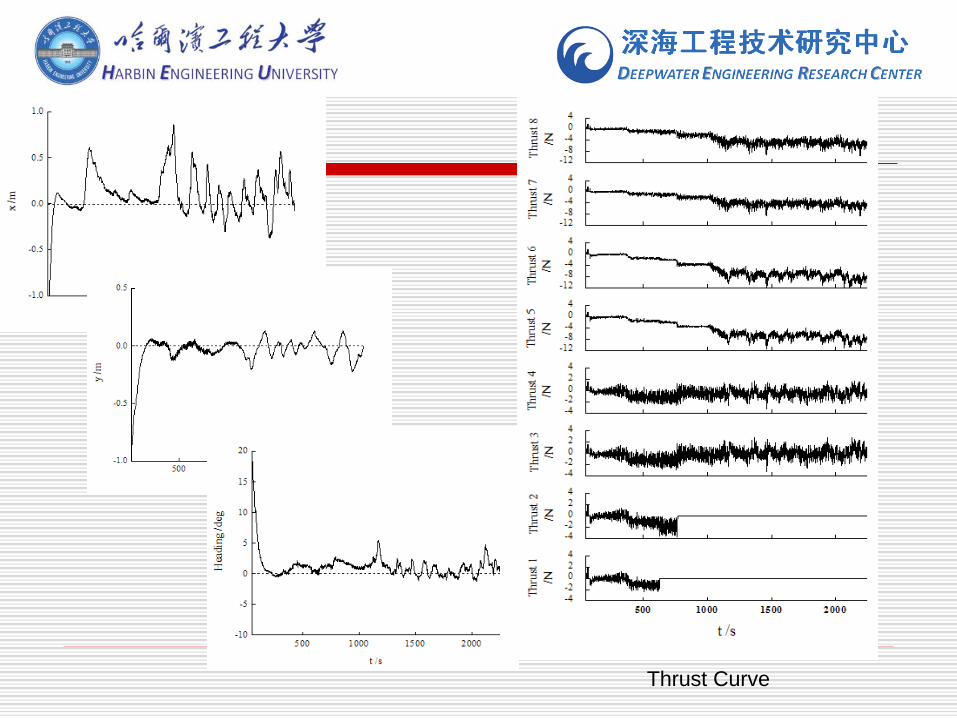
Thrust Curve
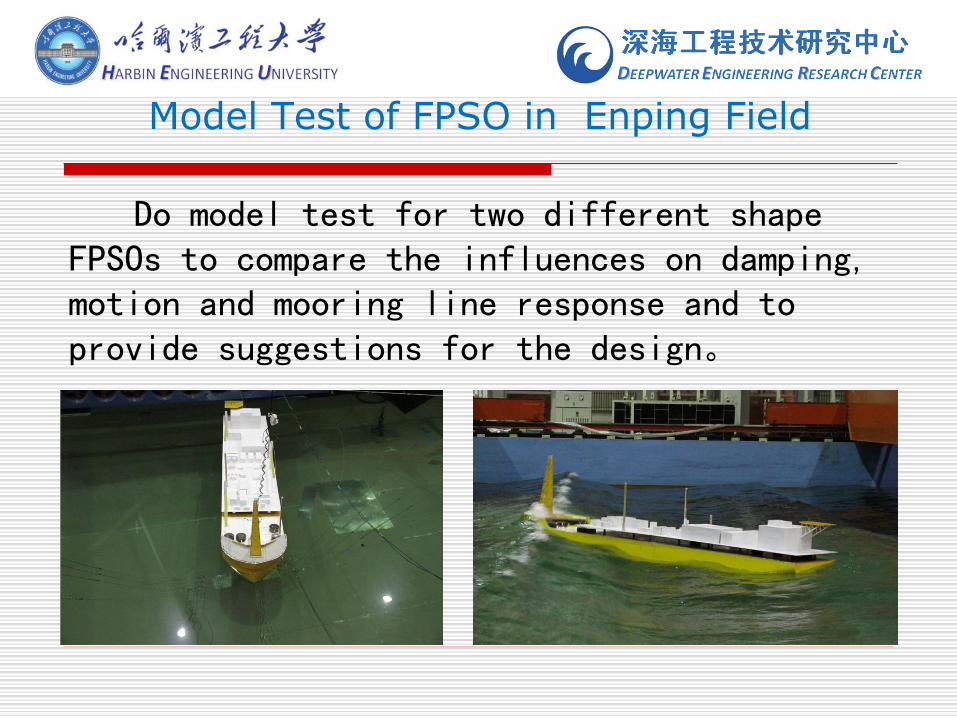
Model Test of FPSO in Enping Field
Do model test for two different shape FPSOs to compare the influences on damping, motion and mooring line response and to provide suggestions for the design。
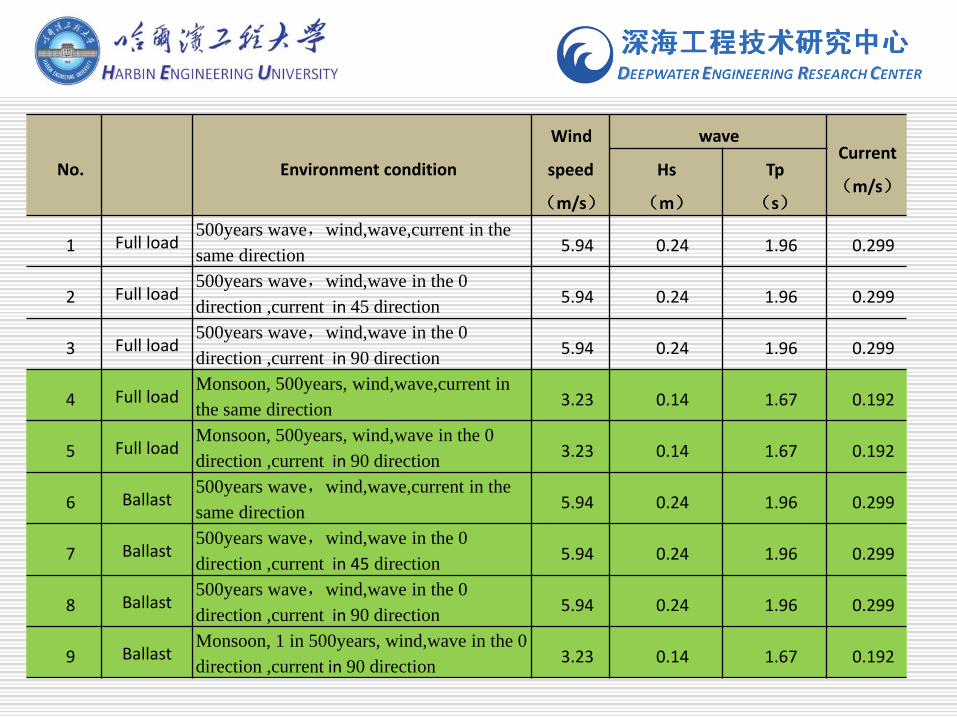
No. Environment condition
Wind
speed
(m/s)
waveCurrent
(m/s)Hs
(m)
Tp
(s)
1 Full load500years wave,wind,wave,current in the
same direction5.94 0.24 1.96 0.299
2 Full load500years wave,wind,wave in the 0
direction ,current in 45 direction5.94 0.24 1.96 0.299
3 Full load500years wave,wind,wave in the 0
direction ,current in 90 direction5.94 0.24 1.96 0.299
4 Full loadMonsoon, 500years, wind,wave,current in
the same direction3.23 0.14 1.67 0.192
5 Full loadMonsoon, 500years, wind,wave in the 0
direction ,current in 90 direction3.23 0.14 1.67 0.192
6 Ballast500years wave,wind,wave,current in the
same direction5.94 0.24 1.96 0.299
7 Ballast500years wave,wind,wave in the 0
direction ,current in 45 direction5.94 0.24 1.96 0.299
8 Ballast500years wave,wind,wave in the 0
direction ,current in 90 direction5.94 0.24 1.96 0.299
9 BallastMonsoon, 1 in 500years, wind,wave in the 0
direction ,current in 90 direction3.23 0.14 1.67 0.192

Test Results
There is visible green water under both ballast and full load conditions.
The green water is much for the full load condition than ballast condition. When current and wave in different direction the green water is obvious at the midship.
By increasing the height of forecastle there is no green water anymore on the bow but there is no any change at the midship.

Model Test of SSCV H206
Series of model tests were carried out in HEU basin to get the motion response, air gap of SSCV H206 under different conditions.

Irregular Wave Conditions
15 wave probes were set on SSCV to get the air gaps of different
positions. Three load conditions:
Survival condition: HS=12m, Tp=13.7s, gamma=3.33;
Survival condition: HS=10.42m, Tp=11.18s, gamma=3.33;
Towing condition: HS=3m, Tp=9.83s, gamma=3.33
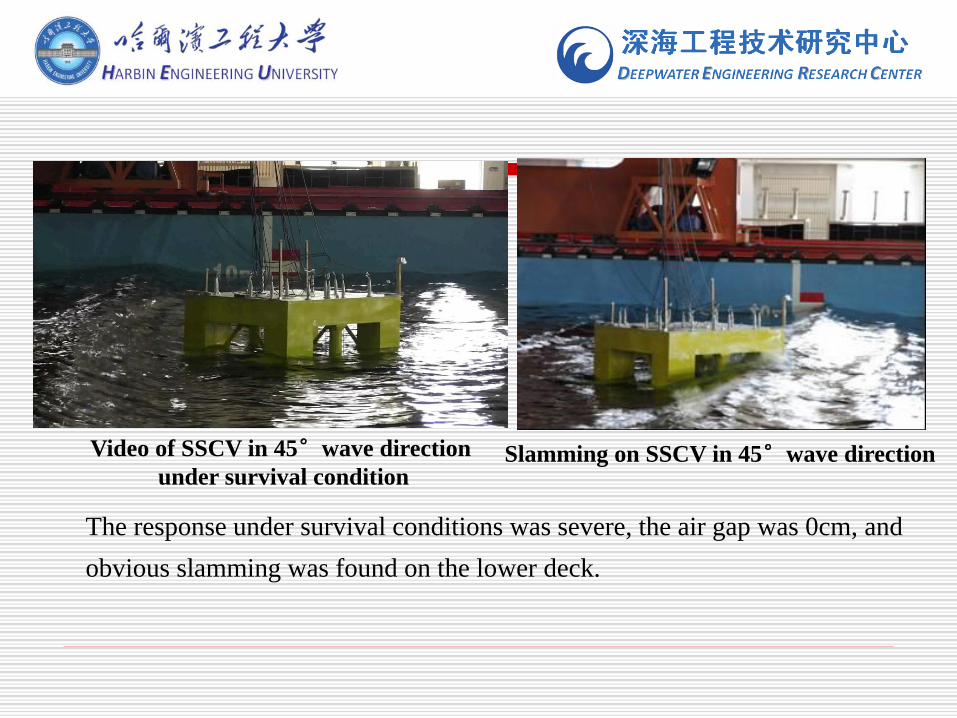
Video of SSCV in 45°wave direction
under survival conditionSlamming on SSCV in 45°wave direction
The response under survival conditions was severe, the air gap was 0cm, and
obvious slamming was found on the lower deck.

1. Introduction to DERC
2. Offshore Basin in the World
3. Platform Motion Model Test
4. Riser Model Test
Outline
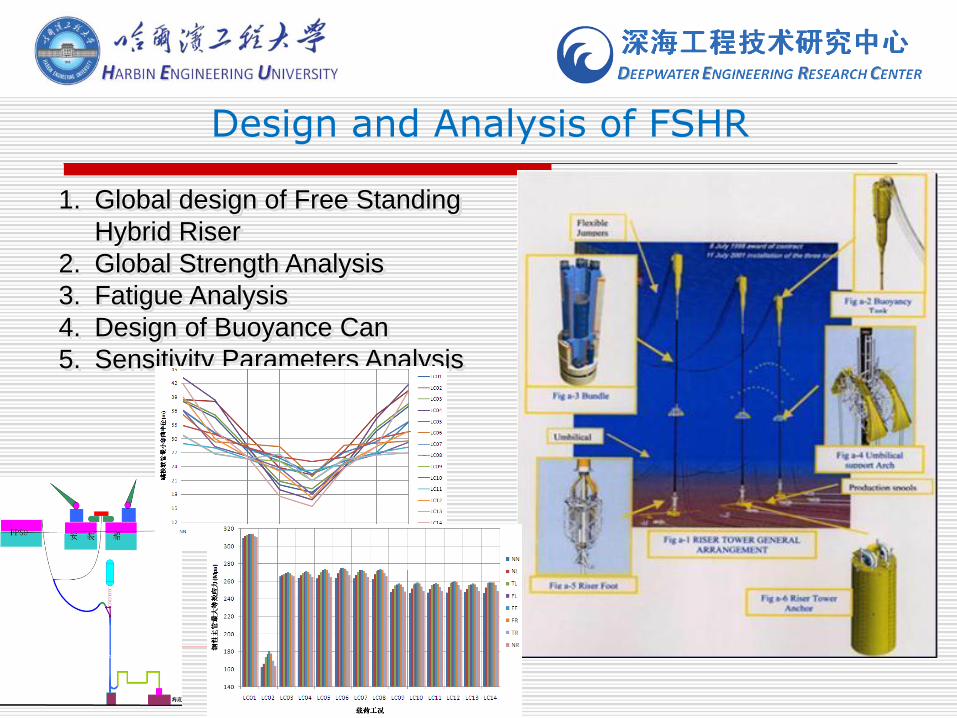
Design and Analysis of FSHR
1. Global design of Free Standing
Hybrid Riser
2. Global Strength Analysis
3. Fatigue Analysis
4. Design of Buoyance Can
5. Sensitivity Parameters Analysis

Three kinds of VIV suppression devices are tested, uniform current from 0.2m/s~0.6m/s,interval 0.1m/s。
Vortex-induced vibration suppression device model test

Without suppression device, the biggest amplitude appeared under current velocity of 0.2 ~ 0.3 m/s ,which is the lock area, when the velocity is greater than 0.4 m/s, amplitude decreases.
With suppression device ,it was founded the double set of double helix work best ,a single set of double helix is the second,fiber is the last。
Experimental results
水池
圆柱体
连接板
水平导轨
滑车
垂向运动机构
横向电位器
加速度传感器
弹簧
滚珠轴承
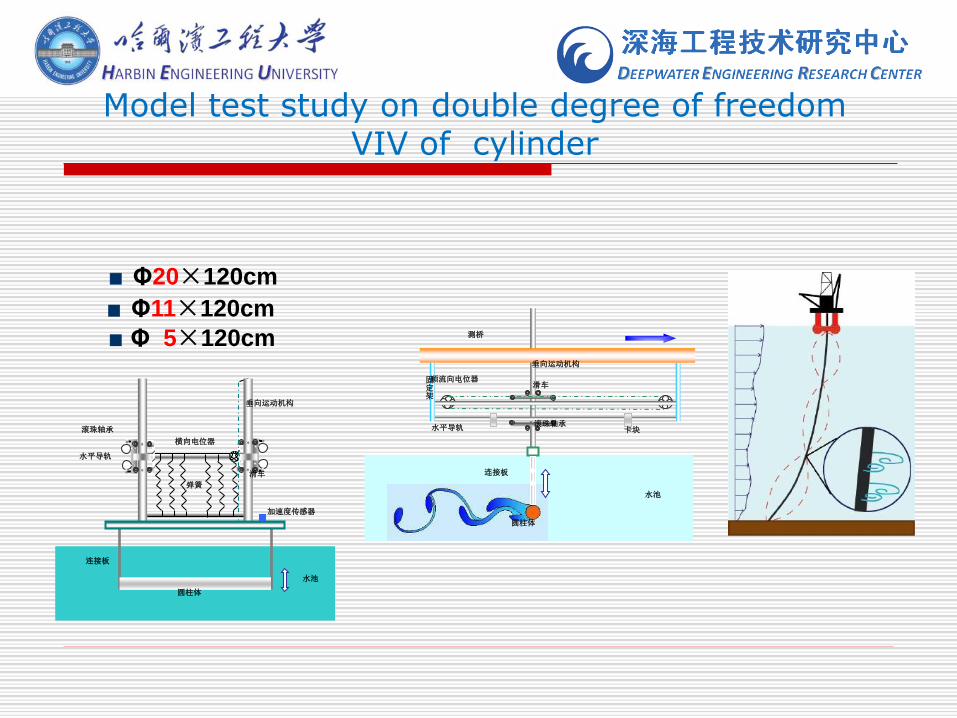
■ Φ20×120cm
■ Φ11×120cm
■ Φ 5×120cm
圆柱体
水平导轨
连接板
顺流向电位器滑车
卡块
水池
垂向运动机构
滚珠轴承
测桥
固定架
Model test study on double degree of freedom VIV of cylinder

Cylinder motion trajectories results
Cylinder motion trajectories corresponding to different natural
vibration frequencies are completely different.
That is, they respectively appear to be “D” shape, “egg” shape,
“rain drop” shape and figure “8” shape.
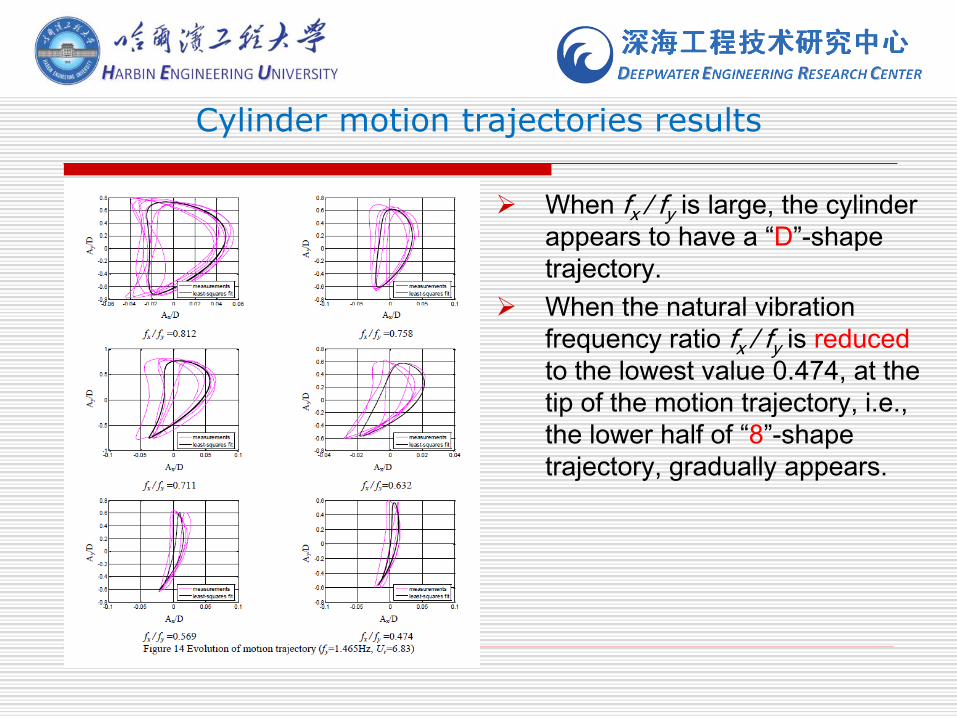
Cylinder motion trajectories results
When fx / fy is large, the cylinder
appears to have a “D”-shape
trajectory.
When the natural vibration
frequency ratio fx / fy is reduced
to the lowest value 0.474, at the
tip of the motion trajectory, i.e.,
the lower half of “8”-shape
trajectory, gradually appears.
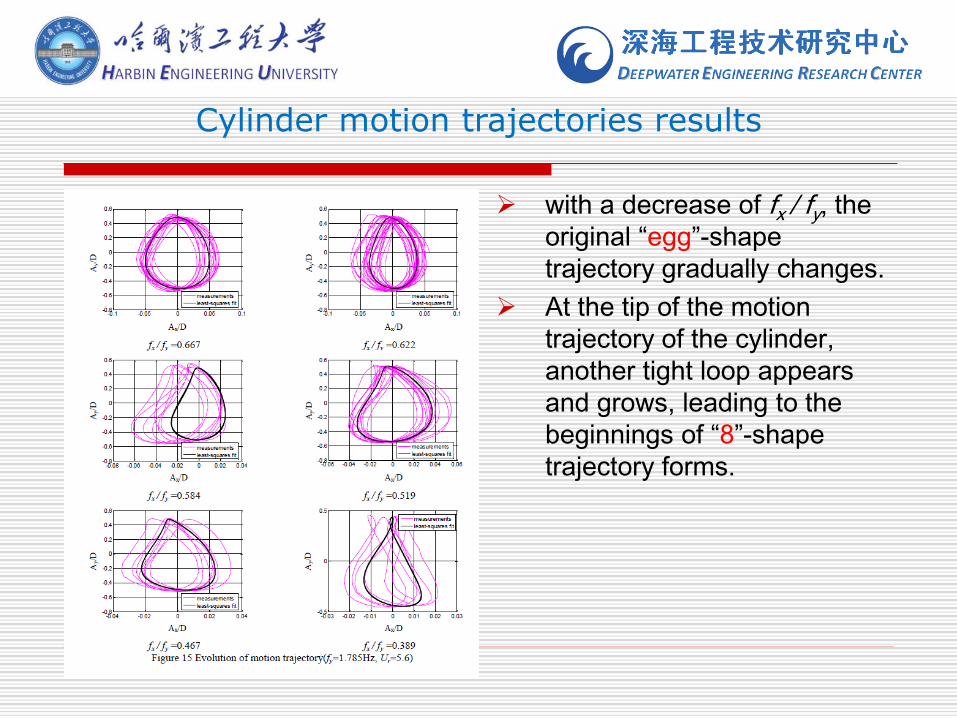
Cylinder motion trajectories results
with a decrease of fx / fy, the
original “egg”-shape
trajectory gradually changes.
At the tip of the motion
trajectory of the cylinder,
another tight loop appears
and grows, leading to the
beginnings of “8”-shape
trajectory forms.
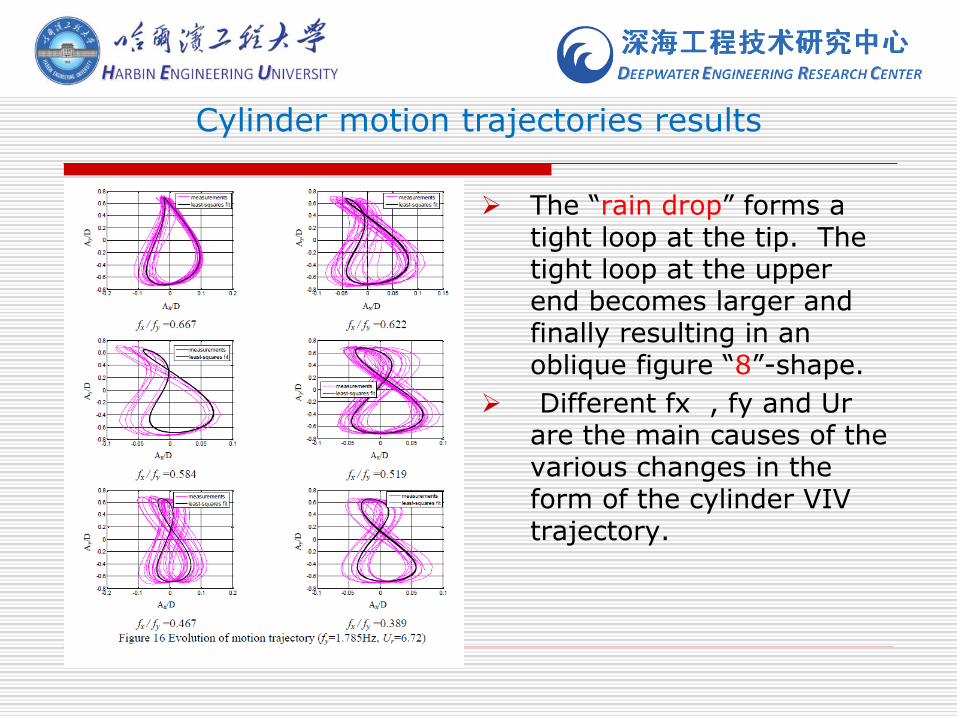
Cylinder motion trajectories results
The “rain drop” forms a tight loop at the tip. The tight loop at the upper end becomes larger and finally resulting in an oblique figure “8”-shape.
Different fx , fy and Ur are the main causes of the various changes in the form of the cylinder VIV trajectory.
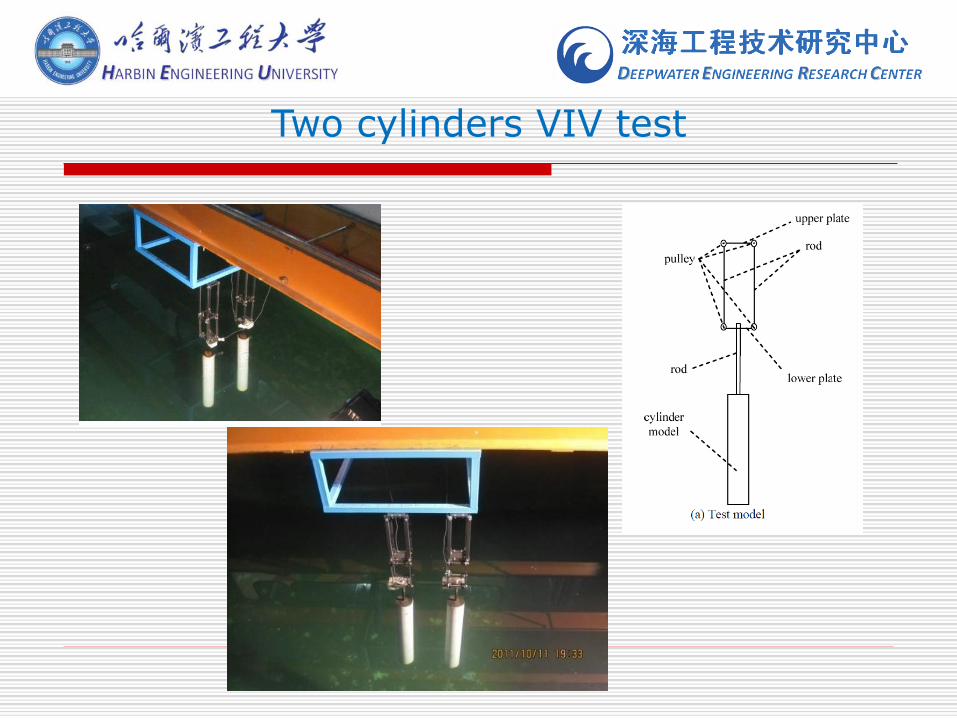
Two cylinders VIV test

Test Matrix
ExpNo.
Spacing(spacing ratio)
Velocity (m/s)
0.2 0.3 0.4 0.5 0.6 0.7 0.8
160.5 cm
(L/D=5.5)√ √ √ √ √ √ √
254.2 cm
(L/D =4.9)√ √ √ √ √ √ √
339.3 cm
(L/D =3.6)√ √ √ √ √ √ √
432.5 cm
(L/D =3.0)√ √ √ √ √ √ √
arrangement Spacing (spacing ratio)
side by side arrangement
absolute value(cm) 51.6 46.6 42.4 38.3 33.5 29.0
spacing ratioT/D 4.7 4.2 3.9 3.5 3.0 2.6
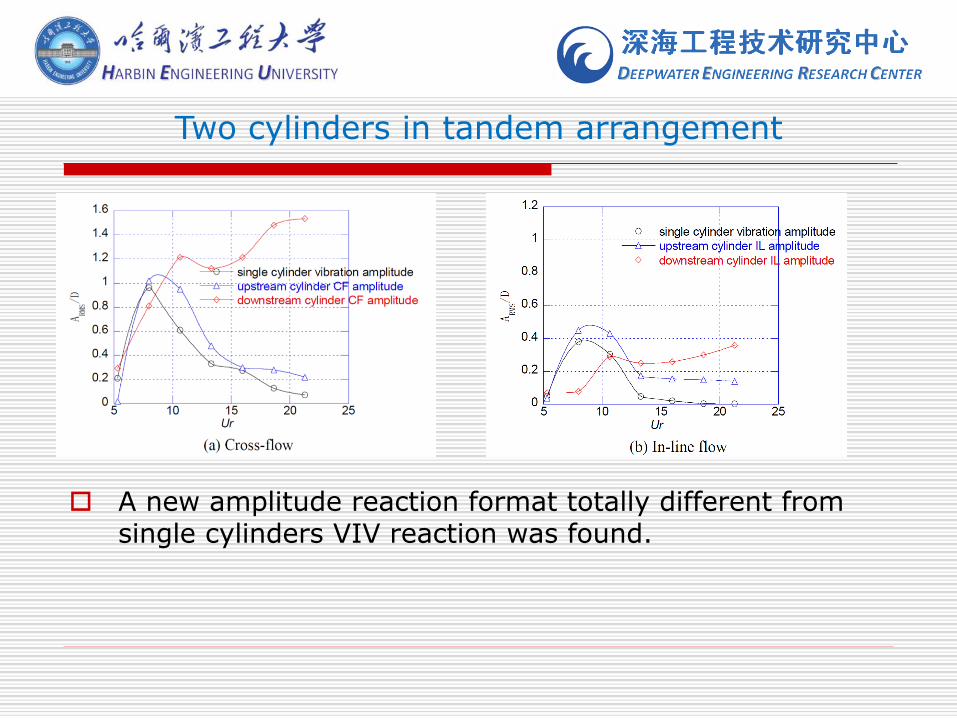
Two cylinders in tandem arrangement
A new amplitude reaction format totally different from single cylinders VIV reaction was found.
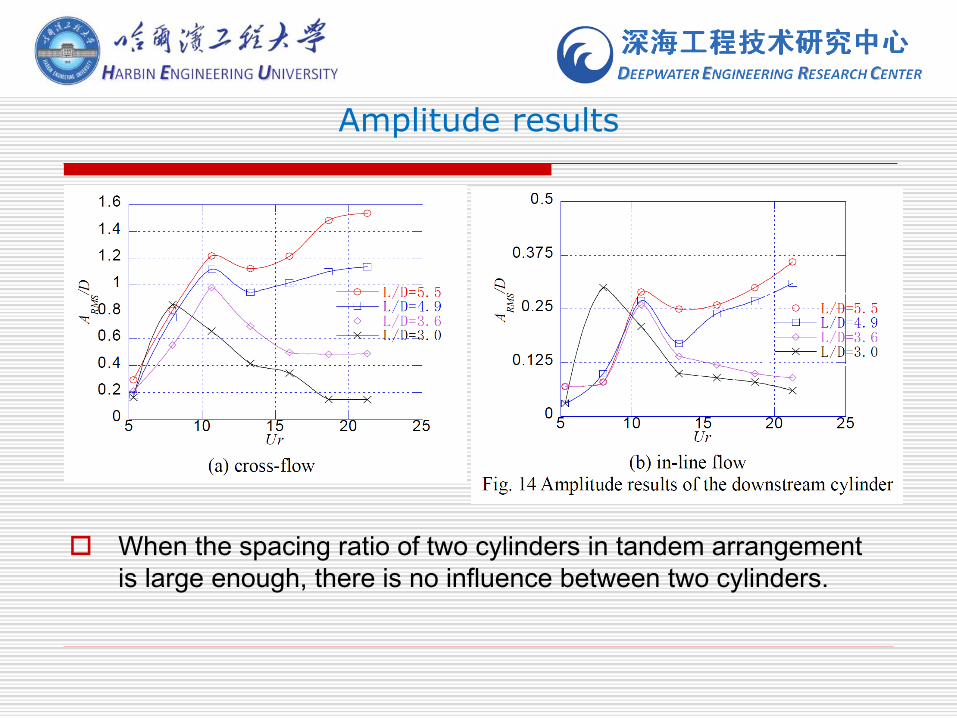
Amplitude results
When the spacing ratio of two cylinders in tandem arrangement
is large enough, there is no influence between two cylinders.
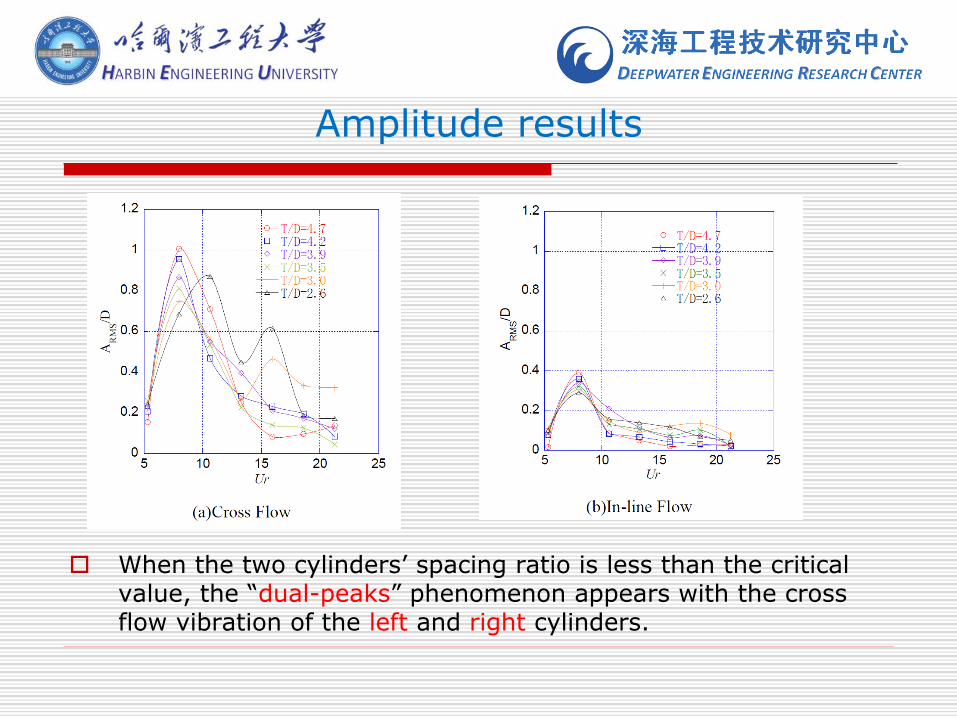
Amplitude results
When the two cylinders’ spacing ratio is less than the critical value, the “dual-peaks” phenomenon appears with the cross flow vibration of the left and right cylinders.
Thank you for your attention