Embed Size (px)
Citation preview

Imagine the result
Ocean Water Desalination Program Master Plan
Imagine the result

Imagine the result Imagine the result
•Background & Objectives
•Conceptual System Design
•Power Supply
•Environmental Review
•Permitting
•Operations & Maintenance
•Costs & Funding
•Project Delivery
•Conclusions & Next Steps
Outline

© 2011 ARCADIS 22 January 2013 3
Background & Objectives
Comprehensive Planning
Ocean Water Desalination Program Master Plan
Demonstration Project (2010 – Present) Ocean Water Desalination Demonstration Facility
(OWDDF) at Sea Lab, Redondo Beach Intake technologies, energy usage, optimization, operation, water quality, discharge management
Piloting (8 Years)
Water treatment technologies: high rate pre-screening, MF/UF, reverse osmosis, etc.
Water quality monitoring: raw ocean source water, discharge concentrate, product water
• Improve reliability
• Reduce dependence on imported water
• Diversify water supply portfolio
• New source of local potable water

Imagine the result Imagine the result
•Background & Objectives
•Conceptual System Design
•Power Supply
•Environmental Review
•Permitting
•Operations & Maintenance
•Costs & Funding
•Project Delivery
•Conclusions & Next Steps
Outline

© 2011 ARCADIS 22 January 2013 5
• Static overall demand < 200,000 AFY through 2035 (2010 UWMP)
• Reduce imported from 66% to approx. 33% by 2020 (WR 2020)
• Local demand supports 20-MGD
• Regional demand w/ exist MWD operational constraints is 25-MGD
• Site and regional conveyance system capable of 60-MGD
Scenarios
• 10-MGD Facility (full build-out) 1
• 20-MGD Facility (full build-out) 2
• 10-MGD Facility (40-MGD backbone for expansion) 3A
• 40-MGD Facility (full build-out) 3B
• 60-MGD Facility (full build-out) 4

© 2011 ARCADIS 22 January 2013 6
• Candidate Sites* • El Segundo Generating Station (ESGS)
• Redondo Beach Generating Station (RBGS)
• Differences mainly due to space availability
• Sensitivity analysis shows near equivalent rank
Siting Evaluation
Criteria Description Percentage
Score
ESGS RBGS
Technical Performance Treatment Technology and Operational Complexity 40% 25 26
Economic Performance Sound Financial and Resource Management 20% 12 11
Environmental Performance Environmental Stewardship 20% 11 12
Social performance Stakeholder Acceptance and Customer Service 20% 14 13
Overall Performance 100% 64 65
Performance Rating
*Short listing to candidate sites
completed in previous effort by
West Basin.

© 2011 ARCADIS 22 January 2013 7
Intake

© 2011 ARCADIS 22 January 2013 8
Discharge

© 2011 ARCADIS 22 January 2013 9
Treatment Process

© 2011 ARCADIS 22 January 2013 10
Facilities 20-MGD Facility El Segundo

© 2011 ARCADIS 22 January 2013 11
Facilities 20-MGD Facility Redondo Beach

© 2011 ARCADIS 22 January 2013 12
Facilities 60-MGD Facility El Segundo

© 2011 ARCADIS 22 January 2013 13
Facilities 60-MGD Facility Redondo Beach

© 2011 ARCADIS 22 January 2013 14
• Permeate conditioning to mitigate
compatibility issues (corrosion)
• Likely Treatment Options • Lime with carbon dioxide
• Calcite filters
• Target pH 8.5 • Least chemical doses & treatment cost
• Target pH 8.2 w/o Sulfate Adj. • Moderate chemical doses & treatment cost
• Target pH 8.2 with Sulfate Adj. • Match MWD water quality
• Significant doses of sulfuric acid needed in
addition to lime and carbon dioxide
• Double treatment cost compared to no
sulfate adjustment
• Water Quality Integration Study
Product Water Quality
Parameter West Basin
Target Range
Metropolitan
Jensen Range
(and Average)
pH 8.2 to 8.5 7.4 to 8.4
(average 8.2)
Alkalinity
(mg/L as CaCO3) 45 to 100
80 to 99
(average 87)
Calcium (mg/L as
CaCO3) 40 to 100
55 to 93
(average 68)
Langelier Saturation
Index (LSI) > 0 Not reported
Calcium Carbonate
Precipitation Potential
(CCPP, mg/L)
0 < CCPP < 10 Not reported
Chloride (mg/L) ≤ 100 40 to 96
(average 68)
Sulfate (mg/L) No target 39 to 102
(average 59)
Bromide (mg/L) Chloramine
Stability
0.11 to 0.2
(average 0.18)
Boron (mg/L) 0.5 0.15 to 0.37
(average 0.21)
Product Water Quality Specifications

© 2011 ARCADIS 22 January 2013 15
Conveyance 20-MGD Facility El Segundo
El Segundo Site
WB-28
WB-30
WB-20
WB-3,4,5
WB-29
WB-2A,2B,13
West Coast Feeder
West Basin Feeder
Se
pu
lve
da
Fe
ed
er

© 2011 ARCADIS 22 January 2013 16
Conveyance 20-MGD Facility Redondo Beach
El Segundo Site
Redondo Beach Site
West Coast Feeder
West Basin Feeder
Se
pu
lve
da
Fe
ed
er
WB-3,4,5
WB-28
WB-30
WB-20
WB-29
WB-2A,2B,13

© 2011 ARCADIS 22 January 2013 17
Conveyance 60-MGD Facility El Segundo
El Segundo Site
Feeder Tie-in
West Coast Feeder
West Basin Feeder
Sepulv
eda F
eeder

© 2011 ARCADIS 22 January 2013 18
Conveyance 60-MGD Facility Redondo Beach
West Basin Feeder
West Coast Feeder
Se
pu
lve
da
Fe
ed
er
El Segundo Site
Redondo Beach Site
Feeder Tie-in

© 2011 ARCADIS 22 January 2013 19
• Vertical Turbine Pumps
• Design Considerations • Flow velocity
• Head loss
• Materials of Construction
• Connection Pressures
• Flow Ranges
• Hydrostatic Grade El
• Pump Type
• Redundancy
• Diurnal Variation
• Related Components • Wet Well
• Sedimentation Chamber
• PS Building
• Overhead Crane
• Surge Tank
Product Water Pumping
10-MGD 20-MGD 40-MGD 60-MGD
3
400HP EA
5
700HP EA
7
1,500HP EA
9
1,500HP EA
Product Water Pump Stations (El Segundo & Redondo Beach)
Legend
Standby Duty

Imagine the result Imagine the result
•Background & Objectives
•Conceptual System Design
•Power Supply
•Environmental Review
•Permitting
•Operations & Maintenance
•Costs & Funding
•Project Delivery
•Conclusions & Next Steps
Outline

© 2011 ARCADIS 22 January 2013 21
• Demand: 20-MGD 14 MW | 60-MGD 46 MW
Power Supply
Technical Evaluation
1. Onsite generation conventional means
2. Onsite generation renewable resources
3. Power directly purchased from SCE
Onsite Generation (Conventional)
• Gas turbine and steam turbine in combined
cycle mode, other options available
• Pipeline natural gas available at ES (NRG)
and RB (AES) sites
• > 50 MW would require detailed review
and evaluation by CEC, does not apply
• No renewable credits or carbon offsets
Onsite Generation (Renewable)
• Wind turbines: limited space, insufficient
wind speed to support
• Fuel cells: convert chemical energy
from fuel into electricity by oxidation
• Solar panels (CSP): limited space,
insufficient solar resources to support
• Rooftop PV panels feasible

© 2011 ARCADIS 22 January 2013 22
Power Supply
Power Supply Option Advantages Disadvantages Conclusions
Onsite power generation
with conventional means
Lower cost.
Local control of power
source and agreement
terms.
Will require permitting
and regulatory approval.
Potential SCE standby
charges.
No renewable credits.
Obtaining emissions offsets
and permitting is major hurdle.
Economics marginal.
WB has limited experience in
operating power plant but joint
option could make feasible.
Onsite power generation
by renewable resources
Attractive – green power. Not very good wind or
solar resources at site,
not practical.
Highest cost, with SCE
supplying remaining
power.
If implemented, on site
renewable will generate <5%
of power need of the
desalination plant.
Power supply directly
purchased from SCE
System reliability,
defined contract terms
and most accurate cost
estimate. Will have 20-
33% renewable
component.
Current cost are well
defined, but future
escalation is subject to
PUC process, and can
have negative impact for
large user to subsidize
residential customers.
SCE >50 kV supply rates are
competitive. SCE will work
with WB within PUC guideline
for best rates.
Summary of Power Supply Options
Imagine the result Imagine the result
•Background & Objectives
•Conceptual System Design
•Power Supply
•Environmental Review
•Permitting
•Operations & Maintenance
•Costs & Funding
•Project Delivery
•Conclusions & Next Steps
Outline

© 2011 ARCADIS 22 January 2013 24
• Technical Studies and Data Needs • Completed prior to or during EIR development vs. part of EIR process
• Study scopes
• Environmental Review Plan • Importance of Project Definition, detail and flexibility
• CEQA Lead Agency – anticipated to be West Basin
• Federal Agency – Marine construction (ACOE)
• Stakeholder input
• Preliminary Engineering and Design
• Least environmentally damaging practicable alternative
• CEQA/NEPA
• Risks (schedule, document defensibility, budget) • Potential litigation
• Insufficient stakeholder involvement
• Unanticipated delays
Environmental Review Aesthetics
Air Quality/GHGs
Marine Bio
Impingement
Entrainment
Salinity
Terrestrial Bio
Cultural
Geology
Soils
HazMat
Hydrology
Water Quality
Noise
Transportation

© 2011 ARCADIS 22 January 2013 25
EIR/EIS Programs Define Proposed Project/Action
1. Review for Exemptions
CEQA PROCESS
2. Initial Study
3. EIR Required
4. Notice of Preparation
5. Scoping
6. Draft EIR
7. State Clearinghouse
8. Public & Agency Review
9. Prepare Responses to Comments
10. Review of Responses by Commentor
11. Final EIR
12. Agency Decision/Finding/SOC
13. File NOD within 5 days of Decision
14. Wait 30 days (Challenge Period)
15. Proceed with Project/Monitoring
1. Review for Exclusions
2. Environmental Assessment
3. EIS Required
4. Notice of Intent
5. Scoping
6. Draft EIS
7. EPA Filing: Federal Register
8. Public & Agency Review
9. Final EIS
NEPA PROCESS
10. EPA Filing: Federal Register
11. Agency Decision/Record of Decision
12. No Statute of Limitations for NEPA
13. Proceed with Project
Determine Lead Agency

Imagine the result Imagine the result
•Background & Objectives
•Conceptual System Design
•Power Supply
•Environmental Review
•Permitting
•Operations & Maintenance
•Costs & Funding
•Project Delivery
•Conclusions & Next Steps
Outline

© 2011 ARCADIS 22 January 2013 27
Agency Permit/Authorization/Approval Timeline
Federal
USFWS ITP Endangered Species Act (ESA)
ITP Migratory Bird Treaty Act (MBTA) 12-18 mo
NMFS ITP Marine Mammal Protection Act (MMPA) 12-18 mo
USACE Individual Permit, Clean Water Act (CWA)
Individual Permit, Rivers and Harbors Appropriation Act 6-18 mo
State
RWQCB
NPDES General Permit
NPDES Permit, Clean Water Act (CWA)
Waste Discharge Requirements (WDR), Porter-Cologne WQCA
Water Quality Certification, Clean Water Act (CWA)
12-24 mo
CSLC Land Use Lease 12-24 mo
CDFG ITP California Endangered Species Act (CESA)
Lake/Streambed Alteration Agreement
6-12 mo
6-12 mo
CCC Coastal Development Permit (CDP), California Coastal Act 24-36 mo
CDPH Permit to Operate a Public Water System 24-36 mo
CDPR Coordination, National Historic Preservation Act (NHPA) 6-12 mo
Caltrans Encroachment Permit 12-24 mo
Regional
SCAQMD Permit to Construct
Permit to Operate
6-12 mo
6-12 mo
MWDOC Encroachment Permit for Work within Metropolitan ROW 12-24 mo
Local Cities Encroachment Permit 3-6 mo/ea

Imagine the result Imagine the result
•Background & Objectives
•Conceptual System Design
•Power Supply
•Environmental Review
•Permitting
•Operations & Maintenance
•Costs & Funding
•Project Delivery
•Conclusions & Next Steps
Outline

© 2011 ARCADIS 22 January 2013 29
• Objectives • Basis for future staff planning
• Environmental analysis
• Framework for contract operations
procurement
• Operation Factors • Treatment capacity
• Raw water quality
• Effluent requirements
• Brine discharge limitations
• Preliminary plant design
• Operational Oversight • Monitoring influent and effluent
water quality and process variables
• Maintenance, replacement, and
calibration of equipment and
instrumentation
• Compliance and optimization goals
Operations & Maintenance Operational Parameters

© 2011 ARCADIS 22 January 2013 30
Operations & Maintenance • Labor / Staffing Plan
• Facility Staffing Roles and
Certification Requirements
• Asset Maintenance and
Management System (MMS)
• Work Schedules
Staffing Roles and Certification Requirements
Work Schedules

© 2011 ARCADIS 22 January 2013 31
Operations & Maintenance • Owner Operations
• Not used extensively by West Basin in the past
• Challenges: availability of staff, familiarity with desalination plant operation, high risk
• Contract Operations • Greater accountability for operations, transfer operations risks to private sector
• Benefits: fixed pricing, technical expertise
• RFQ process for selecting qualified Contractor
• Variety of forms due to duration/scope: performance based vs. staffing & materials
• Design Build Operate • Helps ensure operation factors are considered during design and construction
• Retain Project Team Prelim Design RFQ SOQs RFP Selection
• DBO Procurement typically longer than DBB Procurement, but DBB typically longer
design, bidding/selection, and construction.

Imagine the result Imagine the result
•Background & Objectives
•Conceptual System Design
•Power Supply
•Environmental Review
•Permitting
•Operations & Maintenance
•Costs & Funding
•Project Delivery
•Conclusions & Next Steps
Outline

© 2011 ARCADIS 22 January 2013 33
• Annualized Capital and O&M Cost
Costs & Funding
$0
$500
$1,000
$1,500
$2,000
$2,500
10-MGD 20-MGD 10/40-MGD 30/40-MGD 40-MGD 60-MGD
Note: 10/40 is initial 10
MGD plant w/ 40 MGD
backbone for expansion.
30/40 refers to 30 MGD
expansion to 40 MGD.
Inc
rea
sin
g C
os
t

© 2011 ARCADIS 22 January 2013 34
• Annualized Capital and O&M Cost ($/AF)
Costs & Funding
Note: 10/40 is initial 10
MGD plant w/ 40 MGD
backbone for expansion.
30/40 refers to 30 MGD
expansion to 40 MGD.

© 2011 ARCADIS 22 January 2013 35
Operations & Maintenance
$0
$10,000,000
$20,000,000
$30,000,000
$40,000,000
$50,000,000
10-MGD 20-MGD 40-MGD 60-MGD
Power Chemicals Maintenance & Materials Labor Replacement
Inc
rea
sin
g C
os
t • Annual O&M Cost

© 2011 ARCADIS 22 January 2013 36
Operations & Maintenance • Annual O&M Cost ($/yr)

© 2011 ARCADIS 22 January 2013 37
• Internal Funding
• Federal Funding • U.S. Bureau of Reclamation
• U.S. Army Corp of Engineers
• Water Infrastructure Finance and
Innovation Authority (WIFIA)
• State Funding • Proposition 84
• Safe, Clean and Reliable Drinking
Water Supply Act of 2012
• Regional Funding • Seawater Desalination Program (SDP)
• Public Private Partnerships • Investment Funds
• Qualified Tax Credit Bond (QTCB)
Costs & Funding • Uncertainty in availability of
public grants (poor economy)
• Cost of Water Analysis
• Financial Impact Analysis
• Schedule/Sequencing • Limited flexibility in timing of
borrowings
• Phasing/expansions might provide
opportunity for varying timing of
borrowing to mitigate rate impact
• Construction segments
• Rate impact during design &
construction vs. after on-line date
• Debt service coverage requirements
• Metropolitan SDP incentive of up to
$250 per acre foot

Imagine the result Imagine the result
•Background & Objectives
•Conceptual System Design
•Power Supply
•Environmental Review
•Permitting
•Operations & Maintenance
•Costs & Funding
•Project Delivery
•Conclusions & Next Steps
Outline

© 2011 ARCADIS 22 January 2013 39
• Advantages & Disadvantages
• Shortlisted to:
Project Delivery
• Design-Bid-Build (DBB) 1
• Design-Build (DB) 2
• Design-Build-Operate (DBO) 3
• Construction Manager (CM) at Risk 4
• Design Build Own Operate Transfer (DBOOT) 5
• Risk Profiles
• Key Drivers for APD Method Selection • Based on multiple years of project development and site specific understanding gained,
West Basin is likely in a more knowledgeable position on the preferred treatment system
performance than industry. As such, West Basin would likely consider providing the
definition on the technical/treatment components (i.e. prescriptive approach).
• Flexibility in contractor selection – ability to select based on best value
• Cost impacts
• Schedule (no regulatory constraints for expedited schedule)

© 2011 ARCADIS 22 January 2013 40
• Cost & Schedule Comparison
Project Delivery
Delivery Method Cost w/ Operations Cost w/o Operations Schedule
Design-Bid-Build
(DBB)
DBB
Capital Cost
(baseline for comparison)
DBB
Life Cycle Cost
(baseline for comparison)
DBB
Capital Cost
(baseline for comparison)
DBB
Life Cycle Cost
(baseline for comparison)
DBB
(baseline for comparison)
Design-Build
(DB)
Lower than DBB Capital
Cost (15-35% lower)
Higher than DBB Life Cycle
Cost (5-15% higher)
Same as DBB
Capital Cost
Same as DBB
Life Cycle Cost
Shorter than DBB
(0 to 10% shorter)
Design-Build-Operate
(DBO)
Lower than DBB Capital
Cost (10 to 25% lower)
Lower than DBB Life Cycle
Cost (10 to 25% lower)
N/A
N/A
Shorter than DBB
(0 to 10% shorter)

© 2011 ARCADIS 22 January 2013 41
• Intake/Discharge Structure: More risk, industry proprietary Performance-based
• Desalination Plant: Can be clearly defined by West Basin DBB or descriptive DB
• Conveyance System: Can be clearly defined by West Basin DBB or descriptive DB
• DBO also considered as incorporates long term operation into design/construction
Project Delivery • Example Program
Delivery Model

© 2011 ARCADIS 22 January 2013 42
Project Delivery • Schedule

Imagine the result Imagine the result
•Background & Objectives
•Conceptual System Design
•Power Supply
•Environmental Review
•Permitting
•Operations & Maintenance
•Costs & Funding
•Project Delivery
•Conclusions & Next Steps
Outline
© 2011 ARCADIS 22 January 2013 44
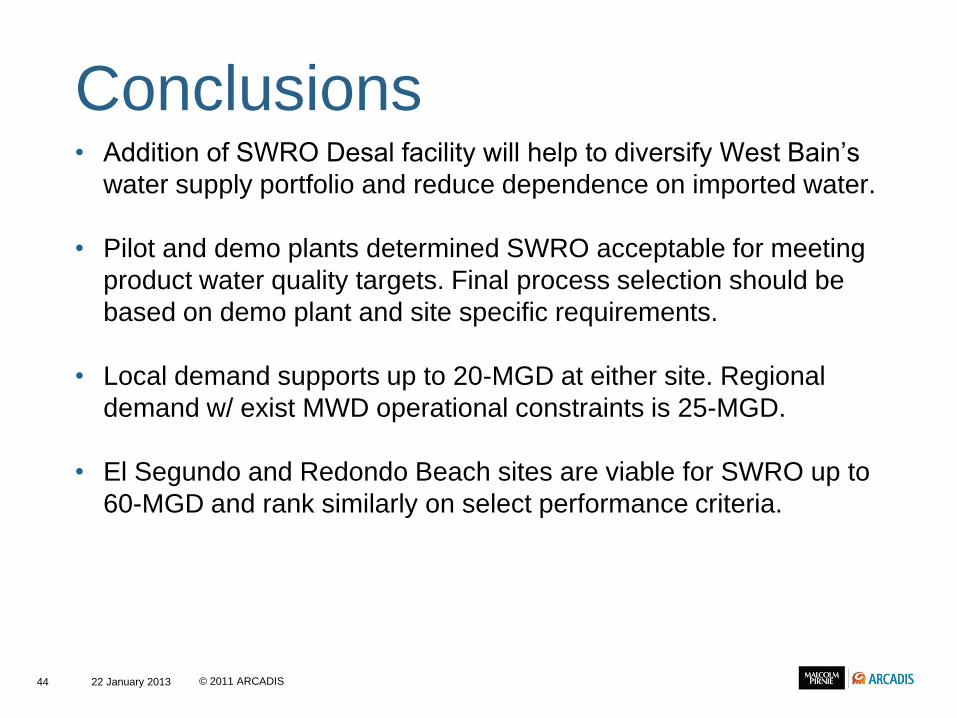
• Addition of SWRO Desal facility will help to diversify West Bain’s
water supply portfolio and reduce dependence on imported water.
• Pilot and demo plants determined SWRO acceptable for meeting
product water quality targets. Final process selection should be
based on demo plant and site specific requirements.
• Local demand supports up to 20-MGD at either site. Regional
demand w/ exist MWD operational constraints is 25-MGD.
• El Segundo and Redondo Beach sites are viable for SWRO up to
60-MGD and rank similarly on select performance criteria.
Conclusions

© 2011 ARCADIS 22 January 2013 45
• Best config to meet objectives: existing tunnels as conduit for I&D
pipes with wedge wire intake screens and diffuser discharge ports.
• Conveyance into local distribution or MWD feeders viable at both
sites. Compatibility concerns must be studied further.
• Several options for power supply. Additional investigations and
negotiations with SCE, NRG, and AES should be pursued.
• DBB or DB appropriate for Desal Plant and Conveyance System.
Could consider performance-based for Intake/Discharge Struct.
Conclusions

© 2011 ARCADIS 22 January 2013 46
• Additional Studies • Tunnel integrity at El Segundo
• RB discharge tunnel under pressure conditions
• Sediment transport / suspension
• Power Supply • Further evaluation of onsite self-generation and direct purchase from SCE options
• EIR Phase • Procurement of environmental and engineering support
• Address technical studies and data needs
• Prepare draft EIR/EIS and related NEPA/CEQA documentation
• Permitting • Comprehensive plan to acquire all permits
• Early and on-going consultation with permitting agencies
• Conduct initial scoping meetings
• Operations & Maintenance • Once preferred delivery method chosen, optimize an operations plan
Next Steps
• Bench or pilot-scale testing of
chemical dosing
• Water Quality Integration Study

© 2011 ARCADIS 22 January 2013 47
Imagine the result