Embed Size (px)
Citation preview

An Accredited Law Enforcement Agency
OCEANFRONT OPERATIONS
VIRGINIA BEACH POLICEA Fresh Perspective
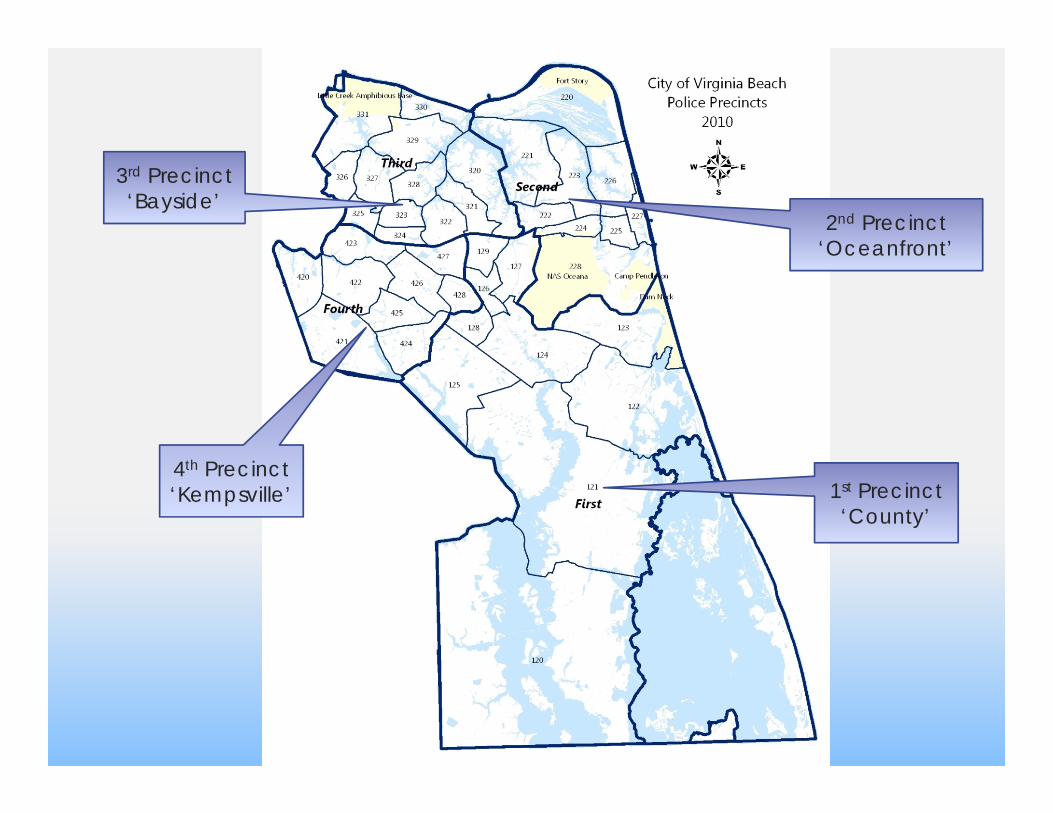
3rd Precinct‘Bayside’
4th Precinct‘Kempsville’ 1st Precinct
‘County’
2nd Precinct‘Oceanfront’

Population 433,549 42nd largest City in the United States 310 square miles 258.7 square miles of land 51.3 square miles of water 14 miles of public beaches 95,423 single family houses 1,317 duplexes 19,638 townhouses 18,442 condominium units 27,903 apartment units 42 trailer parks 86 schools 365 signalized intersections 1,742 centerline miles of streets 6,331 total streets
Virginia Beach FACTS


Why Do People Come ToThe Oceanfront?
Vacation and Special Events2.75 million annual visitors
Eclectic Nightlife1.5 million people live within a 45-minute drive
- ABC establishments on every block- Safe environment- Reality TV show - some nights- To See and Be Seen

The Oceanfront -A Unique Environment
Visitors/Crowd Dynamics/Traffic Management Geography/Limited Space Special Events (SETF – Special Event Task Force) Systems Approach Police Response
- Training (i.e. CIT - Crisis Intervention Team)- Supervision- Experience

Major Events

Crowds – Special Events
Latin Festival

Crowds – “The Block”

Multi SystemAgency Approach
Police Resort Management Code Enforcement Housing & Neighborhood Preservation Virginia ABC Probation & Parole

Ongoing Areas of Concern
Crowd management remains a consistent challenge for oceanfront operations.
Bars continue to challenge the staggered closure design.

Enforcement Strategy
Minor violations- Voluntary Compliance- Education- Crime Prevention- Community Involvement
Major Violations/Persistent Problems- Zero Tolerance - Deterrence- Community Action
Crimes Against Persons
Illegal Weapons
Disorderly Conduct
Cursing

Police Transportation
CarsBikesMotorcyclesHorses ATVHelicopterBoats

Police Transportation (continued)

Summer Season 2011-2013Aggravated Assaults & Robberies
Aggravated Assaults Robberies

3-Year Comparison of Arrestsby Charge Type
The number of felony charges decreased during
2013, with increases in misdemeanor and traffic
charges.
Type of Charge (# of Charges) 2011 2012 2011/2012
% Change 2013 2012/2013% Change
Felony 154 190 23.4% 134 -29.5%Misdemeanor 2,904 2,428 -16.4% 2,473 1.9%
Traffic 2,524 2,114 -16.2% 2,280 7.9%
Total 5,582 4,732 -15.2% 4,887 3.3%
0
5001,000
1,5002,0002,500
3,000
Felony Misdemeanor Traffic
2011 2012 2013

3-Year Comparison of Arrestsby Residence
Residence 2011 2012 2011/2012 % Difference 2013 2012/2013 %
DifferenceVirginia Beach 45.6% 46.4% .08% 49.5% 3.1%
Hampton Roads 23.5% 23.5% .00% 21.3% -2.1%Va, not HR 15.0% 15.8% .08% 14.0% -1.8%
Other 15.7% 14.0% -1.7% 15.0% 1.0%
0.0%
10.0%
20.0%
30.0%
40.0%
50.0%
Virginia Beach HamptonRoads
Va, not HR Other
2011 2012 2013
Virginia Beach residents continue to be the highest percentage of persons arrested at 49.5% of all arrests.
Hampton Roads residents, including Virginia Beach, comprised about 70% of all arrests over the past 3 years.
Visitors from areas outside of Virginia accounted for 15% percent of arrests, an increase of 1% from 2012.

Oceanfront vs. City-WideArrests by Race
Peopleby Race Beach
City‐Wide(Excluding Beach) Beach % of Total
City‐Wide (ExcludingBeach) % of Total
White 2,414 16,663 60.0% 62.4%Black 1,466 8,745 36.4% 32.7%Asian 59 550 1.5% 2.1%Indian 2 16 0.0% 0.1%Hispanic 66 598 1.6% 2.2%Unknown 18 142 0.4% 0.5%Total 4,025 26,714
0.0%
10.0%
20.0%
30.0%
40.0%
50.0%
60.0%
70.0%
80.0%
White Black Asian Indian Hispanic Unknown
April 15-Labor Day Weekend 2013 (People by Race)
Beach % of TotalCity-Wide (Excluding Beach) % of Total
Across all races, oceanfront and city-wide proportions are about the same (April 15-Sept 2, 2013).
White individuals accounted for the highest percentage of arrests at both the oceanfront and city-wide.
Black individuals accounted for the second highest percentage of arrests for both the oceanfront and city-wide.

Part 1 Crimes - Property2008-2012

Part 1 Crimes - Violent2008-2012
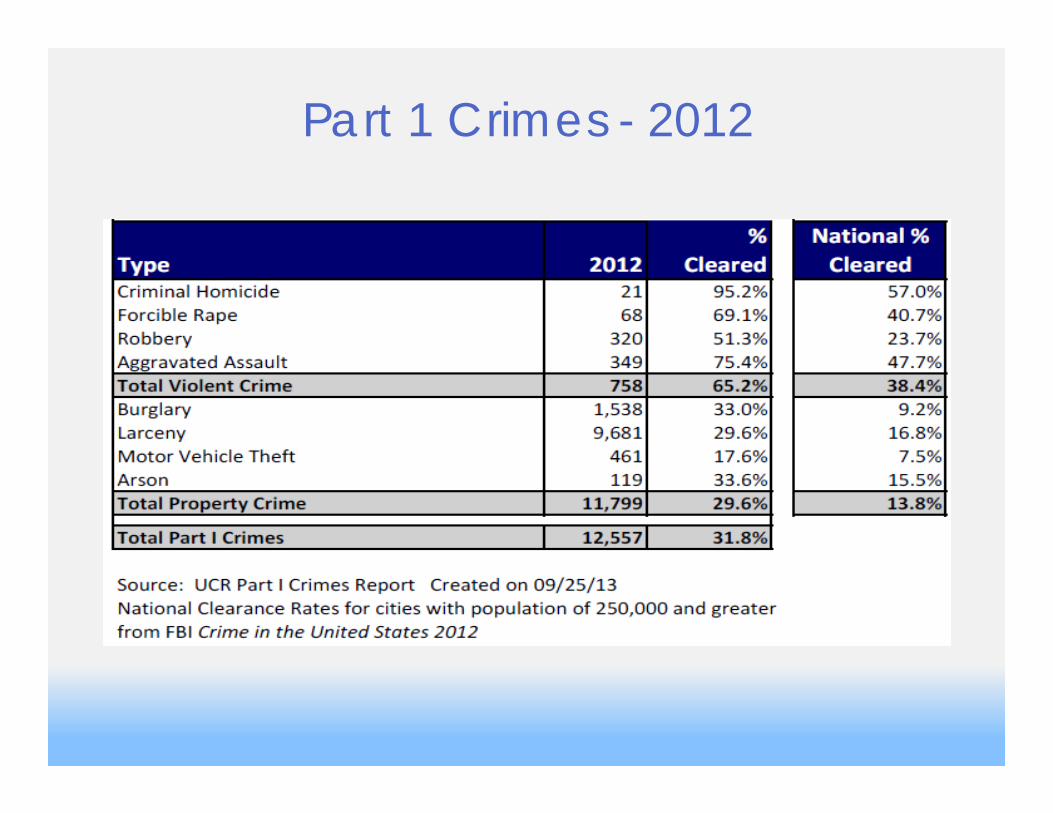
Part 1 Crimes - 2012
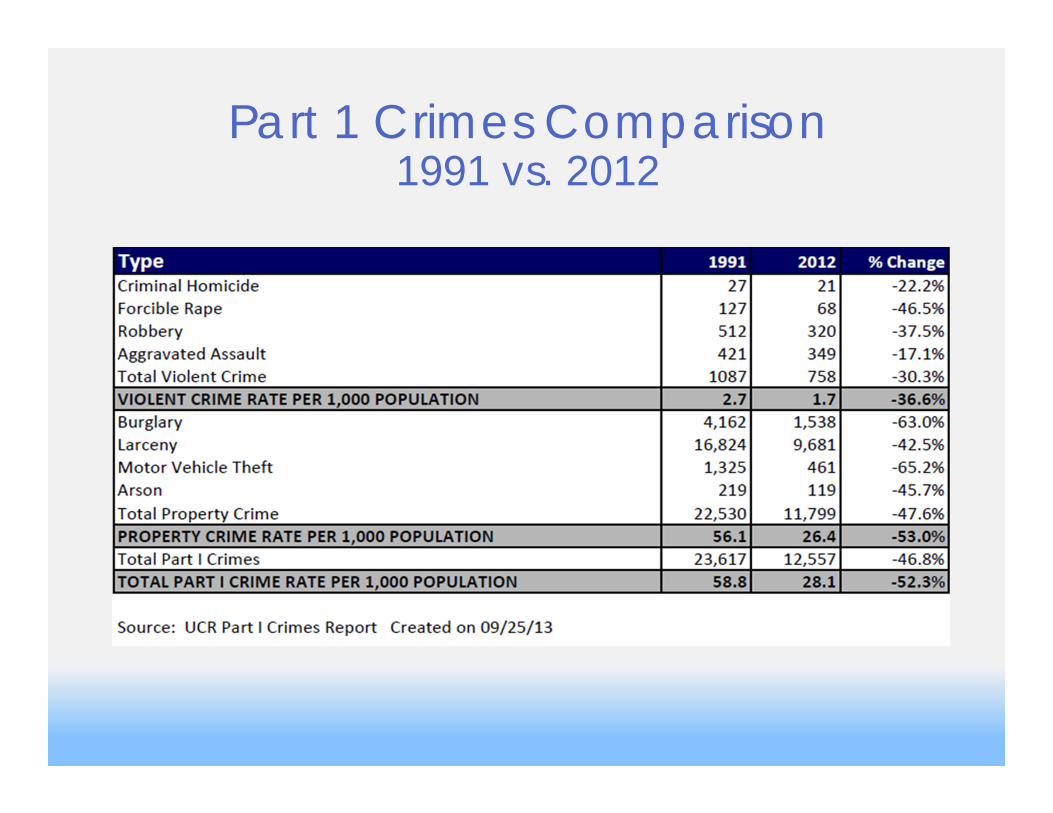
Part 1 Crimes Comparison1991 vs. 2012

Part 1 Crime Clearance Rates2003 Through 2012

2012 Comparison of Crimes in U.S. Citieswith Populations of 350,000-900,000
SourceFBI Crime In the U.S. 2012
The source for all population figures and all reported crime contained in the report, with the exception of Virginia Beach.
Population figures for Virginia Beach were adjusted to match U.S. census Bureau data.
Virginia Beach crime figures differ somewhat from official figures released by the VBPD.
This chart provides a quick comparison of cities with similar populations only.
FBI cautions against ranking cities due to unique attributes that may impact crime in any specific city.
Rank City State PopulationCrimes per
1,000 Residents
Violent Crimes per 1,000 Residents
Modified Property Crimes per 1,000
Residents
Violent Crimes
Modified Property Crimes
Total Crimes Reported
1 Virginia Beach VA 437,994 28.5 1.7 26.8 758 11,717 12,475
2 El Paso TX 675,536 28.5 4.2 24.3 2,859 16,411 19,2703 Tampa FL 350,758 34.5 6.2 28.4 2,162 9,947 12,1094 Mesa AZ 451,391 35.3 4.0 31.3 1,804 14,140 15,9445 Long Beach CA 469,893 35.8 5.8 30.1 2,705 14,131 16,8366 Raleigh NC 420,594 37.0 4.2 32.8 1,780 13,779 15,5597 Denver CO 628,545 43.3 6.2 37.1 3,871 23,343 27,2148 Arlington TX 379,295 44.9 5.0 39.8 1,909 15,109 17,0189 Colorado Springs CO 432,287 46.0 4.6 41.4 1,968 17,899 19,86710 Charlotte‐Mecklenburg NC 808,504 46.8 6.5 40.3 5,238 32,587 37,82511 Jacksonville FL 840,660 47.4 6.2 41.2 5,189 34,674 39,86312 Fort Worth TX 770,101 48.1 5.9 42.2 4,524 32,514 37,03813 Louisville Metro KY 666,200 48.9 6.0 42.9 3,989 28,606 32,59514 Sacramento CA 476,557 49.3 7.4 41.9 3,520 19,967 23,48715 Omaha NE 417,970 51.8 5.9 45.9 2,485 19,178 21,66316 Nashville TN 620,886 54.1 12.2 42.0 7,550 26,052 33,60217 San Francisco CA 820,363 54.5 7.0 47.4 5,777 38,898 44,67518 Bakersfield CA 355,696 55.3 5.4 49.9 1,929 17,754 19,68319 Portland OR 598,037 56.1 5.2 50.9 3,093 30,454 33,54720 Austin TX 832,901 56.3 4.1 52.2 3,405 43,472 46,87721 Fresno CA 506,011 56.3 5.4 50.9 2,748 25,737 28,48522 Seattle WA 626,865 56.9 6.0 50.9 3,746 31,931 35,67723 Washington DC 632,323 58.1 11.8 46.3 7,448 29,264 36,71224 Minneapolis MN 390,240 59.5 9.9 49.6 3,872 19,359 23,23125 Baltimore MD 625,474 60.7 14.1 46.6 8,789 29,149 37,93826 Albuquerque NM 553,684 61.2 7.5 53.7 4,151 29,718 33,86927 Wichita KS 386,409 62.0 7.4 54.5 2,869 21,070 23,93928 Tulsa OK 398,904 62.1 9.9 52.2 3,949 20,807 24,75629 Milwaukee WI 599,395 63.4 12.9 50.4 7,759 30,228 37,98730 Miami FL 414,327 65.5 11.7 53.8 4,856 22,271 27,12731 Indianapolis IN 838,650 67.8 11.9 55.9 9,942 46,898 56,84032 Kansas City MO 464,073 67.9 12.6 55.3 5,862 25,642 31,50433 Oklahoma City OK 595,607 68.6 9.2 59.4 5,474 35,390 40,86434 Cleveland OH 393,781 75.6 13.8 61.7 5,449 24,309 29,75835 Atlanta GA 437,041 79.1 13.8 65.3 6,027 28,554 34,58136 Detroit MI 707,096 79.2 21.2 57.9 15,011 40,956 55,96737 Memphis TN 657,436 80.6 17.5 63.1 11,507 41,503 53,01038 Oakland CA 399,487 85.9 19.9 65.9 7,963 26,342 34,305

2012 Comparison of Crimes in U.S. Citieswith Populations of 350,000-500,000
City State PopulationCrimes per
1,000 Residents
Violent Crimes per 1,000 Residents
Modified Property Crimes per 1,000
Residents
Violent Crimes
Modified Property Crimes
Total Crimes Reported
Virginia Beach VA 437,994 28.5 1.7 26.8 758 11,717 12,475
Tampa FL 350,758 34.5 6.2 28.4 2,162 9,947 12,109
Mesa AZ 451,391 35.3 4.0 31.3 1,804 14,140 15,944
Long Beach CA 469,893 35.8 5.8 30.1 2,705 14,131 16,836
Raleigh NC 420,594 37.0 4.2 32.8 1,780 13,779 15,559
Arlington TX 379,295 44.9 5.0 39.8 1,909 15,109 17,018
Colorado Springs CO 432,287 46.0 4.6 41.4 1,968 17,899 19,867
Sacramento CA 476,557 49.3 7.4 41.9 3,520 19,967 23,487
Omaha NE 417,970 51.8 5.9 45.9 2,485 19,178 21,663
Bakersfield CA 355,696 55.3 5.4 49.9 1,929 17,754 19,683
Minneapolis MN 390,240 59.5 9.9 49.6 3,872 19,359 23,231
Wichita KS 386,409 62.0 7.4 54.5 2,869 21,070 23,939
Tulsa OK 398,904 62.1 9.9 52.2 3,949 20,807 24,756
Miami FL 414,327 65.5 11.7 53.8 4,856 22,271 27,127
Kansas City MO 464,073 67.9 12.6 55.3 5,862 25,642 31,504
Cleveland OH 393,781 75.6 13.8 61.7 5,449 24,309 29,758
Atlanta GA 437,041 79.1 13.8 65.3 6,027 28,554 34,581
Oakland CA 399,487 85.9 19.9 65.9 7,963 26,342 34,305

Homeless at the Oceanfront

Lost Children
Lifeguards, EMS and Police-Coordination through Dispatch Summer Interns/Courtesy Patrol Hotel wristbands
During the summer of 2013, between Memorial Day and
Labor Day, the VBPD responded to 606 reported lost children.
This is a little over 6 a day.

Lost Children (continued)

CPTED/Crime Prevention Efforts
Stickers – by cash registers, bathrooms, etc. Brochures at Oceanfront & Sandbridge –
5,000 handed out PSA – in hotels, local media and VBTV Social Media “Lock It or Lose It” campaign Do Not Tow

Hotel/MotelPublic Safety Announcement

International StudentsInternational Student Outreach Program (ISOP)
Volunteers, sponsors, and law enforcement meet with incoming foreign students to inform them about resources, safety, and local laws.
Information is also available for them online and in their own languages.

First Aid/CPR/AEDs/TourniquetIn an effort to prepare for emergency events, the Virginia Beach Police Department began CPR certification courses in 2001. Training has been expanded to include basic first aid such as splinting, bandaging, and tourniquet use, in addition to CPR and the use of AEDs. The department became an integral component to the Emergency Response System with the introduction of Automated External Defibrillators (AEDs).
Currently, the Virginia Beach Police Department has access to 166 AEDs. In 2012, Virginia Beach police officers successfully administered an AED 34 times.

Crowds – Beach Street Appeal of Beach Street draws crowds Family friendly events Planned activity
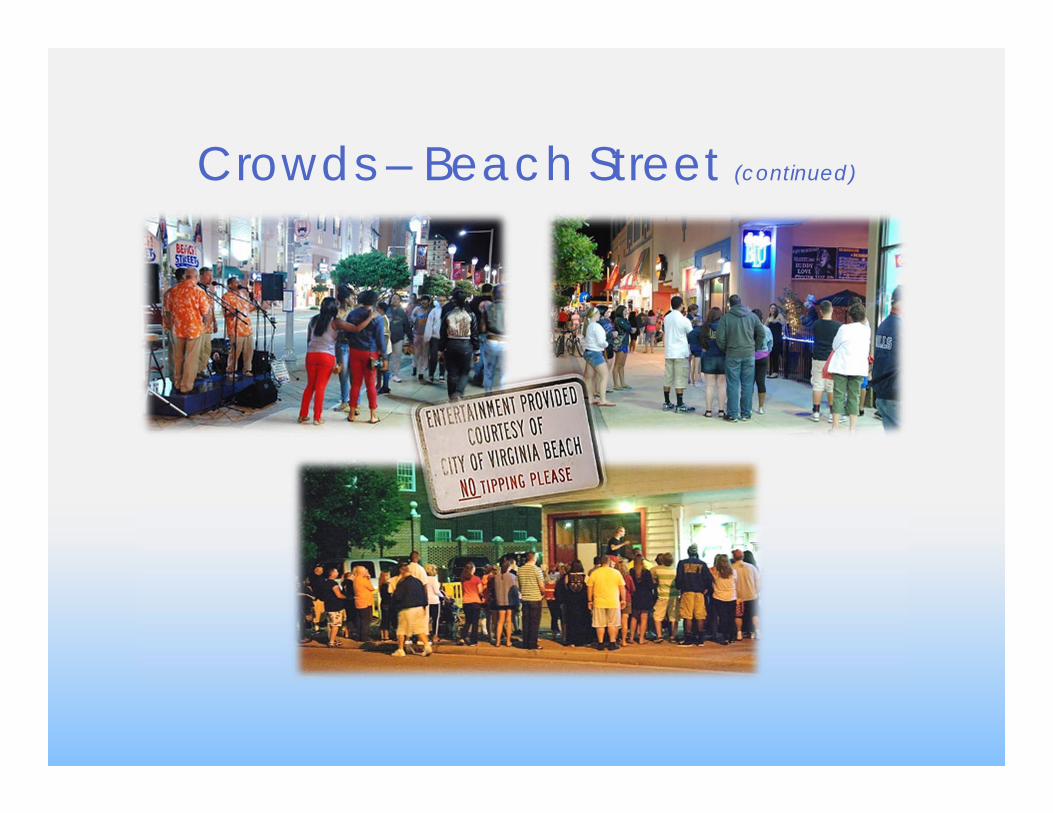
Crowds – Beach Street (continued)

Oceanfront vs.Super Bowl Security
Crowd control/screening, i.e. sporting events, concerts Bags are checked, magnetometers Military as needed

Resort Destinations
Resort Population Off/1,000* Annual Visitors
Ocean City, MD 7,100 14.8 8,000,000
Ocean City, NJ 11,700 5.0 1,000,000
Myrtle Beach, SC 27,100 10.1 14,000,000
Daytona Beach, FL 61,000 4.0 7,700,000
Virginia Beach, VA 450,000 1.8 2,750,000
(*Number officers per 1,000 people)

Visual Behavior Control

Chaplains The Virginia Beach Police Chaplains Program has 24 active
members offering emotional support to members of the PoliceDepartment, citizens of Virginia Beach, and our visitors.
The Police Chaplains donated over 6,000 hours of service invaried tasks such as ride-alongs, walking tours on theoceanfront, death notifications, and Project Lifesaver.
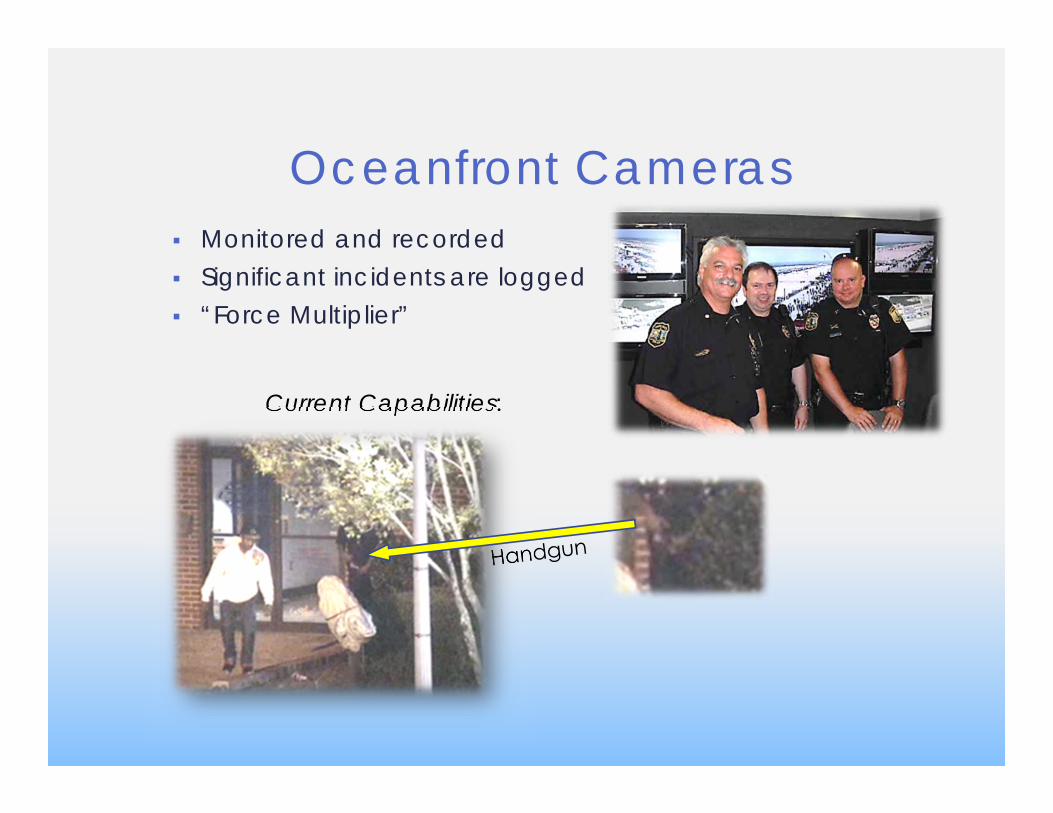
Oceanfront Cameras Monitored and recorded Significant incidents are logged “Force Multiplier”
Current Capabilities:

Leaning Forward Establish work groups focusing on internal and external
initiatives:
Seek continued assistance from the community and otherstakeholders for outreach efforts and recommendations forsolutions, strategies and better ways to manage theoceanfront dynamics.
Community Issues need Community Solutions.
- New camera system- Increased staffing- New code changes
- Outreach efforts- Coordination stakeholders- Redesign options

QUESTIONS?