Embed Size (px)
Citation preview
Aerial Surveys of EndangeredWhales in the Beaufort Sea,Fall 1988
●OCS StudyMMS 89-0033
Jo fq
U.S. Department of the InteriorMinerals Management ServiceAlaska OCS Region

Any use of trade names is for description purposes only and does not constitute endorsementof these products by the Minerals Management Service.
Aerial Surveys of EndangeredWhales in the Beaufort Sea,Fall 1988
By Stephen f). Treaty, Project ManagerMMS Bowhead Whale Aerial Survey
U.S. Department of the InteriorMinerals Management ServiceAlaska OCS Region
OCS StudyMMS 89-0033
Anchorage, Alaska1989
ABSTRACT
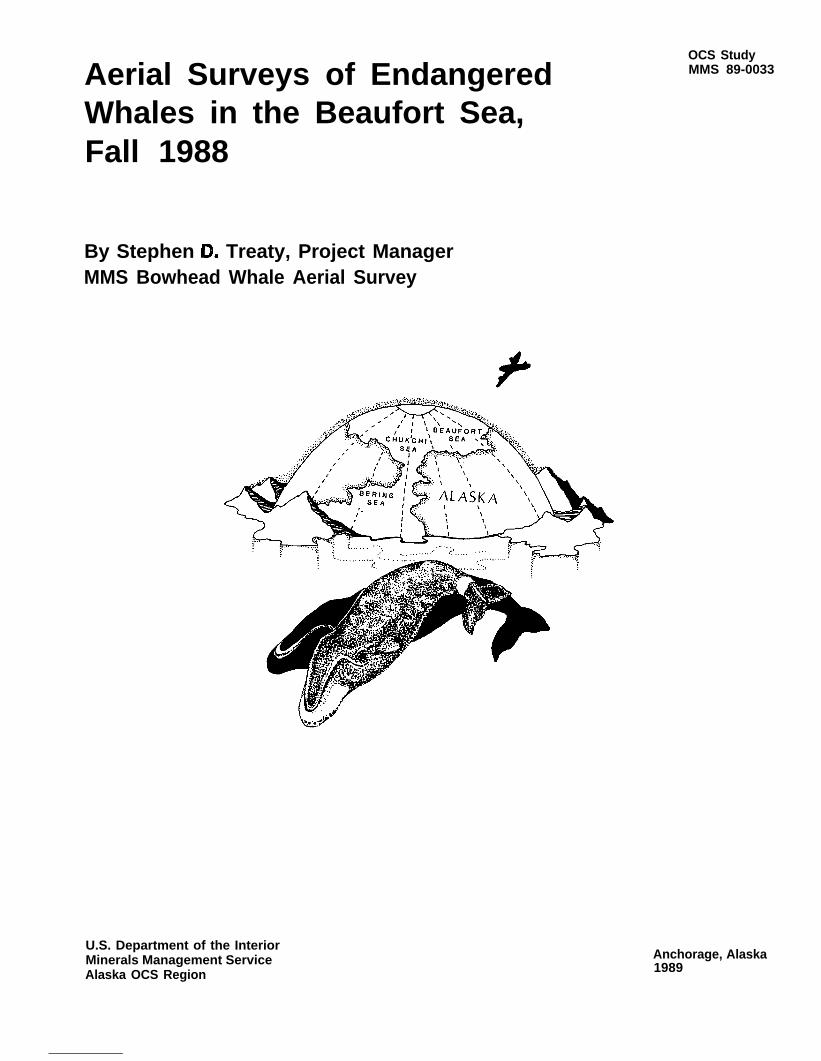
This report describes field activities and data analyses for aerial surveys of bowhead whales conductedbetween 1 September 1988 and 20 October 1988 in the Beaufort Sea, primarily between 1400 W. and1540 W. longitudes south of 720 N. latitude. A total of 37 bowhead whales, 4 gray whales (including onedead whale), 180 beluga whales, 16 bearded seals, 51 ringed seals, 34 unidentified pinnipeds, and 21 polarbears were observed in 1988 during 121.44 hours of survey effort that included 54.75 hours on randomtransects. The initial sighting of bowhead whales in Alaskan waters occurred on 14 September 1988. Half(median) of the 37 bowheads observed had been counted by 30 September, while the peak count (mode)of 8 bowhead whales occurred on 9 October 1988. The last bowhead sighting in the Beaufort Sea occurredon 13 October 1988 in an ice lead (ice cover during September and October 1988 was exceptionally heavy).Except for one truly anomalous year (1983) when the fall migration occurred in relatively deep water, medianand mean water depths at random bowhead sightings in 1988 (42 meters and 61 meters, respectively) weregenerally consistent with values for years of heavy or moderate ice coverage.


ACKNOWLEDGMENTS
Proiect Management
Cleveland J. Cowles, Ph. D., SupervisorStephen D. Treaty, Project Manager
Proiect Field Scientists
Stephen D. Treaty, Team Leader (Flights 1-8 and 16-26)Karen J. Gibson, Team Leader (Flights 9-15 and 26-32)John Dunlap, Data Recorder-Observer (Flights 1-6 and 8-1 6)Don Hansen, Observer (Flights 1-6 and 8-1 5) and Data Recorder-Observer (Flight 7)Kevin Banks, Data Recorder-Observer (Flights 15-32)Gail Irvine, Ph. D., Observer (Flights 16-32)Brunhilde O’Brien, Alternate Observer (Flights 22-24)Richard Rothley, Observer (Flight 7) and Alternate Obsetver (Flight 8)
Contracting Officer’s Technical Re~resentative - Suimortina Contract
Dale Kenney (MMS/Office of Aircraft Services 1A 14-12-00
The project management gratefully acknowledges the initial c=~r checking and analysis of field dataprovided by Sue Moore and Janet Clarke (SEACO, a division of SAIC). We also acknowledge JoanneGroves of the University of Alaska-Fairbanks Geophysical Institute for analyzing ice concentrations.In addition, we acknowledge the Office of Aircraft Services (OAS) for making all aircraft arrangements andE.J. Fish and Ken Seaman (Evergreen Helicopters of Alaska, Inc.) for piloting the Twin Otter.
Alaska OCS Region personnel who supported production of this study were Bennie Sheppard (Clerk-Typist)and the Cartographic Section. Ann Treaty contributed the cover illustration.

CONTENTS
PJIQ
ABSTRACT . . . . . . . . . . . . . . . . . . . . . . . . . . . . . . . . . . . .........i
ACKNOWLEDGMENTS . . . . . . . . . . . . . . . . . . . . . . . . . . . . . . . . . . . . . . ..ii
1.
Il.
Ill.
INTRODUCTION . . . . . . . . . . . . . . . . . . . . . . . . . . . . . . - . . . . . . . ...1
METHODSAND MATERIALS . . . . . . . . . . . . . . . . . . . . . . . . . . . . . . . . ...3A. Study Area. . . . . . . . . . . . . . . . . . . . . . . . . . . . . . . . . . . . . . . . . . 3B. Equipment . . . . . . . . . . . . . . . . . . . . . . . . . . . . . . . . . . . . . . . . ...3C. Aerial-SurveyDesign . . . . . . . . . . . . . . . . . . . . . . . . . . . . . . . . . . . ...5D. Survey-FlightProcedures . . . . . . . . . . . . . . . . . . . . - . . . . . . . . . . . . . 5E. Data Entry . . . . . . . . . . . . . . . . . . . . . . . . . . . . . . . . . . . . . . . . ...5F. General Data Analyses . . . . . . . . . . . . . . . . . . . . . . . . . . . . . . . . . . ...9G. Median Water Depth at Bowhead Sightings (Analysis Protocol) . . . . . . . . . . . . . . 11
RESULTS . . . . . . . . . . . . . . . . . . . . . . . . . . . . . . . . . . . . . . . . . ...15A. Environmental Conditions. . . . . . . . . . . . . . . . . . . . . . . . . . . . . . . ...15B. Survey Effort . . . . . . . . . . . . . . . . . . . . . . . . . . . . . . . . . . . . . . ...15C. Bowhead Whale ~Balaena mvsticetus) Observations . . . . . . . . . . . . . . . . . . . . . 15
1. Distribution . . . . . . . . . . . . . . . . . . . . . . . . . . . . . . . . . . . . . . . . 152. RelativeTemporaland Spatial Abundance . . . . . . . . . . . . . . . . . . . . . . . . 353. Habitat Relationships . . . . . . . . . . . . . . . . . . . . . . . . . . . . . . . . ...354. Behavior, SwimDirection,and Speed . . . . . . . . . . . . . . . . . . . . . . . . . . . 43
D. OtherMarineMammal Observations . . . . . . . . . . . . . . . . . . . . . . . . . . ...43l. GrayWhale (Eschrichtiusrobustus . . . . . . . . . . . . . . . . . . . . . . . . . . . . 432. Beluga Whale (Del~hinaPterus leucas) . . . . . . . . . . . . . . . . . . . . . . . . . . 433. Ringed Seal (PhocahisPida) . . . . . . . . . . . . . . . . . . . . . . . . . . . . ...434. Bearded Seal @ianathusbarbatus) . . . . . . . . . . . . . . . . . . . . . . . . . . . 435. Unidentified Pinnipeds . . . . . . . . . . . . . . . . . . . . . . . . . . . . . . . ...436. Polar Bear(Ursus maritimus) . . . . . . . . . . . . . . . . . . . . . . . . . . . . ...43
IV. DISCUSSION . . . . . . . . . . . . . . . . . . . . . . . . . . . . . . . . . . . . . . . ...51A. General Comparisons with Previous Surveys (1979-1987) . . . . . . . . . . . . . . . . . . 51B. Median Water Depth at Bowhead Sightings (1982-1988) . . . . . . . . . . . . . . . . . . . 51C. Potential Responses of Bowheads to Survey Aircraft . . . . . . . . . . . . . . . . . . . . 57D. Effect of General lce Cover on WPUE . . . . . . . . . . . . . . . . . . . . . . . . . ...57E. Management Use of Real-Time Field Information . . . . . . . . . . . . . . . . . . . . . 61
V. LITERATURE CITED . . . . . . . . . . . . . . . . . . . . . . . . . . . . . . . . . . . . ...63
APPENDICES
Appendix ABowhead Whale Densities . . . . . . . . . . . . . . . . . . . . . . . . . . . .. A-lAppendix B: Daily Flight Summaries - Twin Otter . . . . . . . . . . . . . . . . . . . . . . . B-1Appendix C: Success of Primary Observers in Locating Whales . . . . . . . . . . . . . . . . C-1
Glossary of Acronyms, Initialisms, and Abbreviations
LIST OF FIGURES
FigureNumber
1
2
3
4
5
6
7
8
9
10
11
12
13
14
15
16
17
18
19
20
21
22
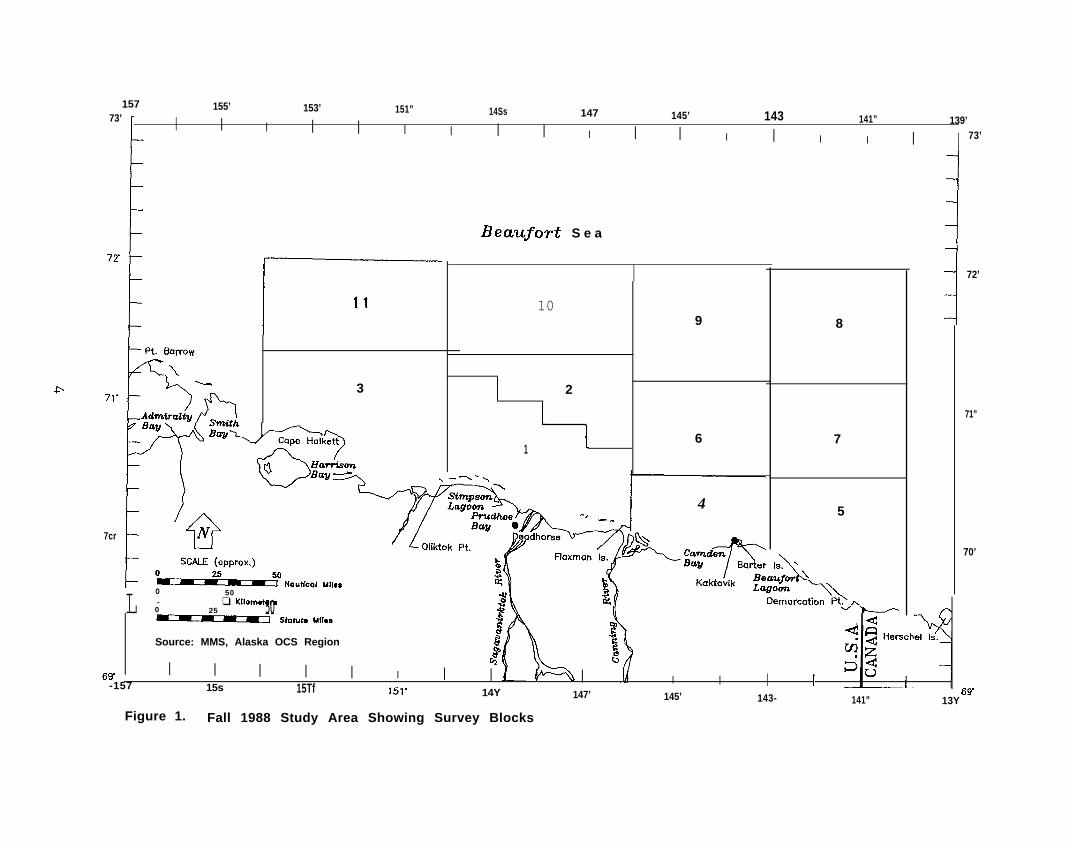
Fall 1988 Study Area Showing Survey Blocks . . . . . . . . . . . . . . . . . .
Example of Computer-Generated Flight Track . . . . . . . . . . . . . . . . . .
Regions B, C*, and D’....... . . . . . . . . . . . . . . . . . . . . . .
Map of Ice Concentrations in the Beaufort Sea,
Map of Ice Concentrations in the Beaufort Sea,
Map of Ice Concentrations in the Beaufott Sea,
Map of Ice Concentrations in the Beaufort Sea,
Map of Ice Concentrations in the Beaufort Sea,
Map of Ice Concentrations in the Beaufort Sea,
Map of Ice Concentrations in the Beaufort Sea,
Map of Ice Concentrations in the Beaufort Sea,
Combined Flight Tracks, 1-15 September 1988
30 August 1988 . . . . . . . .
6 September 1988 . . . . . . .
13 September 1988 . . . . . .
20 September 1988 . . . . . .
27 September 1988 . . . . . .
40ctober 1988 . . . . . . . .
11 October 1988 . . . . . . . .
180ctober 1988 . . . . . . . .
. . . . . . . . . . . . . . . . .
Combined Flight Tracks, 16-30 September 1988 . . . . . . . . . . . . . . . .
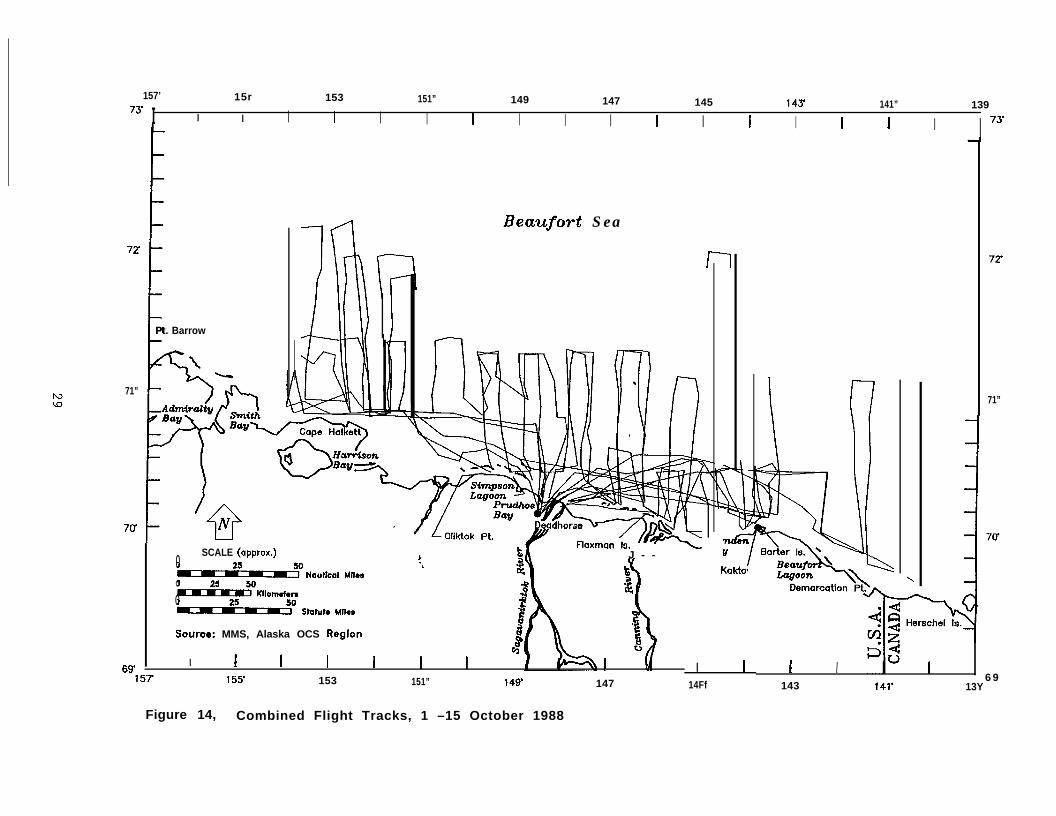
Combined Flight Tracks, 1-15 October 1988 . . . . . . . . . . . . . . . . . . .
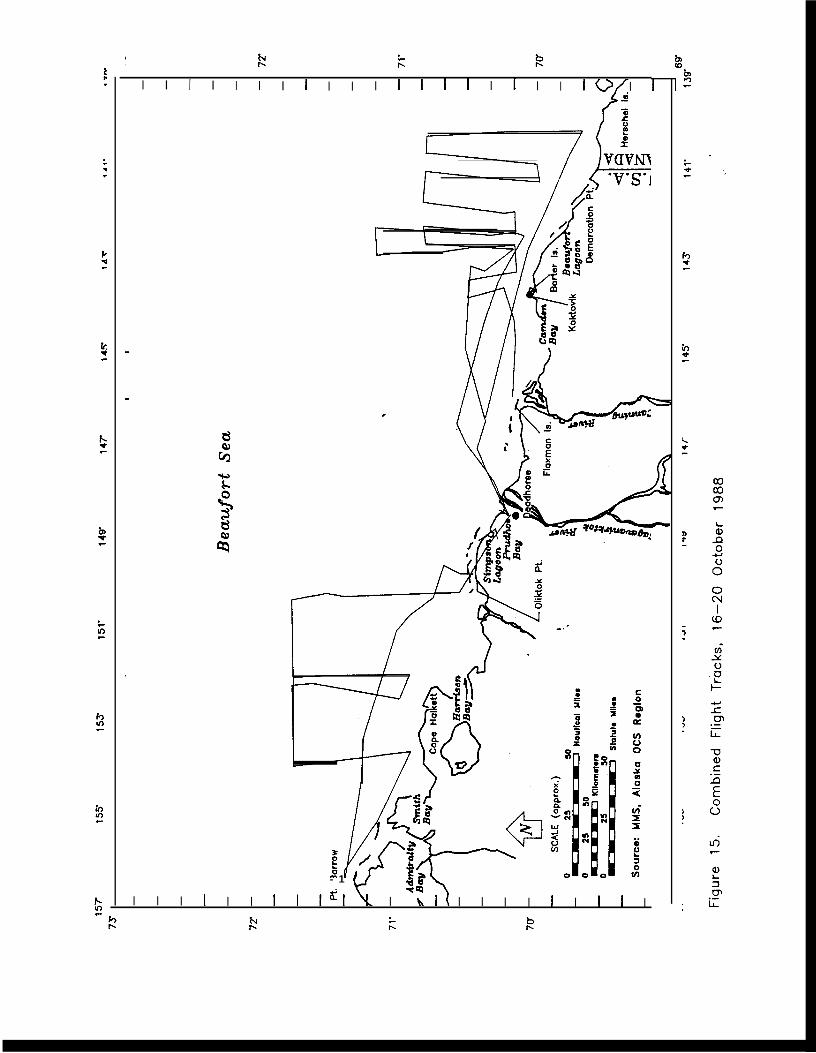
Combined Flight Tracks, 16-20 October 1988 . . . . . . . . . . . . . . . . . .
Map of Bowhead Whale Sightings, 1-15 September 1988, Showing OCS Leasesand Position of Kulluk— ,.. . . . . . . . . . ---- . . . . . . . . . . . . . .
Map of Bowhead Whale Sightings, 16-20 September 1988, Showing OCS Leasesand Position of Kulluk—. . . . . . . . . . . . . . . . . . . . . . . . . . . . . .
Map of Bowhead Whale Sightings, 1-15 October 1988, Showing OCS Leasesand Position of Kulluk—. . . . . . . . . . . . . . . . . . . . . . . . . . . . . .
Map of Bowhead Whale Sightings, 1 September-20 October 1988, ShowingOCS Leases and Position of Kulluk—. . . . . . . . . . . . . . . . . . . . . . .
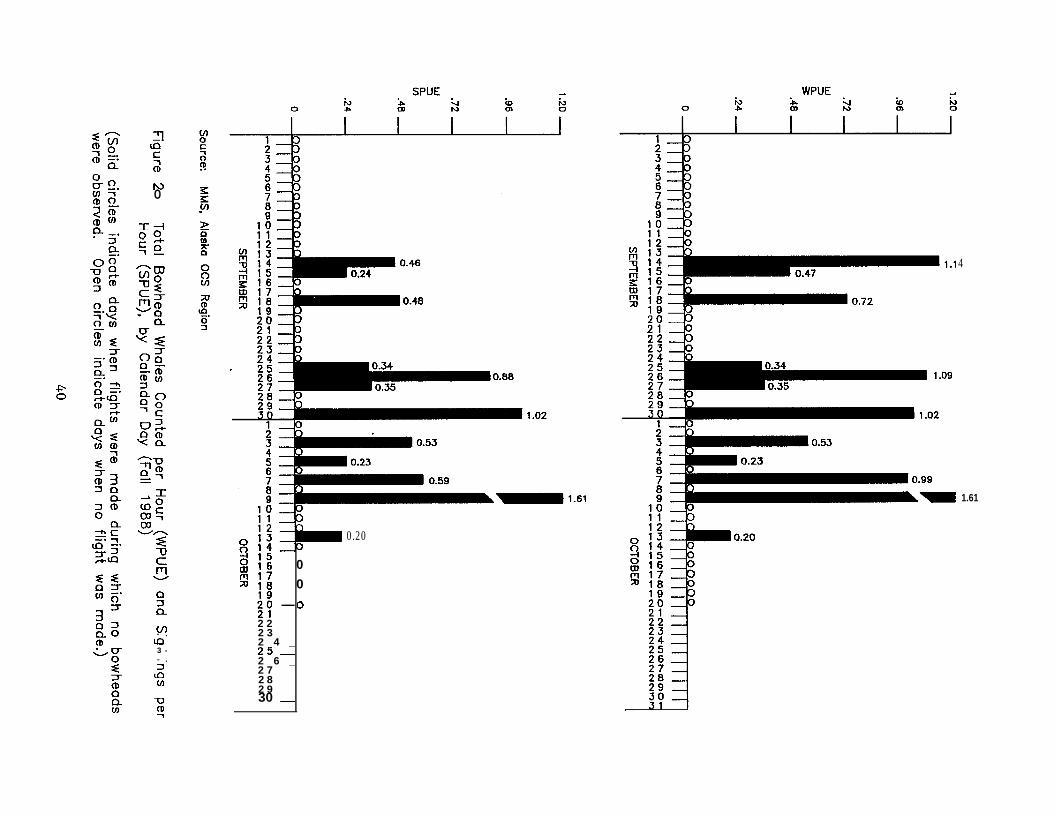
Total Bowhead Whales Counted per Hour (WPUE) and Sightings per Hour(SPUE), by Calendar Day(Fall 1988) . . . . . . . . . . . . . . . . . . . . .
Number of Survey Hours and Number of Bowhead Whales Counted September-October 1988, by Survey Block.... . . . . . . . . . . . . . . . . . . . . .
Semimonthly Summary of Swim Directions for Bowhead Whales (Fall 1988) . .
m9!2
. . . . . . 4
. . . . . . 7
. . . . . 12
. . . . . 19
. . . . . 20
. . . . . 21
. . . . . 22
. . . . . 23
. . . . . 24
. . . . . 25
. . . . . 26
. . . . . 27
. . . . . 28
. . . . . 29
. . . . . 30
. . . . . 31
. . . . . 32
. . . . . 33
. . . . . 34
. . . . . 40
. . . . . 41
. . . . . 45
vi
LIST OF FIGURES(Continued)
FigureNumber ~ ~
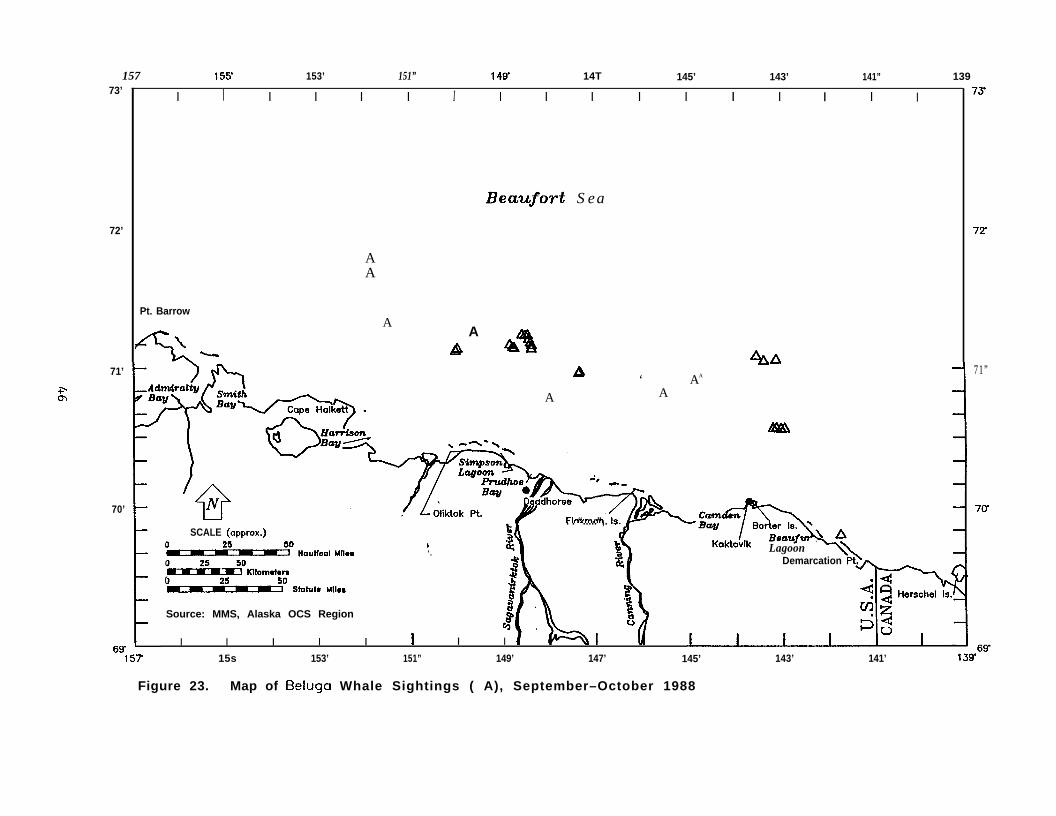
23 Map of Beluga Whale Sightings, September-October 1988 . . . . . . . . . . . . . . . . 46
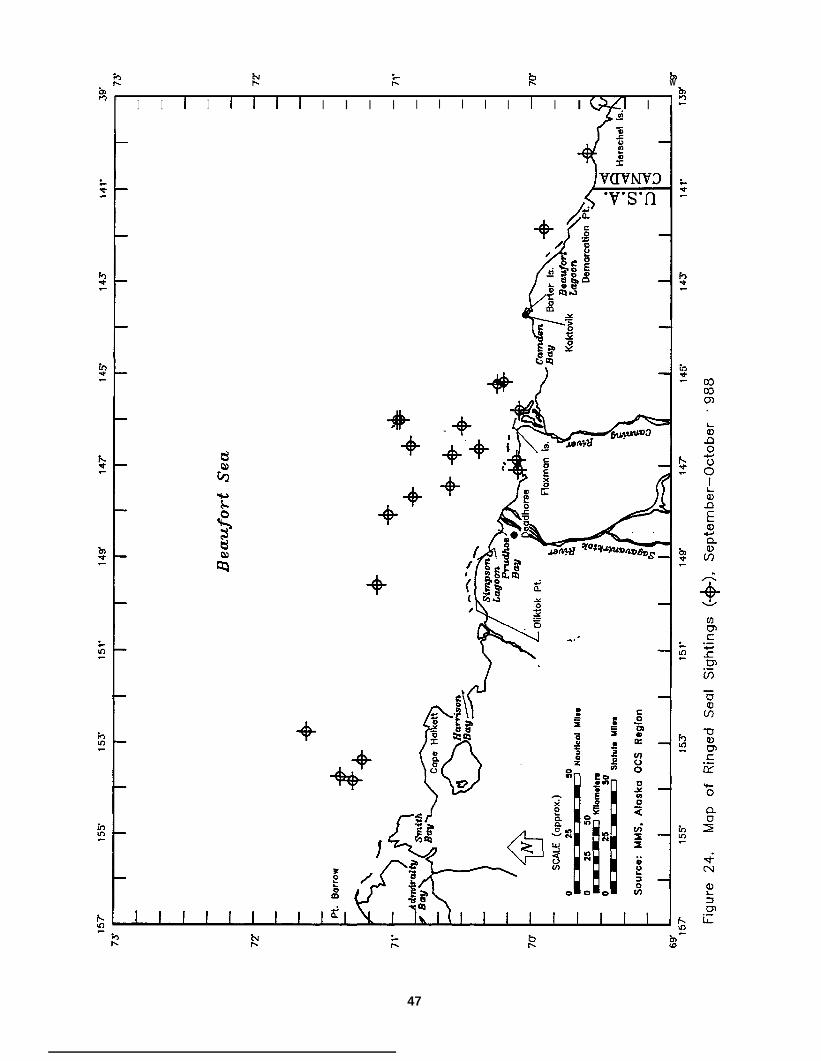
24 Map of Ringed Seal Sightings, September-October 1988 . . . . . . . . . . . . . . . . . 47
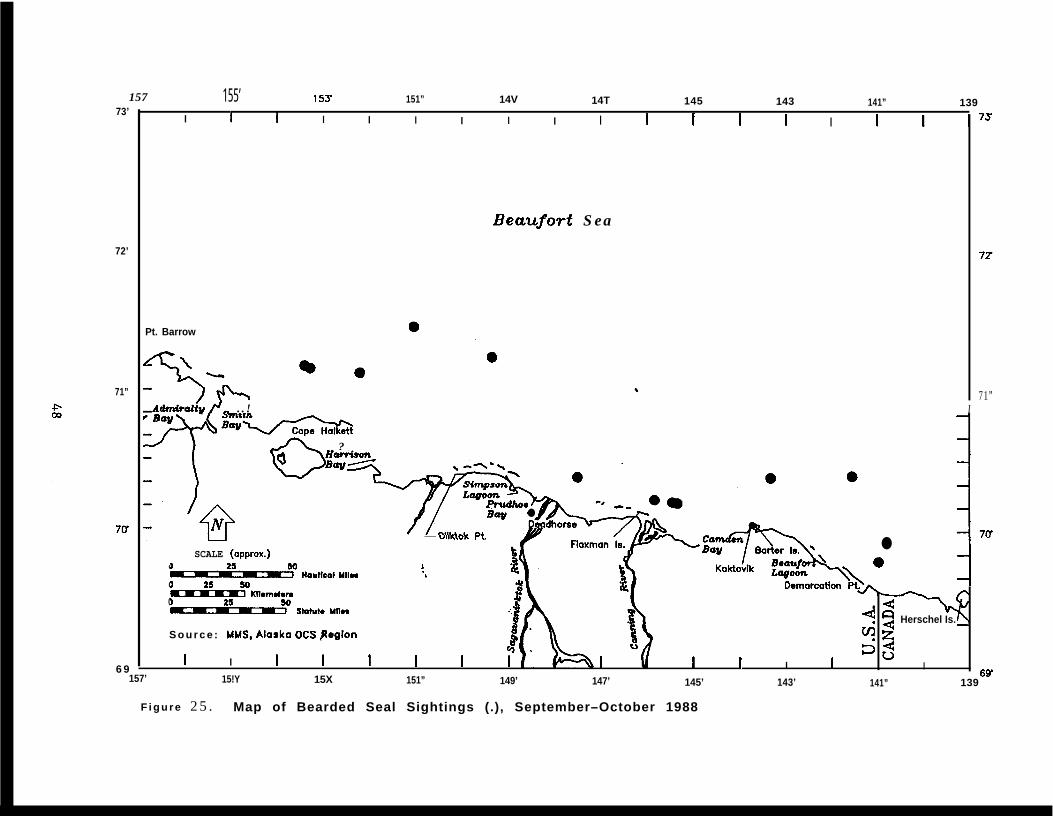
25 Map of Bearded Seal Sightings, September-October 1988 . . . . . . . . . . . . . . . . 48
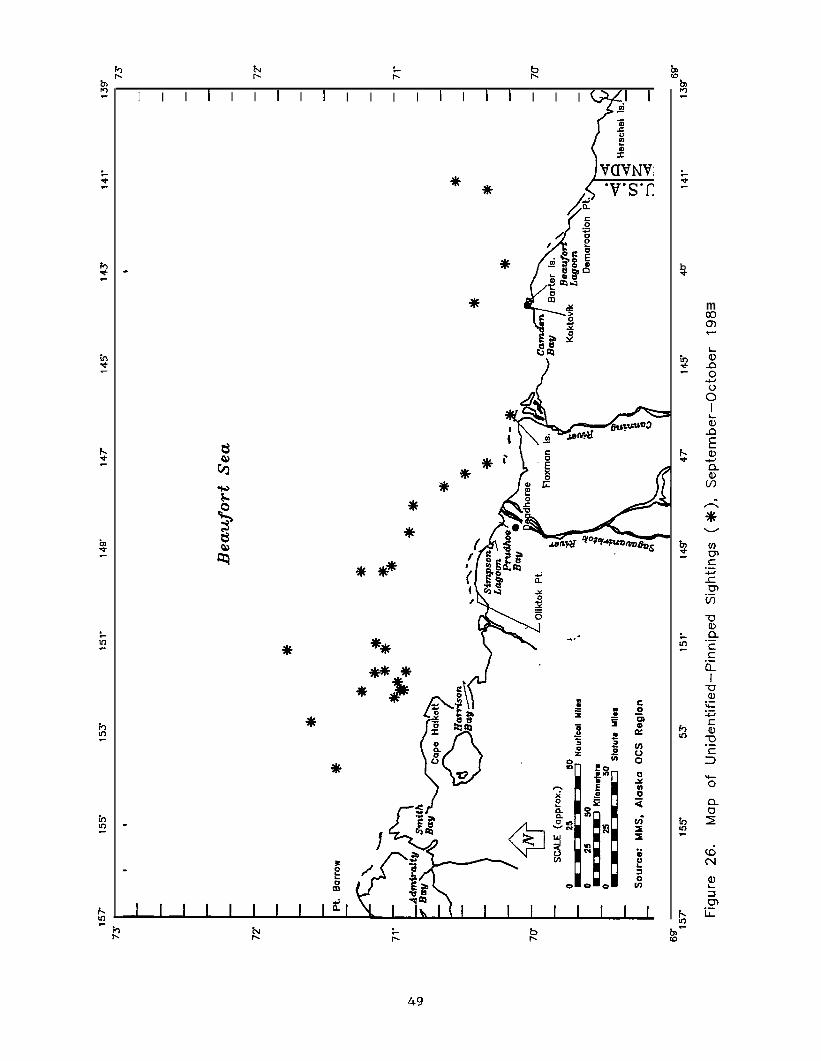
26 Map of Unidentified-Pinniped Sightings, September-October . . . . . . . . . . . . . . . 49
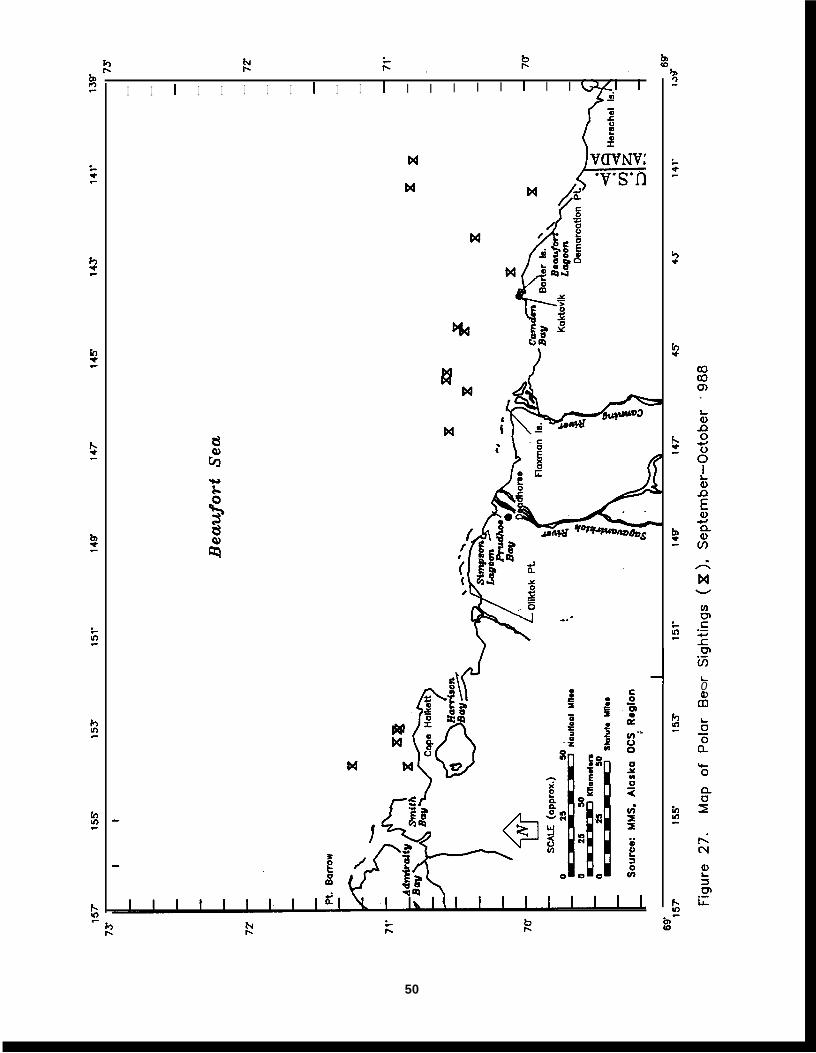
27 Map of Polar Bear Sightings, September-October 1988 . . . . . . . . . . . . . . . . . . 50
28 Kulluk Drilling Barge on Location. . . . . . . . . . . . . . . . . . . . . . . . . . ...62
vii
LIST OF TABLES
TableNumber ~ !&fQ
1
2
3
4
5
6
7
8
9
10
11
12
13
14
15
16
17
Data-Entry Sequence on the Portable Flight Computer . . . . . . . . . . . . . . . . . . . 6
Operational Definitions of Observed Whale Behaviors . . . . . . . . . , . . . . . . . . . 10
Aerial-Survey Effort in the Beaufort Sea, September-October 1988, by Survey Flight . . . 16
Semimonthly Summary of Survey Effort, Fall 1988 . . . . . . . . . . . . . . . . . . . . 17
Summary of Marine Mammal Sightings, by Sutvey Flight (Fall 1988) . . . . . . . . . . . 18
Number of Sightings and Total Bowhead Whales Counted per Hour of SurveyEffort, by Flight Day(3Sep -200ct 1988) . . . . . . . . . . . . . . . . . . . . . . . . 36
Semimonthly Relative Abundance (WPUE) of Bowhead Whales, by Survey Block(Fall 1988) . . . . . . . . . . . . . . . . . . . . . . . . . . . . . . . . . . . . . . ...37
Semimonthly Summary of Bowhead Whales Counted, by Water Depth at SightingLocation (Fall 1988) . . . . . . . . . . . . . . . . . . . . . . . . . . . . . . . . . . ..38
Semimonthly Summary of Bowhead Whales Counted, by Percent Ice Cover Presentat Sighting Location (Fall 1988).. . . . . . . . . . . . . . . . . . . . . . . . . . ...39
Semimonthly Summary of Bowhead Whales Counted, by Behavioral Category(Fall 1988) . . . . . . . . . . . . . . . . . . . . . . . . . . . . . . . . . . . . . . ...44
Semimonthly Summary of Bowhead Whales Counted, by Swimming Speed(Fall 1988) . . . . . . . . . . . . . . . . . . . . . . . . . . . . . . . . . . . . . . ...44
Bowhead Whale Relative Abundance (WPUE) by Beaufort Sea Survey Block duringSeptember and October 1979-1988.. . . . . . . . . . . . . . . . . . . . . . . . ...52
Central-Tendency Statistics for Water ~epth at ~andom Bowhead Whales Sightings(September-October) in Regions B, C , and D , by Year and Region . . . . . . . . . . 53
InterYear Correlation of the Median Water Depths at Random Bowhead Whale(September-October), Using the Mann-Whitney U Test . . . . . . . . . . . . . . . . . . 54
InterYear Correlation of the Mean Water Depths at Random Bowhead WhaleSightings (September-October), Using Analysis of Variants and the Tukey Test . . . . . . 56
Semimonthly Summary of Bowhead Whales Potentially Responding to SurveyAircraft (Fall 1988) . . . . . . . . . . . . . . . . . . . . . . . . . . . . . . . . . . . ..58
Relative Abundance (VVPUE) of Bowhead Whales within the Primary Study Areaduring September and October, by Year and General Ice Coverage . . . . . . . . . . . 59
. . .Vlll
1. INTRODUCTION
In 1953, the Outer Continental Shelf Lands Act (OCSfA) (43 U.S.C. 1331-1356) established Federaljurisdiction over the submerged lands of the continental shelf seaward of State boundaries. The Act chargedthe Secretary of the Interior with the responsibility for administering minerals exploration and developmentof the OCS. It also empowered the Secretary to formulate regulations so that the provisions of the Act mightbe met. The OCSLA Amendments of 1978 (43 U.S.C. 1802) established a policy for the management of oiland natural gas in the OCS and for protection of the marine and coastal environments. The amendedOCSL4 authorizes the Secretary of the Interior to conduct studies in areas or regions of sales to ascertainthe “environmental impacts on the marine and coastal environments of the outer Continental Shelf and thecoastal areas which may be affected by oil and gas development” (43 U.S.C. 1346).
Subsequent to the passage of the OCSIA, the Secretary of the Interior designated the Bureau of LandManagement (BLM) as the administrative agency responsible for leasing submerged Federal lands and theU.S. Geological Survey (USGS) for supervising production. In 1982, the Minerals Management Service(MMS) assumed these responsibilities.
In response to information needed for environmental impact statements (EIS’S) and environmentalassessments under the National Environmental Policy Act of 1969, and to assure protection of marinemammals under the Marine Mammal Protection Act of 1972 (16 U.S.C. 1361-1407) and the EndangeredSpecies Act (ESA) of 1973, BLM funded numerous studies involving acquisition and analysis of marinemammal and other environmental data.
In June 1978, BLM entered into an ESA Section 7 consultation with the National Marine Fisheries Service(N MFS). The purpose of the consultation was to determine the likely effects of the proposed Beaufort SeaOil and Gas Lease Sale on the endangered bowhead (Balaena mvsticetus) and gray (Eschrichtius robustus)whales. After reviewing available information on the two species, NMFS determined that insufficientinformation existed to conclude whether the proposed Beaufort Sea sale was or was not likely to jeopardizethe continued existence of bowhead and gray whales. In August 1978, NMFS recommended studies to BLMthat would fill the information needs identified during the Section 7 consultation. Subsequent biologicalopinions for Arctic Region sales--including a regional biological opinion; a revised opinion relative to the jointFederal/State lease area; and opinions on Sales 71 (issued in 1982), 87 (issued in 1983), and 97 (issued in1987)--recommended continuing studies of whale distribution and OCS-industry effects on bowhead whales(USDOC, NOAA, NMFS, 1982, 1983, 1987). These opinions also requested monitoring of bowhead whalepresence during periods when geophysical exploration and drilling may be occurring.
On 14 May 1982, the Secretary of the Interior imposed an approximately 2-month seasonal-drilling restrictionon exploratory activity in the joint Federal/State Beaufort Sea sale area. The period of restriction would varydepending on bowhead whale presence, and “this determination would require development of a monitoringprogram. . .“ (USDOI, MMS, 1982). Subsequently, MMS (Alaska OCS Region) adopted a monitoring pIanfor endangered whales that required aerial surveys. The Diapir Field Sale 87 Notice of Sale (1984) statesthat “Bowhead whales will be monitored by the Government, the lessee, or both to determine their locationsrelative to operational sites as they migrate through or adjacent to the sale area” (USDOI, MMS, 1984). TheBeaufort Sea Sale 97 Notice of Sale (1988) does not contain a seasonal-drilling restriction but states that“MMS intends to continue its areawide endangered whale monitoring program in the Beaufort Sea duringexploration activities. The program will gather information on whale distribution and abundance patterns andwill provide additional assistance to determine the extent, if any, of adverse effects to the species” (USDOI,MMS, 1988).
Between 1979 and 1987, MMS funded annual monitoring of endangered whales in arctic waters underInteragency Agreements with the Naval Ocean Systems Center (NOSC) and through subcontracts toSEACO, Inc. On 15 April 1987, a proposal for MMS scientists to conduct aerial surveys of these whaleswas approved by the Associate Director for Offshore Minerals Management. The MMS will continue usingMMS personnel to perform fieldwork and reporting activities for the Beaufort Sea on an annual basis.
To assure consistency with earlier surveys, personnel from NOSC and SEACO, Inc., actively participatedin the training of project observers. Initial training included lectures, slide presentations, simulateddata-collection and field-analysis workshops with the onboard computer system, and aerial surveys of beluga

whales in Cook Inlet. Previous observers participated as additional observers on some flights and conductedperiodic consistency checks of the collected data during 1988 Beaufort Sea surveys. A comparison ofsighting rates between MMS and previous observers appears in Appendix C. Following the field season,the contractor for the previous bowhead surveys performed computerized analyses of the raw data usingthe same computer programs developed for those earlier surveys.
Concurrent studies by NOSC and SEACO, Inc., in the Chukchi Sea have employed identical aerial-surveyand data-anal ysis methodology. Data collected for the Chukchi Sea in 1988 will be analyzed and comparedto other data from the same study area following the 1989 field season. These data, as well as previoussurvey reports, are available for inspection at the Minerals Management Service, Library/Public InformationRoom, 949 East 36th Avenue, Anchorage, Alaska 99508-4302.
The present goals of the ongoing endangered whale-survey program are to:
1. Provide real-time data to MMS and NMFS on the fall migration of bowhead whales for use inimplementing overall seasonal-drilling restrictions and seasonal limitations on geological/geophysicalexploration;
2. Provide real-time, site-specific data on endangered whales for use by MMS Resource Evaluation inday-to-day regulation of seismic-exploration operations;
3. Continue collection of data to describe temporal and spatial trends in the distribution, relative abundance,habitat, and behaviors of endangered whales in arctic waters;
4. Continue data collection and between-year trend analysis of the median depth (or distance from shore)of the migration axis for bowhead whales;
5. Record and map other marine mammals observed incidentally to endangered whale surveys; and
6. Determine seasonal distribution of endangered whales in other planning areas of interest to MMS.
Il. METHODS AND MATERIALS
A. Studv Area
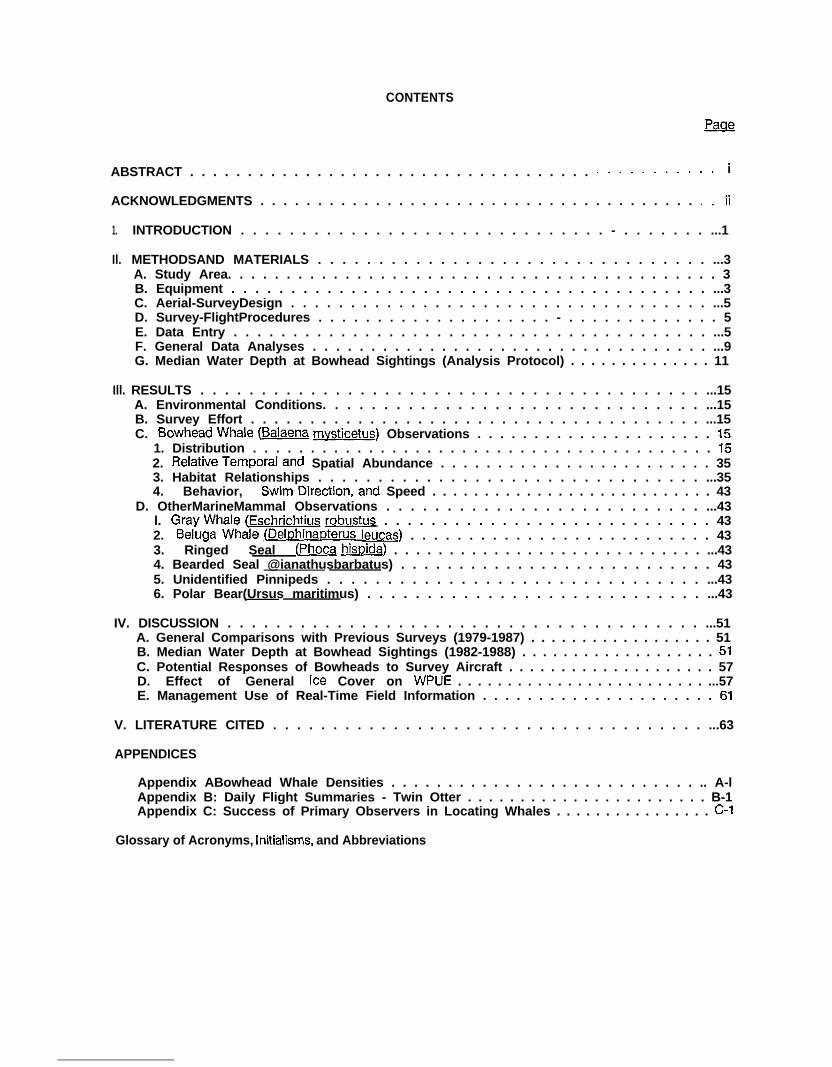
The overall annual survey program is based on a design of random field transects within establishedgeographic blocks in and adjacent to Chukchi and Beaufort Sea sale areas offshore of Alaska. The presentstudy, which was focused on the bowhead whale migration from 1 September 1988 to 20 October 1988,included Beaufort Sea Survey Blocks 1 through 11 (Fig. 1) between 1400 W. and 1540 W. longitude southof 720 N. latitude. O~casional flights involved survey coverage in Canada as far east as 1370 W. longitudeand west to 156”30 W. longitude.
In the Beaufort Sea, Iandfast ice forms during the fall and may eventually extend up to 50 kilometers (km)offshore by the end of winter (Norton and Weller, 1984). The pack ice, which includes multiyear ice 4 meters(m) thick, on average, with pressure ridges up to 50 m thick (Norton and Weller, 1984), becomes contiguouswith the new and fast ice in late fall--effectively closing off the migration corridor to westbound bowheadwhales. From early November to mid-May, the Beaufort Sea normally remains almost totally covered by iceconsidered too thick for whales to penetrate. In mid-May, a recurring flaw lead can form just seaward ofthe stable fast ice, followed by decreasing ice concentrations (LaBelle et al., 1983) and large areas of openwater in summer.
Local weather patterns affect the frequency and effectiveness of all marine aerial surveys. The presentstudy area is in the arctic climate zone, where mean annual temperature is about -120 C. Precipitationranges from 13 centimeters (cm) at Barrow to 18 cm at Barter Island and occurs mostly as summer rain.Fog frequently reduces visibility along the coast during the open-water season. Winds are persistent indirection and speed. Mean annual speed is 5 m per second at Barrow and 6 m per second at Barter Island.Sea breezes occur during about 25 percent of the summer and extend to at least 20 km offshore (Breweret al., 1977).
Sea state is another environmental factor affecting visibility during aerial surveys. Ocean waves, which aregenerally from the northeast and east, are limited to the open-water season, during which the ice packcontinues to limit fetch. Because of the pack ice, significant wave heights are reduced by a factor of 4 fromheights that would otherwise be expected in summer. Wave heights greater than 0.5 m occurred in only22 percent of the observations summarized by Brewer et al. (1977). Wave heights greater than 5.5 m arenot reported within this Beaufort Sea database of 2,570 observations.
The study area contains sufficient zooplanklon to suppoti some feeding by bowhead whales. The availabilityof zooplankton during the fall would be expected to vary between years, geographic locations, and waterdepths in response to ambient oceanographic conditions. In September 1985 and 1986, average zoo-plankton biomass in the Alaskan Beaufort Sea east of 1440 W. longitude was highest south of the 50-misobath in subsurface water (LGL Ecological Research Associates, Inc., 1987).
B. Euui~ment
The aircraft used for the surveys was a de Havilland Twin Otter Series 300 with call sign 302EH. The aircraftwas equipped with a Global Navigation System (GNS) 500 that provided continuous position updating(0.6-km/sutvey-hour [h] precision) and transect-turning-point programming. The Twin Otter’s maximum timealoft was approximately 4.5 h extended to 7.5 h through the use of a supplemental onboard fuel tank.
The Twin Otter was equipped with small bubble windows aft for an observer and a data recorder-observer.A third observer-navigator occupied the copilot seat and was afforded good forward and side viewing fromthat position. Each observer had a hand-held Suunto clinometer to take angles on endangered whalesightings. Observers and pilots were linked to common communication systems, and commentary couldbe recorded.
A portable (Hewlett-Packard 85) computing system was used aboard the aircraft to store and later toanalyze flight data. The computer was interfaced to the GNS for automatic input of entry number, time,latitude, and longitude and to the radar altimeter for precise input of altitude.
3
157 155’ 153’73’
151” 14Ss
[
147 145’I
143I I
141” 139’I I I I 73’
?r
+77”
7cr
6sr
kPt. Borrow
\
Admiral@Ba~ Smith
Bagk
3
Beaufort S e a
109
2
I
I 61
-, J-.— 4
8
7
5
L o 50-
0 25
\\❑ Kllom.tom 31 “a II Demorcdion pt>*50 41\ II “—?——_——
i72’
71”
70’
~- .Statuta MN,,$ . d
Source: MMS, Alaska OCS RegionJ u
I-157 I
15sI
15Tf I151” 14Y 147’ 145’ 143-
6(Y141” 13Y
Figure 1. Fall 1988 Study Area Showing Survey Blocks
C. Aerial-Survev Desian
Aerial surveys were based out of Dead horse, Alaska, from 1 September to 20 October 1988. The fieldschedule was designed to monitor the progress of the Fall 1988 bowhead migration across the AlaskanBeaufort Sea. Particular emphasis was placed on regional surveys to assess fine-scale shifts in the migrationpathway of bowhead whales in this area. Additional monitoring entailed the priority coordination and datamanagement necessary to support implementation of seasonal offshore-drilling regulations.
Daily flight patterns were based on sets of unique transect grids produced for each survey block. Transectgrids were derived by dividing each survey block into sections 30 minutes of longitude across. One of theminute marks along the northern edge of each section was selected at random to designate one end of atransect leg. The other endpoint of the transect leg was determined similarly using a separate randomlygenerated number along the southern edge of the same section. A straight line, representing one transectleg, was drawn between the two points. The same procedure was followed for all sections of the surveyblock. Transect legs were then connected alternately at their northernmost or southernmost ends toproduce one continuous flight grid within each survey block. The use of random-transect grids is arequirement for later analyses of median water depths at bowhead sightings based on line-transect theory(Cochran, 1963) and analyses of absolute densities based on strip-transect theory (Estes and Gilbert, 1978).
The selection of which survey block to fly on a given day was nonrandom, based primarily on criteria suchas reported weather conditions over the study area, the level of oil drilling activity in various areas, and asemimonthly flight-hour goal for each survey block. Flight-hour goals were allocated proportionately forsurvey blocks and semimonthly time periods based on relative abundance of bowhead whales as determinedfrom previous fall migrations (1979-1 986). Such allocations greatly favor survey coverage in inshore SurveyBlocks 1 through 7 and 11 (Fig. 1), since bowheads were rarely sighted north of these blocks in previoussurveys. The purpose of these survey-effort allocations was to increase the sample size of whale sightingswithin the primary migration corridor, thus increasing the power of statistical analysis within these inshoreblocks.
Nonrandom surveys were flown to further identify whales and their behaviors adjacent to a transect line orwhen in transit to a transect block. Data from nonrandom surveys were considered combinable withrandom-transect data to obtain overall distribution patterns, relative abundance, and behavior of whalesand other marine mammals.
D. Survev-Fliaht Procedures
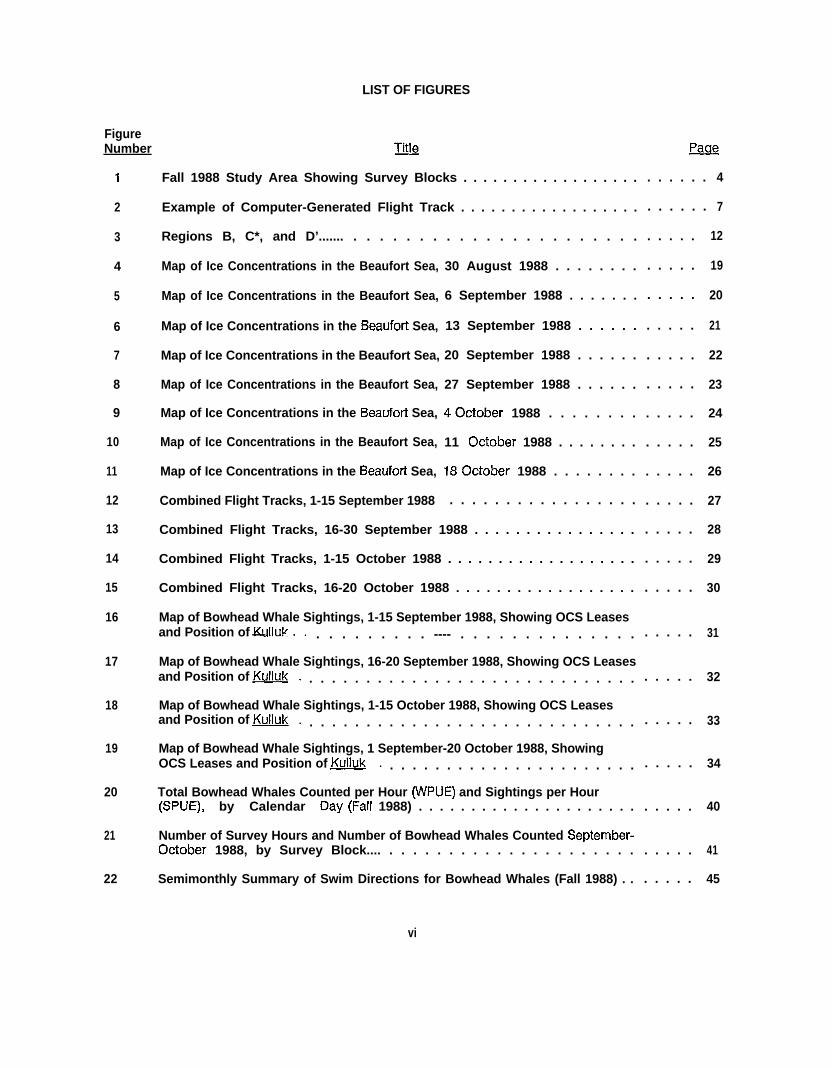
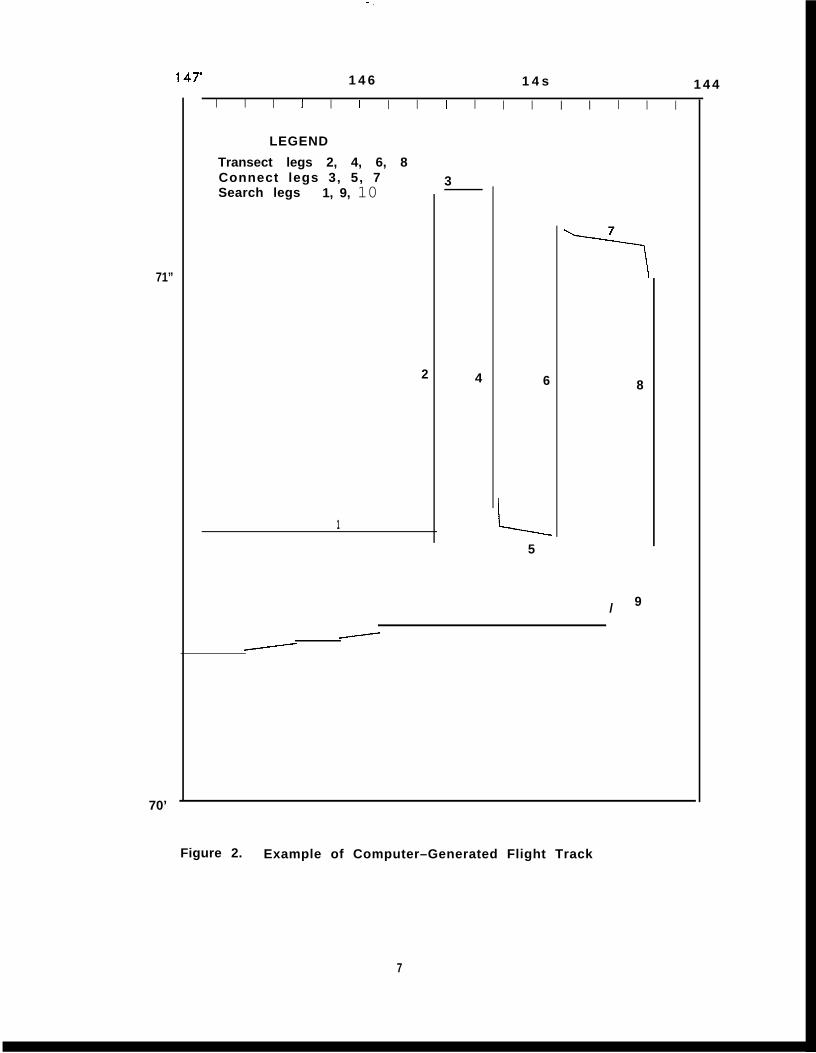
During a typical flight (Fig. 2), a search leg was flown to the survey block, followed by a series ofrandom-transect legs joined together by connect legs, with search legs conducted back to the base ofoperations. Surveys generally were flown at a target altitude of 458 m. This altitude was maintained, whenweather permitted, in order to maximize visibility and minimize potential disturbance to marine mammals.
A hand-held Suunto clinometer was used to measure the angle of inclination to each initial sighting ofendangered whales when the sighting location (or whale-dive site) was abeam of the aircraft.
When bowheads were encountered while surveying a transect line, the aircraft sometimes diverted fromtransect for brief periods (c1 O minutes [rein]) and circled the whales to observe behavior, obtain betterestimates of their numbers, and determine whether calves were present. Only groups of bowheads seenbefore diverting from the transect line were included in density calculations.
E. Data Entry
One of four different data-entry formats was selected on the computer, depending on the reason for entry.Whenever possible, a 28-key entry format was used when whales were seen (Table 1). An abbreviated20-key sighting-update format was used when several whales were sighted within a short period of time.An even shorter rapid-sighting update (9-key format) was used in areas of extremely high animalconcentrations to avoid any lumping of sightings. A position-update, 13-key format including data onweather, visibility, ice cover, and sea state was entered at turning points, when changes in environmental
5
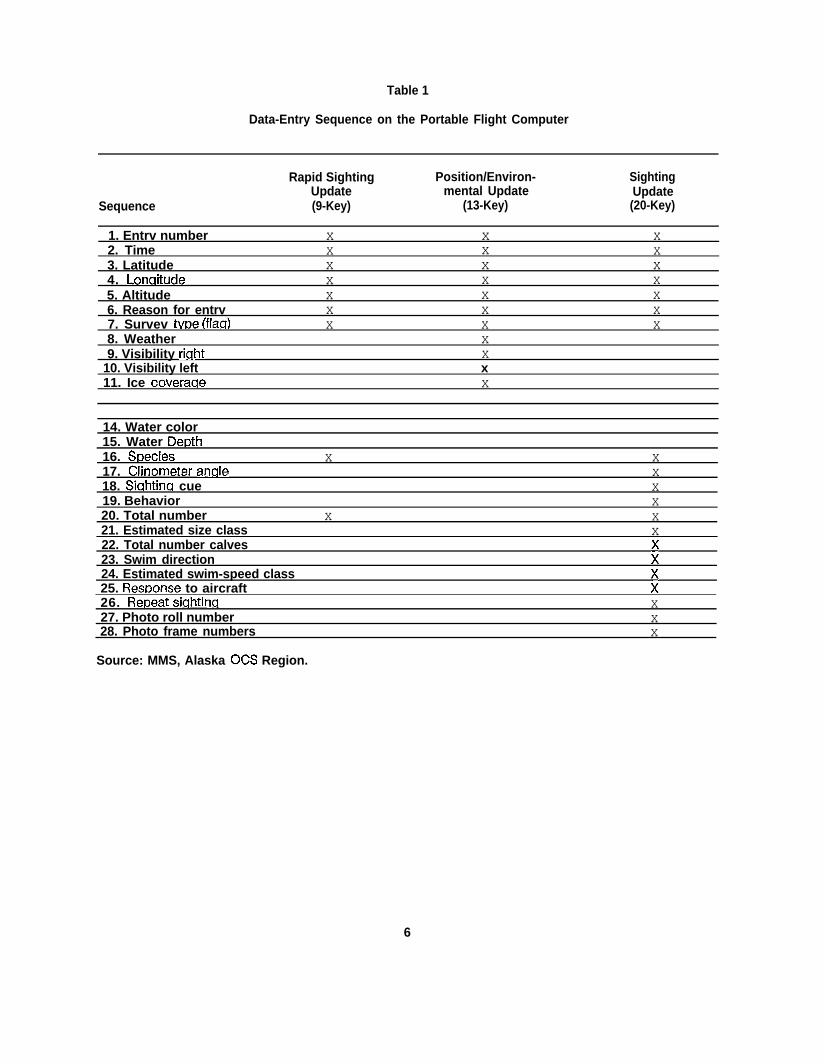
Table 1
Data-Entry Sequence on the Portable Flight Computer
Rapid Sighting Position/Environ- SightingUpdate mental Update Update
Sequence (9-Key) (13-Key) (20-Key)
1. Entrv number x x x2. Time x x x3. Latitude x x x4. Lormitude x x x5. Altitude x x x6. Reason for entrv x x x7. Survev tvoe (flaa) x x x8. Weather x9. Visibility riuht x
10. Visibility left x11. Ice coveraae x
14. Water color15. Water DetXh16. %ecies x x17. Clinometer anale x18. Siahtina cue x19. Behavior x20. Total number x x21. Estimated size class x22. Total number calves23. Swim direction :24. Estimated swim-speed class25. Res~onse to aircraft i26. Re~eat siahtina x27. Photo roll number x28. Photo frame numbers x
Source: MMS, Alaska OCS Region.
6
71”
70’
-,
147 1 4 6 1 4 s 1 4 4I I I I I I I I I I I I I I I I I
LEGEND
Transect legs 2, 4, 6, 8Connect legs 3, 5, 7Search legs 1, 9, 10
2
1
3
4 6
L5
7
‘T
8
/ 9
Figure 2. Example of Computer–Generated Flight Track
7

conditions were obsewed, and otherwise at 10-minute intervals. All entries were coded to reflect the typeof survey being conducted (Table 1: No. 7).
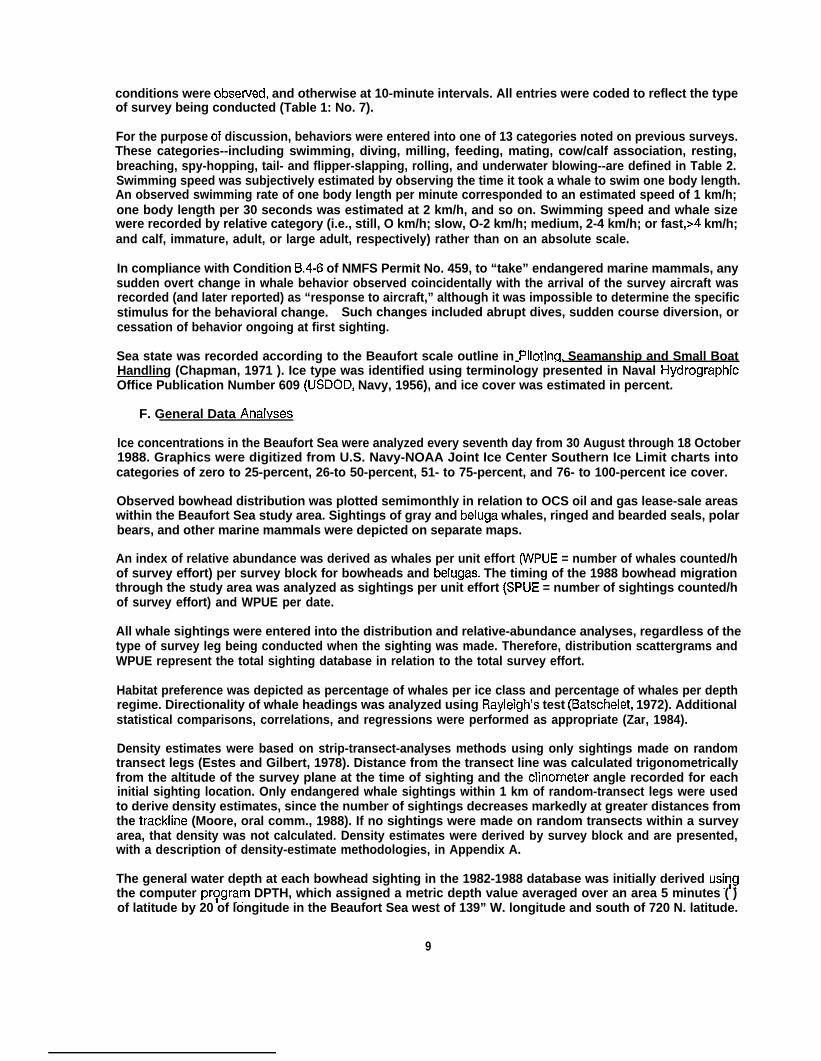
For the purpose of discussion, behaviors were entered into one of 13 categories noted on previous surveys.These categories--including swimming, diving, milling, feeding, mating, cow/calf association, resting,breaching, spy-hopping, tail- and flipper-slapping, rolling, and underwater blowing--are defined in Table 2.Swimming speed was subjectively estimated by observing the time it took a whale to swim one body length.An observed swimming rate of one body length per minute corresponded to an estimated speed of 1 km/h;one body length per 30 seconds was estimated at 2 km/h, and so on. Swimming speed and whale sizewere recorded by relative category (i.e., still, O km/h; slow, O-2 km/h; medium, 2-4 km/h; or fast, >4 km/h;and calf, immature, adult, or large adult, respectively) rather than on an absolute scale.
In compliance with Condition B.4-6 of NMFS Permit No. 459, to “take” endangered marine mammals, anysudden overt change in whale behavior observed coincidentally with the arrival of the survey aircraft wasrecorded (and later reported) as “response to aircraft,” although it was impossible to determine the specificstimulus for the behavioral change. Such changes included abrupt dives, sudden course diversion, orcessation of behavior ongoing at first sighting.
Sea state was recorded according to the Beaufort scale outline in Pilotina, Seamanship and Small BoatHandling (Chapman, 1971 ). Ice type was identified using terminology presented in Naval HydrographicOffice Publication Number 609 (USDOD, Navy, 1956), and ice cover was estimated in percent.
F. General Data Analvses
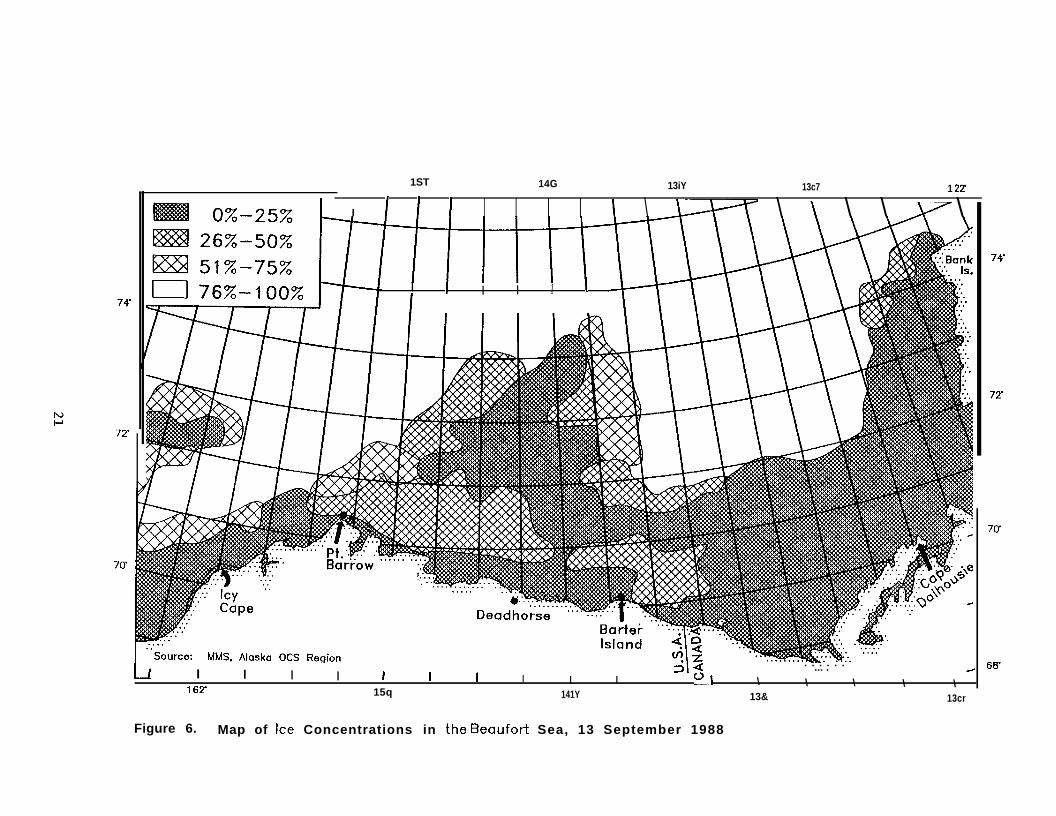
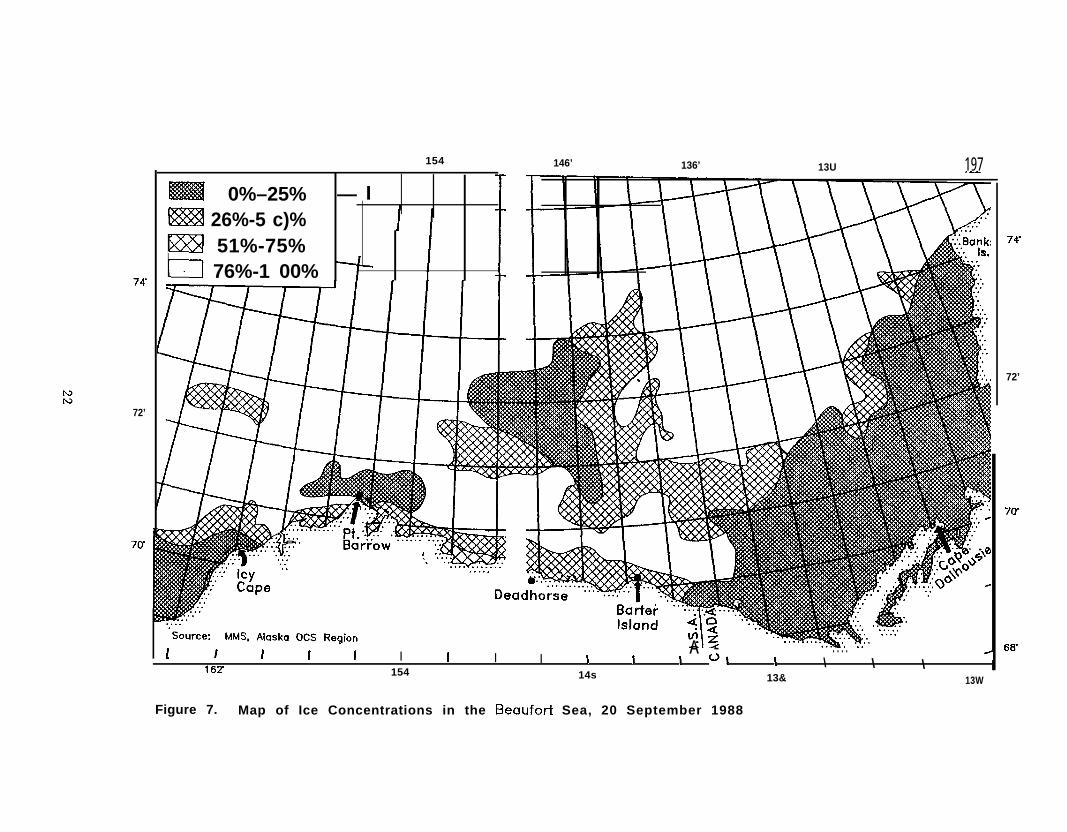
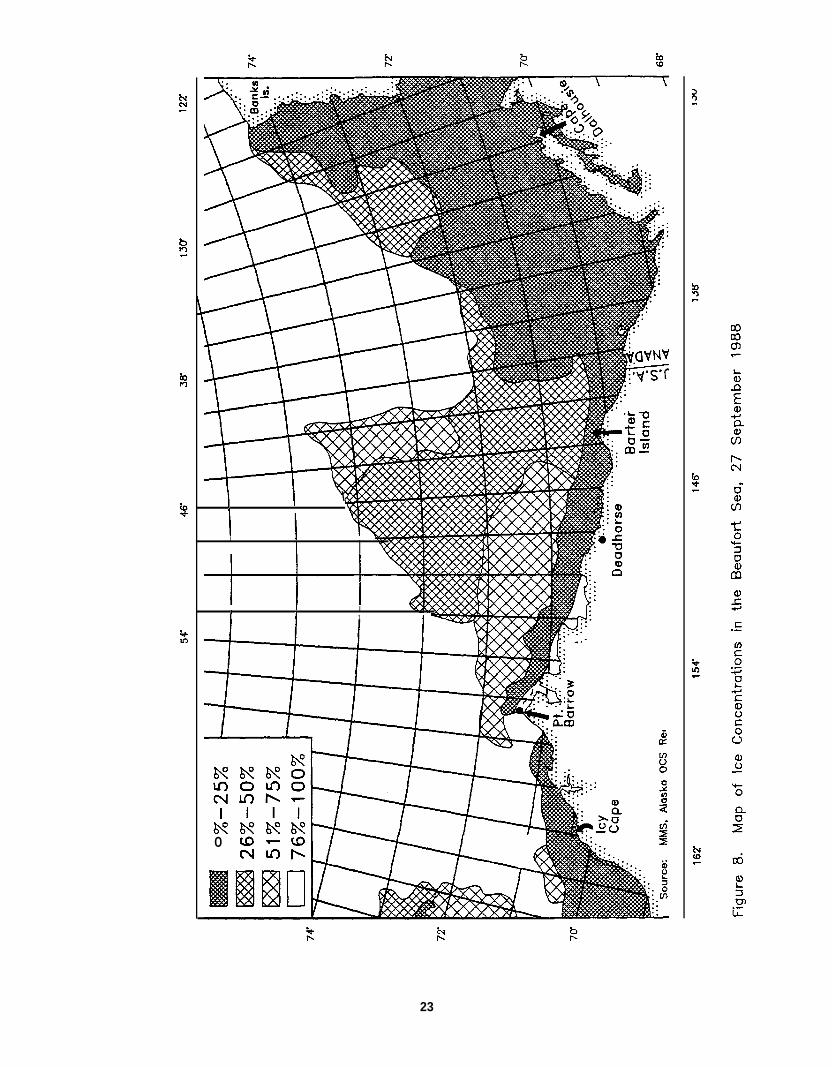
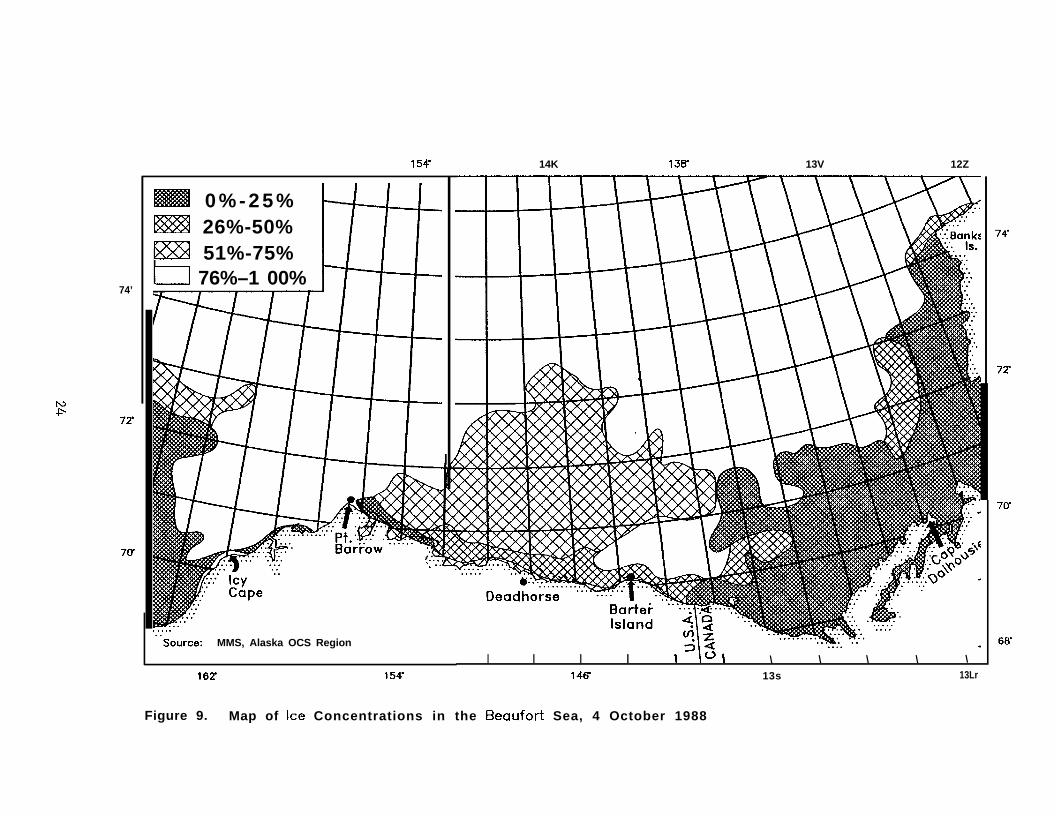
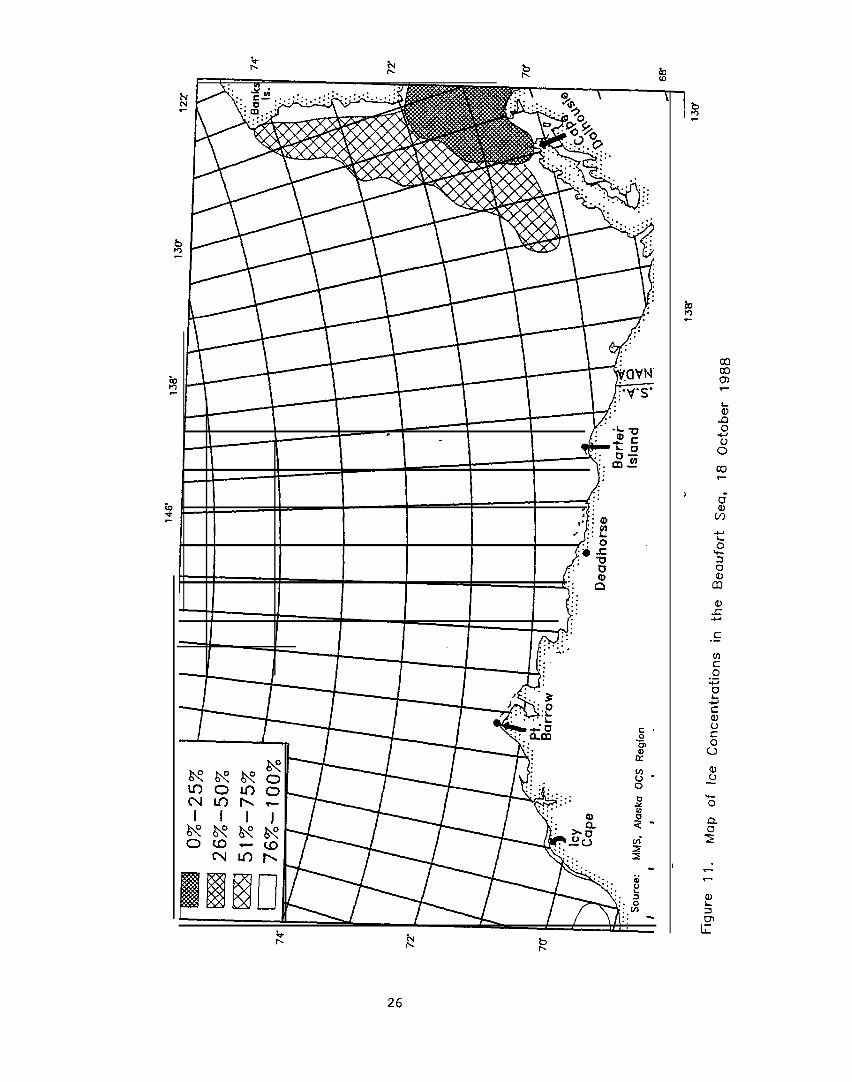
Ice concentrations in the Beaufort Sea were analyzed every seventh day from 30 August through 18 October1988. Graphics were digitized from U.S. Navy-NOAA Joint Ice Center Southern Ice Limit charts intocategories of zero to 25-percent, 26-to 50-percent, 51- to 75-percent, and 76- to 100-percent ice cover.
Observed bowhead distribution was plotted semimonthly in relation to OCS oil and gas lease-sale areaswithin the Beaufort Sea study area. Sightings of gray and beluga whales, ringed and bearded seals, polarbears, and other marine mammals were depicted on separate maps.
An index of relative abundance was derived as whales per unit effort (WPUE = number of whales counted/hof survey effort) per survey block for bowheads and belugas. The timing of the 1988 bowhead migrationthrough the study area was analyzed as sightings per unit effort (SPUE = number of sightings counted/hof survey effort) and WPUE per date.
All whale sightings were entered into the distribution and relative-abundance analyses, regardless of thetype of survey leg being conducted when the sighting was made. Therefore, distribution scattergrams andWPUE represent the total sighting database in relation to the total survey effort.
Habitat preference was depicted as percentage of whales per ice class and percentage of whales per depthregime. Directionality of whale headings was analyzed using Rayleigh’s test (Batschelet, 1972). Additionalstatistical comparisons, correlations, and regressions were performed as appropriate (Zar, 1984).
Density estimates were based on strip-transect-analyses methods using only sightings made on randomtransect legs (Estes and Gilbert, 1978). Distance from the transect line was calculated trigonometricallyfrom the altitude of the survey plane at the time of sighting and the clinometer angle recorded for eachinitial sighting location. Only endangered whale sightings within 1 km of random-transect legs were usedto derive density estimates, since the number of sightings decreases markedly at greater distances fromthe trackline (Moore, oral comm., 1988). If no sightings were made on random transects within a surveyarea, that density was not calculated. Density estimates were derived by survey block and are presented,with a description of density-estimate methodologies, in Appendix A.
The general water depth at each bowhead sighting in the 1982-1988 database was initially derived usi~gthe computer pr?gram DPTH, which assigned a metric depth value averaged over an area 5 minutes ( )of latitude by 20 of longitude in the Beaufort Sea west of 139” W. longitude and south of 720 N. latitude.
9
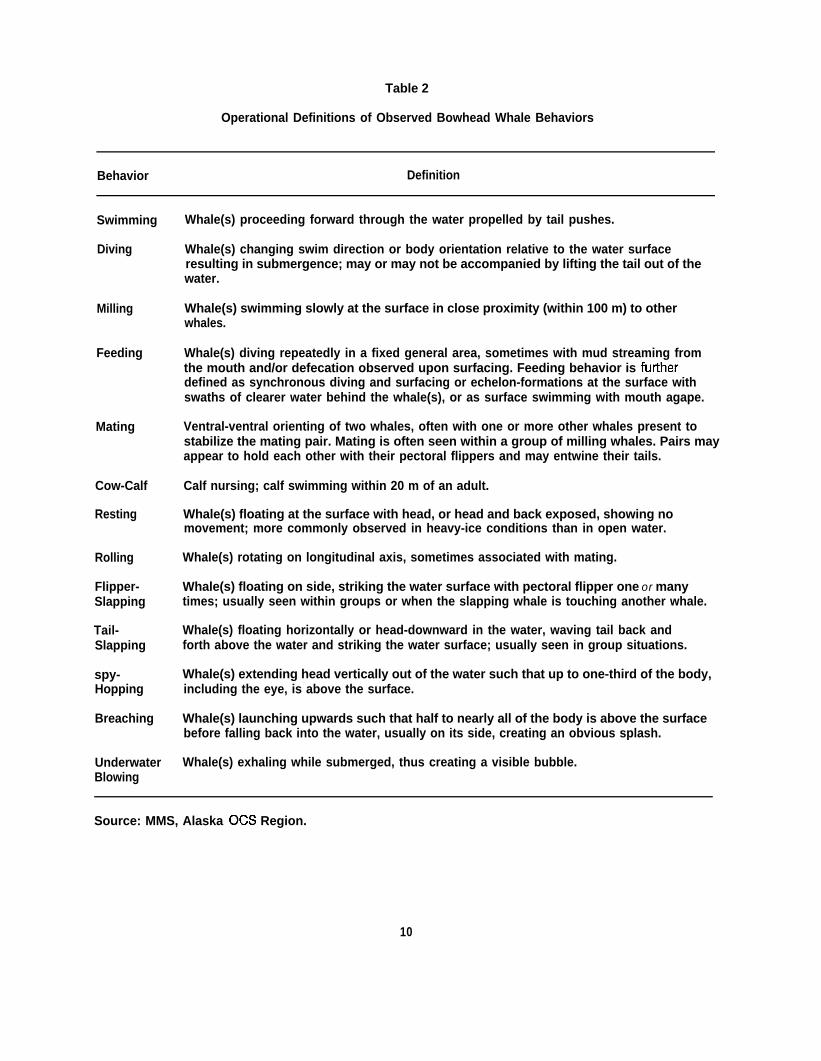
Table 2
Operational Definitions of Observed Bowhead Whale Behaviors
Behavior Definition
Swimming
Diving
Milling
Feeding
Mating
Cow-Calf
Resting
Rolling
Flipper-Slapping
Tail-Slapping
spy-Hopping
Breaching
UnderwaterBlowing
Whale(s) proceeding forward through the water propelled by tail pushes.
Whale(s) changing swim direction or body orientation relative to the water surfaceresulting in submergence; may or may not be accompanied by lifting the tail out of thewater.
Whale(s) swimming slowly at the surface in close proximity (within 100 m) to otherwhales.
Whale(s) diving repeatedly in a fixed general area, sometimes with mud streaming fromthe mouth and/or defecation observed upon surfacing. Feeding behavior is futtherdefined as synchronous diving and surfacing or echelon-formations at the surface withswaths of clearer water behind the whale(s), or as surface swimming with mouth agape.
Ventral-ventral orienting of two whales, often with one or more other whales present tostabilize the mating pair. Mating is often seen within a group of milling whales. Pairs mayappear to hold each other with their pectoral flippers and may entwine their tails.
Calf nursing; calf swimming within 20 m of an adult.
Whale(s) floating at the surface with head, or head and back exposed, showing nomovement; more commonly observed in heavy-ice conditions than in open water.
Whale(s) rotating on longitudinal axis, sometimes associated with mating.
Whale(s) floating on side, striking the water surface with pectoral flipper one or manytimes; usually seen within groups or when the slapping whale is touching another whale.
Whale(s) floating horizontally or head-downward in the water, waving tail back andforth above the water and striking the water surface; usually seen in group situations.
Whale(s) extending head vertically out of the water such that up to one-third of the body,including the eye, is above the surface.
Whale(s) launching upwards such that half to nearly all of the body is above the surfacebefore falling back into the water, usually on its side, creating an obvious splash.
Whale(s) exhaling while submerged, thus creating a visible bubble.
Source: MMS, Alaska OCS Region.
10
This scaling assigns depth to sighting locations with an accuracy of approximately +3.5 m over most ofthe study area. At the shelf break between 100 m and 1,000 m in Regions B and C , the accuracy wasapproximately *2O m. Values assigned to each segment were subjectively averaged from depths read offof NOAA Provisional Chart 16004 when the DPTH software was written.
Beginning with this repott, a supplemental program “NEW DEPTH” was used to assign more acc~rate depthvaluesi These “new depths” were generated using a finer grid; the dimensions of this grid were 3 of latitudeby 10 of longitude, making each grid box less than one-third the size of the original grid boxes used for“old depths.” In offshore areas where depth soundings were far fewer, “new depths” were entered only ifthere was a depth sounding in, or within the vicinity of (adjacent to), the grid box. Sightings that occur inoffshore areas where no “new depth” value has been assigned retain the “old depth value. In mostinstances, use of the DPTH and NEW DEPTH programs in series resulted in depth values that tended to beslightly deeper than those shown in previous reports (e.g., the overall median depth reported changed from31 m for Fall 1987 [Treaty, 1988] to 34 m for this report).
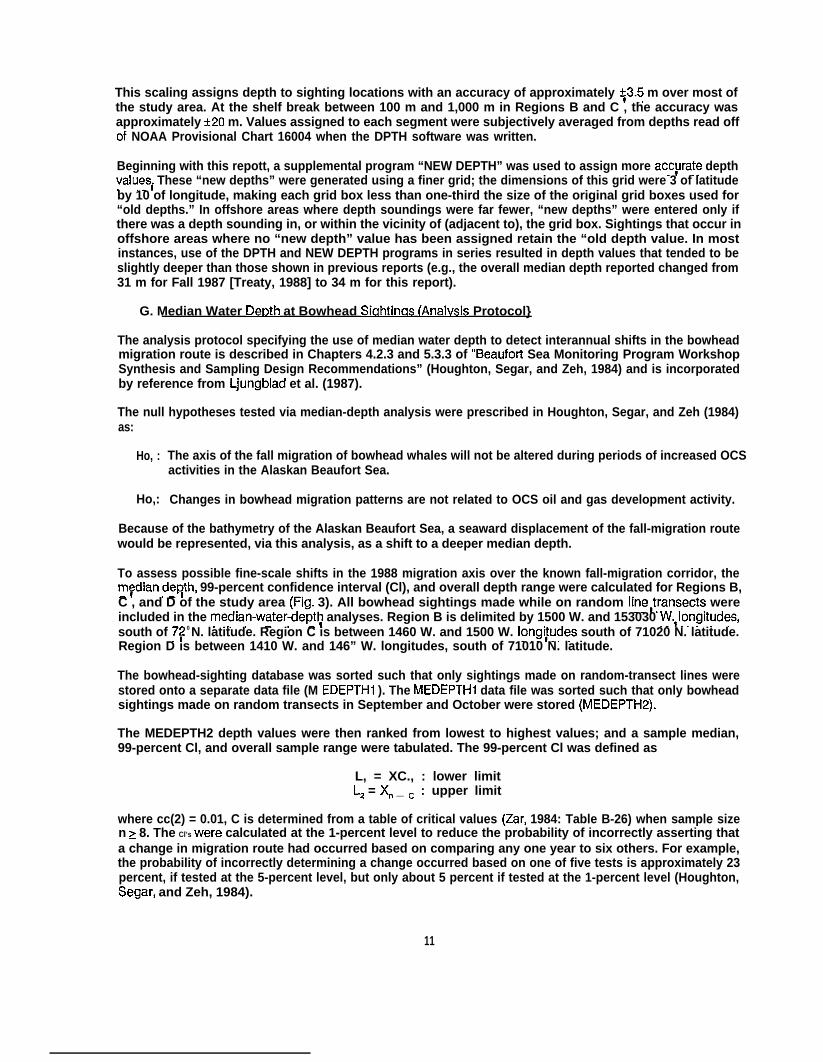
G. Median Water DerXh at Bowhead Siahtinas (Analvsis Protocol}
The analysis protocol specifying the use of median water depth to detect interannual shifts in the bowheadmigration route is described in Chapters 4.2.3 and 5.3.3 of “Beaufort Sea Monitoring Program WorkshopSynthesis and Sampling Design Recommendations” (Houghton, Segar, and Zeh, 1984) and is incorporatedby reference from Ljungblad et al. (1987).
The null hypotheses tested via median-depth analysis were prescribed in Houghton, Segar, and Zeh (1984)as:
Ho, :
Ho,:
The axis of the fall migration of bowhead whales will not be altered during periods of increased OCSactivities in the Alaskan Beaufort Sea.
Changes in bowhead migration patterns are not related to OCS oil and gas development activity.
Because of the bathymetry of the Alaskan Beaufort Sea, a seaward displacement of the fall-migration routewould be represented, via this analysis, as a shift to a deeper median depth.
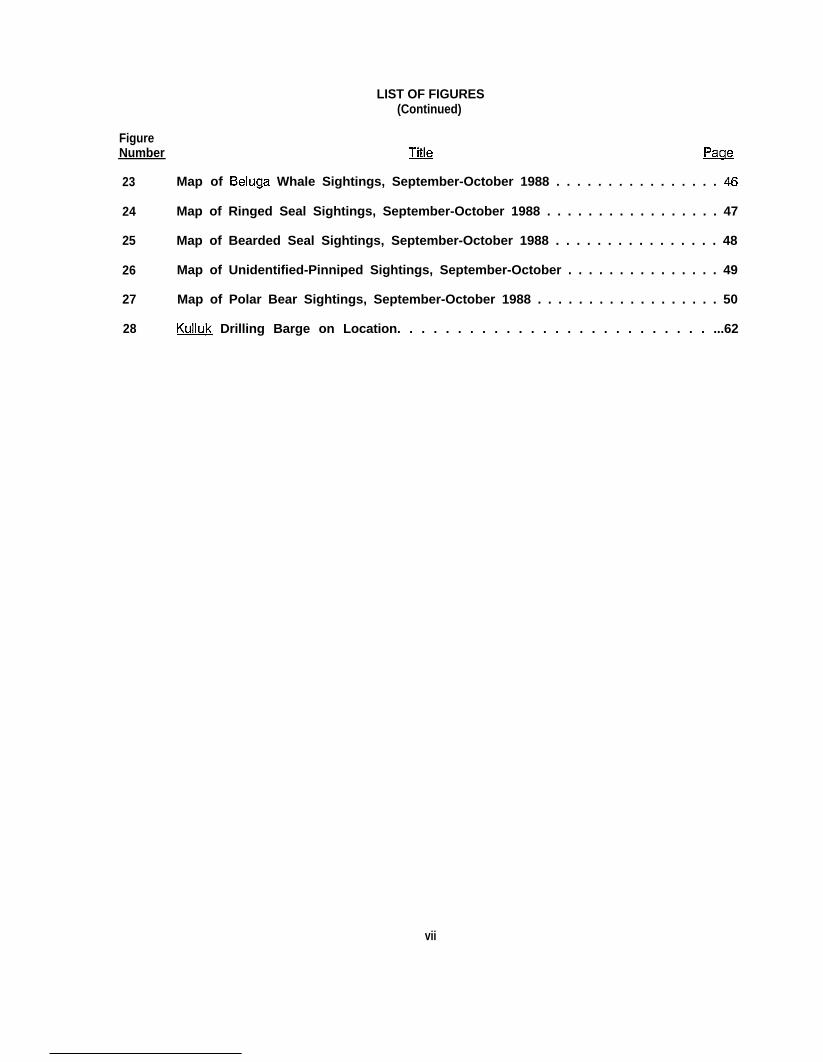
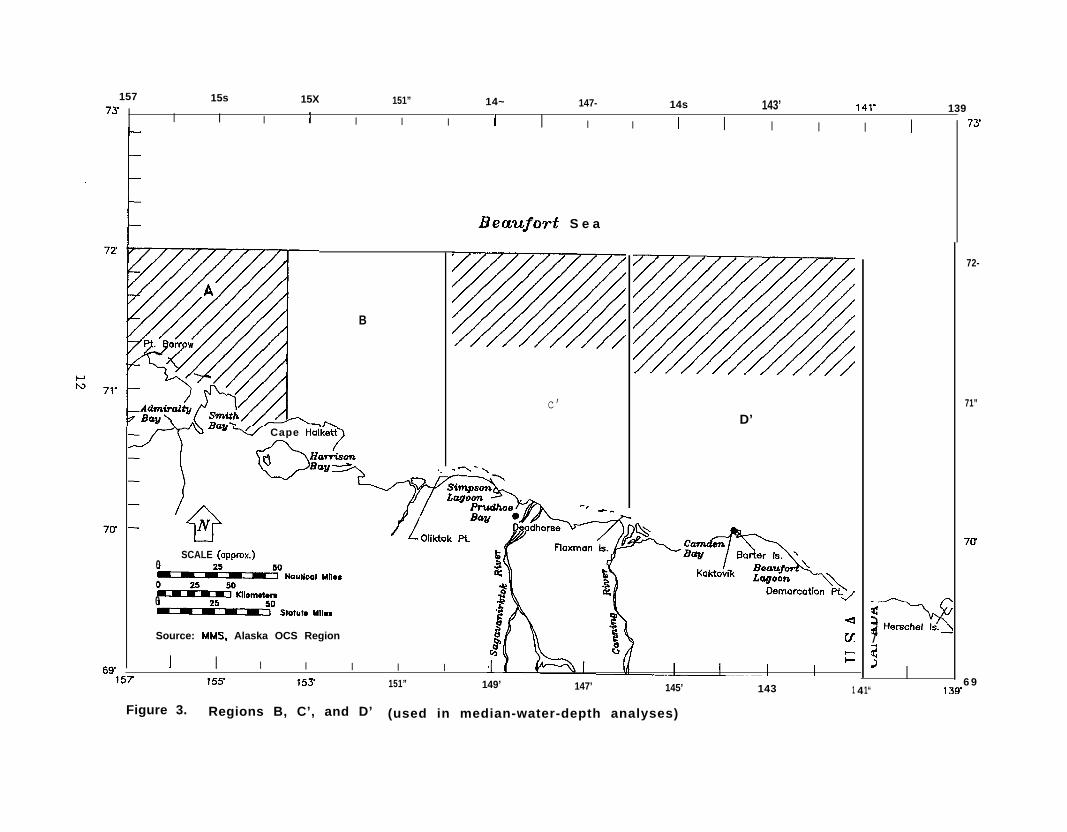
To assess possible fine-scale shifts in the 1988 migration axis over the known fall-migration corridor, them~dian de~th, 99-percent confidence interval (Cl), and overall depth range were calculated for Regions B,C , and D of the study area (Fig. 3). All bowhead sightings made while on random Iine}ransects wereincluded in the median-water-dept~ analyses. Region B is delimited by 1500 W. and 153030 W.llongitudes,south of 7? 0 N. latitude. Region C is between 1460 W. and 1500 W. long~udes south of 71020 N. latitude.Region D is between 1410 W. and 146” W. longitudes, south of 71010 N. latitude.
The bowhead-sighting database was sorted such that only sightings made on random-transect lines werestored onto a separate data file (M EDEPTH1 ). The MEDEPTH1 data file was sorted such that only bowheadsightings made on random transects in September and October were stored (MEDEPTH2).
The MEDEPTH2 depth values were then ranked from lowest to highest values; and a sample median,99-percent Cl, and overall sample range were tabulated. The 99-percent Cl was defined as
L, = XC., : lower limitL, = X“ _ ~ : upper limit
where cc(2) = 0.01, C is determined from a table of critical values (Zar, 1984: Table B-26) when sample sizen ~ 8. The Cl’s were calculated at the 1-percent level to reduce the probability of incorrectly asserting thata change in migration route had occurred based on comparing any one year to six others. For example,the probability of incorrectly determining a change occurred based on one of five tests is approximately 23percent, if tested at the 5-percent level, but only about 5 percent if tested at the 1-percent level (Houghton,Segar, and Zeh, 1984).
11
B
157 15s 15X 151” 14~ 147- 14sI I
143’I I
141”I
139I I I I I I I I I 73
Beaufort S e a
W//c’
D’~ “-w - Cape Ha(kett
SCALE (apprax.) :0~Nauticd Mii.. zo~K1l.met.m 30~Stetut. MlI.,
*W
s 4
Source: MMS, Alaska OCS Regionj
v
Ih
I I I I I+
157 15s 153’ 151” 149’ 147’ 145’ 143 1 4
72-
71”
7cr
4
7~
6 91“ 139’
Figure 3. Regions B, C’, and D’ (used in median-water-depth analyses)

The Mann-Whitney U test was then used to address the question of potential shifts in the axis of thebowhead whale fall migration route. The Mann-Whitney test is a nonparametric procedure performed onranked samples (Zar, 1984). A series of Mann-Whitney paired comparisons were made on annual depthvalues derived from the MEDEPTH2 data file, with each year compared to all others such that annual and/oroverall shifts in migration route over t~e 1979-? 988 study period could be evaluated. Similar pairedcomparisons were made by region (B, C , and D ) such that annual variations or potential shifts in mediandepth could be assessed for these smaller areas.
In addition, mean water depths at bowhead sightings were compared between years using an analysis ofvariance (ANOVA) and the Tukey test (Zar, 1984).
13

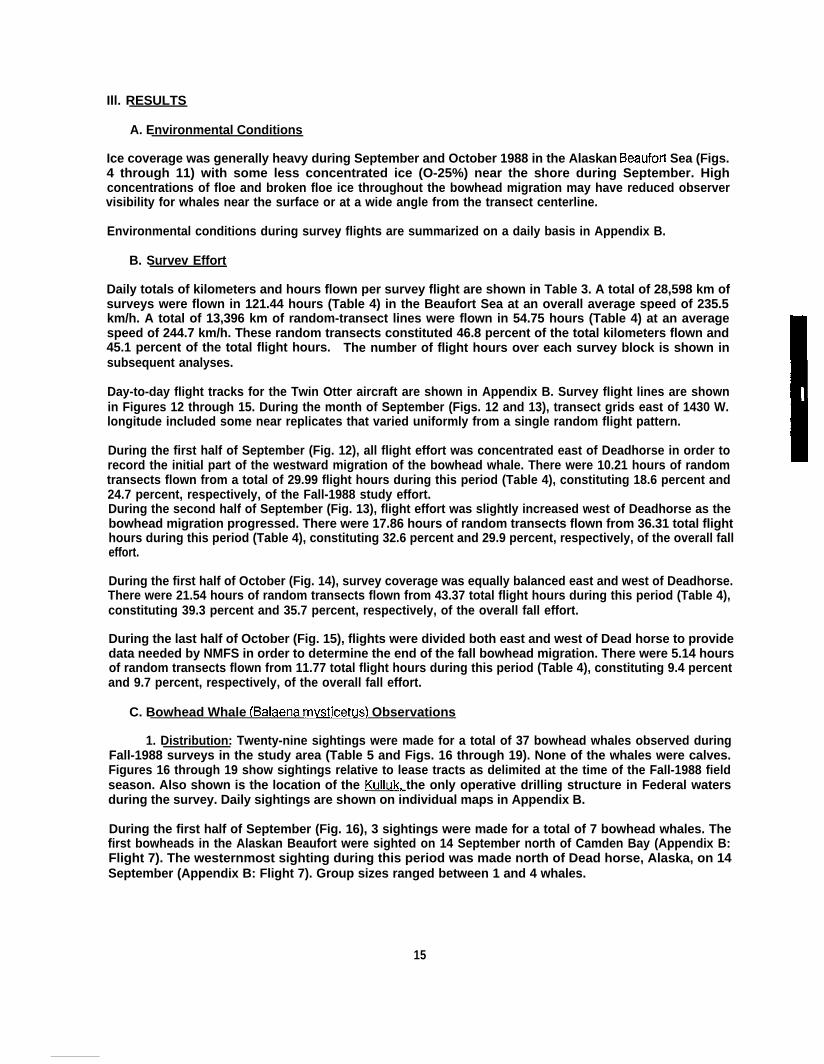
Ill. RESULTS
A. Environmental Conditions
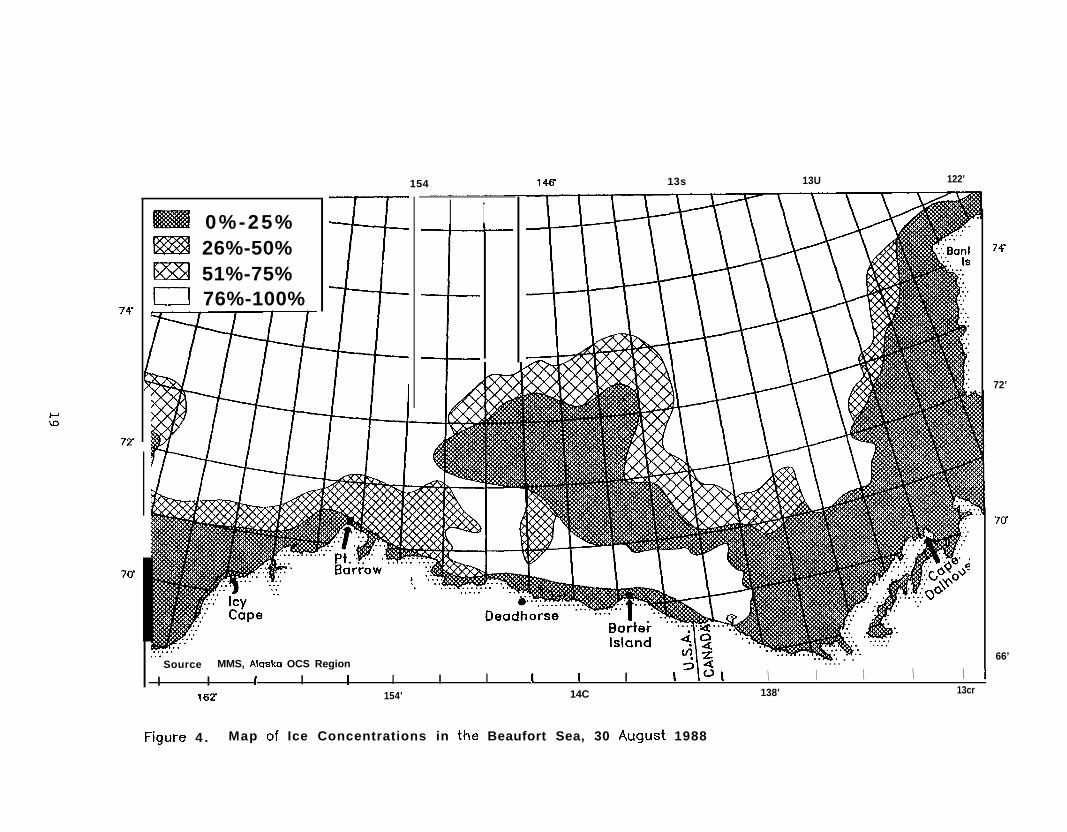
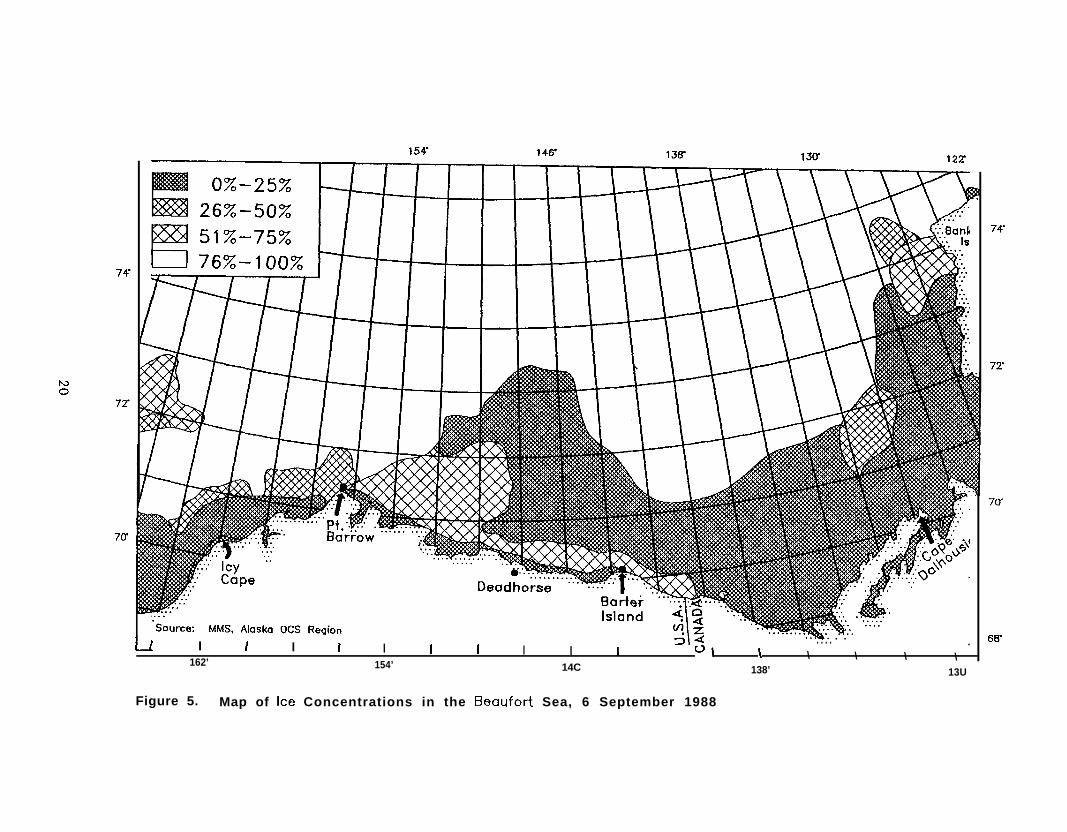
Ice coverage was generally heavy during September and October 1988 in the Alaskan Beauforf Sea (Figs.4 through 11) with some less concentrated ice (O-25%) near the shore during September. Highconcentrations of floe and broken floe ice throughout the bowhead migration may have reduced observervisibility for whales near the surface or at a wide angle from the transect centerline.
Environmental conditions during survey flights are summarized on a daily basis in Appendix B.
B. Survev Effort
Daily totals of kilometers and hours flown per survey flight are shown in Table 3. A total of 28,598 km ofsurveys were flown in 121.44 hours (Table 4) in the Beaufort Sea at an overall average speed of 235.5km/h. A total of 13,396 km of random-transect lines were flown in 54.75 hours (Table 4) at an averagespeed of 244.7 km/h. These random transects constituted 46.8 percent of the total kilometers flown and45.1 percent of the total flight hours. The number of flight hours over each survey block is shown insubsequent analyses.
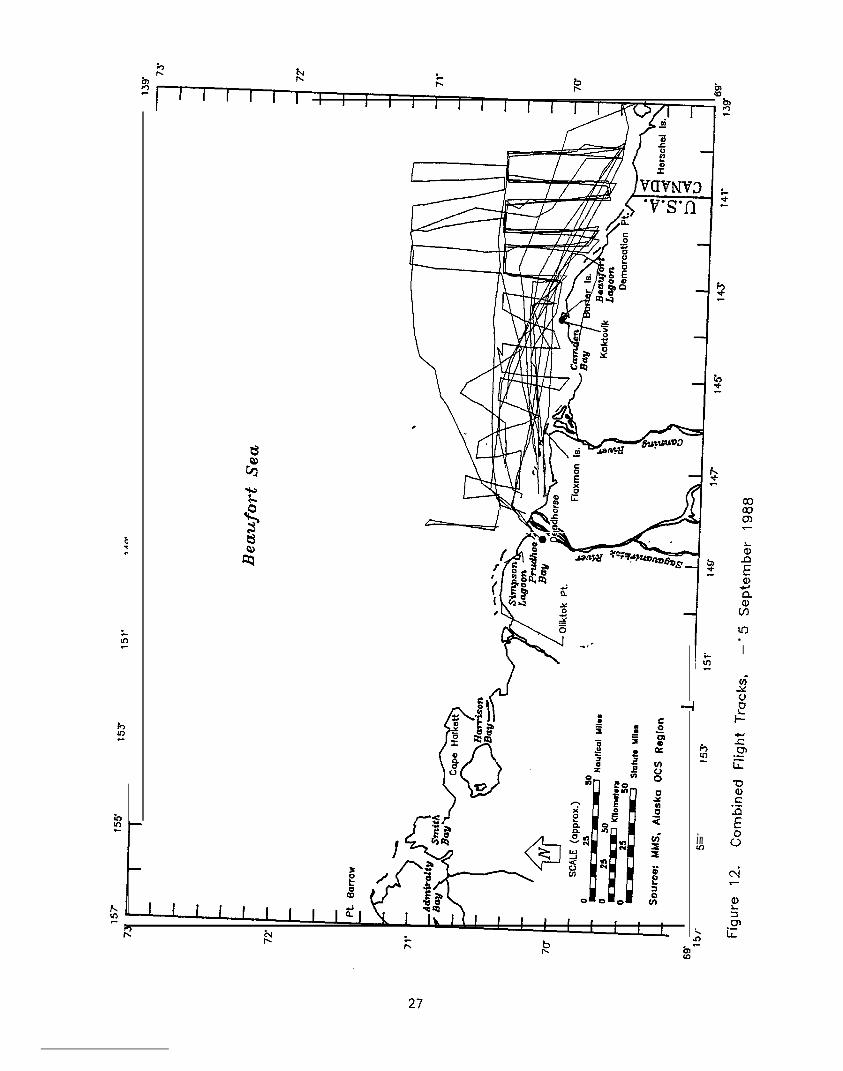
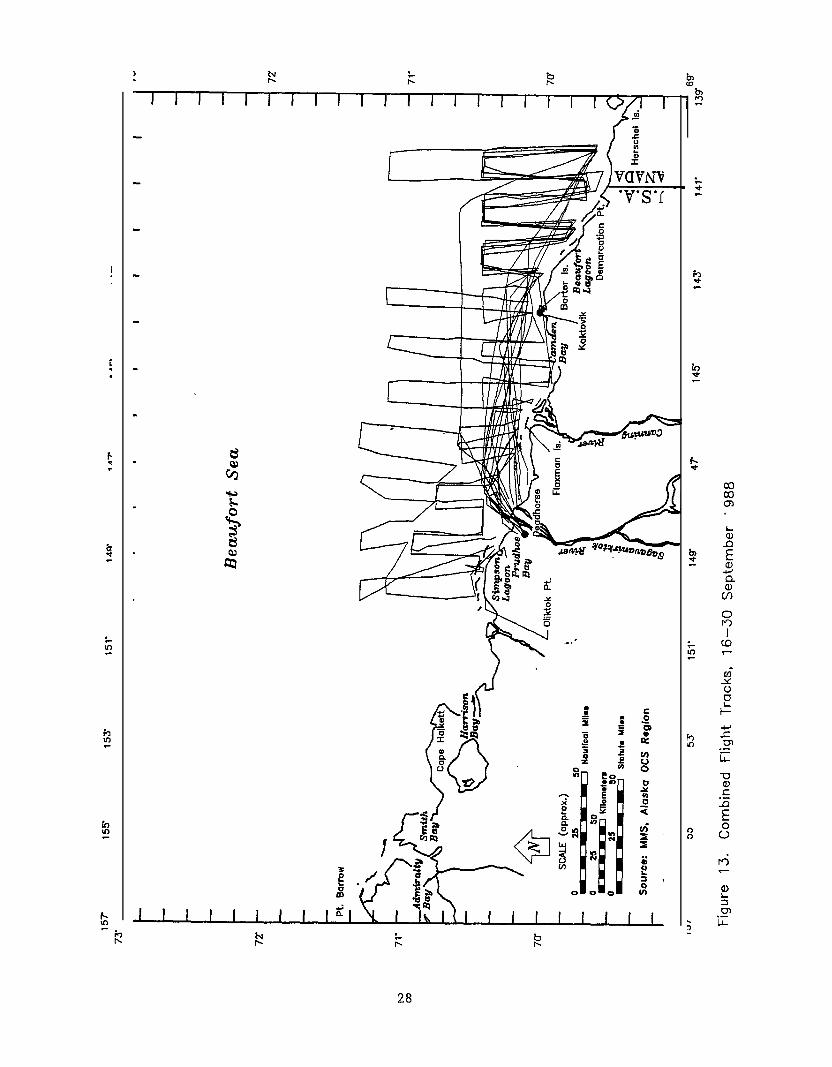
Day-to-day flight tracks for the Twin Otter aircraft are shown in Appendix B. Survey flight lines are shownin Figures 12 through 15. During the month of September (Figs. 12 and 13), transect grids east of 1430 W.longitude included some near replicates that varied uniformly from a single random flight pattern.
During the first half of September (Fig. 12), all flight effort was concentrated east of Deadhorse in order torecord the initial part of the westward migration of the bowhead whale. There were 10.21 hours of randomtransects flown from a total of 29.99 flight hours during this period (Table 4), constituting 18.6 percent and24.7 percent, respectively, of the Fall-1988 study effort.During the second half of September (Fig. 13), flight effort was slightly increased west of Deadhorse as thebowhead migration progressed. There were 17.86 hours of random transects flown from 36.31 total flighthours during this period (Table 4), constituting 32.6 percent and 29.9 percent, respectively, of the overall falleffort.
During the first half of October (Fig. 14), survey coverage was equally balanced east and west of Deadhorse.There were 21.54 hours of random transects flown from 43.37 total flight hours during this period (Table 4),constituting 39.3 percent and 35.7 percent, respectively, of the overall fall effort.
During the last half of October (Fig. 15), flights were divided both east and west of Dead horse to providedata needed by NMFS in order to determine the end of the fall bowhead migration. There were 5.14 hoursof random transects flown from 11.77 total flight hours during this period (Table 4), constituting 9.4 percentand 9.7 percent, respectively, of the overall fall effort.
C. Bowhead Whale (Balaena mvsticetus) Observations
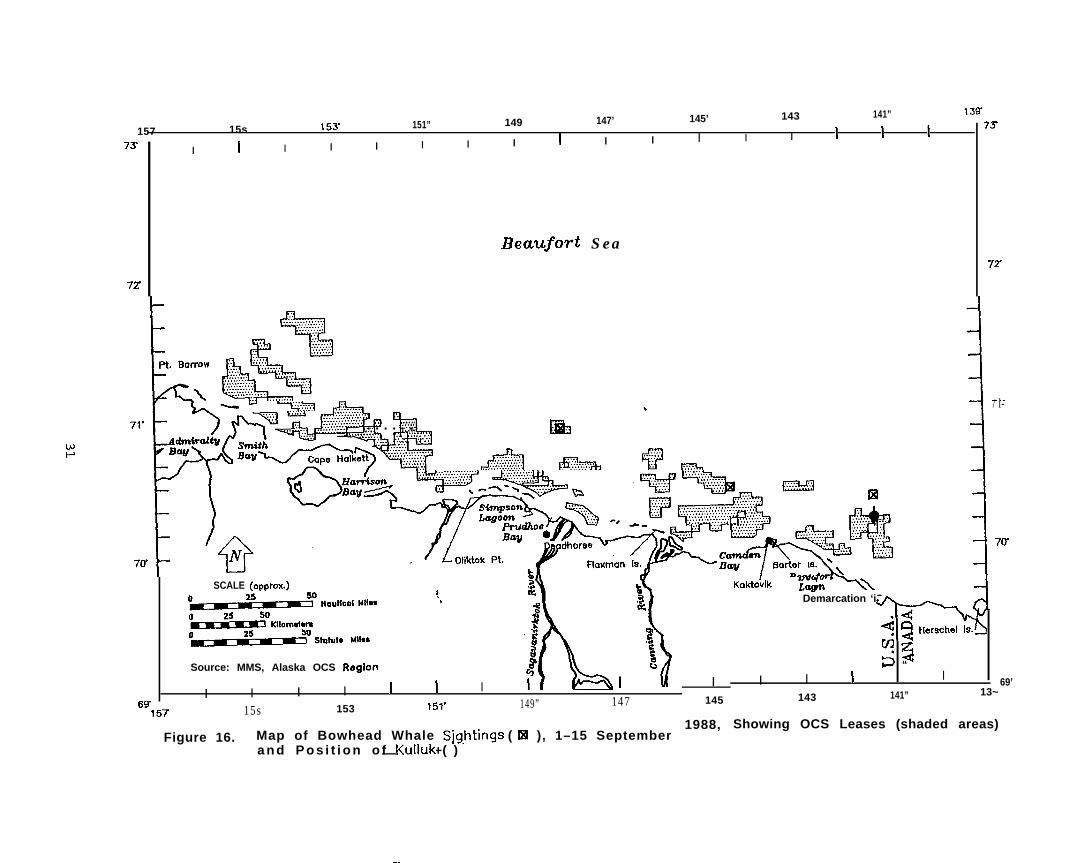
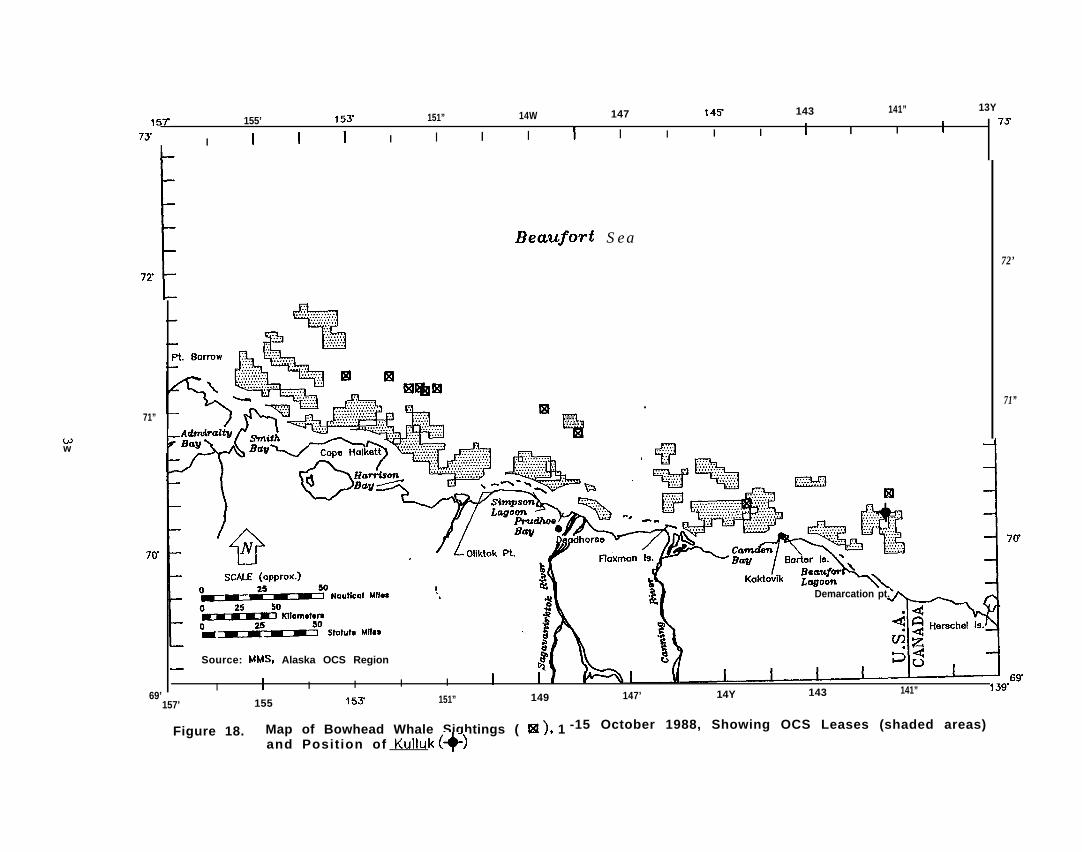
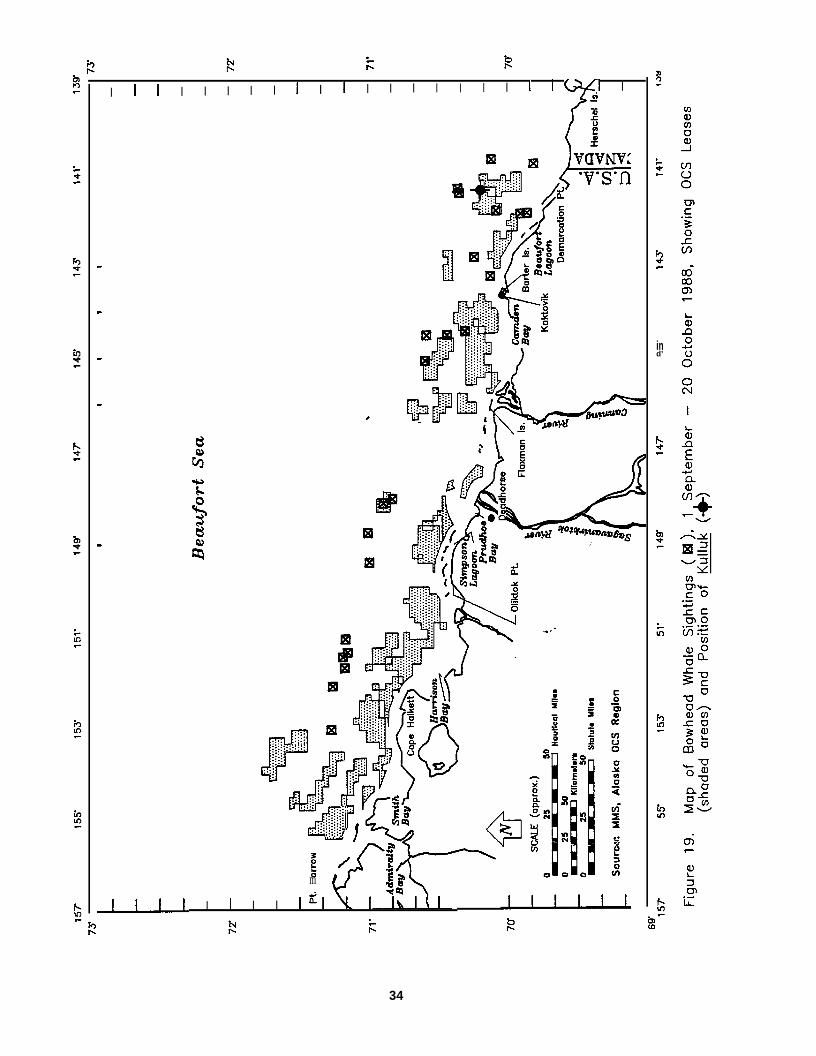
1. Distribution: Twenty-nine sightings were made for a total of 37 bowhead whales observed duringFall-1988 surveys in the study area (Table 5 and Figs. 16 through 19). None of the whales were calves.Figures 16 through 19 show sightings relative to lease tracts as delimited at the time of the Fall-1988 fieldseason. Also shown is the location of the Kulluk, the only operative drilling structure in Federal watersduring the survey. Daily sightings are shown on individual maps in Appendix B.
During the first half of September (Fig. 16), 3 sightings were made for a total of 7 bowhead whales. Thefirst bowheads in the Alaskan Beaufort were sighted on 14 September north of Camden Bay (Appendix B:Flight 7). The westernmost sighting during this period was made north of Dead horse, Alaska, on 14September (Appendix B: Flight 7). Group sizes ranged between 1 and 4 whales.
15
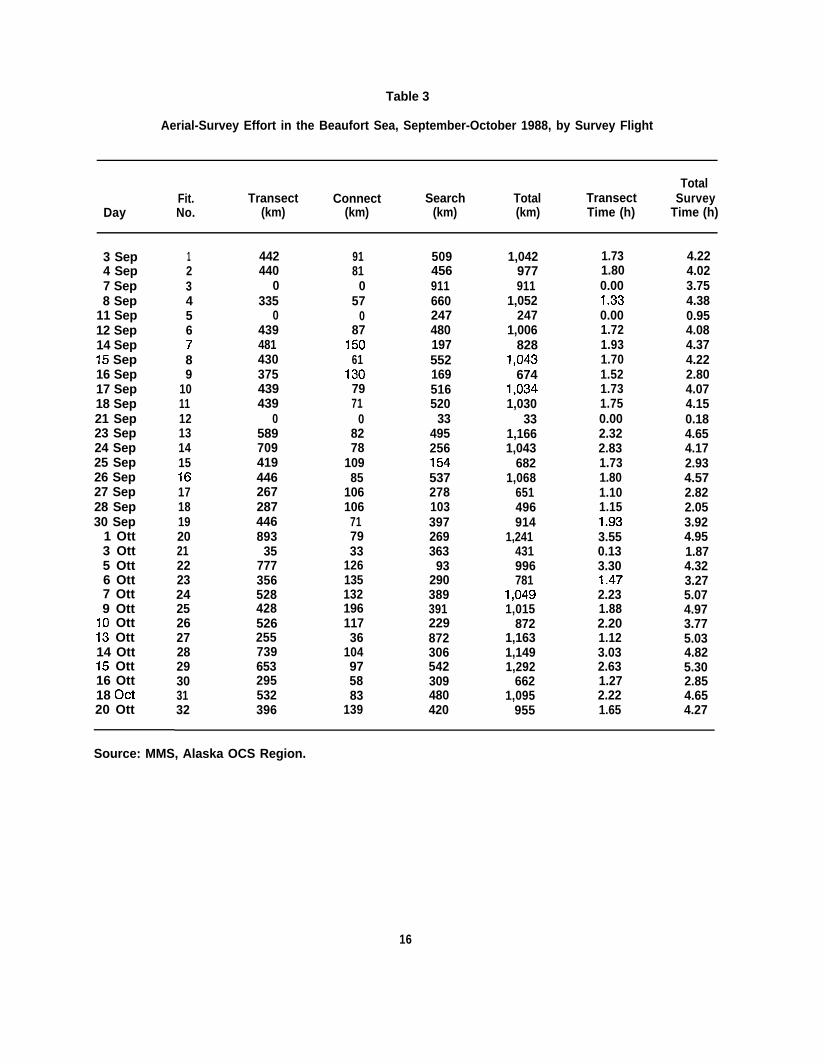
Table 3
Aerial-Survey Effort in the Beaufort Sea, September-October 1988, by Survey Flight
TotalFit. Transect Connect Search Total Transect Survey
Day No. (km) (km) (km) (km) Time (h) Time (h)
3 Sep4 Sep7 Sep8 Sep
11 Sep12 Sep14 Sep15 Sep16 Sep17 Sep18 Sep21 Sep23 Sep24 Sep25 Sep26 Sep27 Sep28 Sep30 Sep
1 Ott3 Ott5 Ott6 Ott7 Ott9 Ott
10 Ott13 Ott14 Ott15 Ott16 Ott18 CJct20 Ott
123456789
1011121314151617181920212223242526272829303132
442440
0335
0439481430375439439
0589709419446267287446893
35777356528428526255739653295532396
91810
570
87150
611307971
08278
10985
106106
717933
12613513219611736
104975883
139
509456911660247480197552169516520
33495256154537278103397269363
93290389391229872306542309480420
1,042977911
1,052247
1,006828
1,043674
1,0341,030
331,1661,043
6821,068
651496914
1,241431996781
1,0491,015
8721,1631,1491,292
6621,095
955
1.731.800.001.330.001.721.931.701.521.731.750.002.322.831.731.801.101.151.933.550.133.301.472.231.882.201.123.032.631.272.221.65
4.224.023.754.380.954.084.374.222.804.074.150.184.654.172.934.572.822.053.924.951.874.323.275.074.973.775.034.825.302.854.654.27
Source: MMS, Alaska OCS Region.
16
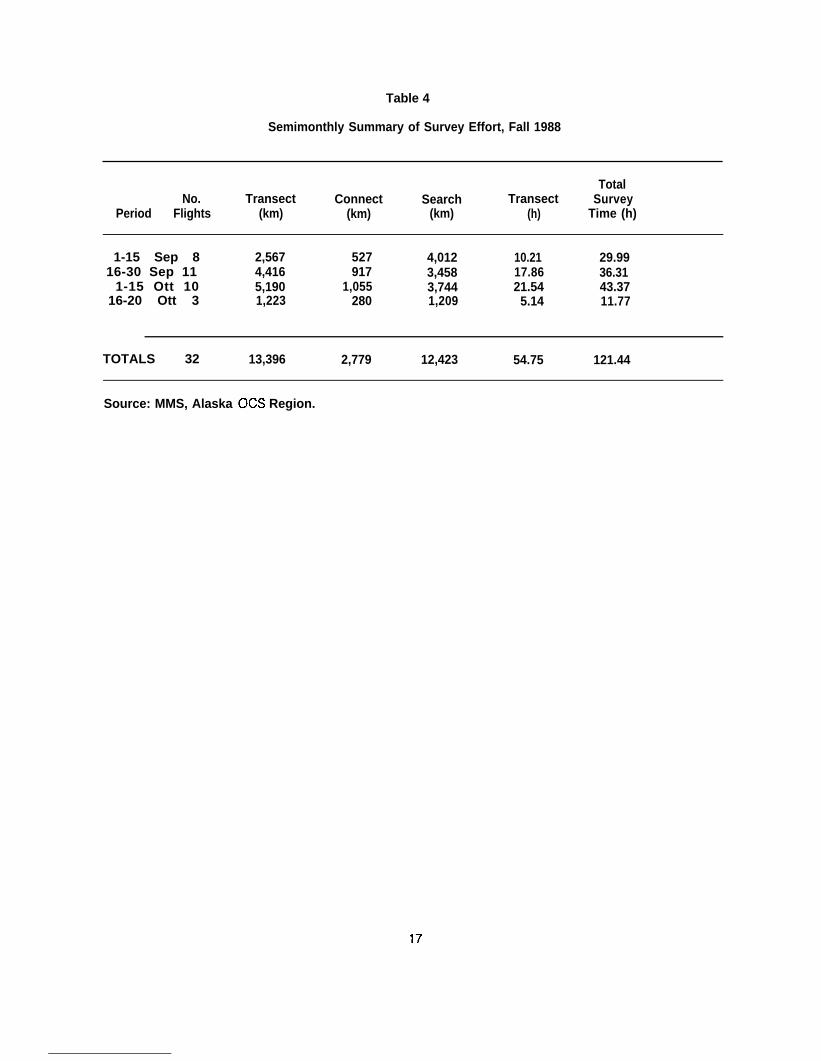
Table 4
Semimonthly Summary of Survey Effort, Fall 1988
TotalNo. Transect Connect Search Transect Survey
Period Flights (km) (km) (km) (h) Time (h)
1-15 Sep 8 2,567 527 4,012 10.21 29.9916-30 Sep 11 4,416 917 3,458 17.86 36.31
1-15 Ott 10 5,190 1,055 3,744 21.54 43.3716-20 Ott 3 1,223 280 1,209 5.14 11.77
TOTALS 32 13,396 2,779 12,423 54.75 121.44
Source: MMS, Alaska OCS Region.
17
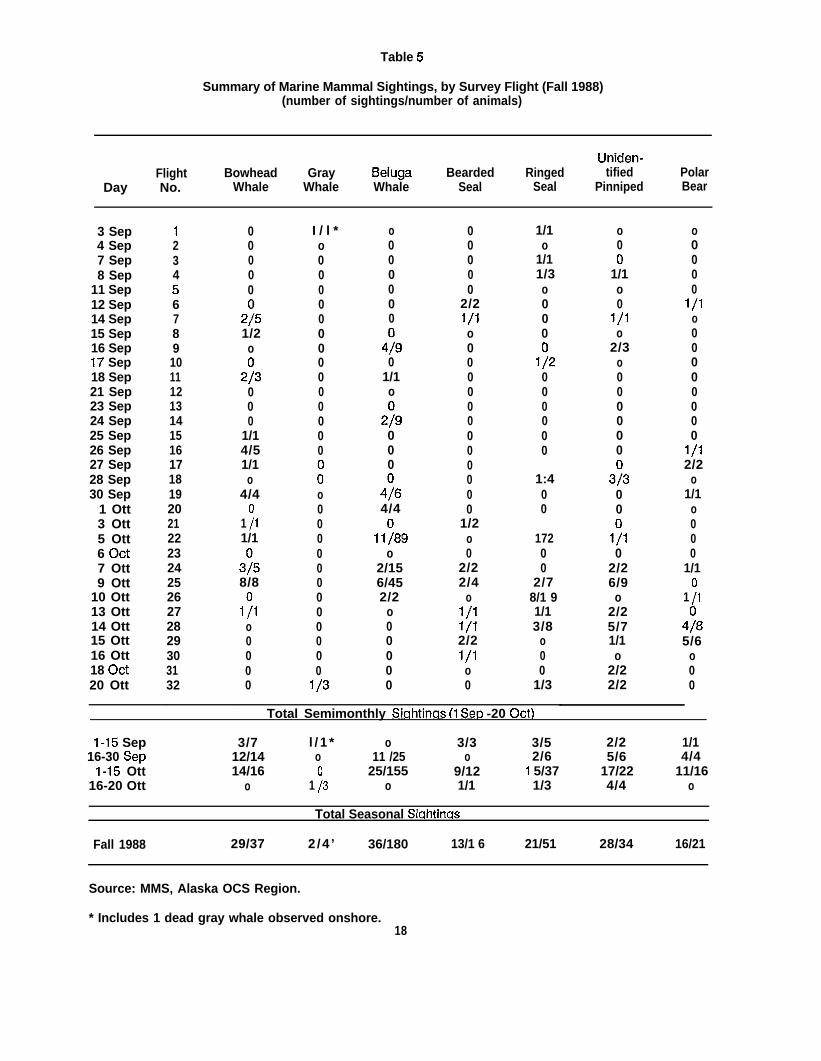
Table 5
Summary of Marine Mammal Sightings, by Survey Flight (Fall 1988)(number of sightings/number of animals)
Uniden-Flight Bowhead Gray Beluga Bearded Ringed tified Polar
Day No. Whale Whale Whale Seal Seal Pinniped Bear
3 Sep4 Sep7 Sep8 Sep
11 Sep12 Sep14 Sep15 Sep16 Sep17 Sep18 Sep21 Sep23 Sep24 Sep25 Sep26 Sep27 Sep28 Sep30 Sep
1 Ott3 Ott5 Ott6 oct7 Ott9 Ott
10 Ott13 Ott14 Ott15 Ott16 Ott18 oct20 Ott
1234567891011121314151617181920212223242526272829303132
00000
2;51/2
o
273000
1/14/51/1
o4/4
1 ;11/1
3758/8
1 !lo0000
I / l *o00000000000000
;o000000000000
1/3
o000000
4:90
1/1o
279000
4764/4
11~89o
2/156/452/2
o00000
00000
2/21/1o000000000000
1/2o0
2/22/4
o1/11/12/21/1o0
1/1o
1/11/3o000
1:2000000
1:400
17200
2/78/1 91/13/8
o00
1/3
o00
1/1o0
1/1o
2/3o000000
37300
1710
2/26/9
o2/25/71/1o
2/22/2
o0000
1/1o00000000
1/12/2
o1/1
o000
1/1
1 ;1
4785/6
o00
Total Semimonthly Siahtinas (1 Se~ -20 Ott)
1-15 Sep 3/7 l / 1 * o 3/3 3/5 2/2 1/116-30 Sep 12/14 o 11 /25 o 2/6 5/6 4/4
1-15 Ott 14/16 25/155 9/12 1 5/37 17/22 11/1616-20 Ott o 1 ;3 o 1/1 1/3 4/4 o
Total Seasonal Siahtinas
Fall 1988 29/37 2/4 ’ 36/180 13/1 6 21/51 28/34 16/21
Source: MMS, Alaska OCS Region.
* Includes 1 dead gray whale observed onshore.18
7cr
= 0%-25%m 26%-50%m 51%-75%m 76%-100%
154 14C 13s 13U 122’
I I
T
. . .Source MMS, Aloska OCS Region <1 z
..-JW. . .. . . .
I I I I I I I I I 1 I ~–\u\ \ \ \ \ \ 1
16Z 154’ 14C 138’ 13cr
—I-”igure 4 . Map of Ice Concentrations in the Beaufort Sea, 30 August 1988
7<
72’
7f7
66’
II I I I I I24 ..-. . .
I I. . . .
I I I UI \.
162’\
154’\ \ \
14C 138’ 13U
Figure 5. Map of Ice Concentrations in the Beaufort Sea, 6 September 1988
7Cr
1ST 14G 13iY 13c7 1 22?
I I I I I I I I I \ \ \ \ \ \
I
II I I 1 I -lT\ \\’
11 I I I I I34 . . . . . .
I... .
I I I I C)I/
16T\ \ \
15q\ \
141Y 13& 13cr
Figure 6. Map of Ice Concentrations in the Beaufort Sea, 13 September 1988
7’#
7Z
70-
6W
154
. ,.{4
72’
7rY
0%–25% — I= 26%-5 c)%Exsl 51%-75%~ 76%-1 00% I
146’ 136’ 13U 197
/ I I I I I I IA - . . . .
I 1 1 I UI I \ \ \1
16T 154 14s 13& 13W
7’f
72’
7CT
6~
Figure 7. Map of Ice Concentrations in the Beaufor-t Sea, 20 September 1988
&m
b-4
I I \
I 1I I
I II I 1 1
0 %L 7iL
23
74’
Iv-b
7i?
7Cr
154
= 0 % - 2 5 %= 26%-50%m 51%-75%m 76%–1 00% m
. . . . .““Source: MMS, Alaska OCS Region
14K 136 13V 12Z
I I I I ~–lu\ \ \ \ \ \
16Z 154’ 14C 13s 13Lr
Figure 9. Map of Ice Concentrations in the Beaufort Sea, 4 October 1988
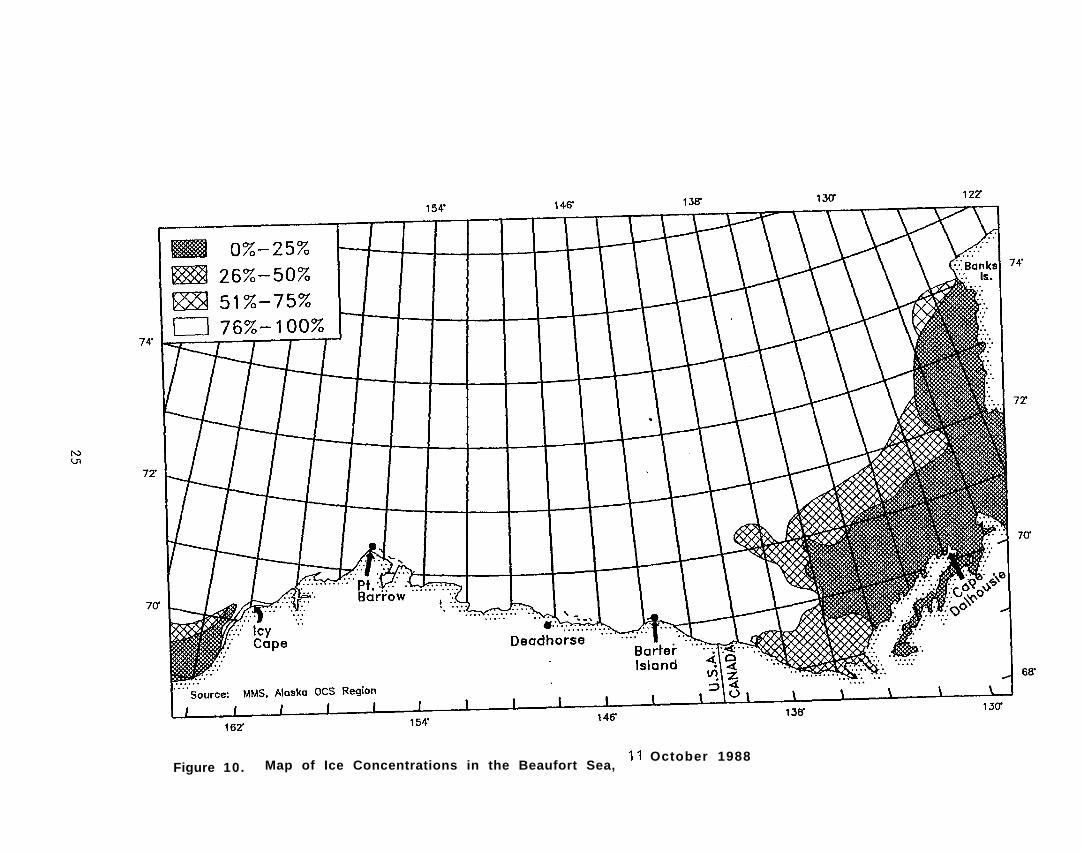
Figure 10. Map of Ice Concentrations in the Beaufort Sea,11 October 1988
Wi’uA’r u
1
I
-llLm--
---J w.
inIn
-1
Q$m.
I
t$
L%o-l.
PJ
k-)0
.
-w-cD.-Iz
a)L3.-LT
157’ 15r 153 151”75
149 147 145
I143 141”
I139
I I I I I I I I I I I I I I 1 I I 7.Y
7r
71”
7U
6Y1
[Pt. Barrow
mBeaufort Sea
rmxman 19.SCALE (approx.) b 8 J - -0~“ Noutlcal Mlla
‘. “& ~o_Kllomct.. ~ %
o~*
Stotutb Mllas ~SoUroe: MMS, Alaska OCS Regfon
8
I I ih
I I I I I57 15s 153 151” 149’ 147
$!iwKakto~
I 114Ff
I (7
r.mmi.m \
d
7r
71”
I I I143
6 9141” 13Y
Figure 14, Combined Flight Tracks, 1 –15 October 1988
I I I I I I I I I I I I I I I I I I I IQ I
.
.
[
.
:=s
- 1 g a“
I I I I I I I I It! ?QI k I I I I I I I I I I
wIJ
147’ 145’ 143 141” 13Er
157 15s 153 151” 149I I I I I
73I
7s I I I I I I I I I I I
72’
72
Beaufort Sea
- ‘--w% ..:....;
%
.$. . .. .. . . . . .. . . . . .. . ,.,.,. . . . . . Iii&’. . . . . .. . . . . :., . . . ..:.:.:.:. . .>Dtt “%;” & h f’ mf?
. . . . .
SCALE (aPProx.) io~ N“””’al ‘1’” ‘,
~0- KllOmctawm $
‘~ s~t”t” ‘119’‘g ‘t‘e
Source: MMS, Alaska OCS Rqion !eg
El
I I I I I I I I6W 15s 153 157” 149” 147
157
Figure 16. Map of Bowhead Whale S“ghtings ( M ), 1–15 September+a n d P o s i t i o n o f Kulluk ( )
I145
1988,
—..
3/l-
Kakto~ik ~~Demarcation ‘i?
● 4$>
Herechel 19.q
3a “
I I I I 69’143 141” 13~
Showing OCS Leases (shaded areas)
7D’
—.
157 155’ 15373’
151” 14~ 147’ 14sI I
143I I I
141”I I
13YI I I I I I I I I I 73’
7Z7T
.
13eu.ufort Sea
t %2-,... . . .. . . . . . . . . . . .. . . . . . . . . .. . . . . . . . .
! . . . . . . . . . .
!523 ;:.::.’... .Pt. B a r r o w j::, ::”;:...,, Ez4
. . . .. . . . . . . .. . . . . . . . . . . . .. . . . . . . . . . . . . . . . .. .. . . . . . . . . .~ . . . . . . . . . “:”
. . . . . . . . . .. . . . . . . . .. . . . ..+....... . . . . . . . . .-h- ““’z :xjj~ii:.,: ~ ““{{g
. . . . . . . . .7’”~T%.,.BaI/ - Smam . . . . . . . . . . . . .:.. , . . ...... . . E&3,.:. . . ,.,
BavCape Halkett .,,..,. .
. . . . . . . . . . . . . . .
. . . . . . . . . . . . . . . . . . . . . . .. . . . . . . . . . . .. . . . . . . . . . . . . . . . . . . . . . . . .. . . . . . . . . . . . . . . . . .
: ‘L~
I.- ~ Uliktok Pt. -,
7cf 1- //Haw -
. . . . . —. J
L4zl
E SCALE (opprox.)
o~“ Nautleal ulla,
10 25 Sn AI .2 1 -w””,. \ \
Ed
71”
7Lr
1- ‘--Kllomot,m $[‘Y
Demarcat ion Pt.’
o =.n ~A~
1-B5” Stetuh Mllom
I Source: MM’S, Alaska OCS Realon gf ~
1-“
WY I I I I I I I I 11 I.!L_&sJ---157 15s 153 151” 149 14T
A14s 143’ 141” 139
69
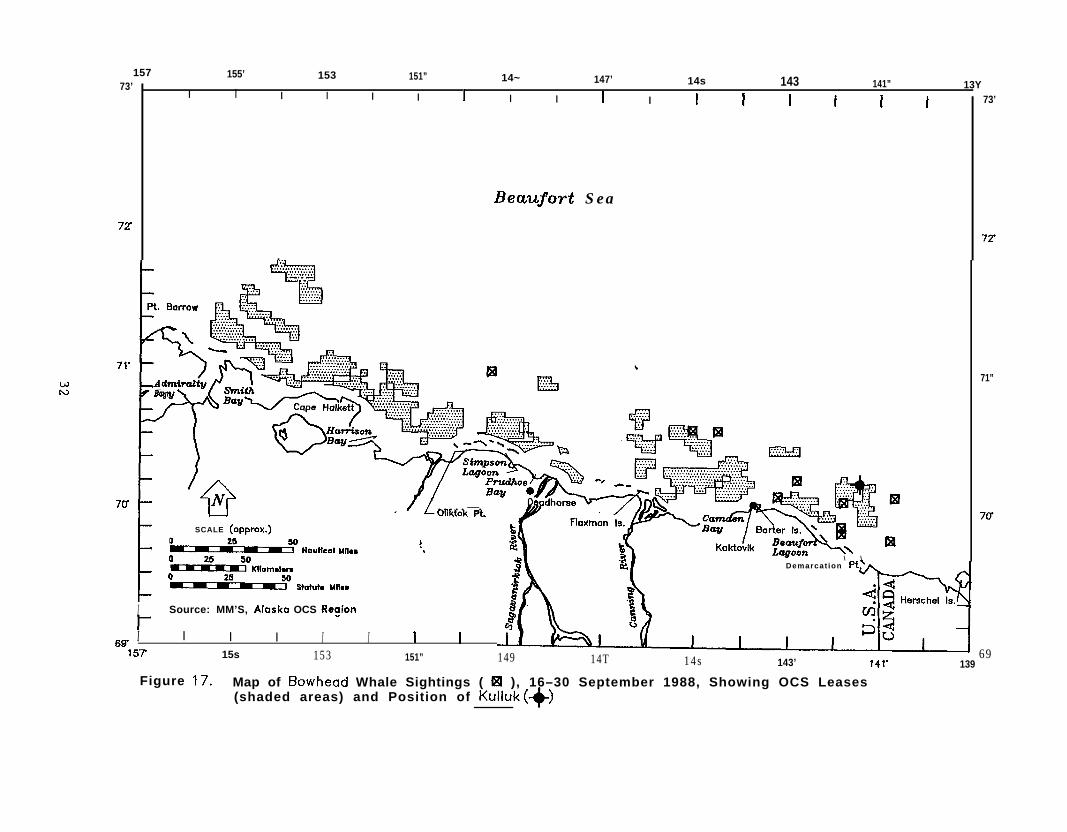
Figure 17, Map of Bowhead Whale Sightings ( ~ ), 16–30 September 1988, Showing OCS Leases(shaded areas) and Position of Kulluk (+)
ww
151” 14W 147 145’ 143 141” 13Y157- 155’ 15X
I I I I I I i73
73I
I I I 1 I I I I I I
Beaufort Sea
El .
Q,.....,. . . . .71”
_Admiral@v Bay
70’
Demarcation pt.
Source: MMS, Alaska OCS Region
I i I I I I I69’ 149 147’ 14Y 143 141” 139
157’ 155 153 151”
72’
71”
Figure 18. Map of Bowhead Whale Sightings ( ~), 1 -15 October 1988, Showing OCS Leases (shaded areas)
and Position of Kulluk (~)
I I I I I I I I I I I I I I I I I I I 1 Q-d I
.
.
ind’.
“-m
P:.:. m 7
;;:: ::::. . . . .;:;::::;:.:..;:::::--
.:::
W$#Jf}.. f“:.:... . :::. ::.:::
““”’’$$’ !m
I I I I pi]
inIn
‘6?
-1cm.-
LL
&r-
34
During the second half of September (Fig. 17), 12 sightings were made for a total of 14 bowheads. Thewesternmost bowhead sighted during this period was north of Simpson Lagoon (Appendix B: Flight 15).Group sizes were small (1-2), with 83.3 percent of the sightings representing single whales.
During the first half of October (Fig. 18), 14 sightings were made for a total of 16 bowheads, with sightingssomewhat equally distributed along the length of the coast. Group sizes remained small (1-2), with 85.7percent of the sightings representing singl~ whales. The last bow~ead seen in the Beaufort Sea during thestudy occurred on 13 October at 70024.9 N. latitude, 141022.2 W. longitude (Appendix B: Flight 27).
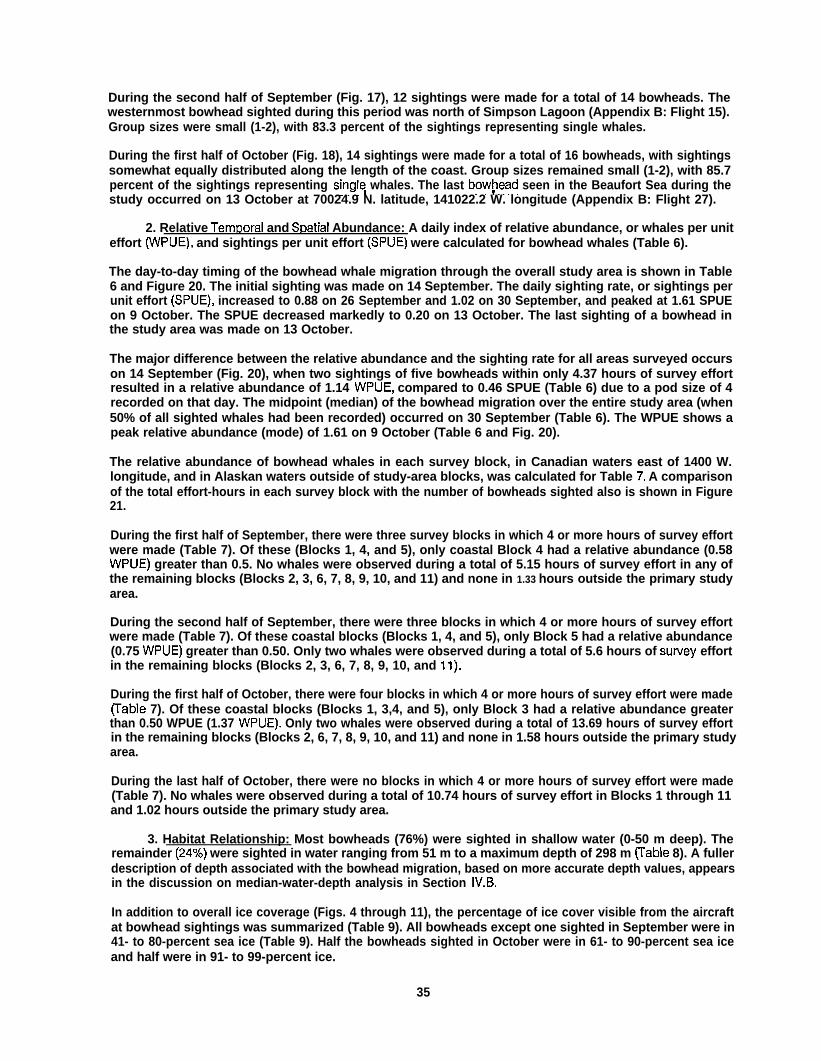
2. Relative Tem~oral and S~atial Abundance: A daily index of relative abundance, or whales per uniteffort (WPUE), and sightings per unit effort (SPUE) were calculated for bowhead whales (Table 6).
The day-to-day timing of the bowhead whale migration through the overall study area is shown in Table6 and Figure 20. The initial sighting was made on 14 September. The daily sighting rate, or sightings perunit effort (SPUE), increased to 0.88 on 26 September and 1.02 on 30 September, and peaked at 1.61 SPUEon 9 October. The SPUE decreased markedly to 0.20 on 13 October. The last sighting of a bowhead inthe study area was made on 13 October.
The major difference between the relative abundance and the sighting rate for all areas surveyed occurson 14 September (Fig. 20), when two sightings of five bowheads within only 4.37 hours of survey effortresulted in a relative abundance of 1.14 WPUE, compared to 0.46 SPUE (Table 6) due to a pod size of 4recorded on that day. The midpoint (median) of the bowhead migration over the entire study area (when50% of all sighted whales had been recorded) occurred on 30 September (Table 6). The WPUE shows apeak relative abundance (mode) of 1.61 on 9 October (Table 6 and Fig. 20).
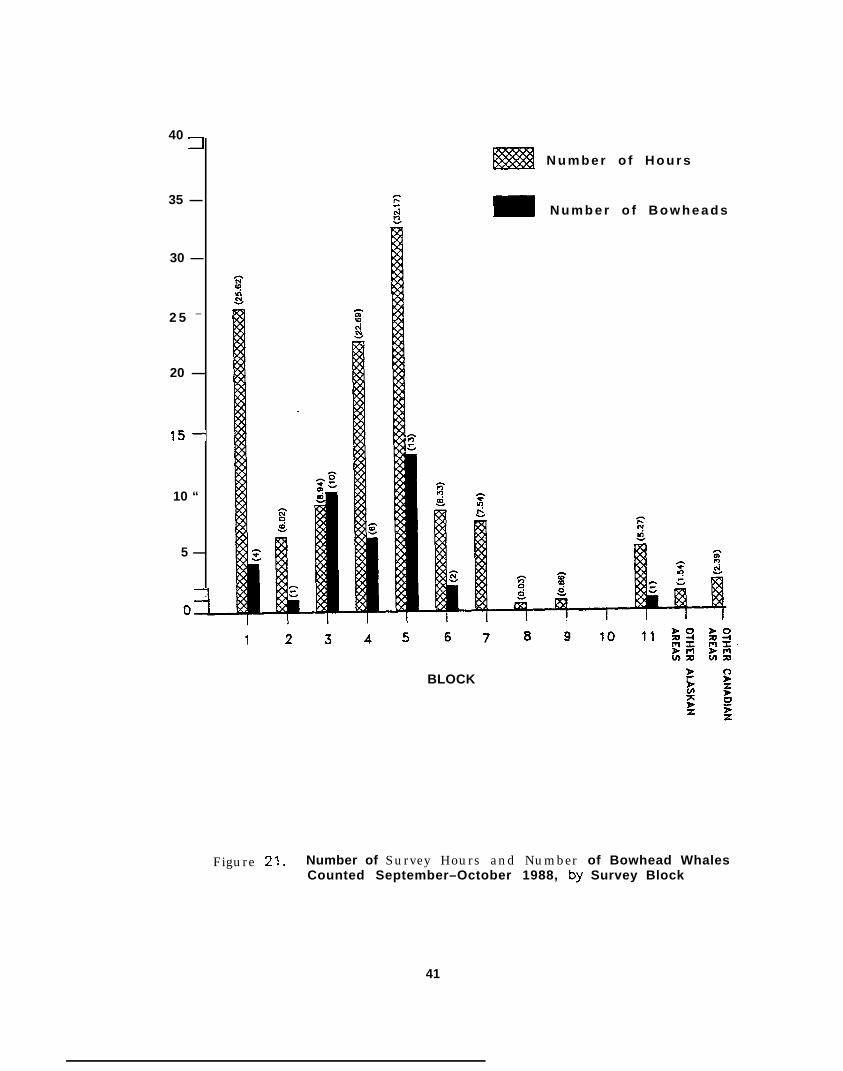
The relative abundance of bowhead whales in each survey block, in Canadian waters east of 1400 W.longitude, and in Alaskan waters outside of study-area blocks, was calculated for Table 7, A comparisonof the total effort-hours in each survey block with the number of bowheads sighted also is shown in Figure21.
During the first half of September, there were three survey blocks in which 4 or more hours of survey effortwere made (Table 7). Of these (Blocks 1, 4, and 5), only coastal Block 4 had a relative abundance (0.58WPUE) greater than 0.5. No whales were observed during a total of 5.15 hours of survey effort in any ofthe remaining blocks (Blocks 2, 3, 6, 7, 8, 9, 10, and 11) and none in 1.33 hours outside the primary studyarea.
During the second half of September, there were three blocks in which 4 or more hours of survey effortwere made (Table 7). Of these coastal blocks (Blocks 1, 4, and 5), only Block 5 had a relative abundance(0.75 WPUE) greater than 0.50. Only two whales were observed during a total of 5.6 hours of sutvey effortin the remaining blocks (Blocks 2, 3, 6, 7, 8, 9, 10, and 11).
During the first half of October, there were four blocks in which 4 or more hours of survey effort were made(Table 7). Of these coastal blocks (Blocks 1, 3,4, and 5), only Block 3 had a relative abundance greaterthan 0.50 WPUE (1.37 WPUE). Only two whales were observed during a total of 13.69 hours of survey effortin the remaining blocks (Blocks 2, 6, 7, 8, 9, 10, and 11) and none in 1.58 hours outside the primary studyarea.
During the last half of October, there were no blocks in which 4 or more hours of survey effort were made(Table 7). No whales were observed during a total of 10.74 hours of survey effort in Blocks 1 through 11and 1.02 hours outside the primary study area.
3. Habitat Relationship: Most bowheads (76%) were sighted in shallow water (0-50 m deep). Theremainder (24Yo) were sighted in water ranging from 51 m to a maximum depth of 298 m ~able 8). A fullerdescription of depth associated with the bowhead migration, based on more accurate depth values, appearsin the discussion on median-water-depth analysis in Section IV.B.
In addition to overall ice coverage (Figs. 4 through 11), the percentage of ice cover visible from the aircraftat bowhead sightings was summarized (Table 9). All bowheads except one sighted in September were in41- to 80-percent sea ice (Table 9). Half the bowheads sighted in October were in 61- to 90-percent sea iceand half were in 91- to 99-percent ice.
35
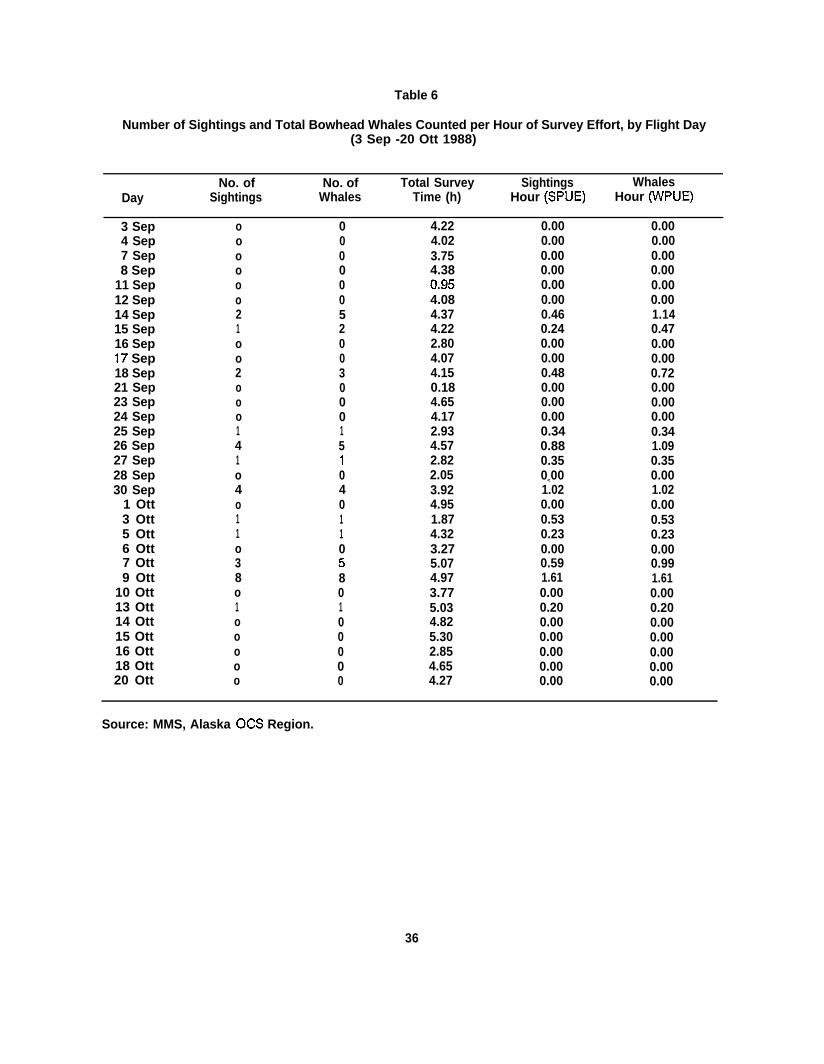
Table 6
Number of Sightings and Total Bowhead Whales Counted per Hour of Survey Effort, by Flight Day(3 Sep -20 Ott 1988)
No. of No. of Total Survey Sightings WhalesDay Sightings Whales Time (h) Hour (SPUE) Hour (WPUE)
3 Sep o 0 4.22 0.00 0.004 Sep o 0 4.02 0.00 0.007 Sep o 0 3.75 0.00 0.008 Sep o 0 4.38 0.00 0.00
11 Sep o 0 0.9!5 0.00 0.0012 Sep o 0 4.08 0.00 0.0014 Sep 2 5 4.37 0.46 1.1415 Sep 1 2 4.22 0.24 0.4716 Sep o 0 2.80 0.00 0.0017 Sep o 0 4.07 0.00 0.0018 Sep 2 3 4.15 0.48 0.7221 Sep o 0 0.18 0.00 0.0023 Sep o 0 4.65 0.00 0.0024 Sep o 0 4.17 0.00 0.0025 Sep 1 1 2.93 0.34 0.3426 Sep 4 5 4.57 0.88 1.0927 Sep 1 1 2.82 0.35 0.3528 Sep o 0 2.05 0<00 0.0030 Sep 4 4 3.92 1.02 1.02
1 Ott o 0 4.95 0.00 0.003 Ott 1 1 1.87 0.53 0.535 Ott 1 1 4.32 0.23 0.236 Ott o 0 3.27 0.00 0.007 Ott 3 5 5.07 0.59 0.999 Ott 8 8 4.97 1.61 1.61
10 Ott o 0 3.77 0.00 0.0013 Ott 1 1 5.03 0.20 0.2014 Ott o 0 4.82 0.00 0.0015 Ott o 0 5.30 0.00 0.0016 Ott o 0 2.85 0.00 0.0018 Ott o 0 4.65 0.00 0.0020 Ott o 0 4.27 0.00 0.00
Source: MMS, Alaska OCS Region.
36
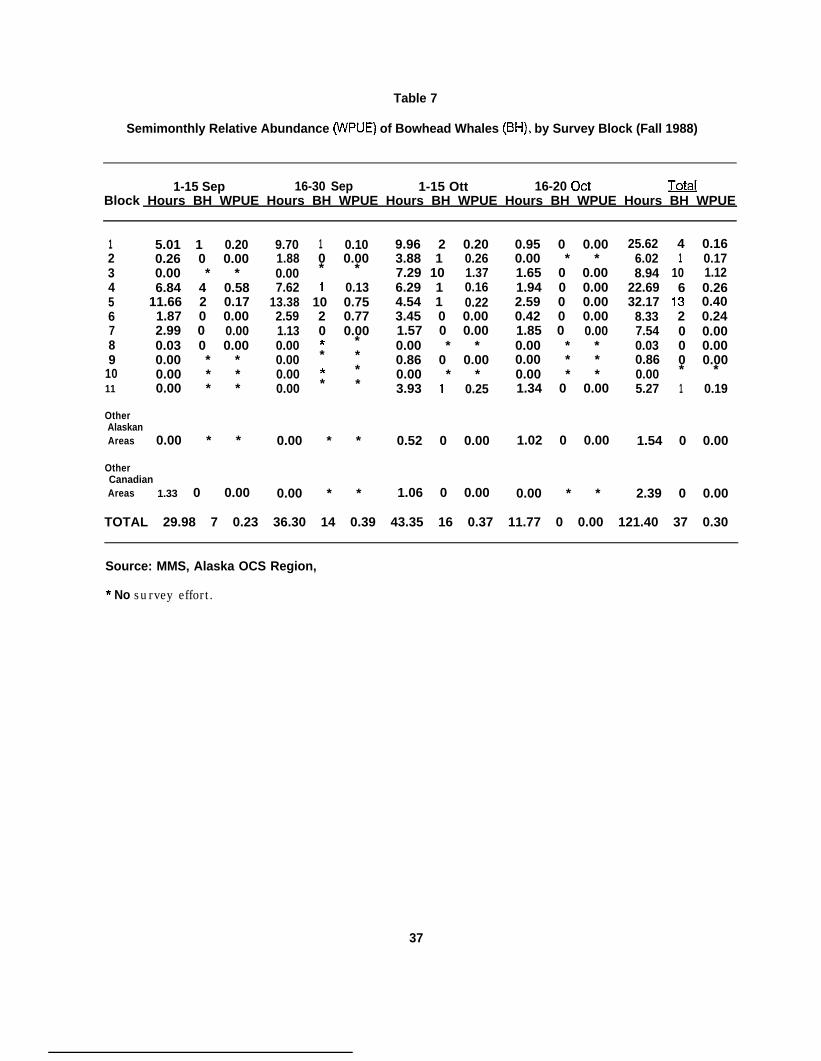
Table 7
Semimonthly Relative Abundance (WPUE) of Bowhead Whales (BH), by Survey Block (Fall 1988)
1-15 Sep 16-30 Sep 1-15 Ott 16-20 oct ~Block Hours BH WPUE Hours BH WPUE Hours BH WPUE Hours BH WPUE Hours BH WPUE
1 5.01 1 0.202 0.26 0 0.003 0.00 * *4 6.84 4 0.585 11.66 2 0.176 1.87 0 0.007 2.99 0 0.008 0.03 0 0.009 0.00 * *
10 0.00 * *11 0.00 * *
9.701.880.007.62
13.382.591.130.000.000.000.00
1 0.10 9.96 2 0.20 0.95 0 0.000 0.00 3.88 1 0.26 0.00 * ** * 7.29 10 1.37 1.65 0 0.001 0.13 6.29 1 0.16 1.94 0 0.00
10 0.75 4.54 1 0.22 2.59 0 0.002 0.77 3.45 0 0.00 0.42 0 0.000 0.00 1.57 0 0.00 1.85 0 0.00* * 0.00 * * 0.00 * ** * 0.86 0 0.00 0.00 * ** * 0.00 * * 0.00 * ** * 3.93 1 0.25 1.34 0 0.00
25.626.028.94
22.6932.17
8.337.540.030.860.005.27
4 0.161 0.17
10 1.126 0.26
13 0.402 0.240 0.000 0.000 0.00* *1 0.19
OtherAlaskanAreas 0.00 * * 0.00 * * 0.52 0 0.00 1.02 0 0.00 1.54 0 0.00
OtherCanadianAreas 1.33 0 0.00 0.00 * * 1.06 0 0.00 0.00 * * 2.39 0 0.00
TOTAL 29.98 7 0.23 36.30 14 0.39 43.35 16 0.37 11.77 0 0.00 121.40 37 0.30
Source: MMS, Alaska OCS Region,
* No survey effort.
37
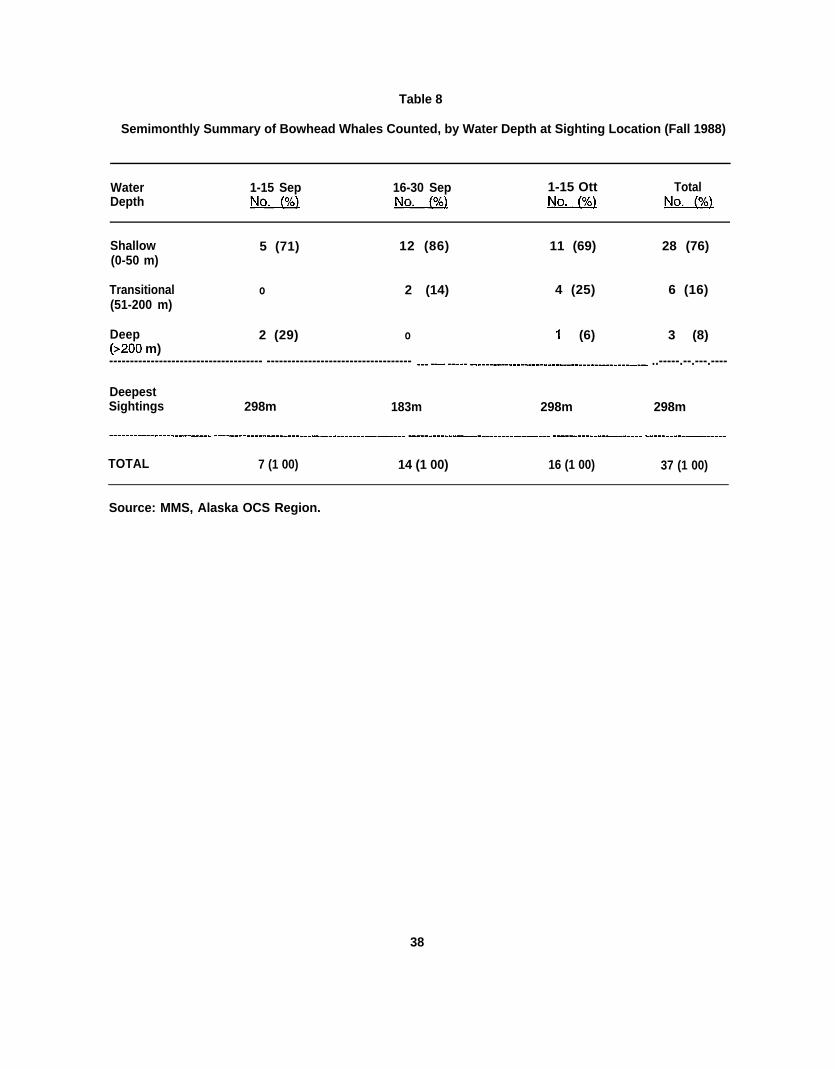
Table 8
Semimonthly Summary of Bowhead Whales Counted, by Water Depth at Sighting Location (Fall 1988)
Water 1-15 Sep 16-30 Sep 1-15 Ott TotalDepth m [email protected] !!&.&?) !@_@)
Shallow(0-50 m)
5 (71) 12 (86) 11 (69) 28 (76)
Transitional o 2 (14) 4 (25) 6 (16)(51-200 m)
Deep 2 (29) o 1 (6) 3 (8)(>200 m)------------------------------------- ----------------------------------- .-. ---. .---. c--------------------------------------------- ..-----.--.---.----
DeepestSightings 298m 183m 298m 298m
-------_----------_---. ----------------------------------------------- ----------------------------------- ---------------------- .------------------.
TOTAL 7 (1 00) 14 (1 00) 16 (1 00) 37 (1 00)
Source: MMS, Alaska OCS Region.
38
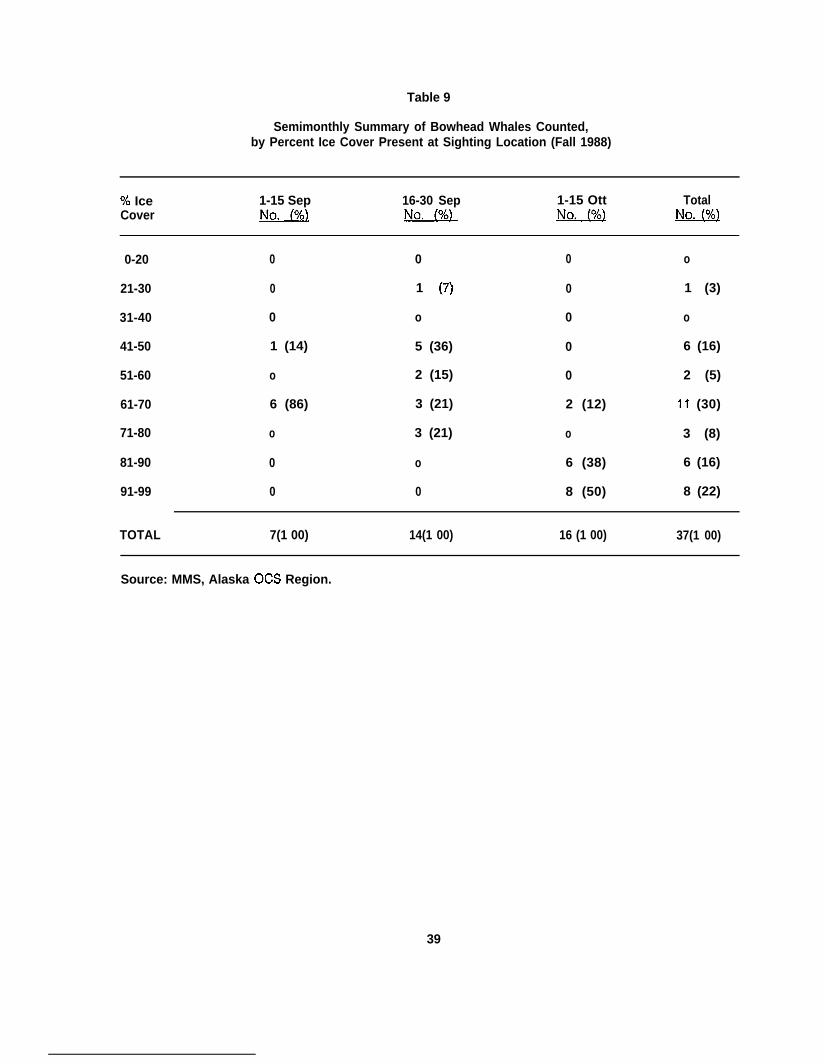
Table 9
Semimonthly Summary of Bowhead Whales Counted,by Percent Ice Cover Present at Sighting Location (Fall 1988)
‘A Ice 1-15 Sep 16-30 Sep 1-15 Ott TotalCover N&(%) !!L(zJ_ w !&L@?)
0-20
21-30
31-40
41-50
51-60
61-70
71-80
81-90
91-99
0
0
0
1 (14)
o
6 (86)
o
0
0
0
1 (7)
o
5 (36)
2 (15)
3 (21)
3 (21)
o
0
0
0
0
0
0
2 (12)
o
6 (38)
8 (50)
o
1 (3)
o
6 (16)
2 (5)
11 (30)
3 (8)
6 (16)
8 (22)
TOTAL 7(1 00) 14(1 00) 16 (1 00) 37(1 00)
Source: MMS, Alaska OCS Region.
39
K10
x-l00Cg1—
c13a(n- .m3 -- .
z(n
-u(m1
ii013014+15$j18 0fl17’18 0
;! — o2 22 32 4 _25—2 6 _2 72 82 930 _
0.20
[-1094
1.61
40
35 —
30 —
2 5 —
20 —
15—
10 “
5 —
7
N u m b e r o f H o u r s
N u m b e r o f B o w h e a d s
BLOCK
Figure 21. Number of Survey Hours and Number of Bowhead WhalesCounted September–October 1988, by Survey Block
41

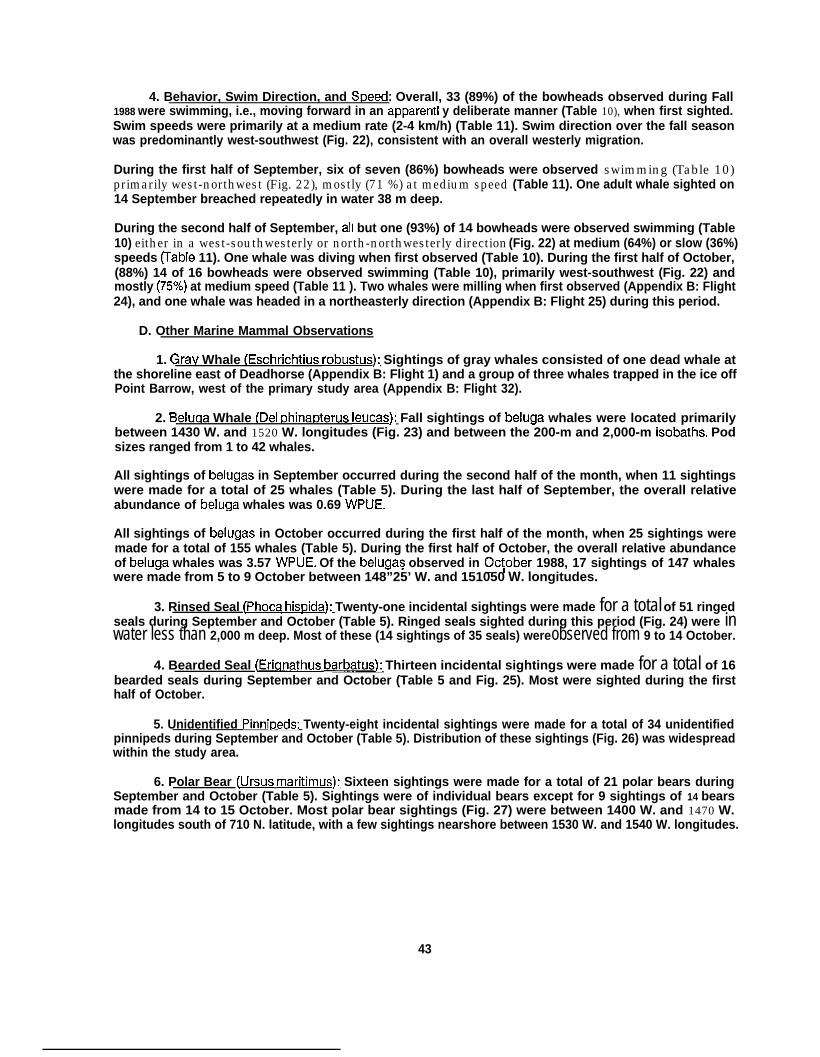
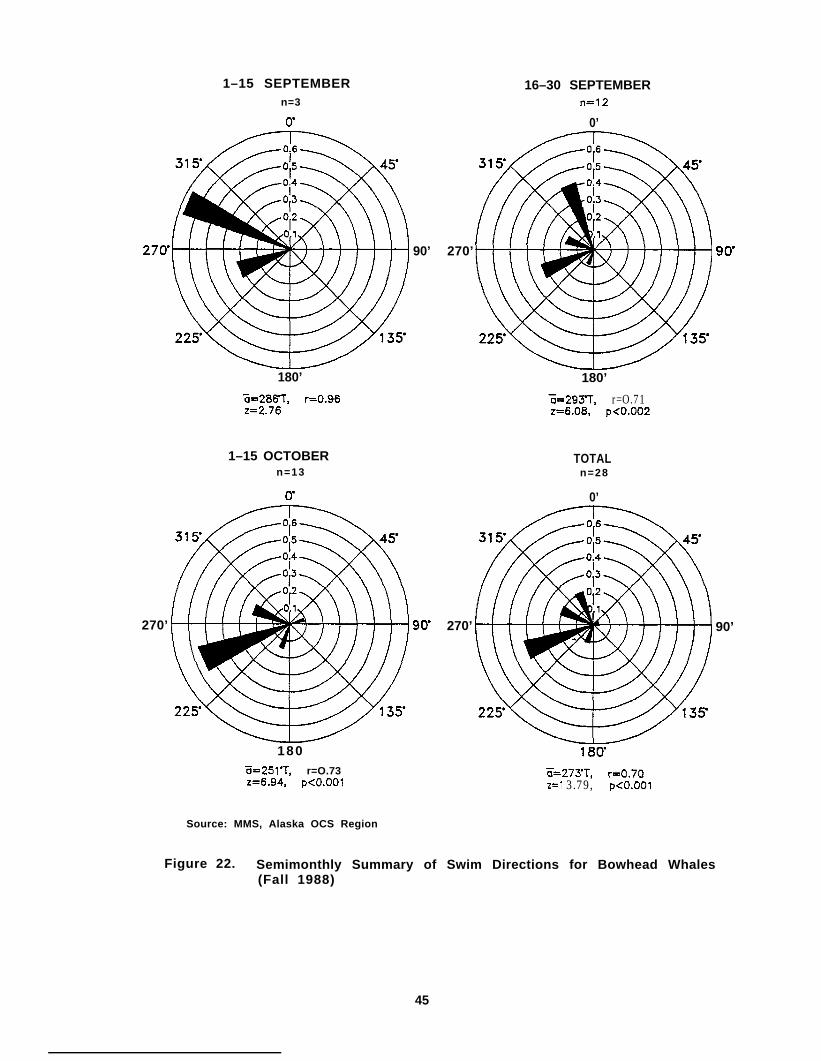
4. Behavior, Swim Direction, and Speed: Overall, 33 (89%) of the bowheads observed during Fall1988 were swimming, i.e., moving forward in an apparentl y deliberate manner (Table 10), when first sighted.Swim speeds were primarily at a medium rate (2-4 km/h) (Table 11). Swim direction over the fall seasonwas predominantly west-southwest (Fig. 22), consistent with an overall westerly migration.
During the first half of September, six of seven (86%) bowheads were observed swimming (Table 10)primarily west-northwest (Fig. 22), mostly (71 %) at medium speed (Table 11). One adult whale sighted on14 September breached repeatedly in water 38 m deep.
During the second half of September, all but one (93%) of 14 bowheads were observed swimming (Table10) either in a west-southwesterly or north-northwesterly direction (Fig. 22) at medium (64%) or slow (36%)speeds (Table 11). One whale was diving when first observed (Table 10). During the first half of October,(88%) 14 of 16 bowheads were observed swimming (Table 10), primarily west-southwest (Fig. 22) andmostly (75Yo) at medium speed (Table 11 ). Two whales were milling when first observed (Appendix B: Flight24), and one whale was headed in a northeasterly direction (Appendix B: Flight 25) during this period.
D. Other Marine Mammal Observations
1. Grav Whale (Eschrichtius robustus): Sightings of gray whales consisted of one dead whale atthe shoreline east of Deadhorse (Appendix B: Flight 1) and a group of three whales trapped in the ice offPoint Barrow, west of the primary study area (Appendix B: Flight 32).
2. Beluua Whale (Del ~hinatXerus Ieucas): Fall sightings of beluga whales were located primarilybetween 1430 W. and 1520 W. longitudes (Fig. 23) and between the 200-m and 2,000-m isobaths. Podsizes ranged from 1 to 42 whales.
All sightings of belugas in September occurred during the second half of the month, when 11 sightingswere made for a total of 25 whales (Table 5). During the last half of September, the overall relativeabundance of beluga whales was 0.69 WPUE.
All sightings of belugas in October occurred during the first half of the month, when 25 sightings weremade for a total of 155 whales (Table 5). During the first half of October, the overall relative abundanceof beluga whales was 3.57 WPUE. Of the belugas observed in Oc~ober 1988, 17 sightings of 147 whaleswere made from 5 to 9 October between 148”25’ W. and 151050 W. longitudes.
3. Rinsed Seal (Phoca his~ida): Twenty-one incidental sightings were made for a total of 51 ringedseals during September and October (Table 5). Ringed seals sighted during this period (Fig. 24) were inwater less than 2,000 m deep. Most of these (14 sightings of 35 seals) were observed from 9 to 14 October.
4. Bearded Seal (Erianathus barbatus): Thirteen incidental sightings were made for a total of 16bearded seals during September and October (Table 5 and Fig. 25). Most were sighted during the firsthalf of October.
5. Unidentified Pinni~eds: Twenty-eight incidental sightings were made for a total of 34 unidentifiedpinnipeds during September and October (Table 5). Distribution of these sightings (Fig. 26) was widespreadwithin the study area.
6. Polar Bear (Lfrsus maritimus): Sixteen sightings were made for a total of 21 polar bears duringSeptember and October (Table 5). Sightings were of individual bears except for 9 sightings of 14 bearsmade from 14 to 15 October. Most polar bear sightings (Fig. 27) were between 1400 W. and 1470 W.longitudes south of 710 N. latitude, with a few sightings nearshore between 1530 W. and 1540 W. longitudes.
43
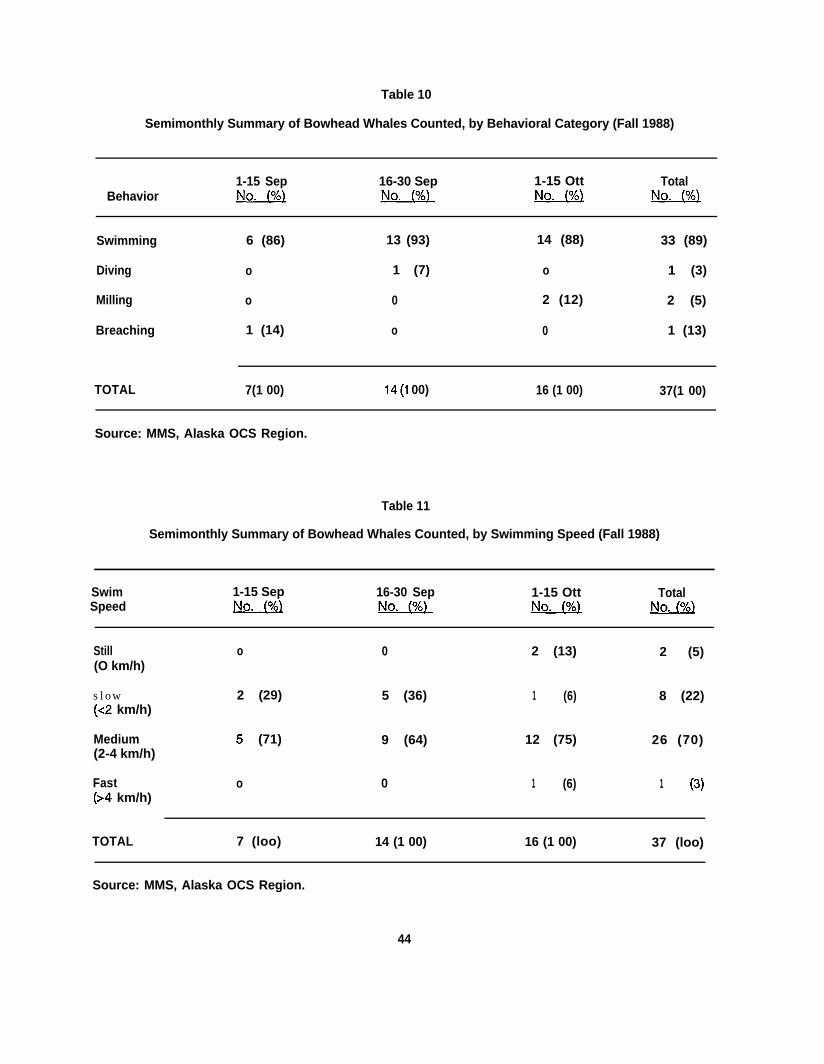
Table 10
Semimonthly Summary of Bowhead Whales Counted, by Behavioral Category (Fall 1988)
1-15 Sep 16-30 Sep 1-15 Ott TotalBehavior m NJL@)- U M
Swimming 6 (86) 13 (93) 14 (88) 33 (89)
Diving o 1 (7) o 1 (3)
Milling o 0 2 (12) 2 (5)
Breaching 1 (14) o 0 1 (13)
TOTAL 7(1 00) 14(1 00) 16 (1 00) 37(1 00)
Source: MMS, Alaska OCS Region.
Table 11
Semimonthly Summary of Bowhead Whales Counted, by Swimming Speed (Fall 1988)
Swim 1-15 Sep 16-30 Sep 1-15 Ott TotalSpeed M ~ m m
Still o 0 2 (13) 2 (5)(O km/h)
slow 2 (29) 5 (36) 1 (6) 8 (22)(<2 km/h)
Medium 5 (71) 9 (64) 12 (75) 26 (70)(2-4 km/h)
Fast o 0 1 (6) 1 (3)(>4 km/h)
TOTAL 7 (loo) 14 (1 00) 16 (1 00) 37 (loo)
Source: MMS, Alaska OCS Region.
44
1–15 SEPTEMBER 16–30 SEPTEMBERn=3 n=12
u
27U 90’
180’
0’
270’
180’
270’
6=2817T, r=O.96 ~=293T, r=O.71z=2.76 z=6.08, p<o.oo2
1–15 OCTOBER TOTALn=13 n=28
0’
90
180
270’
0’
18(Y==251”T, r=O.73 ~=27YT,z=6.94,
r=O.70p<o.ool 2=1 3.79, p<o.ool
Source: MMS, Alaska OCS Region
90’
Figure 22. Semimonthly Summary of Swim Directions for Bowhead Whales(Fall 1988)
45
157 155’ 153’ 151” 149’ 14T 145’ 143’ 141” 13973’
72’
71’
$-0-1
70’
CO.
AA
A
Beaufort Sea
I I I I I I I I I I I I I I I I I 73
77
Pt. Barrow
\ AA 4?A
A ‘ AA
A A
SCALE (opprox.) $~. . “.....”,. .-.
#o~ NoutIcal Mllos
b “3‘.
o-Dffllomdcn
$
0~ Statuto MIIos
f
Source: MMS, Alaska OCS Regionu
I I I I I I I I I
Kaktobik URWKkJ WV ,
LagoonDemarcation Pt>
171”
7Cf
h-n.d
“o 1 !3-7 15s 153’ 151” 149’ 147’ 145’ 143’ 141’ 13Sr--
Figure 23. Map of Beluga Whale Sightings ( A), September–October 1988
b )JF “rr- ~ b
bw
m “mr
I I I I I I I I I I I I I I I I I I I I Qz.1 I 1-WY
1
+,
+
++
Q+
0).
47
157 155’ 1 Sr 151” 14V 14T73’
145 143 141” 139
I I I I I I I I I I I I I I I I I I 7s
72’
71”
Pt. Barrow
Beaufort Sea
77
71”_Admtralii H. . . ! I
7:rBq/ -
iy~keti
o
?o
Hawieon
‘-+- ...=.
/7
La#oon-
●
7(r — UIIK{QK I-L.●
SCALE (approx.)
o-W Noutleol Mflo#
b Kakto~lk Beauf~‘, Lqoon
o94!A”N110mti.m 30 *~Shlhlto MU*S
i● 4.,. *
‘aHerschel Is.
S o u r c e : MMS, Alasko OCS fieglon q ~~ $
I6 9
I I I 1 I I I 1 I I I157’ 15!Y 15X 151” 149’ 147’ 145’
69143’ 141” 139
Figure 2 5 . Map of Bearded Seal Sightings (.), September–October 1988
-1
I I I I I I I I I I I I I I I I I I I I
**
/4$
b-J’
* mcomY
FJ
**
*
*
*
* **
.
Gw
I.-&
a)L3m.-
LLlJ
49
I I I I I I I I I I I I I I I I I I I I I I
M
w
-1
I-J
$
a)030).
L0$
‘6
50
IV. DISCUSSION
A. General Com~arisons with Previous Survevs 0979-1987~
Results of the present study are generally within the range of result values from previous MMS-fundedendangered whale surveys conducted during September and October (1979-1 987) in the Beaufoti Sea(Ljungblad et al., 1987; Treaty, 1988).
The general ice coverage in 1988 during the navigation season was the eighth most severe in the ArcticOcean for the years 1953 through 1988 and was the second most severe (after 1983) since the MMSsurveys began in 1979 (USDOD, Navy, Naval Polar Oceanographic Center, 1989).
The relative abundance (WPUE) of bowhead whales in each survey block during both September andOctober 1988 was within the range of values observed for the years 1979 to 1987 (Table 12) and within 1standard deviation (SD) of the mean value for previous years (1979-1987) in each area.
The percentage of bowhead whales engaged in “swimming” behavior in 1988 (89%) was the highest notedfor this behavioral category compared to previous Beaufort Sea surveys (previous high = 71% in 1987). Thecumulative 1979-1987 percentage (September-October) for swimming bowheads was 44 percent.
The ratio of bowhead calves for 1988 (0.00) was low compared to most 1979-1987 fall (September- October)surveys (overall estimate = 0.03), although comparable to the 1981, 1984, and 1987 ratios (0.01).
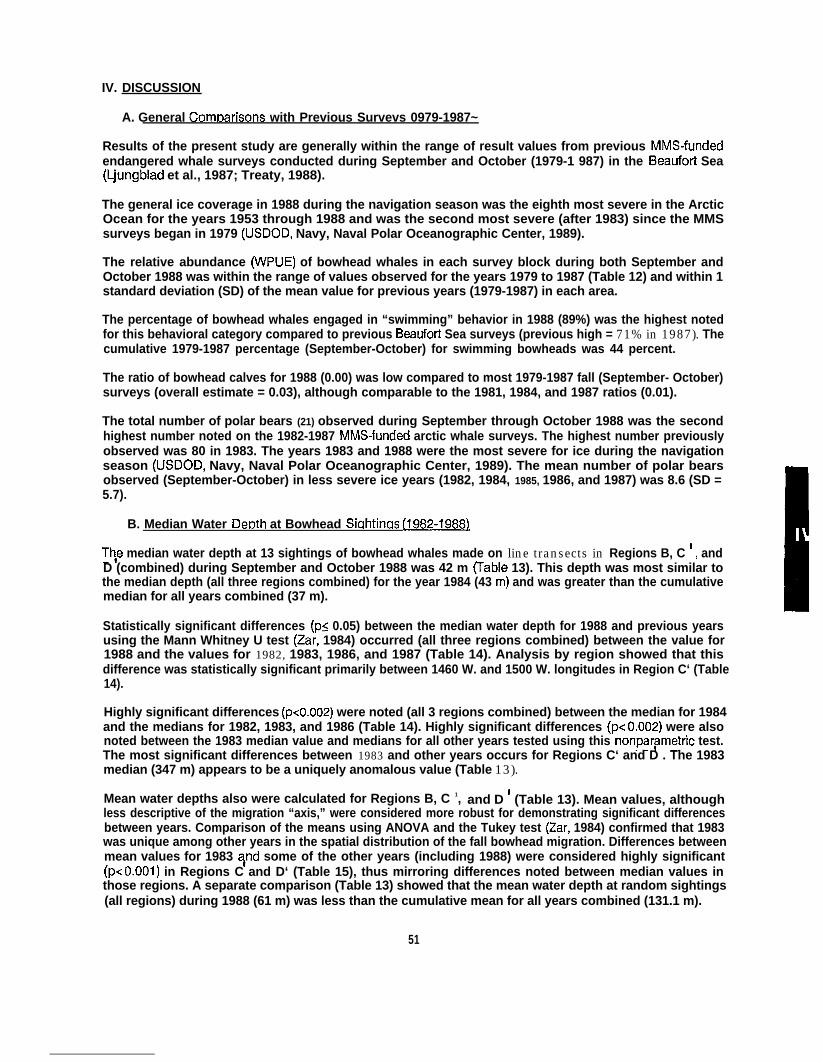
The total number of polar bears (21) observed during September through October 1988 was the secondhighest number noted on the 1982-1987 MMS-funded arctic whale surveys. The highest number previouslyobserved was 80 in 1983. The years 1983 and 1988 were the most severe for ice during the navigationseason (USDOD, Navy, Naval Polar Oceanographic Center, 1989). The mean number of polar bearsobserved (September-October) in less severe ice years (1982, 1984, 1985, 1986, and 1987) was 8.6 (SD =5.7).
B. Median Water DerXh at Bowhead Siahtinas (1982-19881
Th,e median water depth at 13 sightings of bowhead whales made on line transects in Regions B, C 1, andD (combined) during September and October 1988 was 42 m (Table 13). This depth was most similar tothe median depth (all three regions combined) for the year 1984 (43 m) and was greater than the cumulativemedian for all years combined (37 m).
Statistically significant differences (PS 0.05) between the median water depth for 1988 and previous yearsusing the Mann Whitney U test (Zar, 1984) occurred (all three regions combined) between the value for1988 and the values for 1982, 1983, 1986, and 1987 (Table 14). Analysis by region showed that thisdifference was statistically significant primarily between 1460 W. and 1500 W. longitudes in Region C‘ (Table14).
Highly significant differences (peo.002) were noted (all 3 regions combined) between the median for 1984and the medians for 1982, 1983, and 1986 (Table 14). Highly significant differences (p< O.002) were alsonoted between the 1983 median value and medians for all other years tested using this nonpar?metric test.The most significant differences between 1983 and other years occurs for Regions C‘ and D . The 1983median (347 m) appears to be a uniquely anomalous value (Table 13).
Mean water depths also were calculated for Regions B, C 1, and D 1 (Table 13). Mean values, althoughless descriptive of the migration “axis,” were considered more robust for demonstrating significant differencesbetween years. Comparison of the means using ANOVA and the Tukey test (Zar, 1984) confirmed that 1983was unique among other years in the spatial distribution of the fall bowhead migration. Differences betweenmean values for 1983 ~nd some of the other years (including 1988) were considered highly significant(p< O.001) in Regions C and D‘ (Table 15), thus mirroring differences noted between median values inthose regions. A separate comparison (Table 13) showed that the mean water depth at random sightings(all regions) during 1988 (61 m) was less than the cumulative mean for all years combined (131.1 m).
51
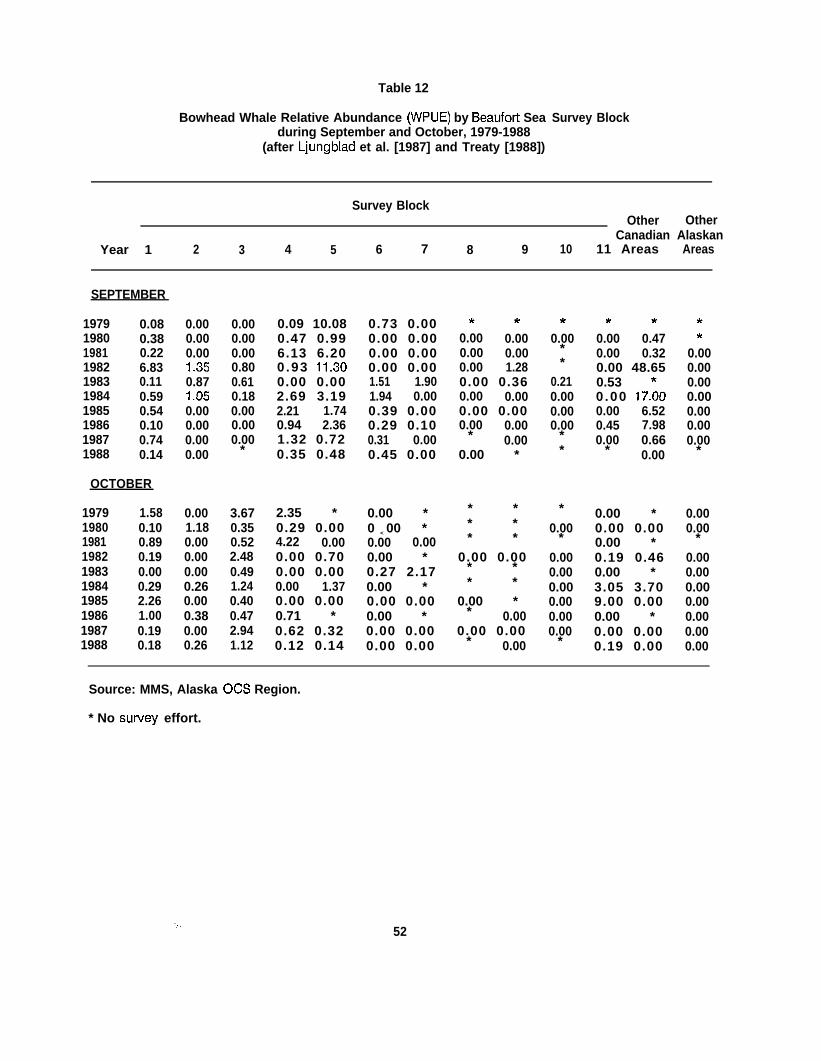
Table 12
Bowhead Whale Relative Abundance (WPUE) by Beaufort Seaduring September and October, 1979-1988
(after Ljungblad et al. [1987] and Treaty [1988])
Survey Block
Survey BlockOther Other
Canadian AlaskanYear 1 2 3 4 5 6 7 8 9 10 11 Areas Areas
SEPTEMBER
1979 0.081980 0.381981 0.221982 6.831983 0.111984 0.591985 0.541986 0.101987 0.741988 0.14
OCTOBER
1979 1.581980 0.101981 0.891982 0.191983 0.001984 0.291985 2.261986 1.001987 0.191988 0.18
0.000.000.001.350.871.050.000.000.000.00
0.001.180.000.000.000.260.000.380.000.26
0.000.000.000.800.610.180.000.000.00
*
3.670.350.522.480.491.240.400.472.941.12
0.09 10.080.47 0.996.13 6.200 .93 11.300.00 0.002.69 3.192.21 1.740.94 2.361.32 0.720.35 0.48
2.35 *0.29 0.004.22 0.000.00 0.700.00 0.000.00 1.370.00 0.000.71 *0.62 0.320.12 0.14
0.73 0.000.00 0.000.00 0.000.00 0.001.51 1.901.94 0.000.39 0.000.29 0.100.31 0.000.45 0.00
0.00 *0 < 00 *0.00 0.000.00 *0.27 2.170.00 *0.00 0.000.00 *0.00 0.000.00 0.00
* *
0.00 0.000.00 0.000.00 1.280.00 0.360.00 0.000.00 0.000.00 0.00
* 0.000.00 *
* ** ** *
0.00 0.00* ** *
0.00 ** 0.00
0.00 0.00* 0.00
*
0.00**
0.210.000.000.00
**
*
0.00*
0.000.000.000.000.000.00
*
* *
0.00 0.470.00 0.320.00 48.650.53 *0 .00 17.000.00 6.520.45 7.980.00 0.66
* 0.00
0.00 *0.00 0.000.00 *0.19 0.460.00 *3.05 3.709.00 0.000.00 *0.00 0.000.19 0.00
**
0.000.000.000.000.000.000.00
*
0.000.00
*
0.000.000.000.000.000.000.00
Source: MMS, Alaska OCS Region.
* No sutvey effort.
. .. .52
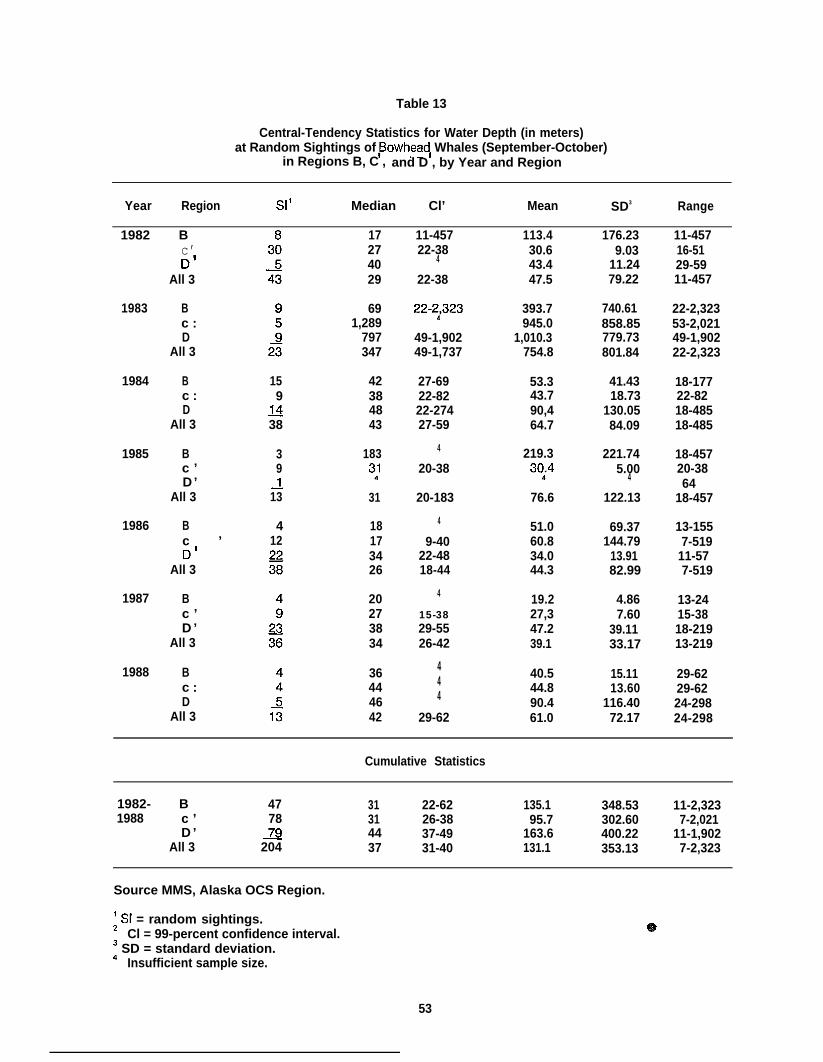
Table 13
Central-Tendency Statistics for Water Depth (in meters)at Random Sightings of ,Bowhea~ Whales (September-October)
in Regions B, C , and D , by Year and Region
Year Region S1’ Median Cl’ Mean SD3 Range
1982 B 8 17 11-457 113.4 176.23 11-457c’D’
274029
22-384
22-38
22-:,323
49-1,90249-1,737
27-6922-8222-27427-59
4
20-38
20-183
4
9-4022-4818-44
4
15-3829-5526-42
444
29-62
30.643.447.5
393.7945.0
1,010.3754.8
53.343.790,464.7
219.330;4
76.6
51.060.834.044.3
19.227,347.239.1
40.544.890.461.0
9.0311.2479.22
740.61858.85779.73801.84
41.4318.73
130.0584.09
221.745.00
4
122.13
69.37144.79
13.9182.99
4.867.60
39.1133.17
15.1113.60
116.4072.17
16-5129-5911-457
22-2,32353-2,02149-1,90222-2,323
18-17722-8218-48518-485
18-45720-3864
18-457
13-1557-519
11-577-519
13-2415-3818-21913-219
29-6229-6224-29824-298
All 3
1983 Bc :D
691,289
797347All 3
1984 Bc :D
159
~38
42384843All 3
1985 Bc ’D ’
39J13
1833:
31All 3
Bc ’D’
1986 412
18173426All 3
1987 Bc ’D ’
20273834All 3
1988 Bc :D
36444642All 3
Cumulative Statistics
1982- B 47 31 22-62 135.1 348.53 11-2,3231988 c ’ 78 31 26-38 95.7 302.60 7-2,021
D ’ ~ 44 37-49 163.6 400.22 11-1,902All 3 204 37 31-40 131.1 353.13 7-2,323
Source MMS, Alaska OCS Region.
~ S1 = random sightings.Cl = 99-percent confidence interval. e
~ SD = standard deviation.Insufficient sample size.
53
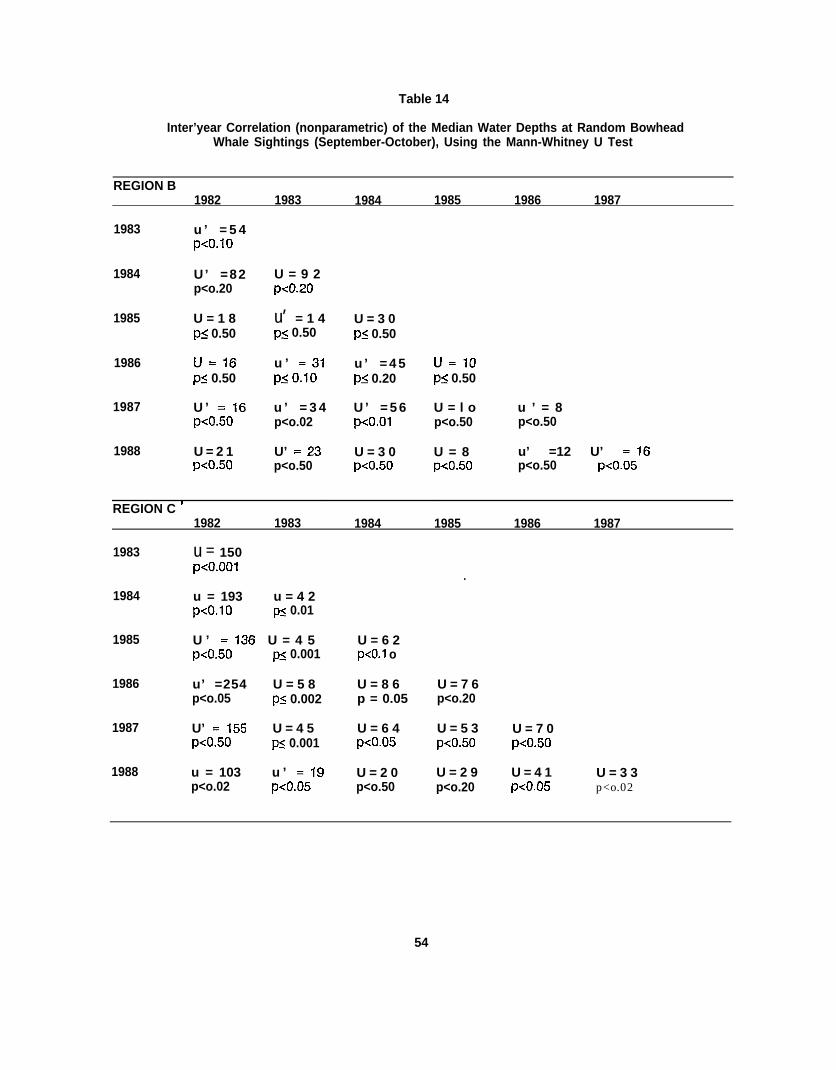
Table 14
Inter’year Correlation (nonparametric) of the Median Water Depths at Random BowheadWhale Sightings (September-October), Using the Mann-Whitney U Test
REGION B1982 1983 1984 1985 1986 1987
1983 u ’ = 5 4p<o.lo
1984 U’ =82p<o.20
1985 U = 1 8p< 0.50
1986 U=16p< 0.50
1987 U ’ =16p<o.50
1988 U = 2 1p<o.50
U = 9 2p<o.20
u’ = 1 4p< 0.50
u ’ =31p<o.lo
u ’ = 3 4p<o.02
U’ =23p<o.50
REGION C ‘
U = 3 0p< 0.50
u ’ = 4 5p< 0.20
U ’ = 5 6p<o.ol
U = 3 0p<o.50
U=lops 0.50
U = l o u ’ = 8p<o.50 p<o.50
U = 8 u’ =12 U’ =16p<o.50 p<o.50 p<o.05
1982 1983 1984 1985 1986 1987
1983 u = 150p<o.ool
.
1984 u = 193 u = 4 2p<o.lo p% 0.01
1985 U ’ =136 U = 4 5 U = 6 2p<o.50 p~ 0.001 p<o.1 o
1986 u’ =254 U = 5 8 U = 8 6 U = 7 6p<o.05 ps 0.002 p = 0.05 p<o.20
1987 U’ =155 U = 4 5 U = 6 4 U = 5 3 U = 7 0p<o.50 ps 0.001 p<o.05 p<o.50 p<o.50
1988 u = 103 u ’ =19 U = 2 0 U = 2 9 U = 4 1 U = 3 3p<o.02 p<o.05 p<o.50 p<o.20 p<o.05 p<o.02
54
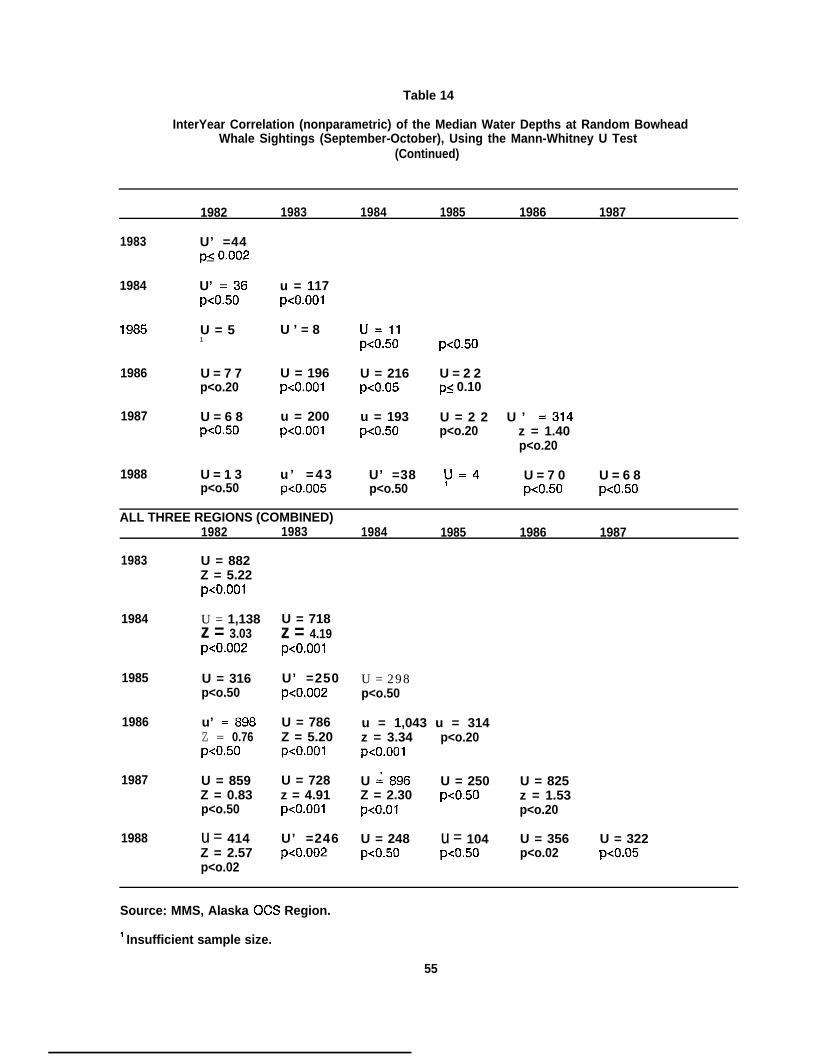
Table 14
InterYear Correlation (nonparametric) of the Median Water Depths at Random BowheadWhale Sightings (September-October), Using the Mann-Whitney U Test
(Continued)
1982 1983 1984 1985 1986 1987
1983 U’ =44p< C.002
1984 U’ =36 u = 117p<o.50 p<o.ool
1985 U = 5 U ’ = 8 U=ll1 p<o.50 p<o.50
1986 U = 7 7 U = 196 U = 216 U = 2 2p<o.20 p<o.ool p<o.05 p< 0.10
1987 U = 6 8 u = 200 u = 193 U = 2 2 U ’ =314p<o.50 p<o.ool p<o.50 p<o.20 z = 1.40
p<o.20
1988 U = 1 3 u ’ = 4 3 U’ =38 y=4 U = 7 0 U = 6 8p<o.50 p<o.oo5 p<o.50 p<o.50 p<o.50
ALL THREE REGIONS (COMBINED)1982 1983 1984 1985 1986 1987
1983 U = 882Z = 5.22p<o.ool
1984 U = 1,138z = 3.03p<o.oo2
1985 U = 316p<o.50
1986 u’ =898Z = 0.76p<o.50
1987 U = 859Z = 0.83p<o.50
1988 u = 414Z = 2.57p<o.02
U = 718z = 4.19p<o.ool
U’ =250p<o.oo2
U = 786Z = 5.20p<o.ool
U = 728z = 4.91p<o.ool
U’ =246p<o.oQ2
U = 298p<o.50
u = 1,043 u = 314z = 3.34 p<o.20p<o.ool
U :896 U = 250 U = 825Z = 2.30 p<o.50 z = 1.53p<o.ol p<o.20
U = 248 u = 104 U = 356 U = 322p<o.50 p<o.50 p<o.02 p<o.05
Source: MMS, Alaska OCS Region.
‘ Insufficient sample size.
55
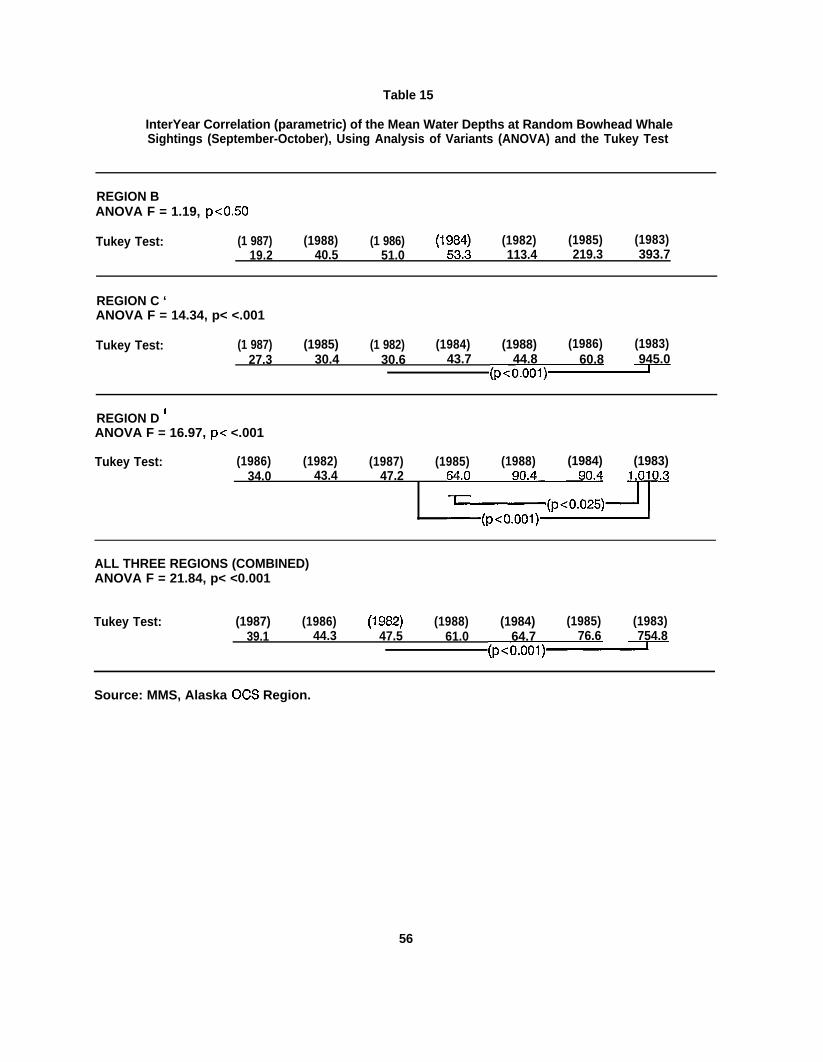
Table 15
InterYear Correlation (parametric) of the Mean Water Depths at Random Bowhead WhaleSightings (September-October), Using Analysis of Variants (ANOVA) and the Tukey Test
REGION BANOVA F = 1.19, P<O.50
Tukey Test: (1 987) (1988) (1 986) (l::J (1982) (1985) (1983)19.2 40.5 51.0 113.4 219.3 393.7
REGION C ‘ANOVA F = 14.34, p< <.001
Tukey Test: (1 987) (1985) (1 982) (1984) (1988) (1986) (1983)27.3 30.4 30.6 43.7 44.8 60.8 945.0
(p<o.ool)~
REGION D tANOVA F = 16.97, p< <.001
Tukey Test: (1986) (1982) (1987) (1985) (1988) (1984) (1983)34.0 43.4 47.2
6=2
ALL THREE REGIONS (COMBINED)ANOVA F = 21.84, p< <0.001
Tukey Test: (1987) (1986) (1982) (1988) (1984) (1985) (1983)39.1 44.3 47.5 61.0 64.7 76.6 754.8
(p<o.ool)~
Source: MMS, Alaska OCS Region.
56
The reasons for the offshore (deep-water) migratory route of 1983 are not fully understood. Several fac-tors--including differences in sampling effort, human activity levels, and oceanographic conditions--mighthave been involved. The possible indirect effect of heavy ice cover on prey availability has been postulatedas a causative factor (Ljungblad et al., 1987). Ice cover would also have associated effects on environmentalconditions expected to have biological significance to migrating bowhead whales (e.g., availability of leads,water temperature). During 1983, the most severe ice year since 1975 (USDOD, Navy, Naval PolarOceanographic Center, 1989), the bowhead migration was observed in water almost an order of magnitudedeeper than for other years (Table 13). Also, during the next most severe ice years of 1988, 1984, and 1985(in that order), mean water depths at random bowhead sightings were greater than during other years (Table13).
C. Potential Res~onses of Bowheads to Survev Aircraft
During September and October, there were no sightings of bowhead whales for which responses to thesurvey aircraft were observed (Table 16). Although it was not possible to determine if observed responsesresulted directly from overflight by survey aircraft, sudden overt changes in whale behavior were looked forand noted. Responses included abrupt dives, course diversion, or cessation of behavior ongoing at firstsighting.
D. Effect of General Ice Cover on WPUE
The years 1980, 1983, and 1988 were categorized as having “heavy” ice cover during the navigation season.These three years are ranked as having the severest seasonal ice for the years 1979 through 1988 and showdistances between Point Barrow and the five-tenths ice concentration on 15 September ranging from 10 nmto 25 nm (USDOD, Navy, Naval Polar Oceanographic Center 1989). Also, Figures 4 through 11 graphicallydemonstrate that 1988 was a year when ice coverage was consistently high throughout September andOctober.
The years 1984 and 1985 were categorized as having “medium” ice cover during the open-water season.These two years are ranked as having the fourth- and fifth-severest seasonal ice for the years 1979 through1988 and show distances between Point Barrow and the five-tenths ice concentration on 15 Septemberranging from 50 nm to 55 nm (USDOD, Navy, Naval Polar Oceanographic Center, 1989).
The years 1979, 1981, 1982, 1986, and 1987 were categorized as having “light” ice cover during the open-water season. These five years are ranked as having the least severe seasonal ice for the years 1979through 1988 and show distances between Point Barrow and the five-tenths ice concentration on 15September ranging from 85 nm to 125 nm (USDOD, Navy, Naval Polar Oceanographic Center, 1989).
Table 17 shows a relatively low cumulative number of bowhead whales obsetved per hour of survey effortin the primary study area (Survey Blocks 1-11) during September and October for years of heavy ice cover(WPUE = 0.39), a middle-range value for moderate ice years (WPUE = 0.97), and a relatively high value forlight years (WPUE = 1.55). The relative abundance of bowheads for 1988 (WPUE = 0.31) was the lowestvalue for a single fall season (next lowest value was 0.34 for 1980) but was considered typical for a heavyice year when bowheads may have been harder to spot.
It should be noted that although cumulative fall values for the three ice-year categories (Table 17) suggesta relationship, it is clear that general ice coverage does not fully account for variation in WPUE. Eventhough the mean WPUE for heavy ice years (~ = 0.39, SD = O.~1, n = 3) is separable from other ice-yearcategories, the SD of th~ mean WPUE for years with light ice (x = 1.66, SD = 1.02, n = 5) overlaps thatfor moderate ice years (x = 0.97, SD = 0.05, n = 2). In addition, the extremely high relative values (Table17) for the month of September 1981 (WPUE = 3.29) and September 1982 (WPUE = 3.83) would indicatethat factors other than general ice coverage are operative (e.g., it is likely that the high WPUE in September1981 resulted from the increase in effort made in the search mode, as opposed to random transects).
A comparison of ice concentrations at bowhead sightings (rather than general ice severity) between 1981and 1986 with the sightabllity of whales appears in Ljungblad et al. (1987).
57
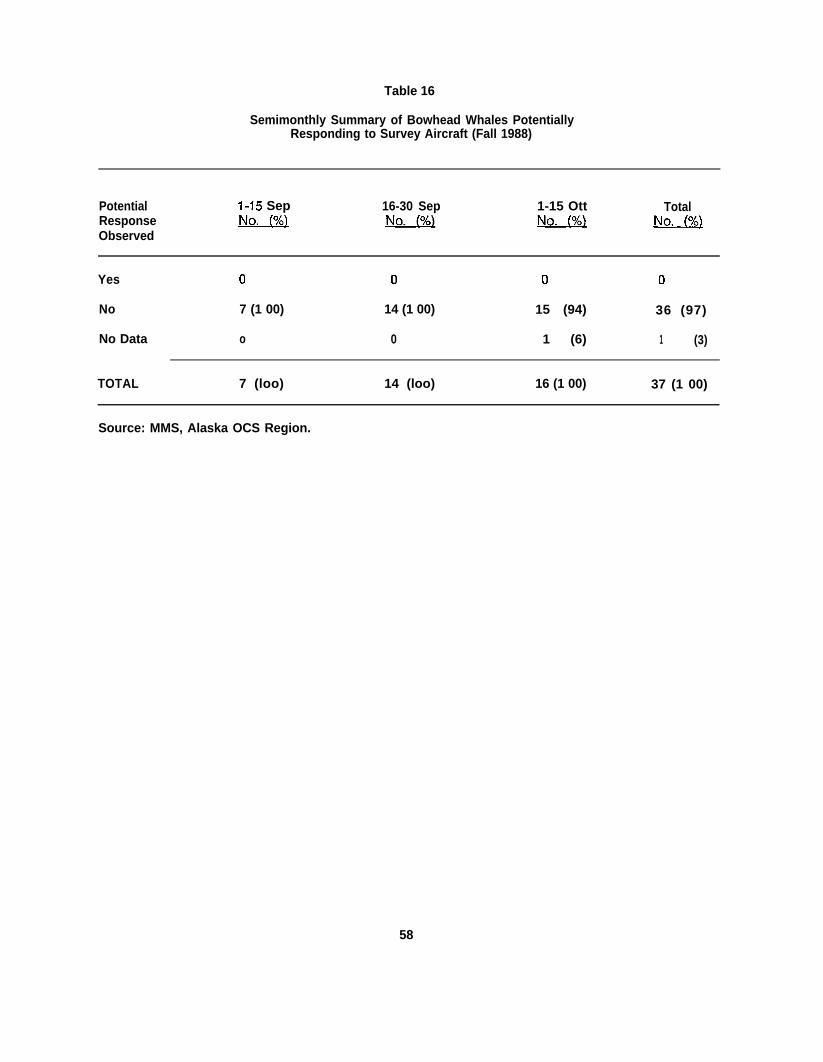
Table 16
Semimonthly Summary of Bowhead Whales PotentiallyResponding to Survey Aircraft (Fall 1988)
Potential 1-15 Sep 16-30 Sep 1-15 Ott TotalResponse u M m !!!Q&.)Observed
Yes o 0 0 0
No 7 (1 00) 14 (1 00) 15 (94) 36 (97)
No Data o 0 1 (6) 1 (3)
TOTAL 7 (loo) 14 (loo) 16 (1 00) 37 (1 00)
Source: MMS, Alaska OCS Region.
58
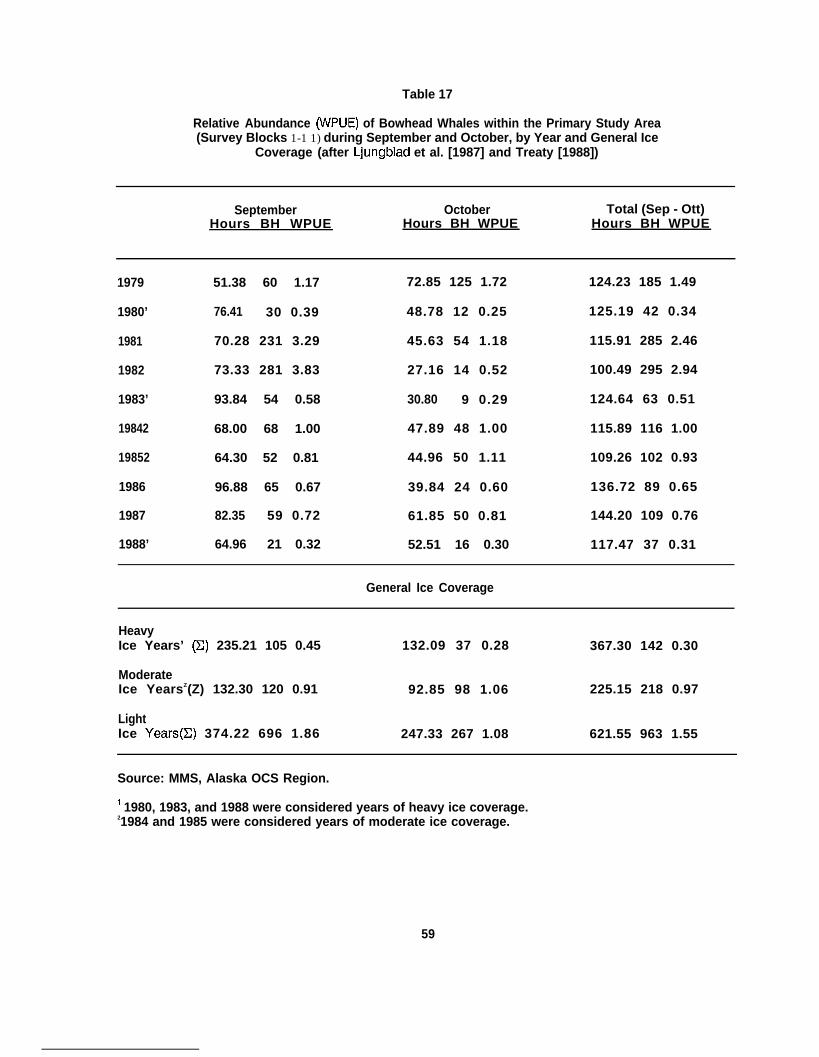
Table 17
Relative Abundance (WPUE) of Bowhead Whales within the Primary Study Area(Survey Blocks 1-1 1) during September and October, by Year and General Ice
Coverage (after Ljungblad et al. [1987] and Treaty [1988])
September October Total (Sep - Ott)Hours BH WPUE Hours BH WPUE Hours BH WPUE
1979 51.38 60 1.17 72.85 125 1.72 124.23 185 1.49
1980’ 76.41 30 0.39 48.78 12 0.25 125.19 42 0.34
1981 70.28 231 3.29 45.63 54 1.18 115.91 285 2.46
1982 73.33 281 3.83 27.16 14 0.52 100.49 295 2.94
1983’ 93.84 54 0.58 30.80 9 0.29 124.64 63 0.51
19842 68.00 68 1.00 47.89 48 1.00 115.89 116 1.00
19852 64.30 52 0.81 44.96 50 1.11 109.26 102 0.93
1986 96.88 65 0.67 39.84 24 0.60 136.72 89 0.65
1987 82.35 59 0.72 61.85 50 0.81 144.20 109 0.76
1988’ 64.96 21 0.32 52.51 16 0.30 117.47 37 0.31
General Ice Coverage
HeavyIce Years’ (Z) 235.21 105 0.45 132.09 37 0.28 367.30 142 0.30
ModerateIce YearsZ(Z) 132.30 120 0.91 92.85 98 1.06 225.15 218 0.97
LightIce Years(z) 374.22 696 1.86 247.33 267 1.08 621.55 963 1.55
Source: MMS, Alaska OCS Region.
‘ 1980, 1983, and 1988 were considered years of heavy ice coverage.21984 and 1985 were considered years of moderate ice coverage.
59

E. Management Use of Real-Time Field Information
During 1988, MMS issued two permits to industry for seismic exploration in the Beaufort Sea. The permitswere used between late August and early October in the eastern half of the Alaskan Beaufort Sea. In orderto prevent potential operational effects on subsistence whaling, the permitters followed stringentrestrictions--including a provision to stop seismic operations when whales were visible from the vessel--asthe bowhead whale migration progressed through the area of operations. Daily summaries of surveyinformation were transferred from the field to Anchorage for use by MMS Resource Evaluation and by NMFSin implementing areawide permit restrictions on high-energy seismic operations during periods of limitedvisibility.
On 6 September 198~, Amoco Production C~mpany emplaced the Kulluk, a semisubmersible drilling barge(Fig. 28) at 70016.6 N. latitude, 141028.5 W. longitude--east-northeast of Barter Island at the Belcherdrilling site. The maximum hull diameter of this circular floating structure is 80.8 m and the maximum hulldepth is 18.5 m. The Kulluk has a 12-point mooring system employing anchor wire lines that are 8.9 cm indiameter. The drilling structure--operational during the present study--disengaged its anchors on 16 October1988.
Bowheads seen in the general vicinity of the Kulluk are shown for each bimonthly period of the Fall-1988survey in Figures 16 through 19. The closest sighting of bowhead whales was noted on 15 September1988 (Appendix B: Flight 8) at a distance of 14.5 km northeast of the operational drilling structure. Thebehavior of these two whales appeared normal, i.e., they were swimming at slow speed on a 260’ heading(magnetic).
Daily summaries of field information from this and other arctic surveys were transferred to MMS FieldOperations in Anchorage for use in implementing seasonal drilling restrictions and ensuring that bowheadwhales were successfully migrating past the drilling operation. Based largely on daily summaries of surveyinformation provided by the present study, NMFS determined the official starting date (14 September) andending date (2o October) of the Fall-1988 bowhead whale migration in the Alaskan Beaufort Sea.
61
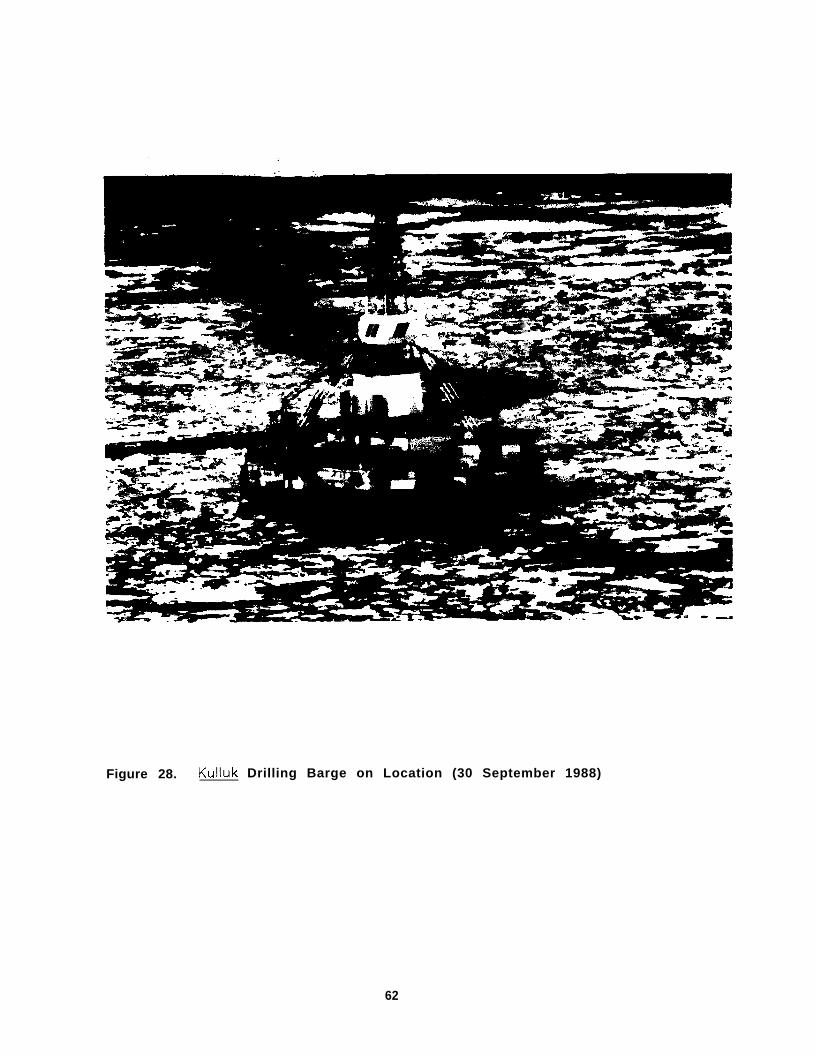
Figure 28. Kulluk Drilling Barge on Location (30 September 1988)
62
V. LITERATURE CITED
Batschelet, E. 1972. Recent Statistical Methods for Orientation Data. k: Animal Orientation andNavigation, S.R. Galler, K. Schmidt-Koenig, G.J. Jacobs, and R.E. Bellevue, eds. Washington, D.C.: NASA,pp. 41-61.
Brewer, W.A., H.F. Diaz, A.S. Prechtel, H.W. Searby, and J*L. Wise. 1977. Climatic Atlas of the OuterContinental Shelf Waters and Coastal Regions of Alaska. Asheville, NC: NOAA
Chapman, C.F. 1971. Piloting, Seamanship and Small Boat Handling. New York, NY Hearst Books,640 pp.
Cochran, W.G. 1963. Sampling Techniques. New York, NY: J. Wiley, 413 pp.
Estes, J.A. and J.R. Gilbert. 1978. Evaluation of an Aerial Survey of Pacific Walruses (Odobenus rosmarus~- J. Fish Res. Board Can. 35:1130-1140.
Houghton, J. P., D.A. Segar, and J.E. Zeh. 1984. Beaufort Sea Monitoring Program. Proceedings of aWorkshop (September 1983) and Sampling Design Recommendations. Prepared by Dames and Moore,Seattle, Washington, for the OCS Environmental Assessment Program, Juneau, AK, 111 pp.
LaBelle, J. C., J.L. Wise, R.P. Voelker, R.H. Schulze, and G.M. Wohl. 1983. Alaska Marine Ice Atlas. ArcticEnvironmental Information and Data Center, University of Alaska, Anchorage, AK, 302 pp.
LGL Ecological Research Associates, Inc. 1987. Importance of the Eastern Alaskan Beaufort Sea to FeedingBowhead Whales, 1985-86, W.J. Richardson, ed. OCS Study MMS 87-0037. Prepared for USDOI, MMS,Alaska OCS Region.
Ljungblad, D. K., S.E. Moore, J.T. Clarke, and J.C. Bennett. 1987. Distribution, Abundance, Behavior andBioacoustics of Endangered Whales in the Alaskan Beaufort and Eastern Chukchi Seas, 1979-86. OCSStudy MMS 87-0039. NOSC Technical Report 1177 prepared for USDOI, MMS, Alaska OCS Region, 391PP.
Moore, S.E. Telephone conversation of 21 December 1988 between Sue Moore of SEACO, Inc., a divisionof SAIC, and the author; subject: The Number of Bowhead Sightings at Various Distances from theAircraft on Earlier Surveys.
Norton, D. and G. Weller. 1984. The Beaufort Sea: Background, History, and Perspective. ~ TheAlaskan Beaufort Sea, P. Barnes, D. Schell, and E. Reimnitz, eds. Orlando, FL: Academic Press, Inc.,466 pp.
Outer Continental Shelf Lands Act of 1953, as amended in 1978. 43 U. S. C., Sections 1331-1356 and1801-1866.
Treaty, S.D. 1988. Aerial Surveys of Endangered Whales in the Beaufort Sea, Fall 1987. OCS Study MMS88-0030. USDOI, MMS, Alaska OCS Region, 141 pp.
USDOC, NOAA, NMFS. 1982. Endangered Species Act, Section 7 Consultation - Biological Opinion, Oiland Gas Lease Sale 71 (Diapir Field). 19 May 1982.
USDOC, NOAA, NMFS. 1983. Endangered Species Act, Section 7 Consultation - 6iological Opinion, Oiland Gas Leasing and Exploration - Diapir Field Lease Offering (Sale 87). 19 December 1983.Washington, D.C.
USDOC, NOAA, NMFS. 1987, Endangered Species Act, Section 7 Consultation - Biological Opinion, Oiland Gas Leasing and Exploration - Beaufort Sea Sale 97. 20 May 1987. Washington, D.C.
63
USDOD, Navy, Naval Hydrographic Office. 1956. Aerial Ice Reconnaissance and Functional Glossary ofIce Terminology. Hydrographic Office Publication No. 609, 14 pp.
USDOD, Navy, Naval Polar Oceanography Center. 1989. U.S. Navy-NOAA Joint Ice Center SeasonalOutlook Western Arctic Ice 1989. Report for Navy Oceanography Command. Washington, D. C., 4 pp.
USDOI, MMS. 1982. Memorandum from Director, BLM, to Secretary of the Interior, dated 30 April 1982;subject: Decision on the Modification of the Seasonal Drilling Restriction.
USDOI, MMS. 1984. Notice of Sale, Oil and Gas Lease Sale 87, Outer Continental Shelf, Diapir Field(August 1984). Anchorage, AK: USDOI, MMS, Alaska OCS Region.
USDOI, MMS. 1988. Notice of Sale, Oil and Gas Lease Sale 97, Outer Continental Shelf, Beaufort Sea(March 1988). Anchorage, AK: USDOI, MMS, Alaska OCS Region.
Zar, S.H. 1984. Biostatistical Analysis. Englewood Cliffs, NJ: Prentice Hall, Inc., 620 pp.
64

APPENDIX A
BOWHEAD WHALE DENSITIES
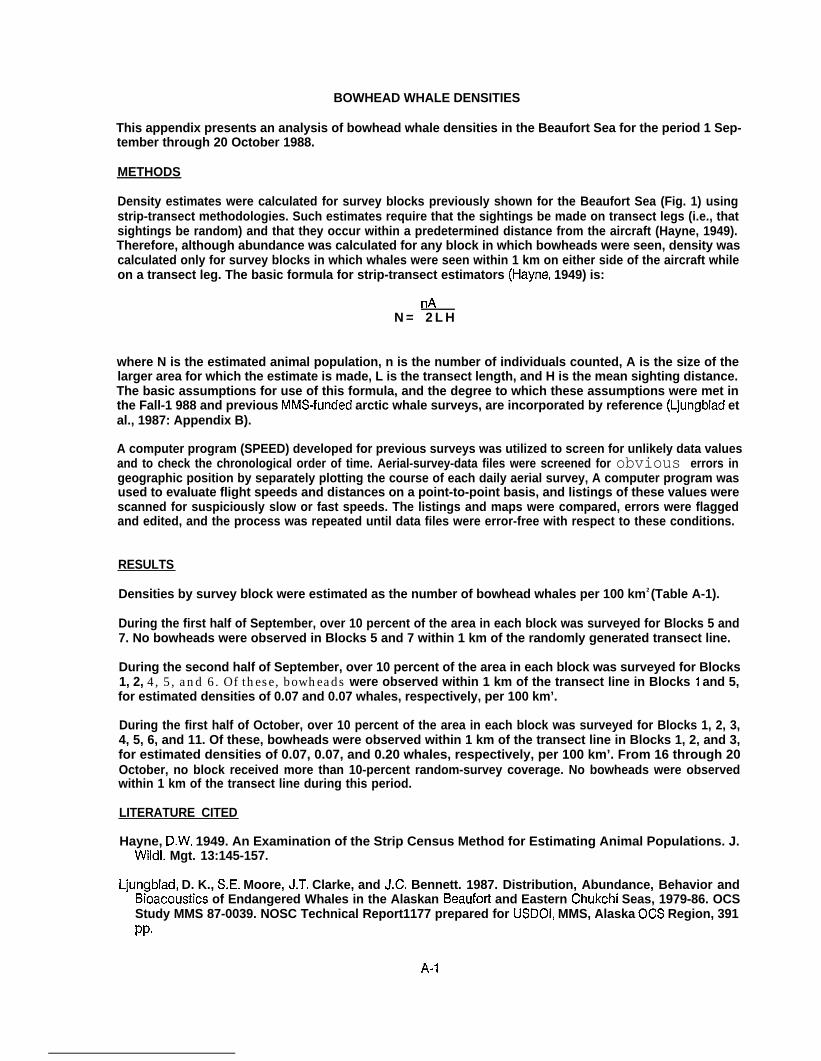
BOWHEAD WHALE DENSITIES
This appendix presents an analysis of bowhead whale densities in the Beaufort Sea for the period 1 Sep-tember through 20 October 1988.
METHODS
Density estimates were calculated for survey blocks previously shown for the Beaufort Sea (Fig. 1) usingstrip-transect methodologies. Such estimates require that the sightings be made on transect legs (i.e., thatsightings be random) and that they occur within a predetermined distance from the aircraft (Hayne, 1949).Therefore, although abundance was calculated for any block in which bowheads were seen, density wascalculated only for survey blocks in which whales were seen within 1 km on either side of the aircraft whileon a transect leg. The basic formula for strip-transect estimators (Hayne, 1949) is:
nAN = 2 L H
where N is the estimated animal population, n is the number of individuals counted, A is the size of thelarger area for which the estimate is made, L is the transect length, and H is the mean sighting distance.The basic assumptions for use of this formula, and the degree to which these assumptions were met inthe Fall-1 988 and previous MMS-funded arctic whale surveys, are incorporated by reference (Ljungblad etal., 1987: Appendix B).
A computer program (SPEED) developed for previous surveys was utilized to screen for unlikely data valuesand to check the chronological order of time. Aerial-survey-data files were screened for obvious errors ingeographic position by separately plotting the course of each daily aerial survey, A computer program wasused to evaluate flight speeds and distances on a point-to-point basis, and listings of these values werescanned for suspiciously slow or fast speeds. The listings and maps were compared, errors were flaggedand edited, and the process was repeated until data files were error-free with respect to these conditions.
RESULTS
Densities by survey block were estimated as the number of bowhead whales per 100 km2 (Table A-1).
During the first half of September, over 10 percent of the area in each block was surveyed for Blocks 5 and7. No bowheads were observed in Blocks 5 and 7 within 1 km of the randomly generated transect line.
During the second half of September, over 10 percent of the area in each block was surveyed for Blocks1, 2, 4, 5, and 6. Of these, bowheads were observed within 1 km of the transect line in Blocks 1 and 5,for estimated densities of 0.07 and 0.07 whales, respectively, per 100 km’.
During the first half of October, over 10 percent of the area in each block was surveyed for Blocks 1, 2, 3,4, 5, 6, and 11. Of these, bowheads were observed within 1 km of the transect line in Blocks 1, 2, and 3,for estimated densities of 0.07, 0.07, and 0.20 whales, respectively, per 100 km’. From 16 through 20October, no block received more than 10-percent random-survey coverage. No bowheads were observedwithin 1 km of the transect line during this period.
LITERATURE CITED
Hayne, D.W. 1949. An Examination of the Strip Census Method for Estimating Animal Populations. J.Wildl. Mgt. 13:145-157.
Ljungblad, D. K., S.E. Moore, J.T. Clarke, and J.C. Bennett. 1987. Distribution, Abundance, Behavior andBioacoustics of Endangered Whales in the Alaskan Beaufort and Eastern Chukchi Seas, 1979-86. OCSStudy MMS 87-0039. NOSC Technical Report1177 prepared for USDOI, MMS, Alaska OCS Region, 391PP.
A-1
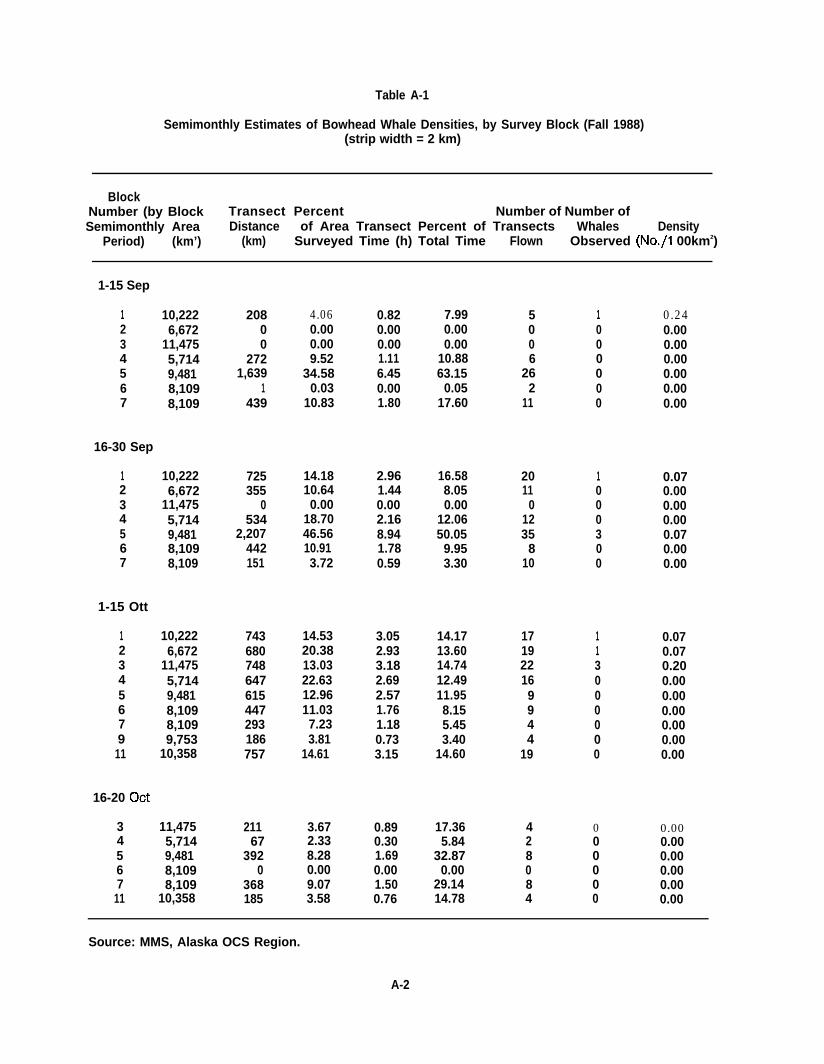
Table A-1
Semimonthly Estimates of Bowhead Whale Densities, by Survey Block (Fall 1988)(strip width = 2 km)
BlockNumber (by Block Transect Percent Number of Number ofSemimonthly Area Distance of Area Transect Percent of Transects Whales Density
Period) (km’) (km) Surveyed Time (h) Total Time Flown Observed (No./l 00km2)
1-15 Sep
1 10,2222 6,6723 11,4754 5,7145 9,4816 8,1097 8,109
16-30 Sep
1 10,2222 6,6723 11,4754 5,7145 9,4816 8,1097 8,109
1-15 Ott
1 10,2222 6,6723 11,4754 5,7145 9,4816 8,1097 8,1099 9,753
11 10,358
16-20 C)ct
3 11,4754 5,7145 9,4816 8,1097 8,109
11 10,358
20800
2721,639
1439
725355
0534
2,207442151
743680748647615447293186757
21167
3920
368185
4.060.000.009.52
34.580.03
10.83
14.1810.640.00
18.7046.5610.913.72
14.5320.3813.0322.6312.9611.037.233.81
14.61
3.672.338.280.009.073.58
0.820.000.001.116.450.001.80
2.961.440.002.168.941.780.59
3.052.933.182.692.571.761.180.733.15
0.890.301.690.001.500.76
7.990.000.00
10.8863.15
0.0517.60
16.588.050.00
12.0650.05
9.953.30
14.1713.6014.7412.4911.958.155.453.40
14.60
17.365.84
32.870.00
29.1414.78
5006
262
11
2011
012358
10
171922169944
19
4
1 0.240 0.000 0.000 0.000 0.000 0.000 0.00
1000300
113000000
0.070.000.000.000.070.000.00
0.070.070.200.000.000.000.000.000.00
0 0.002 0 0.008 0 0.000 0 0.008 0 0.004 0 0.00
Source: MMS, Alaska OCS Region.
A-2

APPENDIX B
DAILY FLIGHT SUMMARIES - TWIN OITER
DAILY FLIGHT SUMMARIES - TWIN 07TER
This appendix consists of Flight Tracks 1 through 36, depicting aerial surveys flown over the study areafrom 3 September through 20 October 1988, by MMS personnel aboard a Twin Otter aircraft. Maps wereprepared using a series of computer programs consisting of BASIC subroutines implemented on aHewlett-Packard (HP 85) microcomputer connected to an HP 7470A printer/plotter. The coastlines foreach map, digitized on an HP 9111A graphics tablet, were formatted to examine the principal study area.As a result, a comparison of flight tracks can be made on a visual basis over the period of the field seasonto evaluate ongoing patterns of the animal distribution and aircraft coverage. Each map shows the flighttrack as a line drawn through position updates recorded on the aircraft computer system. Each animalsighting is marked with a species symbol on the flight-track plot. The symbols used can be keyed out toa two-letter abbreviation shown in each map legend representing the following species:
BH = Bowhead WhaleGW = Gray WhaleBE = Beluga WhaleBS = Bearded SealRS = Ringed SealPN = Unidentified PinnipedPR = Polar Bear
Summary information on bowhead whale sightings is presented beneath the flight acaption in a tabularformat, as follows:
T#/C# Total number of whales/total number of calves seenLAT/LONG Location (latitude N./longitude W.) in degrees, minutes, and tenths of minutesDIS Perpendicular distance from the aircraft in meters (altitude x cotangent clinometer angle)CUE Sighting cue:
BO = Body MP = Mud PlumesBW = Blow DY = DisplaySP = Splash
BEH Behavior:
Sw = Swim DY = Display SHDI = Dive MT = Mate TSRE = Rest FE = Feed BRMl = Mill CC = Cow-Calf RLUB = Underwater DE = Dead NA
Blow
HDG Heading in magnetic degrees
ICE Ice cover in percent
Ss Sea state (Beaufort scale)
DEPTH Depth in meters
Dash (-) Indicates that data were not recorded
. Spy-Hop
. Tail-Slap—— Breach. Roll—— No Data
B-1
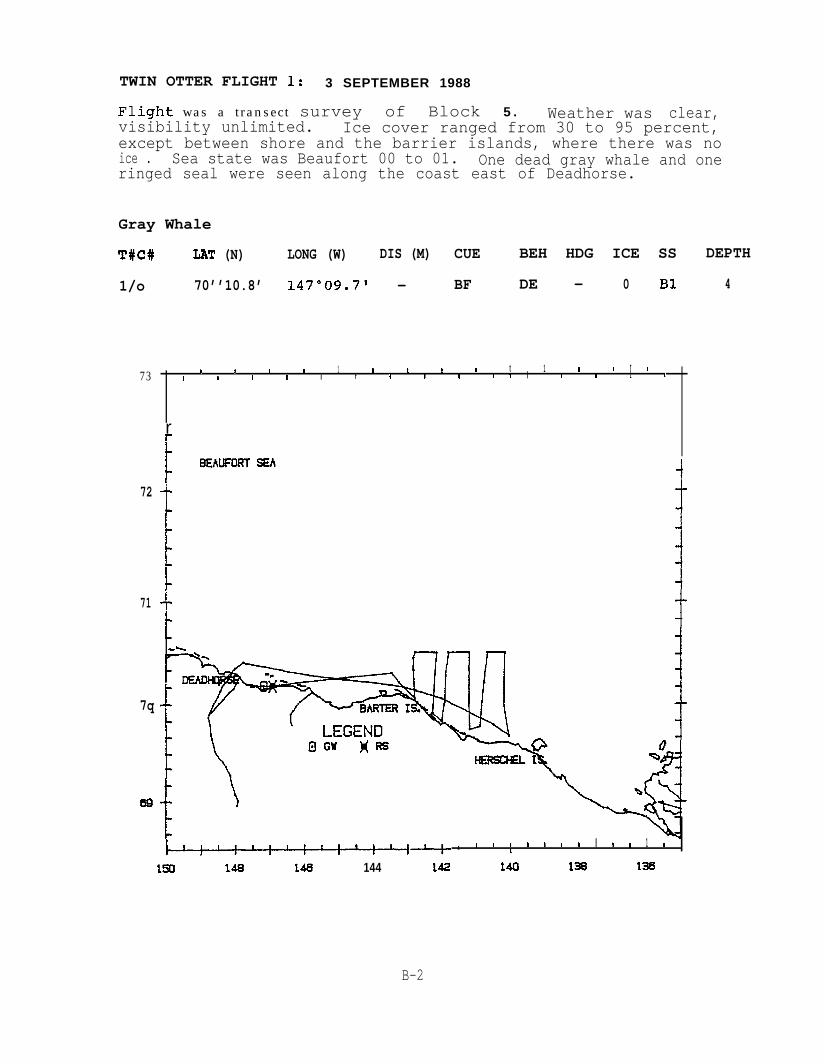
TWIN OTTER FLIGHT 1: 3 SEPTEMBER 1988
Flight was a transect survey of Block 5 . Weather was clear,visibility unlimited. Ice cover ranged from 30 to 95 percent,except between shore and the barrier islands, where there was noice . Sea state was Beaufort 00 to 01. One dead gray whale and oneringed seal were seen along the coast east of Deadhorse.
Gray Whale
T#C# LAT (N) LONG (W) DIS (M) CUE BEH HDG ICE SS DEPTH
1/o 70’’10.8’ 147”09.71 - BF DE - 0 B1 4
73
72
71
7q
w
I I 1 1 1 1 t ! I t 1 # 1 I1 I I I I f I 1 I 1 1 I I 1 I I
r
~
BEALJFORT SEA
-i-1
.-
~i---t--t- ‘ I I I I 1 I 1 I I 1 1 II
150 148 148 144 142 140 l?a 13e
B-2
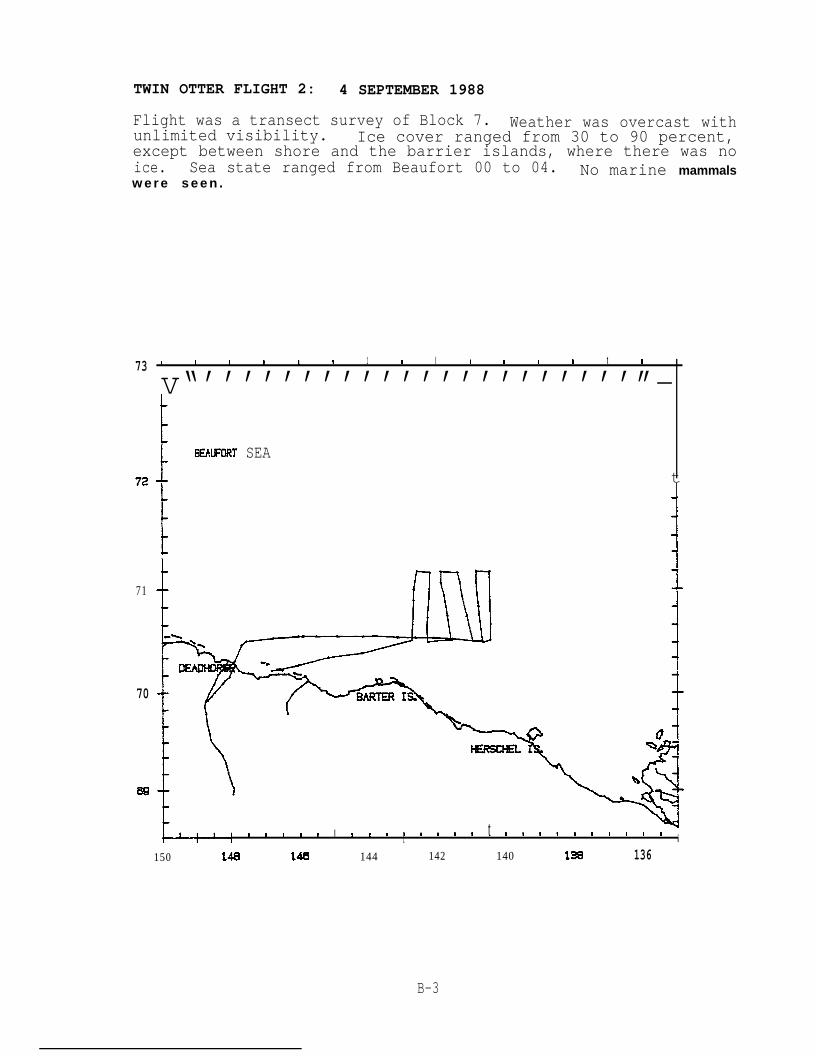
TWIN OTTER FLIGHT 2: 4 SEPTEMBER 1988
Flight was a transect survey of Block 7. Weather was overcast withunlimited visibility. Ice cover ranged from 30 to 90 percent,except between shore and the barrier islands, where there was noice. Sea state ranged from Beaufort 00 to 04. No marine mammalsw e r e s e e n .
73
72
71
70
S9
I I
v“’’’’’’’’’’’’’’’’’’’’’’”-I t I I 1 I I t I I I t 1
\
BEAWORT SEA
t
1
1’:’,1 I 1 I 1 I I I ! 1 I 1 t1 I t t I t I 1 I t t 1 I I i
150 Ma 146 144 142 140 la 136
B-3
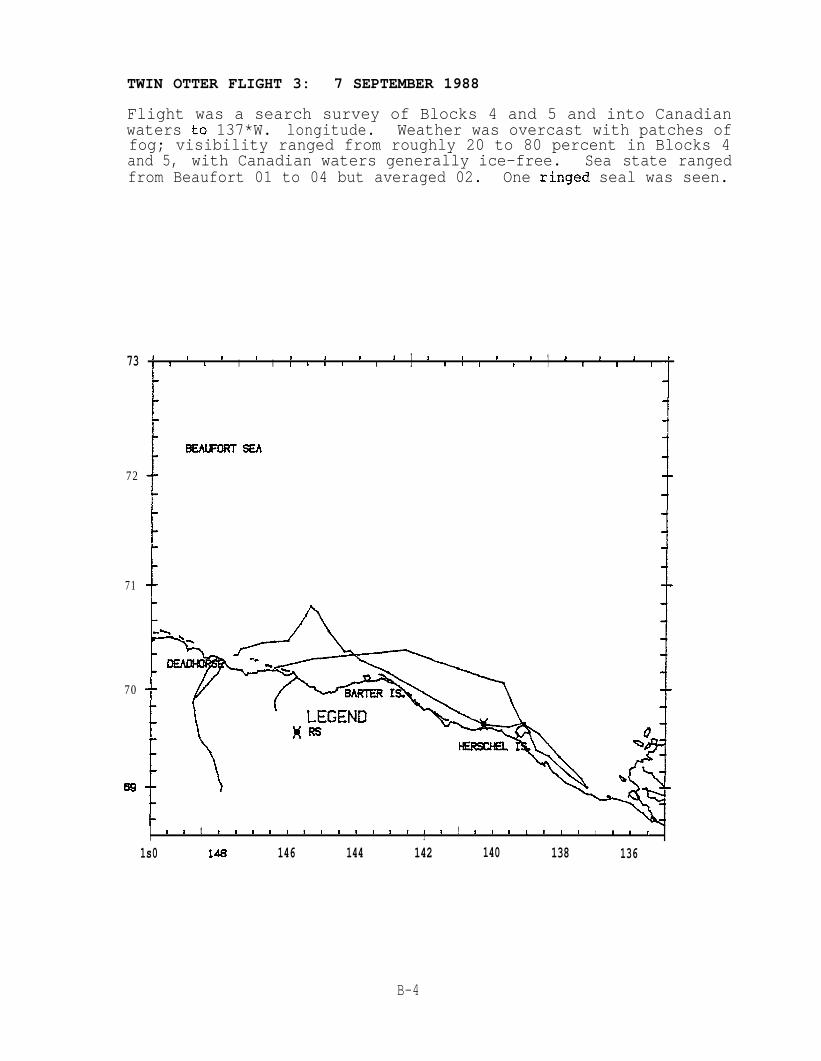
TWIN OTTER FLIGHT 3: 7 SEPTEMBER 1988
Flight was a search survey of Blocks 4 and 5 and into Canadianwaters to 137*W. longitude. Weather was overcast with patches offog; visibility ranged from roughly 20 to 80 percent in Blocks 4and 5, with Canadian waters generally ice-free. Sea state rangedfrom Beaufort 01 to 04 but averaged 02. One ringed seal was seen.
73
72
71
70
w
1 I I I I I 1 t I I t II I I I 1 I I i I I I I I I I I I I1 I I I4
iI
-+
L
I I t I I 1 I I 1 1 1 # I I I 1 8 !1 I t 1 I 1 1 1 1 I 1 1
1s0 148 146 144 142 140 138 136
B-4
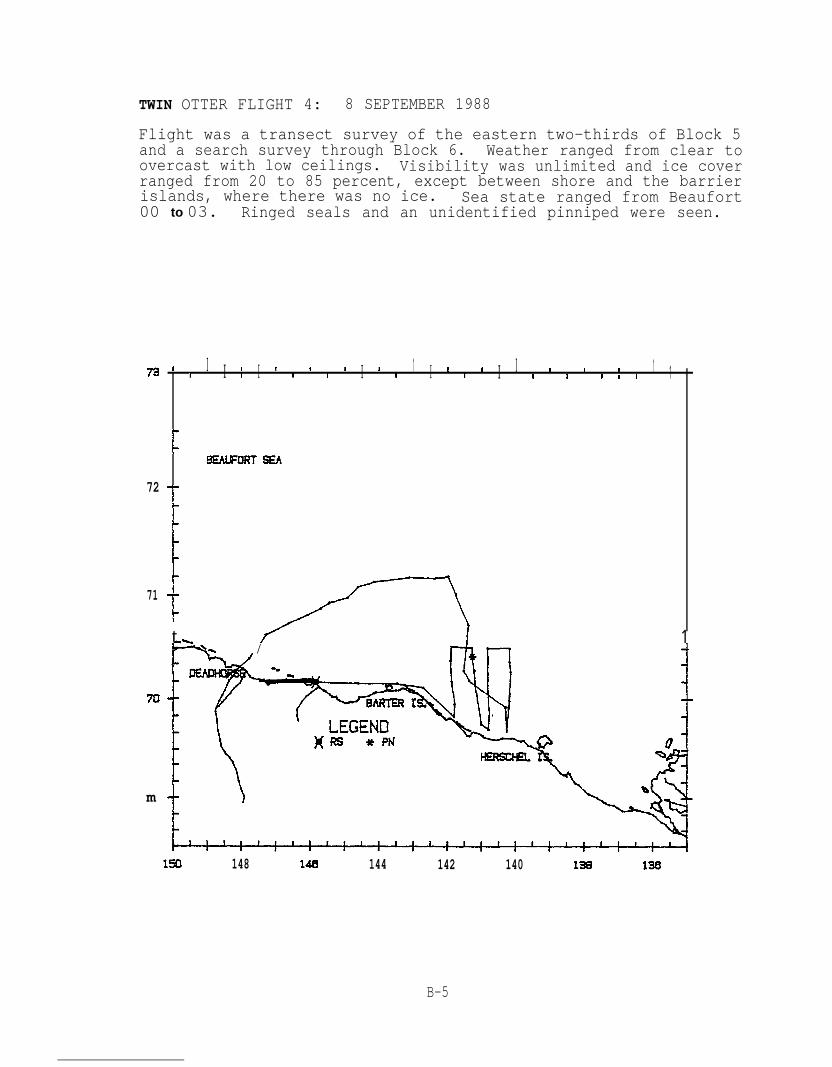
TWIN OTTER FLIGHT 4: 8 SEPTEMBER 1988
Flight was a transect survey of the eastern two-thirds of Block 5and a search survey through Block 6. Weather ranged from clear toovercast with low ceilings. Visibility was unlimited and ice coverranged from 20 to 85 percent, except between shore and the barrierislands, where there was no ice. Sea state ranged from Beaufort00 to 03. Ringed seals and an unidentified pinniped were seen.
73
72
71
70
m
1 I1 1 I I 1I I I I I 1 1 1 II I I [ II 1I I I 11 # 1 I 1
[ WALFORT SEA
T
1 /)t.= 1b=%. / Yhn 4L
-1 \ \ “\ -!
m 148 148 144 142 140 Es 130
B-5
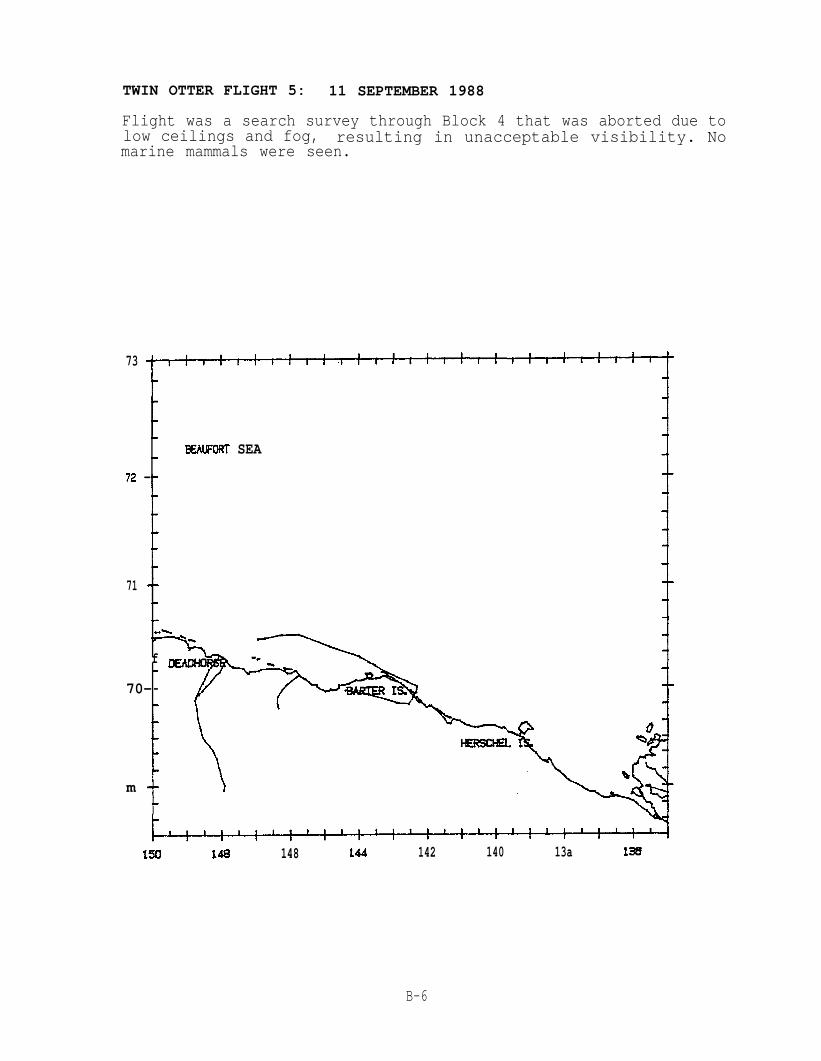
TWIN OTTER FLIGHT 5: 11 SEPTEMBER 1988
Flight was a search survey through Block 4 that was aborted due tolow ceilings and fog, resulting in unacceptable visibility. Nomarine mammals were seen.
73
3EN.!FIIRT SEA
72 -
71
.-
f
70--
m
1s0 148 148 144 142 140 13a 13%
B-6
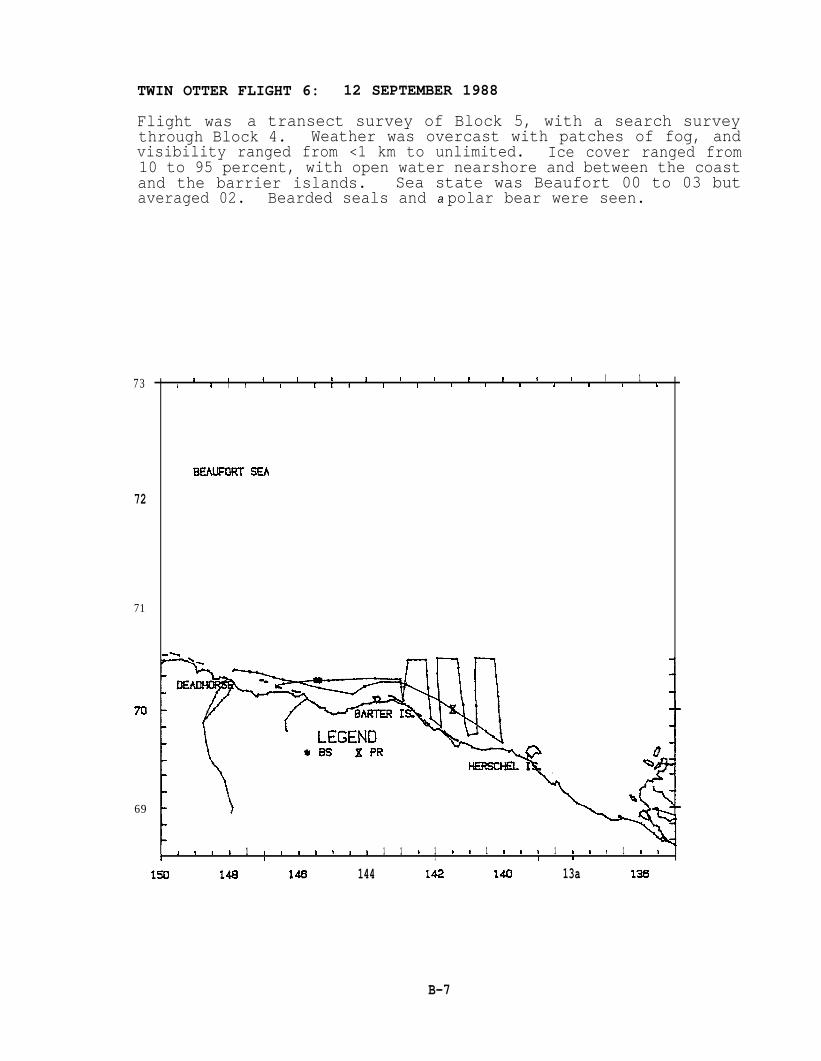
TWIN OTTER FLIGHT 6: 12 SEPTEMBER 1988
Flight was a transect survey of Block 5, with a search surveythrough Block 4. Weather was overcast with patches of fog, andvisibility ranged from <1 km to unlimited. Ice cover ranged from10 to 95 percent, with open water nearshore and between the coastand the barrier islands. Sea state was Beaufort 00 to 03 butaveraged 02. Bearded seals and a polar bear were seen.
73
72
71
m
69
i 1 t I I 1 t t 1 1 1 1 I 1I 1 I I I [ [ I 1 t 1 { I 1 1 1 t
BEAUFCIRT SEA
.-
i1 I 1 ) 1 1 I 1 I 1 1 1 !
I I 1 1 1 1 1 1 11 I 1 1 1 $I 1 1 I )
ml 143 146 144 142 la 13a 13s
B-7
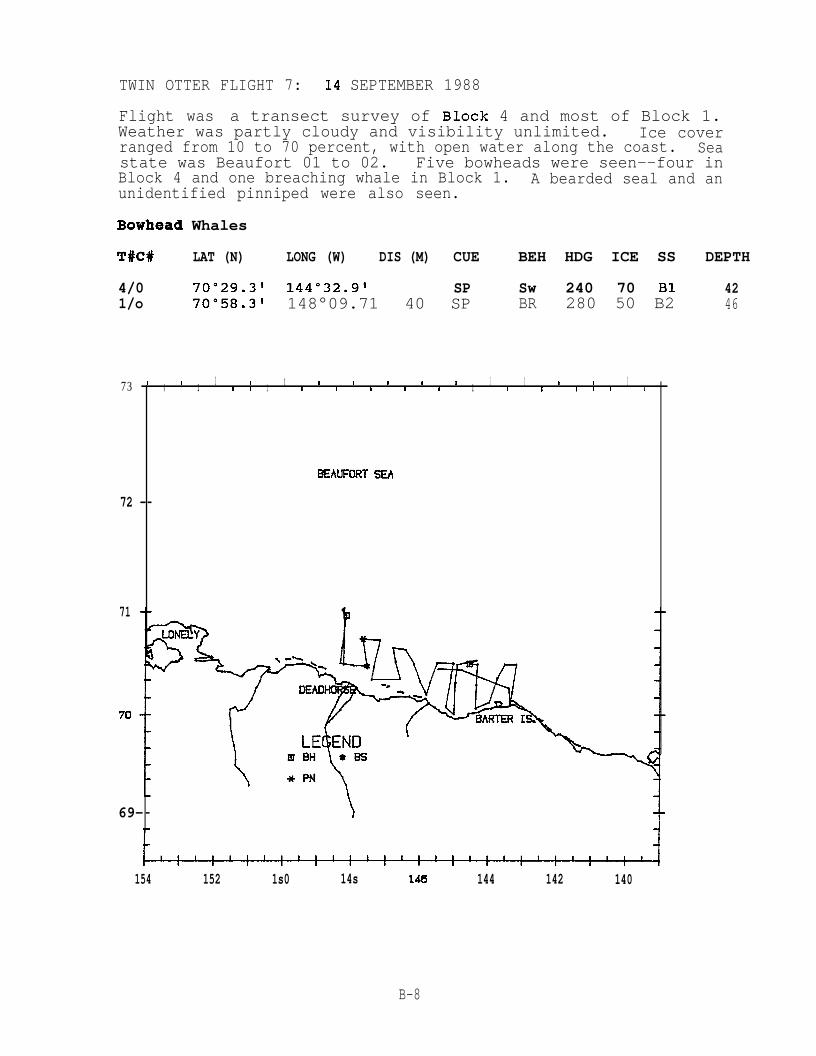
TWIN OTTER FLIGHT 7: 14 SEPTEMBER 1988
Flight was a transect survey of Block 4 and most of Block 1.Weather was partly cloudy and visibility unlimited. Ice coverranged from 10 to 70 percent, with open water along the coast. Seastate was Beaufort 01 to 02. Five bowheads were seen--four inBlock 4 and one breaching whale in Block 1. A bearded seal and anunidentified pinniped were also seen.
Bowhead Whales
T#C# LAT (N) LONG (W) DIS (M) CUE BEH HDG ICE SS DEPTH
4/0 70’’29.31 144”32.9! SP Sw 240 70 B1 421/o 70°58.3g 148°09.71 40 SP BR 280 50 B2 46
BENJFORT SEA
73 I I 1 t t 1 I I I I 1 1 I I 1I 1 [ I 1 I I 1 I 1 1 I I 1 I 1 1
72 --
71
7n-
69--
154 152 1s0 14s 148 144 142 140
B-8
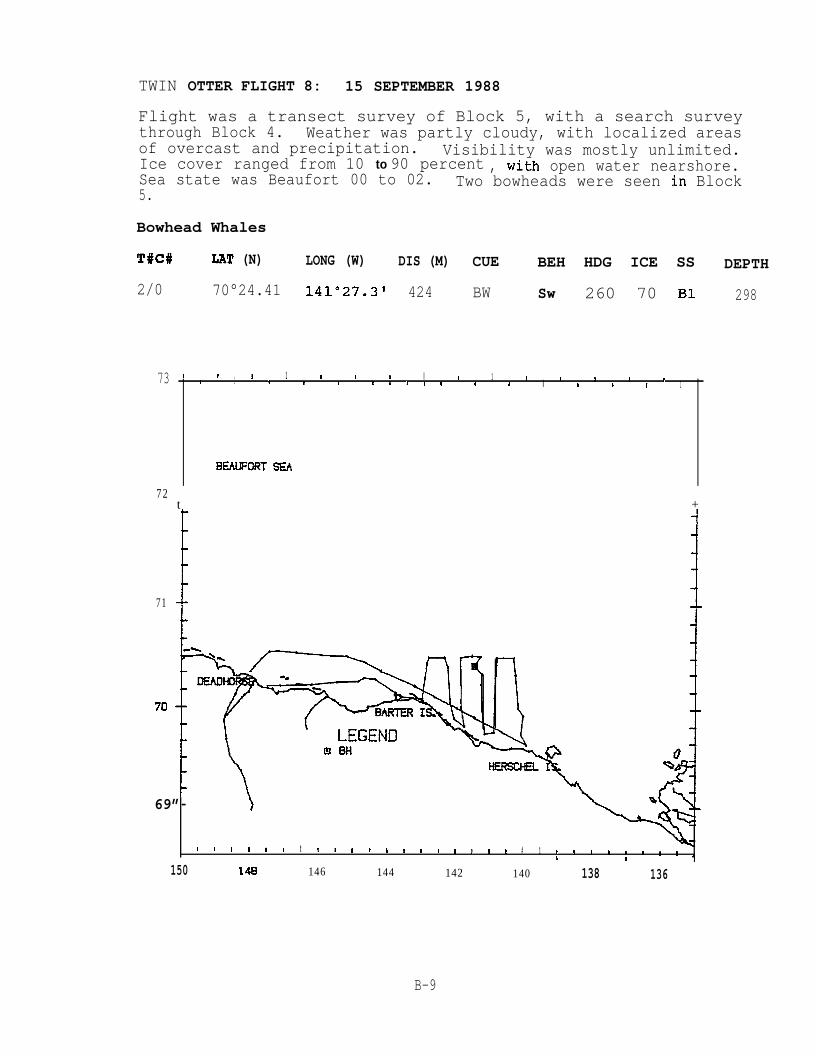
TWIN OTTER FLIGHT 8: 15 SEPTEMBER 1988
Flight was a transect survey of Block 5, with a search surveythrough Block 4. Weather was partly cloudy, with localized areasof overcast and precipitation. Visibility was mostly unlimited.Ice cover ranged from 10 to 90 percent , with open water nearshore.Sea state was Beaufort 00 to 02. Two bowheads were seen in Block5.
Bowhead Whales
T#C# LAT (N) LONG (W) DIS (M) CUE BEH HDG ICE SS DEPTH
2/0 70°24.41 141°27.3v 424 BW Sw 260 70 B1 298
73 I r 18 1 1I tI I s1 1 I1 I tI 11 1 11 1I 1 18 1 11 1
BEAL!FORT S$ZA
72t +
71
/’=—J——BARTER ;
69”- \
1 1 I I t I t I 1 1 I I 1 1 t I 1 1 1 # 1 t 1 11
1 I I1
t 11
150 14s 146 144 142 140 138 136
B-9
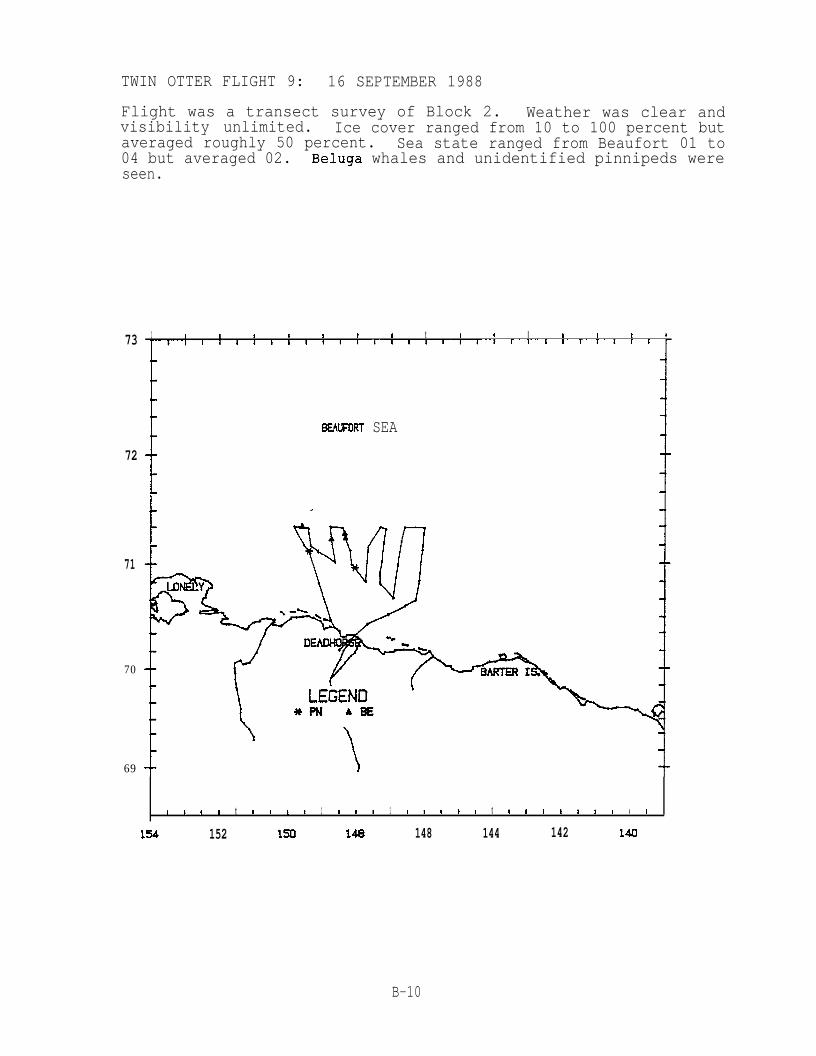
TWIN OTTER FLIGHT 9: 16 SEPTEMBER 1988
Flight was a transect survey of Block 2. Weather was clear andvisibility unlimited. Ice cover ranged from 10 to 100 percent butaveraged roughly 50 percent. Sea state ranged from Beaufort 01 to04 but averaged 02. Beluga whales and unidentified pinnipeds wereseen.
73
72
71
70
69
.
1 t
L“’’’’’’’’’’’’’’’’’’’’’’’’’”i
1 1 I 1 ! # t I t I t I t I
BEhumRT SEA
1 & I I t I 1 I 1 1 I t 1 1 1 1 I t 1 t I I 1 1 I 1 I I I
EM 152 1s0 148 148 144 142 VW
B-10
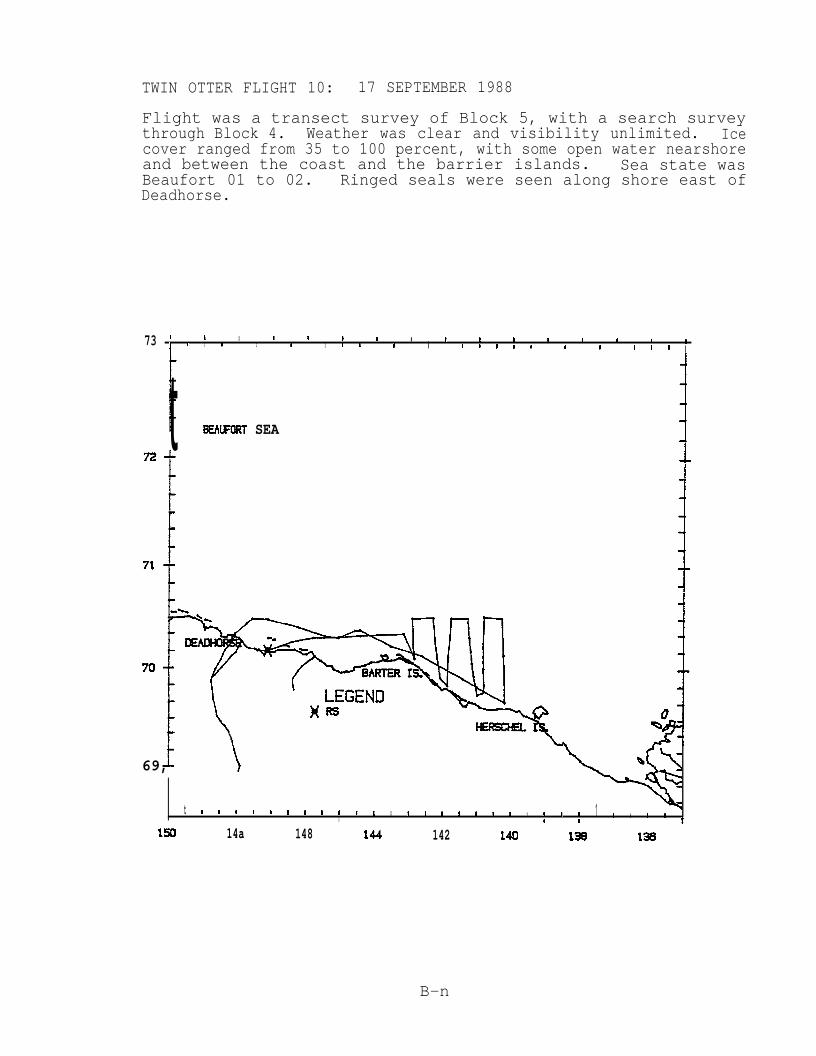
TWIN OTTER FLIGHT 10: 17 SEPTEMBER 1988
Flight was a transect survey of Block 5, with a search surveythrough Block 4. Weather was clear and visibility unlimited. Icecover ranged from 35 to 100 percent, with some open water nearshoreand between the coast and the barrier islands. Sea state wasBeaufort 01 to 02. Ringed seals were seen along shore east ofDeadhorse.
73 1 I I 1 i I 1 # t 1 1 # 1 1 I tI I 1 I I I I I I I I I I I 1 I # # I 1 I I
1t 2EMFORT SEA
71 +
L69, \
t I I I 1 I I I I t I1
I I I t 1 I 1 I I 1 t 1 I1
14
1 # I I1
150 14a 148 144 142 140 13 136
B-n
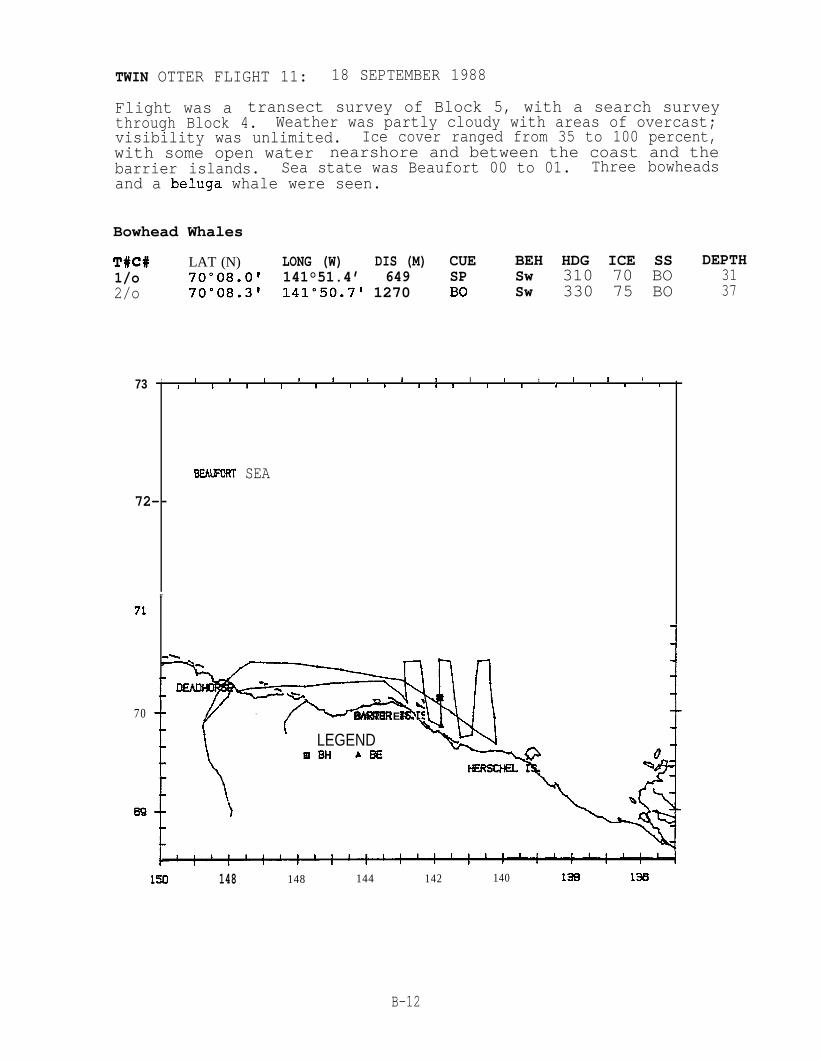
TWIN OTTER FLIGHT 11: 18 SEPTEMBER 1988
Flight was a transect survey of Block 5, with a search surveythrough Block 4. Weather was partly cloudy with areas of overcast;visibility was unlimited. Ice cover ranged from 35 to 100 percent,with some open water nearshore and between the coast and thebarrier islands. Sea state was Beaufort 00 to 01. Three bowheadsand a beluga whale were seen.
Bowhead Whales
T#C# LAT (N) LONG (W) DIS (M) CUE BEH HDG ICE SS DEPTH1/o 70°08.0! 141°51.4’ 649 SP Sw 310 70 BO 312/o 70”08.3t 141”50.71 1270 BO Sw 330 75 BO 37
73 I 1 t 1 I I 1 I t I 1 t I 1 II 1 I I I 8 v I t i I 1 1 I 1 I
BEAUFCRT SEA
72--
r
7L
.%
*
/[
1LEGEND
tfl141 A=
70 l-b -
—
7“=-%N\BARTIER [’
150 148 148 144 142 140 Em 133
B-12
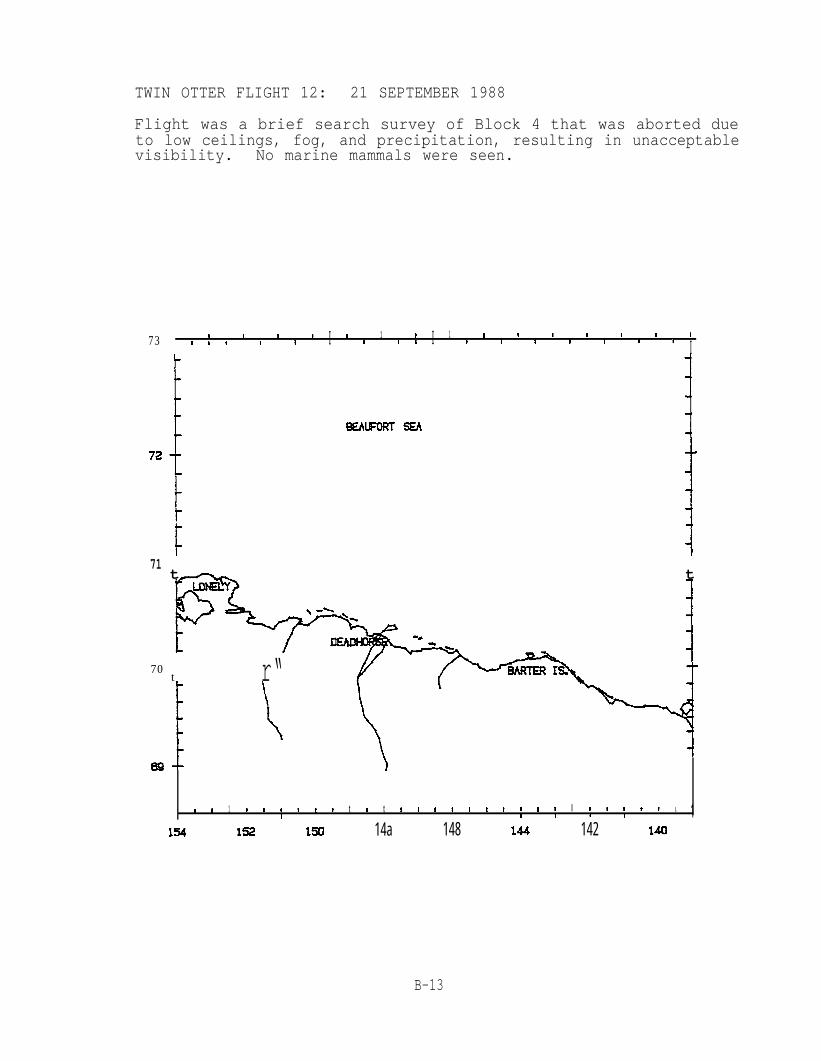
TWIN OTTER FLIGHT 12: 21 SEPTEMBER 1988
Flight was a brief search survey of Block 4 that was aborted dueto low ceilings, fog, and precipitation, resulting in unacceptablevisibility. No marine mammals were seen.
73 I 1 # 1 1 1 ! 1 : t 1 ) I I 1# I I 1 I I I I I I I 1 I 1 r I I
I
WlwFORT SEA
71t~. t
FA -.70
t r“ t
w-L )
I 1 1 I 1 t 1 1 I I I I I I # tI
1 t I t I I I 1 1 1 1 1I I I 1 1 11s4 1s2 1s0 14a 148 144 142 la
B-13
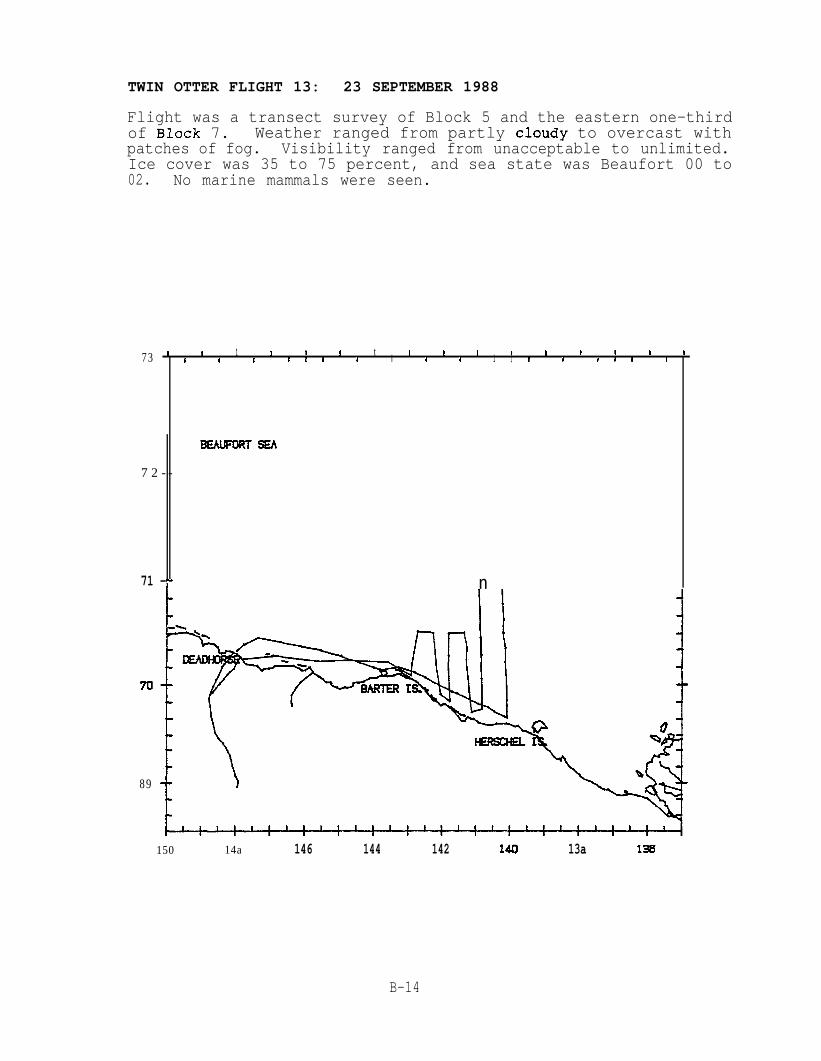
TWIN OTTER FLIGHT 13: 23 SEPTEMBER 1988
Flight was a transect survey of Block 5 and the eastern one-thirdof Block 7. Weather ranged from partly cloudy to overcast withpatches of fog. Visibility ranged from unacceptable to unlimited.Ice cover was 35 to 75 percent, and sea state was Beaufort 00 to02. No marine mammals were seen.
73 I 1 1 I t i t I 1 I t I t 1 1 !I I 1 I 1 I 1 I 1 4 1 1 I I I I I {
BEhlmRlsEA
7 2 --
71 -f- n
89 )
150 14a 146 144 142 140 13a 138
B-14
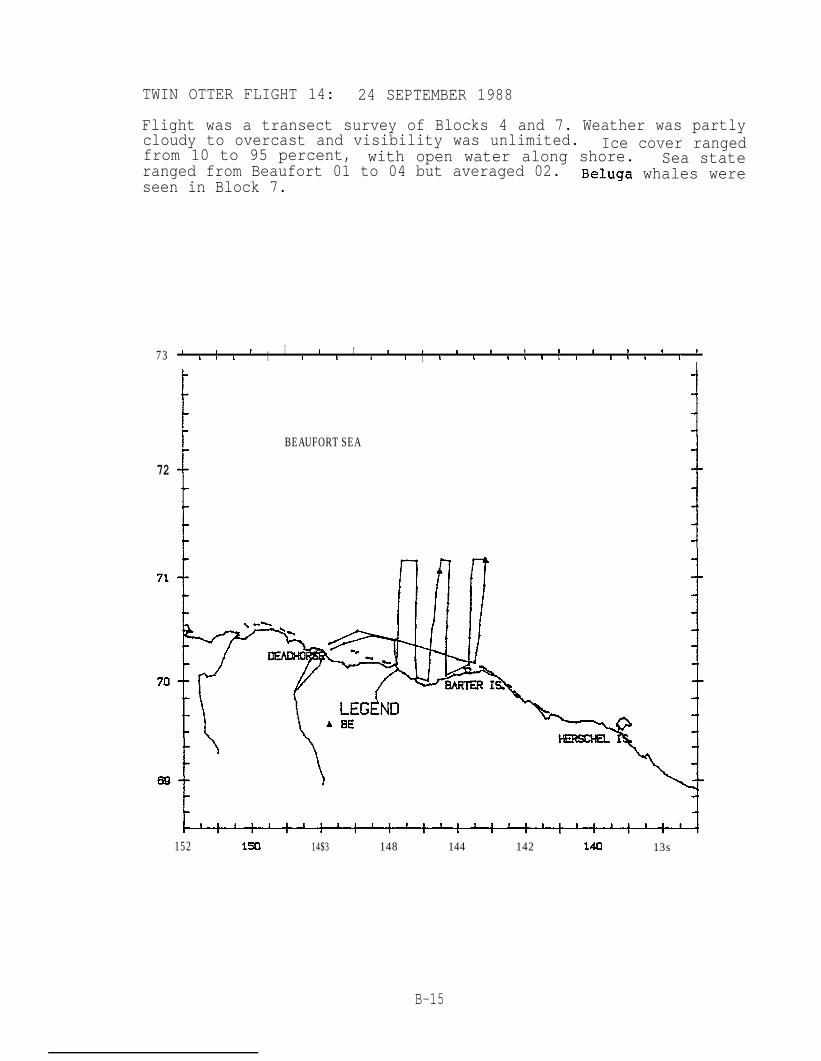
TWIN OTTER FLIGHT 14: 24 SEPTEMBER 1988
Flight was a transect survey of Blocks 4 and 7. Weather was partlycloudy to overcast and visibility was unlimited. Ice cover rangedfrom 10 to 95 percent, with open water along shore. Sea stateranged from Beaufort 01 to 04 but averaged 02. Beluga whales wereseen in Block 7.
73 1 I t I I t I 1 : t I I I > I ti I I I t ( I I [ I L I t t L I t I t II
72
/
BEAUFORT SEA
152 l= 14$3 148 144 142 140 13s
B-15
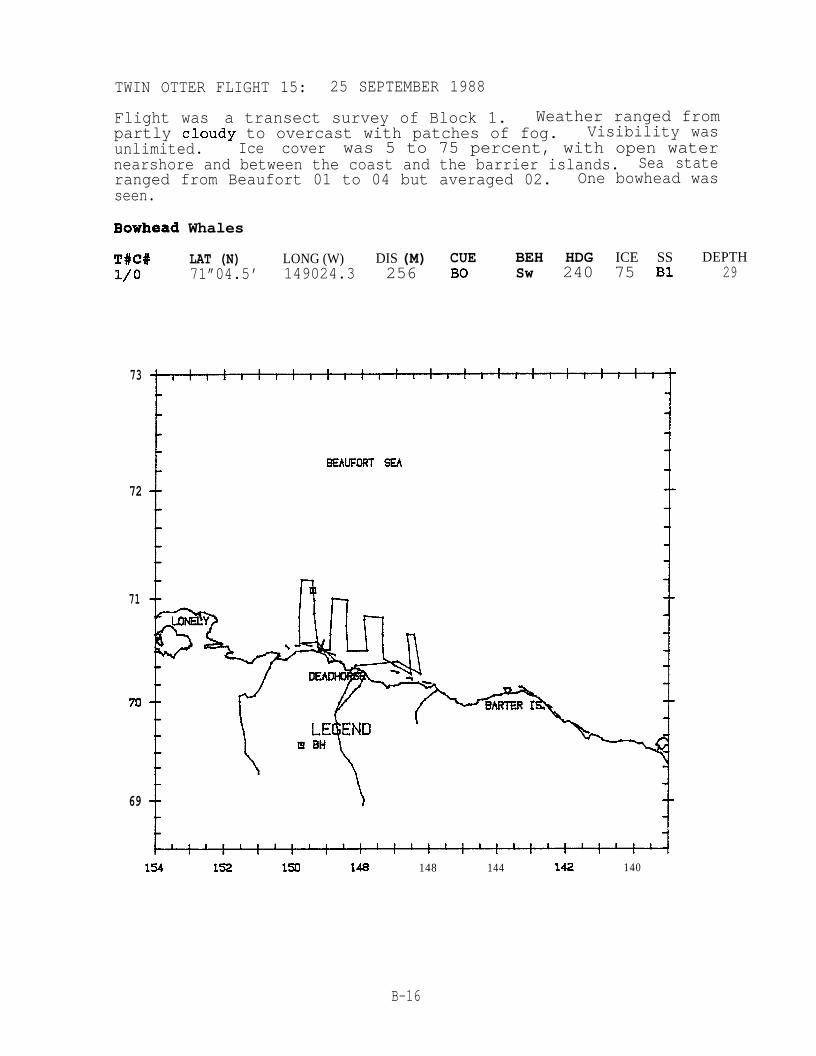
TWIN OTTER FLIGHT 15: 25 SEPTEMBER 1988
Flight was a transect survey of Block 1. Weather ranged frompartly cloudy to overcast with patches of fog. Visibility wasunlimited. Ice cover was 5 to 75 percent, with open waternearshore and between the coast and the barrier islands. Sea stateranged from Beaufort 01 to 04 but averaged 02. One bowhead wasseen.
Bowhead Whales
T#C# LAT (N) LONG (W) DIS (M) CUE BEH HDG ICE SS DEPTH1/o 71”04.5’ 149024.3 256 BO Sw 240 75 B1 29
8EAU!=ORT 52A
73
72
71
70
69
1!54 152 150 14 148 144 142 140
B-16
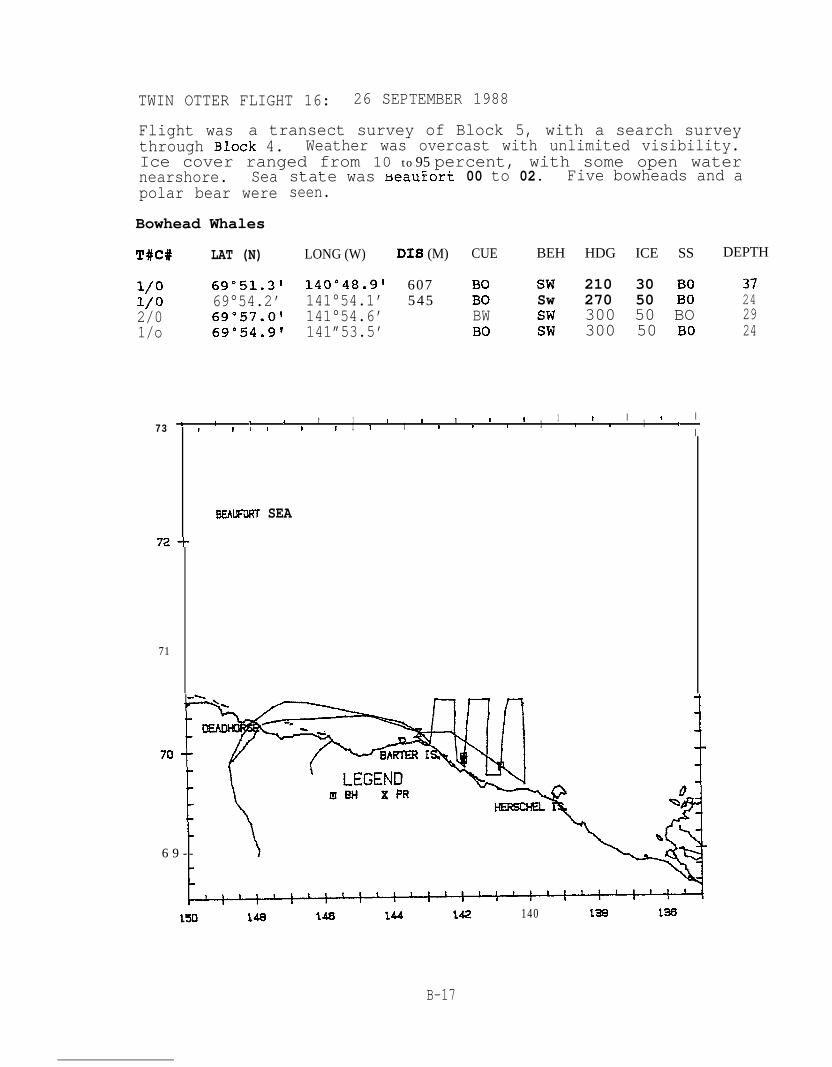
TWIN OTTER FLIGHT 16: 26 SEPTEMBER 1988
Flight was a transect survey of Block 5, with a search surveythrough Block 4. Weather was overcast with unlimited visibility.Ice cover ranged from 10 to 95 percent, with some open waternearshore. Seapolar bear were
Bowhead Whales
T#C# LAT (N)
state was ~eauzort. . -, 00 to 02. Five bowheads and aseen.
LONG (W)
1/o 69”51.3! 140”48.9!1/o 69°54.2’ 141°54.1’2/0 69”57.0J 141°54.6’1/o 69°54.9~ 141”53.5’
DIS (M)
607545
CUE BEH HDG ICE SS DEPTH
BO Sw 210 30 BO 37BO Sw 270 50 BO 24BW Sw 300 50 BO 29BO Sw 300 50 BO 24
BEAUFURT SEA
1 I I 1 I I I I73 I 1 I I t 1 1 I
r 1 I f 1 1 1 1 t 8 I 1 1 # I 1 bI
72+
71
l=+. ~ nnn 1
6 9 --
1 I
150 Me 140 144 w? 140 RR 128
B-17
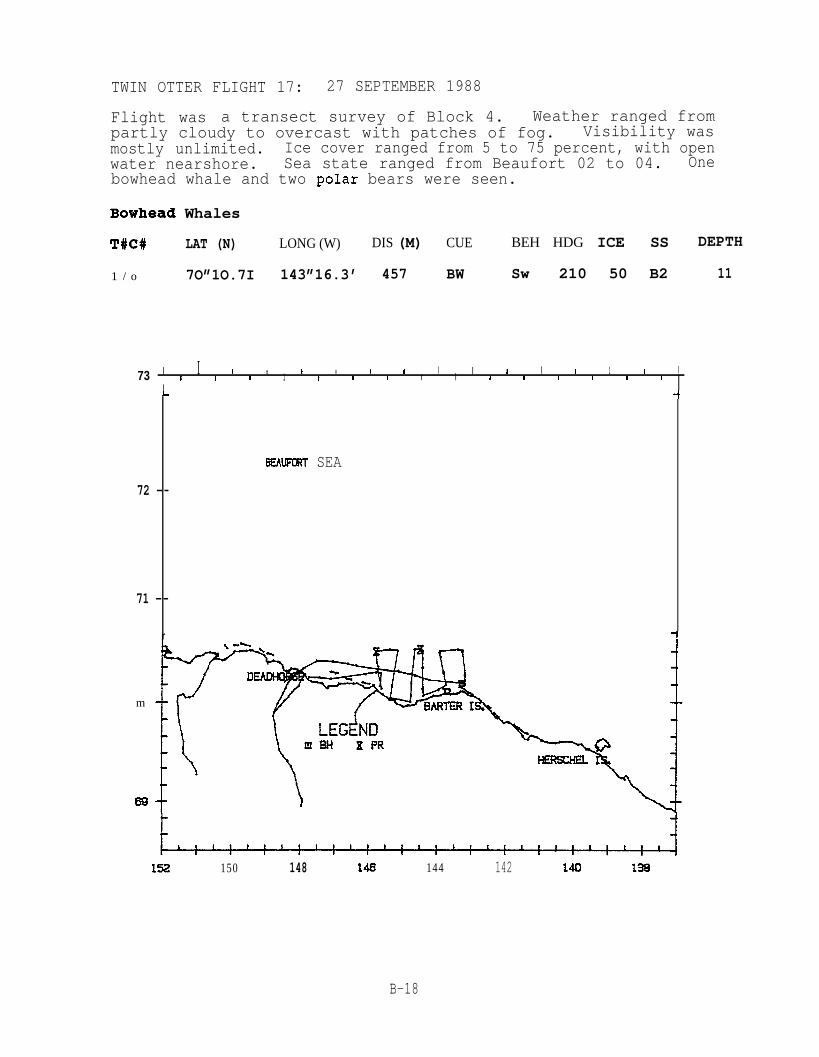
TWIN OTTER FLIGHT 17: 27 SEPTEMBER 1988
Flight was a transect survey of Block 4. Weather ranged frompartly cloudy to overcast with patches of fog. Visibility wasmostly unlimited. Ice cover ranged from 5 to 75 percent, with openwater nearshore. Sea state ranged from Beaufort 02 to 04. Onebowhead whale and two polar bears were seen.
Bowhead Whales
T#C# LAT (N) LONG (W) DIS (M) CUE BEH HDG ICE SS DEPTH
1 / o 7O”1O.7I 143”16.3’ 457 BW Sw 210 50 B2 11
73 I I I t t # I I I I I I 1 1 I I
Ii t 1 1 I I # r I 1 I 1 I 1 1
L
72 --
71 --
r
BEAuml?-r SEA
i
-i
m
w
1s2 150 148 146 144 142 140 138
B-18
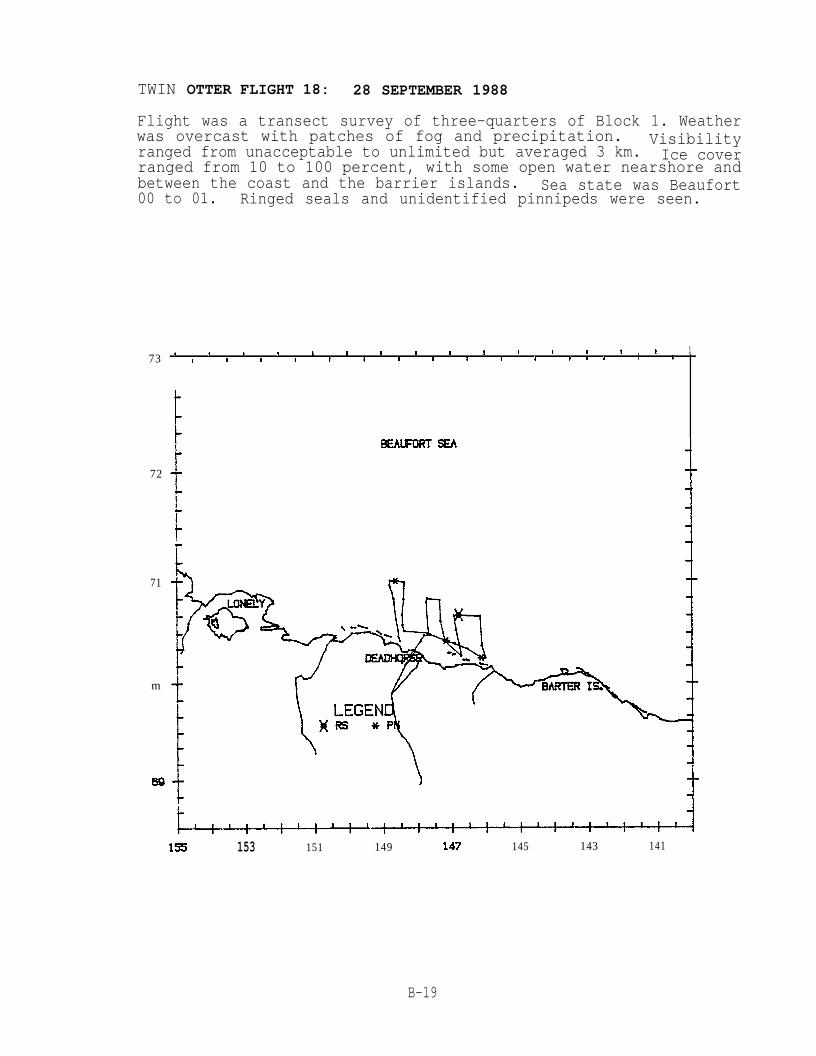
TWIN OTTER FLIGHT 18: 28 SEPTEMBER 1988
Flight was a transect survey of three-quarters of Block 1. Weatherwas overcast with patches of fog and precipitation. Visibilityranged from unacceptable to unlimited but averaged 3 km. Ice coverranged from 10 to 100 percent, with some open water nearshore andbetween the coast and the barrier islands. Sea state was Beaufort00 to 01. Ringed seals and unidentified pinnipeds were seen.
73
72
71
m
I I t t I I 1 I 1 ! I 1 I 1 I 1I I t 1 t 1 I I t i 1 I I t I 1
[
wt
L4—+—+4—l—~1s5 153 151 149 147 145 143 141
B-19
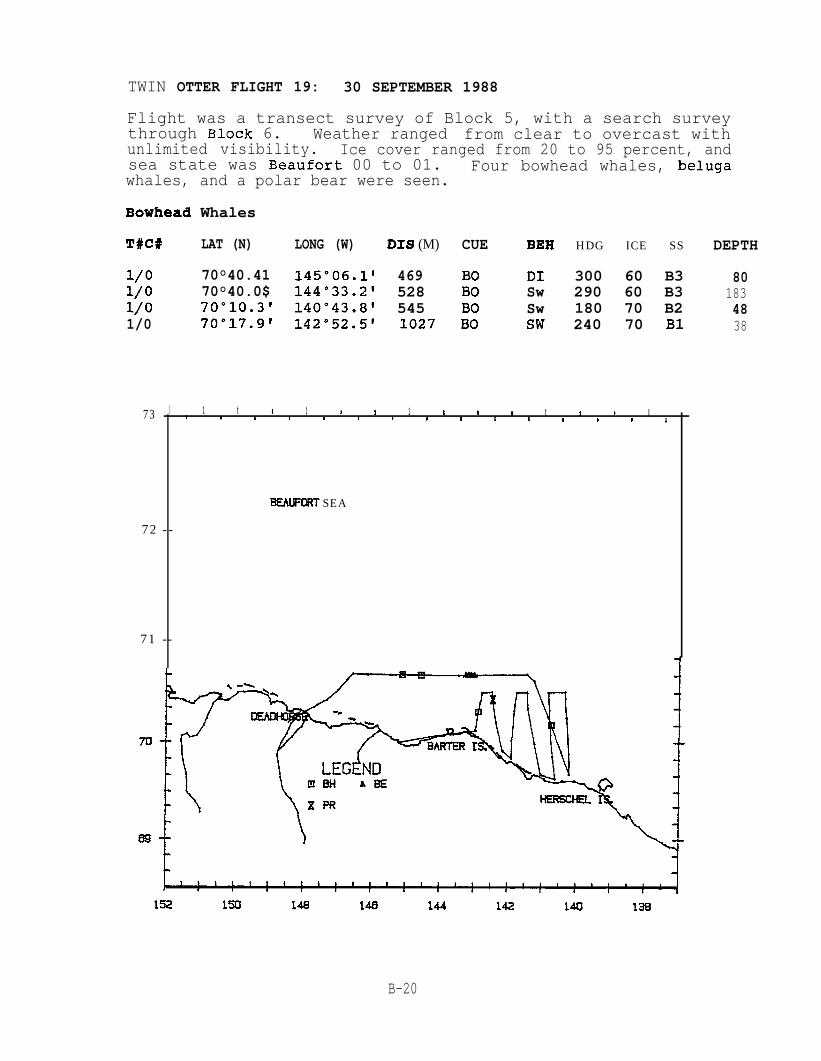
TWIN OTTER FLIGHT 19: 30 SEPTEMBER 1988
Flight was a transect survey of Block 5, with a search surveythrough Block 6. Weather ranged from clear to overcast withunlimited visibility. Ice cover ranged from 20 to 95 percent, andsea state was Beaufort 00 to 01. Four bowhead whales, belugawhales, and a polar bear were seen.
Bowhead Whales
T#C# LAT (N) LONG (W) DIS (M) CUE BEH HDG ICE SS DEPTH
1/o 70°40.41 145°06.1~ 469 BO DI 300 60 B3 801/o 70°40.0$ 144°33.21 528 BO Sw 290 60 B3 1831/o 70”10.31 140°43.8t 545 BO Sw 180 70 B2 481/0 70”17.9? 142°52.5? 1027 BO Sw 240 70 B1 38
3EAUFORT SEA
73 1 1I tI 1 1 I1 i I t 1I I I 14 1 II t1 1I II II I
72 --
71 --
7
70
w
B-20
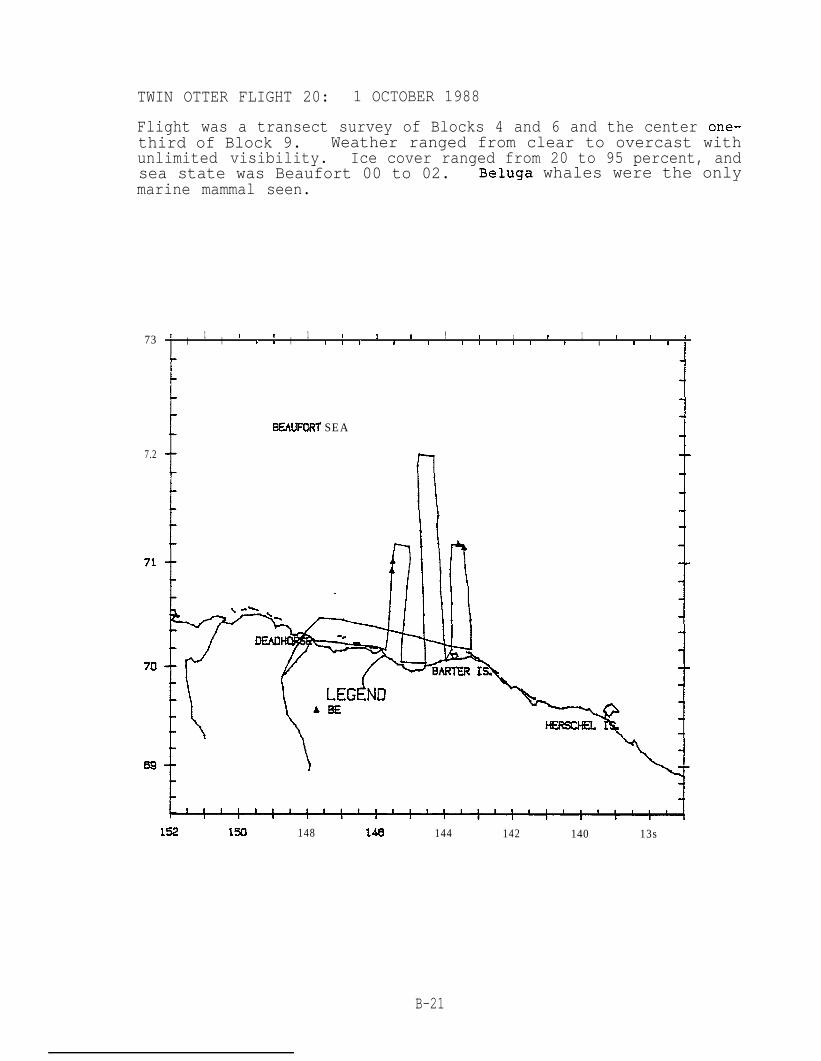
TWIN OTTER FLIGHT 20: 1 OCTOBER 1988
Flight was a transect survey of Blocks 4 and 6 and the center one-third of Block 9. Weather ranged from clear to overcast withunlimited visibility. Ice cover ranged from 20 to 95 percent, andsea state was Beaufort 00 to 02. Beluga whales were the onlymarine mammal seen.
73 1 1 I t 1 II I I 1 I I 1[ I 1 ! I 1 I 1
1 1 I 1 1 I 1 I 1 1 II 1 I I
7.2
8EAUFORT SEA
1!52 150 148 145 144 142 140 13s
B-21
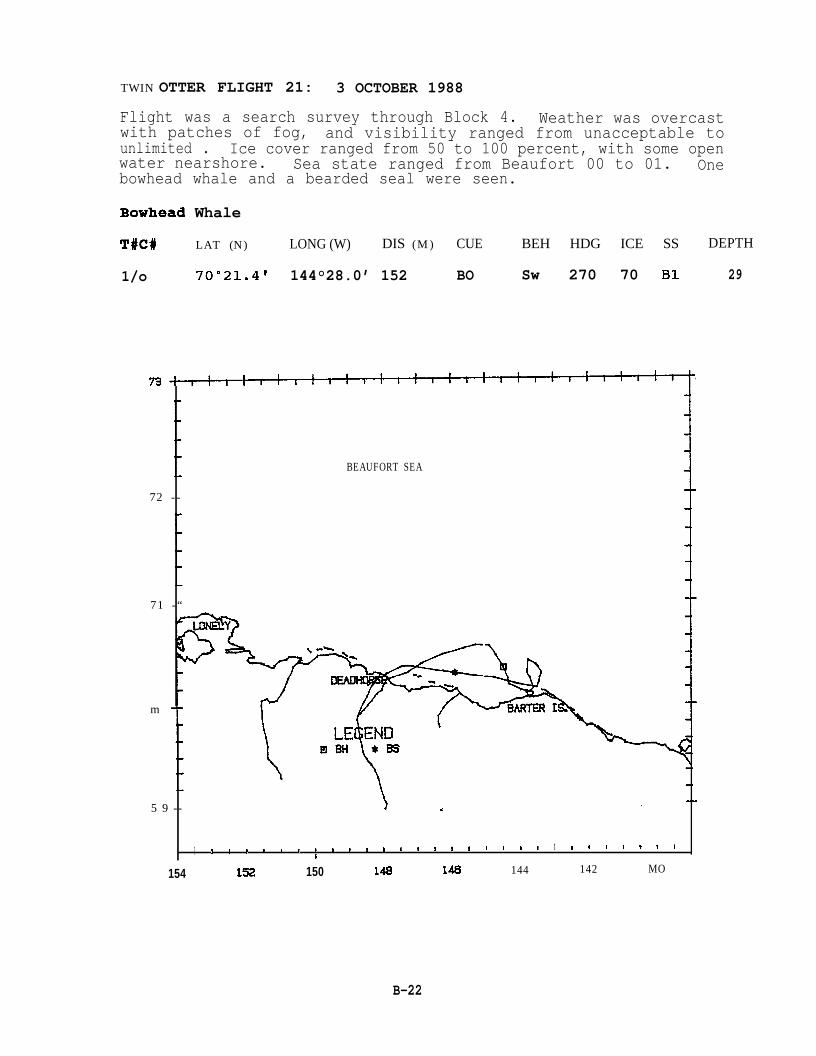
TWIN OTTER FLIGHT 21: 3 OCTOBER 1988
Flight was a search survey through Block 4. Weather was overcastwith patches of fog, and visibility ranged from unacceptable tounlimited . Ice cover ranged from 50 to 100 percent, with some openwater nearshore. Sea state ranged from Beaufort 00 to 01. Onebowhead whale and a bearded seal were seen.
Bowhead Whale
T#C# LAT (N) LONG (W) DIS (M) CUE BEH HDG ICE SS DEPTH
1/o 70°21.4! 144°28.0’ 152 BO Sw 270 70 B1 29
BEAUFORT SEA
73~I 1 I I I t I I
72 - -
71 - “
m
5 9 --
1 1 1 I 1 I I t I I II I I 1 I I I * t I I t I I I t t 1 1
154 152 150 lM 146 144 142 MO
B-22
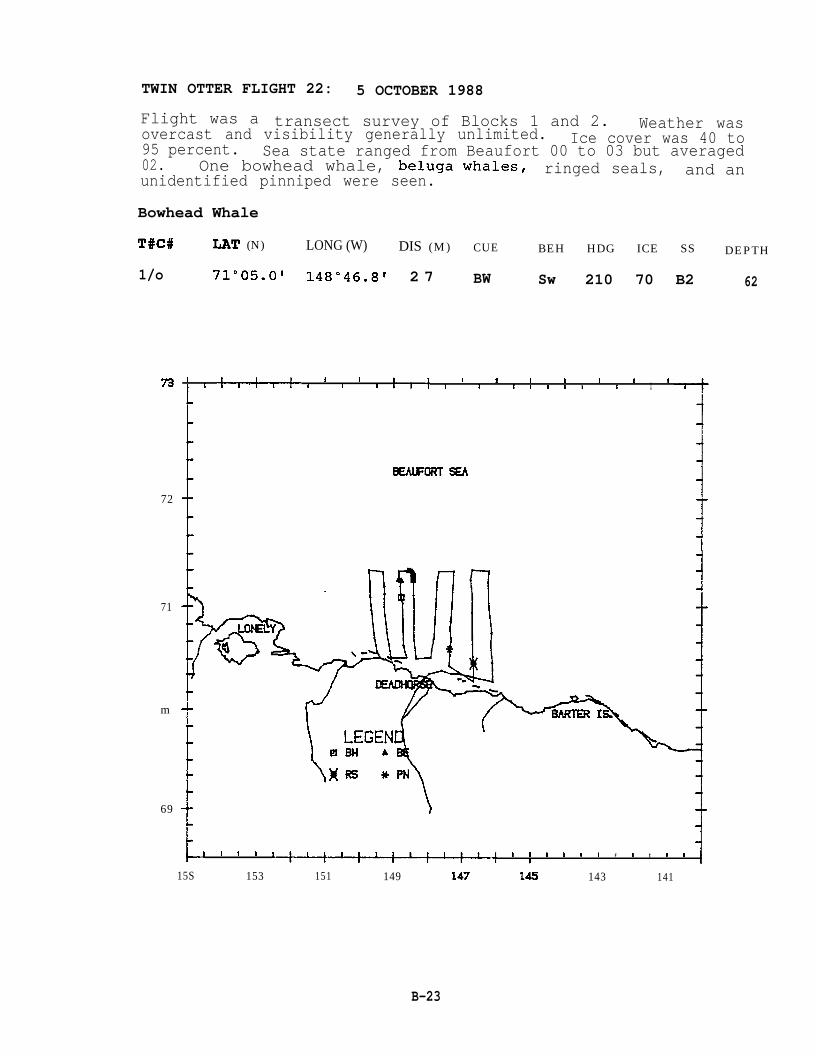
TWIN OTTER FLIGHT 22: 5 OCTOBER 1988
Flight was a transect survey of Blocks 1 and 2. Weather wasovercast and visibility generally unlimited. Ice cover was 40 to95 percent. Sea state ranged from Beaufort 00 to 03 but averaged02. One bowhead whale, beluga whales, ringed seals, and anunidentified pinniped were seen.
Bowhead Whale
T#C# L?iT (N) LONG (W) DIS (M) CUE BEH HDG ICE SS DEPTH
1/o 71°05.01 148°46.8! 2 7 BW Sw 210 70 B2 62
73
72
71
m
69
1I I
t
t
+-1--+
RmlJmRl SEA
I !i I I t I-+ I I1 I t I II I 1 I I II1
T I \
1’ t I I ‘-+--+~+ 1 1 I II
t t # I t 1 I I15S 153 151 149 147 145 143 141
B-23
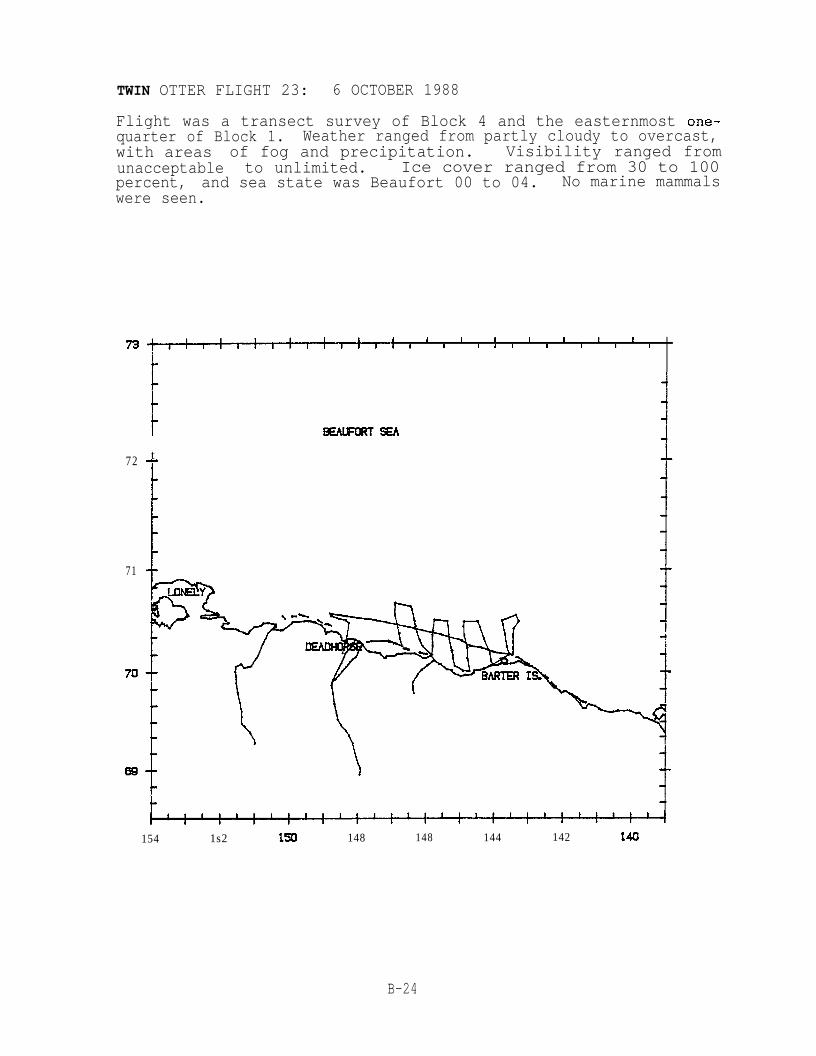
TWIN OTTER FLIGHT 23: 6 OCTOBER 1988
Flight was a transect survey of Block 4 and the easternmost one-quarter of Block 1. Weather ranged from partly cloudy to overcast,with areas of fog and precipitation. Visibility ranged fromunacceptable to unlimited. Ice cover ranged from 30 to 100percent, and sea state was Beaufort 00 to 04. No marine mammalswere seen.
BEAlmR19EA
1 I I I 1 1 173 +~i I 1 1 I 1 I I 1 I
172 t
71 I !
w+ \t
154 1s2 150 148 148 144 142 140
B-24
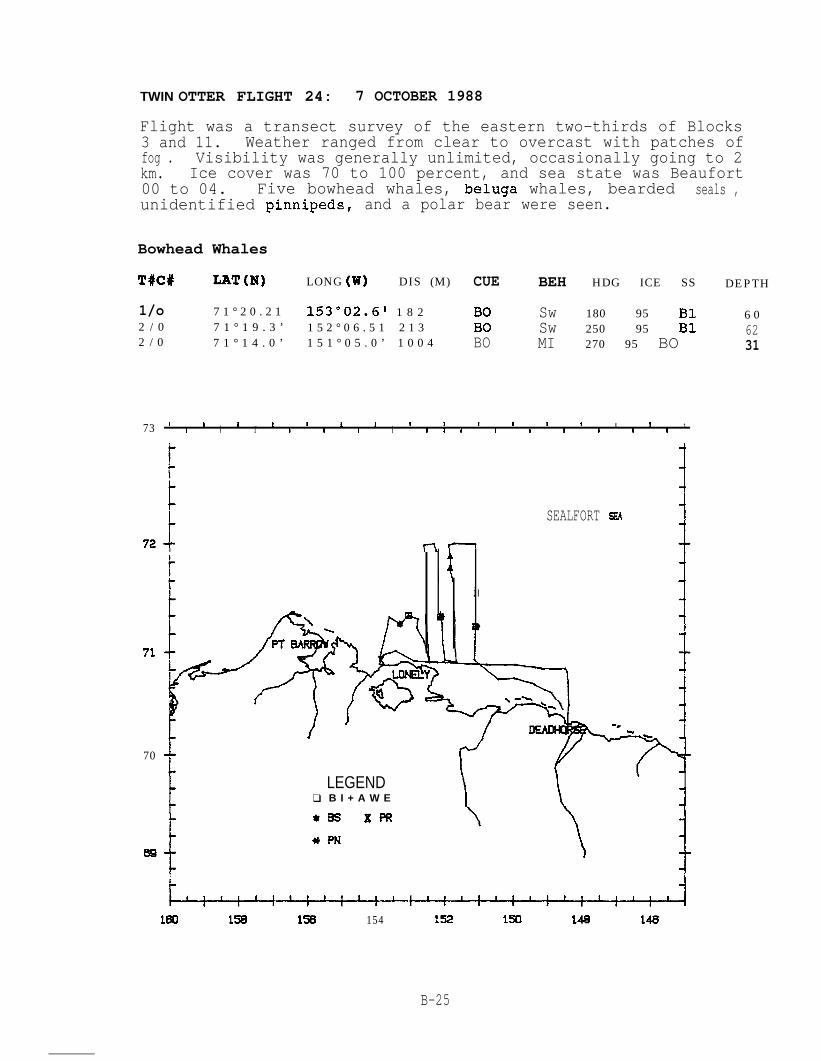
TWIN OTTER FLIGHT 24: 7 OCTOBER 1988
Flight was a transect survey of the eastern two-thirds of Blocks3 and 11. Weather ranged from clear to overcast with patches offog . Visibility was generally unlimited, occasionally going to 2km. Ice cover was 70 to 100 percent, and sea state was Beaufort00 to 04. Five bowhead whales, beluga whales, bearded seals ,unidentified pinnipeds, and a polar bear were seen.
Bowhead Whales
T#C# LAT (N] LONG (W) DIS (M) CUE BEH HDG ICE SS DEPTH
1/o 7 1 ° 2 0 . 2 1 153°02.6! 1 8 2 BO Sw 180 95 B1 6 02 / 0 7 1 ° 1 9 . 3 ’ 1 5 2 ° 0 6 . 5 1 2 1 3 BO Sw 250 95 B1 622 / 0 7 1 ° 1 4 . 0 ’ 1 5 1 ° 0 5 . 0 ’ 1 0 0 4 BO MI 270 95 BO 31
73 I t 1 1 1 t 1I I r I I b I 1 t I I I t I tI I I I I I 1 s I I
SEALFORT SEA Im
i I
70
I
LEGEND❑ B I + A W E
1
*8SXPR
69f.:4100 1s 1s6 154 152 150 149 148
B-25
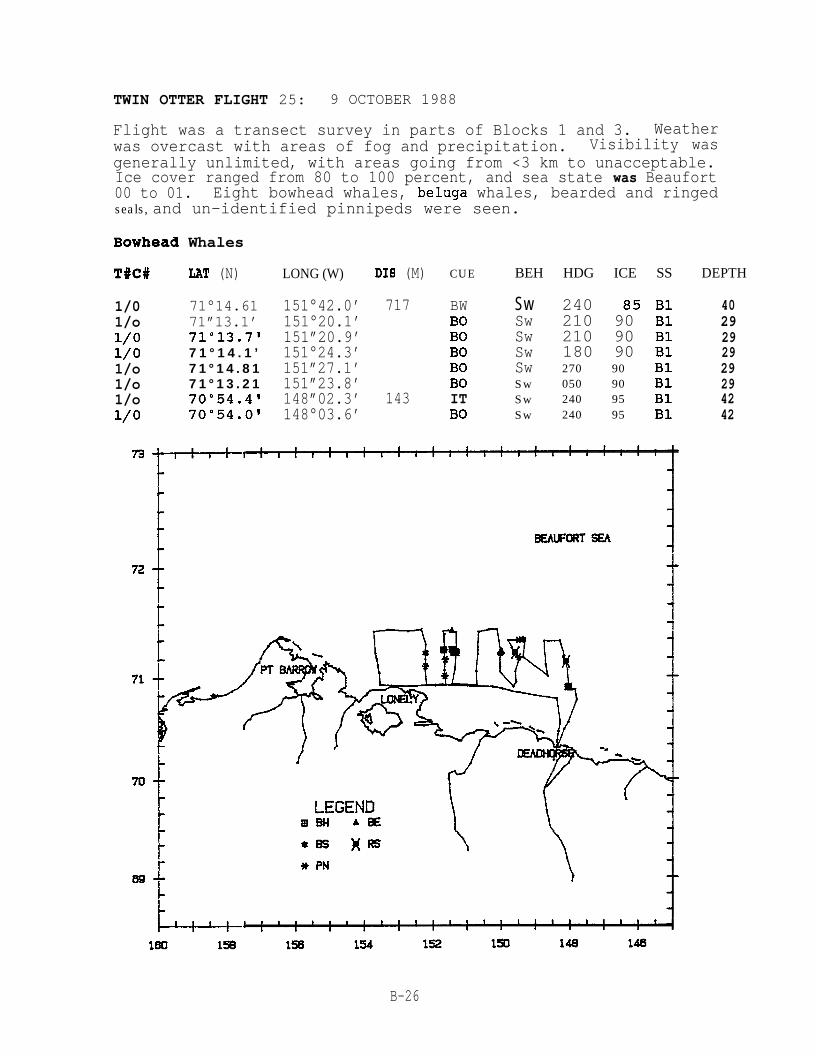
TWIN OTTER FLIGHT 25: 9 OCTOBER 1988
Flight was a transect survey in parts of Blocks 1 and 3. Weatherwas overcast with areas of fog and precipitation. Visibility wasgenerally unlimited, with areas going from <3 km to unacceptable.Ice cover ranged from 80 to 100 percent, and sea state was Beaufort00 to 01. Eight bowhead whales, beluga whales, bearded and ringedseals, and un-identified pinnipeds were seen.
Bowhead Whales
T#C# LAT (N)
1/01/o1/o1/o1/o1/o1/o1/o
71°14.6171”13.1’71°13.717 1 ° 1 4 . 1 ’7 1 ° 1 4 . 8 17 1 ° 1 3 . 2 170°54.4170°54.01
LONG (W) DIS (M)
151°42.0’ 717151°20.1’151”20.9’151°24.3’151”27.1’151”23.8’148”02.3’ 143148°03.6’
CUE
BWBOBOBOBOBOITBO
BEH HDG ICE SS
Sw 240 85 B1Sw 210 90 B1Sw 210 90 B1Sw 180 90 B1Sw 270 90 B1Sw 050 90 B1Sw 240 95 B1Sw 240 95 B1
BEALmRT8EA
-. I
DEPTH
4029292929294242
B-26
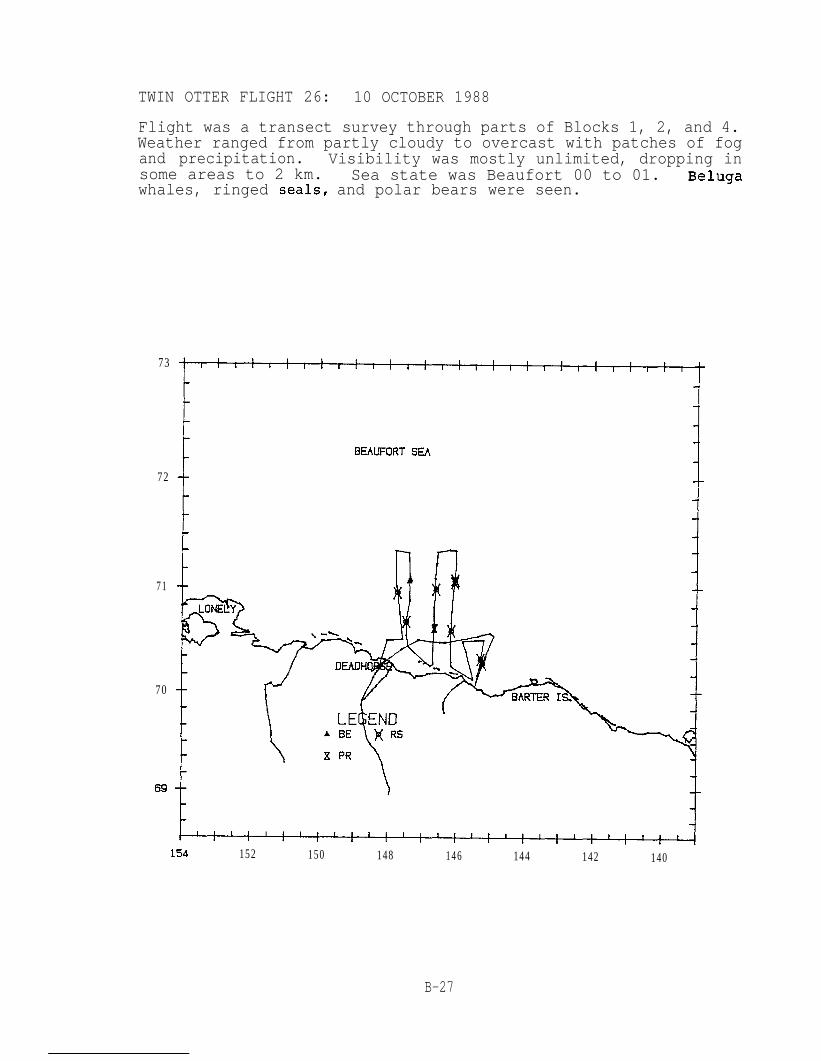
TWIN OTTER FLIGHT 26: 10 OCTOBER 1988
Flight was a transect survey through parts of Blocks 1, 2, and 4.Weather ranged from partly cloudy to overcast with patches of fogand precipitation. Visibility was mostly unlimited, dropping insome areas to 2 km. Sea state was Beaufort 00 to 01. Belugawhales, ringed seals, and polar bears were seen.
73
72
71
70
69
154 152 150 148 146 144 142 140
B-27
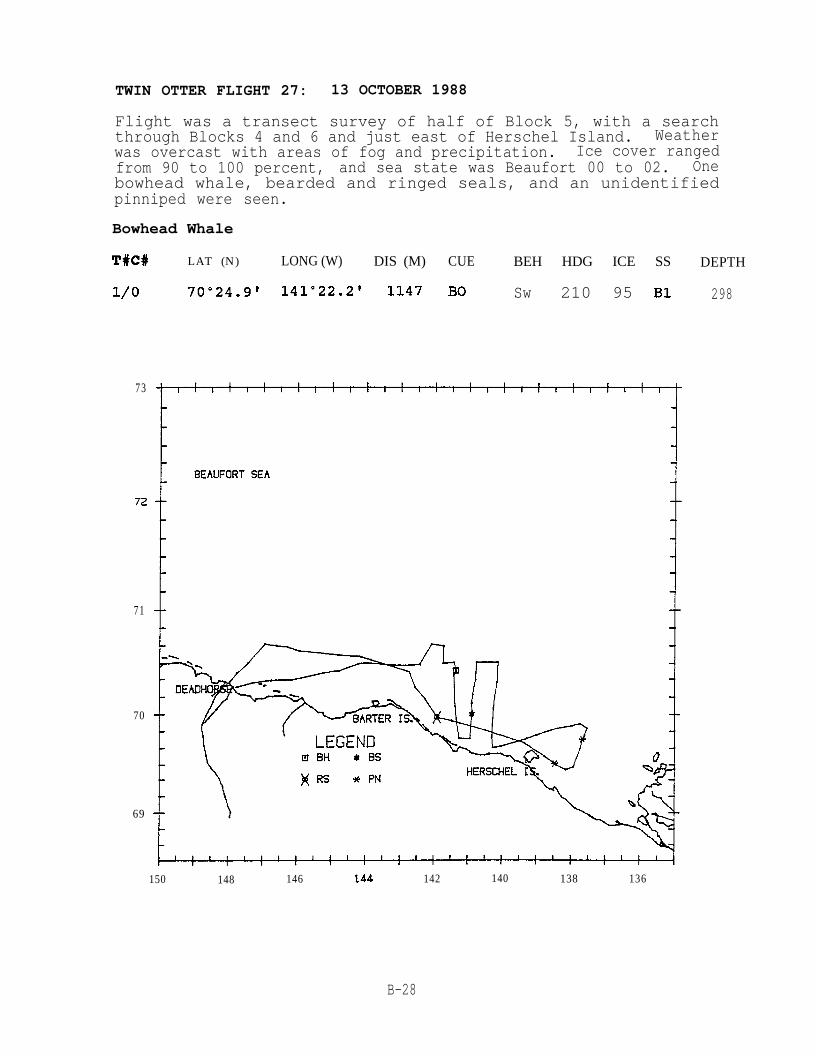
TWIN OTTER FLIGHT 27: 13 OCTOBER 1988
Flight was a transect survey of half of Block 5, with a searchthrough Blocks 4 and 6 and just east of Herschel Island. Weatherwas overcast with areas of fog and precipitation. Ice cover rangedfrom 90 to 100 percent, and sea state was Beaufort 00 to 02. Onebowhead whale, bearded and ringed seals, and an unidentifiedpinniped were seen.
Bowhead Whale
T#C# LAT (N) LONG (W) DIS (M) CUE BEH HDG ICE SS DEPTH
1/o 70°24.9? 141”22.21 1147 BO Sw 210 95 B1 298
73
72
71
70
69
150 148 146 144 142 140 138 136
B-28
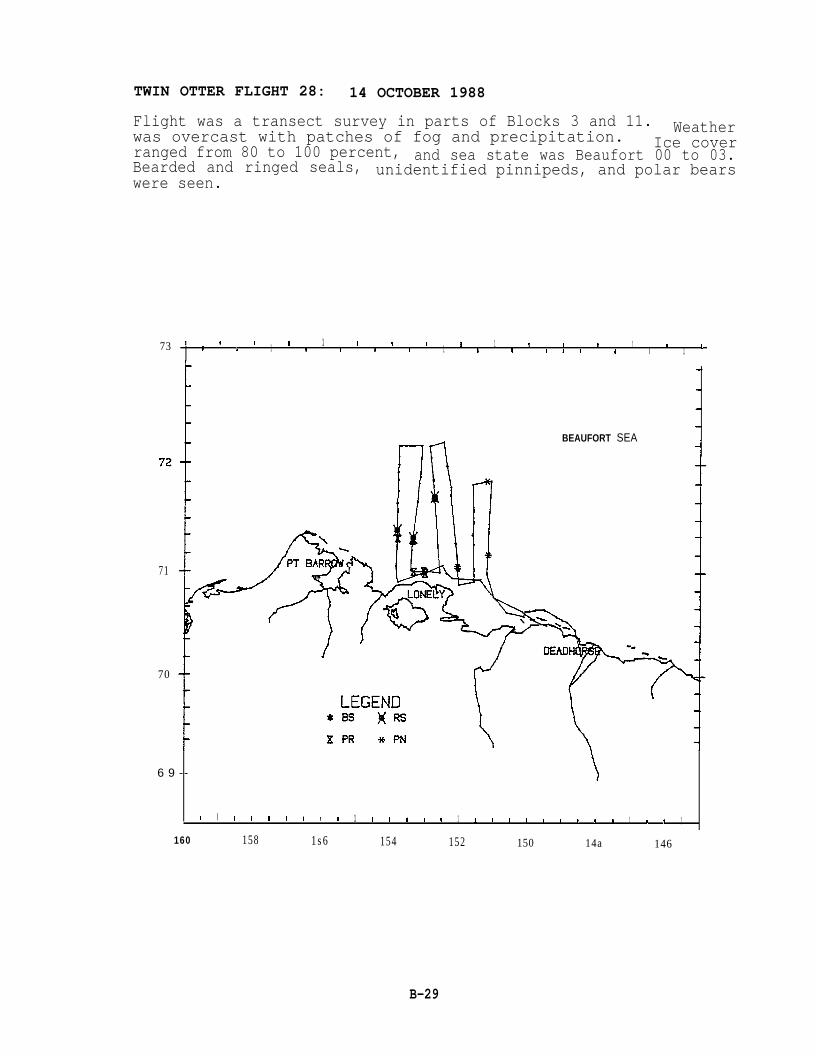
TWIN OTTER FLIGHT 28: 14 OCTOBER 1988
Flight was a transect survey in parts of Blocks 3 and 11. Weatherwas overcast with patches of fog and precipitation. Ice coverranged from 80 to 100 percent, and sea state was Beaufort 00 to 03.Bearded and ringed seals, unidentified pinnipeds, and polar bearswere seen.
73 t t 1r I 11 1 1I I If 1 II 1 11 11 I 1I I I 11 II t1
71
70
BEAUFORT SEA
6 9 -- \
1 I I I t 1 I I 1 1 I I 1 I I 1 1 I I I 1 1 1 t I 1 1 I 1
160 158 1s6 154 152 150 14a 146
B-29
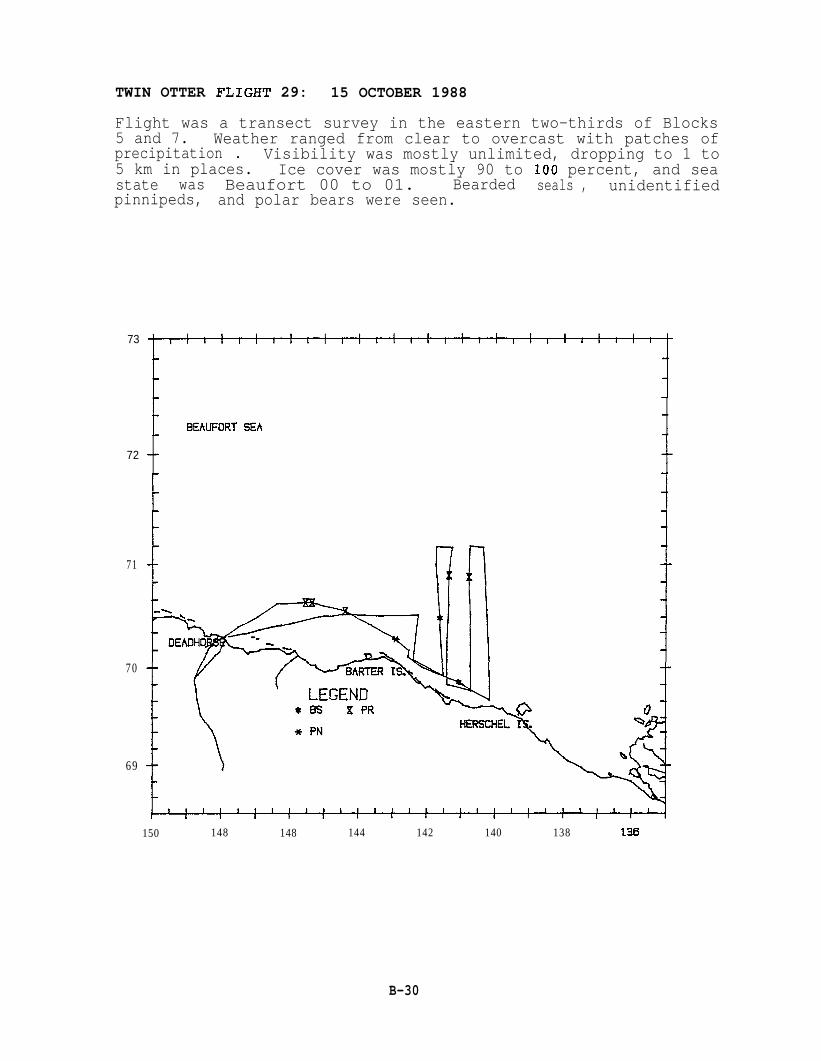
TWIN OTTER FLIGHT 29: 15 OCTOBER 1988
Flight was a transect survey in the eastern two-thirds of Blocks5 and 7. Weather ranged from clear to overcast with patches ofprecipitation . Visibility was mostly unlimited, dropping to 1 to5 km in places. Ice cover was mostly 90 to 100 percent, and seastate was Beaufort 00 to 01. Bearded seals , unidentifiedpinnipeds, and polar bears were seen.
73
72
71
70
69
150 148 148 144 142 140 138 136
B-30
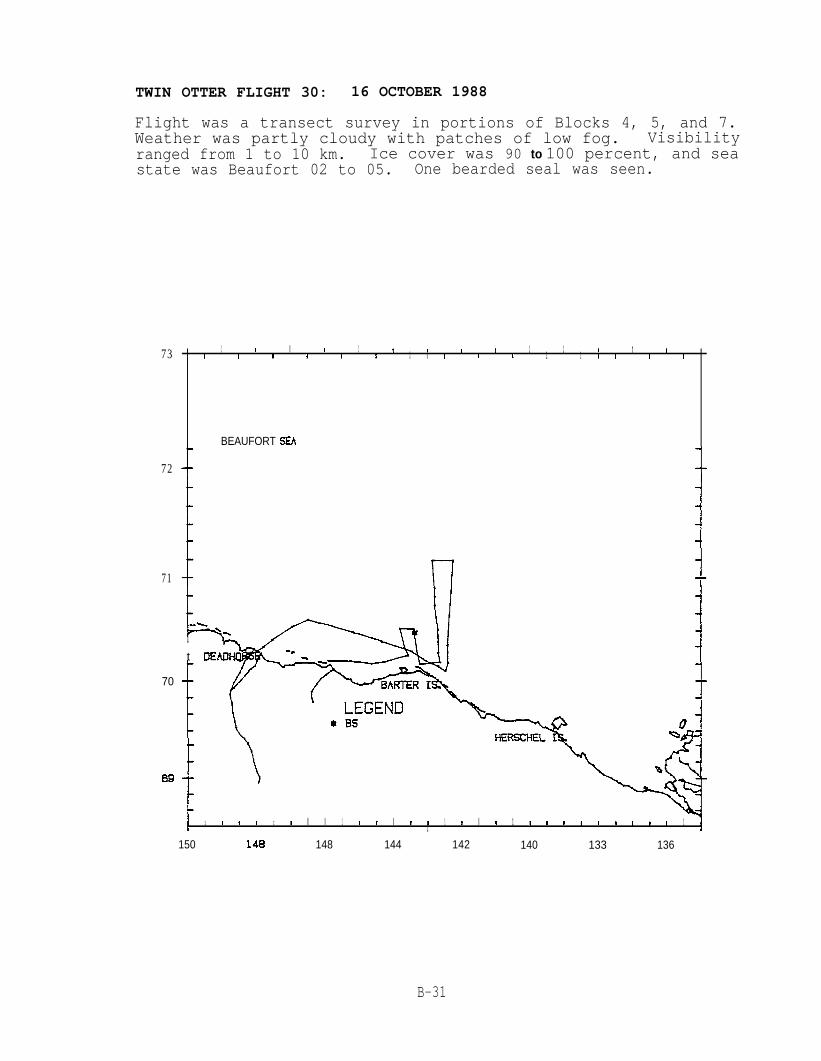
TWIN OTTER FLIGHT 30: 16 OCTOBER 1988
Flight was a transect survey in portions of Blocks 4, 5, and 7.Weather was partly cloudy with patches of low fog. Visibilityranged from 1 to 10 km. Ice cover was 90 to 100 percent, and seastate was Beaufort 02 to 05. One bearded seal was seen.
73
72
71
70
39
1 t I I 1 t I I I 1 1 I t t1 I I f [ I 1 I I 1 1 1 1 I I 1 i
BEAUFORT 3EA
It DEAd
-t
I 1 I t t I # I I 1 1 I I 1 $ 1 t I1 I 1 I I 1 1 # 9 I 1 I 1 1
150 143 148 144 142 140 133 136
B-31
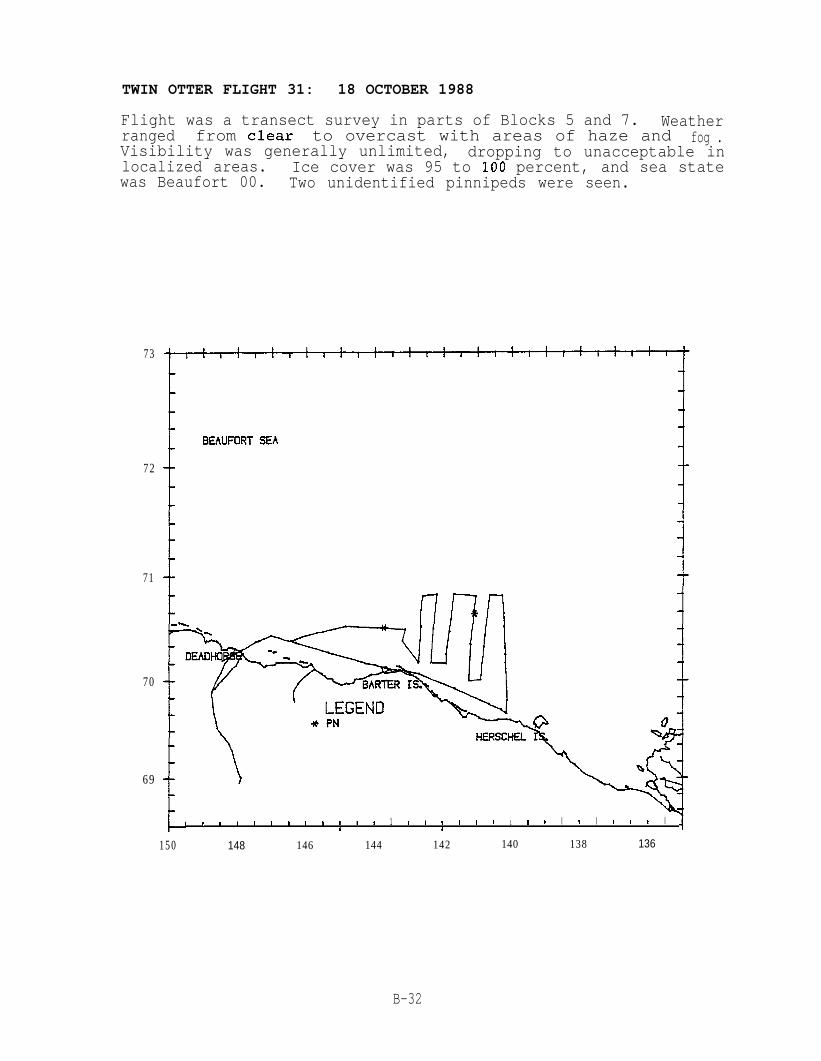
TWIN OTTER FLIGHT 31: 18 OCTOBER 1988
Flight was a transect survey in parts of Blocks 5 and 7. Weatherranged from clear to overcast with areas of haze and fog .Visibility was generally unlimited, dropping to unacceptable inlocalized areas. Ice cover was 95 to 100 percent, and sea statewas Beaufort 00. Two unidentified pinnipeds were seen.
73
72
71
70
69
) I !1’ t I 1 I I I I ) tI 1 1 t t I t1
1 I 1 I I I 1 # 1 I 4
150 148 146 144 142 140 138 136
B-32
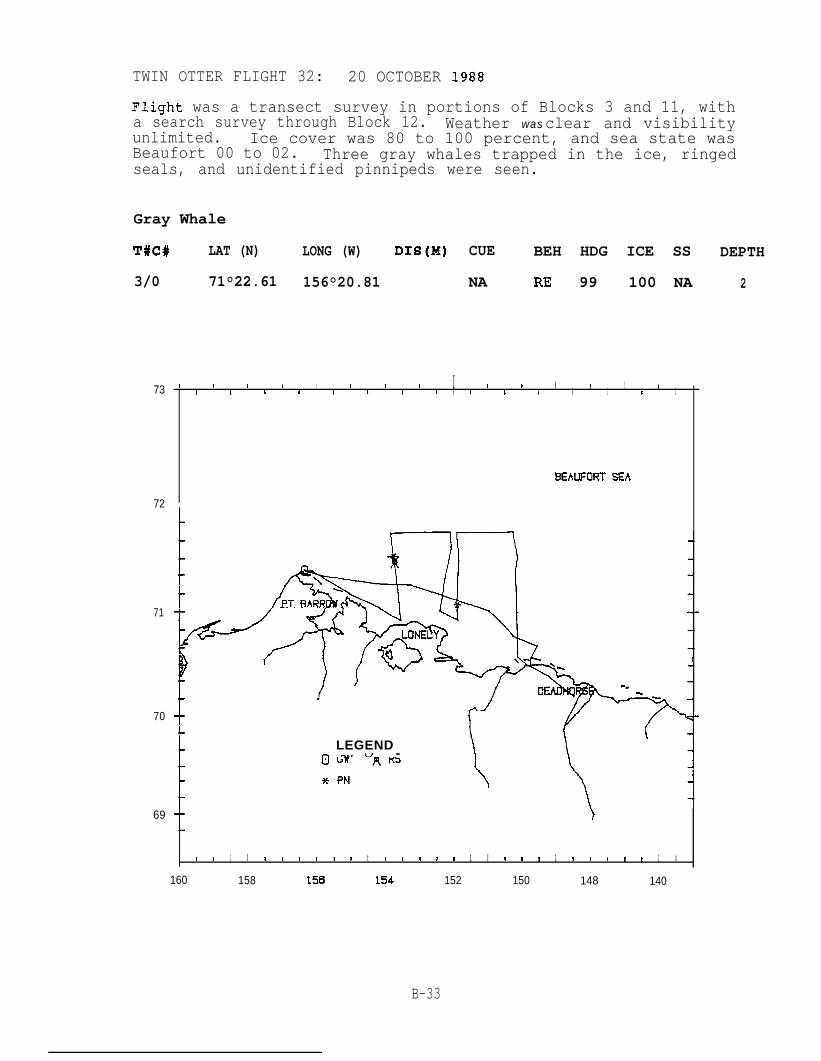
TWIN OTTER FLIGHT 32: 20 OCTOBER 1988
Flight was a transect survey in portions of Blocks 3 and 11, witha search survey through Block 12. Weather was clear and visibilityunlimited. Ice cover was 80 to 100 percent, and sea state wasBeaufort 00 to 02. Three gray whales trapped in the ice, ringedseals, and unidentified pinnipeds were seen.
Gray Whale
T#C# LAT (N) LONG (W) DIS(M) CUE BEH HDG ICE SS DEPTH
3/0 71°22.61 156°20.81 NA RE 99 100 NA 2
73
72
71
70
69
I
+ / -. . . ..T.A
t I 1 1 1 1 1 I I f t I1 I ! 1 ! i I 1 I 1 I I 1 1 tI 1 1 1
BENJFORT 32A
1
LEGENDm -.., u -
)
I I 1 I 1 t t I I I t I I I 1 I 1 I * I 1 1 I 1 I 1 1 1 #
160 158 156 154 152 150 148 140
B-33
APPENDIX C
SUCCESS OF PRIMARY OBSERVERS IN LOCATING WHALES
SUCCESS OF PRIMARY OBSERVERS IN LOCATING WHALES
This appendix presents a comparison of the number of bowhead whale sightings and the total number ofbowhead whales observed per hour by MMS and non-MMS primary observers for the period 1September through 20 October 1988.
The number of whales counted during a survey depends on the success of survey observers in spottingwhales. In order to gauge the relative success of selected whale observers in 1988, their productivitywas calculated from the whale sighting data assuming that individual observers had an equal opportunityto encounter whales. For purposes of this calculation, sightings and total whales in each group sightedwere credited solely to the observer making the initial report, ignoring subsequent or near-simultaneousreports by other observers. The number of sightings credited per hour of effort (SPUE) and the numberof whales sighted per hour of effort (WPUE) were then used as measures of relative productivity.
The MMS observer team always consisted of two aircraft pilots, a data recorder, a primary port observer,and a primary starboard observer (who also functioned as team leader). The productivity of the twoprimary observers was used to represent overall team success (Table C-1), regardless of who occupiedthe port and starboard positions during the course of the survey. As a comparison, the productivity oftwo non-MMS observers who had participated in many previous MMS-funded surveys was alsocalculated (Table C-1 ).
Both the MMS and non-MMS observers showed identical group-sighting rates of 0.070 SPUE over theentire survey. During Test Period B, when only 1 non-MMS observer was aboard, the sighting rate of thenon-MMS observer (SPUE = 0.072) was higher than the MMS group-sighting rate (SPUE = 0.054),although the rate at which all whales were sighted was the same (WPUE = 0.072). The highest groupproductivity (SPUE = 0.076; WPUE = 0.095) occurred during Test Period C, in the absence of the twonon-MMS observers. The highest sighting rate for individual primary observer positions was 0.135 SPUEby both an MMS observer and a non-MMS observer during Test Period A ~able C-1).
Productivity rates for all aircraft personnel combined are shown by flight date in Table 6. To generallyassess whether the addition of the non-MMS observers increased the overall sighting rate and number ofwhales sighted per survey hour, productivity rates were calculated from Table 6 for flights with andwithout these additional observers. On those days that one or both non-MMS observers were on board(3-4 September, 21-30 September, and 18-20 October), the Fall-1 988 cumulative rates (SPUE = 0.236;WPUE = 0.259) were not higher than when these observers were not on board (SPUE = 0.241; WPUE= 0.329).
c-1
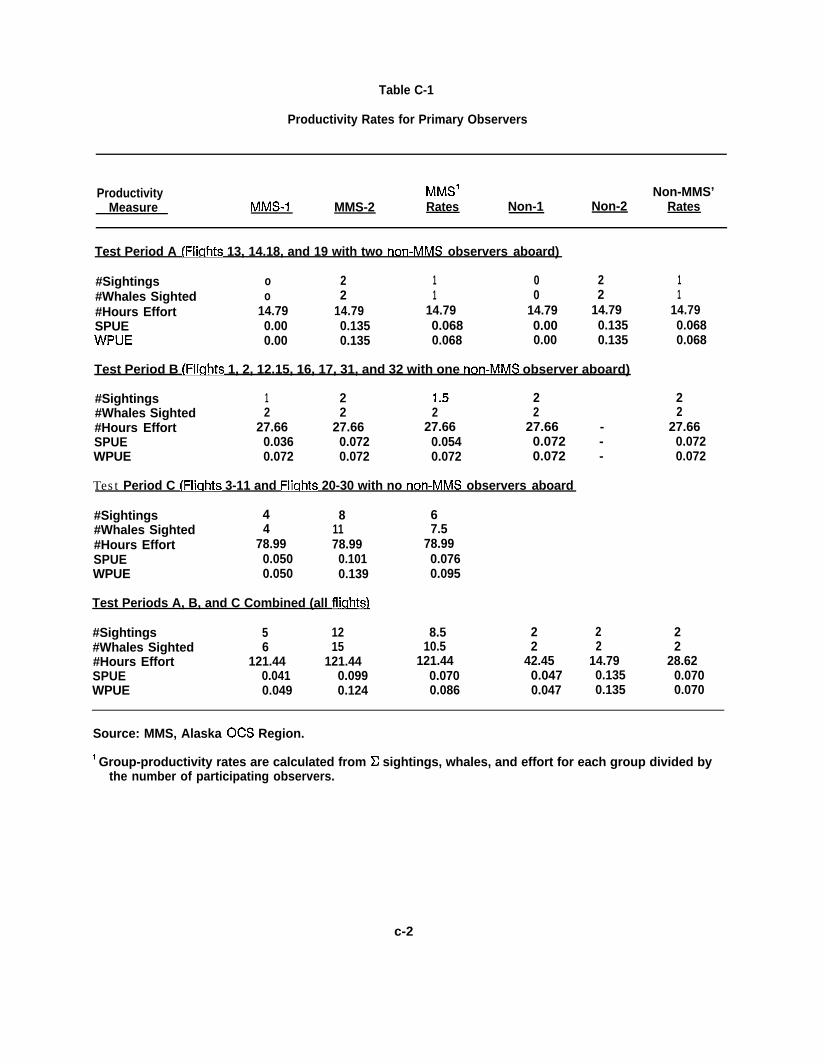
Table C-1
Productivity Rates for Primary Observers
Productivity MMS1 Non-MMS’Measure MMS-1 MMS-2 Rates Non-1 Non-2 Rates
Test Period A (Fliahts 13, 14.18, and 19 with two non-MMS observers aboard)
#Sightings o 2 1 0 2#Whales Sighted o 2 1 0 2#Hours Effort 14.79 14.79 14.79 14.79 14.79SPUE 0.00 0.135 0.068 0.00 0.135WPUE 0.00 0.135 0.068 0.00 0.135
Test Period B (Fliuhts 1, 2, 12.15, 16, 17, 31, and 32 with one non-MMS observer aboard)
#Sightings 1 2 1.5 2#Whales Sighted 2 2 2 2#Hours Effort 27.66 27.66 27.66 27.66 -SPUE 0.036 0.072 0.054 0.072 -WPUE 0.072 0.072 0.072 0.072 -
Test Period C (Fliuhts 3-11 and Fliuhts 20-30 with no non-MMS observers aboard
#Sightings 4 8 6#Whales Sighted 4 11 7.5#Hours Effort 78.99 78.99 78.99SPUE 0.050 0.101 0.076WPUE 0.050 0.139 0.095
Test Periods A, B, and C Combined (all fliahts).
#Sightings 5 12 8.5 2 2#Whales Sighted 6 15 10.5 2 2#Hours Effort 121.44 121.44 121.44 42.45 14.79SPUE 0.041 0.099 0.070 0.047 0.135WPUE 0.049 0.124 0.086 0.047 0.135
11
14.790.0680.068
22
27.660.0720.072
22
28.620.0700.070
Source: MMS, Alaska OCS Region.
1 Group-productivity rates are calculated from E sightings, whales, and effort for each group divided bythe number of participating observers.
c-2
AMPBLM
cc1cm
EISESA
GNS
hHP
km
mMATminMMS
NOAANOSCNMFSnm
OASOcsOCSEAPOCSLA
SDSPUESSDC
USDOCUSDODUSDOIUSGS
WPUE
GLOSSARY OF ACRONYMS, INITIALISMS, AND ABBREVIATIONS
A Mapping PackageBureau of Land Management
Celsiusconfidence intetvalcentimeter
environmental impact statementEndangered Species Act
Global Navigation System
hourHewlett-Packard
kilometer
meteran underwater mat or platform for the SSDCminuteMinerals Management Service
National Oceanic and Atmospheric AdministrationNaval Ocean Systems CenterNational Marine Fisheries Servicenautical miles
Office of Aircraft ServicesOuter Continental ShelfOuter Continental She[f Enviranrnenta! Assessment ProgramOuter Continental Shelf Lands Act
standard deviationsightings per unit effort (number of whale sightings counted per hour)Single Steel Drilling Caisson
U.S. Department of CommerceU.S. Department of DefenseU.S. Department of the InteriorU.S. Geological Survey
whales per unit effort (number of whales counted per hour)
v u.S. GOVERNMENT PRINTING OFFICE 1989-691 -059/00,700 REGION NO. 10
As the Nation’s principal conservationagency, the Department of the Interiorhas responsibility for most of our nation-ally owned public lands and naturalresources. This includes fostering thewisest use of our land and water re-sources, protecting our fish and wildlife,preserving the environmental and cul-tural values of our national parks andhistorical places, and providing for theenjoyment of life through outdoor recrea-tion. The Depaflment assesses our en-ergy and mineral resources and worksto assure that their development is in thebest interest of all our people. The De-partment also has a major responsibilityfor American Indian reservation com-munities and for people who live in IslandTerritories under U.S. Administration.