Embed Size (px)
Citation preview
Oct. 18, 2012
AGENDA:1 – Bell Ringer2 – Acceleration Lab3 – Acceleration Lab
Analysis
Today’s Goal:Students will be able to understand calculate acceleration from position and time dataHomework
1. Acceleration Lab Analysis
(p. 18-20)
2. Quiz Tomorrow

CHAMPS for Bell Ringer
C – Conversation – No Talking H – Help – RAISE HAND for questionsA – Activity – Solve Bell Ringer on
binder paper. Homework out on desk
M – Materials and Movement – Pen/Pencil, Notebook or Paper
P – Participation – Be in assigned seats, work silently
S – Success – Get a stamp! I will collect!
Thursday , Oct. 18th (p. 22)
Objective: Students will be able to understand calculate acceleration from position and time data
Bell Ringer:1. How do you calculate
velocity from position time data?
2. How do you calculate acceleration from knowing an initial and final velocity and a time

4 MINUTES REMAINING…

Thursday , Oct. 18th (p. 22)
Objective: Students will be able to understand calculate acceleration from position and time data
Bell Ringer:1. How do you calculate
velocity from position time data?
2. How do you calculate acceleration from knowing an initial and final velocity and a time

3 MINUTES REMAINING…

Thursday , Oct. 18th (p. 22)
Objective: Students will be able to understand calculate acceleration from position and time data
Bell Ringer:1. How do you calculate
velocity from position time data?
2. How do you calculate acceleration from knowing an initial and final velocity and a time

2 MINUTES REMAINING…

Thursday , Oct. 18th (p. 22)
Objective: Students will be able to understand calculate acceleration from position and time data
Bell Ringer:1. How do you calculate
velocity from position time data?
2. How do you calculate acceleration from knowing an initial and final velocity and a time

1minute Remaining…

Thursday , Oct. 18th (p. 22)
Objective: Students will be able to understand calculate acceleration from position and time data
Bell Ringer:1. How do you calculate
velocity from position time data?
2. How do you calculate acceleration from knowing an initial and final velocity and a time
30 Seconds Remaining…

Thursday , Oct. 18th (p. 22)
Objective: Students will be able to understand calculate acceleration from position and time data
Bell Ringer:1. How do you calculate
velocity from position time data?
2. How do you calculate acceleration from knowing an initial and final velocity and a time

BELL-RINGER TIME IS
UP!

Thursday , Oct. 18th (p. 22)
Objective: Students will be able to understand calculate acceleration from position and time data
Bell Ringer:1. How do you calculate
velocity from position time data?
2. How do you calculate acceleration from knowing an initial and final velocity and a time
Shout Outs
Period 5 – Nana JenkinsPeriod 7 – Jasmine Thomas, Montanez Arnold

Oct. 18, 2012
AGENDA:1 – Bell Ringer2 – Acceleration Lab3 – Acceleration Lab
Analysis
Today’s Goal:Students will be able to understand calculate acceleration from position and time dataHomework
1. Acceleration Lab Analysis
2. (p. 18-20)
3. Quiz Tomorrow
Week 6
Weekly AgendaMonday – AccelerationTuesday – AccelerationWednesday – Acceleration & Results Section of LabsThursday – Acceleration LabFriday – Quiz # 3

CHAMPS for Labs
C – Conversation – Talk to your group no louder than a whisper
H – Help – RAISE HAND for questionsA – Activity – Take Position Time DataM – Materials and Movement –
Pen/Pencil, Packet Pages 18-21P – Participation – Complete Page 18-
21S – Success – Understand how to
calculate acceleration

Lab Analysis (p. 18)
Classwork for Thursday, 10/18/12: Acceleration Lab
Hypothesis: What will be the average speed of a tennis ball rolling down a 20cm tall ramp and traveling
5m? Will the ball continually accelerate as it travels the 5m? Or will it decelerate?
Lab Analysis (p. 18)
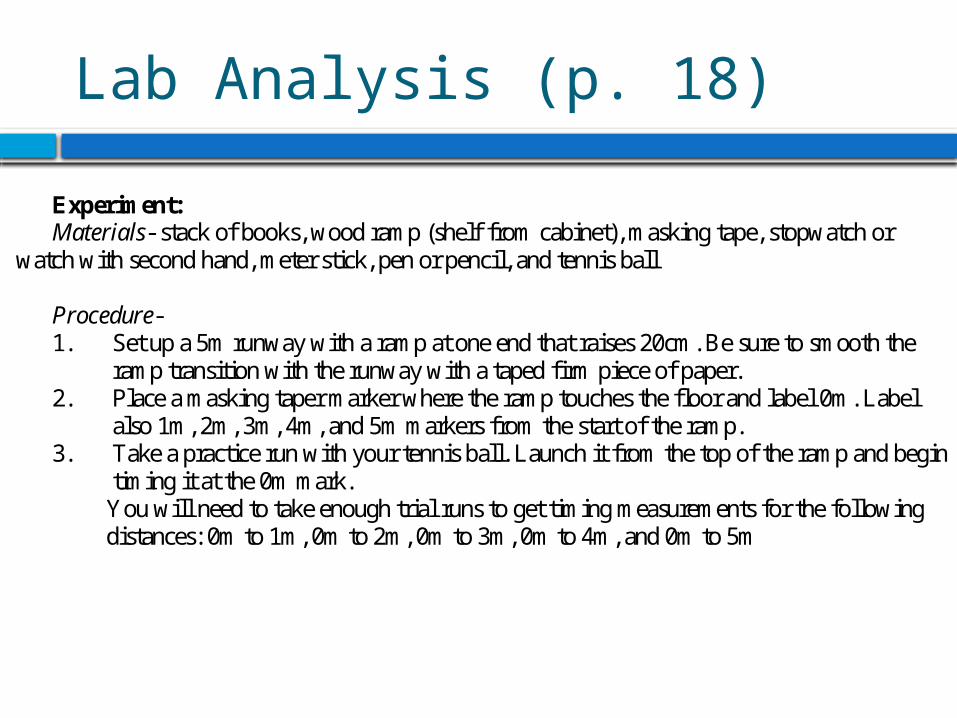
Experiment: Materials- stack of books, wood ramp (shelf from cabinet), masking tape, stopwatch or
watch with second hand, meter stick, pen or pencil, and tennis ball Procedure- 1. Set up a 5m runway with a ramp at one end that raises 20cm. Be sure to smooth the
ramp transition with the runway with a taped firm piece of paper. 2. Place a masking taper marker where the ramp touches the floor and label 0m. Label
also 1m, 2m, 3m, 4m, and 5m markers from the start of the ramp. 3. Take a practice run with your tennis ball. Launch it from the top of the ramp and begin
timing it at the 0m mark. You will need to take enough trial runs to get timing measurements for the following distances: 0m to 1m, 0m to 2m, 0m to 3m, 0m to 4m, and 0m to 5m

Lab Analysis (p. 18)
Record your time data below
a. 0m to 1m ____________
b. 0m to 2m ____________
c. 0m to 3m ____________
d. 0m to 4m ____________
e. 0m to 5m ____________
Lab Analysis (p. 18)
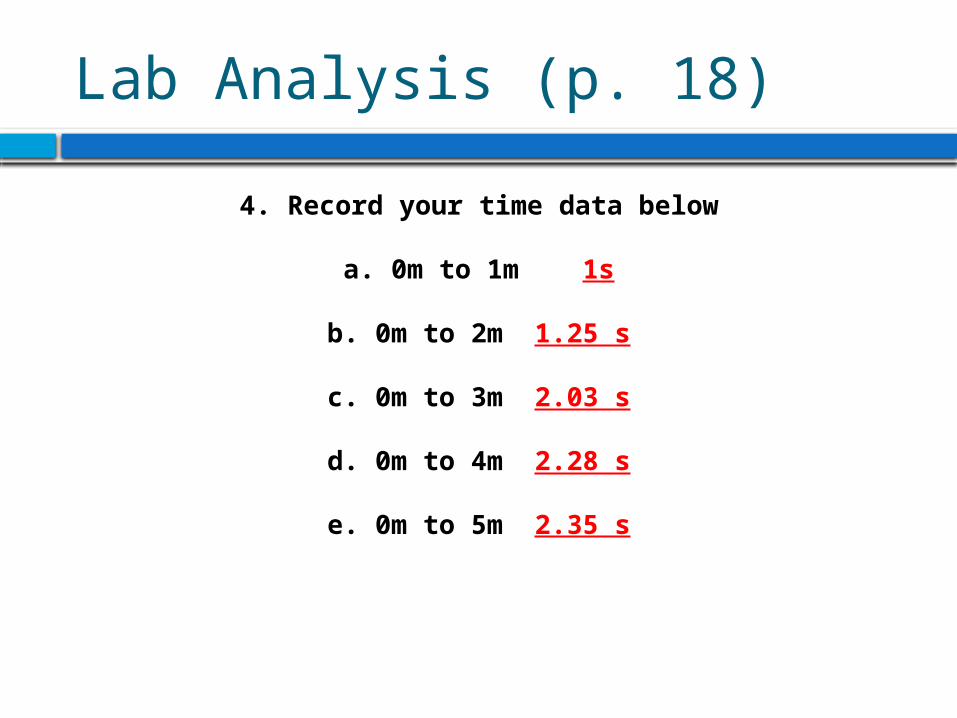
4. Record your time data below
a. 0m to 1m 1s
b. 0m to 2m 1.25 s
c. 0m to 3m 2.03 s
d. 0m to 4m 2.28 s
e. 0m to 5m 2.35 s

Lab Analysis (p. 18-19)
Analysis:
5. Calculate the instantaneous speed at the following distances
f. 1m ____________ (1/a)
g. 2m ____________ (2/b)
h. 3m ____________ (3/c)
i. 4m ____________ (4/d)
j. 5m ____________ (5/e)
Lab Analysis (p. 18-19)
Analysis:
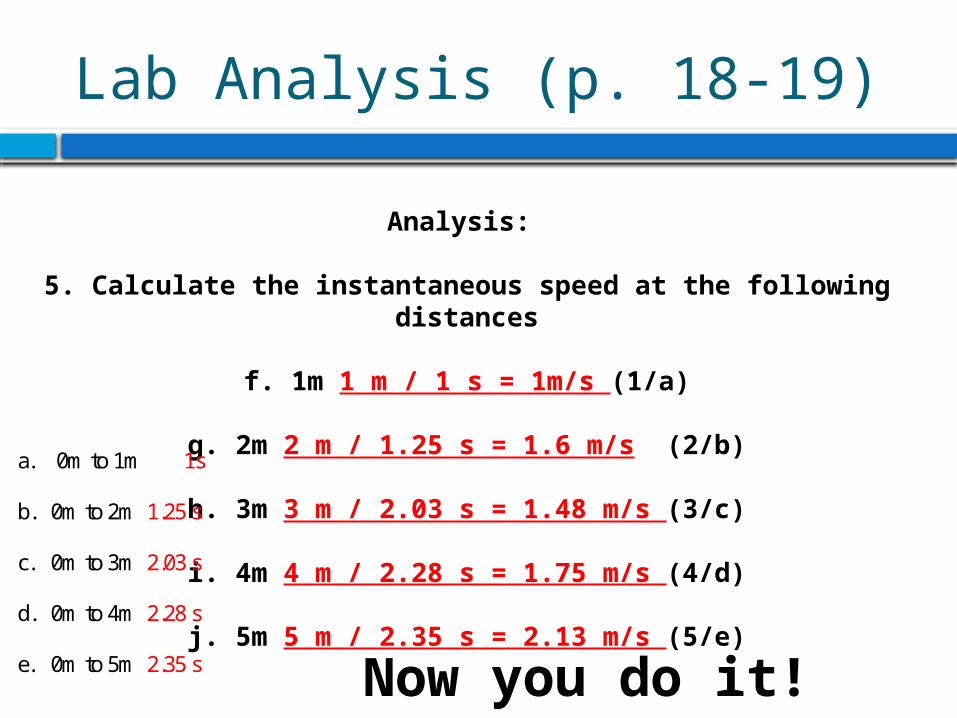
5. Calculate the instantaneous speed at the following distances
f. 1m 1 m / 1 s = 1m/s (1/a)
g. 2m 2 m / 1.25 s = 1.6 m/s (2/b)
h. 3m 3 m / 2.03 s = 1.48 m/s (3/c)
i. 4m 4 m / 2.28 s = 1.75 m/s (4/d)
j. 5m 5 m / 2.35 s = 2.13 m/s (5/e)
a. 0m to 1m 1s b. 0m to 2m 1.25 s
c. 0m to 3m 2.03 s
d. 0m to 4m 2.28 s
e. 0m to 5m 2.35 s Now you do it!
Lab Analysis (p.19)
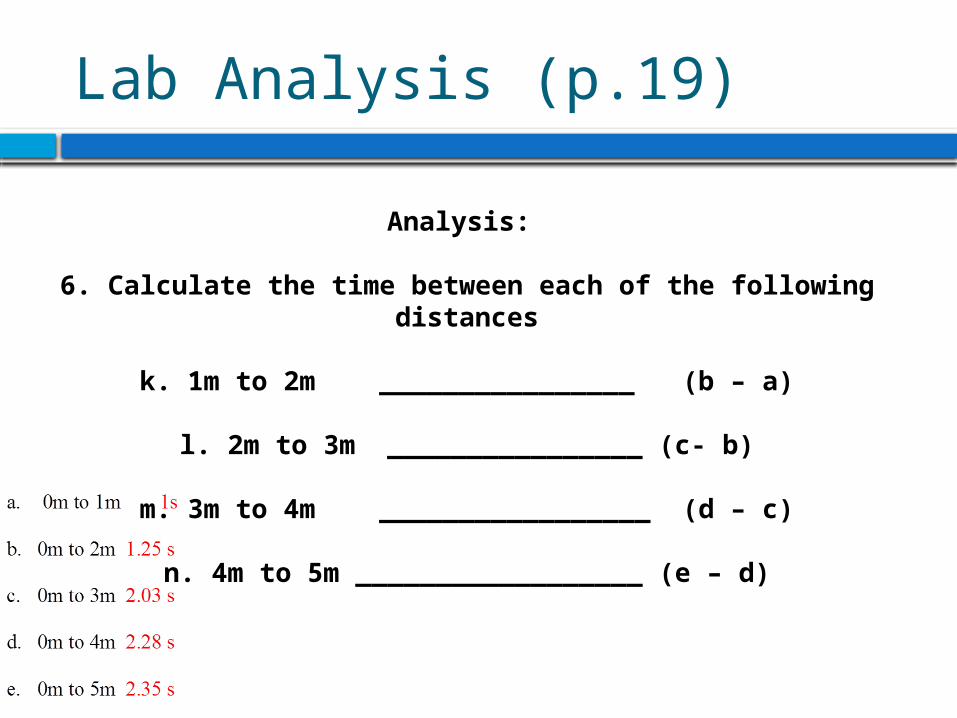
Analysis:
6. Calculate the time between each of the following distances
k. 1m to 2m ________________ (b – a)
l. 2m to 3m ________________ (c- b)
m. 3m to 4m _________________ (d – c)
n. 4m to 5m __________________ (e – d)

Lab Analysis (p.19)
Analysis:
6. Calculate the time between each of the following distances
k. 1m to 2m 1.25 – 1.00 = 0.25s (b – a)
l. 2m to 3m 2.03 – 1.25 = .78s (c- b)
m. 3m to 4m 2.28 – 2.03 = .25 s (d – c)
n. 4m to 5m 2.35 – 2.28 s = .07 s (e – d)
Now you do it!
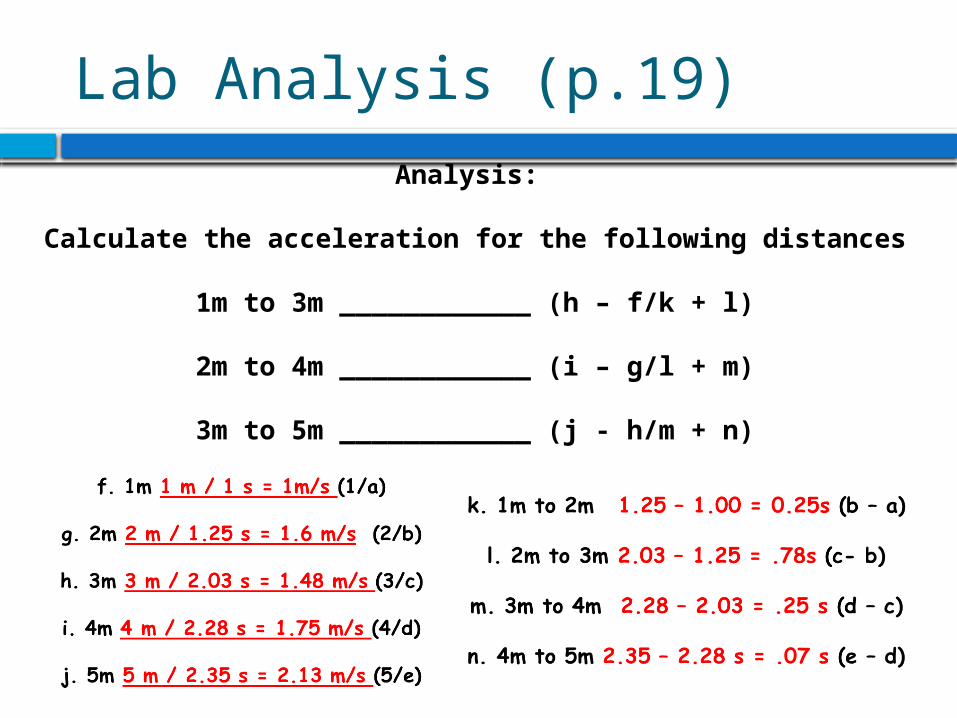
Lab Analysis (p.19)Analysis:
Calculate the acceleration for the following distances
1m to 3m ____________ (h – f/k + l)
2m to 4m ____________ (i – g/l + m)
3m to 5m ____________ (j - h/m + n)
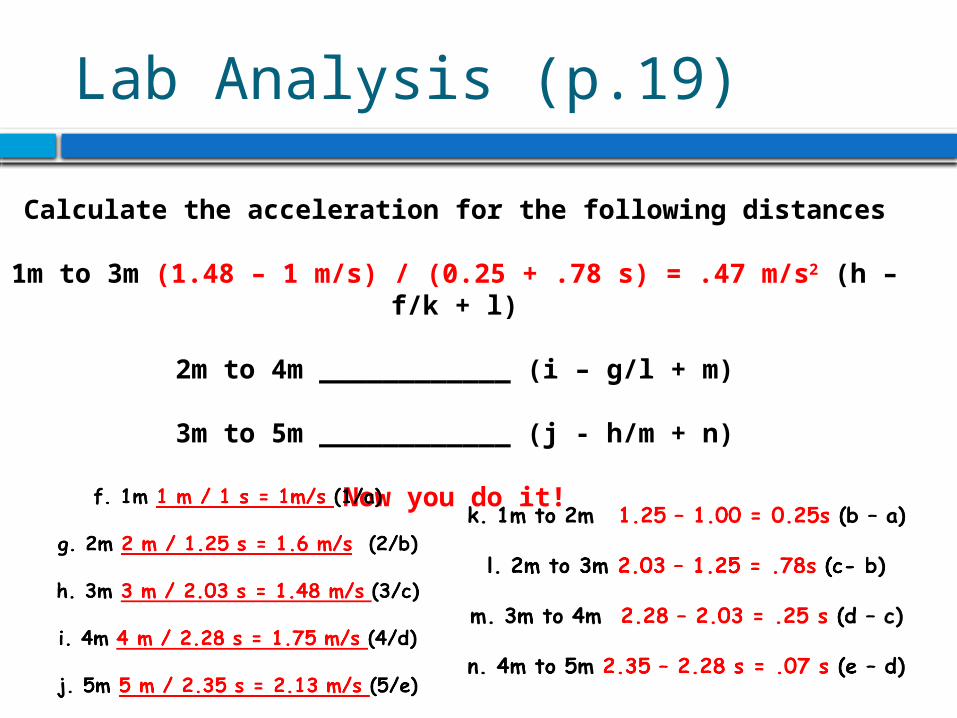
Lab Analysis (p.19)
Calculate the acceleration for the following distances
1m to 3m (1.48 – 1 m/s) / (0.25 + .78 s) = .47 m/s2 (h – f/k +
l)
2m to 4m ____________ (i – g/l + m)
3m to 5m ____________ (j - h/m + n)
Now you do it!

Solving Kinematics Problems
Step 1: Read the Problem, underline key quantitiesStep 2: Assign key quantities a variableStep 3: Identify the missing variableStep 4: Choose the pertinent equation:Step 5: Solve for the missing variable.Step 6: Substitute and solve.
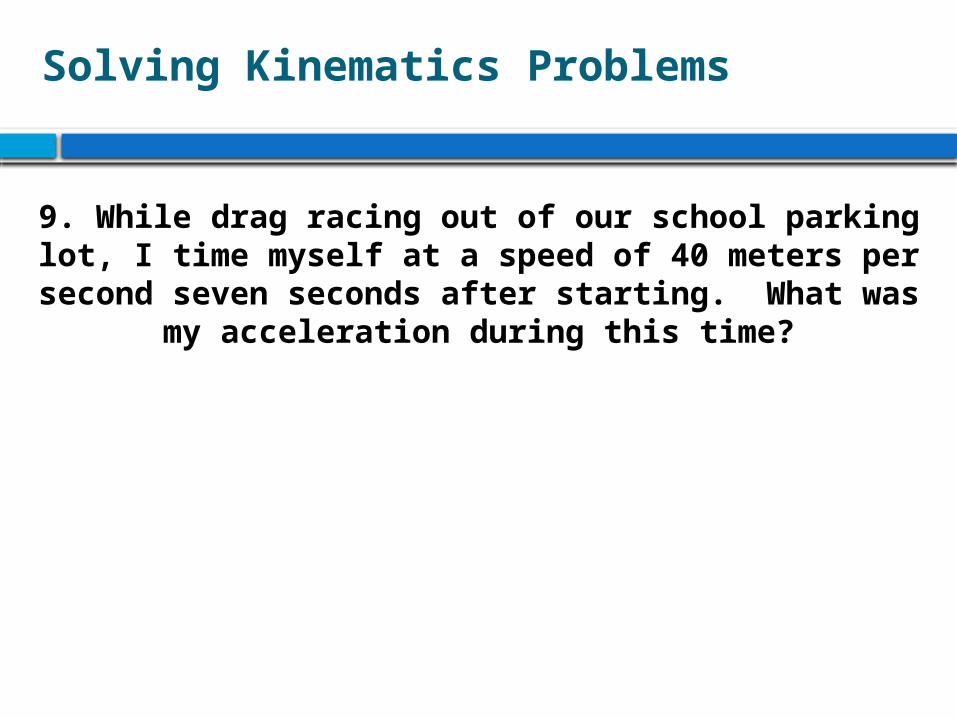
Solving Kinematics Problems
9. While drag racing out of our school parking lot, I time myself at a speed of 40 meters per second
seven seconds after starting. What was my acceleration during this time?

Solving Kinematics Problems
9. While drag racing out of our school parking lot, I time myself at a speed of 40 meters per second
seven seconds after starting. What was my acceleration during this time?
Step 1: Read the Problem, underline key quantities

Solving Kinematics Problems
9. While drag racing out of our school parking lot, I time myself at a speed of 40 meters per second
seven seconds after starting. What was my acceleration during this time?
Step 1: Read the Problem, underline key quantities

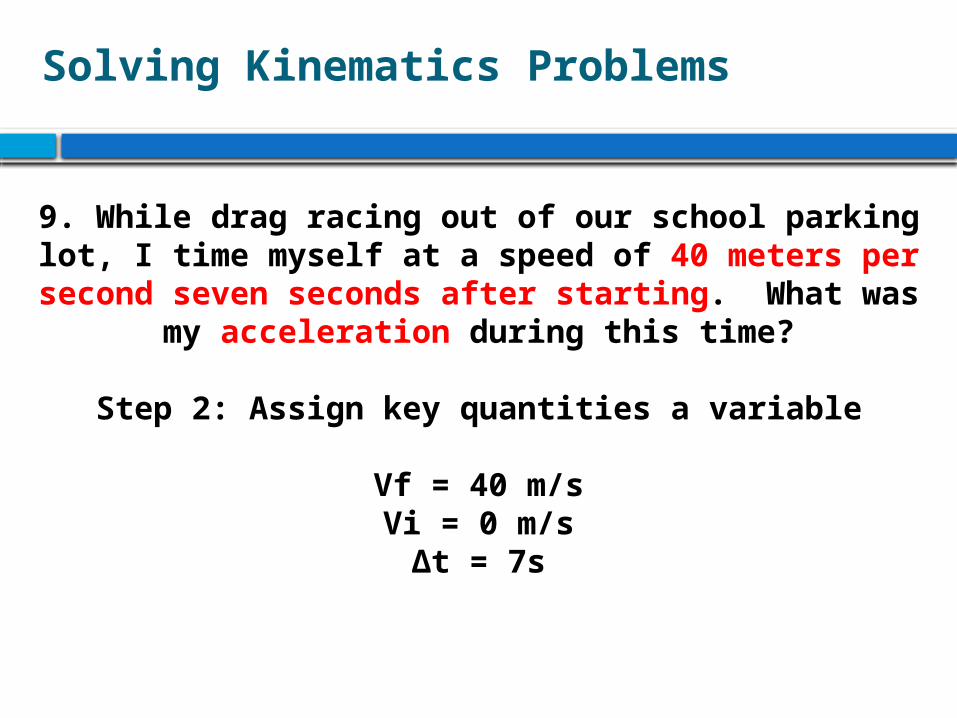
Solving Kinematics Problems
9. While drag racing out of our school parking lot, I time myself at a speed of 40 meters per second
seven seconds after starting. What was my acceleration during this time?
Step 2: Assign key quantities a variable
Solving Kinematics Problems
9. While drag racing out of our school parking lot, I time myself at a speed of 40 meters per second
seven seconds after starting. What was my acceleration during this time?
Step 2: Assign key quantities a variable
Vf = 40 m/sVi = 0 m/s
Δt = 7s
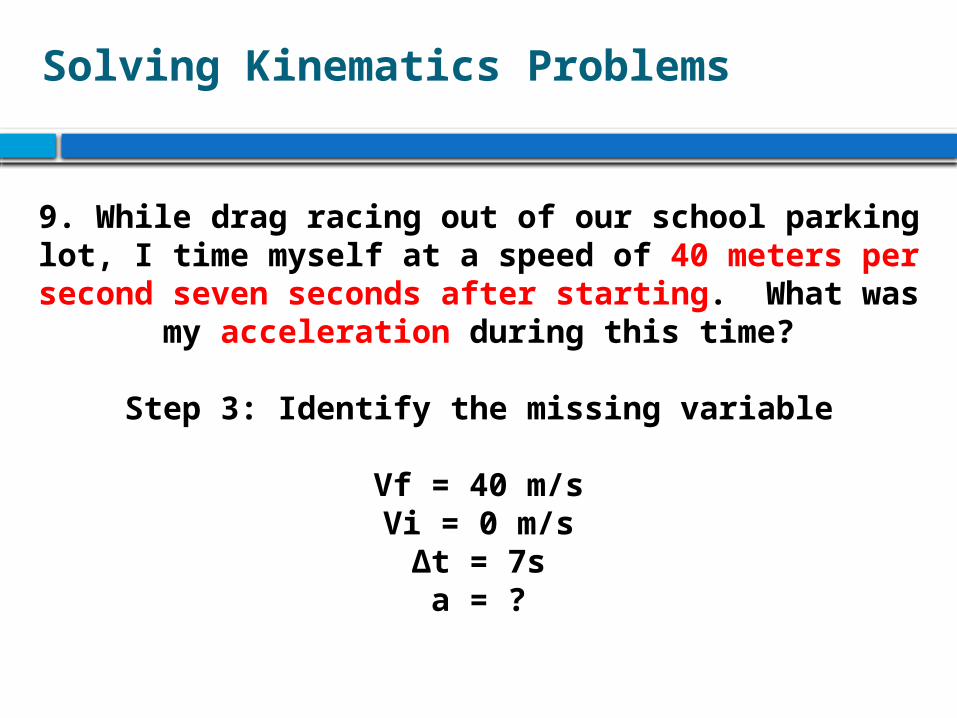
Solving Kinematics Problems
9. While drag racing out of our school parking lot, I time myself at a speed of 40 meters per second
seven seconds after starting. What was my acceleration during this time?
Step 3: Identify the missing variable
Vf = 40 m/sVi = 0 m/s
Δt = 7sa = ?
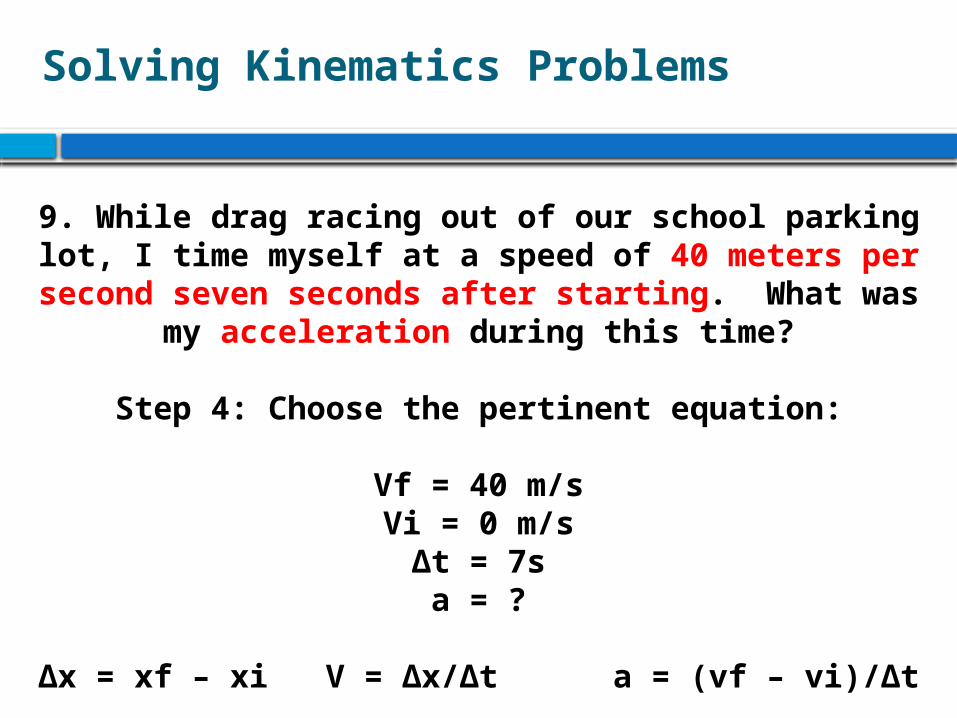
Solving Kinematics Problems
9. While drag racing out of our school parking lot, I time myself at a speed of 40 meters per second
seven seconds after starting. What was my acceleration during this time?
Step 4: Choose the pertinent equation:
Vf = 40 m/sVi = 0 m/s
Δt = 7sa = ?
Δx = xf – xi V = Δx/Δt a = (vf – vi)/Δt
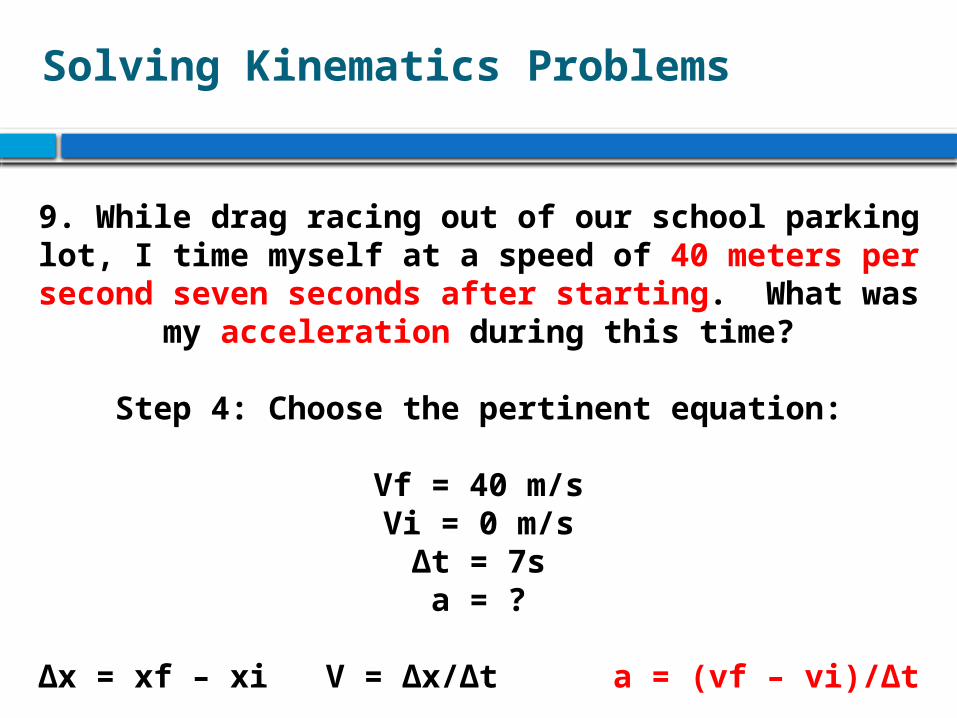

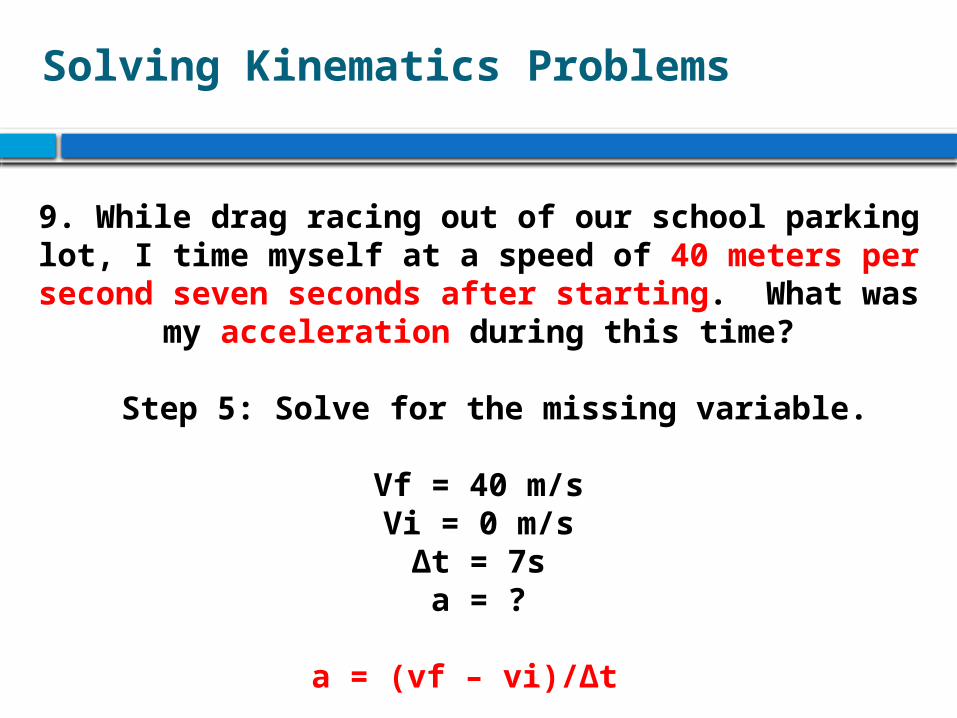
Solving Kinematics Problems
9. While drag racing out of our school parking lot, I time myself at a speed of 40 meters per second
seven seconds after starting. What was my acceleration during this time?
Step 5: Solve for the missing variable.
Vf = 40 m/sVi = 0 m/s
Δt = 7sa = ?
a = (vf – vi)/Δt

Solving Kinematics Problems
9. While drag racing out of our school parking lot, I time myself at a speed of 40 meters per second
seven seconds after starting. What was my acceleration during this time?
Step 6: Substitute and solve.
Vf = 40 m/sVi = 0 m/s
Δt = 7sa = ?
a = (vf – vi)/Δt
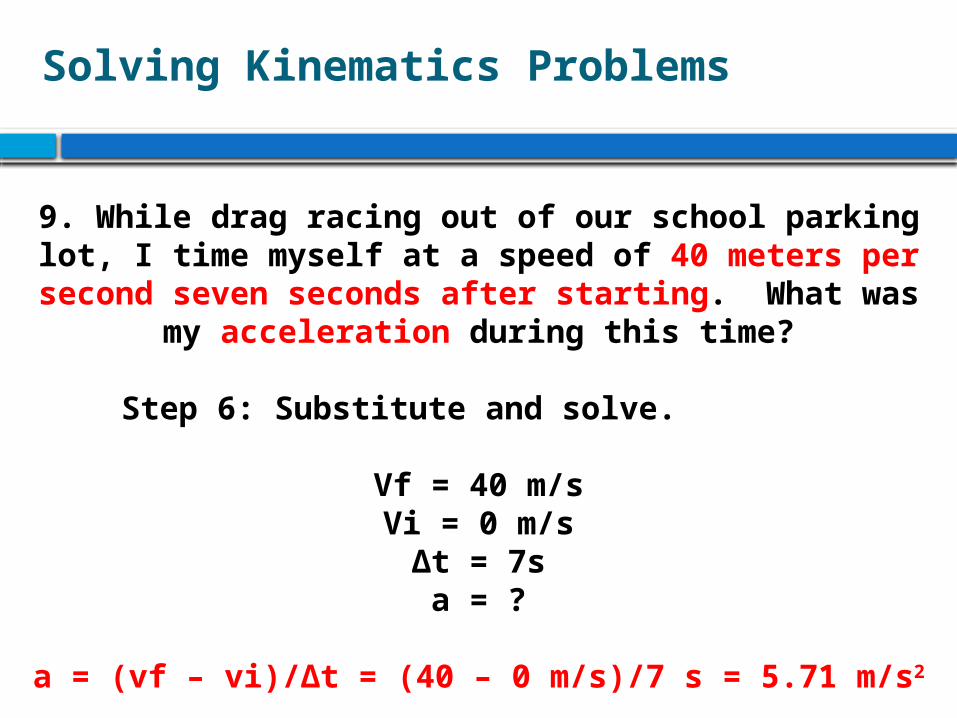
Solving Kinematics Problems
9. While drag racing out of our school parking lot, I time myself at a speed of 40 meters per second
seven seconds after starting. What was my acceleration during this time?
Step 6: Substitute and solve.
Vf = 40 m/sVi = 0 m/s
Δt = 7sa = ?
a = (vf – vi)/Δt = (40 – 0 m/s)/7 s = 5.71 m/s2
Solving Kinematics Problems
9. While drag racing out of our school parking lot, I time myself at a speed of 40 meters per second
seven seconds after starting. What was my acceleration during this time?
Step 5: Solve for the missing variable.
Vf = 40 m/sVi = 0 m/s
Δt = 7sa = ?
a = (vf – vi)/Δt

Solving Kinematics Problems
9. While drag racing out of our school parking lot, I time myself at a speed of 40 meters per second
seven seconds after starting. What was my acceleration during this time?
Step 5: Solve for the missing variable.
Vf = 40 m/sVi = 0 m/s
Δt = 7sa = ?
a = (vf – vi)/Δt
Solving Kinematics Problems
Step 1: Read the Problem, underline key quantitiesStep 2: Assign key quantities a variableStep 3: Identify the missing variableStep 4: Choose the pertinent equation:Step 5: Solve for the missing variable.Step 6: Substitute and solve.

Solving Kinematics Problems
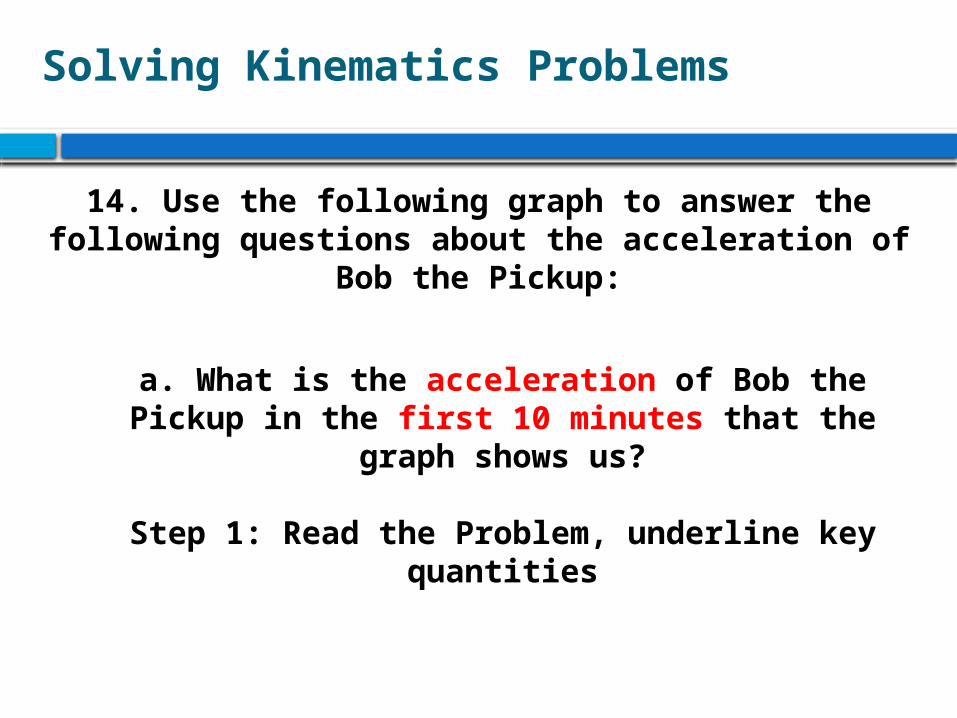
14. Use the following graph to answer the following questions about the acceleration of Bob
the Pickup:
a. What is the acceleration of Bob the Pickup in the first 10 minutes that the graph shows
us?
0 10 20 30 40 50 600
500
1000
1500
2000
2500
3000
Velocity of Bob the Pickup
Time (minutes)
Velo
cit
y (
feet/
min
ute
)
Solving Kinematics Problems
14. Use the following graph to answer the following questions about the acceleration of Bob
the Pickup:
a. What is the acceleration of Bob the Pickup in the first 10 minutes that the graph shows
us?
Step 1: Read the Problem, underline key quantities

Classwork for 10/17 (p. 13)
Example 1: Growth Table
Growth of Plant (cm) Time (days)
1.0 `1 1.0 2 1.0 3 1.0 4 0.9 5 1.0 6 0.3 7 0.2 8 0.3 9 0.3 10 1.0 11 1.0 12
What do you expect the data table earned (out of 3)? Why?
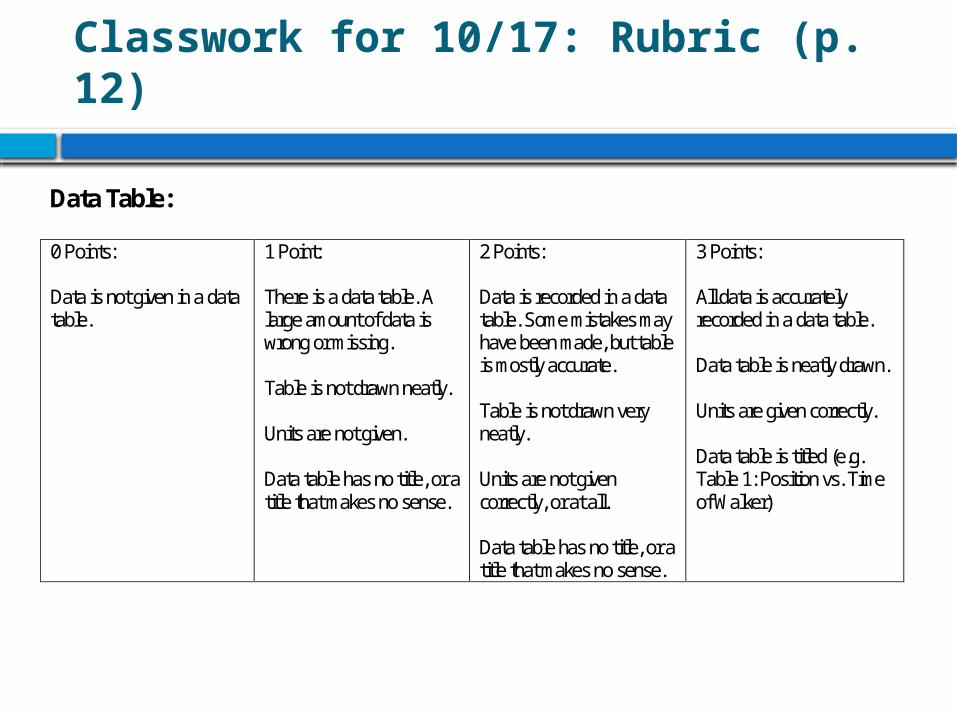
Classwork for 10/17: Rubric (p. 12)
Data Table: 0 Points: Data is not given in a data table.
1 Point: There is a data table. A large amount of data is wrong or missing. Table is not drawn neatly. Units are not given. Data table has no title, or a title that makes no sense.
2 Points: Data is recorded in a data table. Some mistakes may have been made, but table is mostly accurate. Table is not drawn very neatly. Units are not given correctly, or at all. Data table has no title, or a title that makes no sense.
3 Points: All data is accurately recorded in a data table. Data table is neatly drawn. Units are given correctly. Data table is titled (e.g. Table 1: Position vs. Time of Walker)

Classwork for 10/17 (p. 13)
Example 1: Growth Table
Growth of Plant (cm) Time (days)
1.0 `1 1.0 2 1.0 3 1.0 4 0.9 5 1.0 6 0.3 7 0.2 8 0.3 9 0.3 10 1.0 11 1.0 12
What do you expect the data table earned (out of 3)? Why? 3/3, because it is complete, neatly drawn, has correct units, and has a title

Classwork for 10/17: (p. 14)
The growth of the plant each day is recorded in Table 1. As Figure 1 shows, growth was fairly constant from days 1 through six. On day 7, the growth of the plant fell markedly, and then rose back to its earlier value on day 11. What do you expect the graph earned (out of 3)? Why? What do you expect the text earned (out of 3)? Why?
Figure 1: Growth of Plant vs. Time
0
0.2
0.4
0.6
0.8
1
1.2
1 2 3 4 5 6 7 8 9 10 11 12
Time (days)
Gro
wth
(cm
)

Classwork for 10/17: Rubric (p. 12)
Graph: 0 Points: Data is not graphed.
1 Point: There is a graph, but the data is mostly plotted incorrectly, or mostly missing. Axes may be backwards. Graph is very sloppy. Axes are too big or too small—graph is too “zoomed out” or too “zoomed in”. Axes are unlabeled. Graph has no title, or title doesn’t make sense.
2 Points: Data is plotted on a graph, but a few mistakes have been made. Axes may be backwards. Graph is a little sloppy. Axes are too big or too small—graph is too “zoomed out” or too “zoomed in”. Axes are labeled, but without units. Graph has no title, or the title doesn’t make sense.
3 Points: All pertinent data is correctly plotted in a graph. Axes are correct. Graph is neatly drawn. Axes are sized to show all data without being too “zoomed out” Axes are labeled, with units. Graph is titled (e.g. Figure 1: Position vs. Time of Walker)

Classwork for 10/17: (p. 14)
The growth of the plant each day is recorded in Table 1. As Figure 1 shows, growth was fairly constant from days 1 through six. On day 7, the growth of the plant fell markedly, and then rose back to its earlier value on day 11. What do you expect the graph earned (out of 3)? Why? 3/3, Graph is titled, neat, axes are labeled, and all pertinent data is there. What do you expect the text earned (out of 3)? Why? 3/3, professional tone, mentions title, clear language, measures important features (change in growth rate)
Figure 1: Growth of Plant vs. Time
0
0.2
0.4
0.6
0.8
1
1.2
1 2 3 4 5 6 7 8 9 10 11 12
Time (days)
Gro
wth
(cm
)

Group Work
Grade the Results Sections on pages 15-16

Independent Work
Grade the Results Sections on pages 16-17