Embed Size (px)
Citation preview
CLOSING THE GENDER PROFIT GAP ? *
CATIA BATISTA† SANDRA SEQUEIRA‡ PEDRO C. VICENTE§
October 2, 2021
Abstract
We examine the impact of providing access to mobile savings accounts and improving financial management skills on the performance of female-led microenterprises in Mozam-bique. We find evidence that both interventions can improve business performance but the effects are highly heterogeneous. Combining both types of support is associated with a large increase in both short and long-term firm profits and in financial security for the microen-trepreneur. This allowed female-headed microenterprises, particularly those with a higher baseline level of profits, to close the gender profit gap in performance and skills relative to their male counterparts. The main drivers of improved business performance are improved financial management practices (bookkeeping), an increase in accessible savings, and re-duced transfers to friends and relatives. For female entrepreneurs with intermediate levels of profits at baseline, even just providing access to mobile money accounts can increase long-term profits and for the most disadvantaged microentrepreneurs it can at least in-crease levels of financial security. Uncovering this heterogeneity in impact within different types of female-led microenterprises can help improve the targeting of these interventions in the future.
Keywords: Microenterprise development, management, gender, mobile money, financial literacy, economic development.
*We thank Rute Caeiro, Matilde Gracio, Alberto Cruz, Marta Costa and Mattia Fracchia for superb researchassistance and fieldwork m anagement. We also thank Virginia Minni, Sacha Dray, Matthew O’Brien and Michelle Rao for excellent research assistance. We gratefully acknowledge funding from USAID-Development Innovation Ventures and the International Growth Centre.
†Nova School of Business and Economics, IZA, NOVAFRICA. Email: [email protected] ‡London School of Economics, CEPR, NOVAFRICA. Email: [email protected]§Nova School of Business and Economics, BREAD and NOVAFRICA. Email: [email protected]
1 Introduction
Over 50% of the urban poor are currently engaged in some form of micro, non-agricultural busi-
ness.1 A striking fact about self-employment, particularly in the developing world, is the persis-
tence of a substantial business performance gap between male and female microentrepreneurs
(Nix et al, 2015; Hardy and Kagy, 2018). In fact, female-led businesses often report less than half
of male-led business profits (Kalleberg and Leicht, 1991; Bird and Sapp, 2004; Doering and The-
baud, 2017), even when operating in similar sectors as their male counterparts (Hardy and Kagy,
2018). While there might be several drivers of this gender profit gap, this paper focusses on two
key supply-side constraints to business performance that have been identified in the literature
as being particularly binding for female microentrepreneurs: limited access to capital (Bruhn
and Love, 2009; Collins et al, 2009; de Mel et al, 2010) and lack of exposure to financial manage-
ment know how (Rosenthal and Strange, 2012; Field et al, 2016; McKenzie and Woodruff, 2017;
McKenzie, 2020).
A potential strategy for female microentrepreneurs to overcome capital constraints is to
save. Increasing savings can allow them to optimize their cash flows, build long-term finan-
cial and business assets (Ashraf et al, 2005; Collins et al, 2009) and, consequently, improve the
performance of their businesses. Female vendors may, however, face binding constraints in ac-
cessing savings products in the formal banking sector due to a higher opportunity cost of time,
restricted mobility and lower levels of financial literacy to interact with the banking system.
Given exponential rates of cell phone adoption in the developing world, mobile technology
can potentially transform how households and enterprises, particularly female-led microen-
terprises, access savings tools and manage their finances (Jack and Suri, 2014).2 And yet, the
impact of the technology on microenterprise performance is theoretically ambiguous. Mobile
money can facilitate payments to suppliers and payments from clients by enabling low-cost
1The ILO estimates that 78% of the world’s poor living in low-income countries is currently self-employed (ILO2017).
2In our setting in Mozambique, there are over five million cell phone subscribers (close to one fourth of thepopulation), and the geographic coverage of existing cell operators extends to almost 80% of the country.
1

payment services over easily accessible cell phones (Plyer et al, 2010), and it can also enable
savings that help microenterprises smooth investment, accumulate long-term assets and in-
crease profits (Collins et al, 2009; Jack and Suri, 2014; Mbiti and Weil, 2016).3 On the other
hand, mobile money can reduce the cost of these savings being dissipated in the form of trans-
fers to family or other non-income generating types of consumption. Both of these effects can
be exacerbated for female microentrepreneurs who tend to lack access to traditional banking
and who may be more heavily taxed by their relatives, or even by their husbands (Fafchamps et
al, 2014, Bernhardt et al., 2019 and Solene et Ng, 2020). While the effect of mobile money on
household savings has been documented in the literature4, its impact on business savings has
received far less attention.
Lack of financial management skills can also compromise female-led microenterprises’ growth
through several channels.5 It can reduce savings, investment, prevent the introduction of new
products, the management of inventories and the optimization of cash flows. Financial man-
agement skills can also improve the forecasting of revenue, expenditures and profit through
improved bookkeeping practices. But the evidence on the impact of financial literacy and busi-
ness management training interventions on microenterprise performance has shown some-
times positive (Klinger and Schuelden, 2011; Blattman et al., 2016; Bloom et al, 2010; Field et
al., 2016; McKenzie and Puerto, 2020) and sometimes negative or zero effects (Karlan and Val-
divia, 2010; Drexler et al., 2014; Fiala, 2018).
One potential reason for these mixed results is that releasing just one of these constraints
may not be enough to improve business performance. Increasing profits and financial security
may require both the tools to save and the know how to best manage these savings and invest
3Evidence from Mbiti and Weil (2016) and Jack and Suri (2014) suggests that mobile money is associatedwith an increase in formal savings of households by reducing the cost of safely storing money and reducing over-reliance on other less efficient forms of informal savings.
4Recent evidence suggests that accessing financial resources through individual mobile accounts can helpincrease household savings (Suri and Jack, 2016; Riley, 2020) as it provides women with more control over theirfinances.
5Female microentrepreneurs often have less exposure to good management practices, fewer business net-works and business role models, and more limited levels of formal education (Bruhn and Love, 2009; Collins et al,2009; de Mel et al, 2010; Rosenthal and Strange, 2012).
2
for future business growth.
This paper tests this complementarity hypothesis through a three-arm field experiment in-
volving 1,270 microentrepreneurs operating in formal urban markets in Mozambique.6 Moti-
vated by the potential importance of accessible savings as a strategy to overcome capital con-
straints, one of our treatment arms provides access to a mobile money account with a tempo-
rary but high-powered incentive to save.7
A second treatment arm in our study tests the impact of providing business management
training, with a particular emphasis on separating household and business accounts, on cash
flow management, bookkeeping and on the implications of transfers to relatives. This training
course was delivered across four one-hour in-person training modules, and it followed a stan-
dard rules of thumb approach (Drexler et al, 2010), drawing on visual illustrations and examples
from everyday market situations to ensure that participants understood how to apply the train-
ing to their day-to-day business activities.8 The third treatment arm combines both treatments
to test for complementarity.
To understand the differential effect of the treatments on female-led microenterprises we
stratified our sample by the gender of the microentrepreneur. This design allows us to: i) docu-
ment the profitability gap between male and female microentrepreneurs at baseline; ii) exam-
ine the differential impact of our interventions on each group9; and iii) examine whether the
interventions can affect the profitability gap by comparing the differences in performance be-
tween female microentrepreneurs in the treatment groups and male microentrepreneurs in the
control group at the end of the study. This will enable us to document whether the interven-
tions levelled the playing field between female and male microentrepreneurs. We measure the
6The sector breakdown is food retail (55%), nonfood retail (clothes, household items, 31%) and services(restaurants, 14%).
7Participants earned a bonus equivalent to 5% of their average monthly mobile savings for the three monthsthat followed the opening of their accounts.
8This intervention also provided a manual and a comic book illustrating the main concepts taught for futurereference.
9Despite an initial female disadvantage, it is unclear which group is more likely to have the highest returnsto our interventions. Female-led microenterprises may be farther from the productivity frontier, but their malecounterparts may be better placed to take advantage of both interventions due to improved client and suppliernetworks, or higher initial levels of capital and savings.
3

impact of the interventions on profits and on financial security through an in-person survey 12
months after the intervention, and a phone survey 6 years later.
While the literature has tested these interventions independently, to the best of our knowl-
edge, this is the first paper to test for complementarity in a unified setting. It is also the first
paper to compare the impact of these interventions in a stratified sample of male and female
microentrepreneurs operating in the same markets.
We find that twelve months following the interventions, the combined treatment is the only
one that led to a significant increase in profits for female microentrepreneurs. Both the com-
bined treatment and the mobile money treatment are, however, also associated with higher
levels of household financial security (a 7% increase relative to the control mean). This is mea-
sured through an index capturing whether in the previous 12 months, anyone in the house-
hold went without food and if the microentrepreneur was able to pay for children’s schooling
expenses. The impact of mobile money on financial security is driven primarily by female mi-
croentrepreneurs with the lowest level of profits at baseline. The effect on profits persists and
grows in the following 5 years, representing a doubling of profits for the combined treatment
group relative to the control, particularly for female microentrepreneurs in the right tail of the
baseline profit distribution. In the long-run, the mobile money treatment also increased firm
profits, but mostly for female micro-entrepreneurs who started off with intermediate levels of
profits at baseline. The financial management on its own appears to have had no significant
impact on business performance in either the short or long-run.
The key mechanisms behind these treatment effects were a sustained improvement in fi-
nancial management knowledge and practices such as bookkeeping, lower remittances10, and
higher savings in more liquid and potentially safer mobile money accounts. For those in the
mobile money treatment alone it is possible that the mobile money accounts also provided
some means to better track finances (eg: savings). This is consistent with our finding that the
share of transactions representing balance checks is higher in this group by at least a factor of
10Our baseline survey revealed that there is limited perceived reciprocity with regards to family transfers so ourdocumented transfers are unlikely to be a form of social insurance.
4
2 relative to the other experimental groups.11 Mobile money accounts were used primarily to
store money and make remote payments to an electricity company, as opposed to making pay-
ments to suppliers (wholesalers) or receiving payments from clients. Ensuring timely payments
of electricity is key for the day-to-day operations of these businesses. Mobile money also ap-
pears to have enabled female micro-entrepreneurs to better track their finances: they are more
likely to check their mobile account balances more frequently relative to any other experimen-
tal group.
Male microentrepreneurs learn from our financial management training programme and
they improve their bookkeeping practices. They also take up the mobile money service but they
are less likely to report replacing traditional bank savings with mobile money savings. Despite
these positive effects associated with the interventions, we observe no real changes in profits or
financial security suggesting that our interventions did not address the binding constraints to
the growth of male-led microenterprises, which started off with higher profits relative to female-
led microenterprises.
These findings shed light on an important complementarity between providing female-led
microenterprises with the enabling technology to build their savings, while at the same time
providing financial management skills with a special focus on how these savings can be ap-
plied to maximize business returns. When targeted to female microentrepreneurs, these in-
terventions can help close the gap in knowledge and business performance relative to their
male counterparts. But they also show that particularly for female entrepreneurs with smaller
businesses and lower profits to begin with, even just providing access to mobile savings can
improve medium-run financial security, and for female microentrepreneurs with intermediate
levels of profits at baseline, the savings technology is a sufficient condition for an increase in
profits. This heterogeneity in findings underscores the importance of targeting specific types of
microentrepreneurs with different interventions in order to maximize their returns.
Our findings contribute to several literatures. First, our work complements a growing litera-
11We do not find any changes in expectations and beliefs about the future performance of the businesses sug-gesting that an increase in confidence or optimism imparted by our training is unlikely to be driving our results.
5

ture on the importance of savings for business growth. Most interventions that have attempted
to improve savings behavior independently have achieved mixed results (Dupas and Robinson,
2013; Dupas et al, 2016; Dupas et al, 2018; Fox and Thomas, 2016; Brooks et al, 2018; Schaner,
2018; Riley, 2020). At the same time, experimental studies have documented zero returns to cap-
ital for female-led microenterprises (De Mel, McKenzie and Woodruff, 2008, 2009b; Fafchamps
et al., 2014) so releasing the capital constraint alone via savings or cash transfers may not always
suffice. Our results suggest that access to mobile individual saving accounts with short-run high
powered incentives to save can have a sizable effect on profits in the long-run, particularly when
combined with improved business management practices, in order for microentrepreneurs to
make the best possible use of these resources.
Second, we add to a literature on the importance of access to mobile technology in the de-
veloping world. We provide new evidence on how mobile savings accounts can drive business
performance particularly for microenterprises with intermediate levels of capital, complement-
ing results from studies that have documented the impact of mobile money on household fi-
nance, remittances, internal migration and educational and agricultural investment (Jack and
Suri, 2014; Jack and Habyarimana, 2018; Batista and Vicente, 2017, 2018, 2020). This is likely to
be driven by the fact that this form of savings is both liquid and safe (Riley, 2020).
Third, we contribute to the literature on the role of financial management capabilities on
microenterprise growth. The evidence on the effectiveness of business training programmes
is mixed (Karlan, Knight, and Udry, 2015; Bruhn, Karlan, and Schoar, 2018; McKenzie, 2020;
Horn et al, 2020). Our findings suggest that imparting financial management skills to female
microentrepreneurs can help close the gender profit gap, but only when coupled with the tools
that enable microentrepreneurs to put such learnings into practice and invest towards business
growth (McKenzie and Woodruff, 2017). Moreover, our findings are consistent with the impor-
tance of a rules of thumb approach to teaching financial management (Drexler et al, 2014; Ar-
raiz et al, 2019). We further highlight the channels for improved performance such as improved
bookkeeping and reduced transfers to relatives.
6
We also contribute descriptively to the literature on the impact of transfers to relatives on
microenterprise performance. In particular, we document low expectations about the reci-
procity associated with these transfers and how business training can curb contributions to
this “family tax”.
The paper proceeds as follows: in section 2 we describe the setting of our experiment; sec-
tion 3 presents the empirical analysis while section 4 discusses how the interventions helped
close the performance gap between male and female-led microenterprises. Section 5 con-
cludes.
2 Empirical Setting
2.1 Study Location, Population and Sampling
Our sample of 1,270 market vendors was drawn from 23 urban markets in the greater Maputo
area, the Mozambican capital.12 All markets had relatively good accessibility and proximity to
both residential and industrial areas, so lack of access to wholesale markets and to centres of
demand do not represent significant constraints to business in our setting. Vendors can operate
their businesses as a stall or as a store13, both of which have a fixed location in the market and
are traditionally engaged in general retail activities (selling produce, food or general groceries)
or services (sewing, shoemaking and restaurants).14
We stratified our sample based on the gender of the participant and on the type of estab-
lishment (stall vs store). Our sample was then randomly assigned to four experimental groups,
within each stratum.
12Greater Maputo has 120 markets located in low-income neighborhoods, where they are the primary hubs ofeconomic activity. Our analysis is restricted to formal vendors, which we classify as having paid an annual fee tooperate within the area that they are assigned to in the market.
13See Appendix Figure 3.14We first drew detailed maps of each market with the location of each block of stalls/stores. We then split
the market area into quarters and surveyors would randomly identify participants alternating between rows ofstalls/stores within each quarter of the market, so that all participants would have at least one aisle of stores be-tween them as a buffer area. In most markets the distance was significantly larger than just one aisle.
7
2.2 Interventions
Mobile Money: We took advantage of the early stages of the roll-out of mobile money by Mozam-
bique’s largest cell operator to generate exogenous variation in access to mobile money. We
opened a mobile money account and enrolled all the participants in this treatment arm in an
incentive scheme for savings that provided a bonus corresponding to 5% of the average amount
of savings kept in the mobile account (Schaner, 2018).15 This bonus was restricted to the first 3
months from account opening.16
Financial Management Training: The aim of the financial management training was to
introduce vendors to basic concepts of financial management and bookkeeping. It was con-
ducted during four one-hour visits, during work time but off-peak hours, with visits spaced
four weeks apart. The training took place at the establishment, and the training staff ensured
that the opportunity cost of the training was low by allowing respondents to interrupt and con-
tinue to interact with clients. The first session focussed on the difference between business
costs and household expenditures, revenue and profit, the importance of savings and invest-
ment and how to deal with requests for transfers from relatives and friends. The second session
discussed the theory and practice of how to prepare a budget and the importance of bookkeep-
ing. All participants received three different books to record inventories for the main products,
sales on credit and the basic components of a budget (total expenditures and total sales). The
last two sessions revisited the materials covered in previous sessions and clarified any ques-
tions. All participants received a manual with the core teachings as consultation material and
we designed and distributed a comic book written in colloquial Portuguese embedding the core
learnings into everyday scenes in the market, drawn by a local Mozambican artist.17
During each visit, enumerators checked the books to see if they were being adequately filled
15The vendors in this experimental group received a leaflet explaining the bonus: they would receive 5 meticais(0.2 cents at the 2014 exchange rate) for each 100 meticais (4 USD) they kept in their accounts for an entire month.
16All the participants received basic training on how to use their mobile money accounts. Our trainers trans-ferred a small amount of 50 meticais (2 USD) for them to practice how to receive and access funds in their account.Beneficiaries also learned the location of the mobile money agent in the market, where they could make cash-insand cash-outs from their accounts.
17Berg and Zia (2013) find that story-telling can be an effective way of teaching about debt management.
8
in. By the end of the fourth visit, we provided 150 meticais (equivalent to 6 USD or 0.5% of
average monthly revenue) if the books were filled in correctly and 75 meticais (equivalent to 3
USD) if the books were in the business but incomplete. This financial management training
followed a “rules of thumb” approach to teaching concepts (Drexler et al, 2014; Arraiz et al.,
2019), and relied heavily on teaching by analogy and by way of examples from everyday life in
the markets.18
Combined Treatment: Participants received both the financial management training and
the mobile money treatments at the same time.
2.3 Data
To examine treatment effects we rely on a combination of survey and transaction-level data
from the mobile money operator. The baseline and the first endline surveys were conducted 12
months apart (in July 2014 and July 2015), face-to-face. The final endline survey was conducted
over the phone six years after the baseline in 2020.
Administrative data on mobile money transactions were collected between 2014-2018, and
included all transactions and average balances kept in the mobile accounts for all groups.19 The
treatment groups are balanced across treatment and control, and across survey waves, despite
significant attrition in the final endline survey.20
The majority of businesses (89%) are owner-managed and the average age of businesses is
approximately 10 years. Most businesses keep inventory that would allow them to continue
selling for on average 20 days and the main types of investments microentrepreneurs have en-
gaged in during the preceding six months is the introduction of new products. This is also the
18For a detailed description of the training materials see Appendix Figures 7 through 14.19We obtained the mobile phone numbers associated with the mobile money accounts of all participants at
baseline, and we repeated this exercise in the endline survey (including the control group).20Tables A1 and A2 in the Appendix show balance across comparison groups for both endline samples in 2015
and in 2020. Tables A4 and A5 show that attrition at both of the two endlines, while particularly pronounced forthe 2020 endline survey, was fairly balanced. We control for any characteristics in which those who remain in thesample differ from those who don’t (eg; age of establishment, productive assets) in our main analysis. Firm survivalrates between baseline and endline were also similar across treatments for both genders as seen in Table A8.
9
stated preferred type of investment microentrepreneurs would like to engage in for the follow-
ing six months. Approximately half of the sample had previous business experience and the
majority of respondents funded their business with their own savings (75%), highlighting the
critical role of savings for capital investments.
At baseline, overall savings levels are similar between female and male microentrepreneurs:
men are more likely to have access to traditional banking but females are more likely to en-
gage in informal savings practices such as savings groups in the market. Despite comparability
in levels, keeping funds in savings groups is significantly more restrictive and less liquid than
keeping funds in traditional banking accounts. Female-managed businesses also started with
lower capital investments and they reported lower levels of investment in new products in the
preceding six months, as well as lower monthly expenditures and lower monthly sales.21
Levels of financial and numerical literacy differed significantly across female and male mi-
croentrepreneurs: women scored 4% lower in a simple applied arithmetic exercise that involved
calculating discounted prices in the marketplace and were 15% less likely to keep consistent
bookkeeping.
Female microentrepreneurs do not, however, appear to have different objectives for their
businesses or different levels of commitment: they report similar intentions to invest, similar
objectives for savings and are even more optimistic in terms of the future growth prospects of
their businesses than their male counterparts. When asked about their goals when saving, they
are just as likely to prioritize saving for their business over saving for their children’s education
or to cope with health shocks.22
21Tables A6 and A7 of the Appendix show further differences between female and male-owned microenterprisesat baseline.
22See Figure 4 in the Appendix.
10
3 Empirical Analysis
Given the stratified random assignment of our interventions, we can obtain unbiased estimates
of their effect by estimating the following equation for each subgroup of microentrepreneurs:
yEi =αi +β1Treatmenti +γXi +δyB
i +εi (1)
where yEi is the endline value of an outcome variable of interest (e.g. profit or financial se-
curity), i indexes microenterprises and αi denotes market fixed effects. Xi is a matrix of base-
line measured covariates including an indicator on whether the microentrepreneur operates
a stall or a store, the number of employees, baseline numerical literacy, an indicator captur-
ing familiarity with a cell phone, the age of the establishment, inventory size at baseline, the
entrepreneurs’ previous experience as a business owner, and whether the entrepreneur has
given/received a loan from a family member in the year prior to the intervention. The con-
trol group is the omitted category in all specifications. The baseline measure of the outcome
variable yBi explains a substantial share of the variance in outcomes across individuals and is
included in the specification.
3.1 Impact on Profits and Financial Security
Table 1 presents the effect of each intervention on profits, with Panel A representing the ef-
fects for female microentrepreneurs and Panel B the effect for male microentrepreneurs. We
find that 12 months following the interventions, female entrepreneurs in the combined treat-
ment experienced an increase in profits that is significant at the 10% level relative to the control
mean.23 One challenge with our data is that in 2015 we measure profits by asking respondents
about their total revenue and total expenses. However, the mean of profits in the control group
is negative, likely due to measurement error. This can result, for instance, from inconsistencies
23All variables are deflated to 2015 prices.
11
in the timing of investments (expenses) and revenues. The results are however unchanged in
Appendix Table A9 when we only consider microenterprises reporting higher levels of book-
keeping at baseline, suggesting that measurement error is likely to be similar across all groups.
In 2020, we ask directly about business profit, which had substantially less measurement er-
ror.24 Using this measure, we find that the positive effect on profit persists and, in fact, grows
with time. Six years after our intervention, we find that profits reported by the combined treat-
ment group have almost doubled relative to the control mean. While the overall attrition in our
sample for the 2020 phone survey was high, it was balanced across experimental groups, and
importantly, within each gender. Table 1 includes Lee bounds for each estimate to account for
attrition (Lee, 2004).
Female microentrepreneurs who received support to open a mobile money account only
do not show changes to profits in the short-run but they experienced a significant increase in
profits by 2020 that is comparable in magnitude to the effects of the combined treatment. As a
result, the test of the combined treatment having an effect that is greater than the independent
effect of each of the treatments is not statistically significant at conventional levels. We explore
further heterogeneity in section 4 to identify which sub-groups of female microentrepreneurs
benefited the most from each treatment.25
Column 5 examines the impact of the interventions on household-level financial security.
This is measured through an unweighted average of responses to whether all members of the
household had enough to eat in a given day and whether the microentrepreneur had been able
to pay for schooling expenses in the previous 12 months.26 We find that 6 years after the in-
tervention, both the combined and the mobile money treatments are associated with higher
24We do not find any evidence of treatment effects varying by market size, despite significant variation acrossour markets, with the largest markets housing thousands of microentrepreneurs. If treatment effects were morepronounced in smaller markets, it might have indicated business stealing effects (McKenzie and Puerto 2020).
25Note also that the observed change in profits is within the range of one year treatment effects (-15% to 61.1%)that have been found in the literature for business training interventions (only) as documented in McKenzie (2020).Our estimates correspond to a 57-78% increase in profits from the combined intervention after 6 years.
26The financial security indicator is rescaled in the table to be increasing with positive numbers. The ques-tion asked in the survey was how frequently anyone in the household had gone without eating in the previous 12months and whether the microentrepreneur had been unable to cover schooling expenses. Both phrasings miti-gate concerns with affirmative bias in responses.
12
profits and higher levels of financial security for female-led microentrepreneurs relative to a
control group of female microentrepreneurs that did not benefit from the interventions.27
In Panel B we examine the effect of the interventions on male microentrepreneurs. We find
that our interventions were infra-marginal to monthly profits and to the financial security of
male microentrepreneurs, potentially due to higher levels of access to traditional banking and
to financial management skills at baseline, when compared to their female counterparts.
3.2 Mechanisms
3.2.1 Financial Management Skills
We assess the effectiveness of our financial management training through a 15-question test
covering the material taught during the module. This included questions about how to sepa-
rate business and household accounts, how to differentiate between gross and net profits, what
costs to consider when setting prices, and how to deal with family pressure for redistribution.
At the end of the training, the groups that received the financial management training scored
on average 60% (with a 20% standard deviation). Table 2 shows that 12 months following the in-
tervention, all treated groups that received the training scored approximately 10% higher in the
test, relative to the control and mobile money groups.28 These results suggest that our training
succeeded in improving financial management skills, and that these learnings persisted even
12 months after the intervention. To test that we are isolating the effect of the training alone, we
measure performance in a four question numerical literacy test both at baseline and at endline.
This test involved calculating simple price discounts in the marketplace. We find no effect of our
treatments on numerical literacy. This is reassuring since our interventions were not designed
to impart more numerical skills to participants (Column 2).
The second dimension of financial management practices that we assessed was the qual-
27These results are robust to clustering the standard errors at the market level to account for market-levelshocks to general business conditions.
28Performance in this test was standardized to be between 0 and 1. Table A12 in the Online Appendix showsthat the training was also effective for male microentrepreneurs.
13
ity of bookkeeping, 12 months after microentrepreneurs had been trained and encouraged to
engage in regular bookkeeping to track sales on credit, total sales and inventories. Column 3
shows that only the group receiving the combined treatment reported improved practices of
bookkeeping 12 months after the interventions - a 31% improvement on a score that ranges
from 0-3. Bookkeeping was a critical component of the financial management training inter-
vention and all participants were provided with logbooks to encourage record keeping for the
first 3 months following the intervention.29 Taken together, these results suggest that the finan-
cial management training was successful in improving financial management skills, assessed
in terms of the vendors’ theoretical knowledge of how to manage the finances of the business,
but that the actual management practices implemented were only sustained for the combined
treatment group. The rate of decay of financial knowledge might be fast if microentrepreneurs
have no means to apply it effectively for lack of the right financial tools.
The business management training was also effective in reducing transfers to relatives. In
our baseline survey, 77% of respondents reported a belief that transfers to relatives and friends
would never be repaid and 70% of respondents believed that this assistance would not be re-
ciprocated in case of need. An important part of our financial training alerted participants to
ensure that any redistribution should not occur out of business revenue, and that saving and
re-investing profits could enlarge the pie for future redistribution. Column 4 shows that while
all groups appear to have engaged in lower remittances by 2020 relative to the control group,
only the estimate for the combined treatment is statistically significant at conventional levels.
This might reflect the change in attitude towards remittances but also the ability to keep sav-
ings in a mobile money account, where it is less accessible and visible to other members of the
family and of the household.
29We measured bookkeeping through direct observation based on whether the books were in the store and hadentries in them.
14
3.2.2 Mobile Money and Savings
Panel B of Table 2 reports the impact of the interventions on exposure to, and usage, of mobile
money. While over 93% of all respondents both in the control group and in the financial literacy
group had heard of mobile money by the first endline in 2015, usage levels were significantly
lower when compared to the treatment groups that received access to a mobile money account,
as shown in Column 5.
Column 6 reveals that participants in the mobile money treatments were more likely to use
their accounts but only those in the combined treatment group reported keeping their savings
stored in their mobile money accounts.30 Columns 7 and 8 show that these two groups also
conducted transactions of similar value and have similar weekly balances. Table A13 reports the
type of mobile money transactions performed by male and female microentrepreneurs. Mobile
accounts are used for the most part to make remote payments (e.g., paying for electricity), for
cash-ins, and to buy air time. Note that one of the potential reasons behind the improved per-
formance of female-led microenterprises who benefited from the mobile money account was
that it allowed them to better track their finances. Consistent with this hypothesis, Table A13
shows that checking their account balance on the phone was twice as common for those in the
mobile money treatment group as it was for those in the other treatments.
4 Closing the Profit Gender Gap?
We now examine whether the interventions allowed female microentrepreneurs to close the
gap in knowledge and performance relative to their male counterparts in the control group.
Figure 1 shows a clear closing of the gap for profits in 2015, profits in 2020, financial literacy,
and bookkeeping between female-led microenterprises in the combined treatment and male-
led microenterprises in the control group at each endline.31
30The drop in sample size for this variable is due to non-responses.31We compare the performance of treated females to male controls as opposed to male treated microen-
trepreneurs since the latter amounts to a comparison with a moving goal post. Table A12 had already shown thatthe business training module had increased financial knowledge and bookkeeping for men as well.
15

This shows that targeting female microentrepreneurs with the combined treatment can level
the playing field relative to male microentrepreneurs in the control group.
To confirm which female microentrepreneurs benefit the most from the combined treat-
ment, we examine heterogeneous effects based on baseline levels of profit, conditional on all
the baseline covariates. Figure 2 shows that the observed treatment effect for the combined
treatment in 2015 is driven by female microentrepreneurs who started with higher levels of prof-
its at baseline. These are the microentrepreneurs who are most likely to benefit from the com-
bined intervention and who had the highest potential to grow their businesses in both the short
and medium-run. Higher profits in the mobile money treatment group were driven by those
with intermediate levels of baseline profits, whereas increased financial security in the mobile
money treatment group appears to be driven by those with lower levels of baseline profits (see
both Figures 1 and 2).
To further analyse the closing of the gender gap, Table 3 pools both female and male mi-
croentrepreneurs but given significant differences in business attributes at baseline between
the two groups, we estimate a propensity score for all participants determining the propen-
sity of being “male-led” based on an extensive set of covariates.32 Table 3 shows that when
we restrict the analysis to a comparable-on-observables sample of female and male microen-
trepreneurs, the impact of the combined treatment on profits (Panel A) is still significant and of
similar magnitude to the coefficients observed in Table 1. This confirms our previous finding
that the combined treatment has stronger effects for female-led microenterprises with higher
levels of baseline profit, and therefore who are most similar on observables to their male coun-
terparts. Panel B confirms the key mechanisms identified previously in Table 2. In this more
comparable set of microentrepreneurs we no longer find a positive effect of access to mobile
32These include business type (store/stall), business age, previous experience as a business owner, bookkeepingusage, baseline inventory, number of productive assets, and an index of financial literacy. Covariates are selectedfor propensity score matching if they satisfy 2 conditions. 1) The covariate is descriptively imbalanced across maleand female entrepreneurs at baseline, and 2) the covariate is balanced between male and female entrepreneurswithin each block (20%) of the propensity score range. The final matched sample of male and female entrepreneursconsists of individuals whose propensity scores fall between the 33rd and 66th percentile of the propensity scorerange, though our results are not sensitive to the choice of this threshold. See Figure 5 in the Appendix for adistribution of the propensity scores. Results are identical when we use nearest neighbor matching.
16
money on any differential long-run profits.33 This is consistent with our previous findings that
the effect of mobile money is mostly on female-led microenterprises with lower levels of profits
at baseline –a subset that is excluded from the sample in Table 3 as it would be unmatched to
the male-led microenterprises that had on average higher profits at baseline.
Finally, we conduct a cost-benefit analysis to assess the cost-effectiveness of the combined
treatment in closing the profit gap between female and male-microentrepreneurs. The unit cost
of providing the financial management training was 33 USD (2005 Meticais), which included the
salaries of the trainers, the production and printout of materials and the bookkeeping bonus.
The mobile money intervention was considerably cheaper, at 6.3 USD (382.72 Meticais), in-
cluding the cost of sim cards, the practice purchase bonus during the training and the savings
bonus during the first three months. The total unit cost of the combined treatment was there-
fore approximately 39 USD (2388 Meticais). The benefit from the combined treatment was ap-
proximately 5813 Meticais at the end of 12 months suggesting that the cost of this intervention
was easily repaid within the first 5 to 6 months following the intervention.
5 Conclusions
A key policy question is whether access to savings technology and higher levels of business
know how can help reduce the gender profit gap for microentrepreneurs operating in low in-
come settings. We hypothesize that the complementarity between the two interventions might
be central to their effectiveness: access to financial capital may not be a sufficient condition for
microenterprise performance if microentrepreneurs lack the ability to manage resources well
(de Mel et al, 2010; Dupas and Robinson, 2013; Bernhardt et al, 2019). Similarly, improved fi-
nancial literacy and management capabilities may not translate into improved business per-
33Table A11 shows the results when we do not match the female and the male samples and A14 shows thedescriptive statistics for the matched vs unmatched samples. Matching allows us to compare female and malemicroentrepreneurs who are more likely to both own a store instead of a stall, who are more likely to have startedtheir business with a higher level of investment, who have lower levels of inventory, businesses that are younger,and with higher levels of expenditure, sales and productive assets.
17
formance if microentrepreneurs have limited financial resources to invest towards business
growth (Schaner, 2018).
This paper provides novel evidence on the importance of this complementarity: combining
financial literacy and access to savings technology has a positive, significant, sizable and long-
lasting effect on profits and on the financial security of female micro-entrepreneurs. The main
mechanisms behind these effects are improved bookkeeping, reduced transfers to relatives and
increased savings. Female microentrepreneurs with the highest level of profits at baseline are
the most likely to benefit from this support, and close the well-documented gender gap in per-
formance and skills relative to their male counterparts operating in the same markets. How-
ever, we also find evidence in support of the effectiveness of mobile money alone. For microen-
trepreneurs with intermediate levels of profits, providing access to mobile money accounts that
encourage savings can also have a positive impact on long-term profits. For female microen-
trepreneurs with lower levels of profits, providing access to mobile money accounts may not
increase profits but it increases the financial security of the micro-entrepreneur. All treatments
are infra-marginal to male-led microenterprise profits.
This significant heterogeneity in treatment effects across gender, and even within each gen-
der across baseline levels of profits, suggests that policies to promote microenterprise devel-
opment should be targeted to the specific binding constraints faced by different subsets of mi-
croentrepreneurs in order to maximize the returns to these interventions.
18
6 References
Aker, Jenny C. (2010). “Information from Markets Near and Far: Mobile Phones and Agricul-tural Markets in Niger.” American Economic Journal: Applied Economics, 2(3), 46-59.
Aker, Jenny C. and Isaac M. Mbiti. (2010). “Mobile Phones and Economic Development inAfrica.” The Journal of Economic Perspectives, 24(3), 207-232.
Aker, Jenny C, Paul Collier, and Pedro C. Vicente (2017). “Is Information Power? Using Mo-bile Phones and Free Newspapers during an Election in Mozambique.”The Review of Economicsand Statistics, 99(2), 185-200.
Arraiz, Irani, Syon Bhanot and Carla Calero. (2019). “Less is More: Experimental Evidenceon Heuristic-Based Business Training in Ecuador”, IDB Invest Working Paper TN No.18.
Banerjee, Abhijit and Esther Duflo. (2011). Poor Economics: a radical rethinking of the wayto fight global poverty. Public Affairs, New York.
Batista, Catia and Pedro C. Vicente. (2020). “Improving access to savings through mobilemoney: Experimental evidence from African smallholder farmers.”World Development, 129,104905.
Batista, Catia and Pedro C. Vicente. (2018). “Is Mobile Money Changing Rural Africa? Evi-dence from a Field Experiment.” NOVAFRICA Working Paper 1805.
Batista, Catia and Pedro C. Vicente. (2020). “Adopting Mobile Money: Evidence from an Ex-periment in Rural Africa” AEA Papers and Proceedings, 110, pp: 594-598
Bernhardt, Arielle, Erica Field, Natalia Rigol and Rohini Pande. (2019). “Household Matters:Revisiting the Returns to Capital among Female microentrepreneurs”, American Economic Re-view: Insights, vol. 1 no. 2.
Bloom, Nicholas, Mahajan, Aprajit, McKenzie, David, and Roberts, John. (2010). “WhyDo Firms in Developing Countries Have Low Productivity?” The American Economic Review,100(2), 619-623.
Brooks, Wyatt, Kevin Donovan, and Terrence Johnson. (2018). “Mentors or teachers? Mi-croenterprise training in Kenya”, American Economic Journal: Applied Economics 10(4): 196-221
Bruhn, Miriam and Inessa, Love. (2009). “The Economic Impact of Banking the Unbanked:Evidence from Mexico.” Policy Research working paper; no. WPS 4981. World Bank.
Bruhn, Miriam, Dean Karlan and Antoinette Schoar. (2018). “The Impact of Consulting Ser-vices on Small and Medium Enterprises: Evidence from a Randomized Trial in Mexico”, Journal
19
of Political Economy, vol. 126, issue 2, pp: 635-687
Cole, Shawn, Thomas Sampson, and Bilal Zia. (2011). “Prices or Knowledge? What DrivesDemand for Financial Services in Emerging Markets?” The Journal of Finance (New York), 66(6),1933-1967.
Collins, Daryl, Jonathan Morduch, Stuart Rutherford, and Orlanda Ruthven. (2009). Portfo-lios of the Poor. Princeton: Princeton University Press.
de Mel, Suresh David McKenzie and Christopher Woodruff. (2008). “Returns to Capitalin Microenterprises: Evidence from a Field Experiment.” The Quarterly Journal of Economics,123(4), pp: 1329-1372.
Delecourt, Solene and Odyssia Ng.(2020) “Does Gender Matter for Small Business Perfor-mance? Experimental Evidence from India”, manuscript
Drexler, Alejandro, Greg Fischer and Antoinette Schoar. (2014). “Keeping it simple: Finan-cial Literacy and Rules of Thumb”. American Economic Journal. Applied Economics, 6(2), 1-31.
Dupas, Pascaline and Jonathan Robinson. (2013). “Savings Constraints and Microenter-prise Development: Evidence from a Field Experiment in Kenya.”American Economic Journal.Applied Economics, 5(1), 163-192.
Dupas, Pascaline, Dean Karlan, Jonathan Robinson, and Diego Ubfal. (2018).“Banking theUnbanked? Evidence from Three Countries.” American Economic Journal. Applied Economics,10(2), 257-297.
Dupas, Pascaline, Anthony Keats and Jonathan Robinson. (2019). “The Effect of SavingsAccounts on Interpersonal Financial Relationships: Evidence from a Field Experiment in RuralKenya.”The Economic Journal (London), 129(617), 273-310.
Delecourt, SolÃlne, and Odyssia Ng. (2020) “Does Gender Matter for Small Business Perfor-mance? Experimental Evidence from India”. Working Paper.
Field, Erica, Seema Jayachandran, Rohini Pande and Natalia Rigol. (2016). “Friendship atwork: Can peer effects catalyze female entrepreneurship?”, American Economic Journal: Eco-nomic Policy 8(2): 125-53.
Fox, Louise and Alun Thomas. (2016). “Africa has got work to do: A diagnostic of youthemployment challenges in Sub-Saharan Africa”, Journal of African Economies 25: AERC supple-ment 1: i16- i36,
Hardy, Morgan and Gisella Kagy. (2018). “Mind The (Profit) Gap: Why Are Female EnterpriseOwners Earning Less Than Men?”, American Economic Association, Papers and Proceedings, vol.108, pp:252-55
20
Hardy, Morgan, and Gisella Kagy. (2020) “It’s Getting Crowded in Here: Experimental Evi-dence of Demand Constraints in the Gender Profit Gap.” The Economic Journal, 130.631, pp:2272-2290.
Horn, Samantha, Julian Jamison, Dean Karlan, and Jonathan Zinman. (2020) “Does lastingbehavior change require knowledge change? Evidence from savings interventions for youngadults.” No. w28011. National Bureau of Economic Research.
Jack, William and Tavneet Suri. (2014). “Risk Sharing and Transaction Costs: Evidence fromKenya’s Mobile Money Revolution.” The American Economic Review, 104(1), 183-223.
Jayachandran, Seema. (2018). “Microentrepreneurship in Developing Countries”, CEPRDiscussion Paper DP14368.
Jensen, Robert. (2007). “The Digital Provide: Information (Technology), Market Perfor-mance, and Welfare in the South Indian Fisheries Sector.” The Quarterly Journal of Economics,122(3), 879-924.
Karlan, Dean, and Martin Valdivia (2011). “Teaching entrepreneurship” The Review of Eco-nomics and Statistics, 93(2), 510-527.
Karlan, Dean, Ryan Knight and Christopher Udry. (2015). “Consulting and capital experi-ments with microenterprise tailors in Ghana”, Journal of Economic Behavior and Organization,vol. 118, issue C,pp:281-302
Klinger, Bailey, and Matthias Schundel. (2011). “Can Entrepreneurial Activity be Taught?Quasi-Experimental Evidence from Central America.” World Development, 39(9), 1592-1610.
Mbiti, Isaac and David N. Weil. (2016). “Mobile Banking: The Impact of M-Pesa in Kenya”,in African Successes, Volume III: Modernization and Development, Edwards, Johnson, and Weil.
McKenzie, David and Anna L. Paffhausen. (2019). “Small Firm Death in Developing Coun-tries”, Review of Economics and Statistics, 101(4): 645-57, 2019
McKenzie, David and Christopher Woodruff. (2017). “Business Practices in Small Firms inDeveloping Countries”, Management Science, 63(9): 2967-81, 2017
McKenzie, David and Susana Puerto. (2020). “Growing Markets through Business Trainingfor Female Entrepreneurs: A Market-Level Randomized Experiment in Kenya.”American Eco-nomic Journal. Applied Economics, forthcoming.
McKenzie, David. (2020). “Small Business Training to Improve Management Practices inDeveloping Countries : Reassessing the Evidence for ’Training Doesn’t Work.” Policy ResearchWorking Paper; No. 9408. World Bank
21
Nix, E, E Gamberoni, and R Heath. (2015). “Bridging the Gender Gap: Identifying What IsHolding Self-Employed Women Back in Ghana, Rwanda, Tanzania, and the Republic of Congo”,World Bank Economic Review 30(3): 501-512
Riley, Emma. (2020). “Resisting Social Pressure in the Household Using Mobile Money: Ex-perimental Evidence on Microenterprise Investment in Uganda.” Working paper.
Rosenthal, Stuart S. and William C. Strange. (2012). “ Female Entrepreneurship, agglomera-tion and a new spatial mismatch” The Review of Economics and Statistics, 94(3), 764-788.
Schaner, Simone. (2018) “The persistent power of behavioral change: Long-run impacts oftemporary savings subsidies for the poor.” American Economic Journal: Applied Economics, 10,no. 3: 67.
Suri, Tavneet, and William Jack . (2016). “The Long Run Poverty and Gender Impacts of Mo-bile Money”, Science, 354(6317), pp. 1288-1292
22

7 Tables and Figures
23
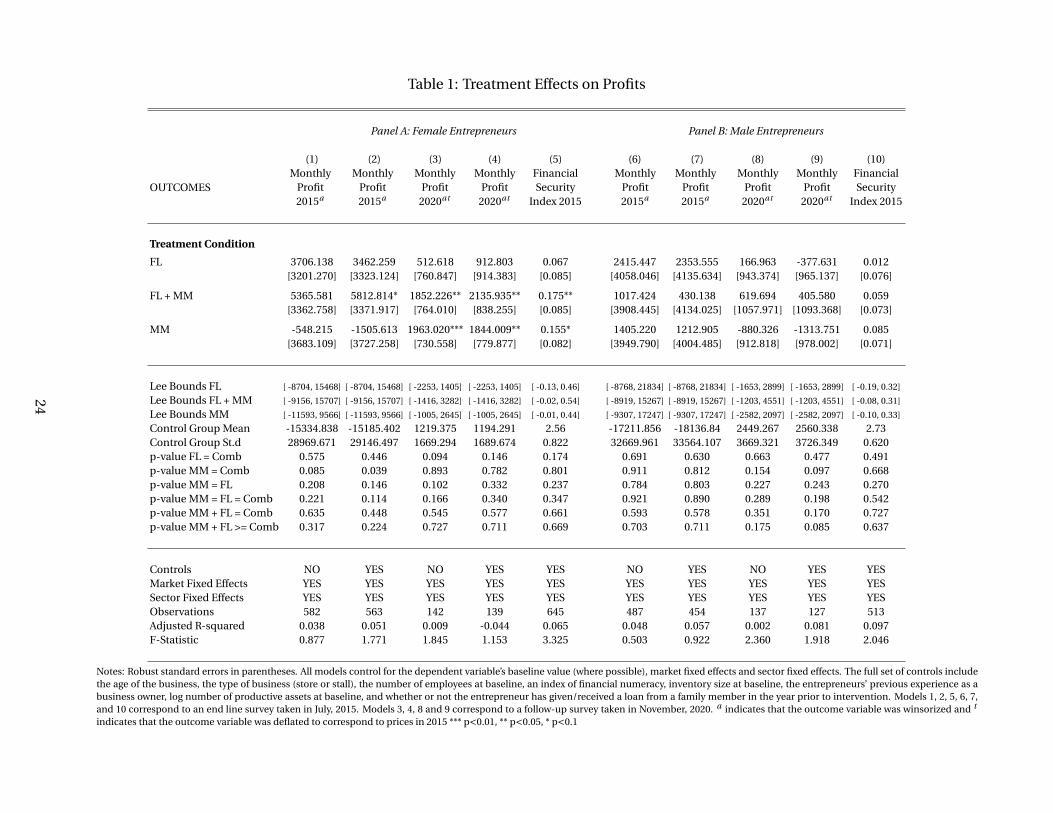
Table 1: Treatment Effects on Profits
Panel A: Female Entrepreneurs Panel B: Male Entrepreneurs
(1) (2) (3) (4) (5) (6) (7) (8) (9) (10)
OUTCOMESMonthly
Profit2015a
MonthlyProfit2015a
MonthlyProfit
2020at
MonthlyProfit
2020at
FinancialSecurity
Index 2015
MonthlyProfit2015a
MonthlyProfit2015a
MonthlyProfit
2020at
MonthlyProfit
2020at
FinancialSecurity
Index 2015
Treatment Condition
FL 3706.138 3462.259 512.618 912.803 0.067 2415.447 2353.555 166.963 -377.631 0.012[3201.270] [3323.124] [760.847] [914.383] [0.085] [4058.046] [4135.634] [943.374] [965.137] [0.076]
FL + MM 5365.581 5812.814* 1852.226** 2135.935** 0.175** 1017.424 430.138 619.694 405.580 0.059[3362.758] [3371.917] [764.010] [838.255] [0.085] [3908.445] [4134.025] [1057.971] [1093.368] [0.073]
MM -548.215 -1505.613 1963.020*** 1844.009** 0.155* 1405.220 1212.905 -880.326 -1313.751 0.085[3683.109] [3727.258] [730.558] [779.877] [0.082] [3949.790] [4004.485] [912.818] [978.002] [0.071]
Lee Bounds FL [ -8704, 15468] [ -8704, 15468] [ -2253, 1405] [ -2253, 1405] [ -0.13, 0.46] [ -8768, 21834] [ -8768, 21834] [ -1653, 2899] [ -1653, 2899] [ -0.19, 0.32]
Lee Bounds FL + MM [ -9156, 15707] [ -9156, 15707] [ -1416, 3282] [ -1416, 3282] [ -0.02, 0.54] [ -8919, 15267] [ -8919, 15267] [ -1203, 4551] [ -1203, 4551] [ -0.08, 0.31]
Lee Bounds MM [ -11593, 9566] [ -11593, 9566] [ -1005, 2645] [ -1005, 2645] [ -0.01, 0.44] [ -9307, 17247] [ -9307, 17247] [ -2582, 2097] [ -2582, 2097] [ -0.10, 0.33]
Control Group Mean -15334.838 -15185.402 1219.375 1194.291 2.56 -17211.856 -18136.84 2449.267 2560.338 2.73Control Group St.d 28969.671 29146.497 1669.294 1689.674 0.822 32669.961 33564.107 3669.321 3726.349 0.620p-value FL = Comb 0.575 0.446 0.094 0.146 0.174 0.691 0.630 0.663 0.477 0.491p-value MM = Comb 0.085 0.039 0.893 0.782 0.801 0.911 0.812 0.154 0.097 0.668p-value MM = FL 0.208 0.146 0.102 0.332 0.237 0.784 0.803 0.227 0.243 0.270p-value MM = FL = Comb 0.221 0.114 0.166 0.340 0.347 0.921 0.890 0.289 0.198 0.542p-value MM + FL = Comb 0.635 0.448 0.545 0.577 0.661 0.593 0.578 0.351 0.170 0.727p-value MM + FL >= Comb 0.317 0.224 0.727 0.711 0.669 0.703 0.711 0.175 0.085 0.637
Controls NO YES NO YES YES NO YES NO YES YESMarket Fixed Effects YES YES YES YES YES YES YES YES YES YESSector Fixed Effects YES YES YES YES YES YES YES YES YES YESObservations 582 563 142 139 645 487 454 137 127 513Adjusted R-squared 0.038 0.051 0.009 -0.044 0.065 0.048 0.057 0.002 0.081 0.097F-Statistic 0.877 1.771 1.845 1.153 3.325 0.503 0.922 2.360 1.918 2.046
Notes: Robust standard errors in parentheses. All models control for the dependent variable’s baseline value (where possible), market fixed effects and sector fixed effects. The full set of controls includethe age of the business, the type of business (store or stall), the number of employees at baseline, an index of financial numeracy, inventory size at baseline, the entrepreneurs’ previous experience as abusiness owner, log number of productive assets at baseline, and whether or not the entrepreneur has given/received a loan from a family member in the year prior to intervention. Models 1, 2, 5, 6, 7,and 10 correspond to an end line survey taken in July, 2015. Models 3, 4, 8 and 9 correspond to a follow-up survey taken in November, 2020. a indicates that the outcome variable was winsorized and t
indicates that the outcome variable was deflated to correspond to prices in 2015 *** p<0.01, ** p<0.05, * p<0.1
24
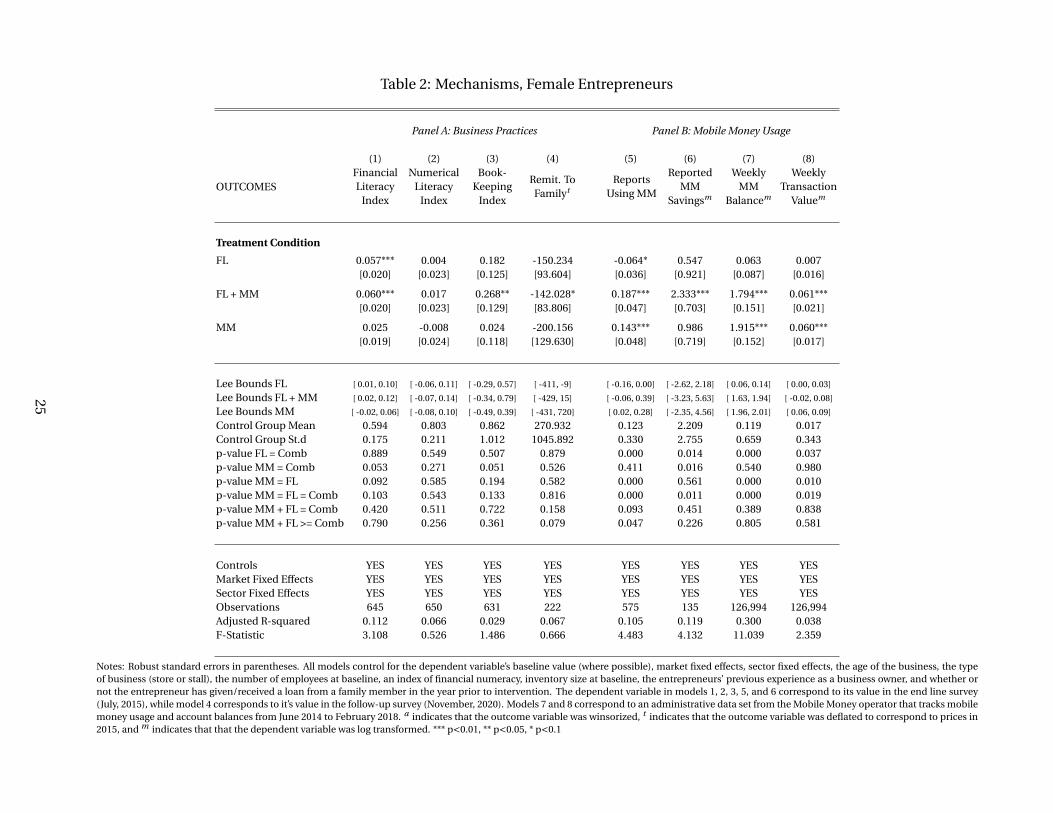
Table 2: Mechanisms, Female Entrepreneurs
Panel A: Business Practices Panel B: Mobile Money Usage
(1) (2) (3) (4) (5) (6) (7) (8)
OUTCOMESFinancialLiteracy
Index
NumericalLiteracy
Index
Book-Keeping
Index
Remit. ToFamilyt
ReportsUsing MM
ReportedMM
Savingsm
WeeklyMM
Balancem
WeeklyTransaction
Valuem
Treatment Condition
FL 0.057*** 0.004 0.182 -150.234 -0.064* 0.547 0.063 0.007[0.020] [0.023] [0.125] [93.604] [0.036] [0.921] [0.087] [0.016]
FL + MM 0.060*** 0.017 0.268** -142.028* 0.187*** 2.333*** 1.794*** 0.061***[0.020] [0.023] [0.129] [83.806] [0.047] [0.703] [0.151] [0.021]
MM 0.025 -0.008 0.024 -200.156 0.143*** 0.986 1.915*** 0.060***[0.019] [0.024] [0.118] [129.630] [0.048] [0.719] [0.152] [0.017]
Lee Bounds FL [ 0.01, 0.10] [ -0.06, 0.11] [ -0.29, 0.57] [ -411, -9] [ -0.16, 0.00] [ -2.62, 2.18] [ 0.06, 0.14] [ 0.00, 0.03]
Lee Bounds FL + MM [ 0.02, 0.12] [ -0.07, 0.14] [ -0.34, 0.79] [ -429, 15] [ -0.06, 0.39] [ -3.23, 5.63] [ 1.63, 1.94] [ -0.02, 0.08]
Lee Bounds MM [ -0.02, 0.06] [ -0.08, 0.10] [ -0.49, 0.39] [ -431, 720] [ 0.02, 0.28] [ -2.35, 4.56] [ 1.96, 2.01] [ 0.06, 0.09]
Control Group Mean 0.594 0.803 0.862 270.932 0.123 2.209 0.119 0.017Control Group St.d 0.175 0.211 1.012 1045.892 0.330 2.755 0.659 0.343p-value FL = Comb 0.889 0.549 0.507 0.879 0.000 0.014 0.000 0.037p-value MM = Comb 0.053 0.271 0.051 0.526 0.411 0.016 0.540 0.980p-value MM = FL 0.092 0.585 0.194 0.582 0.000 0.561 0.000 0.010p-value MM = FL = Comb 0.103 0.543 0.133 0.816 0.000 0.011 0.000 0.019p-value MM + FL = Comb 0.420 0.511 0.722 0.158 0.093 0.451 0.389 0.838p-value MM + FL >= Comb 0.790 0.256 0.361 0.079 0.047 0.226 0.805 0.581
Controls YES YES YES YES YES YES YES YESMarket Fixed Effects YES YES YES YES YES YES YES YESSector Fixed Effects YES YES YES YES YES YES YES YESObservations 645 650 631 222 575 135 126,994 126,994Adjusted R-squared 0.112 0.066 0.029 0.067 0.105 0.119 0.300 0.038F-Statistic 3.108 0.526 1.486 0.666 4.483 4.132 11.039 2.359
Notes: Robust standard errors in parentheses. All models control for the dependent variable’s baseline value (where possible), market fixed effects, sector fixed effects, the age of the business, the typeof business (store or stall), the number of employees at baseline, an index of financial numeracy, inventory size at baseline, the entrepreneurs’ previous experience as a business owner, and whether ornot the entrepreneur has given/received a loan from a family member in the year prior to intervention. The dependent variable in models 1, 2, 3, 5, and 6 correspond to its value in the end line survey(July, 2015), while model 4 corresponds to it’s value in the follow-up survey (November, 2020). Models 7 and 8 correspond to an administrative data set from the Mobile Money operator that tracks mobilemoney usage and account balances from June 2014 to February 2018. a indicates that the outcome variable was winsorized, t indicates that the outcome variable was deflated to correspond to prices in2015, and m indicates that that the dependent variable was log transformed. *** p<0.01, ** p<0.05, * p<0.1
25

Table 3: Combined Sample: Male and Female Entrepreneurs
Panel A: Profit Panel B: Mechanisms
(1) (2) (3) (4) (5) (6) (7) (8) (9) (10) (11)
OUTCOMESMonthly
Profit2015a
MonthlyProfit2015a
MonthlyProfit
2020at
MonthlyProfit
2020at
FinancialSecurity
Index 2015
FinancialLiteracy
Index
Book-Keeping
Index
Remit. ToFamilyt
ReportsUsing MM
WeeklyMM
Balancem
WeeklyTransaction
Valuem
Treatment ConditionFL 5708.637 4915.327 3077.655 3527.225 0.172 0.071** 0.534** -207.626 -0.008 0.181 0.004
[5373.357] [5651.760] [2030.588] [2307.835] [0.133] [0.031] [0.209] [344.500] [0.047] [0.140] [0.034]
FL + MM 6814.968 7113.183 3331.195*** 3485.018** 0.111 0.051* 0.599*** -129.463 0.283*** 1.722*** 0.064**[5383.150] [5536.127] [1239.142] [1526.279] [0.154] [0.030] [0.199] [307.732] [0.072] [0.219] [0.030]
MM -7321.152 -5230.422 756.623 -421.335 0.206 -0.005 0.263 -155.633 0.215*** 1.844*** 0.107***[6700.187] [6772.533] [1318.814] [1989.575] [0.164] [0.034] [0.230] [431.300] [0.082] [0.262] [0.041]
FL * Male 1218.423 2077.848 -3273.600 -4579.600 -0.317* 0.002 -0.031 -1083.749 -0.003 -0.398 0.027[9474.046] [9342.113] [2962.572] [2934.390] [0.174] [0.045] [0.326] [815.365] [0.102] [0.295] [0.054]
(FL + MM) * Male 2395.894 1126.002 -2889.351 -2600.452 -0.137 0.064 -0.223 -822.779 -0.001 0.261 0.070[9676.062] [9549.267] [3270.029] [3071.395] [0.184] [0.046] [0.320] [852.203] [0.131] [0.428] [0.075]
MM * Male 12837.059 9210.684 -1778.315 -1043.546 -0.147 -0.050 -0.226 -948.725 0.013 0.050 0.065[11083.438] [10765.781] [1858.684] [2372.182] [0.183] [0.055] [0.362] [729.658] [0.135] [0.462] [0.088]
Lee Bounds FL [ -3932, 19938] [ -3932, 19938] [ -4791, 2874] [ -4791, 2874] [ -0.14, 0.35] [ 0.01, 0.10] [ -0.11, 1.07] [ -823, 579] [ -0.18, 0.08] [ -0.04, 0.04] [ 0.02, 0.03]Lee Bounds FL + MM [ -2067, 19261] [ -2067, 19261] [ -1735, 5410] [ -1735, 5410] [ -0.19, 0.32] [ 0.01, 0.11] [ -0.08, 0.84] [ -890, 833] [ 0.08, 0.45] [ 1.74, 1.89] [ 0.09, 0.10]Lee Bounds MM [ -12311, 13655] [ -12311, 13655] [ -3671, 1999] [ -3671, 1999] [ -0.02, 0.38] [ -0.06, 0.04] [ -0.43, 0.49] [ -1145, 255] [ 0.06, 0.37] [ 1.86, 1.98] [ 0.14, 0.17]Control Group Mean -18271.878 -18271.878 2281.861 2281.861 2.682 0.635 0.765 717.089 0.114 0.208 0.005Control Group St.d 34662.281 34662.281 3475.246 3475.246 0.767 0.174 0.926 2159.721 0.320 0.968 0.161p-value FL = Comb 0.806 0.652 0.885 0.982 0.591 0.504 0.764 0.719 0.000 0.000 0.057p-value MM = Comb 0.017 0.042 0.036 0.039 0.506 0.094 0.152 0.930 0.467 0.709 0.233p-value MM = FL 0.029 0.100 0.179 0.089 0.794 0.027 0.271 0.874 0.004 0.000 0.018p-value MM = FL = Comb 0.046 0.119 0.087 0.101 0.779 0.082 0.341 0.937 0.000 0.000 0.050p-value MM + FL = Comb 0.296 0.374 0.836 0.898 0.165 0.753 0.530 0.632 0.476 0.398 0.335p-value MM + FL >= Comb 0.148 0.187 0.582 0.449 0.918 0.623 0.735 0.316 0.238 0.801 0.832
Controls NO YES NO YES YES YES YES YES YES YES YESMarket Fixed Effects YES YES YES YES YES YES YES YES YES YES YESSector Fixed Effects YES YES YES YES YES YES YES YES YES YES YESObservations 363 363 92 92 377 373 372 144 359 74,112 74,112Adjusted R-squared 0.005 0.019 -0.025 -0.037 0.065 0.191 0.044 0.021 0.101 0.324 0.057F-Statistic 1.388 1.227 1.901 1.195 1.621 11.422 1.969 0.478 3.957 7.984 1.473
Notes: Robust standard errors in parentheses. All models control for the dependent variable’s baseline value (where possible), market fixed effects and sector fixed effects. The full set of controls includethe age of the business, the type of business (store or stall), the number of employees at baseline, an index of financial numeracy, inventory size at baseline, the entrepreneurs’ previous experience as abusiness owner, and whether or not the entrepreneur has given/received a loan from a family member in the year prior to the intervention. The dependent variable in models 1, 2, 5, 6, 7 and 9 correspondto its value in the end line survey (July, 2015), while models 3, 4 and 8 corresponds to it’s value in the follow-up survey (November, 2020). Models 10 and 11 correspond to an administrative data set fromthe Mobile Money operator that tracks mobile money usage and account balances from June 2014 to February 2018. a indicates that the outcome variable was winsorized, t indicates that the outcomevariable was deflated to correspond to prices in 2015, and m indicates that that the dependent variable was log transformed. *** p<0.01, ** p<0.05, * p<0.1
26
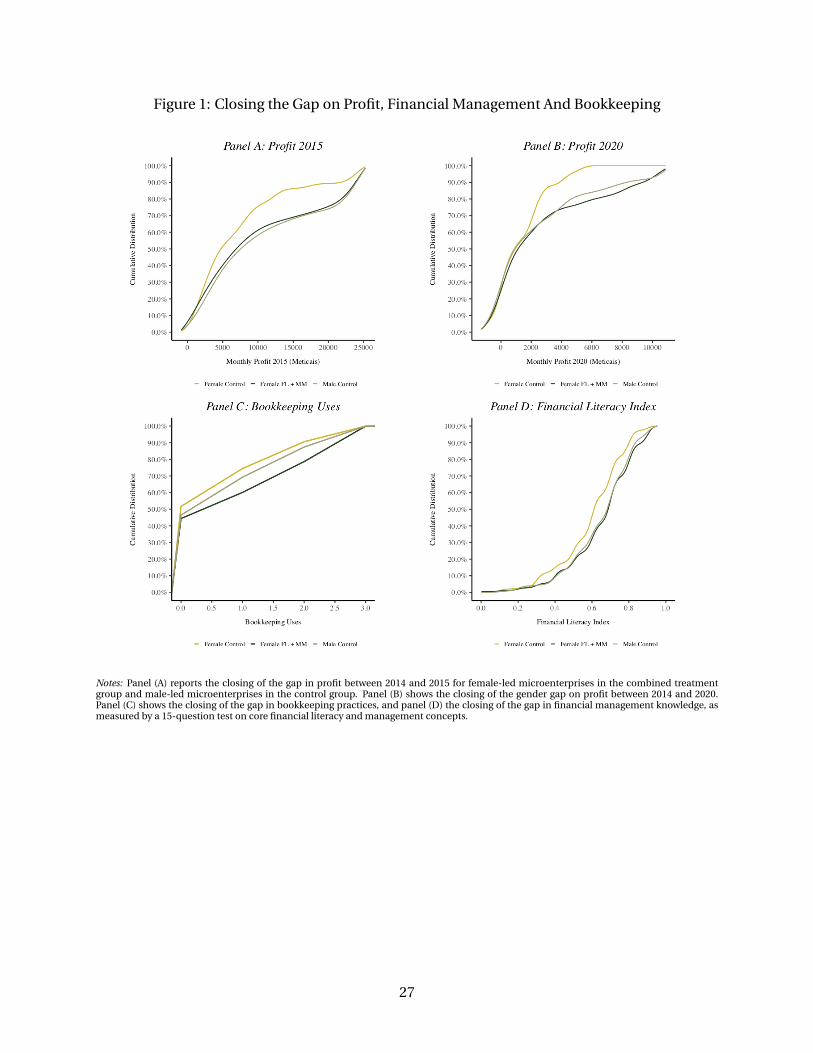
Figure 1: Closing the Gap on Profit, Financial Management And Bookkeeping
Notes: Panel (A) reports the closing of the gap in profit between 2014 and 2015 for female-led microenterprises in the combined treatmentgroup and male-led microenterprises in the control group. Panel (B) shows the closing of the gender gap on profit between 2014 and 2020.Panel (C) shows the closing of the gap in bookkeeping practices, and panel (D) the closing of the gap in financial management knowledge, asmeasured by a 15-question test on core financial literacy and management concepts.
27
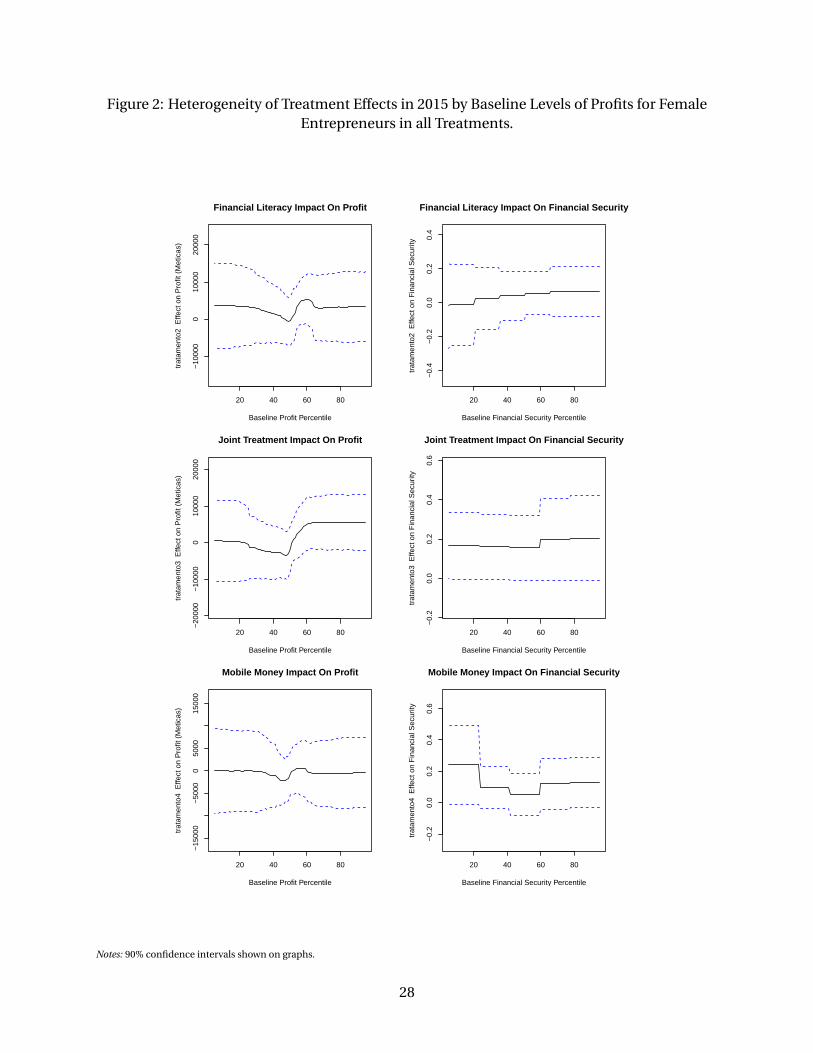
Figure 2: Heterogeneity of Treatment Effects in 2015 by Baseline Levels of Profits for FemaleEntrepreneurs in all Treatments.
20 40 60 80
−10
000
010
000
2000
0
Financial Literacy Impact On Profit
Baseline Profit Percentile
trat
amen
to2
Effe
ct o
n P
rofit
(M
etic
as)
20 40 60 80
−0.
4−
0.2
0.0
0.2
0.4
Financial Literacy Impact On Financial Security
Baseline Financial Security Percentiletr
atam
ento
2 E
ffect
on
Fin
anci
al S
ecur
ity
20 40 60 80
−20
000
−10
000
010
000
2000
0
Joint Treatment Impact On Profit
Baseline Profit Percentile
trat
amen
to3
Effe
ct o
n P
rofit
(M
etic
as)
20 40 60 80
−0.
20.
00.
20.
40.
6
Joint Treatment Impact On Financial Security
Baseline Financial Security Percentile
trat
amen
to3
Effe
ct o
n F
inan
cial
Sec
urity
20 40 60 80
−15
000
−50
000
5000
1500
0
Mobile Money Impact On Profit
Baseline Profit Percentile
trat
amen
to4
Effe
ct o
n P
rofit
(M
etic
as)
20 40 60 80
−0.
20.
00.
20.
40.
6
Mobile Money Impact On Financial Security
Baseline Financial Security Percentile
trat
amen
to4
Effe
ct o
n F
inan
cial
Sec
urity
Notes: 90% confidence intervals shown on graphs.
28

ONLINE APPENDIX FOR
CLOSING THE PROFIT GENDER GAP(NOT FOR PUBLICATION)
September 2021
29

30
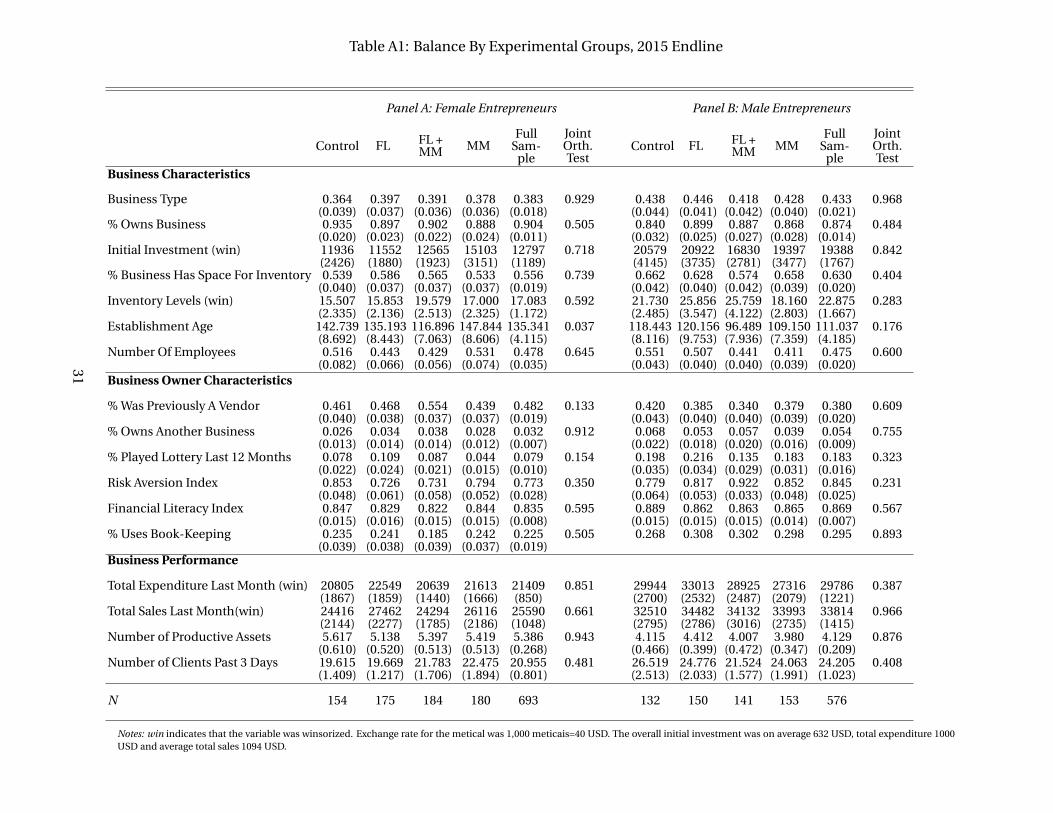
Table A1: Balance By Experimental Groups, 2015 Endline
Panel A: Female Entrepreneurs Panel B: Male Entrepreneurs
Control FL FL +MM MM
FullSam-
ple
JointOrth.Test
Control FL FL +MM MM
FullSam-
ple
JointOrth.Test
Business Characteristics
Business Type 0.364 0.397 0.391 0.378 0.383 0.929 0.438 0.446 0.418 0.428 0.433 0.968(0.039) (0.037) (0.036) (0.036) (0.018) (0.044) (0.041) (0.042) (0.040) (0.021)
% Owns Business 0.935 0.897 0.902 0.888 0.904 0.505 0.840 0.899 0.887 0.868 0.874 0.484(0.020) (0.023) (0.022) (0.024) (0.011) (0.032) (0.025) (0.027) (0.028) (0.014)
Initial Investment (win) 11936 11552 12565 15103 12797 0.718 20579 20922 16830 19397 19388 0.842(2426) (1880) (1923) (3151) (1189) (4145) (3735) (2781) (3477) (1767)
% Business Has Space For Inventory 0.539 0.586 0.565 0.533 0.556 0.739 0.662 0.628 0.574 0.658 0.630 0.404(0.040) (0.037) (0.037) (0.037) (0.019) (0.042) (0.040) (0.042) (0.039) (0.020)
Inventory Levels (win) 15.507 15.853 19.579 17.000 17.083 0.592 21.730 25.856 25.759 18.160 22.875 0.283(2.335) (2.136) (2.513) (2.325) (1.172) (2.485) (3.547) (4.122) (2.803) (1.667)
Establishment Age 142.739 135.193 116.896 147.844 135.341 0.037 118.443 120.156 96.489 109.150 111.037 0.176(8.692) (8.443) (7.063) (8.606) (4.115) (8.116) (9.753) (7.936) (7.359) (4.185)
Number Of Employees 0.516 0.443 0.429 0.531 0.478 0.645 0.551 0.507 0.441 0.411 0.475 0.600(0.082) (0.066) (0.056) (0.074) (0.035) (0.043) (0.040) (0.040) (0.039) (0.020)
Business Owner Characteristics
% Was Previously A Vendor 0.461 0.468 0.554 0.439 0.482 0.133 0.420 0.385 0.340 0.379 0.380 0.609(0.040) (0.038) (0.037) (0.037) (0.019) (0.043) (0.040) (0.040) (0.039) (0.020)
% Owns Another Business 0.026 0.034 0.038 0.028 0.032 0.912 0.068 0.053 0.057 0.039 0.054 0.755(0.013) (0.014) (0.014) (0.012) (0.007) (0.022) (0.018) (0.020) (0.016) (0.009)
% Played Lottery Last 12 Months 0.078 0.109 0.087 0.044 0.079 0.154 0.198 0.216 0.135 0.183 0.183 0.323(0.022) (0.024) (0.021) (0.015) (0.010) (0.035) (0.034) (0.029) (0.031) (0.016)
Risk Aversion Index 0.853 0.726 0.731 0.794 0.773 0.350 0.779 0.817 0.922 0.852 0.845 0.231(0.048) (0.061) (0.058) (0.052) (0.028) (0.064) (0.053) (0.033) (0.048) (0.025)
Financial Literacy Index 0.847 0.829 0.822 0.844 0.835 0.595 0.889 0.862 0.863 0.865 0.869 0.567(0.015) (0.016) (0.015) (0.015) (0.008) (0.015) (0.015) (0.015) (0.014) (0.007)
% Uses Book-Keeping 0.235 0.241 0.185 0.242 0.225 0.505 0.268 0.308 0.302 0.298 0.295 0.893(0.039) (0.038) (0.039) (0.037) (0.019)
Business Performance
Total Expenditure Last Month (win) 20805 22549 20639 21613 21409 0.851 29944 33013 28925 27316 29786 0.387(1867) (1859) (1440) (1666) (850) (2700) (2532) (2487) (2079) (1221)
Total Sales Last Month(win) 24416 27462 24294 26116 25590 0.661 32510 34482 34132 33993 33814 0.966(2144) (2277) (1785) (2186) (1048) (2795) (2786) (3016) (2735) (1415)
Number of Productive Assets 5.617 5.138 5.397 5.419 5.386 0.943 4.115 4.412 4.007 3.980 4.129 0.876(0.610) (0.520) (0.513) (0.513) (0.268) (0.466) (0.399) (0.472) (0.347) (0.209)
Number of Clients Past 3 Days 19.615 19.669 21.783 22.475 20.955 0.481 26.519 24.776 21.524 24.063 24.205 0.408(1.409) (1.217) (1.706) (1.894) (0.801) (2.513) (2.033) (1.577) (1.991) (1.023)
N 154 175 184 180 693 132 150 141 153 576
Notes: win indicates that the variable was winsorized. Exchange rate for the metical was 1,000 meticais=40 USD. The overall initial investment was on average 632 USD, total expenditure 1000USD and average total sales 1094 USD.
31

Table A2: Balance By Experimental Groups, 2020 Endline
Panel A: Female Entrepreneurs Panel B: Male Entrepreneurs
Control FL FL +MM MM
FullSam-
ple
JointOrth.Test
Control FL FL +MM MM
FullSam-
ple
JointOrth.Test
Business CharacteristicsBusiness Type 0.446 0.468 0.420 0.438 0.442 0.959 0.473 0.484 0.429 0.375 0.441 0.640
(0.067) (0.064) (0.060) (0.062) (0.031) (0.068) (0.064) (0.071) (0.065) (0.033)% Owns Business 0.946 0.935 0.928 0.891 0.924 0.675 0.836 0.887 0.878 0.875 0.869 0.865
(0.030) (0.031) (0.031) (0.039) (0.017) (0.050) (0.041) (0.047) (0.045) (0.023)Initial Investment (win) 14111 11481 13895 13939 13350 0.964 25727 16929 20303 19601 20551 0.774
(5030) (2707) (3484) (5157) (2037) (7808) (4309) (5579) (6746) (3087)% Business Has Space For Inventory 0.554 0.694 0.580 0.547 0.594 0.314 0.691 0.661 0.592 0.684 0.659 0.711
(0.067) (0.059) (0.060) (0.063) (0.031) (0.063) (0.061) (0.071) (0.062) (0.032)Inventory Levels (win) 17.245 12.839 26.147 17.672 18.726 0.120 24.722 29.597 37.851 19.885 27.828 0.242
(5.119) (1.623) (4.600) (4.446) (2.079) (4.635) (4.848) (9.732) (5.524) (3.109)Establishment Age 147.393 145.767 127.043 153.672 142.976 0.509 127.291 147.066 105.021 124.421 127.273 0.278
(14.825) (13.912) (11.028) (14.527) (6.746) (13.061) (18.606) (12.744) (12.876) (7.488)Number Of Employees 0.482 0.355 0.449 0.500 0.446 0.776 0.611 0.377 0.681 0.327 0.488 0.121
(0.114) (0.095) (0.096) (0.119) (0.053) (0.136) (0.094) (0.164) (0.097) (0.061)
Business Owner Characteristics% Was Previously A Vendor 0.429 0.468 0.565 0.422 0.474 0.327 0.473 0.355 0.306 0.333 0.368 0.294
(0.067) (0.064) (0.060) (0.062) (0.032) (0.068) (0.061) (0.067) (0.063) (0.032)% Owns Another Business 0.018 0.065 0.043 0.016 0.036 0.416 0.073 0.097 0.102 0.035 0.076 0.534
(0.018) (0.031) (0.025) (0.016) (0.012) (0.035) (0.038) (0.044) (0.025) (0.018)% Played Lottery Last 12 Months 0.089 0.129 0.101 0.047 0.092 0.450 0.291 0.242 0.122 0.211 0.220 0.211
(0.038) (0.043) (0.037) (0.027) (0.018) (0.062) (0.055) (0.047) (0.054) (0.028)Risk Aversion Index 0.833 0.681 0.674 0.860 0.758 0.371 0.885 0.853 0.857 0.867 0.865 0.798
(0.083) (0.106) (0.108) (0.079) (0.048) (0.024) (0.024) (0.027) (0.022) (0.012)Financial Literacy Index 0.860 0.866 0.826 0.823 0.843 0.513 0.222 0.344 0.417 0.309 0.321 0.204
(0.025) (0.027) (0.025) (0.024) (0.013) (0.057) (0.061) (0.072) (0.063) (0.032)% Uses Book-Keeping 0.250 0.194 0.159 0.190 0.196 0.655 0.222 0.344 0.417 0.309 0.321 0.204
(0.058) (0.051) (0.044) (0.050) (0.025) (0.057) (0.061) (0.072) (0.063) (0.032)
Business Performance
Total Expenditure Last Month (win) 20357 21661 21851 20237 21063 0.962 30536 31081 32904 25027 29796 0.518(2789) (3345) (2221) (2589) (1363) (4190) (3594) (4483) (3336) (1935)
Total Sales Last Month(win) 24138 25143 23803 27137 24983 0.912 33049 32386 32950 30207 32144 0.970(4074) (3476) (2670) (3904) (1733) (4610) (4108) (5317) (4484) (2286)
Number of Productive Assets 5.232 5.484 5.203 5.734 5.414 0.971 4.309 3.806 4.286 3.912 4.063 0.921(0.968) (0.894) (0.790) (0.901) (0.440) (0.822) (0.433) (0.756) (0.536) (0.317)
Number of Clients Past 3 Days 19.272 18.098 20.313 22.065 19.946 0.751 30.819 24.848 20.740 24.820 25.405 0.302(2.701) (1.752) (2.114) (3.804) (1.316) (4.832) (3.379) (2.261) (3.434) (1.824)
N 56 62 69 64 251 55 62 49 57 223
Notes: win indicates that the variable was winsorized.
32
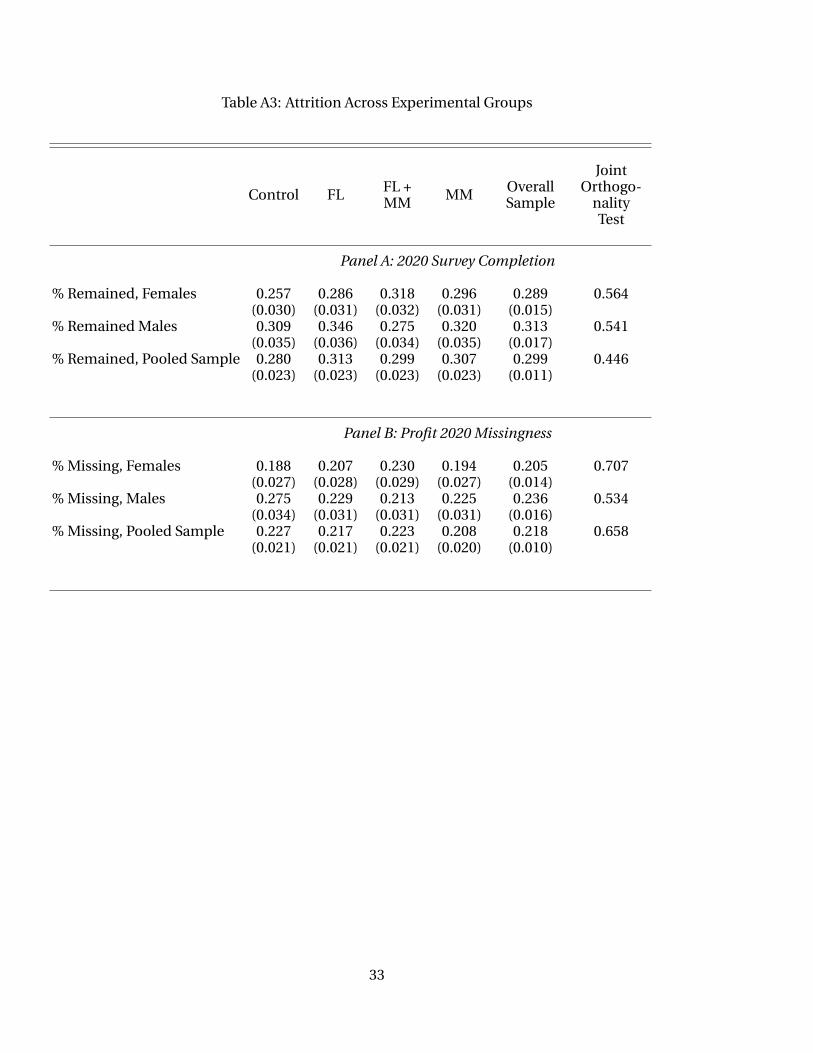
Table A3: Attrition Across Experimental Groups
Control FL FL +MM MM Overall
Sample
JointOrthogo-
nalityTest
Panel A: 2020 Survey Completion
% Remained, Females 0.257 0.286 0.318 0.296 0.289 0.564(0.030) (0.031) (0.032) (0.031) (0.015)
% Remained Males 0.309 0.346 0.275 0.320 0.313 0.541(0.035) (0.036) (0.034) (0.035) (0.017)
% Remained, Pooled Sample 0.280 0.313 0.299 0.307 0.299 0.446(0.023) (0.023) (0.023) (0.023) (0.011)
Panel B: Profit 2020 Missingness
% Missing, Females 0.188 0.207 0.230 0.194 0.205 0.707(0.027) (0.028) (0.029) (0.027) (0.014)
% Missing, Males 0.275 0.229 0.213 0.225 0.236 0.534(0.034) (0.031) (0.031) (0.031) (0.016)
% Missing, Pooled Sample 0.227 0.217 0.223 0.208 0.218 0.658(0.021) (0.021) (0.021) (0.020) (0.010)
33
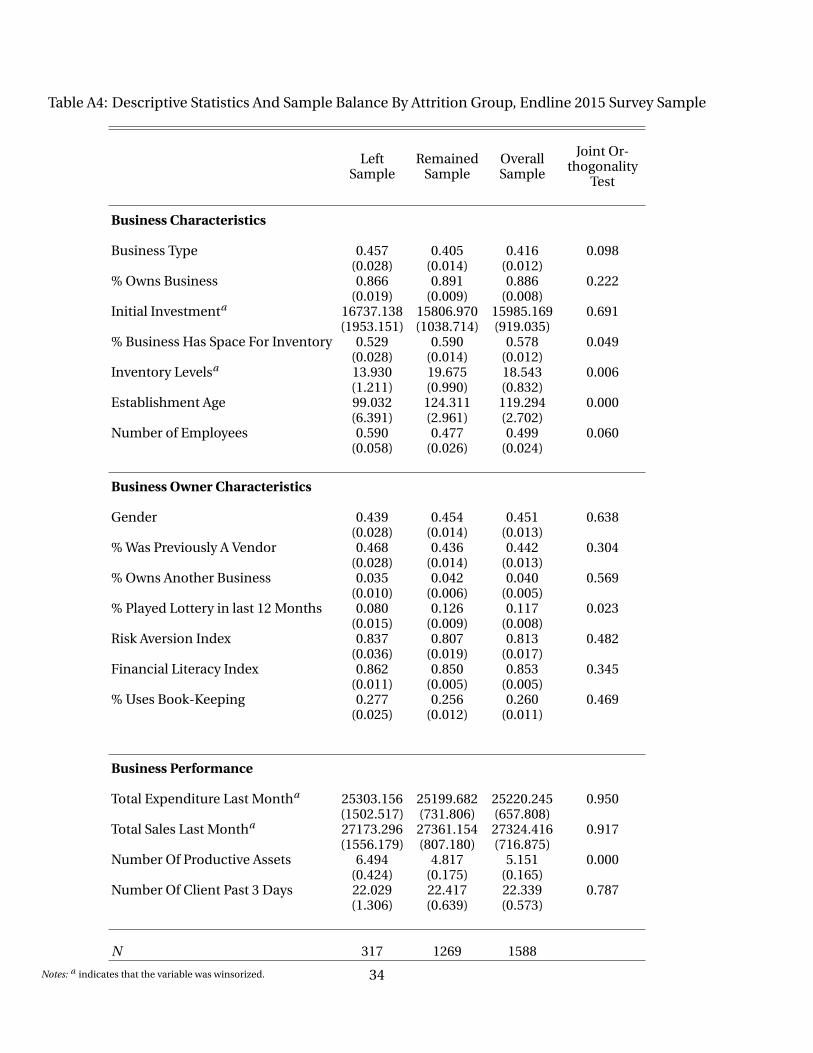
Table A4: Descriptive Statistics And Sample Balance By Attrition Group, Endline 2015 Survey Sample
LeftSample
RemainedSample
OverallSample
Joint Or-thogonality
Test
Business Characteristics
Business Type 0.457 0.405 0.416 0.098(0.028) (0.014) (0.012)
% Owns Business 0.866 0.891 0.886 0.222(0.019) (0.009) (0.008)
Initial Investmenta 16737.138 15806.970 15985.169 0.691(1953.151) (1038.714) (919.035)
% Business Has Space For Inventory 0.529 0.590 0.578 0.049(0.028) (0.014) (0.012)
Inventory Levelsa 13.930 19.675 18.543 0.006(1.211) (0.990) (0.832)
Establishment Age 99.032 124.311 119.294 0.000(6.391) (2.961) (2.702)
Number of Employees 0.590 0.477 0.499 0.060(0.058) (0.026) (0.024)
Business Owner Characteristics
Gender 0.439 0.454 0.451 0.638(0.028) (0.014) (0.013)
% Was Previously A Vendor 0.468 0.436 0.442 0.304(0.028) (0.014) (0.013)
% Owns Another Business 0.035 0.042 0.040 0.569(0.010) (0.006) (0.005)
% Played Lottery in last 12 Months 0.080 0.126 0.117 0.023(0.015) (0.009) (0.008)
Risk Aversion Index 0.837 0.807 0.813 0.482(0.036) (0.019) (0.017)
Financial Literacy Index 0.862 0.850 0.853 0.345(0.011) (0.005) (0.005)
% Uses Book-Keeping 0.277 0.256 0.260 0.469(0.025) (0.012) (0.011)
Business Performance
Total Expenditure Last Montha 25303.156 25199.682 25220.245 0.950(1502.517) (731.806) (657.808)
Total Sales Last Montha 27173.296 27361.154 27324.416 0.917(1556.179) (807.180) (716.875)
Number Of Productive Assets 6.494 4.817 5.151 0.000(0.424) (0.175) (0.165)
Number Of Client Past 3 Days 22.029 22.417 22.339 0.787(1.306) (0.639) (0.573)
N 317 1269 1588
Notes: a indicates that the variable was winsorized. 34
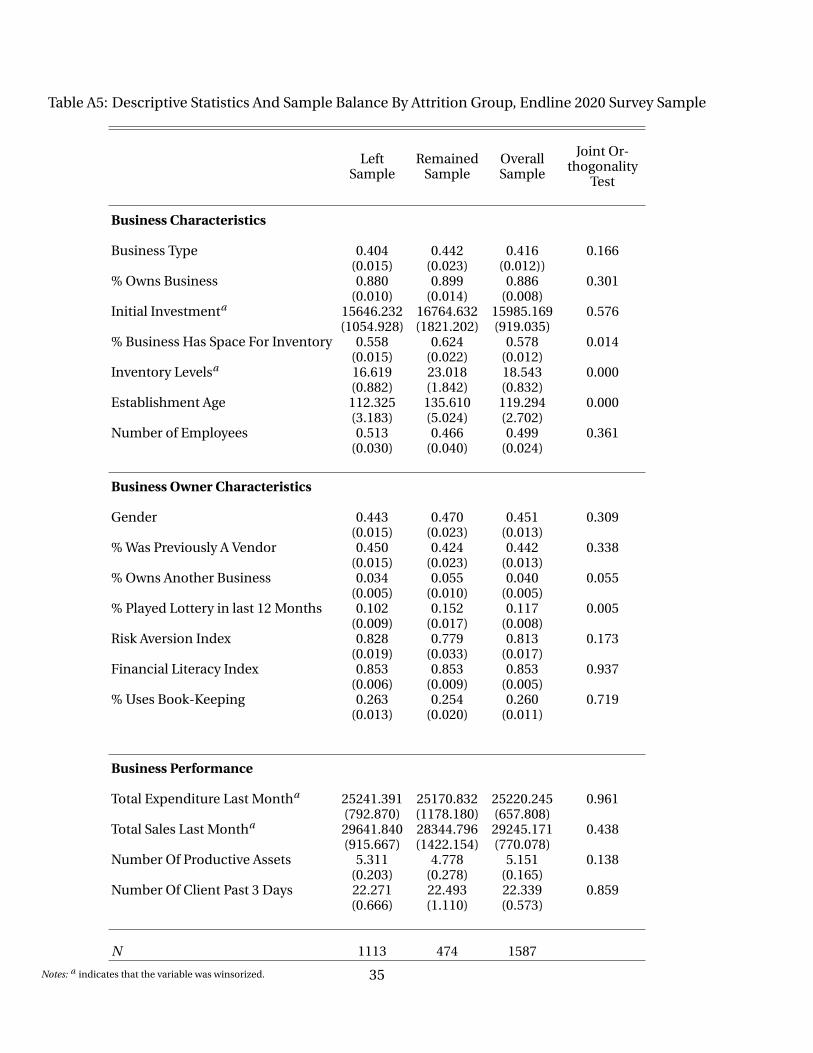
Table A5: Descriptive Statistics And Sample Balance By Attrition Group, Endline 2020 Survey Sample
LeftSample
RemainedSample
OverallSample
Joint Or-thogonality
Test
Business Characteristics
Business Type 0.404 0.442 0.416 0.166(0.015) (0.023) (0.012))
% Owns Business 0.880 0.899 0.886 0.301(0.010) (0.014) (0.008)
Initial Investmenta 15646.232 16764.632 15985.169 0.576(1054.928) (1821.202) (919.035)
% Business Has Space For Inventory 0.558 0.624 0.578 0.014(0.015) (0.022) (0.012)
Inventory Levelsa 16.619 23.018 18.543 0.000(0.882) (1.842) (0.832)
Establishment Age 112.325 135.610 119.294 0.000(3.183) (5.024) (2.702)
Number of Employees 0.513 0.466 0.499 0.361(0.030) (0.040) (0.024)
Business Owner Characteristics
Gender 0.443 0.470 0.451 0.309(0.015) (0.023) (0.013)
% Was Previously A Vendor 0.450 0.424 0.442 0.338(0.015) (0.023) (0.013)
% Owns Another Business 0.034 0.055 0.040 0.055(0.005) (0.010) (0.005)
% Played Lottery in last 12 Months 0.102 0.152 0.117 0.005(0.009) (0.017) (0.008)
Risk Aversion Index 0.828 0.779 0.813 0.173(0.019) (0.033) (0.017)
Financial Literacy Index 0.853 0.853 0.853 0.937(0.006) (0.009) (0.005)
% Uses Book-Keeping 0.263 0.254 0.260 0.719(0.013) (0.020) (0.011)
Business Performance
Total Expenditure Last Montha 25241.391 25170.832 25220.245 0.961(792.870) (1178.180) (657.808)
Total Sales Last Montha 29641.840 28344.796 29245.171 0.438(915.667) (1422.154) (770.078)
Number Of Productive Assets 5.311 4.778 5.151 0.138(0.203) (0.278) (0.165)
Number Of Client Past 3 Days 22.271 22.493 22.339 0.859(0.666) (1.110) (0.573)
N 1113 474 1587
Notes: a indicates that the variable was winsorized. 35
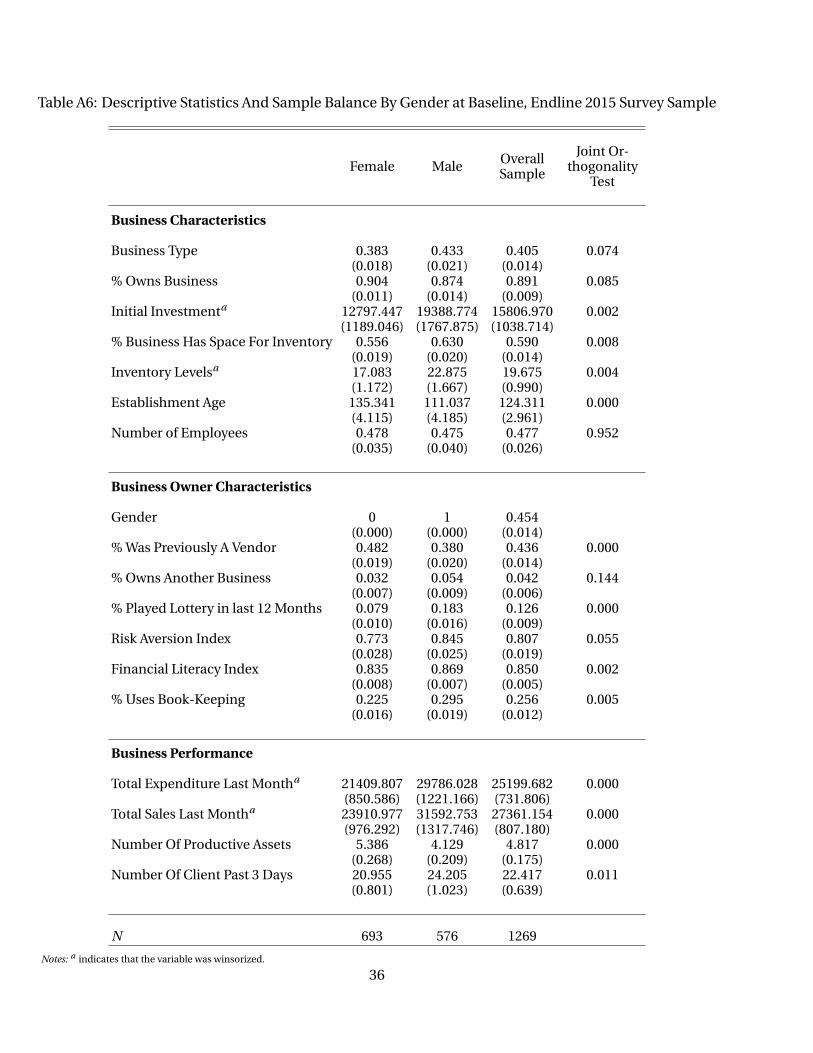
Table A6: Descriptive Statistics And Sample Balance By Gender at Baseline, Endline 2015 Survey Sample
Female Male OverallSample
Joint Or-thogonality
Test
Business Characteristics
Business Type 0.383 0.433 0.405 0.074(0.018) (0.021) (0.014)
% Owns Business 0.904 0.874 0.891 0.085(0.011) (0.014) (0.009)
Initial Investmenta 12797.447 19388.774 15806.970 0.002(1189.046) (1767.875) (1038.714)
% Business Has Space For Inventory 0.556 0.630 0.590 0.008(0.019) (0.020) (0.014)
Inventory Levelsa 17.083 22.875 19.675 0.004(1.172) (1.667) (0.990)
Establishment Age 135.341 111.037 124.311 0.000(4.115) (4.185) (2.961)
Number of Employees 0.478 0.475 0.477 0.952(0.035) (0.040) (0.026)
Business Owner Characteristics
Gender 0 1 0.454(0.000) (0.000) (0.014)
% Was Previously A Vendor 0.482 0.380 0.436 0.000(0.019) (0.020) (0.014)
% Owns Another Business 0.032 0.054 0.042 0.144(0.007) (0.009) (0.006)
% Played Lottery in last 12 Months 0.079 0.183 0.126 0.000(0.010) (0.016) (0.009)
Risk Aversion Index 0.773 0.845 0.807 0.055(0.028) (0.025) (0.019)
Financial Literacy Index 0.835 0.869 0.850 0.002(0.008) (0.007) (0.005)
% Uses Book-Keeping 0.225 0.295 0.256 0.005(0.016) (0.019) (0.012)
Business Performance
Total Expenditure Last Montha 21409.807 29786.028 25199.682 0.000(850.586) (1221.166) (731.806)
Total Sales Last Montha 23910.977 31592.753 27361.154 0.000(976.292) (1317.746) (807.180)
Number Of Productive Assets 5.386 4.129 4.817 0.000(0.268) (0.209) (0.175)
Number Of Client Past 3 Days 20.955 24.205 22.417 0.011(0.801) (1.023) (0.639)
N 693 576 1269
Notes: a indicates that the variable was winsorized.
36

Table A7: Descriptive Statistics And Sample Balance By Gender, Endline 2020 Survey Sample
Female Male OverallSample
Joint Or-thogonality
Test
Business Characteristics
Business Type 0.442 0.441 0.442 0.986(0.031) (0.033) (0.023)
% Owns Business 0.924 0.869 0.899 0.048(0.017) (0.023) (0.014)
Initial Investmenta 13350.824 20551.213 16764.632 0.048(2037.828) (3087.154) (1821.202)
% Business Has Space For Inventory 0.594 0.659 0.624 0.142(0.031) (0.032) (0.022)
Inventory Levelsa 18.726 27.828 23.018 0.013(2.079) (3.109) (1.842)
Establishment Age 142.976 127.273 135.610 0.119(6.746) (7.488) (5.024)
Number of Employees 0.446 0.488 0.466 0.596(0.053) (0.061) (0.040)
Business Owner Characteristics
Gender 0.000 1.000 0.470(0.000) (0.000) (0.023)
% Was Previously A Vendor 0.474 0.368 0.424 0.019(0.032) (0.032) (0.023)
% Owns Another Business 0.036 0.076 0.055 0.054(0.012) (0.018) (0.010)
% Played Lottery in last 12 Months 0.092 0.220 0.152 0.000(0.018) (0.028) (0.017)
Risk Aversion Index 0.758 0.799 0.779 0.536(0.048) (0.044) (0.033)
Financial Literacy Index 0.843 0.865 0.853 0.195(0.013) (0.012) (0.009)
% Uses Book-Keeping 0.196 0.321 0.254 0.002(0.025) (0.032) (0.020)
Business Performance
Total Expenditure Last Montha 21063.051 29796.712 25170.832 0.000(1363.762) (1935.787) (1178.180)
Total Sales Last Montha 23352.930 30048.928 26495.949 0.011(1613.717) (2127.588) (1323.575)
Number Of Productive Assets 5.414 4.063 4.778 0.015(0.440) (0.317) (0.278)
Number Of Client Past 3 Days 19.946 25.405 22.493 0.014(1.316) (1.824) (1.110)
N 251 223 474
Notes: a indicates that the variable was winsorized. 37

Table A8: Firm Survival in 2020 Endline Survey
(1) (2)Firm
Survival(Female)
FirmSurvival(Male)
Treatment
FL -0.027 -0.064[0.054] [0.063]
FL + MM -0.027 -0.104[0.053] [0.065]
MM -0.079 -0.098[0.053] [0.065]
Lee Bounds FL [ -0.22, 0.11] [ -0.32, 0.13]
Lee Bounds FL + MM [ -0.22, 0.16] [ -0.29, 0.04]
Lee Bounds MM [ -0.26, 0.05] [ -0.36, 0.09]
Control Group Mean 0.314 0.423Control Group St.d 0.466 0.496p-value FL = Comb 0.996 0.489p-value MM = Comb 0.282 0.929p-value MM = FL 0.297 0.539p-value MM = FL = Comb 0.470 0.743p-value MM + FL = Comb 0.274 0.504p-value MM + FL >= Comb 0.137 0.252
Controls YES YESMarket Fixed Effects YES YESSector Fixed Effects YES YESObservations 632 497Adjusted R-squared 0.027 0.028F-Statistic 1.694 5.459
Notes: Robust standard errors in parentheses. All models control for market fixed effects, sector fixed effects, the age of the business, the type ofbusiness (store or stall), the number of employees at baseline, an index of financial numeracy, inventory size at baseline, the entrepreneurs’ previousexperience as a business owner, and whether or not the entrepreneur has given/received a loan from a family member in the year prior to intervention.A firm is ’survived’ if they indicate on the follow up survey that the business is still in operation. Column (1) corresponds to female micro-entrepreneursand column (2) corresponds to male micro-entrepreneurs.
38

Table A9: Treatment Effects On Profits, Controlling For Endline Bookkeeping
Panel A: Female Entrepreneurs Panel B: Male Entrepreneurs
(1) (2) (3) (4) (5) (6) (7) (8) (9) (10)
OUTCOMESMonthly
Profit2015a
MonthlyProfit2015a
MonthlyProfit
2020at
MonthlyProfit
2020at
FinancialSecurity
Index 2015
MonthlyProfit2015a
MonthlyProfit2015a
MonthlyProfit
2020at
MonthlyProfit
2020at
FinancialSecurity
Index 2015
Treatment Condition
FL 4803.170 4511.597 383.718 752.814 0.062 4106.112 3920.521 -23.303 -601.873 -0.006[3152.428] [3272.560] [744.521] [886.355] [0.086] [4108.874] [4190.475] [993.999] [999.818] [0.074]
FL + MM 7047.315** 7480.638** 1742.866** 1904.573** 0.169* 2986.572 2511.670 342.062 157.870 0.053[3306.436] [3335.819] [762.525] [850.804] [0.087] [3965.387] [4205.396] [1087.851] [1129.923] [0.071]
MM -730.662 -1803.656 2169.163*** 2198.559*** 0.176** 2230.535 2070.114 -870.775 -1278.949 0.067[3700.272] [3739.580] [758.785] [805.694] [0.082] [3946.484] [4001.924] [970.072] [1005.174] [0.070]
Lee Bounds FL [ -8801, 15475] [ -8801, 15475] [ -1974, 1084] [ -1974, 1084] [ -0.14, 0.47] [ -8810, 23249] [ -8810, 23249] [ -1904, 2193] [ -1904, 2193] [ -0.22, 0.30]
Lee Bounds FL + MM [ -9243, 17240] [ -9243, 17240] [ -1588, 3950] [ -1588, 3950] [ -0.02, 0.54] [ -8193, 17410] [ -8193, 17410] [ -1915, 3838] [ -1915, 3838] [ -0.10, 0.31]
Lee Bounds MM [ -12391, 12484] [ -12391, 12484] [ 113, 3006] [ 113, 3006] [ 0.02, 0.47] [ -9322, 17788] [ -9322, 17788] [ -3558, 1617] [ -3558, 1617] [ -0.13, 0.31]
Control Group Mean -15391.222 -15240.542 1237.165 1211.001 2.554 -17934.495 -18980.823 2461.133 2576.169 2.750Control Group St.d 28910.876 29090.404 1722.386 1745.554 0.826 32948.503 33878.655 3720.650 3781.192 0.570p-value FL = Comb 0.430 0.306 0.067 0.144 0.183 0.752 0.703 0.729 0.501 0.412p-value MM = Comb 0.021 0.007 0.617 0.750 0.922 0.830 0.905 0.265 0.176 0.833p-value MM = FL 0.096 0.058 0.036 0.139 0.132 0.618 0.626 0.345 0.428 0.310p-value MM = FL = Comb 0.067 0.025 0.066 0.229 0.263 0.882 0.877 0.473 0.371 0.570p-value MM + FL = Comb 0.517 0.316 0.441 0.347 0.542 0.523 0.518 0.409 0.189 0.932p-value MM + FL >= Comb 0.258 0.158 0.779 0.826 0.729 0.738 0.741 0.205 0.095 0.534
Controls NO YES NO YES YES NO YES NO YES YESMarket Fixed Effects YES YES YES YES YES YES YES YES YES YESSector Fixed Effects YES YES YES YES YES YES YES YES YES YESObservations 573 554 137 134 633 477 444 133 123 502Adjusted R-squared 0.059 0.074 0.016 -0.047 0.067 0.065 0.072 -0.030 0.038 0.101F-Statistic 2.715 2.448 1.729 0.915 3.048 0.640 0.971 1.753 1.467 1.914
Notes: Robust standard errors in parentheses. All models control for the dependent variable’s baseline value (where possible), market fixed effects and sector fixed effects. The full set ofcontrols include the age of the business, the type of business (store or stall), the number of employees at baseline, an index of financial numeracy, inventory size at baseline, the entrepreneurs’previous experience as a business owner, log number of productive assets at baseline, whether or not the entrepreneur has given/received a loan from a family member in the year prior tointervention, and an index of endline bookkeeping. Models 1, 2, 5, 6, 7, and 10 correspond to an end line survey taken in July, 2015. Models 3, 4, 8 and 9 correspond to a follow-up surveytaken in November, 2020. a indicates that the outcome variable was winsorized and t indicates that the outcome variable was deflated to correspond to prices in 2015 *** p<0.01, ** p<0.05,* p<0.1
39
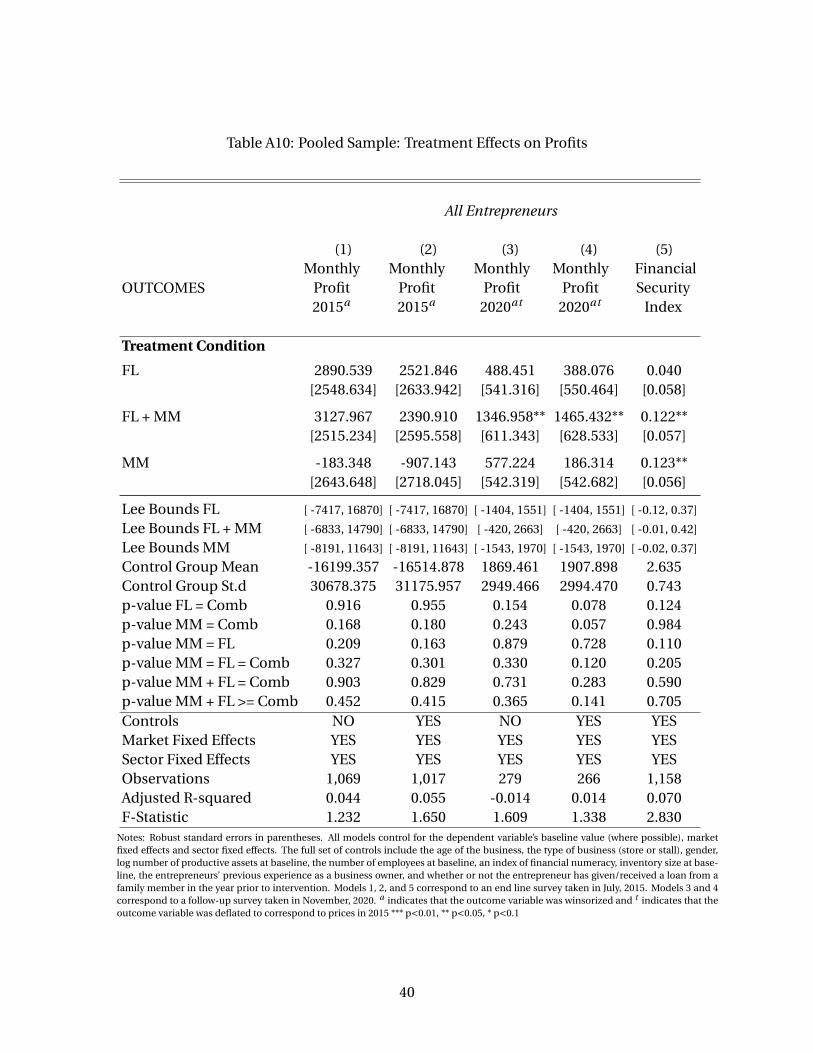
Table A10: Pooled Sample: Treatment Effects on Profits
All Entrepreneurs
(1) (2) (3) (4) (5)
OUTCOMESMonthly
Profit2015a
MonthlyProfit2015a
MonthlyProfit
2020at
MonthlyProfit
2020at
FinancialSecurity
Index
Treatment Condition
FL 2890.539 2521.846 488.451 388.076 0.040[2548.634] [2633.942] [541.316] [550.464] [0.058]
FL + MM 3127.967 2390.910 1346.958** 1465.432** 0.122**[2515.234] [2595.558] [611.343] [628.533] [0.057]
MM -183.348 -907.143 577.224 186.314 0.123**[2643.648] [2718.045] [542.319] [542.682] [0.056]
Lee Bounds FL [ -7417, 16870] [ -7417, 16870] [ -1404, 1551] [ -1404, 1551] [ -0.12, 0.37]
Lee Bounds FL + MM [ -6833, 14790] [ -6833, 14790] [ -420, 2663] [ -420, 2663] [ -0.01, 0.42]
Lee Bounds MM [ -8191, 11643] [ -8191, 11643] [ -1543, 1970] [ -1543, 1970] [ -0.02, 0.37]
Control Group Mean -16199.357 -16514.878 1869.461 1907.898 2.635Control Group St.d 30678.375 31175.957 2949.466 2994.470 0.743p-value FL = Comb 0.916 0.955 0.154 0.078 0.124p-value MM = Comb 0.168 0.180 0.243 0.057 0.984p-value MM = FL 0.209 0.163 0.879 0.728 0.110p-value MM = FL = Comb 0.327 0.301 0.330 0.120 0.205p-value MM + FL = Comb 0.903 0.829 0.731 0.283 0.590p-value MM + FL >= Comb 0.452 0.415 0.365 0.141 0.705Controls NO YES NO YES YESMarket Fixed Effects YES YES YES YES YESSector Fixed Effects YES YES YES YES YESObservations 1,069 1,017 279 266 1,158Adjusted R-squared 0.044 0.055 -0.014 0.014 0.070F-Statistic 1.232 1.650 1.609 1.338 2.830
Notes: Robust standard errors in parentheses. All models control for the dependent variable’s baseline value (where possible), marketfixed effects and sector fixed effects. The full set of controls include the age of the business, the type of business (store or stall), gender,log number of productive assets at baseline, the number of employees at baseline, an index of financial numeracy, inventory size at base-line, the entrepreneurs’ previous experience as a business owner, and whether or not the entrepreneur has given/received a loan from afamily member in the year prior to intervention. Models 1, 2, and 5 correspond to an end line survey taken in July, 2015. Models 3 and 4correspond to a follow-up survey taken in November, 2020. a indicates that the outcome variable was winsorized and t indicates that theoutcome variable was deflated to correspond to prices in 2015 *** p<0.01, ** p<0.05, * p<0.1
40
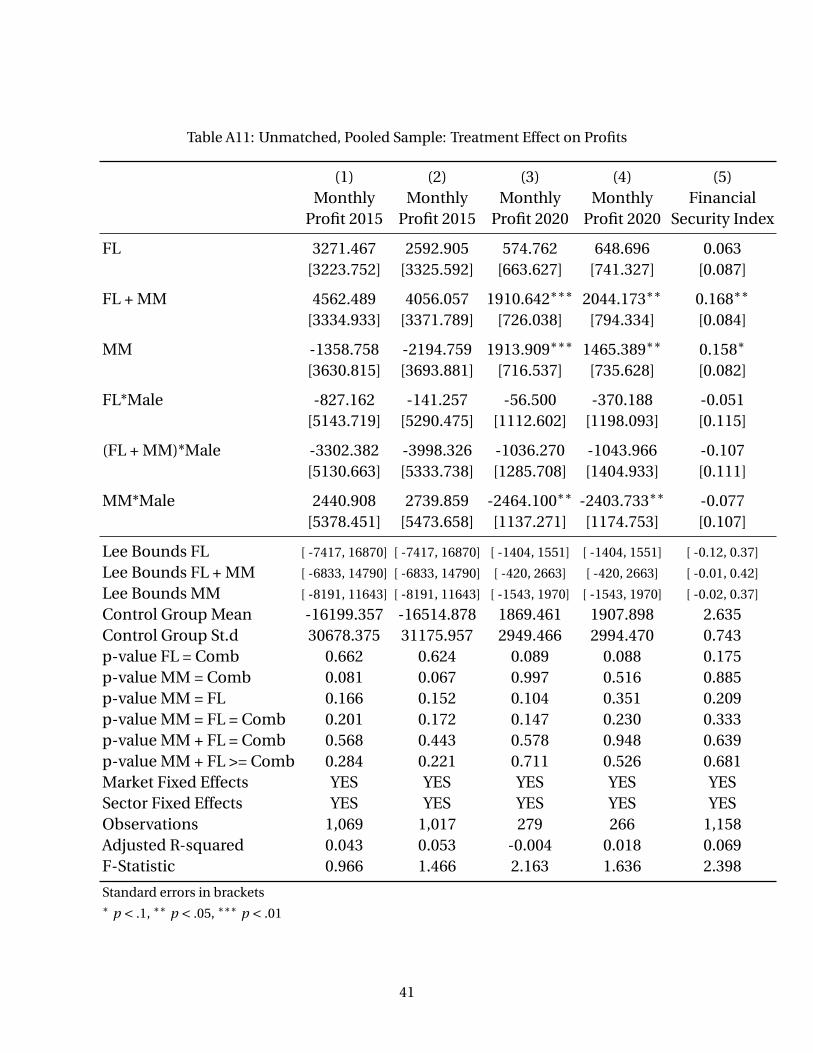
Table A11: Unmatched, Pooled Sample: Treatment Effect on Profits
(1) (2) (3) (4) (5)Monthly Monthly Monthly Monthly Financial
Profit 2015 Profit 2015 Profit 2020 Profit 2020 Security Index
FL 3271.467 2592.905 574.762 648.696 0.063[3223.752] [3325.592] [663.627] [741.327] [0.087]
FL + MM 4562.489 4056.057 1910.642∗∗∗ 2044.173∗∗ 0.168∗∗
[3334.933] [3371.789] [726.038] [794.334] [0.084]
MM -1358.758 -2194.759 1913.909∗∗∗ 1465.389∗∗ 0.158∗
[3630.815] [3693.881] [716.537] [735.628] [0.082]
FL*Male -827.162 -141.257 -56.500 -370.188 -0.051[5143.719] [5290.475] [1112.602] [1198.093] [0.115]
(FL + MM)*Male -3302.382 -3998.326 -1036.270 -1043.966 -0.107[5130.663] [5333.738] [1285.708] [1404.933] [0.111]
MM*Male 2440.908 2739.859 -2464.100∗∗ -2403.733∗∗ -0.077[5378.451] [5473.658] [1137.271] [1174.753] [0.107]
Lee Bounds FL [ -7417, 16870] [ -7417, 16870] [ -1404, 1551] [ -1404, 1551] [ -0.12, 0.37]
Lee Bounds FL + MM [ -6833, 14790] [ -6833, 14790] [ -420, 2663] [ -420, 2663] [ -0.01, 0.42]
Lee Bounds MM [ -8191, 11643] [ -8191, 11643] [ -1543, 1970] [ -1543, 1970] [ -0.02, 0.37]
Control Group Mean -16199.357 -16514.878 1869.461 1907.898 2.635Control Group St.d 30678.375 31175.957 2949.466 2994.470 0.743p-value FL = Comb 0.662 0.624 0.089 0.088 0.175p-value MM = Comb 0.081 0.067 0.997 0.516 0.885p-value MM = FL 0.166 0.152 0.104 0.351 0.209p-value MM = FL = Comb 0.201 0.172 0.147 0.230 0.333p-value MM + FL = Comb 0.568 0.443 0.578 0.948 0.639p-value MM + FL >= Comb 0.284 0.221 0.711 0.526 0.681Market Fixed Effects YES YES YES YES YESSector Fixed Effects YES YES YES YES YESObservations 1,069 1,017 279 266 1,158Adjusted R-squared 0.043 0.053 -0.004 0.018 0.069F-Statistic 0.966 1.466 2.163 1.636 2.398
Standard errors in brackets∗ p < .1, ∗∗ p < .05, ∗∗∗ p < .01
41

Table A12: Mechanisms, Male Entrepreneurs
Panel A: Business Practices Panel B: Mobile Money Usage
(1) (2) (3) (4) (5) (6) (7) (8)
OUTCOMESFinancialLiteracy
Index
NumericalLiteracy
Index
Book-Keeping
Index
Remit. ToFamilyt
ReportsUsing MM
ReportedMM
Savingsm
WeeklyMM
Balancem
WeeklyTransaction
Valuem
Treatment Condition
FL 0.076*** 0.006 0.386** 662.107 0.001 -0.762 -0.024 0.024[0.021] [0.024] [0.150] [624.976] [0.050] [0.832] [0.120] [0.020]
FL + MM 0.076*** -0.011 0.427*** -401.096 0.380*** 0.068 1.908*** 0.112***[0.023] [0.024] [0.157] [374.613] [0.061] [0.704] [0.189] [0.029]
MM -0.019 -0.010 -0.062 -297.320 0.242*** -0.426 2.023*** 0.112***[0.023] [0.025] [0.143] [401.592] [0.060] [0.702] [0.180] [0.025]
Lee Bounds FL [ 0.03, 0.13] [ -0.07, 0.12] [ -0.32, 0.99] [ -1103, 1427] [ -0.18, 0.07] [ -2.70, 1.71] [ -0.24, 0.03] [ -0.01, 0.03]
Lee Bounds FL + MM [ 0.05, 0.13] [ -0.06, 0.07] [ -0.05, 0.77] [ -999, 709] [ 0.21, 0.49] [ -3.08, 4.72] [ 1.78, 1.94] [ -0.01, 0.12]
Lee Bounds MM [ -0.06, 0.04] [ -0.09, 0.09] [ -0.67, 0.30] [ -914, 305] [ 0.12, 0.42] [ -3.68, 3.88] [ 1.87, 2.21] [ -0.01, 0.18]
Control Group Mean 0.652 0.834 0.963 701.867 0.147 3.115 0.231 0.006Control Group St.d 0.178 0.186 1.113 1911.859 0.356 2.225 0.970 0.182p-value FL = Comb 0.984 0.498 0.790 0.057 0.000 0.283 0.000 0.010p-value MM = Comb 0.000 0.960 0.001 0.738 0.036 0.365 0.618 0.983p-value MM = FL 0.000 0.538 0.001 0.043 0.000 0.632 0.000 0.003p-value MM = FL = Comb 0.000 0.754 0.001 0.119 0.000 0.507 0.000 0.004p-value MM + FL = Comb 0.518 0.845 0.625 0.321 0.102 0.231 0.724 0.554p-value MM + FL >= Comb 0.259 0.577 0.312 0.839 0.051 0.115 0.638 0.723
Controls YES YES YES YES YES YES YES YESMarket Fixed Effects YES YES YES YES YES YES YES YESSector Fixed Effects YES YES YES YES YES YES YES YESObservations 513 517 501 183 448 150 100,360 100,360Adjusted R-squared 0.059 0.039 0.063 0.005 0.149 0.082 0.330 0.088F-Statistic 3.750 1.614 2.434 0.900 5.805 5.174 10.261 1.778
Notes: Robust standard errors in parentheses. All models control for the dependent variable’s baseline value (where possible), market fixed effects, sector fixed effects, the age of the business, the typeof business (store or stall), the number of employees at baseline, an index of financial numeracy, inventory size at baseline, the entrepreneurs’ previous experience as a business owner, and whether ornot the entrepreneur has given/received a loan from a family member in the year prior to intervention. The dependent variable in models 1, 2, 3, 5, and 6 correspond to its value in the end line survey(July, 2015), while model 4 corresponds to it’s value in the follow-up survey (November, 2020). Models 7 and 8 correspond to an administrative data set from the mobile money operator that tracks mobilemoney usage and account balances from June 2014 to February 2018. t indicates that the outcome variable was deflated to correspond to prices in 2015, and m indicates that that the dependent variablewas log transformed. *** p<0.01, ** p<0.05, * p<0.1
42
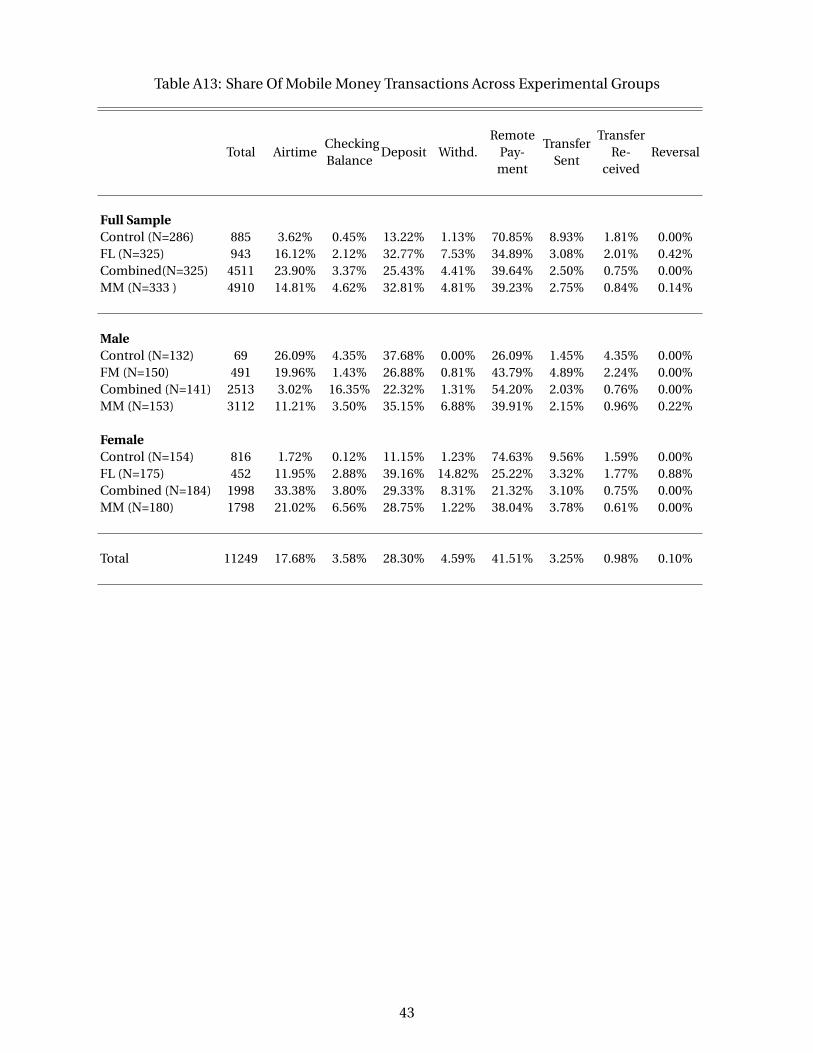
Table A13: Share Of Mobile Money Transactions Across Experimental Groups
Total AirtimeCheckingBalance
Deposit Withd.Remote
Pay-ment
TransferSent
TransferRe-
ceivedReversal
Full SampleControl (N=286) 885 3.62% 0.45% 13.22% 1.13% 70.85% 8.93% 1.81% 0.00%FL (N=325) 943 16.12% 2.12% 32.77% 7.53% 34.89% 3.08% 2.01% 0.42%Combined(N=325) 4511 23.90% 3.37% 25.43% 4.41% 39.64% 2.50% 0.75% 0.00%MM (N=333 ) 4910 14.81% 4.62% 32.81% 4.81% 39.23% 2.75% 0.84% 0.14%
MaleControl (N=132) 69 26.09% 4.35% 37.68% 0.00% 26.09% 1.45% 4.35% 0.00%FM (N=150) 491 19.96% 1.43% 26.88% 0.81% 43.79% 4.89% 2.24% 0.00%Combined (N=141) 2513 3.02% 16.35% 22.32% 1.31% 54.20% 2.03% 0.76% 0.00%MM (N=153) 3112 11.21% 3.50% 35.15% 6.88% 39.91% 2.15% 0.96% 0.22%
FemaleControl (N=154) 816 1.72% 0.12% 11.15% 1.23% 74.63% 9.56% 1.59% 0.00%FL (N=175) 452 11.95% 2.88% 39.16% 14.82% 25.22% 3.32% 1.77% 0.88%Combined (N=184) 1998 33.38% 3.80% 29.33% 8.31% 21.32% 3.10% 0.75% 0.00%MM (N=180) 1798 21.02% 6.56% 28.75% 1.22% 38.04% 3.78% 0.61% 0.00%
Total 11249 17.68% 3.58% 28.30% 4.59% 41.51% 3.25% 0.98% 0.10%
43
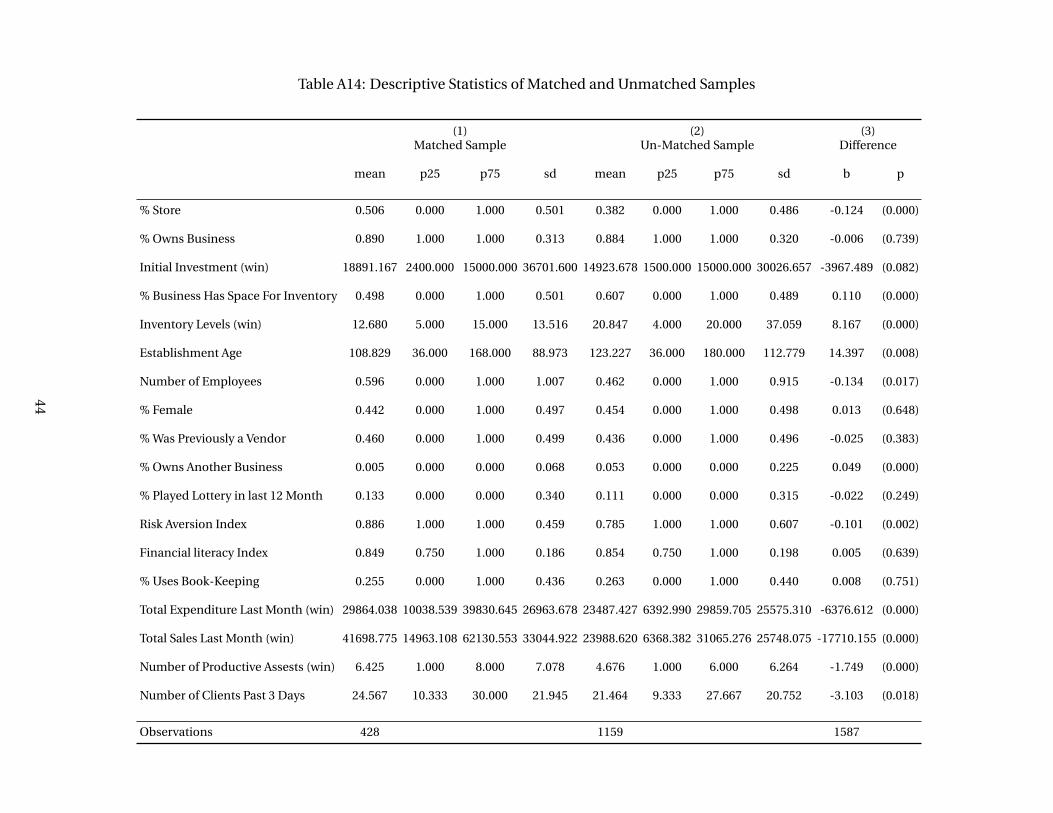
Table A14: Descriptive Statistics of Matched and Unmatched Samples
(1) (2) (3)Matched Sample Un-Matched Sample Difference
mean p25 p75 sd mean p25 p75 sd b p
% Store 0.506 0.000 1.000 0.501 0.382 0.000 1.000 0.486 -0.124 (0.000)
% Owns Business 0.890 1.000 1.000 0.313 0.884 1.000 1.000 0.320 -0.006 (0.739)
Initial Investment (win) 18891.167 2400.000 15000.000 36701.600 14923.678 1500.000 15000.000 30026.657 -3967.489 (0.082)
% Business Has Space For Inventory 0.498 0.000 1.000 0.501 0.607 0.000 1.000 0.489 0.110 (0.000)
Inventory Levels (win) 12.680 5.000 15.000 13.516 20.847 4.000 20.000 37.059 8.167 (0.000)
Establishment Age 108.829 36.000 168.000 88.973 123.227 36.000 180.000 112.779 14.397 (0.008)
Number of Employees 0.596 0.000 1.000 1.007 0.462 0.000 1.000 0.915 -0.134 (0.017)
% Female 0.442 0.000 1.000 0.497 0.454 0.000 1.000 0.498 0.013 (0.648)
% Was Previously a Vendor 0.460 0.000 1.000 0.499 0.436 0.000 1.000 0.496 -0.025 (0.383)
% Owns Another Business 0.005 0.000 0.000 0.068 0.053 0.000 0.000 0.225 0.049 (0.000)
% Played Lottery in last 12 Month 0.133 0.000 0.000 0.340 0.111 0.000 0.000 0.315 -0.022 (0.249)
Risk Aversion Index 0.886 1.000 1.000 0.459 0.785 1.000 1.000 0.607 -0.101 (0.002)
Financial literacy Index 0.849 0.750 1.000 0.186 0.854 0.750 1.000 0.198 0.005 (0.639)
% Uses Book-Keeping 0.255 0.000 1.000 0.436 0.263 0.000 1.000 0.440 0.008 (0.751)
Total Expenditure Last Month (win) 29864.038 10038.539 39830.645 26963.678 23487.427 6392.990 29859.705 25575.310 -6376.612 (0.000)
Total Sales Last Month (win) 41698.775 14963.108 62130.553 33044.922 23988.620 6368.382 31065.276 25748.075 -17710.155 (0.000)
Number of Productive Assests (win) 6.425 1.000 8.000 7.078 4.676 1.000 6.000 6.264 -1.749 (0.000)
Number of Clients Past 3 Days 24.567 10.333 30.000 21.945 21.464 9.333 27.667 20.752 -3.103 (0.018)
Observations 428 1159 1587
44
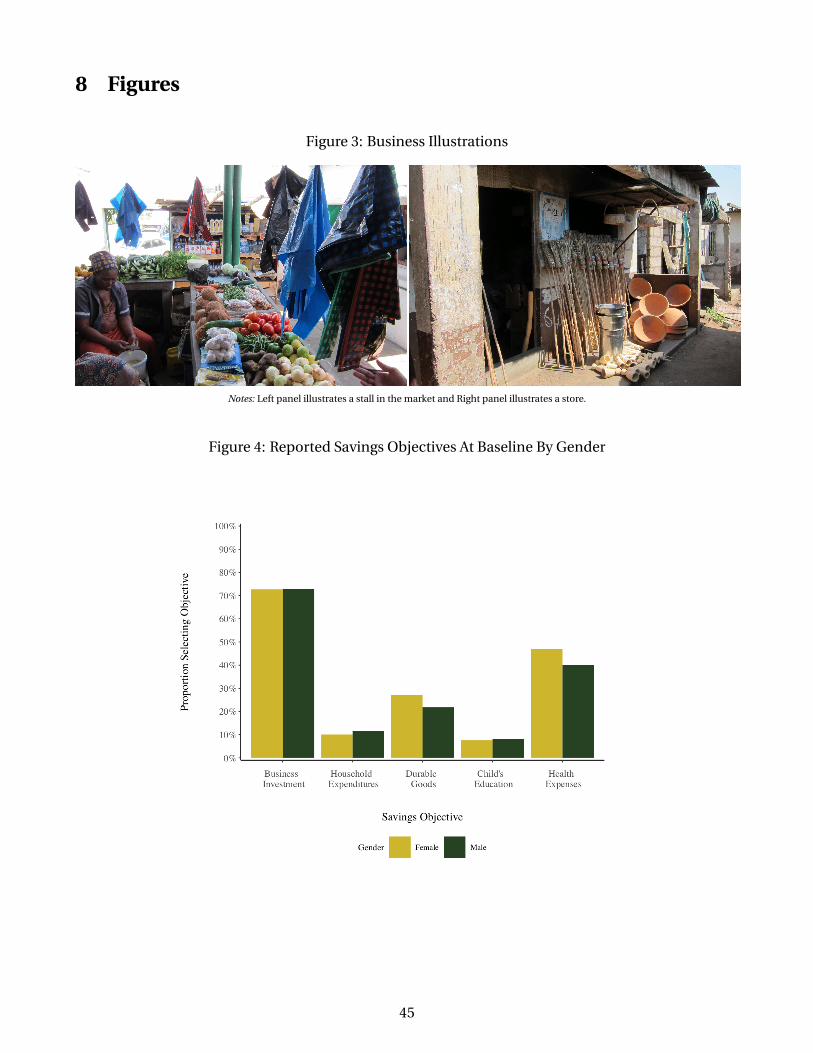
8 Figures
Figure 3: Business Illustrations
Notes: Left panel illustrates a stall in the market and Right panel illustrates a store.
Figure 4: Reported Savings Objectives At Baseline By Gender
45
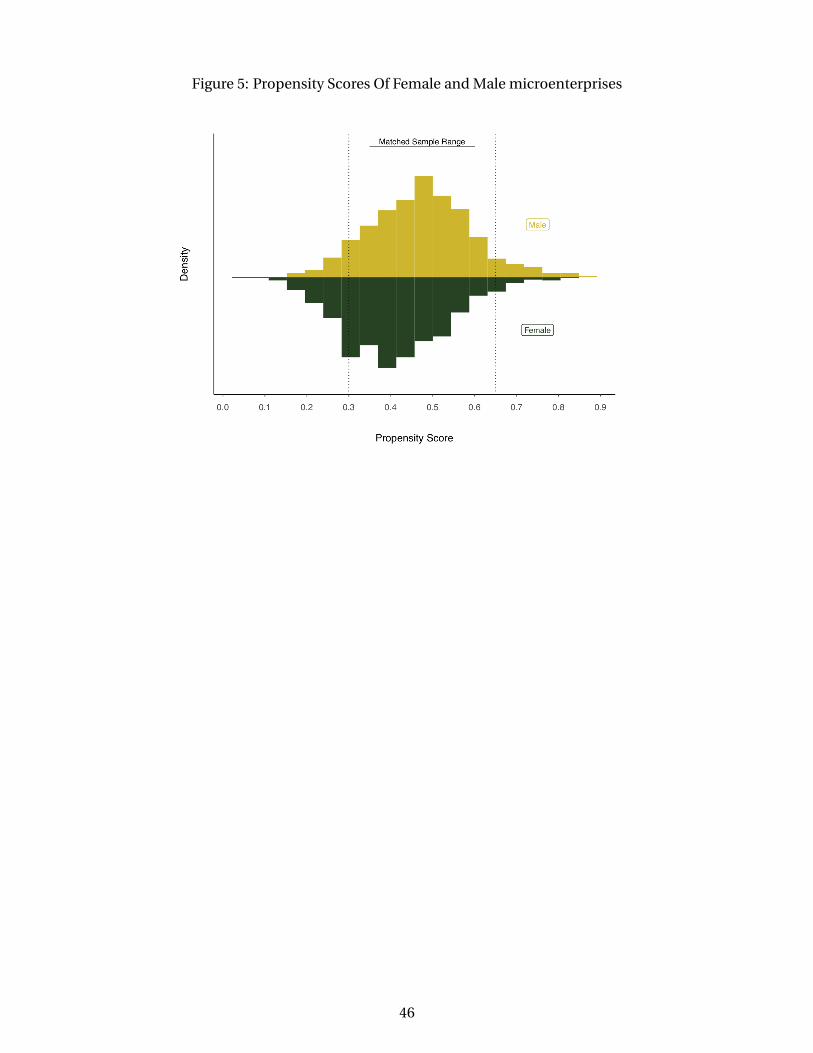
Figure 5: Propensity Scores Of Female and Male microenterprises
46

Figure 6: Closing the Gender Gap on Profit, Mobile Money Treatment
0.0%
10.0%
20.0%
30.0%
40.0%
50.0%
60.0%
70.0%
80.0%
90.0%
100.0%
0 5000 10000 15000 20000 25000
Monthly Profit 2015 (Meticais)
Cum
ulat
ive
Dis
tribu
tion
Female Control Female MM Male Control
Panel A: Profit 2015
0.0%
10.0%
20.0%
30.0%
40.0%
50.0%
60.0%
70.0%
80.0%
90.0%
100.0%
0 2000 4000 6000 8000 10000
Monthly Profit 2020 (Meticais)
Cum
ulat
ive
Dis
tribu
tion
Female Control Female MM Male Control
Panel B: Profit 2020
0.0%
10.0%
20.0%
30.0%
40.0%
50.0%
60.0%
70.0%
80.0%
90.0%
100.0%
0.0 0.5 1.0 1.5 2.0 2.5 3.0
Bookkeeping Uses
Cum
ulat
ive
Dis
tribu
tion
Female Control Female MM Male Control
Panel C: Bookkeeping Uses
0.0%
10.0%
20.0%
30.0%
40.0%
50.0%
60.0%
70.0%
80.0%
90.0%
100.0%
0.0 0.2 0.4 0.6 0.8 1.0
Financial Literacy Index
Cum
ulat
ive
Dis
tribu
tion
Female Control Female MM Male Control
Panel D: Financial Literacy Index
47
Figure 7: Front Cover Of The Manual Designed To Support Financial Management Training
MANUAL DE FORMAÇÃO DOS MICRO-EMPRESÁRIOS NOS
MERCADOS URBANOS DA CIDADE DE MAPUTO
Training Manual for microentrepreneurs Operating in the Urban Markets of the City of Maputo
48
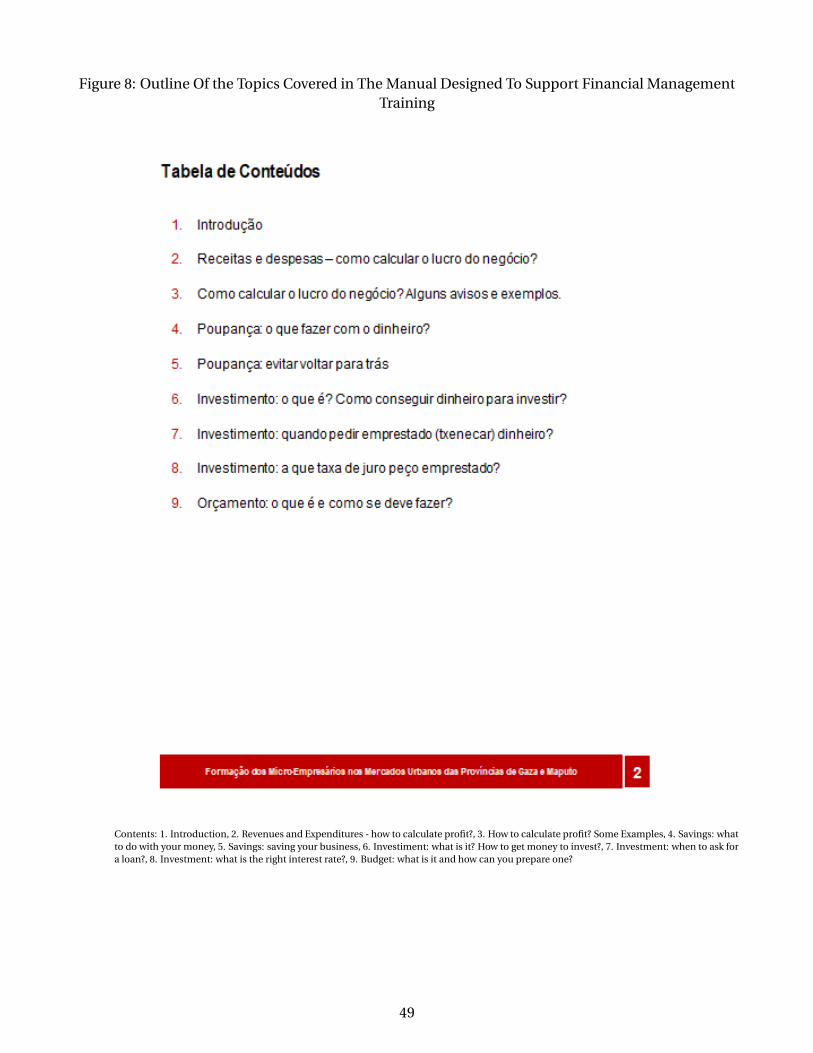
Figure 8: Outline Of the Topics Covered in The Manual Designed To Support Financial ManagementTraining
Contents: 1. Introduction, 2. Revenues and Expenditures - how to calculate profit?, 3. How to calculate profit? Some Examples, 4. Savings: whatto do with your money, 5. Savings: saving your business, 6. Investiment: what is it? How to get money to invest?, 7. Investment: when to ask fora loan?, 8. Investment: what is the right interest rate?, 9. Budget: what is it and how can you prepare one?
49
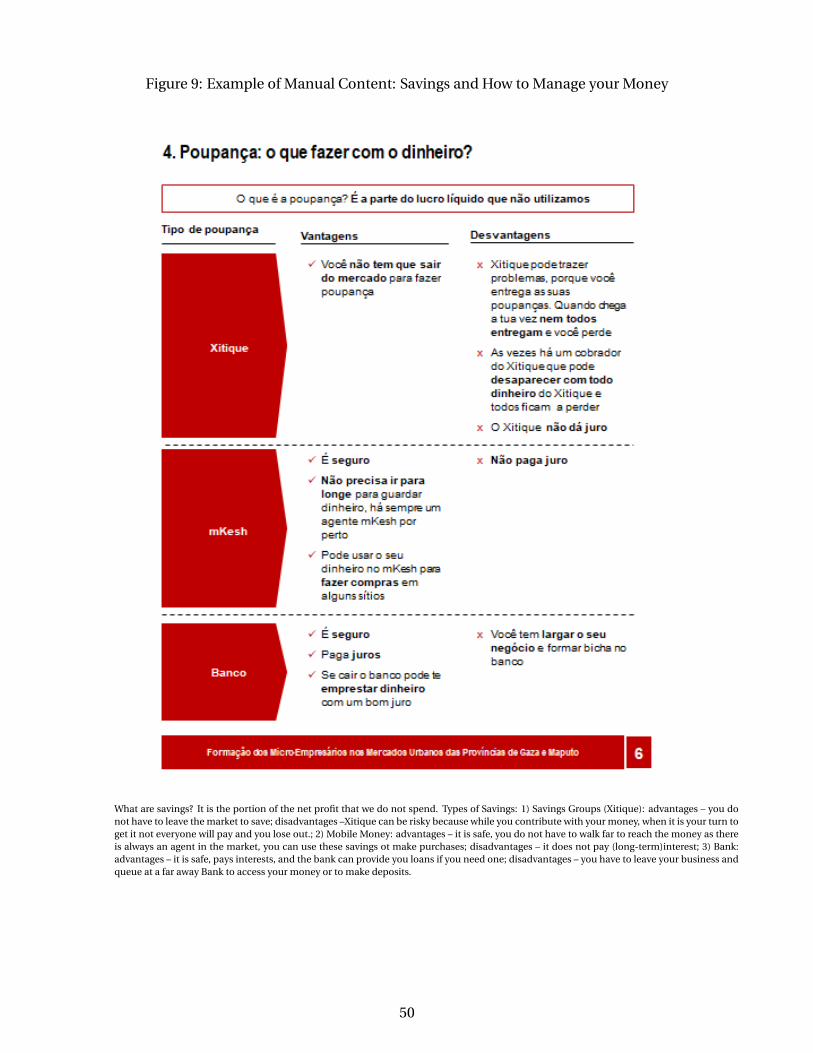
Figure 9: Example of Manual Content: Savings and How to Manage your Money
What are savings? It is the portion of the net profit that we do not spend. Types of Savings: 1) Savings Groups (Xitique): advantages – you donot have to leave the market to save; disadvantages –Xitique can be risky because while you contribute with your money, when it is your turn toget it not everyone will pay and you lose out.; 2) Mobile Money: advantages – it is safe, you do not have to walk far to reach the money as thereis always an agent in the market, you can use these savings ot make purchases; disadvantages – it does not pay (long-term)interest; 3) Bank:advantages – it is safe, pays interests, and the bank can provide you loans if you need one; disadvantages – you have to leave your business andqueue at a far away Bank to access your money or to make deposits.
50
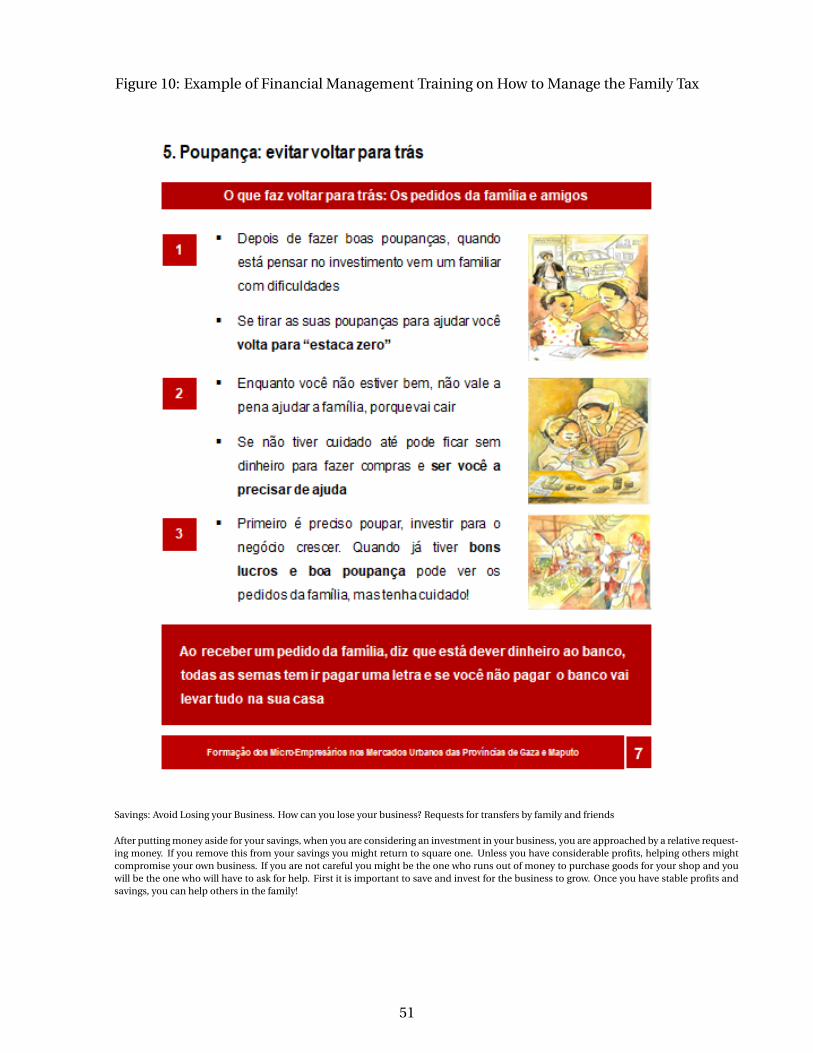
Figure 10: Example of Financial Management Training on How to Manage the Family Tax
Savings: Avoid Losing your Business. How can you lose your business? Requests for transfers by family and friends
After putting money aside for your savings, when you are considering an investment in your business, you are approached by a relative request-ing money. If you remove this from your savings you might return to square one. Unless you have considerable profits, helping others mightcompromise your own business. If you are not careful you might be the one who runs out of money to purchase goods for your shop and youwill be the one who will have to ask for help. First it is important to save and invest for the business to grow. Once you have stable profits andsavings, you can help others in the family!
51

Figure 11: Example of Financial Management Training Manual: How To Prepare A Budget.
Budget: what is it and how do you prepare one? Four Steps to preparing a budget
Estimating Shopping Expenditures - how to calculate it?
– Once you estimate and predict your sales, you can predict what would be the required purchases. When you are predicting purchases,remember that prices might vary!
– Example: Mr Ezequiel already estimated his sales for next month. Next month he will have to buy 100 bags of potatoes to sell in his stall.At present, Mr Ezequiel buys each potato bag at 240 MT. He expects prices to increase to 245 MT in the next 3 months. Purchases = Priceper bag x Number of Bags that are needed. Example: 245 MTx100 bags=24500 MT. Mr Ezequiel will spend 24,500 MT to buy is stock.
52
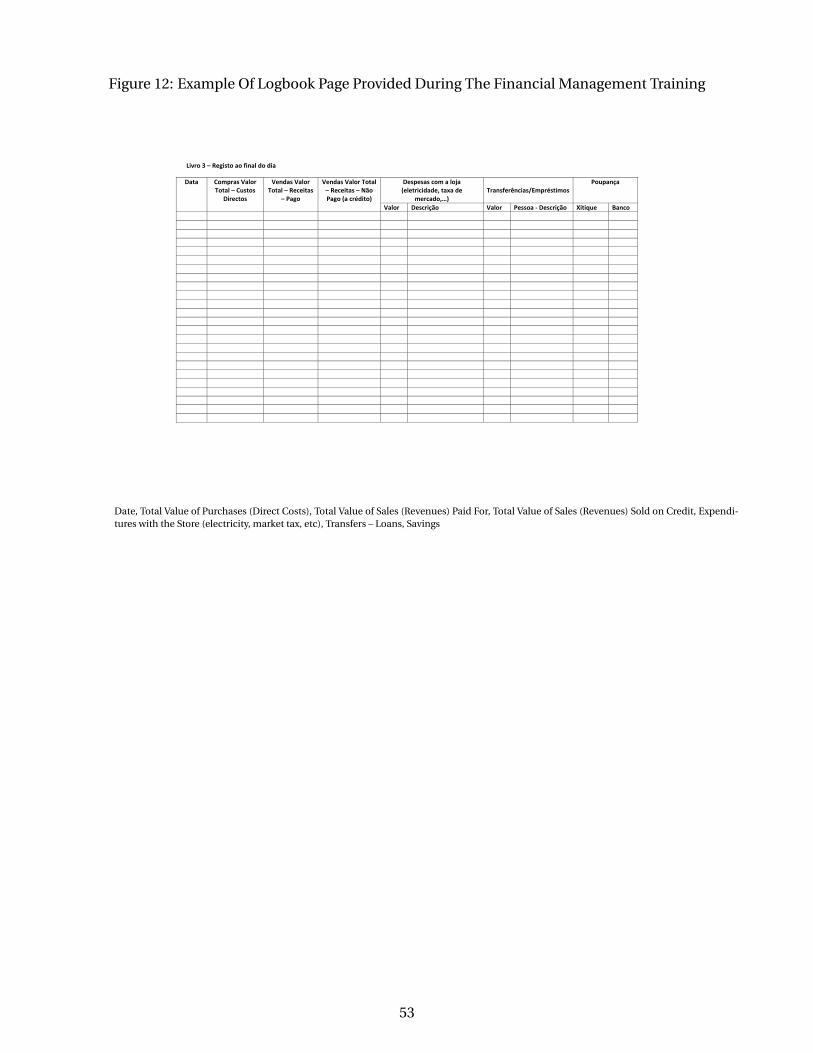
Figure 12: Example Of Logbook Page Provided During The Financial Management Training
Livro 3 – Registo ao final do dia
Data Compras Valor Total – Custos
Directos
Vendas Valor Total – Receitas
– Pago
Vendas Valor Total – Receitas – Não Pago (a crédito)
Despesas com a loja (eletricidade, taxa de
mercado,…) Transferências/Empréstimos
Poupança
Valor Descrição Valor Pessoa ‐ Descrição Xitique Banco
Date, Total Value of Purchases (Direct Costs), Total Value of Sales (Revenues) Paid For, Total Value of Sales (Revenues) Sold on Credit, Expendi-tures with the Store (electricity, market tax, etc), Transfers – Loans, Savings
53
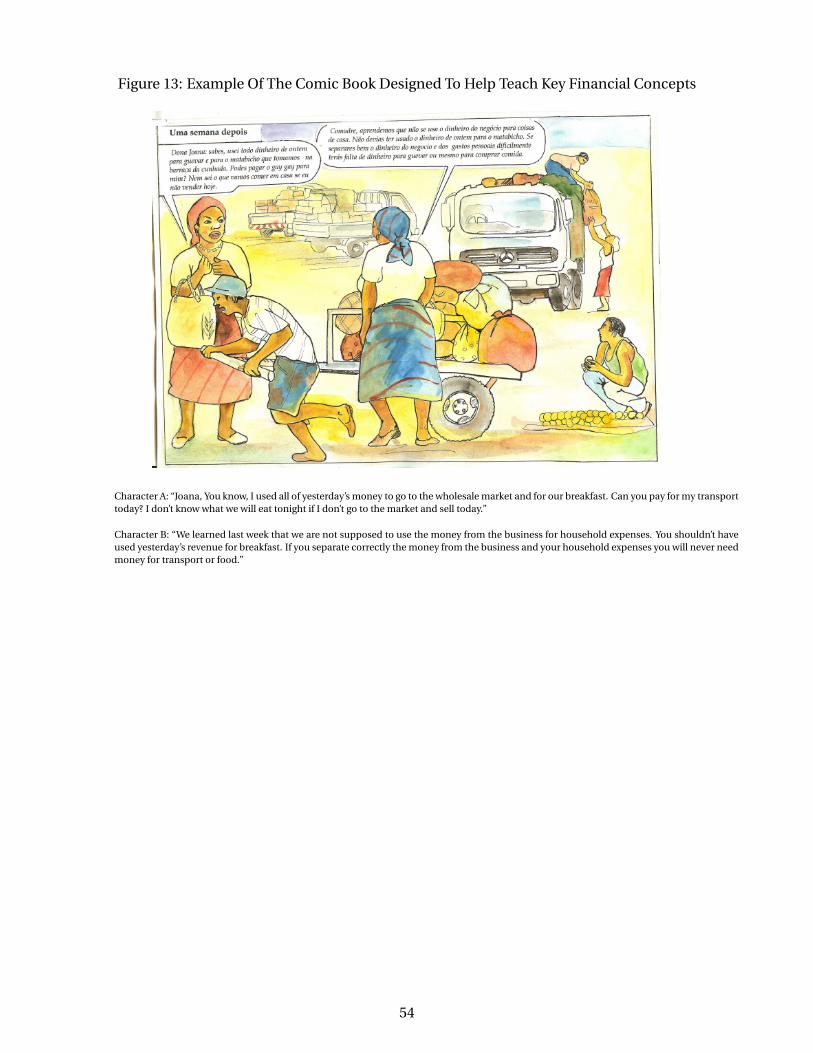
Figure 13: Example Of The Comic Book Designed To Help Teach Key Financial Concepts
Character A: “Joana, You know, I used all of yesterday’s money to go to the wholesale market and for our breakfast. Can you pay for my transporttoday? I don’t know what we will eat tonight if I don’t go to the market and sell today.”
Character B: “We learned last week that we are not supposed to use the money from the business for household expenses. You shouldn’t haveused yesterday’s revenue for breakfast. If you separate correctly the money from the business and your household expenses you will never needmoney for transport or food.”
54

Figure 14: Example Of The Comic Book Designed To Help Teach Key Financial Concepts
Character A: “I don’t believe you. The next thing you are going to tell me is that they also give you interest. But why don’t you save your moneyin the savings group or at the Bank?”
Character B: “The Bank is always packed and it is far away. By the time I leave the market it is already closed. Here I know I have my agent closeby. I have had many problems with the savings group (xitique). When it is my turn to get the money I am not paid. Enough.”
55