Embed Size (px)
Citation preview
October, 2006
How to access OECD statistical information
- an interactive workshop for delegations
October, 2006 2
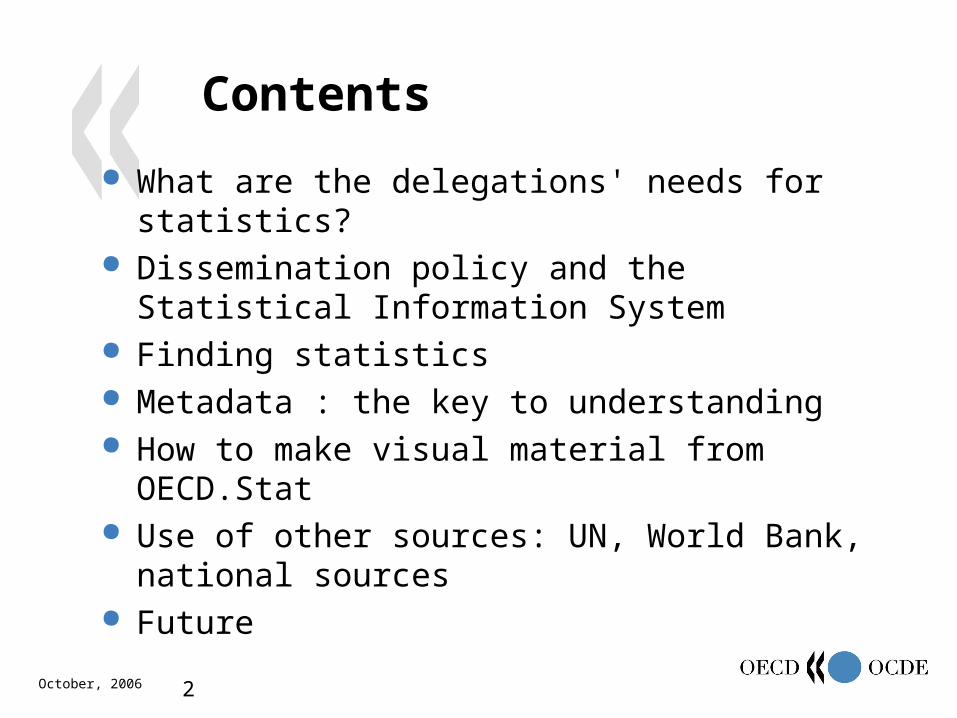
Contents
What are the delegations' needs for statistics? Dissemination policy and the Statistical
Information System Finding statistics Metadata : the key to understanding How to make visual material from OECD.Stat Use of other sources: UN, World Bank,
national sources Future
October, 2006 3
What are the delegations' needs for statistics?
October, 2006 4
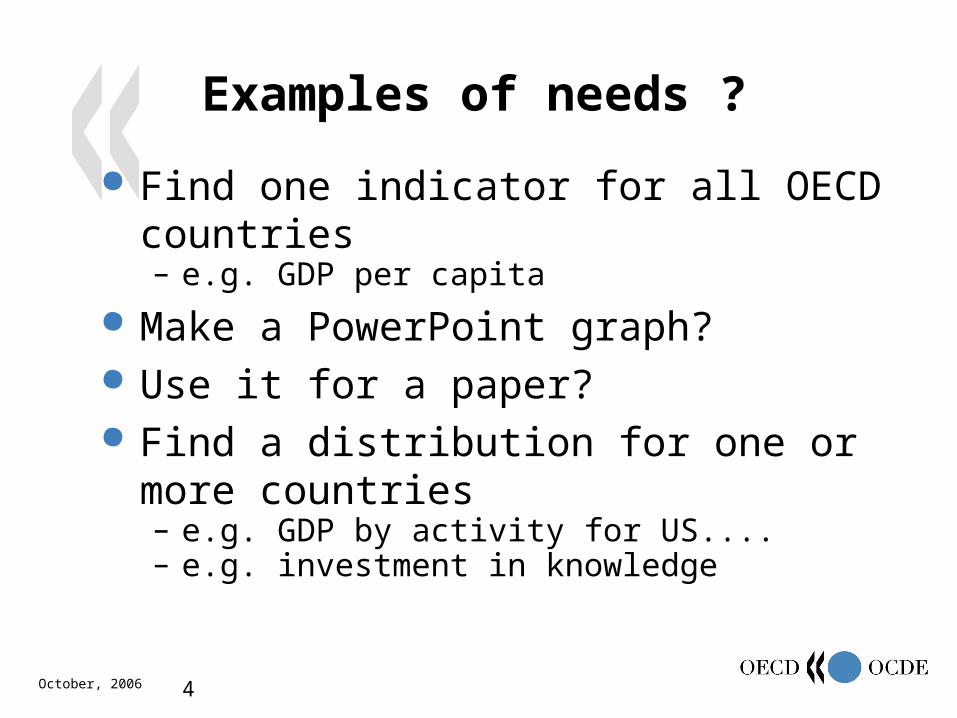
Examples of needs ?
Find one indicator for all OECD countries– e.g. GDP per capita
Make a PowerPoint graph? Use it for a paper? Find a distribution for one or more countries
– e.g. GDP by activity for US....– e.g. investment in knowledge
October, 2006 5
Examples: Austria
FDI Commodity trade Trade in services

October, 2006 6
Dissemination policy and the Statistical Information System
October, 2006 7
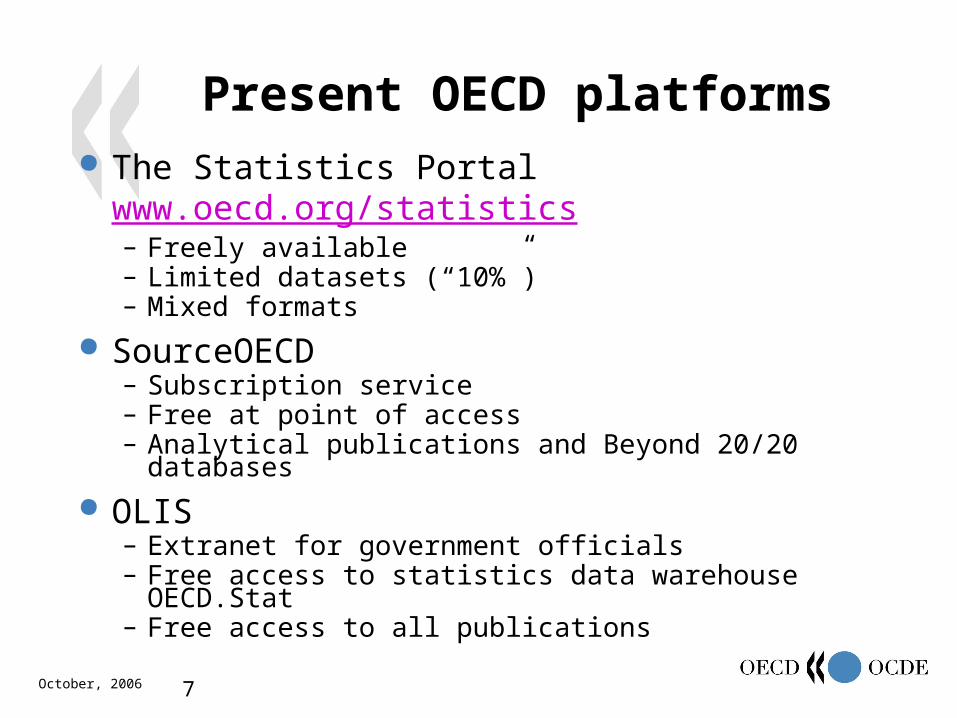
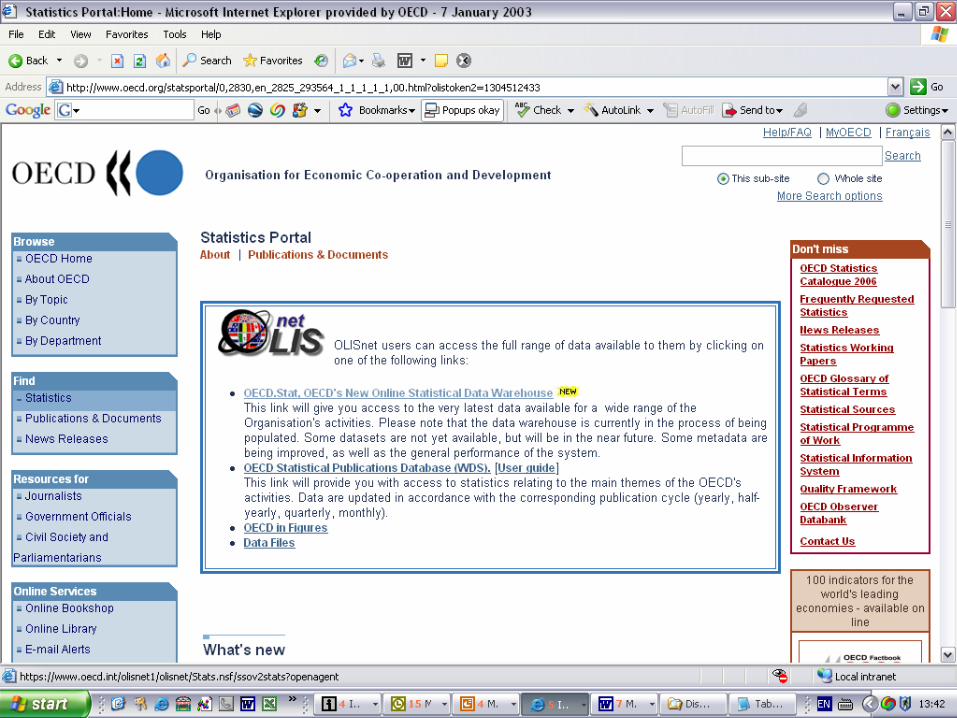
Present OECD platforms The Statistics Portal www.oecd.org/statistics
– Freely available– Limited datasets (“10%”)– Mixed formats
SourceOECD– Subscription service– Free at point of access– Analytical publications and Beyond 20/20 databases
OLIS– Extranet for government officials– Free access to statistics data warehouse OECD.Stat – Free access to all publications
October, 2006 8
Some trends
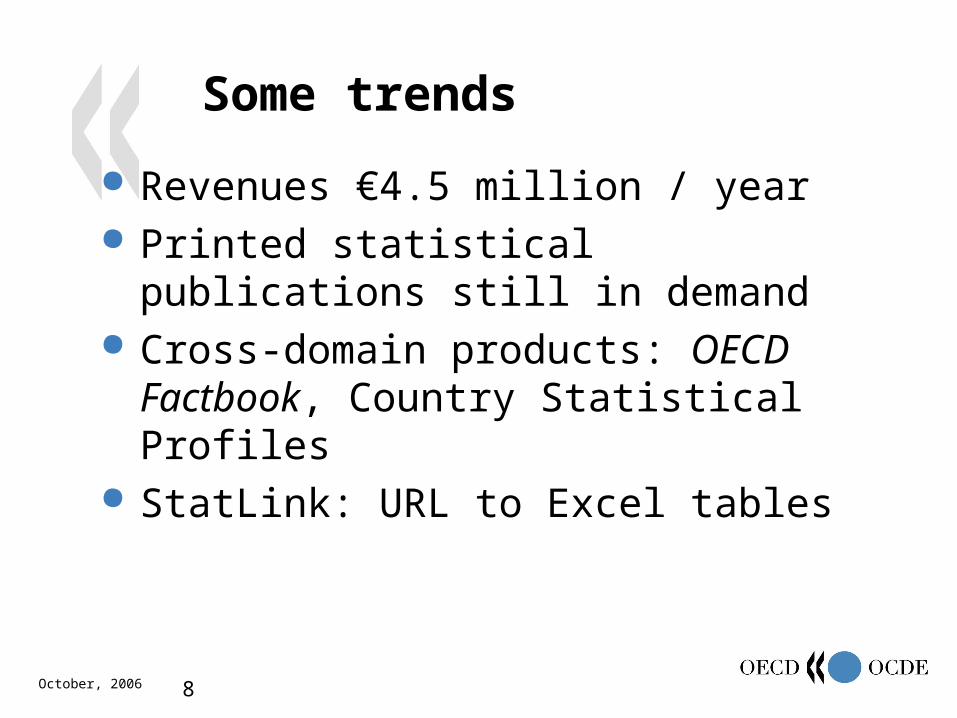
Revenues €4.5 million / year Printed statistical publications still in
demand Cross-domain products: OECD Factbook,
Country Statistical Profiles StatLink: URL to Excel tables
October, 2006 9
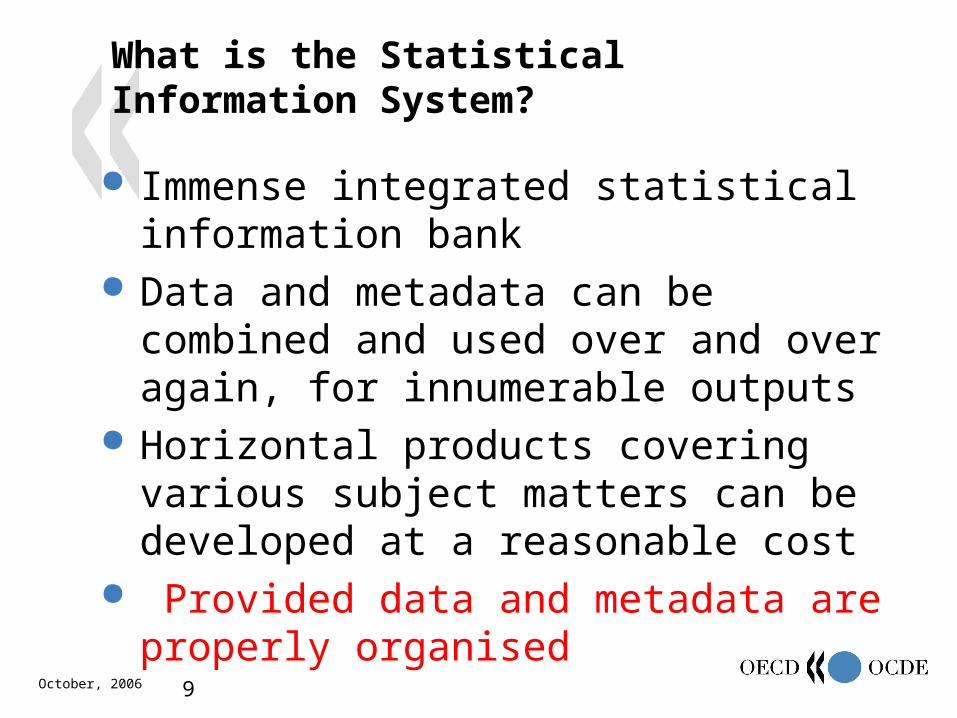
What is the Statistical Information System?
Immense integrated statistical information bank
Data and metadata can be combined and used over and over again, for innumerable outputs
Horizontal products covering various subject matters can be developed at a reasonable cost
Provided data and metadata are properly organised
October, 2006 10
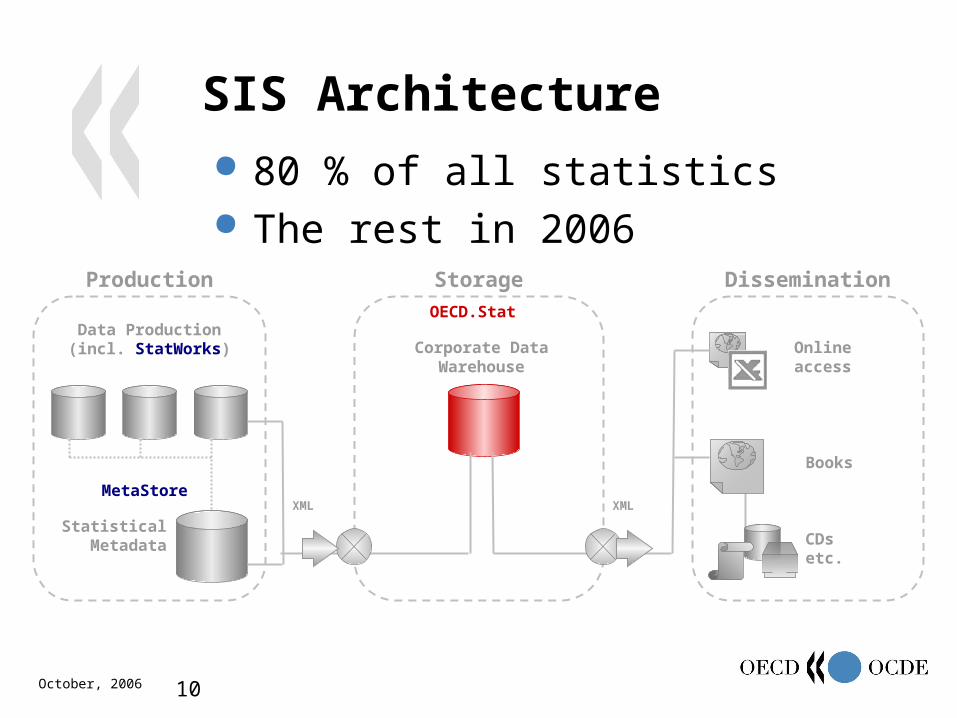
SIS Architecture
Production Storage Dissemination
Data Production(incl. StatWorks)
MetaStore
StatisticalMetadata
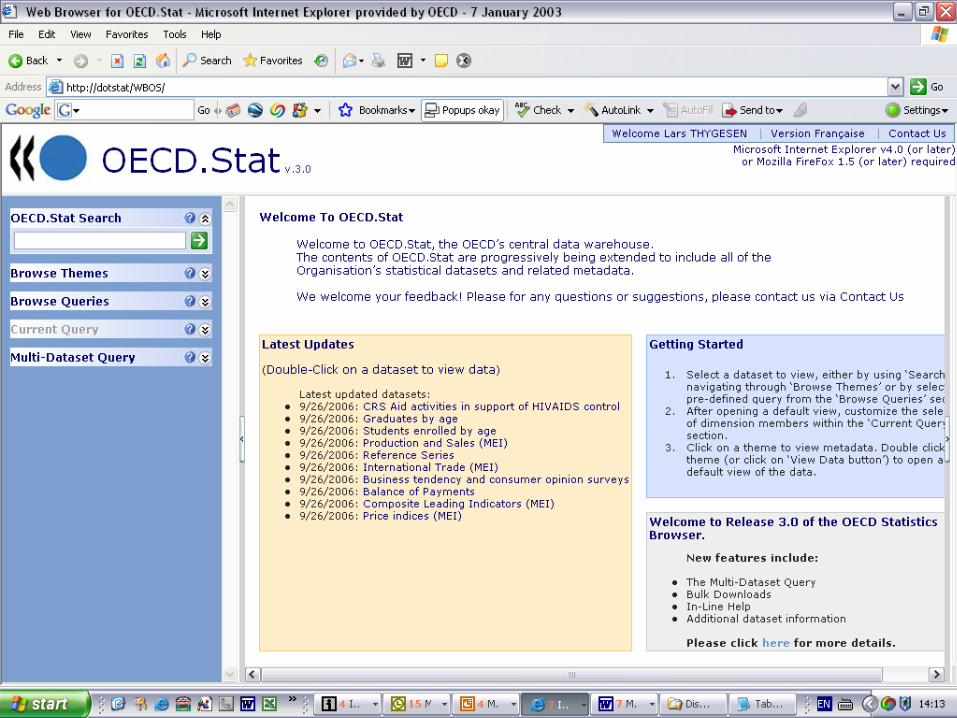
OECD.Stat
Corporate Data Warehouse
XML XML
Onlineaccess
Books
CDsetc.
80 % of all statistics The rest in 2006
October, 2006 11
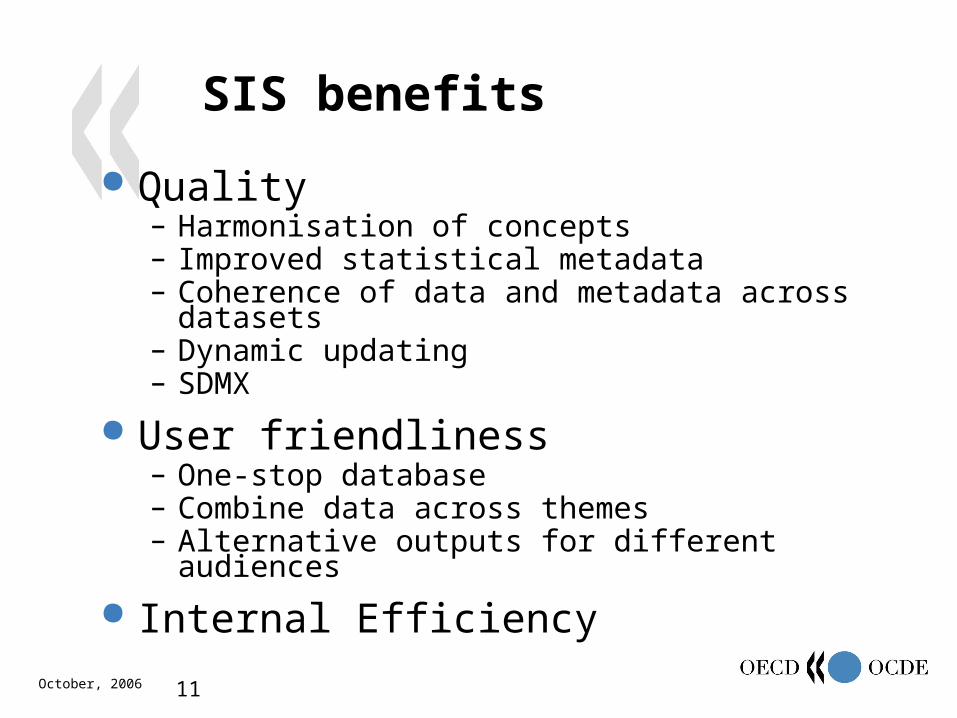
SIS benefits
Quality– Harmonisation of concepts– Improved statistical metadata– Coherence of data and metadata across datasets– Dynamic updating– SDMX
User friendliness– One-stop database– Combine data across themes– Alternative outputs for different audiences
Internal Efficiency

October, 2006 12
Finding OECD statistics
October, 2006 13
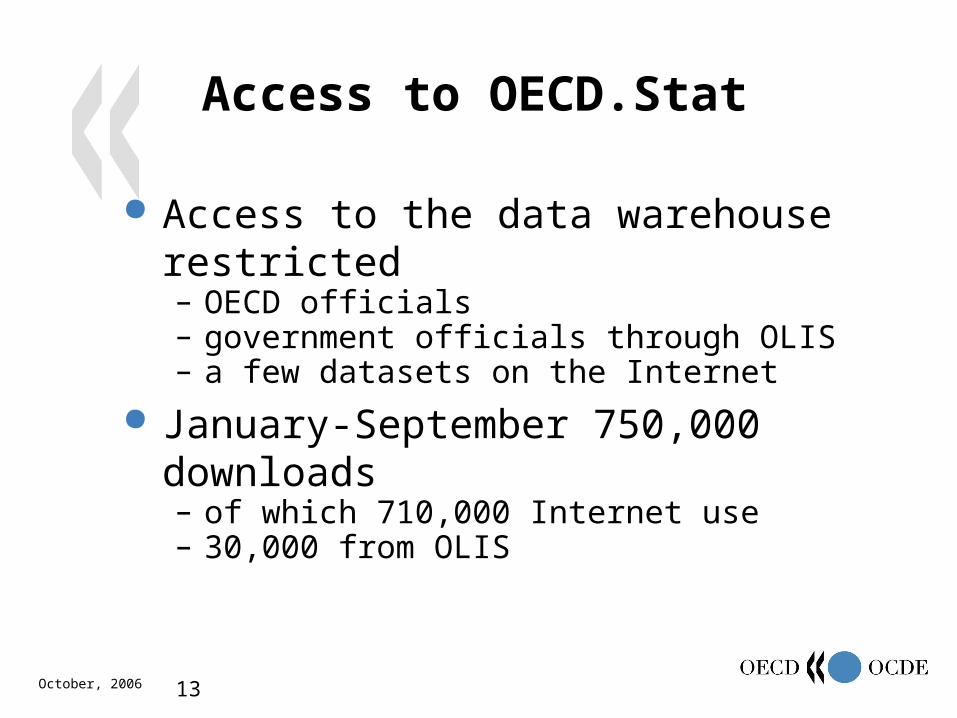
Access to OECD.Stat
Access to the data warehouse restricted– OECD officials – government officials through OLIS– a few datasets on the Internet
January-September 750,000 downloads – of which 710,000 Internet use– 30,000 from OLIS
October, 2006 14
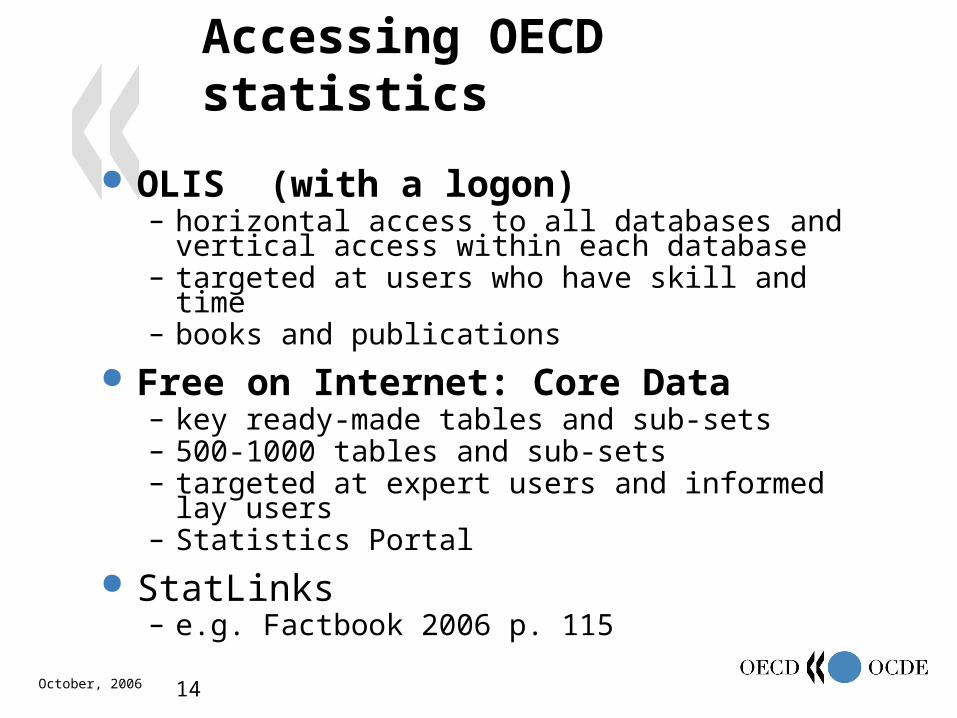
Accessing OECD statistics
OLIS (with a logon)– horizontal access to all databases and vertical
access within each database– targeted at users who have skill and time – books and publications
Free on Internet: Core Data– key ready-made tables and sub-sets – 500-1000 tables and sub-sets– targeted at expert users and informed lay users– Statistics Portal
StatLinks– e.g. Factbook 2006 p. 115
October, 2006 15
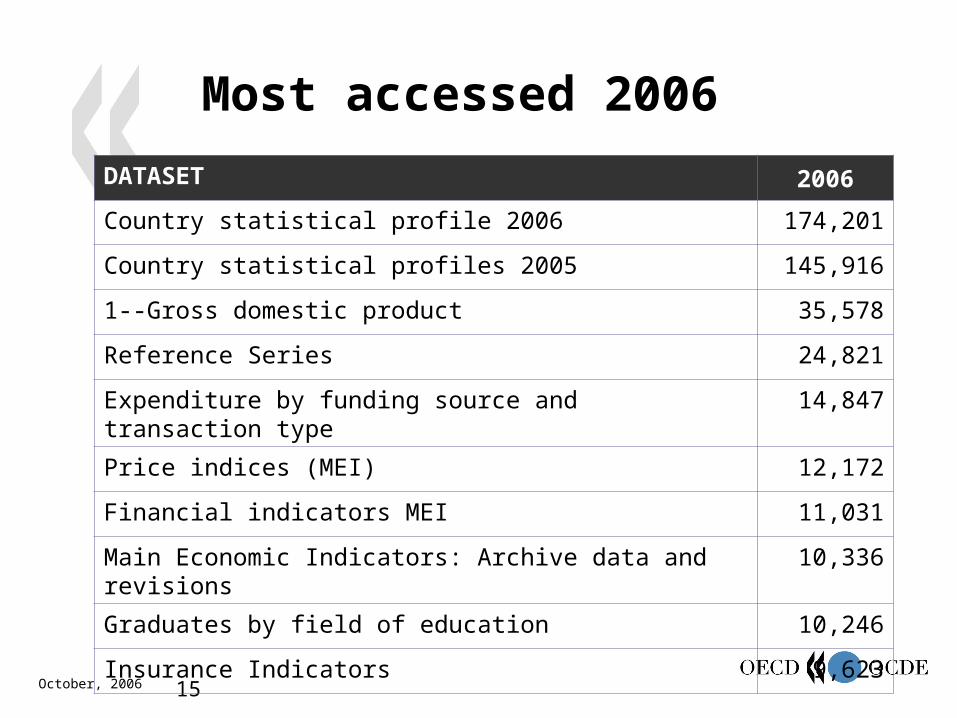
Most accessed 2006
DATASET 2006
Country statistical profile 2006 174,201
Country statistical profiles 2005 145,916
1--Gross domestic product 35,578
Reference Series 24,821
Expenditure by funding source and transaction type 14,847
Price indices (MEI) 12,172
Financial indicators MEI 11,031
Main Economic Indicators: Archive data and revisions 10,336
Graduates by field of education 10,246
Insurance Indicators 9,623
October, 2006 16
Metadata:The key to understanding
October, 2006 17
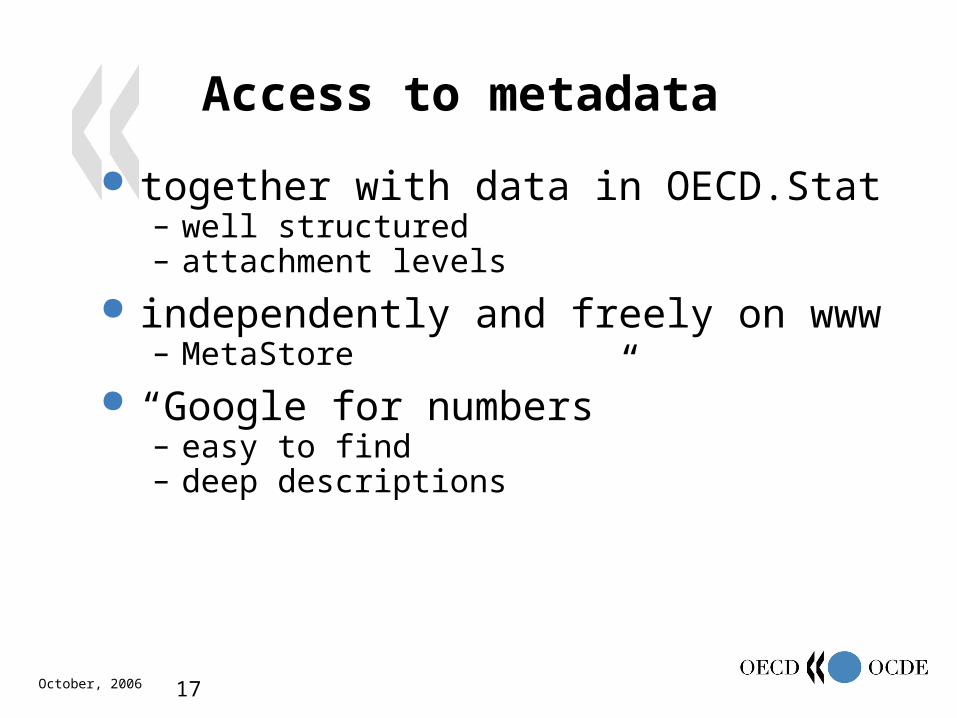
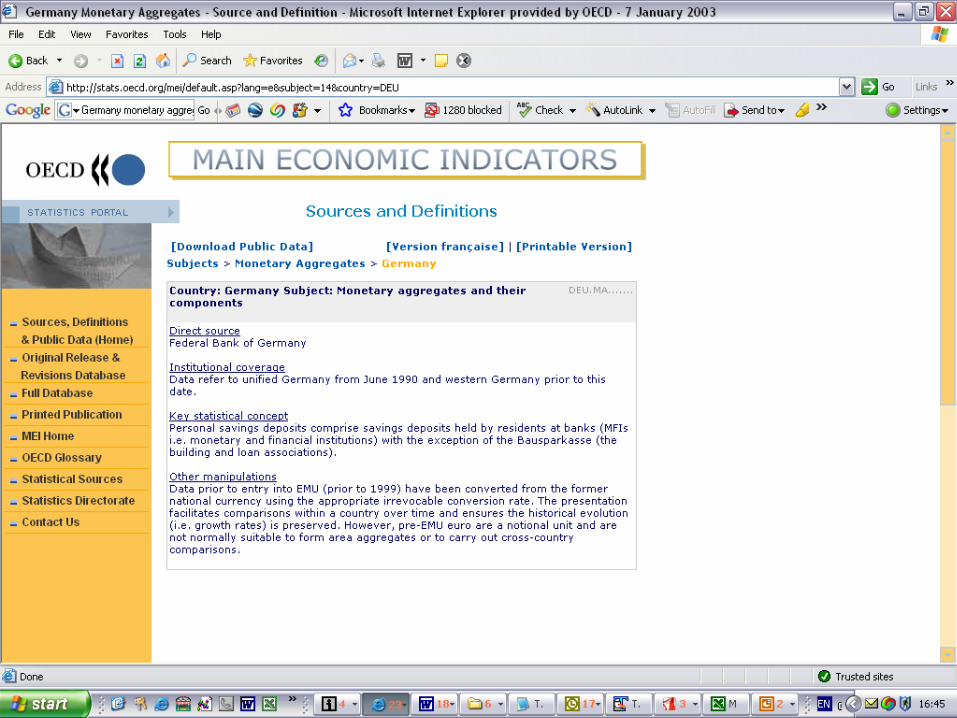
Access to metadata
together with data in OECD.Stat– well structured– attachment levels
independently and freely on www– MetaStore
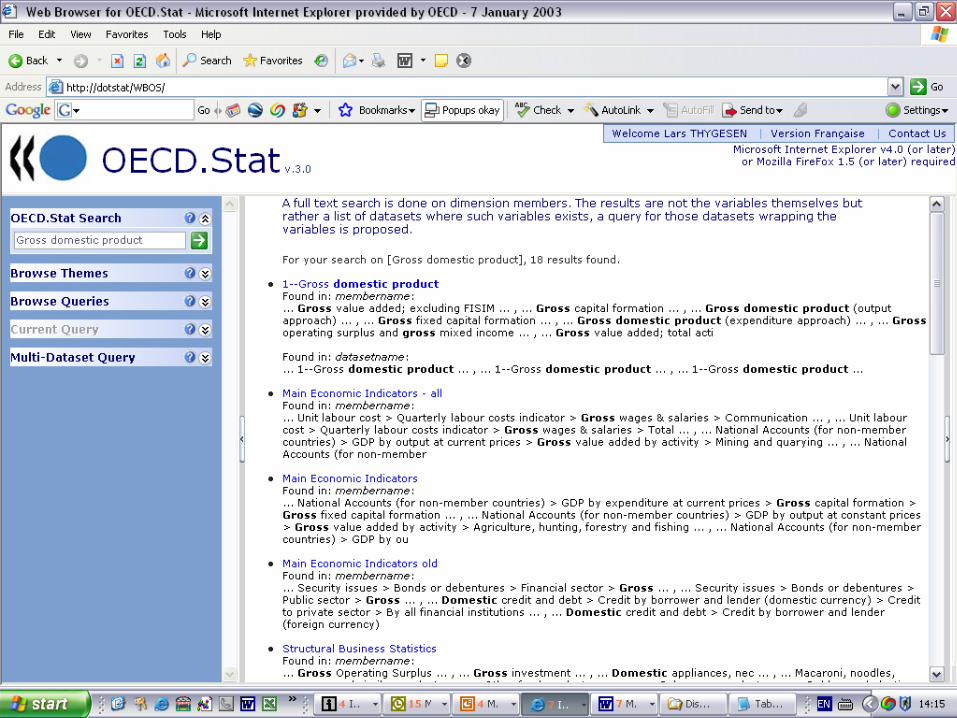
“Google for numbers”– easy to find– deep descriptions

October, 2006 18
Making visual material
October, 2006 19
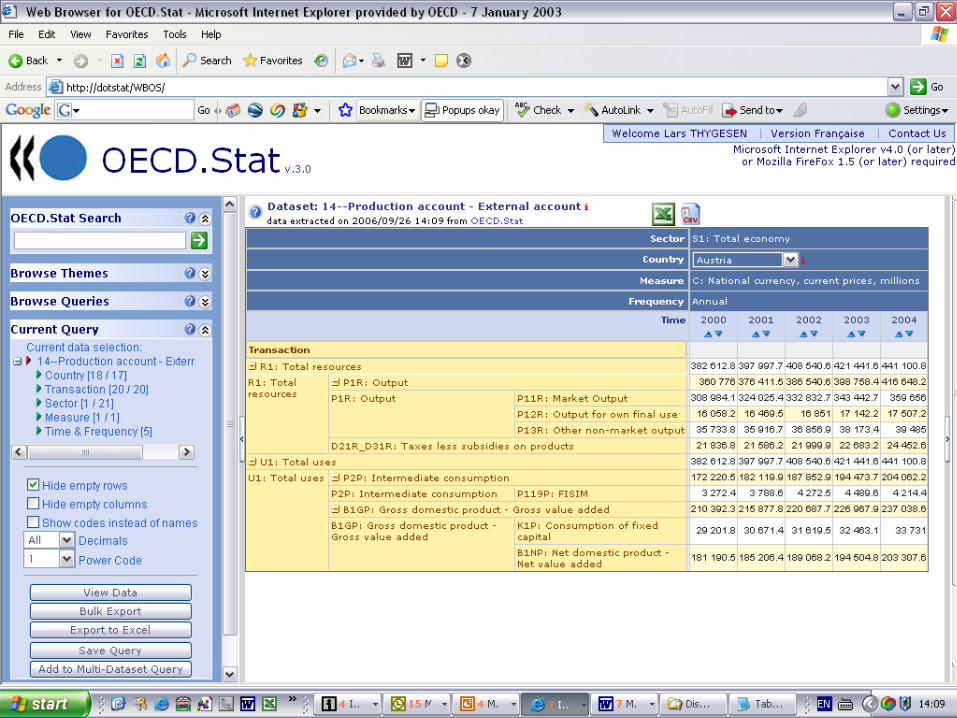
Tables or Graphs
From StatLinks to PPT– e.g. all Factbook graphs
From OECD.Stat via Excel to PPT– anything you like
Don’t fill it too much – keep it simple Careful with sizes
October, 2006 20
Hungary
Australia
Switzerland
Czech Republic
Austria
EU15
New Zealand
Spain
OECD total
Japan
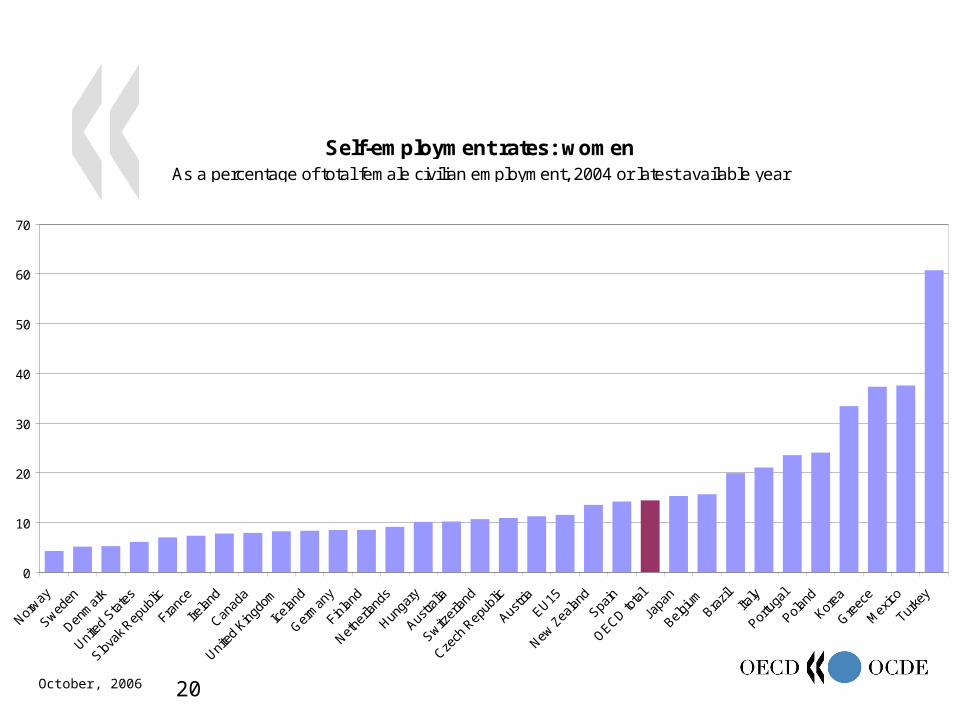
Self-employment rates: womenAs a percentage of total female civilian employment, 2004 or latest available year
0
10
20
30
40
50
60
70
Norway
Sweden
Denm
ark
United
Sta
tes
Slovak
Rep
ublic
Franc
e
Irelan
d
Canad
a
United
King
dom
Icela
nd
Germ
any
Finlan
d
Nethe
rland
s
Hunga
ry
Austra
lia
Switzer
land
Czech
Rep
ublic
Austri
a
EU15
New Z
ealan
d
Spain
OECD tota
l
Japa
n
Belgium
Brazil
Italy
Portu
gal
Poland
Korea
Greec
e
Mex
ico
Turke
y
October, 2006 21
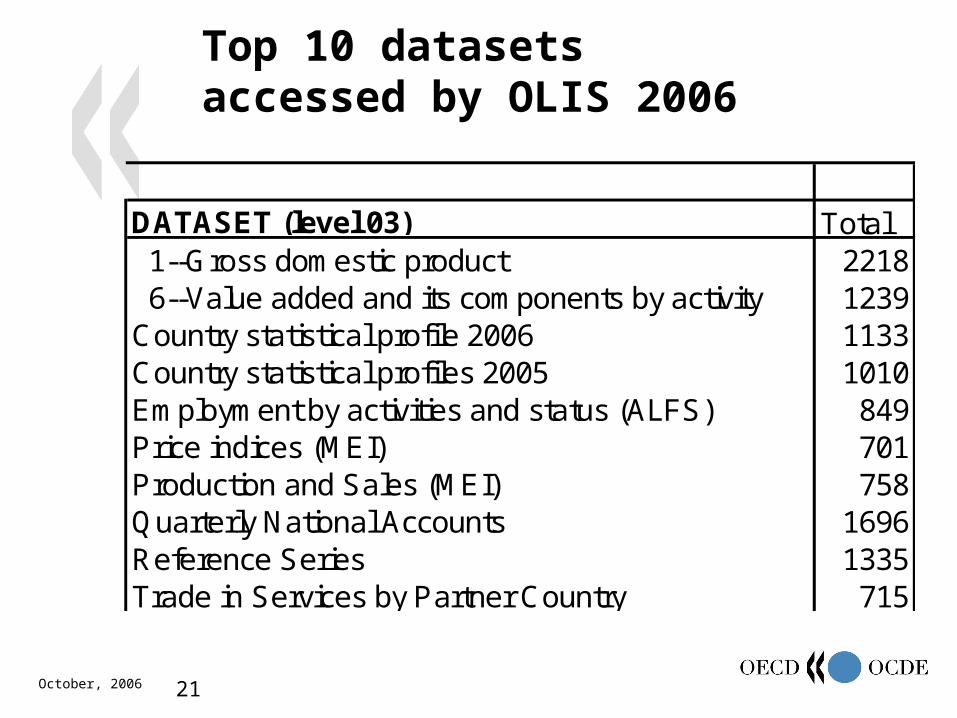
Top 10 datasets accessed by OLIS 2006
DATASET (level 03) Total 1--Gross domestic product 2218 6--Value added and its components by activity 1239Country statistical profile 2006 1133Country statistical profiles 2005 1010Employment by activities and status (ALFS) 849Price indices (MEI) 701Production and Sales (MEI) 758Quarterly National Accounts 1696Reference Series 1335Trade in Services by Partner Country 715
October, 2006 22
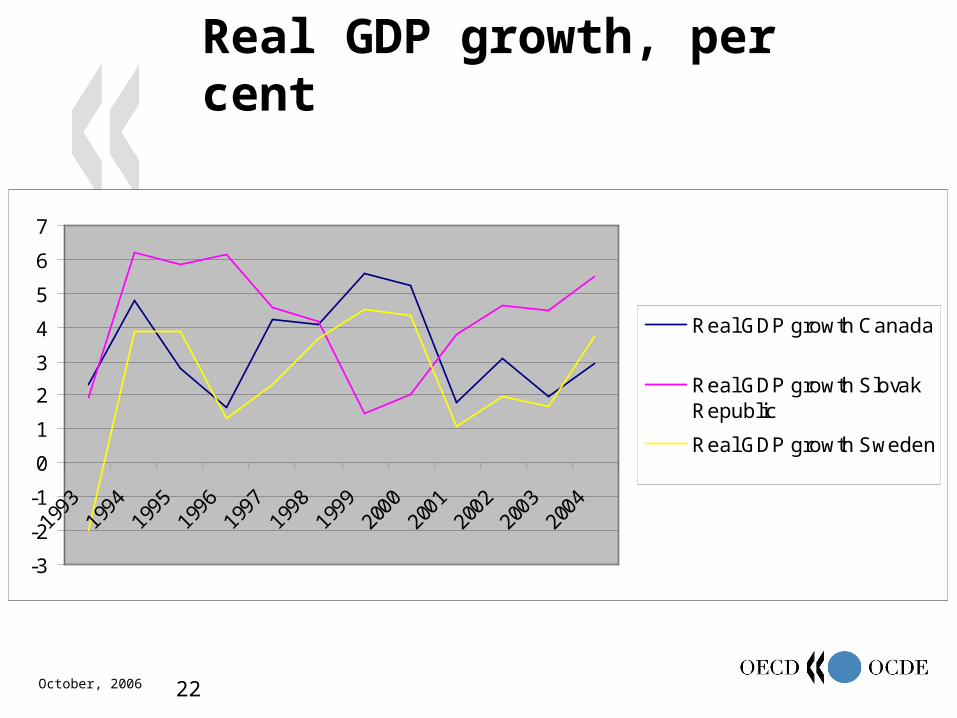
Real GDP growth, per cent
-3
-2
-1
0
1
2
3
4
5
6
7
1993
1994
1995
1996
1997
1998
1999
2000
2001
2002
2003
2004
Real GDP growth Canada
Real GDP growth SlovakRepublic
Real GDP growth Sweden
October, 2006 23
Using other sources
October, 2006 24
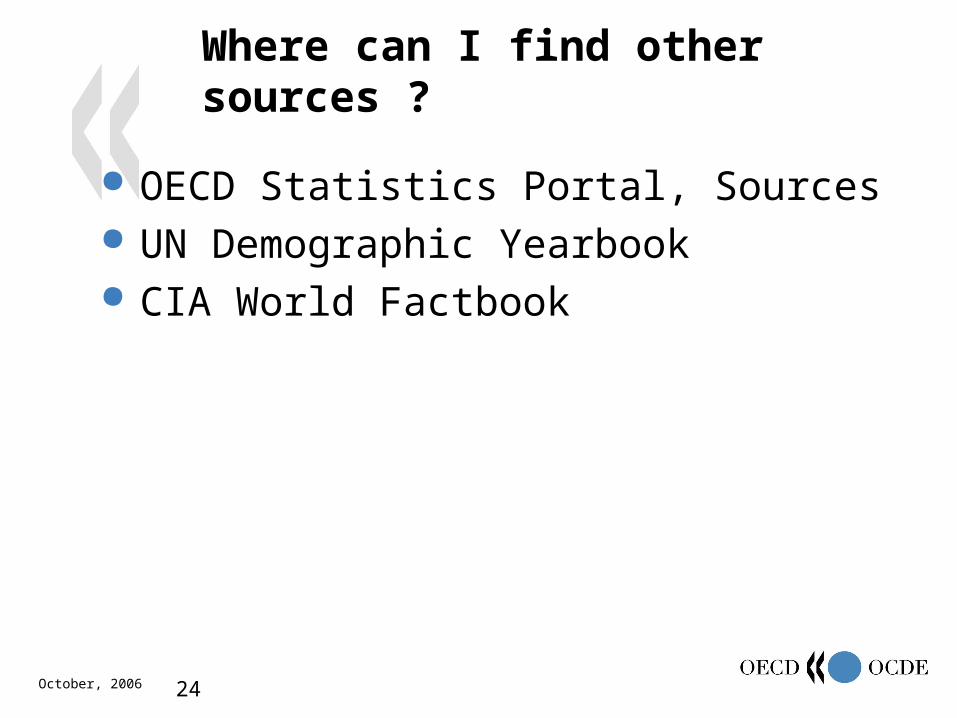
Where can I find other sources ?
OECD Statistics Portal, Sources UN Demographic Yearbook CIA World Factbook
October, 2006 25
Future
October, 2006 26
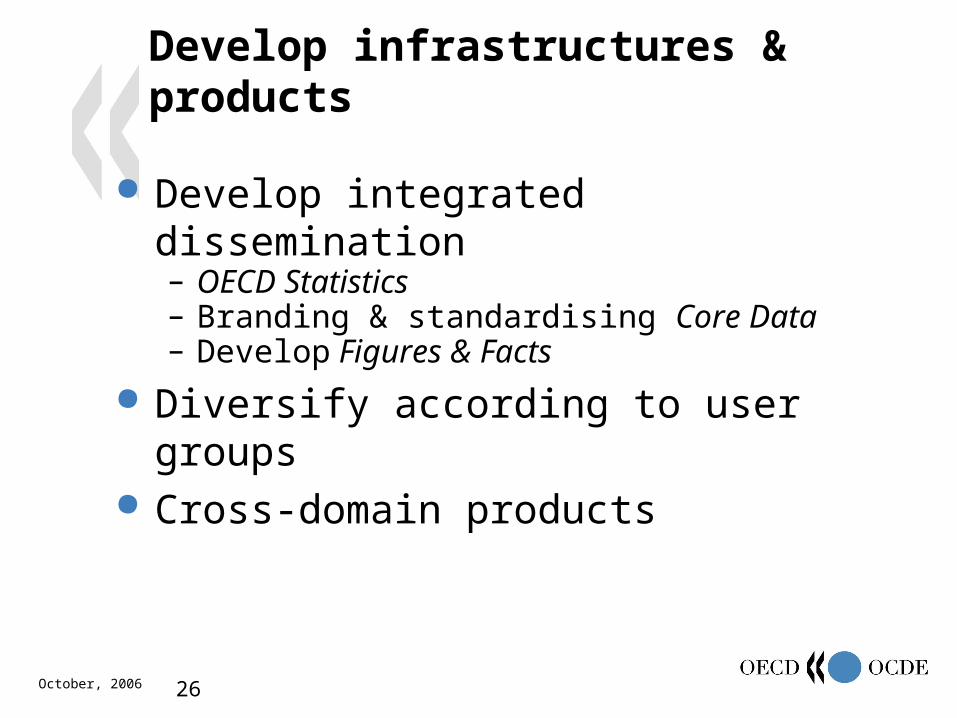
Develop infrastructures & products
Develop integrated dissemination– OECD Statistics– Branding & standardising Core Data– Develop Figures & Facts
Diversify according to user groups Cross-domain products
October, 2006 27
New opportunities
publications can be smaller and more analytically focused
new (and existing) horizontal publications integrate SourceOECD with the free
dissemination of basic statistics links between all the different ways statistics
can be viewed go immediately, e.g., from a database query to
a StatLink or a related analytical e-book fixed and dynamic tables can be stored queries
to OECD.Stat
October, 2006 28
Your feed-back
Did this workshop meet expectations ? Should there be another one ? Could we have exercises ?
– in a class-room with pc’s
Wishes for contents ? Ideas about better access to OECD data ?

October, 2006
The End
TourEurope
October, 2006 30
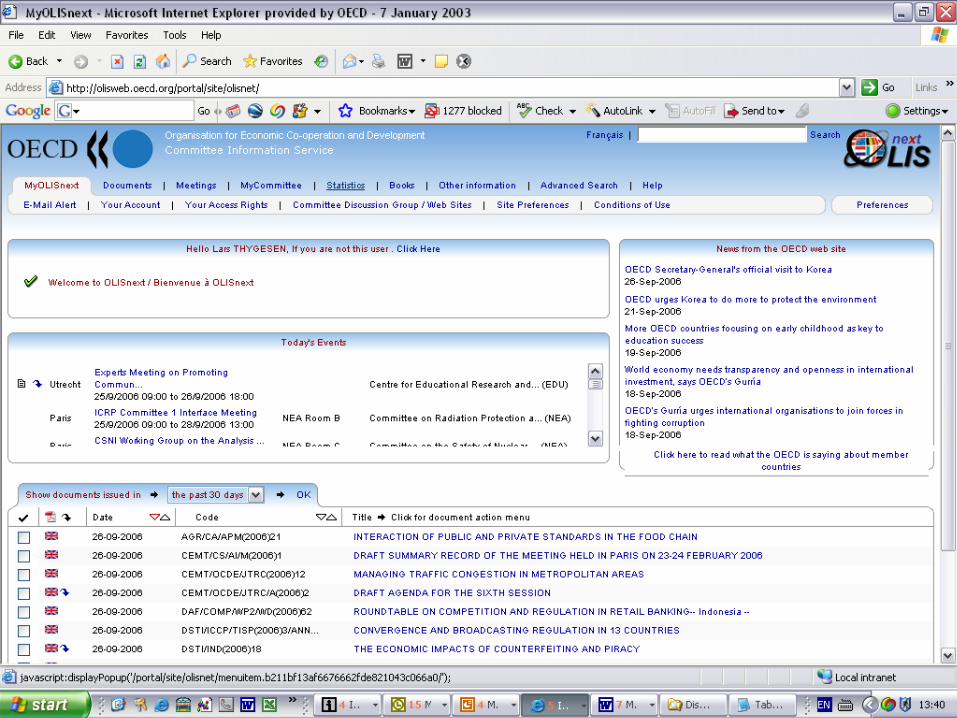
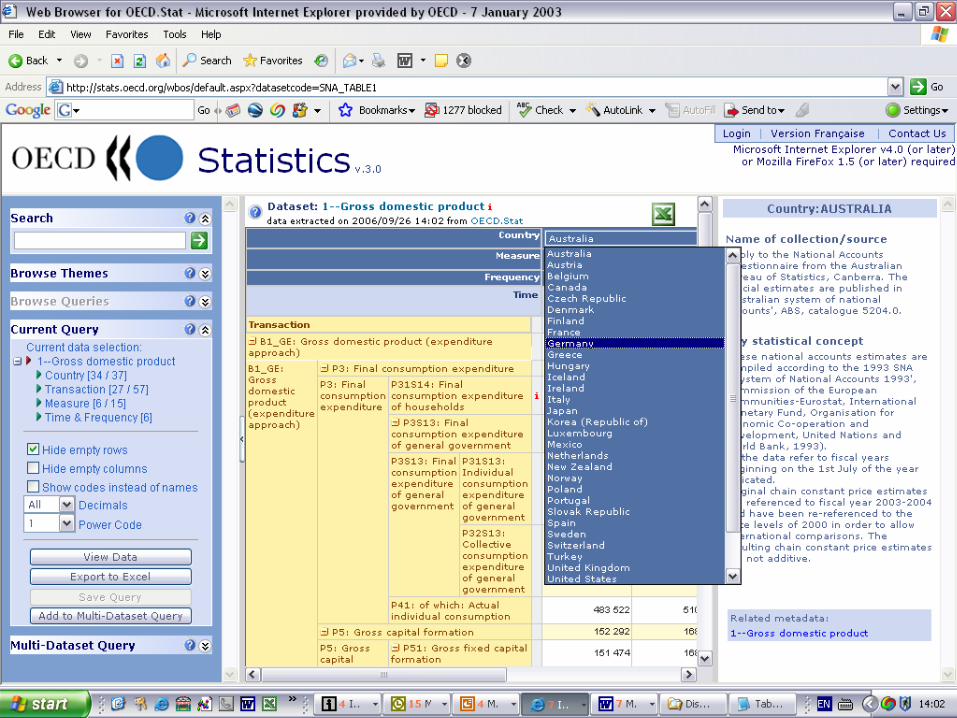
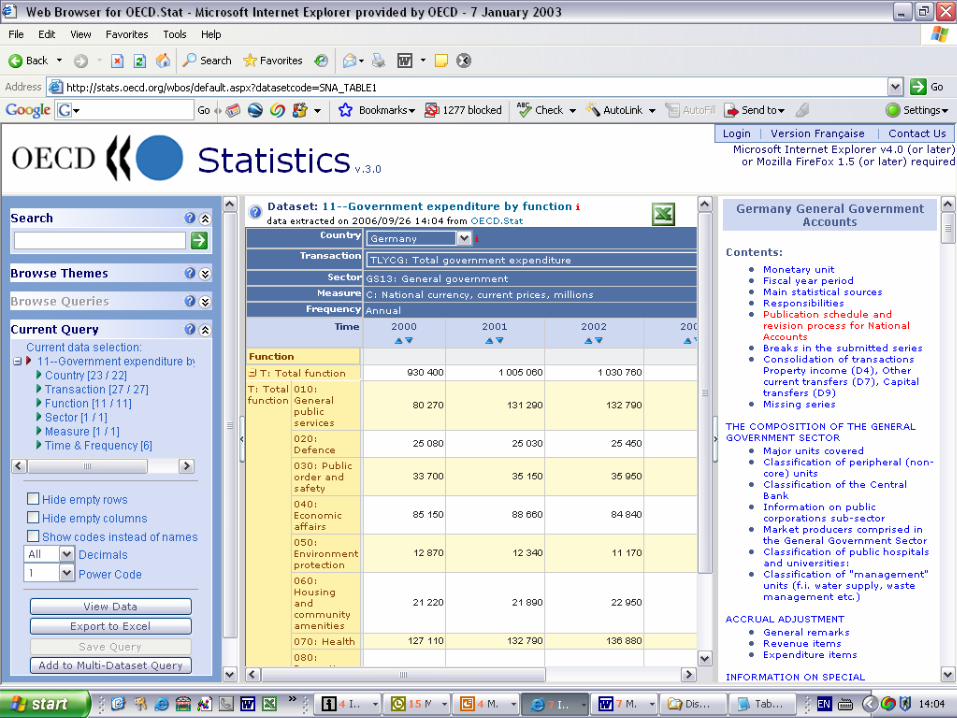
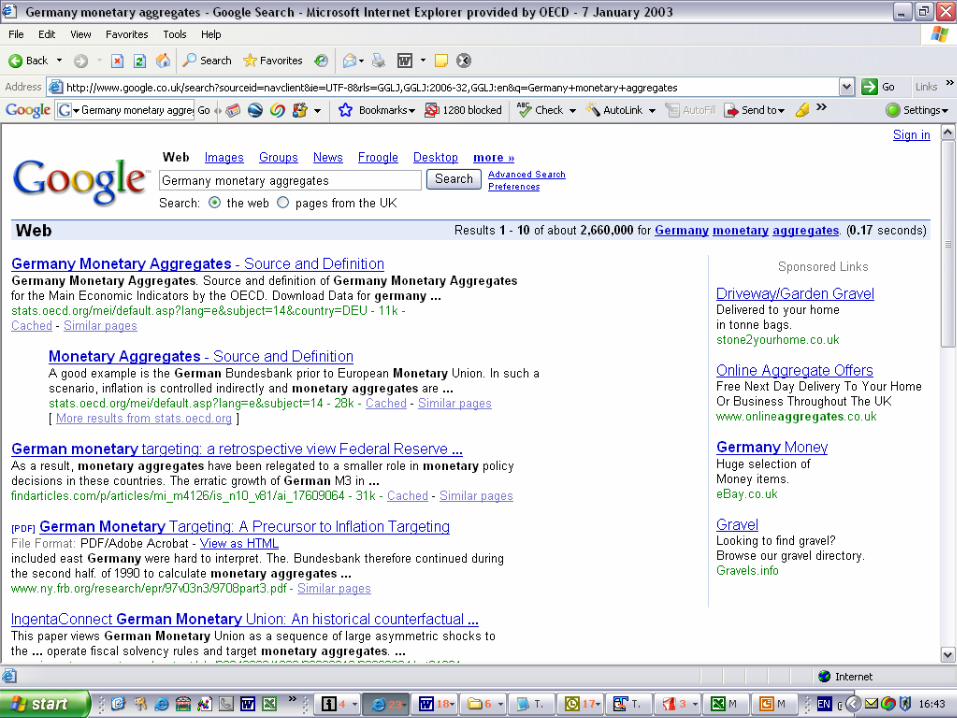
the following slides are screen-shots that can be shown if Internet or OLIS doesn’t work
October, 2006 31
October, 2006 32
October, 2006 33
October, 2006 34
October, 2006 35
October, 2006 36
October, 2006 37
October, 2006 38
October, 2006 39
![20 2011 10 1 P -:HSTCQE=VVZW][ - OECD.org - OECD · Please cite this publication as: OECD (2011), OECD Guidelines for Multinational Enterprises, OECD Publishing. This work is published](https://img.pdfslide.net/doc/110x75/5aebe86f7f8b9a3b2e8e9816/20-2011-10-1-p-hstcqevvzw-oecdorg-cite-this-publication-as-oecd-2011.jpg)