Embed Size (px)
Citation preview
SPONSORED BY
OCTOBER 2008
Experts discuss how Cirrus HD-OCT has made a profound impacton diagnosing, treating and managing glaucoma and retinal disease.
Experiencing High-DefinitionSpectral Domain OpticalCoherence Tomography
0908OMD336-12.qxd:OMD Poly 9/26/08 10:59 AM Page 1

DETECT EARLY GLAUCOMA WITH GREATER PRECISION . . . . . . . . . . . . 3
SETTLING THE DEBATE ON ILM PEELING IN . . . . . . . . . . . . . . . . . . . 7MACULAR HOLE SURGERY
MAKE THE BEST TREATMENT DECISIONS FOR . . . . . . . . . . . . . . . . . . 9DIABETIC MACULAR EDEMA
CONFIRMING A QUESTIONABLE GLAUCOMA DIAGNOSIS . . . . . . . . . . . 11
EVALUATING THE IMPACT OF HD-OCT ON
DIAGNOSING AND TREATING RETINAL DISEASE . . . . . . . . . . . . . . . . 14
CONTRIBUTING FACULTY:Lawrence Stone, MD, is chief of ophthalmologyat Weiss Memorial Hospital in Chicago, and isfounder of Mid-North Eye Center in Chicago. Hespecializes in glaucoma.
Paul E. Tornambe, MD, is in private practice inSan Diego, Calif. He’s director of the San DiegoRetina Research Foundation and past presidentof the American Society of Retina Specialists.
Iqbal “Ike” K. Ahmed, MD, is an assistant professor, at the University of Toronto, and clinicalassistant professor, at the University of Utah. He’sthe fellowship director of the Glaucoma andAdvanced Anterior Segment Surgery (GAASS) fellowship, and director of research fellowshipsat the University of Toronto.
Jennifer Calafati, MD, completed her undergraduate medical training at McMasterUniversity in Hamilton, Ontario. She’s a researchfellow at the University of Toronto, under thesupervision of Dr. Ahmed.
William F. Mieler, MD, is professor, departmentchairman and director of the residency programat the University of Chicago department of oph-thalmology, as well as chairman of the AmericanBoard of Ophthalmology.
Wolters Kluwer Health, Lippincott Williams & Wilkins VisionCare Group
Copyright 2008. Wolters Kluwer Health Inc., LWW VisionCare Group. All Rights Reserved.
Editorial StaffCHIEF MEDICAL EDITOR: Larry E. Patterson, MDEDITORIAL MANAGER, SPECIAL PROJECTS: Angela JacksonSENIOR EDITOR, SPECIAL PROJECTS: Judith RiddleCONTRIBUTING EDITOR: Erin Murphy
Design and ProductionPRODUCTION DIRECTOR: Leslie Caruso ART DIRECTOR: Michael F. HigginsPRODUCTION MANAGER: Bill Hallman
Editorial and Production Offices323 Norristown Road, Suite 200, Ambler, PA 19002Phone: (215) 646-8700Fax: (215) 367-2157
Business StaffGROUP PUBLISHER: Douglas A. ParryASSOCIATE PUBLISHER: Dan MarshACCOUNT REPRESENTATIVE: Jodi L. SmithACCOUNT REPRESENTATIVE: Kathleen MalseedMARKETING MANAGER: Amy WauhopPROMOTIONAL EVENTS MANAGER: Michelle KiefferCIRCULATION DIRECTOR: Deb Benward
Vice President, Journals Business DevelopmentR. Patricia Herron
WHAT’S INSIDE:
0908OMD336-12.qxd:OMD Poly 9/26/08 11:00 AM Page 2
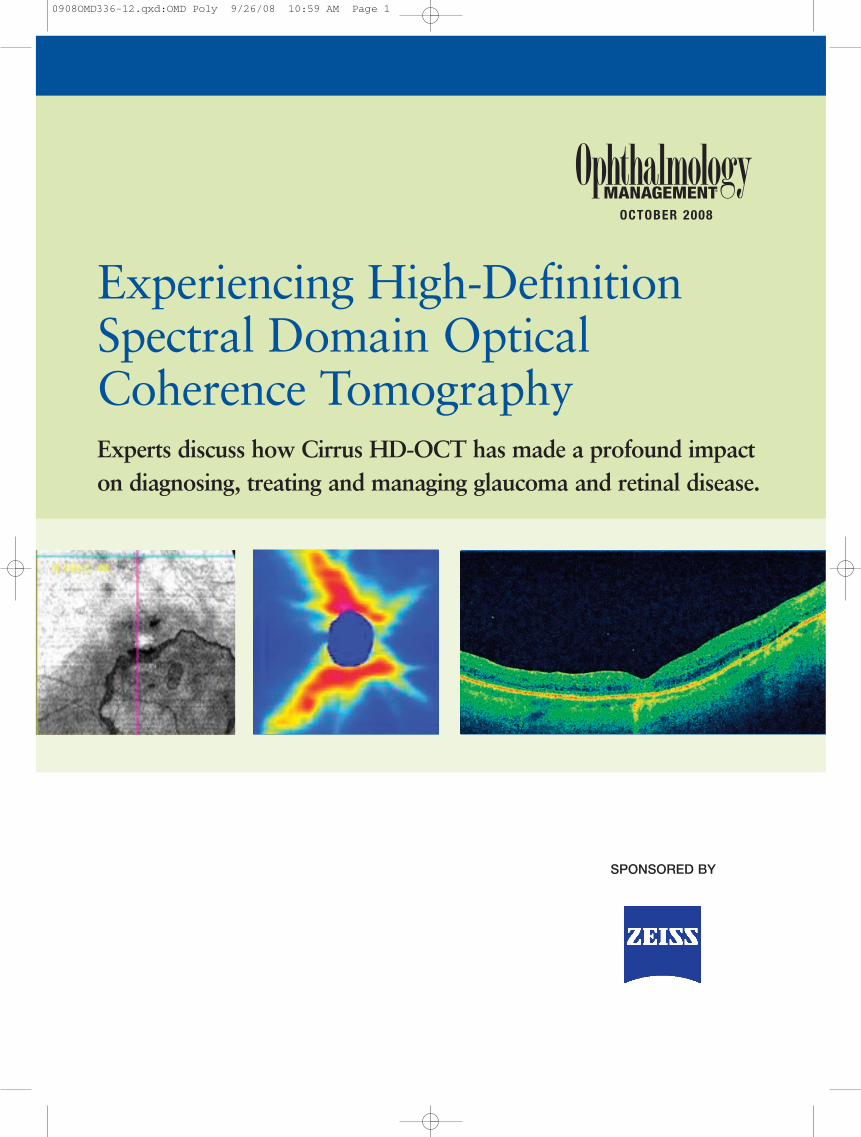
The RNFL thickness map is the centerpiece of thereadout. The RNFL layer is segmented in the 6 mm x6 mm cube, and the display schematically shows thenerve fiber layer’s pattern and thickness (Figure 1).This is the image to show patients, because it’s the
easiest for them to understand. For comparison, Ikeep a scan of a normal eye in a folder in each examroom.
The RNFL thickness deviation map displays OCTfundus images (Figure 2). This is an en face view ofthe cube of OCT data. A colored overlay shows areasof RNFL thickness that deviate from the norm, basedon the age-matched normative database. Deviationsfound in this area are of clinical significance if they’re
Recently, we added Cirrus HD-OCT (Carl ZeissMeditec, Dublin, Calif.) to our armamentarium todetect early glaucoma.
We’ve been thrilled with this diagnostic tool. It’sbeen immensely helpful in the decision-making para-digm for patients with ocular hypertension, largecup-to-disk ratios and those whom we suspect mayhave glaucoma. Over time, I’ve gained confidencewith Cirrus HD-OCT and now find that it’s as usefulas a 90 diopter optic disk examination of the opticnerve head in assessing glaucomatous damage —although Cirrus HD-OCT focuses more on the retinalnerve fiber layer (RNFL) instead of optic disk cup-ping.
Cirrus HD-OCT tests for glaucoma using a cubescan, measuring a 6 mm x 6 mm area. It uses a 200 x200 testing strategy (200 B-scans with 200 A-scansper B-scan) and delivers 27,000 A-scans per second.Because of its fast acquisition time and improvedoptics, patients with pupils that are 2.5 mm or largerwith clear media don’t need to be dilated.
The scan is user- and patient-friendly. In 3 minutes,you can prepare the patient, scan both eyes and printthe analysis, which is something patients appreciate.The ergonomically designed unit allows the technicianto sit on the same side as the patient, enabling him toview the patient’s head and body directly.
Scan ReadoutThe Cirrus HD-OCT glaucoma scan features an
RNFL thickness map, an RNFL thickness deviationmap, an RNFL TSNIT normative database and anextracted RNFL tomogram graph. The normativedatabase is for the overall RNFL thickness map andthe TSNIT.
The unique features and capabilities of Cirrus HD-OCT enable you to diagnose glaucoma more accurately.
Detect Early Glaucoma With Greater Precision
By Lawrence Stone, MD
Figure 1. The RNFL thickness map schematically shows the nerve fiberlayer’s pattern and thickness.
Figure 2. The RNFL thickness deviation map displays OCT fundus images.
Continued on page 6
3
0908OMD336-12.qxd:OMD Poly 9/26/08 11:00 AM Page 3
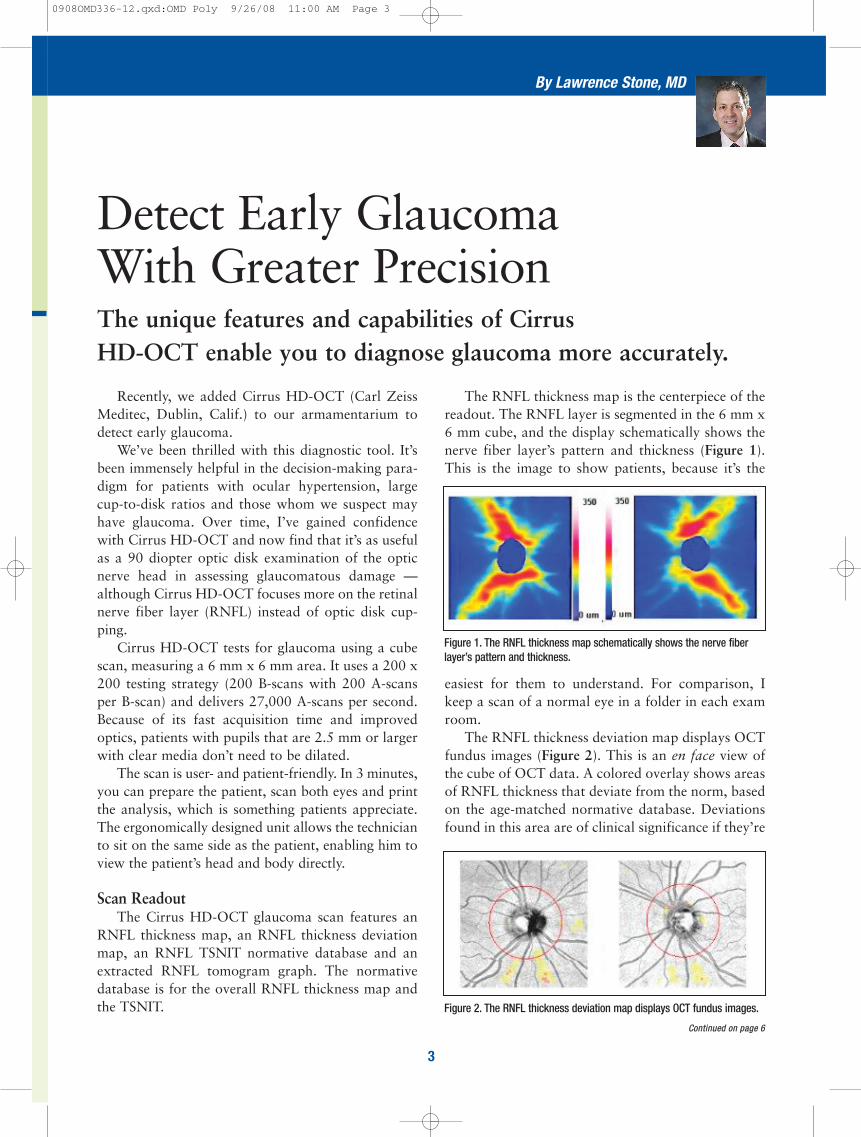
A 75-year-old white woman had been coming to see mefor several years with IOPs in the high teens. Her GDX scanswere normal — although slight asymmetry existed betweenher eyes — as well as her Humphrey visual fields. Cup-to-disk ratios, documented by stereo disk photography,showed vertical cupping in her right eye at 0.65 and in herleft eye at 0.50. The patient’s IOP readings were 20 mm Hgin her right eye and 19 mm Hg in her left eye. Her visualacuities with pinhole measured 20/30 OD and 20/30 OS.Mild cortical haze was present in both crystalline lenses.
The Zeiss Matrix 24-2 FDT threshold test showed nofocal glaucomatous defects. A generalized reduction inmean deviation, however, was present in both eyes.
The Cirrus HD-OCT showed a few areas of RNFL thinningin both eyes. Quality readings were right 8/10 and left7/10. I performed a 90 diopter examination of the opticnerve and compared the results with stereo-digital photos
taken two years before (Figure 1 and Figure 2). I found nochange in the cupping or neuro-retinal rim.
Negative FindingsThe depression in the double frequency visual field was
nonspecific and could be attributed to early cataract or otherfactors. The nerve fiber loss seen on the Cirrus HD-OCT didn’t correlate with areas of retinal rim thinning, nor wasthere glaucomatous visual field loss. Cataractous changes(reflected in the scanning signal strength of the Cirrus HD-OCT) may have accounted for the nerve fiber changes.
The comparison of the 90 diopter exams with stereophotos from 2006 reinforced my assessment that thepatient didn’t have structural glaucomatous changes. Thiscase reminds us that OCT results must be interpreted with-in the context of other clinical information. A 12-month fol-low-up visit with this patient, however, is warranted. ■
Diagnosing a Glaucoma Suspect
4
Figure 1 Figure 2
0908OMD336-12.qxd:OMD Poly 9/26/08 11:00 AM Page 4
5
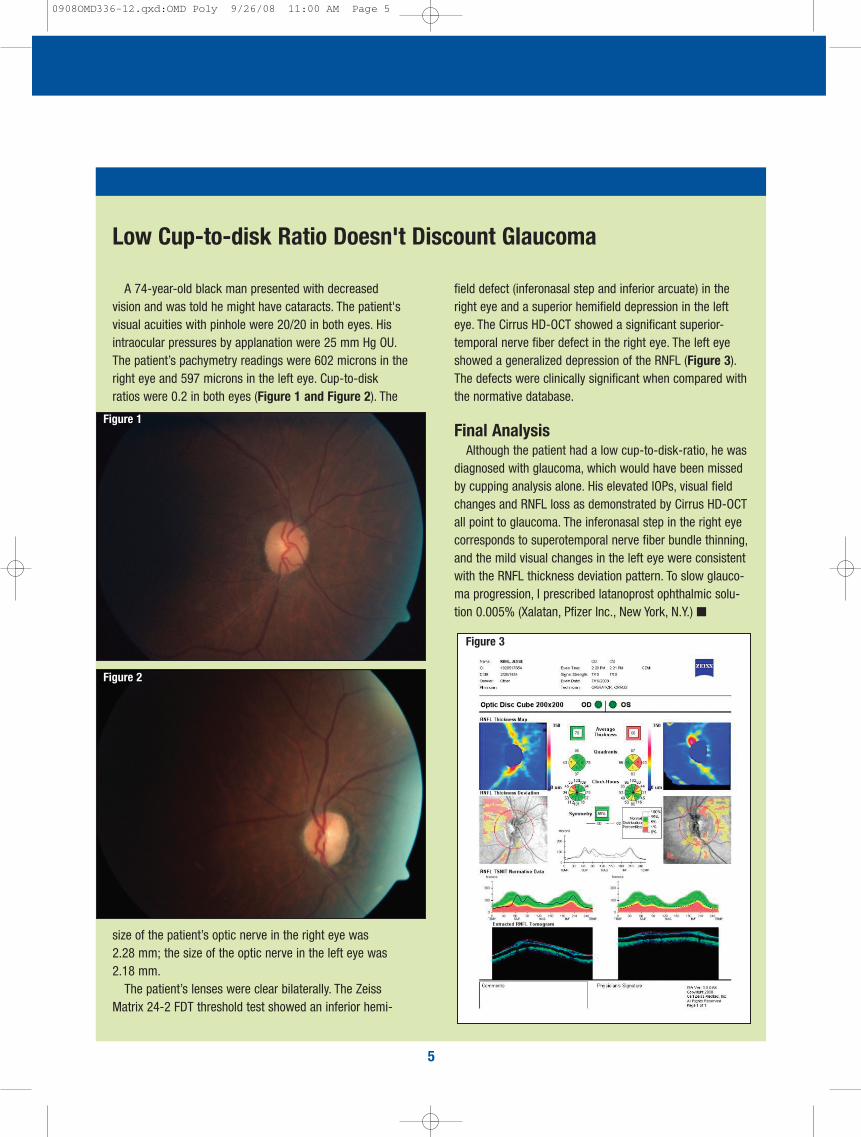
A 74-year-old black man presented with decreasedvision and was told he might have cataracts. The patient'svisual acuities with pinhole were 20/20 in both eyes. Hisintraocular pressures by applanation were 25 mm Hg OU.The patient’s pachymetry readings were 602 microns in theright eye and 597 microns in the left eye. Cup-to-diskratios were 0.2 in both eyes (Figure 1 and Figure 2). The
size of the patient’s optic nerve in the right eye was 2.28 mm; the size of the optic nerve in the left eye was 2.18 mm.
The patient’s lenses were clear bilaterally. The ZeissMatrix 24-2 FDT threshold test showed an inferior hemi-
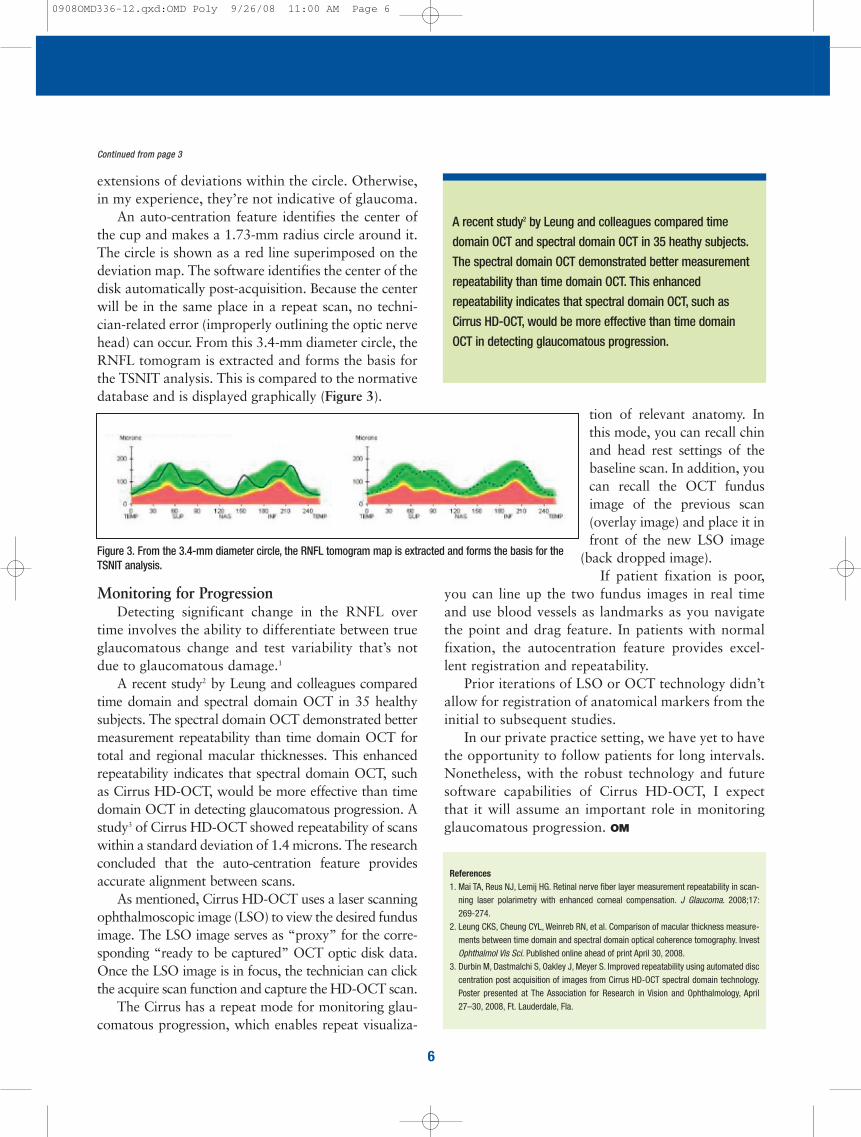
field defect (inferonasal step and inferior arcuate) in theright eye and a superior hemifield depression in the lefteye. The Cirrus HD-OCT showed a significant superior-temporal nerve fiber defect in the right eye. The left eyeshowed a generalized depression of the RNFL (Figure 3).The defects were clinically significant when compared withthe normative database.
Final Analysis Although the patient had a low cup-to-disk-ratio, he was
diagnosed with glaucoma, which would have been missedby cupping analysis alone. His elevated IOPs, visual fieldchanges and RNFL loss as demonstrated by Cirrus HD-OCTall point to glaucoma. The inferonasal step in the right eyecorresponds to superotemporal nerve fiber bundle thinning,and the mild visual changes in the left eye were consistentwith the RNFL thickness deviation pattern. To slow glauco-ma progression, I prescribed latanoprost ophthalmic solu-tion 0.005% (Xalatan, Pfizer Inc., New York, N.Y.) ■
Low Cup-to-disk Ratio Doesn't Discount Glaucoma
Figure 1
Figure 2
Figure 3
0908OMD336-12.qxd:OMD Poly 9/26/08 11:00 AM Page 5
tion of relevant anatomy. Inthis mode, you can recall chinand head rest settings of thebaseline scan. In addition, youcan recall the OCT fundusimage of the previous scan(overlay image) and place it infront of the new LSO image
(back dropped image).If patient fixation is poor,
you can line up the two fundus images in real timeand use blood vessels as landmarks as you navigatethe point and drag feature. In patients with normalfixation, the autocentration feature provides excel-lent registration and repeatability.
Prior iterations of LSO or OCT technology didn’tallow for registration of anatomical markers from theinitial to subsequent studies.
In our private practice setting, we have yet to havethe opportunity to follow patients for long intervals.Nonetheless, with the robust technology and futuresoftware capabilities of Cirrus HD-OCT, I expectthat it will assume an important role in monitoringglaucomatous progression. OM
extensions of deviations within the circle. Otherwise,in my experience, they’re not indicative of glaucoma.
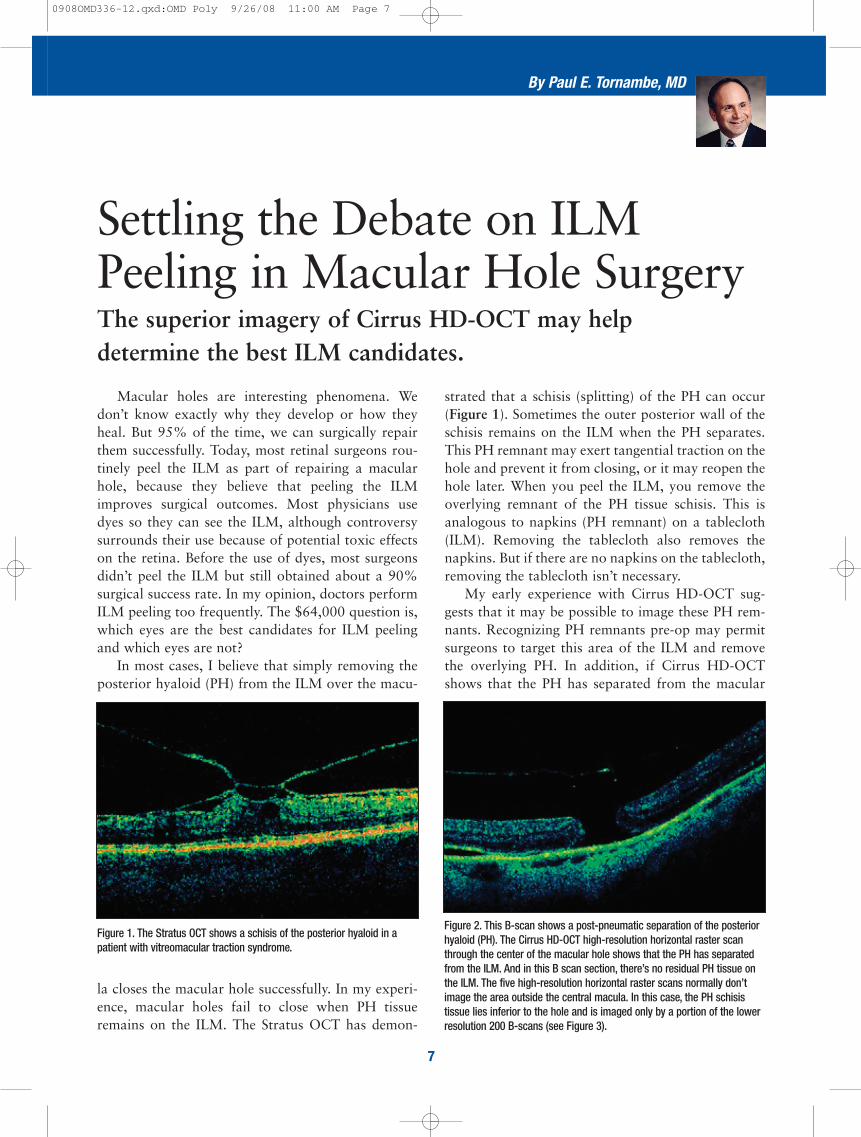
An auto-centration feature identifies the center ofthe cup and makes a 1.73-mm radius circle around it.The circle is shown as a red line superimposed on thedeviation map. The software identifies the center of thedisk automatically post-acquisition. Because the centerwill be in the same place in a repeat scan, no techni-cian-related error (improperly outlining the optic nervehead) can occur. From this 3.4-mm diameter circle, theRNFL tomogram is extracted and forms the basis forthe TSNIT analysis. This is compared to the normativedatabase and is displayed graphically (Figure 3).
Monitoring for ProgressionDetecting significant change in the RNFL over
time involves the ability to differentiate between trueglaucomatous change and test variability that’s notdue to glaucomatous damage.1
A recent study2 by Leung and colleagues comparedtime domain and spectral domain OCT in 35 healthysubjects. The spectral domain OCT demonstrated bettermeasurement repeatability than time domain OCT fortotal and regional macular thicknesses. This enhancedrepeatability indicates that spectral domain OCT, suchas Cirrus HD-OCT, would be more effective than timedomain OCT in detecting glaucomatous progression. Astudy3 of Cirrus HD-OCT showed repeatability of scanswithin a standard deviation of 1.4 microns. The researchconcluded that the auto-centration feature providesaccurate alignment between scans.
As mentioned, Cirrus HD-OCT uses a laser scanningophthalmoscopic image (LSO) to view the desired fundusimage. The LSO image serves as “proxy” for the corre-sponding “ready to be captured” OCT optic disk data.Once the LSO image is in focus, the technician can clickthe acquire scan function and capture the HD-OCT scan.
The Cirrus has a repeat mode for monitoring glau-comatous progression, which enables repeat visualiza-
6
References1. Mai TA, Reus NJ, Lemij HG. Retinal nerve fiber layer measurement repeatability in scan-
ning laser polarimetry with enhanced corneal compensation. J Glaucoma. 2008;17:269-274.
2. Leung CKS, Cheung CYL, Weinreb RN, et al. Comparison of macular thickness measure-ments between time domain and spectral domain optical coherence tomography. InvestOphthalmol Vis Sci. Published online ahead of print April 30, 2008.
3. Durbin M, Dastmalchi S, Oakley J, Meyer S. Improved repeatability using automated disccentration post acquisition of images from Cirrus HD-OCT spectral domain technology.Poster presented at The Association for Research in Vision and Ophthalmology, April27–30, 2008, Ft. Lauderdale, Fla.
A recent study2 by Leung and colleagues compared time
domain OCT and spectral domain OCT in 35 heathy subjects.
The spectral domain OCT demonstrated better measurement
repeatability than time domain OCT. This enhanced
repeatability indicates that spectral domain OCT, such as
Cirrus HD-OCT, would be more effective than time domain
OCT in detecting glaucomatous progression.
Figure 3. From the 3.4-mm diameter circle, the RNFL tomogram map is extracted and forms the basis for theTSNIT analysis.
Continued from page 3
0908OMD336-12.qxd:OMD Poly 9/26/08 11:00 AM Page 6
7
strated that a schisis (splitting) of the PH can occur(Figure 1). Sometimes the outer posterior wall of theschisis remains on the ILM when the PH separates.This PH remnant may exert tangential traction on thehole and prevent it from closing, or it may reopen thehole later. When you peel the ILM, you remove theoverlying remnant of the PH tissue schisis. This isanalogous to napkins (PH remnant) on a tablecloth(ILM). Removing the tablecloth also removes thenapkins. But if there are no napkins on the tablecloth,removing the tablecloth isn’t necessary.
My early experience with Cirrus HD-OCT sug-gests that it may be possible to image these PH rem-nants. Recognizing PH remnants pre-op may permitsurgeons to target this area of the ILM and removethe overlying PH. In addition, if Cirrus HD-OCTshows that the PH has separated from the macular
Macular holes are interesting phenomena. Wedon’t know exactly why they develop or how theyheal. But 95% of the time, we can surgically repairthem successfully. Today, most retinal surgeons rou-tinely peel the ILM as part of repairing a macularhole, because they believe that peeling the ILMimproves surgical outcomes. Most physicians usedyes so they can see the ILM, although controversysurrounds their use because of potential toxic effectson the retina. Before the use of dyes, most surgeonsdidn’t peel the ILM but still obtained about a 90%surgical success rate. In my opinion, doctors performILM peeling too frequently. The $64,000 question is,which eyes are the best candidates for ILM peelingand which eyes are not?
In most cases, I believe that simply removing theposterior hyaloid (PH) from the ILM over the macu-
la closes the macular hole successfully. In my experi-ence, macular holes fail to close when PH tissueremains on the ILM. The Stratus OCT has demon-
The superior imagery of Cirrus HD-OCT may help determine the best ILM candidates.
Settling the Debate on ILMPeeling in Macular Hole Surgery
By Paul E. Tornambe, MD
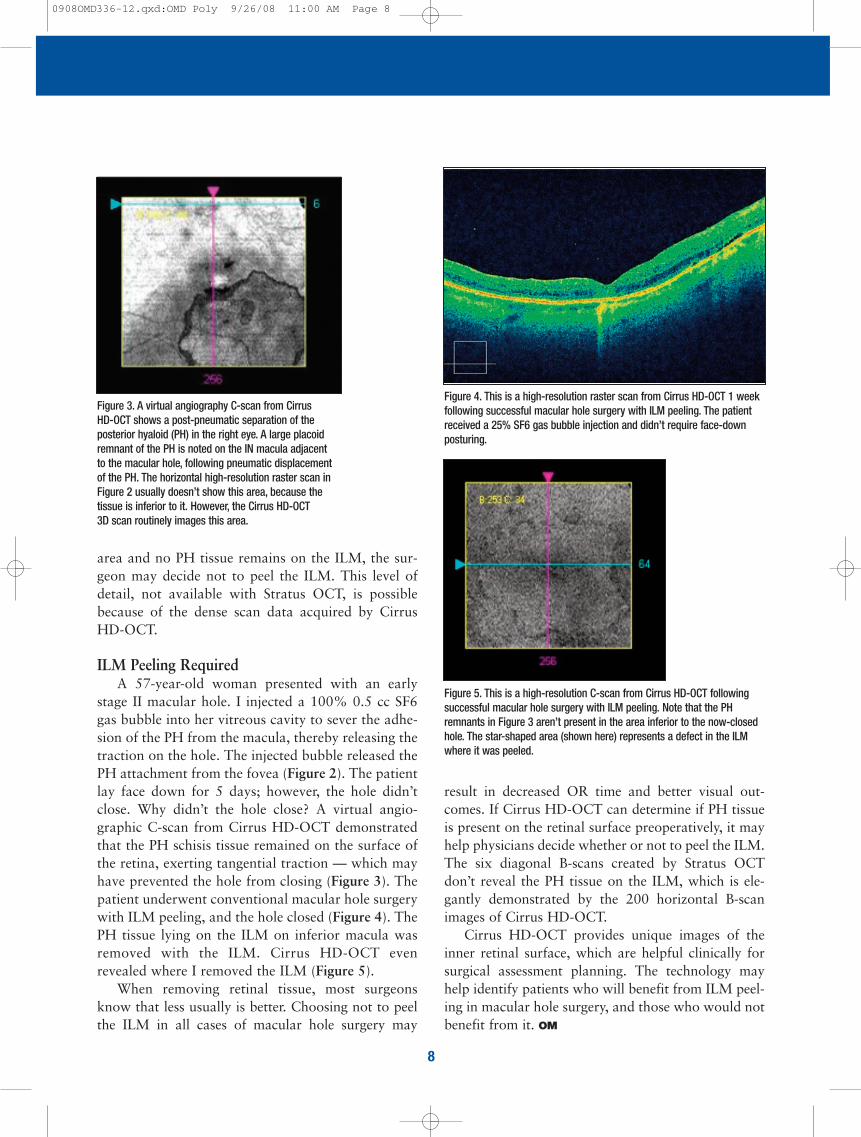
Figure 1. The Stratus OCT shows a schisis of the posterior hyaloid in apatient with vitreomacular traction syndrome.
Figure 2. This B-scan shows a post-pneumatic separation of the posteriorhyaloid (PH). The Cirrus HD-OCT high-resolution horizontal raster scanthrough the center of the macular hole shows that the PH has separatedfrom the ILM. And in this B scan section, there’s no residual PH tissue onthe ILM. The five high-resolution horizontal raster scans normally don’timage the area outside the central macula. In this case, the PH schisis tissue lies inferior to the hole and is imaged only by a portion of the lowerresolution 200 B-scans (see Figure 3).
0908OMD336-12.qxd:OMD Poly 9/26/08 11:00 AM Page 7
result in decreased OR time and better visual out-comes. If Cirrus HD-OCT can determine if PH tissueis present on the retinal surface preoperatively, it mayhelp physicians decide whether or not to peel the ILM.The six diagonal B-scans created by Stratus OCTdon’t reveal the PH tissue on the ILM, which is ele-gantly demonstrated by the 200 horizontal B-scanimages of Cirrus HD-OCT.
Cirrus HD-OCT provides unique images of theinner retinal surface, which are helpful clinically forsurgical assessment planning. The technology mayhelp identify patients who will benefit from ILM peel-ing in macular hole surgery, and those who would notbenefit from it. OM
area and no PH tissue remains on the ILM, the sur-geon may decide not to peel the ILM. This level ofdetail, not available with Stratus OCT, is possiblebecause of the dense scan data acquired by CirrusHD-OCT.
ILM Peeling RequiredA 57-year-old woman presented with an early
stage II macular hole. I injected a 100% 0.5 cc SF6gas bubble into her vitreous cavity to sever the adhe-sion of the PH from the macula, thereby releasing thetraction on the hole. The injected bubble released thePH attachment from the fovea (Figure 2). The patientlay face down for 5 days; however, the hole didn’tclose. Why didn’t the hole close? A virtual angio-graphic C-scan from Cirrus HD-OCT demonstratedthat the PH schisis tissue remained on the surface ofthe retina, exerting tangential traction — which mayhave prevented the hole from closing (Figure 3). Thepatient underwent conventional macular hole surgerywith ILM peeling, and the hole closed (Figure 4). ThePH tissue lying on the ILM on inferior macula wasremoved with the ILM. Cirrus HD-OCT evenrevealed where I removed the ILM (Figure 5).
When removing retinal tissue, most surgeonsknow that less usually is better. Choosing not to peelthe ILM in all cases of macular hole surgery may
8
Figure 4. This is a high-resolution raster scan from Cirrus HD-OCT 1 weekfollowing successful macular hole surgery with ILM peeling. The patientreceived a 25% SF6 gas bubble injection and didn’t require face-downposturing.
Figure 5. This is a high-resolution C-scan from Cirrus HD-OCT followingsuccessful macular hole surgery with ILM peeling. Note that the PH remnants in Figure 3 aren’t present in the area inferior to the now-closedhole. The star-shaped area (shown here) represents a defect in the ILMwhere it was peeled.
Figure 3. A virtual angiography C-scan from Cirrus HD-OCT shows a post-pneumatic separation of theposterior hyaloid (PH) in the right eye. A large placoidremnant of the PH is noted on the IN macula adjacentto the macular hole, following pneumatic displacementof the PH. The horizontal high-resolution raster scan inFigure 2 usually doesn’t show this area, because thetissue is inferior to it. However, the Cirrus HD-OCT 3D scan routinely images this area.
0908OMD336-12.qxd:OMD Poly 9/26/08 11:00 AM Page 8
9
Metaphorically speaking, Stratus OCT took us fromradio to black and white TV. Cirrus HD-OCT takesus from black and white TV to high-definition (mil-lions of colors) TV, providing much more detail andinformation that we can use in daily practice. The fol-lowing case demonstrates the clinical relevance ofCirrus HD-OCT.
A Case of DMEA 64-year-old woman with insulin-dependent dia-
betes presented with DME. Over the last 2 years, herright eye was treated with laser photocoagulation,periocular steroids and, more recently, with 6 monthlyinjections of ranibizumab (Lucentis, Genentech, SouthSan Francisco, Calif.). The macular edema showed lit-tle improvement, and her visual acuity remained in the20/50 to 20/60 range.
Crystal Clear Images The patient’s vision in the fellow eye declined
from 20/20 to 20/60. The high-resolution B-scans of
One of the most frustrating cases the retina surgeonfaces is the patient with diabetic macular edema(DME). Anti-VEGF agents aren’t very effective intreating DME and could reduce vision further if mac-ular ischemia is present. Periocular and intravitrealcorticosteroids are short-acting, and subsequent injec-tions usually are less effective and even shorter-acting.Grid laser photocoagulation, sometimes used in com-bination with VEGF inhibitors and steroids, may besomewhat effective, but it’s associated with scotomas,areas of RPE atrophy that progressively enlarge, andsometimes iatrogenic choroidal neovascular membraneformation. Often, vitrectomy is considered if signifi-cant traction exists and after you’ve tried the othertherapies mentioned above.
We used Stratus OCT in the past to verify retinaltraction. In my experience, Cirrus HD-OCT providesunique, crisp images of the vitreoretinal interface anddemonstrates the magnitude of these vitreoretinalinterface forces in much greater detail. Stratus OCTrevolutionized the way we examined the retina.
Learn how Cirrus HD-OCT helped determine if vitrectomy wasnecessary in this DME case.
Make the Best TreatmentDecisions for Diabetic Macular Edema
By Paul E. Tornambe, MD
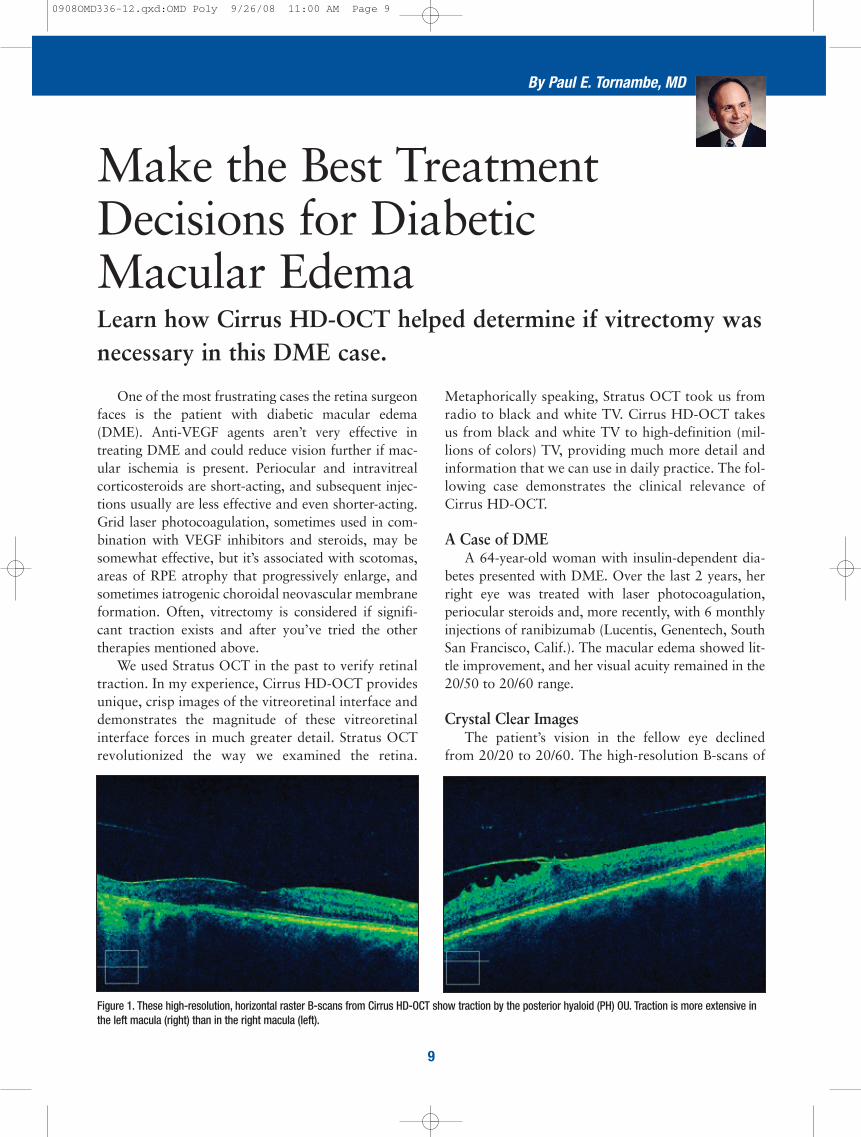
Figure 1. These high-resolution, horizontal raster B-scans from Cirrus HD-OCT show traction by the posterior hyaloid (PH) OU. Traction is more extensive inthe left macula (right) than in the right macula (left).
0908OMD336-12.qxd:OMD Poly 9/26/08 11:00 AM Page 9
10
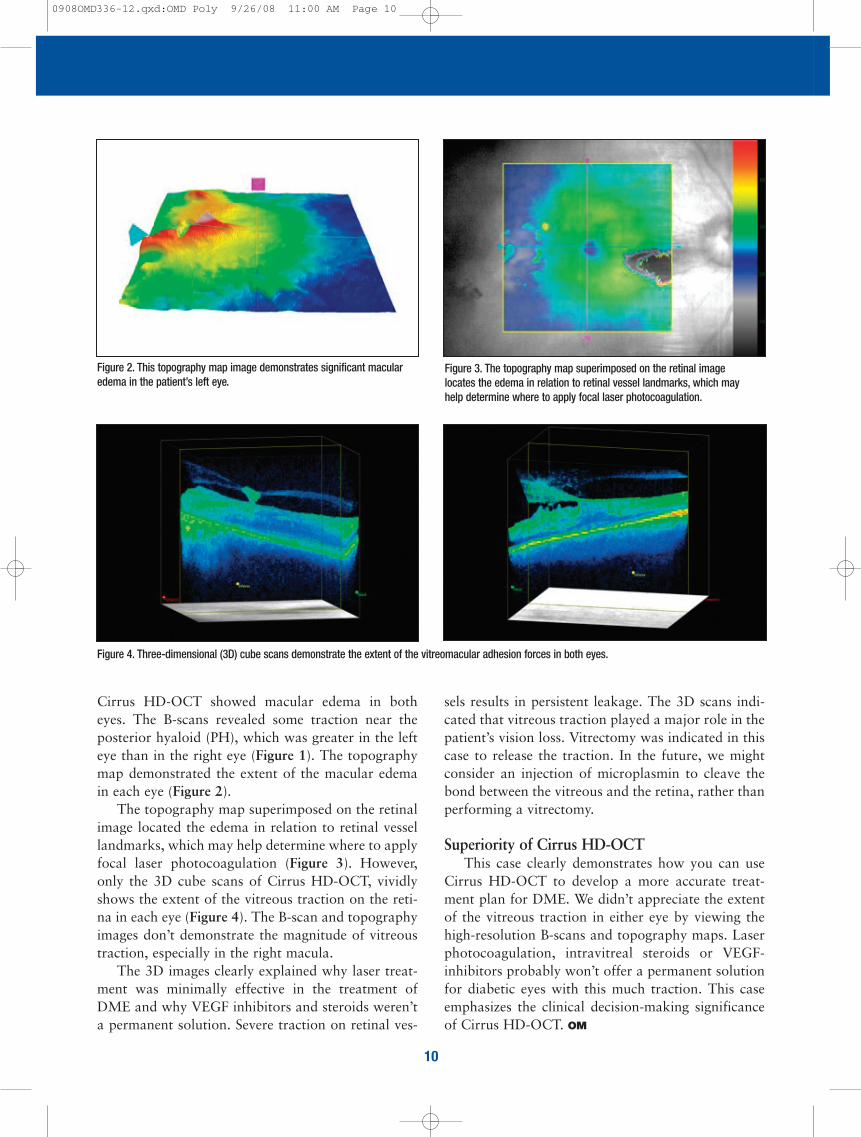
Figure 2. This topography map image demonstrates significant macularedema in the patient’s left eye.
Figure 3. The topography map superimposed on the retinal imagelocates the edema in relation to retinal vessel landmarks, which mayhelp determine where to apply focal laser photocoagulation.
sels results in persistent leakage. The 3D scans indi-cated that vitreous traction played a major role in thepatient’s vision loss. Vitrectomy was indicated in thiscase to release the traction. In the future, we mightconsider an injection of microplasmin to cleave thebond between the vitreous and the retina, rather thanperforming a vitrectomy.
Superiority of Cirrus HD-OCTThis case clearly demonstrates how you can use
Cirrus HD-OCT to develop a more accurate treat-ment plan for DME. We didn’t appreciate the extentof the vitreous traction in either eye by viewing thehigh-resolution B-scans and topography maps. Laserphotocoagulation, intravitreal steroids or VEGF-inhibitors probably won’t offer a permanent solutionfor diabetic eyes with this much traction. This caseemphasizes the clinical decision-making significanceof Cirrus HD-OCT. OM
Cirrus HD-OCT showed macular edema in botheyes. The B-scans revealed some traction near theposterior hyaloid (PH), which was greater in the lefteye than in the right eye (Figure 1). The topographymap demonstrated the extent of the macular edemain each eye (Figure 2).
The topography map superimposed on the retinalimage located the edema in relation to retinal vessellandmarks, which may help determine where to applyfocal laser photocoagulation (Figure 3). However,only the 3D cube scans of Cirrus HD-OCT, vividlyshows the extent of the vitreous traction on the reti-na in each eye (Figure 4). The B-scan and topographyimages don’t demonstrate the magnitude of vitreoustraction, especially in the right macula.
The 3D images clearly explained why laser treat-ment was minimally effective in the treatment ofDME and why VEGF inhibitors and steroids weren’ta permanent solution. Severe traction on retinal ves-
Figure 4. Three-dimensional (3D) cube scans demonstrate the extent of the vitreomacular adhesion forces in both eyes.
0908OMD336-12.qxd:OMD Poly 9/26/08 11:00 AM Page 10
Cirrus HD-OCT DifferenceCirrus HD-OCT provides rapid high-resolution
scanning of the entire retina, retinal pigment epitheli-um and choroid. It’s an important tool in glaucomadiagnostic imaging because it measures the thicknessand quality of the peripapillary RNFL, possiblywhere the earliest glaucomatous changes occur.
A 64-year-old Caucasian man was referred for anassessment of suspicious-looking optic discs and bor-derline intraocular pressures (IOPs). The patient hadno visual complaints but was slightly myopic. He hadhypertension and diabetes and was taking medica-tions for both conditions. He had no known familyhistory of significant ocular diseases.
Ophthalmic AssessmentThe patient’s visual acuity was 20/25 in both eyes,
and he had a mild myopic (–0.75D) correction. HisIOP was 21 mm Hg in the right eye and 20 mm Hg inthe left eye. Central corneal thickness (CCT) was 550microns in the right eye and 554 microns in the lefteye.
Optic disc examination of the right eye showedsome suspicious cupping with early inferior and supe-rior thinning of the neuroretinal rim. The left opticdisc seemed to have a normal inferior rim, althoughit appeared there might be superior neuroretinal rimthinning. Clinical assessment of the retinal nerve fiberlayer (RNFL) in both eyes revealed no obviousdefects.
Humphrey automated perimetry 24-2 showedthat both eyes had significant fixation losses with lowreliability. We found no obvious visual field defects ineither eye. Repeated automated perimetry showedvariable reliability and was within normal limits.
Our standard ophthalmic workup revealed suspi-cious optic discs, particularly in the right eye, withborderline IOPs and normal CCTs. Visual fields,although not entirely reliable with multiple testing,was within normal limits. The question was, “Doesthis patient have glaucoma or not?”
11
Here’s how various capabilities of Cirrus HD-OCT helpeddevelop an accurate treatment plan.
Confirming a QuestionableGlaucoma Diagnosis
By Iqbal K. Ahmed, MD, FRCSC, and Jennifer Calafati, MD
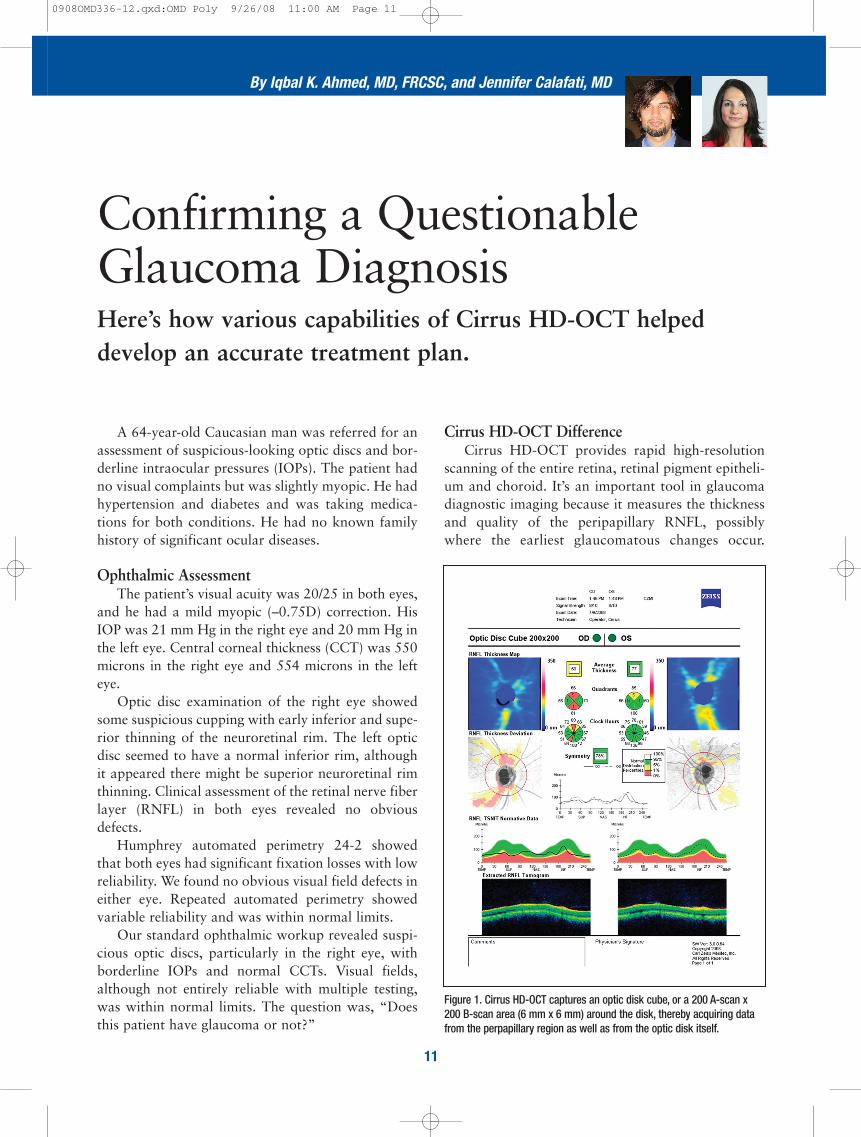
Figure 1. Cirrus HD-OCT captures an optic disk cube, or a 200 A-scan x200 B-scan area (6 mm x 6 mm) around the disk, thereby acquiring datafrom the perpapillary region as well as from the optic disk itself.
0908OMD336-12.qxd:OMD Poly 9/26/08 11:00 AM Page 11
and left eye was 78%, which is within the normalrange but is below the established mean of 88.6%.Asymmetry of RNFL thickness can be a useful find-ing in the diagnosis of glaucoma.
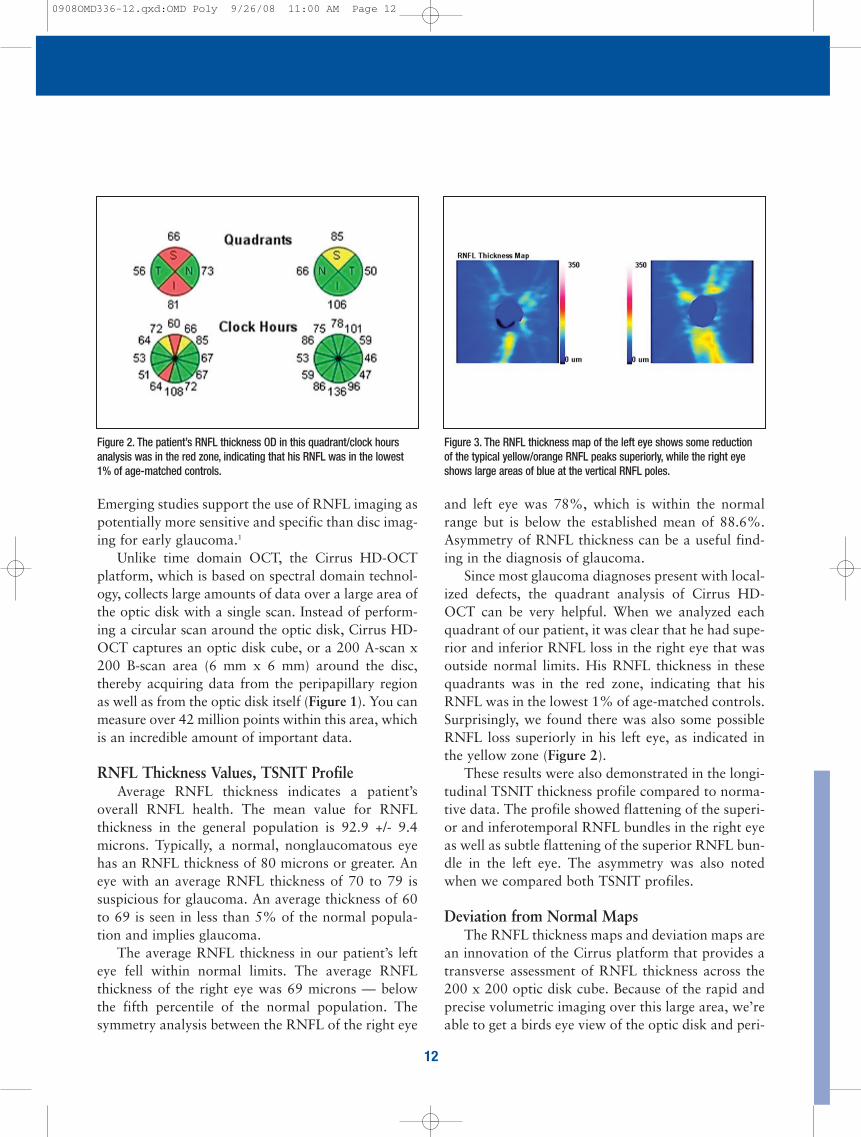
Since most glaucoma diagnoses present with local-ized defects, the quadrant analysis of Cirrus HD-OCT can be very helpful. When we analyzed eachquadrant of our patient, it was clear that he had supe-rior and inferior RNFL loss in the right eye that wasoutside normal limits. His RNFL thickness in thesequadrants was in the red zone, indicating that hisRNFL was in the lowest 1% of age-matched controls.Surprisingly, we found there was also some possibleRNFL loss superiorly in his left eye, as indicated inthe yellow zone (Figure 2).
These results were also demonstrated in the longi-tudinal TSNIT thickness profile compared to norma-tive data. The profile showed flattening of the superi-or and inferotemporal RNFL bundles in the right eyeas well as subtle flattening of the superior RNFL bun-dle in the left eye. The asymmetry was also notedwhen we compared both TSNIT profiles.
Deviation from Normal Maps The RNFL thickness maps and deviation maps are
an innovation of the Cirrus platform that provides atransverse assessment of RNFL thickness across the200 x 200 optic disk cube. Because of the rapid andprecise volumetric imaging over this large area, we’reable to get a birds eye view of the optic disk and peri-
Emerging studies support the use of RNFL imaging aspotentially more sensitive and specific than disc imag-ing for early glaucoma.1
Unlike time domain OCT, the Cirrus HD-OCTplatform, which is based on spectral domain technol-ogy, collects large amounts of data over a large area ofthe optic disk with a single scan. Instead of perform-ing a circular scan around the optic disk, Cirrus HD-OCT captures an optic disk cube, or a 200 A-scan x200 B-scan area (6 mm x 6 mm) around the disc,thereby acquiring data from the peripapillary regionas well as from the optic disk itself (Figure 1). You canmeasure over 42 million points within this area, whichis an incredible amount of important data.
RNFL Thickness Values, TSNIT Profile Average RNFL thickness indicates a patient’s
overall RNFL health. The mean value for RNFLthickness in the general population is 92.9 +/- 9.4microns. Typically, a normal, nonglaucomatous eyehas an RNFL thickness of 80 microns or greater. Aneye with an average RNFL thickness of 70 to 79 issuspicious for glaucoma. An average thickness of 60to 69 is seen in less than 5% of the normal popula-tion and implies glaucoma.
The average RNFL thickness in our patient’s lefteye fell within normal limits. The average RNFLthickness of the right eye was 69 microns — belowthe fifth percentile of the normal population. Thesymmetry analysis between the RNFL of the right eye
12
Figure 2. The patient’s RNFL thickness OD in this quadrant/clock hoursanalysis was in the red zone, indicating that his RNFL was in the lowest1% of age-matched controls.
Figure 3. The RNFL thickness map of the left eye shows some reductionof the typical yellow/orange RNFL peaks superiorly, while the right eyeshows large areas of blue at the vertical RNFL poles.
0908OMD336-12.qxd:OMD Poly 9/26/08 11:00 AM Page 12
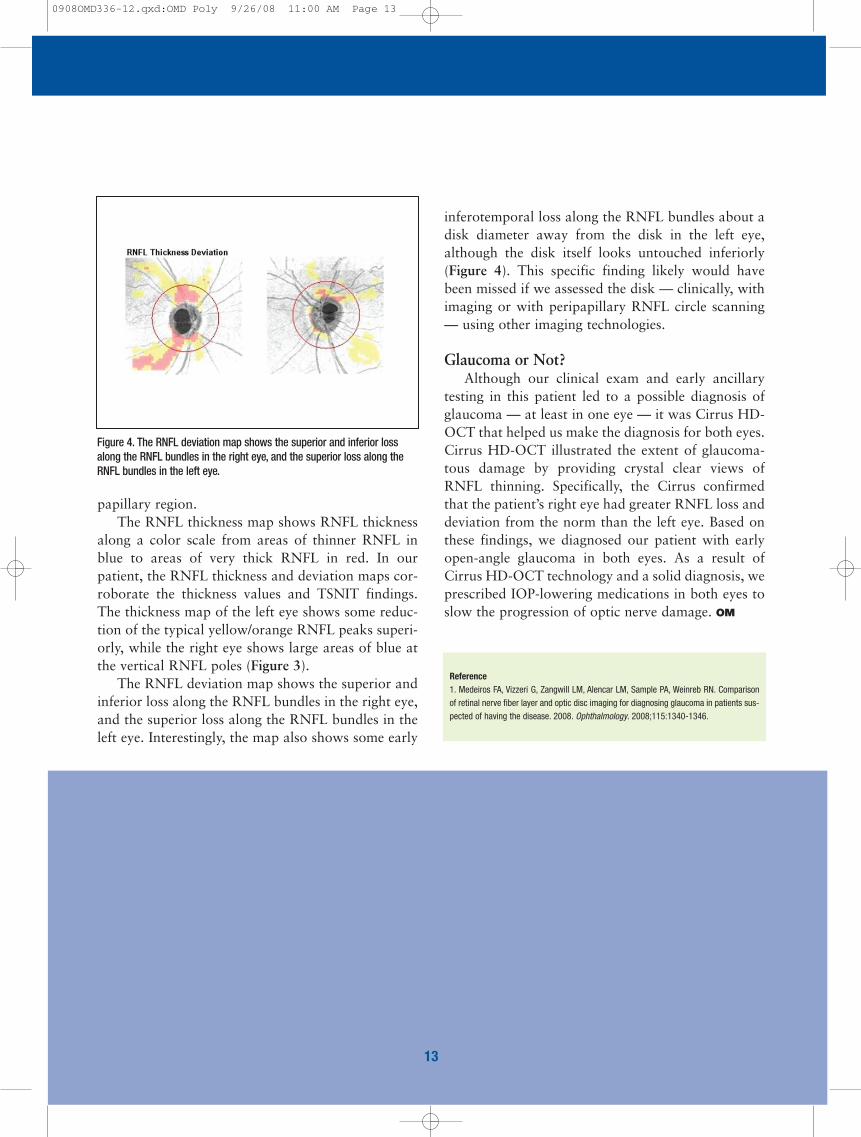
inferotemporal loss along the RNFL bundles about adisk diameter away from the disk in the left eye,although the disk itself looks untouched inferiorly(Figure 4). This specific finding likely would havebeen missed if we assessed the disk — clinically, withimaging or with peripapillary RNFL circle scanning— using other imaging technologies.
Glaucoma or Not?Although our clinical exam and early ancillary
testing in this patient led to a possible diagnosis ofglaucoma — at least in one eye — it was Cirrus HD-OCT that helped us make the diagnosis for both eyes.Cirrus HD-OCT illustrated the extent of glaucoma-tous damage by providing crystal clear views ofRNFL thinning. Specifically, the Cirrus confirmedthat the patient’s right eye had greater RNFL loss anddeviation from the norm than the left eye. Based onthese findings, we diagnosed our patient with earlyopen-angle glaucoma in both eyes. As a result ofCirrus HD-OCT technology and a solid diagnosis, weprescribed IOP-lowering medications in both eyes toslow the progression of optic nerve damage. OM
papillary region. The RNFL thickness map shows RNFL thickness
along a color scale from areas of thinner RNFL inblue to areas of very thick RNFL in red. In ourpatient, the RNFL thickness and deviation maps cor-roborate the thickness values and TSNIT findings.The thickness map of the left eye shows some reduc-tion of the typical yellow/orange RNFL peaks superi-orly, while the right eye shows large areas of blue atthe vertical RNFL poles (Figure 3).
The RNFL deviation map shows the superior andinferior loss along the RNFL bundles in the right eye,and the superior loss along the RNFL bundles in theleft eye. Interestingly, the map also shows some early
Figure 4. The RNFL deviation map shows the superior and inferior lossalong the RNFL bundles in the right eye, and the superior loss along theRNFL bundles in the left eye.
Reference1. Medeiros FA, Vizzeri G, Zangwill LM, Alencar LM, Sample PA, Weinreb RN. Comparisonof retinal nerve fiber layer and optic disc imaging for diagnosing glaucoma in patients sus-pected of having the disease. 2008. Ophthalmology. 2008;115:1340-1346.
13
0908OMD336-12.qxd:OMD Poly 9/26/08 11:00 AM Page 13
Evaluating and Treating DME One application of Cirrus HD-OCT that’s particu-
larly beneficial is the ability to see detailed images andmaps of visual changes related to diabetes complica-tions that help with diagnosis and disease management.
I examined a 75-year-old man with moderate, non-proliferative diabetic retinopathy who complained thathis vision substantially worsened following uneventfulcataract surgery in his left eye. His preoperative visualacuity was 20/70 OS. At 6 weeks postop, his acuitydropped to 20/400. In addition, the patient had devel-oped significant Amsler grid abnormalities. Since thetime of his cataract surgery, he’d been treated with top-ical nonsteroidal anti-inflammatory agents (NSAIDs)and topical corticosteroids.
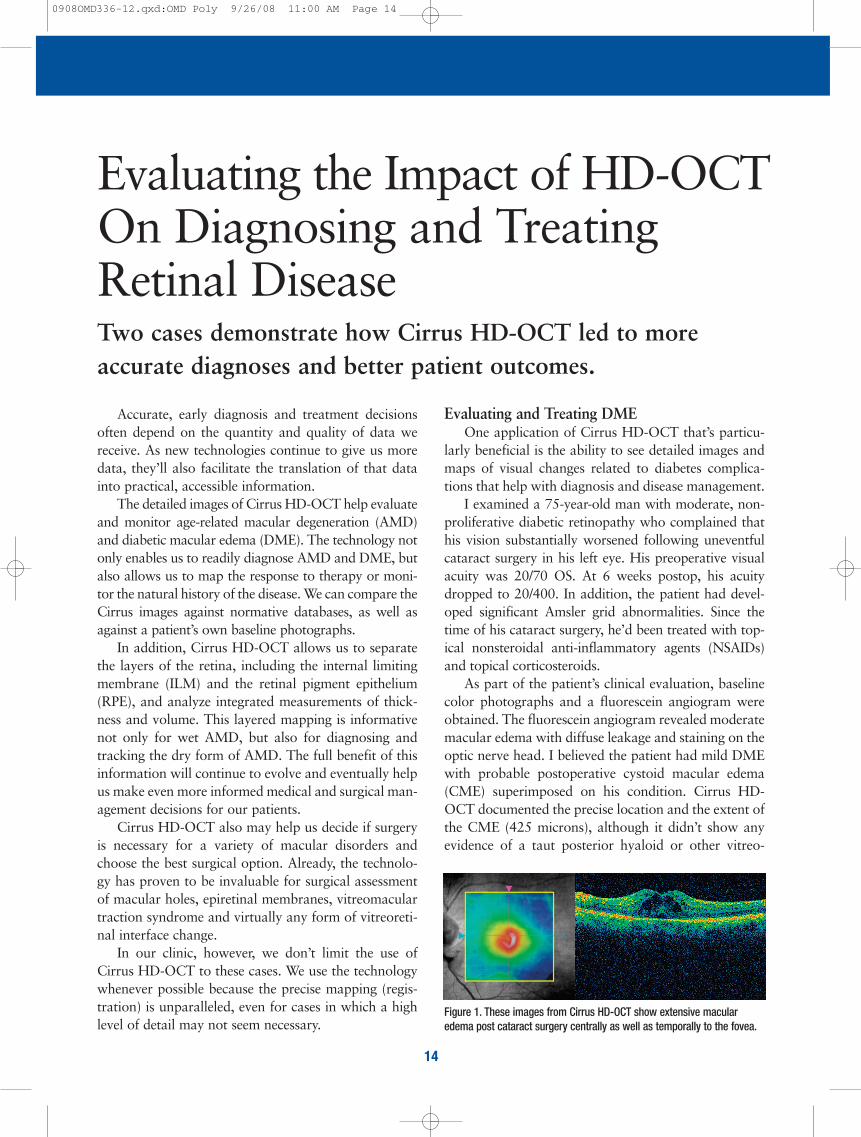
As part of the patient’s clinical evaluation, baselinecolor photographs and a fluorescein angiogram wereobtained. The fluorescein angiogram revealed moderatemacular edema with diffuse leakage and staining on theoptic nerve head. I believed the patient had mild DMEwith probable postoperative cystoid macular edema(CME) superimposed on his condition. Cirrus HD-OCT documented the precise location and the extent ofthe CME (425 microns), although it didn’t show anyevidence of a taut posterior hyaloid or other vitreo-
Accurate, early diagnosis and treatment decisionsoften depend on the quantity and quality of data wereceive. As new technologies continue to give us moredata, they’ll also facilitate the translation of that datainto practical, accessible information.
The detailed images of Cirrus HD-OCT help evaluateand monitor age-related macular degeneration (AMD)and diabetic macular edema (DME). The technology notonly enables us to readily diagnose AMD and DME, butalso allows us to map the response to therapy or moni-tor the natural history of the disease. We can compare theCirrus images against normative databases, as well asagainst a patient’s own baseline photographs.
In addition, Cirrus HD-OCT allows us to separatethe layers of the retina, including the internal limitingmembrane (ILM) and the retinal pigment epithelium(RPE), and analyze integrated measurements of thick-ness and volume. This layered mapping is informativenot only for wet AMD, but also for diagnosing andtracking the dry form of AMD. The full benefit of thisinformation will continue to evolve and eventually helpus make even more informed medical and surgical man-agement decisions for our patients.
Cirrus HD-OCT also may help us decide if surgeryis necessary for a variety of macular disorders andchoose the best surgical option. Already, the technolo-gy has proven to be invaluable for surgical assessmentof macular holes, epiretinal membranes, vitreomaculartraction syndrome and virtually any form of vitreoreti-nal interface change.
In our clinic, however, we don’t limit the use ofCirrus HD-OCT to these cases. We use the technologywhenever possible because the precise mapping (regis-tration) is unparalleled, even for cases in which a highlevel of detail may not seem necessary.
14
Two cases demonstrate how Cirrus HD-OCT led to more accurate diagnoses and better patient outcomes.
Evaluating the Impact of HD-OCTOn Diagnosing and TreatingRetinal Disease
Figure 1. These images from Cirrus HD-OCT show extensive macularedema post cataract surgery centrally as well as temporally to the fovea.
0908OMD336-12.qxd:OMD Poly 9/26/08 11:00 AM Page 14
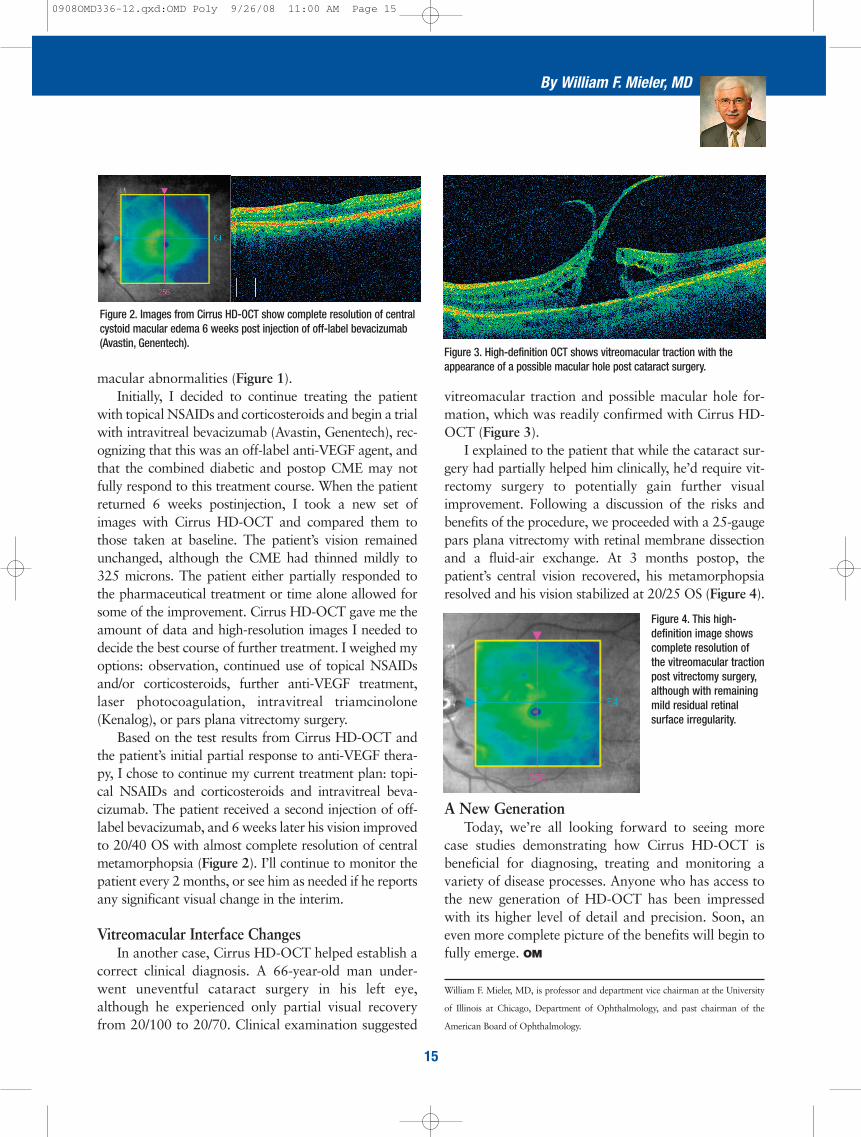
vitreomacular traction and possible macular hole for-mation, which was readily confirmed with Cirrus HD-OCT (Figure 3).
I explained to the patient that while the cataract sur-gery had partially helped him clinically, he’d require vit-rectomy surgery to potentially gain further visualimprovement. Following a discussion of the risks andbenefits of the procedure, we proceeded with a 25-gaugepars plana vitrectomy with retinal membrane dissectionand a fluid-air exchange. At 3 months postop, thepatient’s central vision recovered, his metamorphopsiaresolved and his vision stabilized at 20/25 OS (Figure 4).
A New GenerationToday, we’re all looking forward to seeing more
case studies demonstrating how Cirrus HD-OCT isbeneficial for diagnosing, treating and monitoring avariety of disease processes. Anyone who has access tothe new generation of HD-OCT has been impressedwith its higher level of detail and precision. Soon, aneven more complete picture of the benefits will begin tofully emerge. OM
William F. Mieler, MD, is professor and department vice chairman at the University
of Illinois at Chicago, Department of Ophthalmology, and past chairman of the
American Board of Ophthalmology.
macular abnormalities (Figure 1). Initially, I decided to continue treating the patient
with topical NSAIDs and corticosteroids and begin a trialwith intravitreal bevacizumab (Avastin, Genentech), rec-ognizing that this was an off-label anti-VEGF agent, andthat the combined diabetic and postop CME may notfully respond to this treatment course. When the patientreturned 6 weeks postinjection, I took a new set ofimages with Cirrus HD-OCT and compared them tothose taken at baseline. The patient’s vision remainedunchanged, although the CME had thinned mildly to325 microns. The patient either partially responded tothe pharmaceutical treatment or time alone allowed forsome of the improvement. Cirrus HD-OCT gave me theamount of data and high-resolution images I needed todecide the best course of further treatment. I weighed myoptions: observation, continued use of topical NSAIDsand/or corticosteroids, further anti-VEGF treatment,laser photocoagulation, intravitreal triamcinolone(Kenalog), or pars plana vitrectomy surgery.
Based on the test results from Cirrus HD-OCT andthe patient’s initial partial response to anti-VEGF thera-py, I chose to continue my current treatment plan: topi-cal NSAIDs and corticosteroids and intravitreal beva-cizumab. The patient received a second injection of off-label bevacizumab, and 6 weeks later his vision improvedto 20/40 OS with almost complete resolution of centralmetamorphopsia (Figure 2). I’ll continue to monitor thepatient every 2 months, or see him as needed if he reportsany significant visual change in the interim.
Vitreomacular Interface ChangesIn another case, Cirrus HD-OCT helped establish a
correct clinical diagnosis. A 66-year-old man under-went uneventful cataract surgery in his left eye,although he experienced only partial visual recoveryfrom 20/100 to 20/70. Clinical examination suggested
15
By William F. Mieler, MD
Figure 2. Images from Cirrus HD-OCT show complete resolution of centralcystoid macular edema 6 weeks post injection of off-label bevacizumab(Avastin, Genentech).
Figure 3. High-definition OCT shows vitreomacular traction with theappearance of a possible macular hole post cataract surgery.
Figure 4. This high-definition image showscomplete resolution ofthe vitreomacular tractionpost vitrectomy surgery,although with remainingmild residual retinal surface irregularity.
0908OMD336-12.qxd:OMD Poly 9/26/08 11:00 AM Page 15