Embed Size (px)
Citation preview
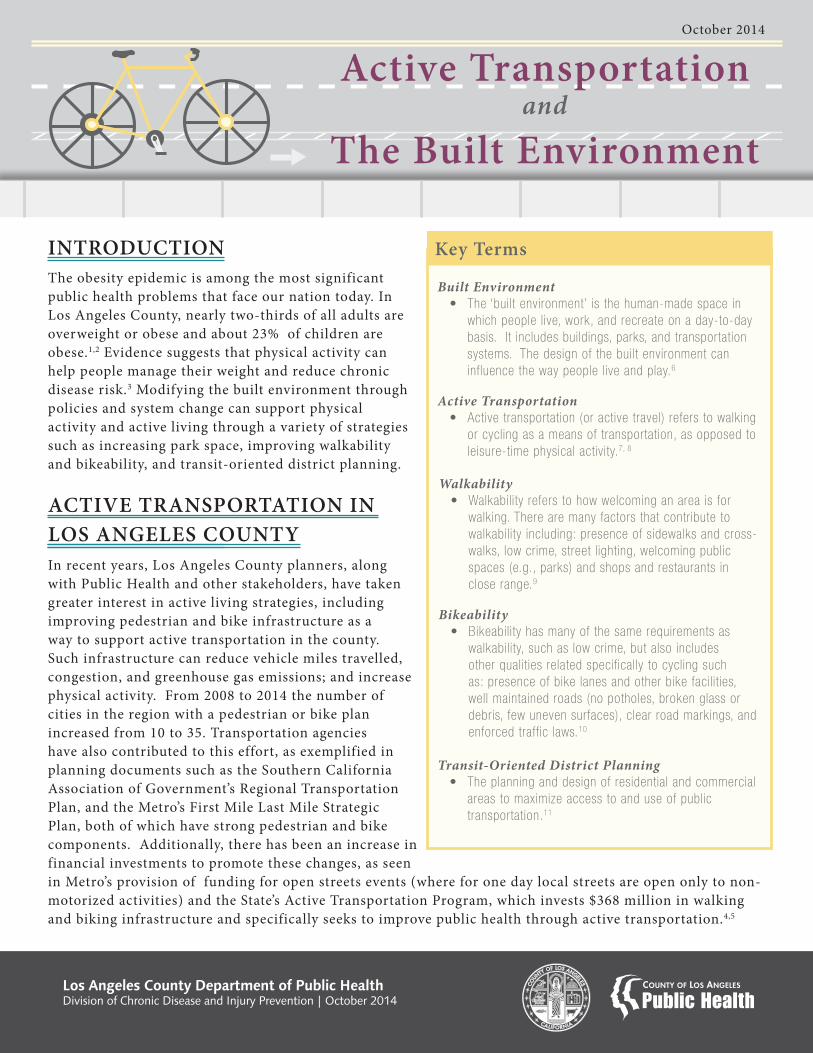
The obesity epidemic is among the most significant public health problems that face our nation today. In Los Angeles County, nearly two-thirds of all adults are overweight or obese and about 23% of children are obese.1,2 Evidence suggests that physical activity can help people manage their weight and reduce chronic disease risk.3 Modifying the built environment through policies and system change can support physical activity and active living through a variety of strategies such as increasing park space, improving walkability and bikeability, and transit-oriented district planning.
INTRODUCTION
Active Transportationand
The Built Environment
In recent years, Los Angeles County planners, along with Public Health and other stakeholders, have taken greater interest in active living strategies, including improving pedestrian and bike infrastructure as a way to support active transportation in the county. Such infrastructure can reduce vehicle miles travelled, congestion, and greenhouse gas emissions; and increase physical activity. From 2008 to 2014 the number of cities in the region with a pedestrian or bike plan increased from 10 to 35. Transportation agencies have also contributed to this effort, as exemplified in planning documents such as the Southern California Association of Government’s Regional Transportation Plan, and the Metro’s First Mile Last Mile Strategic Plan, both of which have strong pedestrian and bike components. Additionally, there has been an increase in financial investments to promote these changes, as seen in Metro’s provision of funding for open streets events (where for one day local streets are open only to non-motorized activities) and the State’s Active Transportation Program, which invests $368 million in walking and biking infrastructure and specifically seeks to improve public health through active transportation.4,5
ACTIVE TRANSPORTATION IN LOS ANGELES COUNTY
October 2014
Built Environment
6
Active Transportation
Walkability
9
Bikeability
Key Terms
Transit-Oriented District Planning
11
Los Angeles County Department of Public Health
Division of Chronic Disease and Injury Prevention | October 2014
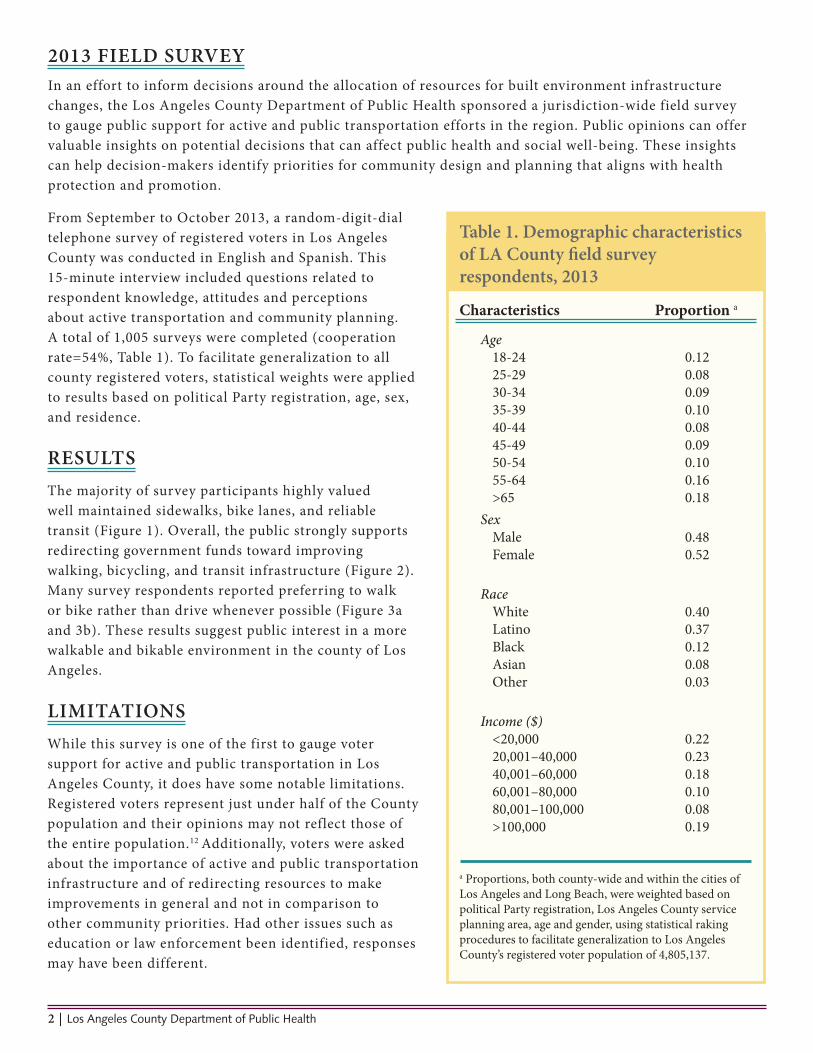
Table 1. Demographic characteristics of LA County !eld survey respondents, 2013Characteristics
0.120.080.090.100.080.090.100.160.18
0.220.230.180.100.080.19
0.400.370.120.080.03
Proportion a
Age18-2425-2930-3435-3940-4445-4950-5455-64>65
Income ($)<20,000 20,001–40,000 40,001–60,000 60,001–80,00080,001–100,000 >100,000
RaceWhiteLatinoBlackAsianOther
SexMaleFemale
0.48 0.52
a Proportions, both county-wide and within the cities of Los Angeles and Long Beach, were weighted based on political Party registration, Los Angeles County service planning area, age and gender, using statistical raking procedures to facilitate generalization to Los Angeles County’s registered voter population of 4,805,137.
In an effort to inform decisions around the allocation of resources for built environment infrastructure changes, the Los Angeles County Department of Public Health sponsored a jurisdiction-wide field survey to gauge public support for active and public transportation efforts in the region. Public opinions can offer valuable insights on potential decisions that can affect public health and social well-being. These insights can help decision-makers identify priorities for community design and planning that aligns with health protection and promotion.
2013 FIELD SURVEY
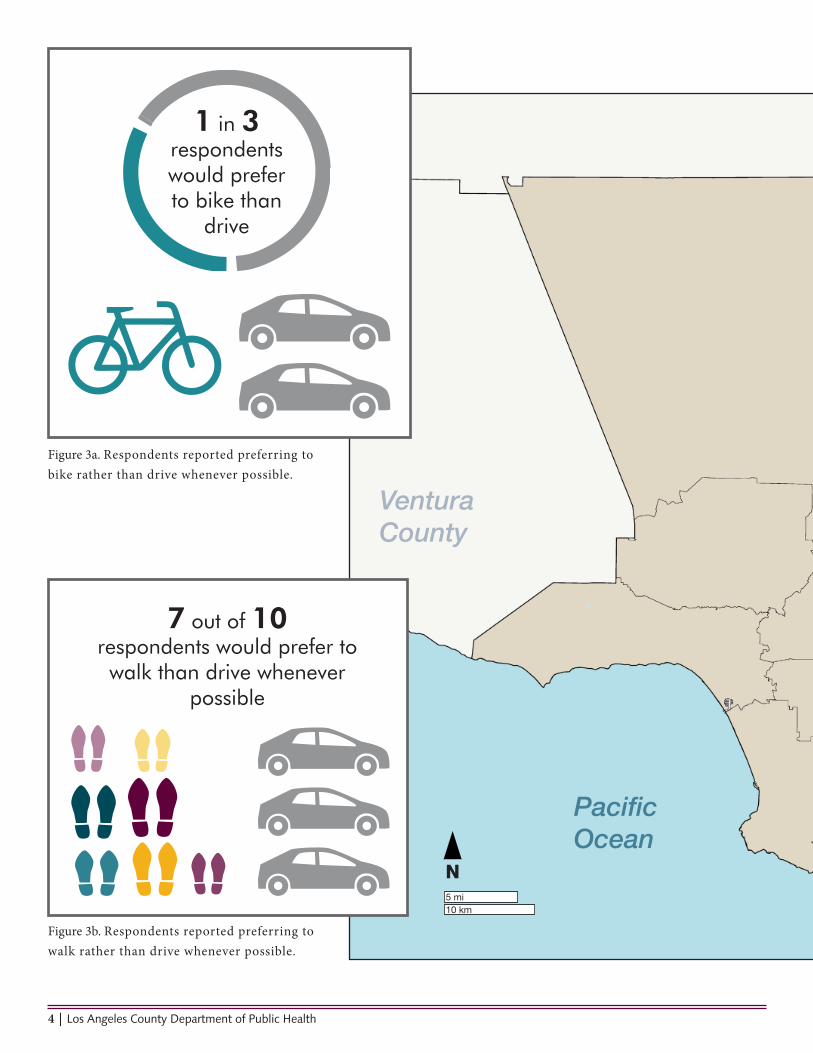
The majority of survey participants highly valued well maintained sidewalks, bike lanes, and reliable transit (Figure 1). Overall, the public strongly supports redirecting government funds toward improving walking, bicycling, and transit infrastructure (Figure 2). Many survey respondents reported preferring to walk or bike rather than drive whenever possible (Figure 3a and 3b). These results suggest public interest in a more walkable and bikable environment in the county of Los Angeles.
RESULTS
From September to October 2013, a random-digit-dial telephone survey of registered voters in Los Angeles County was conducted in English and Spanish. This 15-minute interview included questions related to respondent knowledge, attitudes and perceptions about active transportation and community planning. A total of 1,005 surveys were completed (cooperation rate=54%, Table 1). To facilitate generalization to all county registered voters, statistical weights were applied to results based on political Party registration, age, sex, and residence.
2 | Los Angeles County Department of Public Health
While this survey is one of the first to gauge voter support for active and public transportation in Los Angeles County, it does have some notable limitations. Registered voters represent just under half of the County population and their opinions may not reflect those of the entire population.12 Additionally, voters were asked about the importance of active and public transportation infrastructure and of redirecting resources to make improvements in general and not in comparison to other community priorities. Had other issues such as education or law enforcement been identified, responses may have been different.
LIMITATIONS
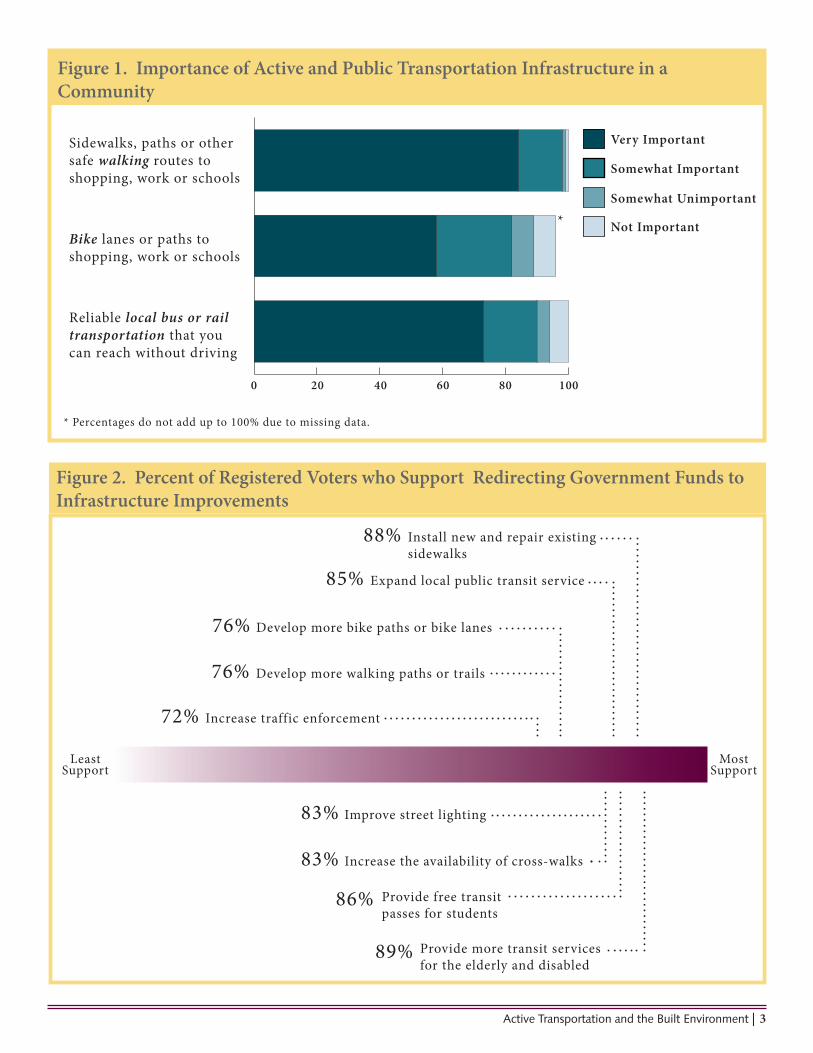
Figure 1. Importance of Active and Public Transportation Infrastructure in a Community
Active Transportation and the Built Environment | 3
Sidewalks, paths or other safe walking routes to shopping, work or schools
Bike lanes or paths to shopping, work or schools
Reliable local bus or rail transportation that you can reach without driving
Very Important
Somewhat Important
Not Important
Somewhat Unimportant
* Percentages do not add up to 100% due to missing data.
0
*
20 40 60 80 100
Figure 2. Percent of Registered Voters who Support Redirecting Government Funds to Infrastructure Improvements
Most Support
LeastSupport
Develop more walking paths or trails76%
76% Develop more bike paths or bike lanes
72% Increase traffic enforcement
Expand local public transit service85%
Install new and repair existing sidewalks
88%
Provide more transit services for the elderly and disabled
Improve street lighting83%
Increase the availability of cross-walks83%Provide free transit passes for students
86%
89%
4 | Los Angeles County Department of Public Health
0ACIÛC�Ocean
6ENTURA�County
N5 mi10 km
Figure 3a. Respondents reported preferring to bike rather than drive whenever possible.
Figure 3b. Respondents reported preferring to walk rather than drive whenever possible.
1 in 3respondents would prefer to bike than
drive
7 out of 10respondents would prefer to walk than drive whenever
possible
Active Transportation and the Built Environment | 5
- Data from the City of Long Beach, 2012
/RANGE�County
,OS�!NGELESCounty
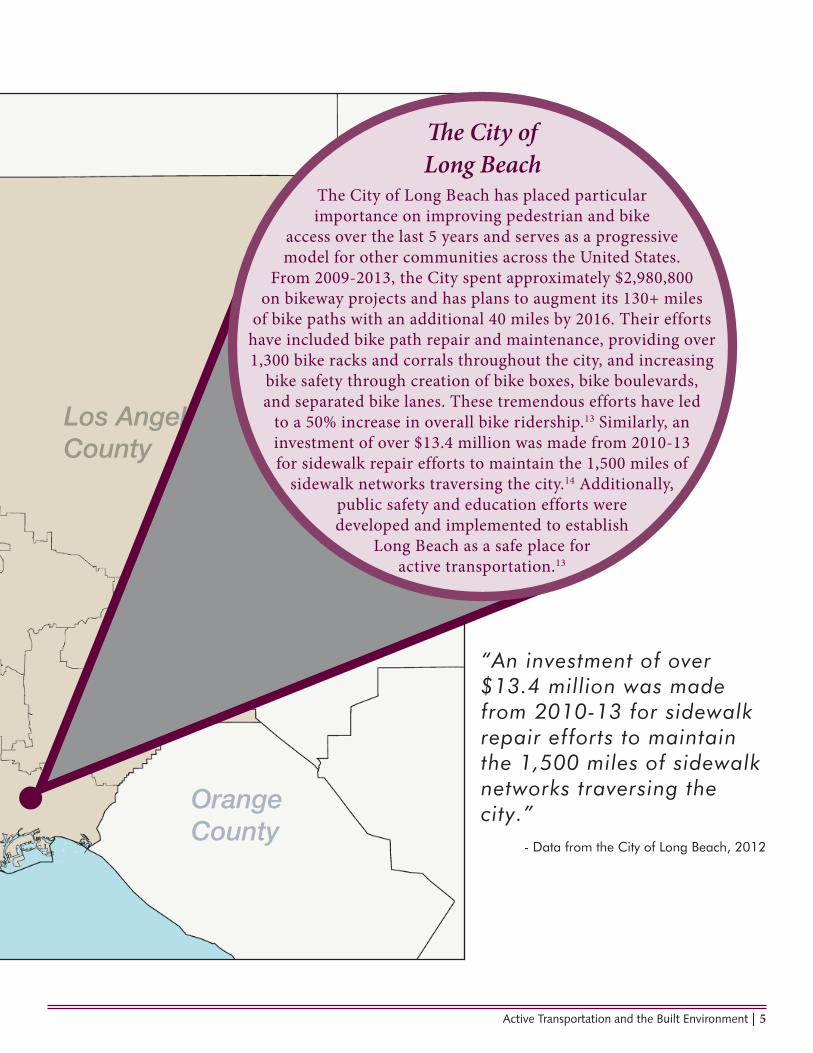
“An investment of over $13.4 million was made from 2010-13 for sidewalk repair efforts to maintain the 1,500 miles of sidewalk networks traversing the city.”
!e City of
The City of Long Beach has placed particular importance on improving pedestrian and bike
access over the last 5 years and serves as a progressive model for other communities across the United States.
From 2009-2013, the City spent approximately $2,980,800 on bikeway projects and has plans to augment its 130+ miles
of bike paths with an additional 40 miles by 2016. Their efforts have included bike path repair and maintenance, providing over 1,300 bike racks and corrals throughout the city, and increasing
bike safety through creation of bike boxes, bike boulevards, and separated bike lanes. These tremendous efforts have led
to a 50% increase in overall bike ridership.13 Similarly, an investment of over $13.4 million was made from 2010-13 for sidewalk repair efforts to maintain the 1,500 miles of
sidewalk networks traversing the city.14 Additionally, public safety and education efforts were developed and implemented to establish
Long Beach as a safe place for active transportation.13
Long Beach
Recommendations
Infrastructure Changes that Promote Active Living
Conduct a sidewalk inventory and prioritize missing sidewalk installation and sidewalk repair.Add quality bikeways to roads such as: bike lanes with buffers, cycle tracks or separated bike lanes, and bike boulevards.Change signal timing to better accommodate pedestrians, including protected left turns, leading pedestrian intervals, automatic walk signal instead of push buttons, and elimination of right turns on red.Use high-visibility crosswalk markings for all crossings.Add midblock crosswalks when marked crosswalks are more than 800 feet long and include additional safety features such as crossing islands, rectangular rapid flash beacons, advanced yield markings, and signs.Install appropriate bicycle parking at key destinations (downtown, employment centers, schools, at transit stops, park and ride lots).
Programming Initiatives that can Foster Community Support for Active Transportation Investments
Develop pedestrian and bike media campaigns to promote pedestrian and bicycle-related events and increase knowledge of safe walking, riding, and driving practices.Conduct safety education in schools including field training. Work with Police Departments to target traffic enforcement in high-risk areas during high-risk periods (weekends, commute times, near schools, at alcohol outlets, etc.).Work with local business districts to become bicycle-friendly business districts by providing discounts or other incentives to people who ride their bikes to shop or dine in the district. Organize regular bike rides and walks, such as a “Walk with the Mayor” or a “City History Bike Ride”. Work with large employers to provide incentives for active commuting.Work with the League of American Bicyclists and other local groups to offer bicycle safety classes to adults and children.
Policy and Planning Efforts that can be Implemented to Prioritize Active Transportation Improvements in Your Community
Adopt active transportation and/or pedestrian and bicycle plans that create a network of pedestrian and bicycle improvements that facilitate travel to key destinations. Adopt a Complete Streets policy. Adopt transit-oriented district plans to increase walking/biking to and from rail and bus stations. Adopt a traffic calming policy and plan. Develop and adopt a bicycle parking ordinance.Lower speed limits in school zones to 15 mph within 500 feet of a school and 25 mph within 500 to 1000 feet of a school. Increase regional and local funding for active transportation infrastructure projects.Adopt mixed-use residential, commercial, and office zoning where appropriate.Require walking, biking, and wheelchair facilities in new developments.Incentivize mixed-use, compact development.
6 | Los Angeles County Department of Public Health
Active Transportation and the Built Environment | 7
RESOURCES
ChangeLab Solutions’s Tools for Health Planning portal provides communities with guides and sample policies for Complete Streets, bicycle parking, and more. http://changelabsolutions.org/tools-healthy-planning
The PLACE program (Policies for Livable, Active Communities and Environments), in the Los Angeles County Department of Public Health, is dedicated to fostering policy change that supports the development of healthy, safe and active environments for all Los Angeles County residents. http://publichealth.lacounty.gov/place/
The Centers for Disease Control and Prevention’s Built Environment and Health Initiative provides federal expertise to help states and communities integrate health considerations into transportation and community planning decisions. http://www.cdc.gov/nceh/information/built_environment.htm
National Association of City Transportation Officials’ Urban Street Design and Urban Bikeway Design Guides provide cities a blueprint for complete streets that are safe and enjoyable for everyone using them. http://nacto.org
1. Los Angeles County Department of Public Health. Los Angeles County Health Survey, 2011. Retrieved May 23, 2014, from http://www.publichealth.lacounty.gov/ha/LACHSDataTopics2011.htm.
2. Los Angeles County Department of Public Health, Office of Health Assessment and Epidemiology. Obesity and Related Mortality in Los Angeles County: A Cities and communities Health Report; September 2011.
3. Warburton D, Nicol C, Bredin S. Health benefits of physical activity: the evidence. Canadian Medical Association Journal. 2006: 174(6); 801-809.
4. California Transportation Commission. Active Transportation Program. http://www.catc.ca.gov/programs/ATP.htm5. Center for Active Design. A policy win for active transportation. Retrieved May 23, 2014. http://centerforactivedesign.org/
capolicyactivetransportation6. Roof K, Oleru N. Public health: Seattle and King County’s push for the built environment. Journal of Environmental Health.
2008; 71(1):24-7.7. Panter J, Jones A. Attitudes and the environment as determinants of active travel in adults: What do and don’t we know? Journal
of Physical Activity and Health. 2010; 7(4):551-61.8. Sallis J, Cervero R, Ascher W, Henderson K, Kraft M, Kerr J. An ecological approach to creating active living communities.
Annual Review of Public Health. 2006; 27:297-322.9. U.S. Department of Transportation, National Highway Traffic Safety Administration, U.S. Environmental Protection Agency,
National Center for Safe Routes to School, Pedestrian and Bicycle Information Center. Walkability checklist. Retrieved May 23, 2014 http://katana.hsrc.unc.edu/cms/downloads/walkability_checklist.pdf
10. U.S. Department of Transportation, National Highway Traffic Safety Administration. Bikeability Checklist. Retrieved May 23, 2014. http://www.nhtsa.gov/people/injury/pedbimot/bike/Bikeability/checklist.htm
11. U.S. Department of Transportation - Federal Transit Administration. Transit-oriented Development. Retrieved October 12, 2013, from http://www.fta.dot.gov/12347_6932.html
12. Logan DC. Los Angeles County Registrar-Recorder/County Clerk. Preliminary voter registration report activity through October 22, 2012.
13. City of Long Beach. Bike Long Beach. Retrieved May 23, 2014. http://www.bikelongbeach.org/14. City of Long Beach. Personal Communication. April 2, 2014
References
Made possible with funding from the Centers for Disease Control and Prevention through the Los Angeles County Department of Public Health.
Los Angeles County Department of Public HealthDivision of Chronic Disease & Injury Prevention3530 Wilshire Boulevard, 8th Floor Los Angeles, CA 90010(213) 351-7301
Los Angeles County Department of Public Health
Cynthia A. Harding, MPHInterim Director
Jeffrey D. Gunzenhauser, MD, MPHInterim Health Officer
Division of Chronic Disease and Injury Prevention
Paul Simon, MD, MPHDirector
Tony Kuo, MD, MSHSDeputy Director
Linda Aragon, MPHChief, Programs and Policy
Los Angeles County Board of Supervisors
Gloria Molina First District
Mark Ridley-Thomas Second District
Zev Yaroslavsky Third District
Don Knabe Fourth District
Michael D. Antonovich Fifth District
ContributorsNoel C. Barragan, MPH, Research & EvaluationLauren N. Gase, MPH, Health and Policy AssessmentJean Armbruster, MA, PLACE ProgramAlexis Lantz, MA, PLACE ProgramKatrina Mai Võ, UCLA Fielding School of Public Health
Suggested Citation: Active Transportation and the Built Environment. Division of Chronic Disease and Injury Prevention. Los Angeles County Department of Public Health. October 2014.
Electronic copies of this brief may be downloaded at www.publichealth.lacounty.gov/chronic


![Active Transportation – Making It Work in Canadian ......Active Transportation - Making It Work In Canadian Communities iv November 2010 AT [Active transportation] Active transportation](https://img.pdfslide.net/doc/110x75/60e99b5bb07da13e9f6cb1d6/active-transportation-a-making-it-work-in-canadian-active-transportation.jpg)