Embed Size (px)
Citation preview
O C TO B E R 2 01 6
ASIAN STEEL WATCH
02
INDUSTRY 4.0 AND THE ASIAN STEEL INDUSTRY
WINDS OF CHANGE ARE BLOWING
INTERVIEW
Ask the Guru: Roads Ahead for the Steel IndustryEdwin Basson, Director General of worldsteel
ON THE COVER
Accelerating Digital Transformation with Smart Factory to Unlock New ValueJeong, Duk-Kyun, POSCO ICT
FEATURED ARTICLES
Restructuring of the Chinese Steel Industry:Retrospects and ProspectsSPECIAL REPORT
Global Competitiveness Through Hybridization of FINEX and CEM ProcessesDong Joon MIN, Professor of Yonsei University
MARKET TREND AND ANALYSIS
Examining the Past 100 Years:Where is the Steel Super Cycle Headed?

O C T O B E R 2 0 1 6
ASIAN STEEL WATCH
02
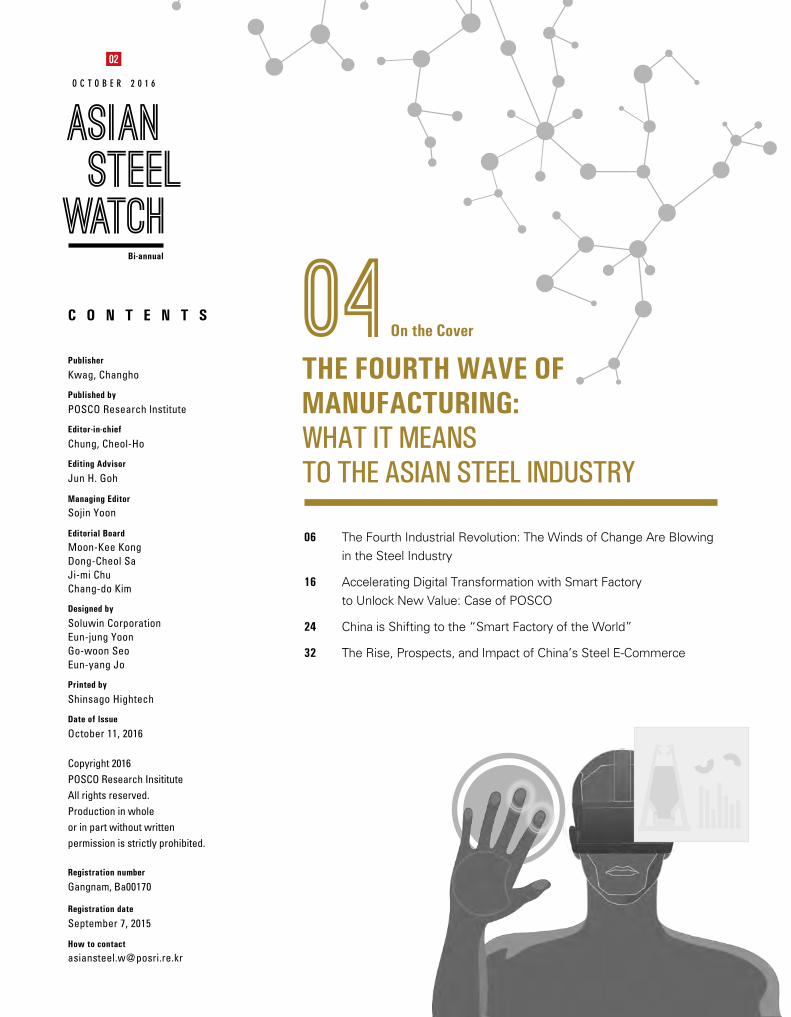
On the Cover04
06 The Fourth Industrial Revolution: The Winds of Change Are Blowing in the Steel Industry
16 Accelerating Digital Transformation with Smart Factory to Unlock New Value: Case of POSCO
24 China is Shifting to the “Smart Factory of the World”
32 The Rise, Prospects, and Impact of China’s Steel E-Commerce
THE FOURTH WAVE OF MANUFACTURING: WHAT IT MEANS TO THE ASIAN STEEL INDUSTRY
Publisher Kwag, Changho
Published by POSCO Research lnstitute
Editor-in-chief Chung, Cheol-Ho
Editing Advisor
Jun H. Goh
Managing Editor
Sojin Yoon
Editorial Board
Moon-Kee Kong Dong-Cheol SaJi-mi ChuChang-do Kim
Designed by
Soluwin CorporationEun-jung YoonGo-woon SeoEun-yang Jo
Printed by
Shinsago Hightech
Date of lssue
October 11, 2016
Copyright 2016POSCO Research InsitituteAll rights reserved.Production in whole or in part without writtenpermission is strictly prohibited.
Registration number
Gangnam, Ba00170
Registration date
September 7, 2015
How to contact
asiansteel.w@ posri.re.kr
O C T O B E R 2 0 1 6
ASIAN STEEL WATCH
02
C O N T E N T S
Bi-annual
98Market Trend and Analysis
100 Examining the Past 100 Years: Where is the Steel Super Cycle Headed?
110 Statistical Review of the Steel Trade in Northeast Asia
40Ask the Guru: Roads Ahead for the Steel Industry
Edwin Basson, Director General of worldsteel
Interview
64 Featured Articles
50Global Competitiveness Through Hybridization of FINEX and CEM Processes
Dong Joon MIN, Professor of Yonsei University
Special Report
66 The Demographic Cliff: How It Will Impact Asia’s Steel Demand
78 Restructuring of the Chinese Steel Industry: Retrospects and Prospects
88 Myanmar, the Last Frontier in the ASEAN, Will See High Growth of its Steel Industry
4 Asian Steel Watch
On the Cover
06
16
24
32
The Fourth Industrial Revolution: The Winds of Change Are Blowing in the Steel Industry Cheong, Je-Ho
Accelerating Digital Transformation with Smart Factory to Unlock New Value: Case of POSCO Jeong, Duk-Kyoon
China is Shifting to the “Smart Factory of the World” Dr. Kim Chang-do
The Rise, Prospects, and Impact of China’s Steel E-Commerce Dr. Kim Kyeongchan
The Fourth Wave of Manufacturing: What It Means to the Asian Steel Industry
The Fourth Industrial Revolution is bringing massive changes to mankind through accelerated integration
of traditional industries and ICT. The Internet of Things (IoT), Big Data, and Artificial Intelligence (AI)
are forcing traditional industrial structures to rapidly change. The scale, scope, and complexity of these
changes will be unprecedented. Steelmakers are also actively developing advanced technologies to
respond to the massive paradigm shift. The leading steel mills will customize technologies such as AI
and virtual factories and apply them to the production sites. They will strengthen integration along value
chains by connecting clients and suppliers through smart factories.
Vol.02 October 2016 5
The Fourth Industrial Revolution: The Winds of Change Are Blowing in the Steel Industry
Vol.02 October 2016 5
The Fourth Industrial Revolution: The Winds of Change Are Blowing in the Steel Industry
6 Asian Steel Watch
The Fourth Industrial Revolution: The Winds of Change Are Blowing in the Steel Industry
“Mastering the Fourth Industrial Revolution” was
the official theme of the World Economic Forum,
held in Davos, Switzerland early this year. The
news from this forum was that boundaries be-
tween the digital, physical, and biological spheres
will disappear, and the convergence of technol-
ogies will be expedited, ushering in a new era of
unprecedented experiences for humanity.
We are already experiencing enormous chang-
es. With accelerating technological innovation
across industries, the landscape of traditional
industries is changing, as are the value chains
and market players of traditional industries. The
steel industry is no exception. What fundamental
changes can we anticipate? How will they affect
manufacturing, and what must the steel industry
do to prepare?
Traditional industries on the brink of collapse
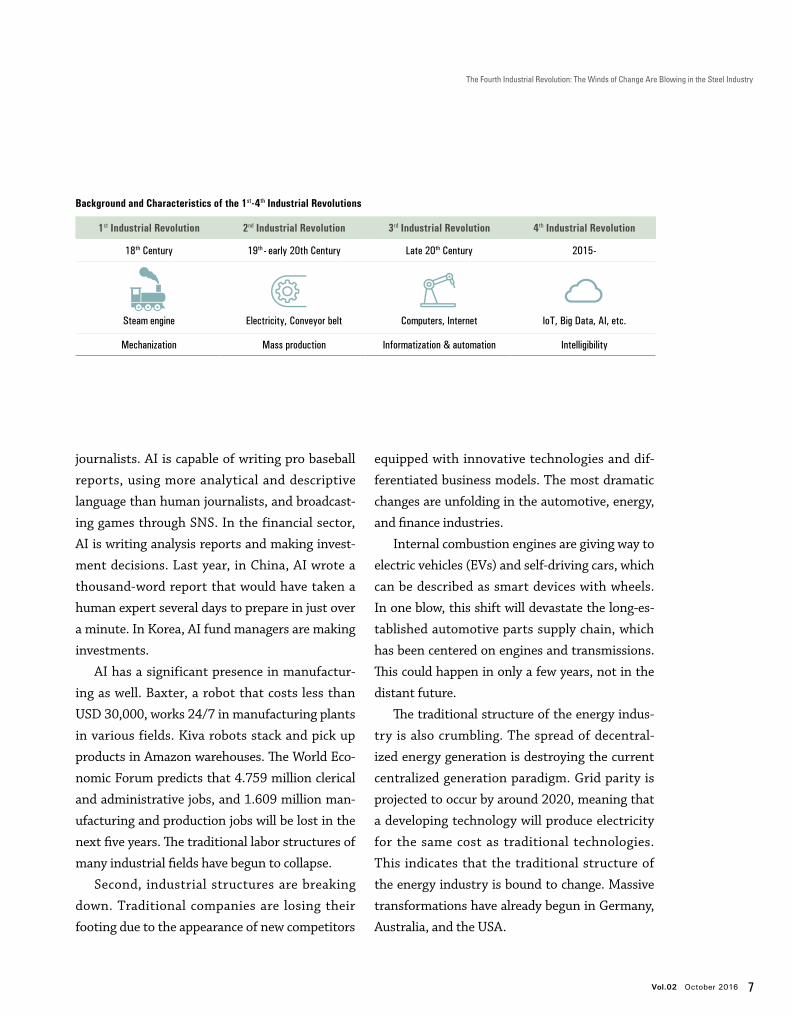
Over 100 years elapsed between the First In-
dustrial Revolution, which was triggered by the
advent of steam engines, and the Second Indus-
trial Revolution, which was characterized by the
use of electricity and conveyor belts. Another 60
years passed before the Third Industrial Revolu-
tion, which was brought on by the invention of
personal computers and the Internet. Now, after
only 20-30 years, the world is facing the Fourth
Industrial Revolution.
Change is ever-accelerating and its impact is
ever-stronger. In the midst of the Fourth Indus-
trial Revolution, which is characterized by big
data, the Internet of Things (IoT), artificial intelli-
gence (AI), virtual reality/augmented reality (VR/
AR), and 3D printing, competition in technolog-
ical innovation is breaking down every aspect of
traditional industries at an alarming speed.
First, conventional labor structures are col-
lapsing. About 3-4 years ago, AI-produced earth-
quake and weather news stories appeared in the
Los Angeles Times. Although this was much talk-
ed about, the news stories were comprised only
of simple facts. At that time, AI was a convenient
tool and a friend to human journalists pressured
by deadlines. But now, AI is replacing human
Cheong, Je-Ho Senior Principal Researcher, POSCO Research [email protected]
THE FOURTH WAVE OF MANUFACTURING:WHAT IT MEANS TO THE ASIAN STEEL INDUSTRY
Vol.02 October 2016 7
The Fourth Industrial Revolution: The Winds of Change Are Blowing in the Steel Industry
journalists. AI is capable of writing pro baseball
reports, using more analytical and descriptive
language than human journalists, and broadcast-
ing games through SNS. In the financial sector,
AI is writing analysis reports and making invest-
ment decisions. Last year, in China, AI wrote a
thousand-word report that would have taken a
human expert several days to prepare in just over
a minute. In Korea, AI fund managers are making
investments.
AI has a significant presence in manufactur-
ing as well. Baxter, a robot that costs less than
USD 30,000, works 24/7 in manufacturing plants
in various fields. Kiva robots stack and pick up
products in Amazon warehouses. The World Eco-
nomic Forum predicts that 4.759 million clerical
and administrative jobs, and 1.609 million man-
ufacturing and production jobs will be lost in the
next five years. The traditional labor structures of
many industrial fields have begun to collapse.
Second, industrial structures are breaking
down. Traditional companies are losing their
footing due to the appearance of new competitors
equipped with innovative technologies and dif-
ferentiated business models. The most dramatic
changes are unfolding in the automotive, energy,
and finance industries.
Internal combustion engines are giving way to
electric vehicles (EVs) and self-driving cars, which
can be described as smart devices with wheels.
In one blow, this shift will devastate the long-es-
tablished automotive parts supply chain, which
has been centered on engines and transmissions.
This could happen in only a few years, not in the
distant future.
The traditional structure of the energy indus-
try is also crumbling. The spread of decentral-
ized energy generation is destroying the current
centralized generation paradigm. Grid parity is
projected to occur by around 2020, meaning that
a developing technology will produce electricity
for the same cost as traditional technologies.
This indicates that the traditional structure of
the energy industry is bound to change. Massive
transformations have already begun in Germany,
Australia, and the USA.
1st Industrial Revolution 2nd Industrial Revolution 3rd Industrial Revolution 4th Industrial Revolution
18th Century 19th - early 20th Century Late 20th Century 2015-
Steam engine Electricity, Conveyor belt Computers, Internet IoT, Big Data, AI, etc.
Mechanization Mass production Informatization & automation Intelligibility
Background and Characteristics of the 1st-4th Industrial Revolutions
8 Asian Steel Watch
The current finance industry is also faltering.
The emergence of mobile payment providers,
such as Samsung Pay and Apple Pay, is upsetting
the traditional payment market structure. Inter-
net-only banks and cloud funding are shifting the
financial paradigm. In China’s payment and lend-
ing markets, the share of mobile and Internet
firms exceeds that of traditional financial institu-
tions.
Destruction of industrial structures will
spread to all industries. The established rules are
already changing, and the hegemonies that have
led industries are losing ground. Companies from
different fields are making inroads and challeng-
ing traditional industries.
Third, traditional methods of creating
value are also being destroyed. The common
expectation of what costs money is being over-
turned. Energy, often regarded as paid goods,
can become free. In the USA, Tesla provides its
customers with free charging through its vast
network of “supercharger” stations. In Japan, a
telecommunication company branched into the
electricity business, and bundled telecommuni-
cation and broadcast services with electricity.
This means that energy will potentially become
free of charge, just like e-mail and video stream-
ing.
The price of an item with zero marginal cost
moves toward zero. With the rise of the shared
economy, which links the information of suppli-
ers and customers on one platform, the concept
of ownership is changing. This changes the under-
standing of value and upends traditional business
models. Airbnb and Uber show how it is possible
to enter the accommodation and transportation
businesses without investment in fixed assets
such as hotels and cars, disrupting the traditional
way of creating value.
In the era of the Fourth Industrial Revolu-
tion, intangible value exceeds tangible value. In
the automotive industry, for instance, the value
of data such as driving patterns and locations,
may exceed the value of cars, and provide much
greater opportunities to car makers because a
car becomes a source of various customer data
THE FOURTH WAVE OF MANUFACTURING:WHAT IT MEANS TO THE ASIAN STEEL INDUSTRY
In the automotive industry, for instance, the value of data such as driving patterns and
locations, may exceed the value of cars, and provide much greater opportunities to
car makers because a car becomes a source of various customer data and a channel
for delivering new services to customers.
Vol.02 October 2016 9
The Fourth Industrial Revolution: The Winds of Change Are Blowing in the Steel Industry
and a channel for delivering new services to cus-
tomers. This explains why Google has paid USD
3.2 billion for a household device maker, Nest.
Its true value lies not in its hardware, but in the
data that the hardware collects from each house-
hold.
Companies like Tesla, Google, and Amazon,
are branching into traditional industries. But, in-
stead of following the conventional way of doing
business, they introduce a new business model
weaponizing data and software. Who will win this
competition?
How do countries prepare for the future of manufacturing?
The rapid change of the traditional industry and
disruptive advances in technology is threatening
the very survival of countries and companies
built on manufacturing.
For industrialized countries, which have long
been suffered from high labor costs, stagnant
production, and decline in the labor force, the
Fourth Industrial Revolution is a breakthrough,
and an opportunity to take the leadership in the
future.
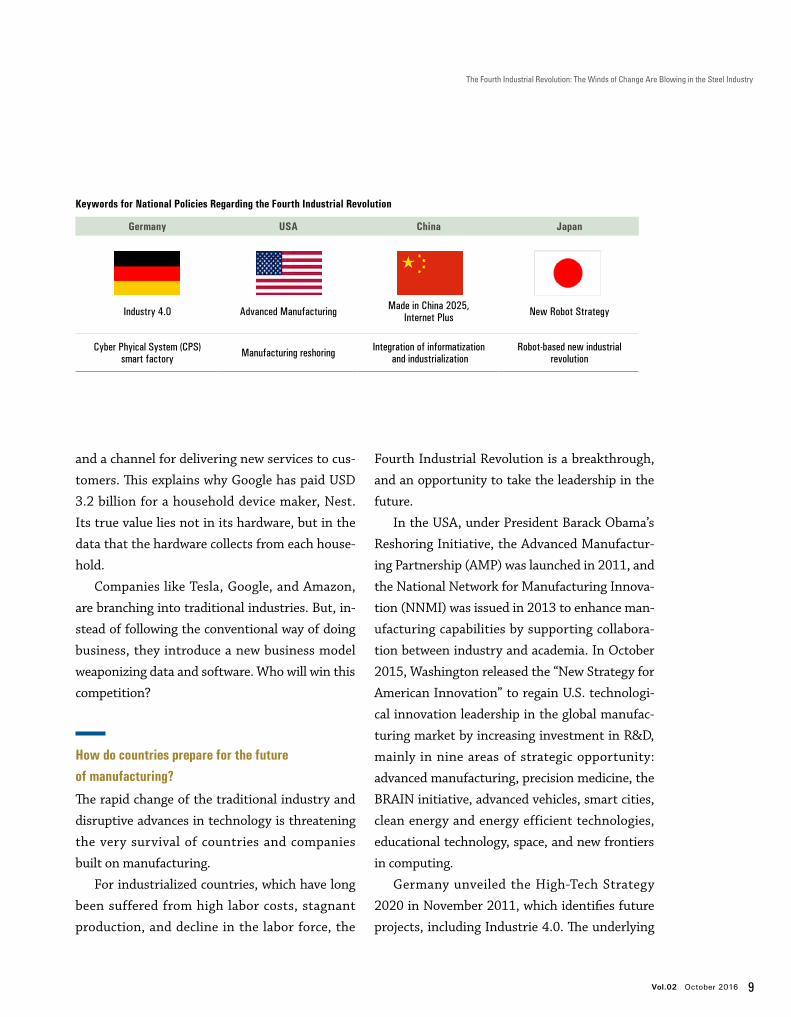
In the USA, under President Barack Obama’s
Reshoring Initiative, the Advanced Manufactur-
ing Partnership (AMP) was launched in 2011, and
the National Network for Manufacturing Innova-
tion (NNMI) was issued in 2013 to enhance man-
ufacturing capabilities by supporting collabora-
tion between industry and academia. In October
2015, Washington released the “New Strategy for
American Innovation” to regain U.S. technologi-
cal innovation leadership in the global manufac-
turing market by increasing investment in R&D,
mainly in nine areas of strategic opportunity:
advanced manufacturing, precision medicine, the
BRAIN initiative, advanced vehicles, smart cities,
clean energy and energy efficient technologies,
educational technology, space, and new frontiers
in computing.
Germany unveiled the High-Tech Strategy
2020 in November 2011, which identifies future
projects, including Industrie 4.0. The underlying
Keywords for National Policies Regarding the Fourth Industrial Revolution
Germany USA China Japan
Industry 4.0 Advanced Manufacturing Made in China 2025,Internet Plus New Robot Strategy
Cyber Phyical System (CPS) smart factory Manufacturing reshoring Integration of informatization
and industrializationRobot-based new industrial
revolution
10 Asian Steel Watch
concept of Industrie 4.0 is to integrate manufac-
turing and ICT via IoT, 3D printing, and cyber
physical system (CPS) for networked and intelli-
gent production facilities. All processes concern-
ing raw materials, production, logistics, service,
and products are connected to networks through
embedded systems and controlled through CPS.
By setting these technologies as national stan-
dards, Germany is showing its determination to
assume technology leadership in the Fourth In-
dustrial Revolution.
In response to the U.S. Advanced Manufac-
turing Partnership and Germany’s Industrie 4.0,
Japan’s strategy is to improve manufacturing
competitiveness centering on its relatively com-
petitive robotics field. To this end, Japan an-
nounced the New Robot Strategy in 2015, which
aims to robotize objects so as to greatly increase
the utilization of robotics, and to utilize the data
produced to create new wealth, ultimately con-
tributing to solving social problems and increas-
ing competitiveness in the manufacturing and
service sectors.
China is preparing for the Fourth Industrial
Revolution by two separate initiatives: “Made in
China 2025” and “Internet Plus.” The “Made in
China 2025” plan is a strategy to comprehensive-
ly upgrade Chinese industry to achieve qualitative
growth, with a view to transforming China from
a manufacturing giant based on cheap labor costs
and cost competitiveness into a global manufac-
turing power backed by technological innovation.
Recognizing the integration of the Internet and
traditional industries as a new engine for indus-
trial development, China announced the “Internet
Plus” action plan, which aims to build the world’s
largest Internet platform, and carries out smart
manufacturing development strategy through
the integration of manufacturing and Internet
technologies.
The intensifying competition in technological
innovation among companies and countries is
rapidly reshaping the landscape of manufactur-
ing. The concepts of customers and their demand
are being redefined. Production methods, compa-
ny structures, and value chains are all changing.
In the future, products and services must move beyond ready-made customization.
Extreme flexibility is required in the production process in order to satisfy individual
needs without compromising cost. Mass Personalization is the future of manufacturing
in the Fourth Industrial Revolution.
THE FOURTH WAVE OF MANUFACTURING:WHAT IT MEANS TO THE ASIAN STEEL INDUSTRY
Vol.02 October 2016 11
The Fourth Industrial Revolution: The Winds of Change Are Blowing in the Steel Industry
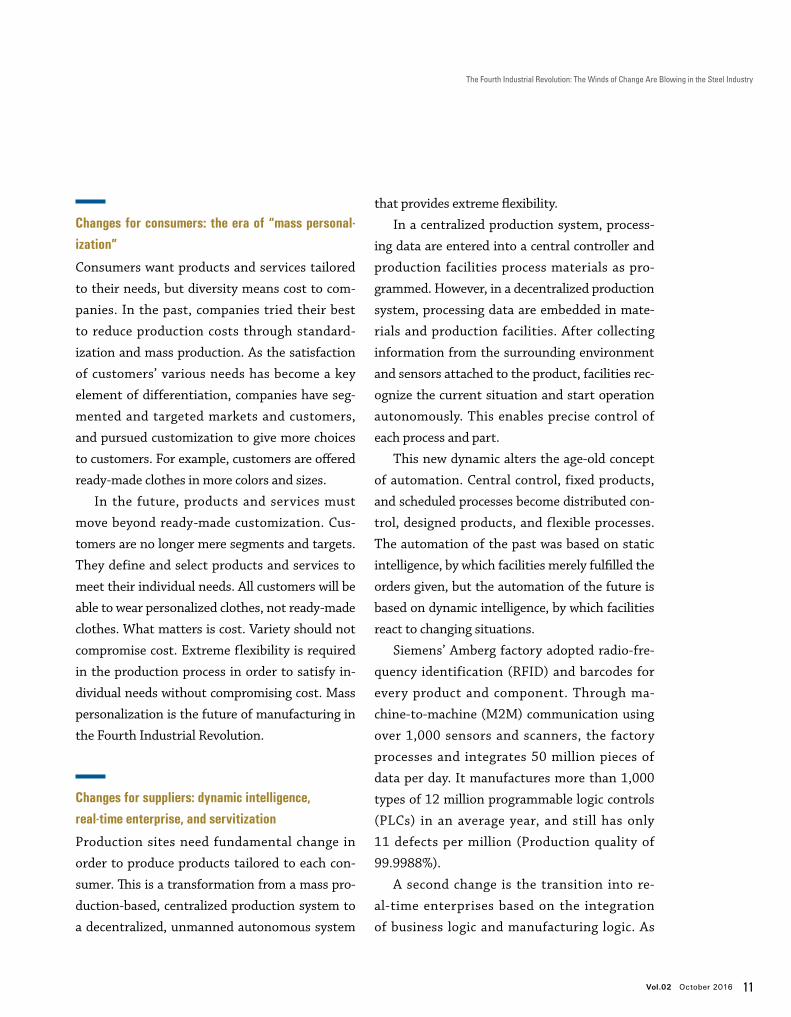
Changes for consumers: the era of “mass personal-ization”
Consumers want products and services tailored
to their needs, but diversity means cost to com-
panies. In the past, companies tried their best
to reduce production costs through standard-
ization and mass production. As the satisfaction
of customers’ various needs has become a key
element of differentiation, companies have seg-
mented and targeted markets and customers,
and pursued customization to give more choices
to customers. For example, customers are offered
ready-made clothes in more colors and sizes.
In the future, products and services must
move beyond ready-made customization. Cus-
tomers are no longer mere segments and targets.
They define and select products and services to
meet their individual needs. All customers will be
able to wear personalized clothes, not ready-made
clothes. What matters is cost. Variety should not
compromise cost. Extreme flexibility is required
in the production process in order to satisfy in-
dividual needs without compromising cost. Mass
personalization is the future of manufacturing in
the Fourth Industrial Revolution.
Changes for suppliers: dynamic intelligence, real-time enterprise, and servitization
Production sites need fundamental change in
order to produce products tailored to each con-
sumer. This is a transformation from a mass pro-
duction-based, centralized production system to
a decentralized, unmanned autonomous system
that provides extreme flexibility.
In a centralized production system, process-
ing data are entered into a central controller and
production facilities process materials as pro-
grammed. However, in a decentralized production
system, processing data are embedded in mate-
rials and production facilities. After collecting
information from the surrounding environment
and sensors attached to the product, facilities rec-
ognize the current situation and start operation
autonomously. This enables precise control of
each process and part.
This new dynamic alters the age-old concept
of automation. Central control, fixed products,
and scheduled processes become distributed con-
trol, designed products, and flexible processes.
The automation of the past was based on static
intelligence, by which facilities merely fulfilled the
orders given, but the automation of the future is
based on dynamic intelligence, by which facilities
react to changing situations.
Siemens’ Amberg factory adopted radio-fre-
quency identification (RFID) and barcodes for
every product and component. Through ma-
chine-to-machine (M2M) communication using
over 1,000 sensors and scanners, the factory
processes and integrates 50 million pieces of
data per day. It manufactures more than 1,000
types of 12 million programmable logic controls
(PLCs) in an average year, and still has only
11 defects per million (Production quality of
99.9988%).
A second change is the transition into re-
al-time enterprises based on the integration
of business logic and manufacturing logic. As
12 Asian Steel Watch
markets become more volatile and product life
cycles become shorter to meet rapidly changing
customer needs, it is important how fast and
accurately corporate can meet time-to-market
goals. In addition to being flexible, a production
system needs to ensure the visibility of real-time
operational data and provide insight for better
and faster decision-making along the value chain,
from product design, sourcing, and supply to lo-
gistics, distribution, and sales.
To this end, companies are integrating
business logic and manufacturing logic. By in-
tegrating manufacturing logic, which controls
production processes, and business logic, which
manages production schedules, material/invento-
ry management, and logistics, companies strive
to minimize time-to-market. By ensuring inte-
grated data visibility in all product life cycles, Sie-
mens oversees all processes of product planning,
design, production, and facility management at a
glance, ultimately halving time-to-market.
A third change is the expansion of value chains
beyond manufacturing to remote-control-based
servitization. In general, value creation in manu-
facturing is completed upon release of a product.
Customer service used to be considered a cost by
corporations. Now the release of a product is the
start of the sale of new services. Corporations can
collect customer information and usage patterns
from sensors attached to products.
GE has launched Predix, a cloud-based plat-
form for industrial internet applications, that
combines people, machines, big data and ana-
lytics. Predix analyzes and manages data being
generated from purchase to customer service as
sensors are attached to everything from aircraft
engines to medical equipment. For example, the
platform as a service (PaaS) helps jet engines fix
themselves and supports the operation of power
plants in remote places. It also helps distribute
and process data flowing out of medical imaging
systems.
The steel industry in the fourth industrial revolution
The Fourth Industrial Revolution is also gaining
In addition to being flexible, a production system needs to ensure the visibility
of real-time operational data and provide insight for better and faster decision-making
along the value chain.
THE FOURTH WAVE OF MANUFACTURING:WHAT IT MEANS TO THE ASIAN STEEL INDUSTRY
Vol.02 October 2016 13
The Fourth Industrial Revolution: The Winds of Change Are Blowing in the Steel Industry
ground in the steel industry, and new changes are
becoming apparent. One change is the integra-
tion of digital networks in value chains. Plants,
companies, and even the entire steel industry can
be integrated into a single digital ecosystem.
Germany’s ThyssenKrupp is building an in-
tegrated digital system to allow real-time infor-
mation on orders and production to be shared
among the company, suppliers, and client com-
panies. For example, Huttenwerke Krupp Man-
nesmann (HKM), a supplier of hot-rolled strip
steel to ThyssenKrupp Hoesch Hohenlimburg,
shares order and production information in real
-time with ThyssenKrupp. The two companies
coordinate in advance the order of production
processes and timing of deliveries, minimizing
waste in production and swiftly responding to
customer needs. By expanding the scope and
depth of digital integration, ThyssenKrupp plans
to reduce time-to-market to 24-28 hours for all of
its plants.
Tata Steel Europe is also seeking digital inte-
gration of logistics processes to allow clients to
monitor scheduling of shipments in real time.
For example, a client at a steel plant in the Neth-
erlands is provided with information on the loca-
tion and arrival time of a vessel loaded with HR
steel products, allowing the company to achieve
optimal inventory management.
The Fourth Industrial Revolution is spread-
ing throughout the stel industry. Tata Steel is
planning to digitalize all transactions between its
steel plants and customers within two years. It
also plans to combine information networks with
Klockner, the largest steel trader in Europe. The
two companies already share order and purchase
data for the UK market, and they plan to expand
the scope of integration to other European coun-
tries and the USA.
Another change is the trend toward Ama-
zon-like, online-based steel trading platforms.
Klockner will build an online transaction plat-
form by 2017. If the platform is successful, the
traditional steel trading structure will face a revo-
lutionary transformation.
In a traditional steel market, steelmakers
stock inventory and await orders without know-
ing exact demand. Inventory is a burden on
traders. If a mechanism that drastically reduces
inventory burden and strikes a balance between
demand and supply, an Amazon of the steel in-
dustry is foreseeable.
Through its Internet transaction platform,
Klockner shares not only its own product infor-
mation, but competitors’ product information,
with a view to increasing transaction efficiency
and cost transparency, and eliminating inefficien-
cy in the steel trading structure. The company
anticipates a reduction in net working capital of
10%, and savings of EUR 100 million. It hopes to
handle more than half of sales through the trans-
action platform by 2019.
China is also building online steel transaction
platforms. Baosteel Group established the Shang-
hai Steel Trade Center in 2013, and developed
it into steel e-commerce platform, called “Ouy-
eel” in 2015. Shagang Group built its own steel
e-commerce platforms, Jiulong Online, in 2014.
This trend shows that information in the
value chain of production, distribution, and con-
14 Asian Steel Watch
sumption is gradually being integrated. In the
near future, it is possible that all information on
supply and demand of steel will be open to every
producer and customer.
Still another change is the advent of “digital
genome map” of steelworks. Herein lies the key to
the steel-making process in the Fourth Industrial
Revolution. This is the heart of POSCO’s vision of
the future of steel plants.
There is a big difference between the assem-
bly process for producing automobiles and the
continuous process for making steel. It is very
difficult and expensive to apply a decentralized,
unmanned autonomous system, which is useful
in assembling components, to the continuous
process of steel, which involves liquid steel at
high temperatures moving at high speeds. As
the share of labor cost is relatively low in the
steel-making process, automation will not bring
tremendous benefits in the short term. Further-
more, the steel-making process is mostly auto-
mated because it handles heavy raw materials and
equipment. What then is the vision of a future
steel plant set by POSCO, the largest steelmaker
in Korea?
The answer is the development of the “data
genome map” based on data and software. The
Human Genome Project aims to determine the
sequence of the three billion chemical base pairs
that make up human DNA, eventually allowing
personalized diagnosis and disease prevention.
This work seeks to understand the substance of
life and unlock hidden potential. A smart steel
factory mimics this idea, aiming to collect and
THE FOURTH WAVE OF MANUFACTURING:WHAT IT MEANS TO THE ASIAN STEEL INDUSTRY
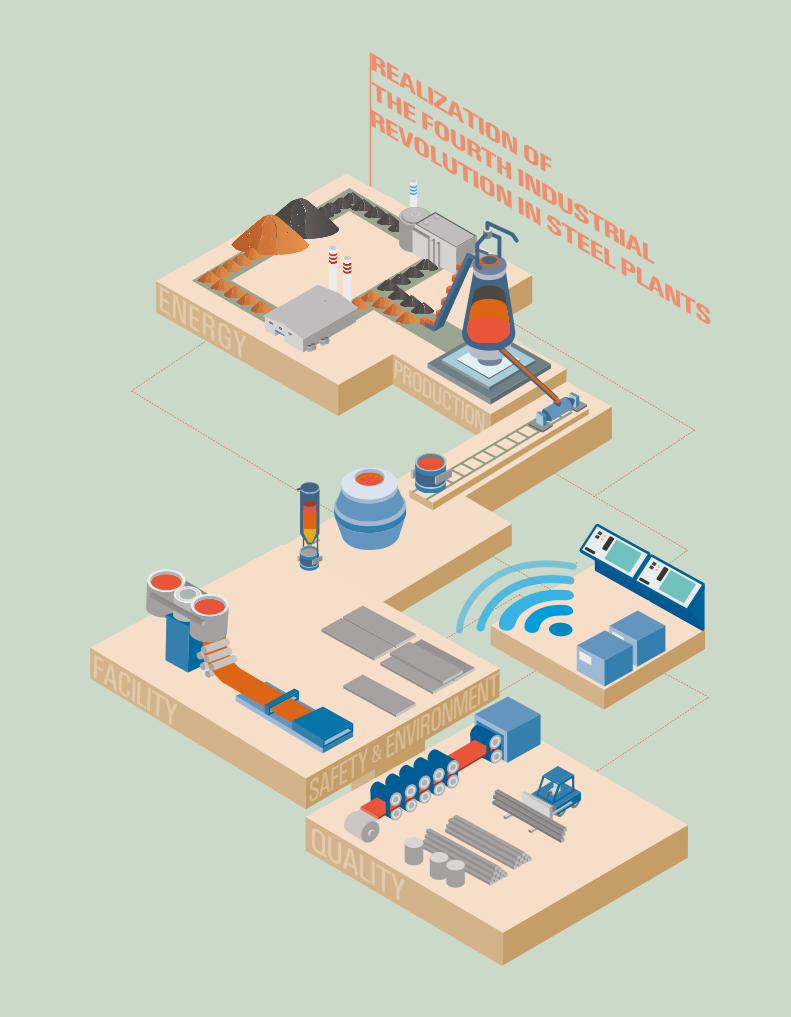
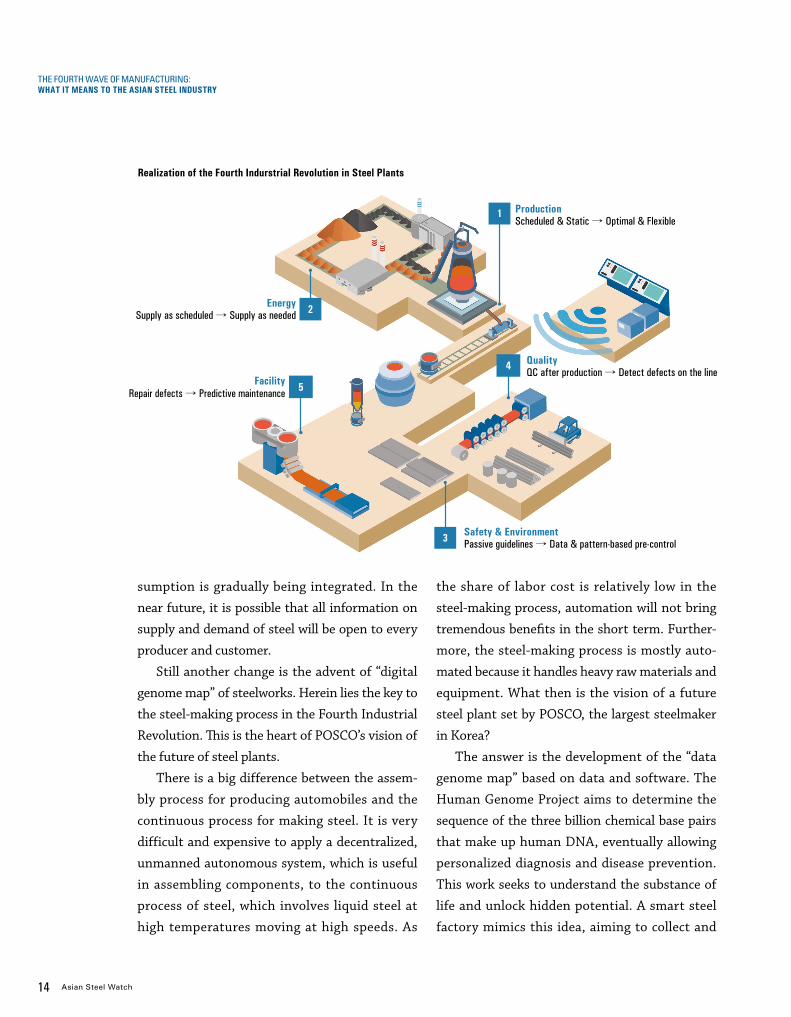
Realization of the Fourth Indurstrial Revolution in Steel Plants
3 Safety & EnvironmentPassive guidelines → Data & pattern-based pre-control
FacilityRepair defects → Predictive maintenance 5
EnergySupply as scheduled → Supply as needed 2
Production Scheduled & Static → Optimal & Flexible
1
QualityQC after production → Detect defects on the line
Vol.02 October 2016 15
The Fourth Industrial Revolution: The Winds of Change Are Blowing in the Steel Industry
analyze all microdata generated in the production
process, and determine the cause of every event.
By identifying the exact cause of quality and
production issues, and reviewing the status of
facilities, steelmakers will be able to solve chronic
problems and create new value.
Every aspect of a steel plant, including pro-
duction, facilities, energy, environment, safety,
and quality, is subject to a smart factory. POSCO
envisions a steel plant that can sense, analyze,
and control its conditions, just as a human can
feel, think, and respond. POSCO’s smart factory
project, currently taking place at Gwangyang
plate plant, will gradually be extended to all pro-
duction areas.
What must the steel industry consider for the future?
The Fourth Industrial Revolution seems to be just
around the corner. The steel industry is not ex-
empt from its effects. It is unknown what calam-
ities might befall the industrial structure and val-
ue chain of the steel industry. Are there defense
mechanisms for survival?
As stated earlier, the core of the Fourth Indus-
trial Revolution is data and software. GE has a
long history and tradition as an automation com-
pany in power generation and energy, but it has
declared itself to be a software company. Siemens
invests in solutions that integrate data and soft-
ware for all of a company’s product lines. In the
automotive industry, more than half of BMW’s
R&D staff are software engineers.
Likewise, a steel company in the Fourth Indus-
trial Revolution might need to become a “software
engineering company that produces steel,” not
a “company that buys and uses software well.” It
may sound odd that a steel company needs to be-
come a software engineering company. However,
what actually increases productivity, determines
the quality of products, and ensures that facilities
work properly is not visible hardware, but the
engineering and processing knowledge behind it.
Software is not merely algorithms and code, but
the embodiment of this knowledge.
The steel industry creates profits by selling
steel products. However, the real value is in data
and software. In order to properly respond to the
Fourth Industrial Revolution, steel companies
must first understand the value of these intangi-
bles and make the necessary investments. Dieter
Zetsche, Chairman of Daimler, gave the steel
industry something to think about when he said
that mobility will be fueled by software, not by
gasoline.
16 Asian Steel Watch
Accelerating Digital Transformation with Smart Factory to Unlock New Value: Case of POSCO
The Fourth Industrial Revolution is bringing
massive changes to mankind through accelerated
integration of traditional industries and ICT. The
Internet of Things (IoT), Big Data, and Artificial
Intelligence (AI) are forcing traditional industrial
structures to rapidly change. The scale, scope, and
complexity of these changes will be unlike any-
thing mankind has experienced. It is no coinci-
dence that new startups such as Google and Tesla
have outpaced traditional market leaders such
as IBM and GM. This is a sign that the time has
come for companies to move beyond the limita-
tions of traditional practices and seek innovative
transformation.
Manufacturing plays a fundamental role in
the economy, accounting for 16% of the world’s
GDP and 62 million diverse jobs. Since the start
of the Industrial Revolution 200 years ago, man-
ufacturing has changed the world through relent-
less advancement in the automotive, chemical,
machinery, electronics, and materials industries.
There is no doubt that manufacturing will con-
tinue to lead technological innovation in the
future. Products that will totally change our way
of life are continuing to emerge: electric vehicles,
self-driving cars, drones, and humanoid robots.
At the heart of the Fourth Industrial Revolu-
tion, manufacturing is poised to shift from “tra-
ditional” to “smart” through integration with ICT.
Leading global companies are already seeing new
growth opportunities through breakthrough in-
novations. General Electric is moving away from
its core financial business towards smart manu-
facturing under the name “Industrial Internet.”
Siemens’s Amberg factory has significantly re-
duced defect rates through IoT technologies, and
boasts the world’s best production quality rate at
99.9988%.
POSCO, one step closer to smart factory
In the face of the great paradigm shift brought on
by the Fourth Industrial Revolution, many Asian
steelmakers are taking preemptive measures to
maintain competitiveness and contribute to the
advancement of manufacturing. POSCO is also
Jeong, Duk-Kyoon Senior Vice President, POSCO ICT
THE FOURTH WAVE OF MANUFACTURING:WHAT IT MEANS TO THE ASIAN STEEL INDUSTRY
Accelerating Digital Transformation with Smart Factory to Unlock New Value: Case of POSCO
Vol.02 October 2016 17
one of the leading global steelmakers in this are-
na.
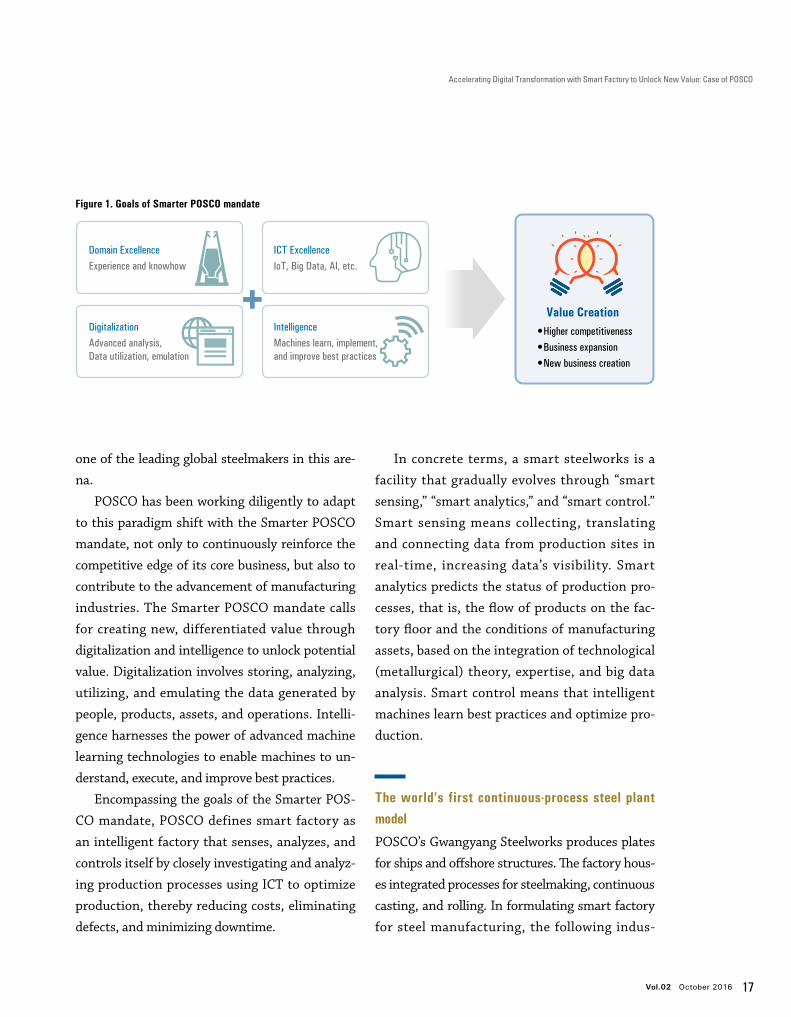
POSCO has been working diligently to adapt
to this paradigm shift with the Smarter POSCO
mandate, not only to continuously reinforce the
competitive edge of its core business, but also to
contribute to the advancement of manufacturing
industries. The Smarter POSCO mandate calls
for creating new, differentiated value through
digitalization and intelligence to unlock potential
value. Digitalization involves storing, analyzing,
utilizing, and emulating the data generated by
people, products, assets, and operations. Intelli-
gence harnesses the power of advanced machine
learning technologies to enable machines to un-
derstand, execute, and improve best practices.
Encompassing the goals of the Smarter POS-
CO mandate, POSCO defines smart factory as
an intelligent factory that senses, analyzes, and
controls itself by closely investigating and analyz-
ing production processes using ICT to optimize
production, thereby reducing costs, eliminating
defects, and minimizing downtime.
In concrete terms, a smart steelworks is a
facility that gradually evolves through “smart
sensing,” “smart analytics,” and “smart control.”
Smart sensing means collecting, translating
and connecting data from production sites in
real-time, increasing data’s visibility. Smart
analytics predicts the status of production pro-
cesses, that is, the flow of products on the fac-
tory floor and the conditions of manufacturing
assets, based on the integration of technological
(metallurgical) theory, expertise, and big data
analysis. Smart control means that intelligent
machines learn best practices and optimize pro-
duction.
The world’s first continuous-process steel plant model
POSCO’s Gwangyang Steelworks produces plates
for ships and offshore structures. The factory hous-
es integrated processes for steelmaking, continuous
casting, and rolling. In formulating smart factory
for steel manufacturing, the following indus-
Domain ExcellenceExperience and knowhow
DigitalizationAdvanced analysis, Data utilization, emulation
ICT ExcellenceIoT, Big Data, AI, etc.
Figure 1. Goals of Smarter POSCO mandate
IntelligenceMachines learn, implement, and improve best practices
Value Creation•Higher competitiveness•Business expansion •New business creation

18 Asian Steel Watch
try-specific requirements have to be factored in.
First, it is difficult to determine the root cause
of defects in plates by tracing processes because
the physical properties of steel change when mol-
ten steel solidifies into plates during the continu-
ous casting process, and plates are frequently cut,
flipped, and rotated. Second, adjusting or chang-
ing upstream and downstream production pro-
cesses that are online is costly and difficult. For
example, all materials are scheduled to go through
production routings and steps in a predetermined
order. If trouble occurs in the middle of a process,
former processes might be suspended until the
problem is solved. Third, various materials are
processed in the same facility, and a number of
facilities and production methods are involved in
making one kind of product, making it difficult to
find the exact cause of a problem.
Recognizing these complexities in producing
“World Premium (WP)” products, the Gwangyang
plate factory is building a model for the smart
factory by applying IoT, big data, and AI to pro-
duction, worker safety, and cost management.
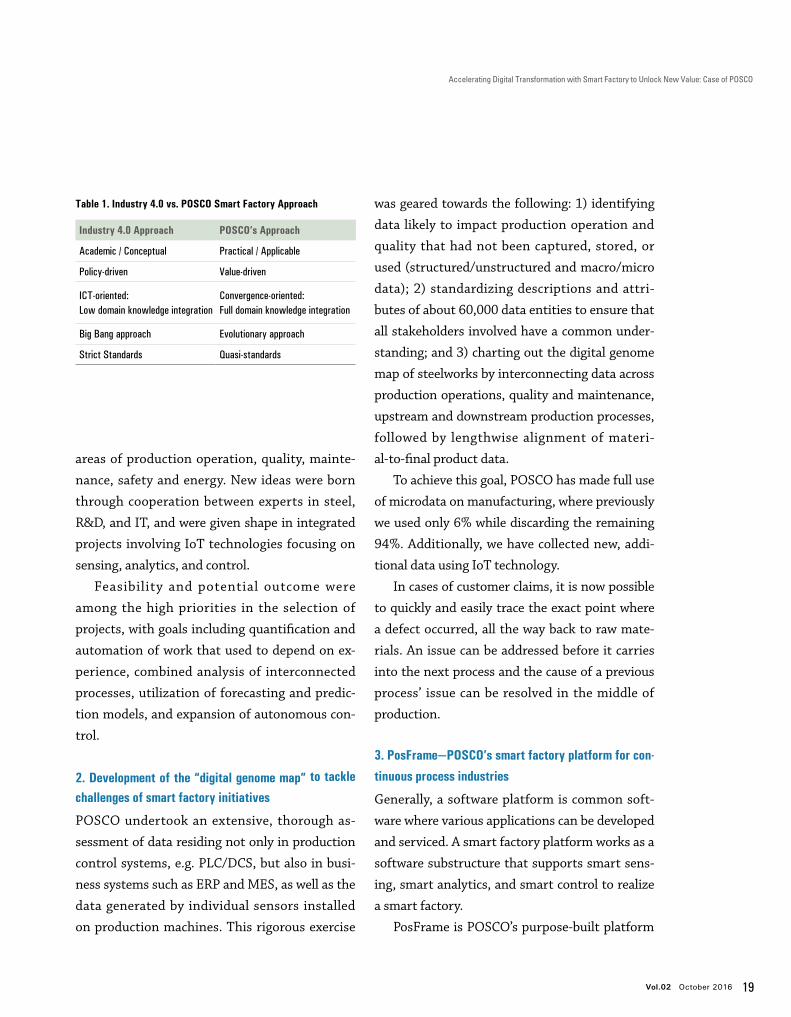
POSCO tailored Germany’s Industry 4.0 ap-
proach to meet industry-specific requirements
with the following refinements: 1) Converted
academic and conceptual theories into practi-
cal, applicable actions at the shop floor level;
2) adopted a value-centered, outcome-driven
approach aligned with relevant policies; 3) inte-
grated domain knowledge with information and
communications technology, rather than simple
information technology-driven implementation;
4) employed an evolutionary approach rather
than a big-bang approach, and 5) flexibly adapted
strict Industry 4.0 standards that made sense for
deployment at the shop floor.
Here are the details and major outcomes by
phase of the smart factory at Gwangyang Steel-
works.
1. Selection of smart factory projects
In order to increase global competitiveness and
maximize customer value, POSCO developed a
mid- to long-term vision for the Smarter POSCO
mandate. Initiatives were then derived in the
The Fourth Industrial Revolution has already started and is expected to have a great
impact on the survival and development of companies. Steelmakers will strive for long-
term innovation to realize smart factories by interconnecting data across production
operations, quality and maintenance, upstream and downstream production processes,
followed by lengthwise alignment of material-to-final product data.
THE FOURTH WAVE OF MANUFACTURING:WHAT IT MEANS TO THE ASIAN STEEL INDUSTRY
Accelerating Digital Transformation with Smart Factory to Unlock New Value: Case of POSCO
Vol.02 October 2016 19
areas of production operation, quality, mainte-
nance, safety and energy. New ideas were born
through cooperation between experts in steel,
R&D, and IT, and were given shape in integrated
projects involving IoT technologies focusing on
sensing, analytics, and control.
Feasibility and potential outcome were
among the high priorities in the selection of
projects, with goals including quantification and
automation of work that used to depend on ex-
perience, combined analysis of interconnected
processes, utilization of forecasting and predic-
tion models, and expansion of autonomous con-
trol.
2. Development of the “digital genome map” to tackle
challenges of smart factory initiatives
POSCO undertook an extensive, thorough as-
sessment of data residing not only in production
control systems, e.g. PLC/DCS, but also in busi-
ness systems such as ERP and MES, as well as the
data generated by individual sensors installed
on production machines. This rigorous exercise
was geared towards the following: 1) identifying
data likely to impact production operation and
quality that had not been captured, stored, or
used (structured/unstructured and macro/micro
data); 2) standardizing descriptions and attri-
butes of about 60,000 data entities to ensure that
all stakeholders involved have a common under-
standing; and 3) charting out the digital genome
map of steelworks by interconnecting data across
production operations, quality and maintenance,
upstream and downstream production processes,
followed by lengthwise alignment of materi-
al-to-final product data.
To achieve this goal, POSCO has made full use
of microdata on manufacturing, where previously
we used only 6% while discarding the remaining
94%. Additionally, we have collected new, addi-
tional data using IoT technology.
In cases of customer claims, it is now possible
to quickly and easily trace the exact point where
a defect occurred, all the way back to raw mate-
rials. An issue can be addressed before it carries
into the next process and the cause of a previous
process’ issue can be resolved in the middle of
production.
3. PosFrame—POSCO’s smart factory platform for con-
tinuous process industries
Generally, a software platform is common soft-
ware where various applications can be developed
and serviced. A smart factory platform works as a
software substructure that supports smart sens-
ing, smart analytics, and smart control to realize
a smart factory.
PosFrame is POSCO’s purpose-built platform
Industry 4.0 Approach POSCO’s Approach
Academic / Conceptual Practical / Applicable
Policy-driven Value-driven
ICT-oriented:Low domain knowledge integration
Convergence-oriented:Full domain knowledge integration
Big Bang approach Evolutionary approach
Strict Standards Quasi-standards
Table 1. Industry 4.0 vs. POSCO Smart Factory Approach
20 Asian Steel Watch
for process industry applications. It empowers
POSCO to: 1) apply the digital genome map
to production operations through high-speed
collection and inter-connection of structured/
unstructured and macro/micro data; 2) rapidly
convert smart factory initiatives in domains such
as production operation, quality, maintenance,
safety and energy into applications with the same
ease and speed as building and deploying apps for
smart phones; 3) leverage a common platform to
adopt emerging technologies, including IoT, big
data, and deep learning, which are required for
smart factory implementations at the enterprise
level; and 4) cost-effectively roll out the smart
factory model to other similar factories with
standardized, re-usable software components.
In the future, POSCO will continue to adopt new
ICT for this platform and blend it with global best
practices.
4. Smart factory project execution and results sharing
POSCO ran pilot projects to validate business cas-
es and to secure success stories before initiating
full-blown smart factory projects. The experience
of each preliminary project was applied to the
next project, leading to a continuous evolution
and development of technologies and experienc-
es. Success cases were replicated at similar plants
in order to reproduce outcomes.
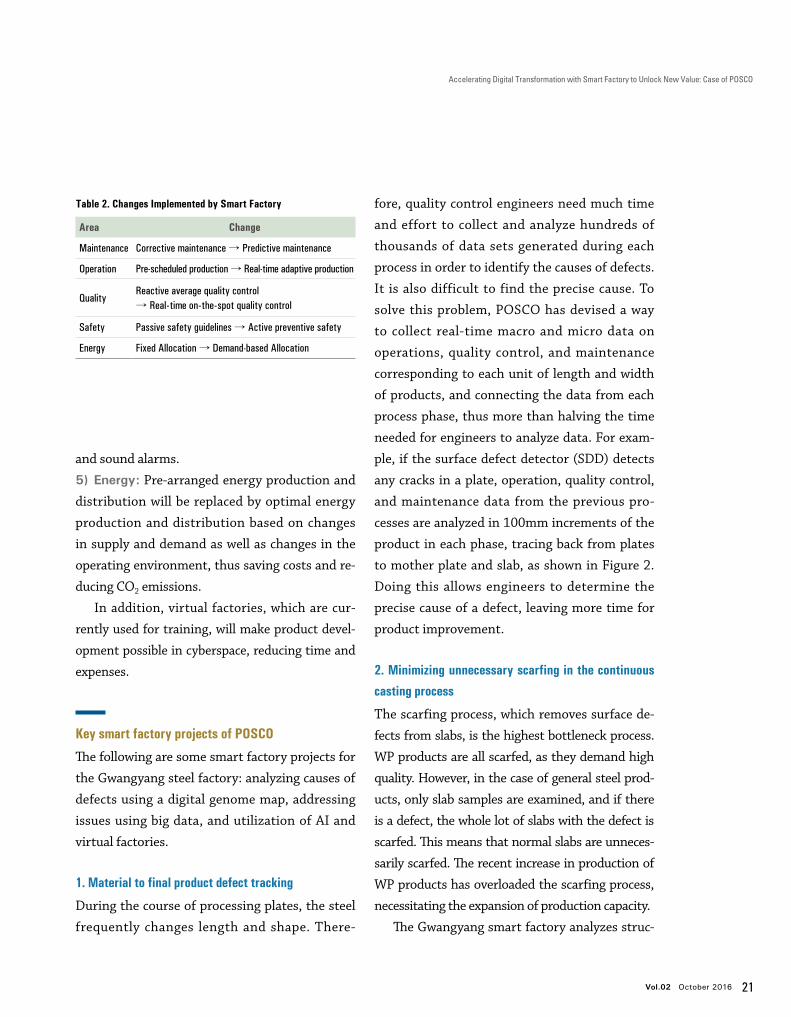
The smart factory plant, scheduled to be com-
pleted in 2017, seeks to change maintenance,
operations, quality, safety and energy as follows:
1) Maintenance: Pre-scheduled and regular
maintenance and repairs of defects will be re-
placed by predictive maintenance that finds de-
fects in advance.
2) Operation: Pre-scheduled production will be
replaced by real-time, adaptive production, resil-
ient to changes in demand, quality, and mainte-
nance status.
3) Quality: Reactive quality control will be re-
placed by real-time, on-the-spot quality control.
4) Safety: Worker safety has historically depend-
ed on physical barriers and safety training, but
IoT technology will automatically identify danger
Generally, a software platform is common software where various applications
can be developed and serviced. A smart factory platform works as a software
substructure that supports smart sensing, smart analytics, and smart control to
realize a smart factory.
THE FOURTH WAVE OF MANUFACTURING:WHAT IT MEANS TO THE ASIAN STEEL INDUSTRY
Accelerating Digital Transformation with Smart Factory to Unlock New Value: Case of POSCO
Vol.02 October 2016 21
and sound alarms.
5) Energy: Pre-arranged energy production and
distribution will be replaced by optimal energy
production and distribution based on changes
in supply and demand as well as changes in the
operating environment, thus saving costs and re-
ducing CO2 emissions.
In addition, virtual factories, which are cur-
rently used for training, will make product devel-
opment possible in cyberspace, reducing time and
expenses.
Key smart factory projects of POSCO
The following are some smart factory projects for
the Gwangyang steel factory: analyzing causes of
defects using a digital genome map, addressing
issues using big data, and utilization of AI and
virtual factories.
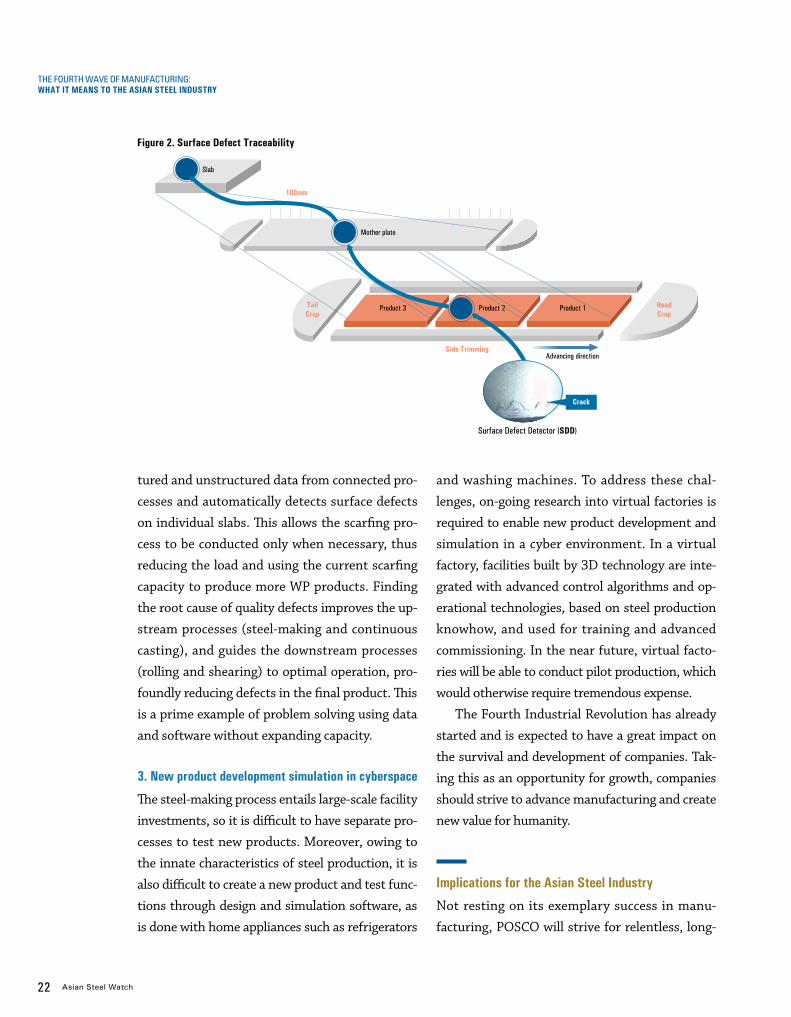
1. Material to final product defect tracking
During the course of processing plates, the steel
frequently changes length and shape. There-
fore, quality control engineers need much time
and effort to collect and analyze hundreds of
thousands of data sets generated during each
process in order to identify the causes of defects.
It is also difficult to find the precise cause. To
solve this problem, POSCO has devised a way
to collect real-time macro and micro data on
operations, quality control, and maintenance
corresponding to each unit of length and width
of products, and connecting the data from each
process phase, thus more than halving the time
needed for engineers to analyze data. For exam-
ple, if the surface defect detector (SDD) detects
any cracks in a plate, operation, quality control,
and maintenance data from the previous pro-
cesses are analyzed in 100mm increments of the
product in each phase, tracing back from plates
to mother plate and slab, as shown in Figure 2.
Doing this allows engineers to determine the
precise cause of a defect, leaving more time for
product improvement.
2. Minimizing unnecessary scarfing in the continuous
casting process
The scarfing process, which removes surface de-
fects from slabs, is the highest bottleneck process.
WP products are all scarfed, as they demand high
quality. However, in the case of general steel prod-
ucts, only slab samples are examined, and if there
is a defect, the whole lot of slabs with the defect is
scarfed. This means that normal slabs are unneces-
sarily scarfed. The recent increase in production of
WP products has overloaded the scarfing process,
necessitating the expansion of production capacity.
The Gwangyang smart factory analyzes struc-
Area Change
Maintenance Corrective maintenance → Predictive maintenance
Operation Pre-scheduled production → Real-time adaptive production
QualityReactive average quality control → Real-time on-the-spot quality control
Safety Passive safety guidelines → Active preventive safety
Energy Fixed Allocation → Demand-based Allocation
Table 2. Changes Implemented by Smart Factory
22 Asian Steel Watch
tured and unstructured data from connected pro-
cesses and automatically detects surface defects
on individual slabs. This allows the scarfing pro-
cess to be conducted only when necessary, thus
reducing the load and using the current scarfing
capacity to produce more WP products. Finding
the root cause of quality defects improves the up-
stream processes (steel-making and continuous
casting), and guides the downstream processes
(rolling and shearing) to optimal operation, pro-
foundly reducing defects in the final product. This
is a prime example of problem solving using data
and software without expanding capacity.
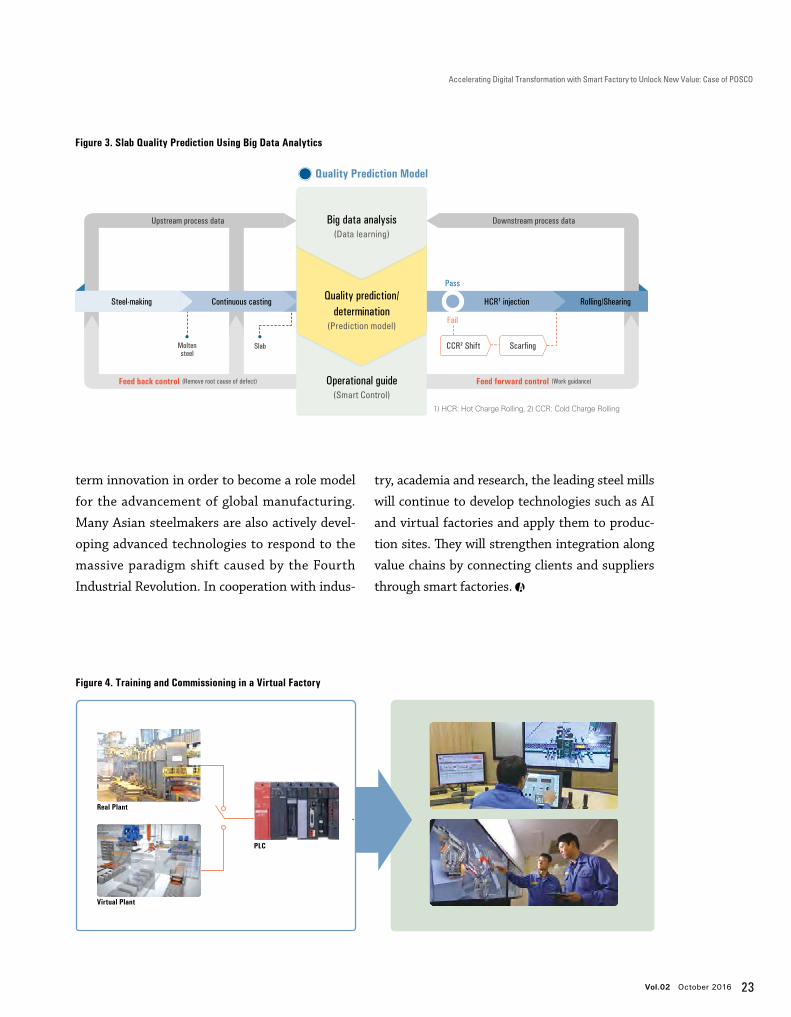
3. New product development simulation in cyberspace
The steel-making process entails large-scale facility
investments, so it is difficult to have separate pro-
cesses to test new products. Moreover, owing to
the innate characteristics of steel production, it is
also difficult to create a new product and test func-
tions through design and simulation software, as
is done with home appliances such as refrigerators
and washing machines. To address these chal-
lenges, on-going research into virtual factories is
required to enable new product development and
simulation in a cyber environment. In a virtual
factory, facilities built by 3D technology are inte-
grated with advanced control algorithms and op-
erational technologies, based on steel production
knowhow, and used for training and advanced
commissioning. In the near future, virtual facto-
ries will be able to conduct pilot production, which
would otherwise require tremendous expense.
The Fourth Industrial Revolution has already
started and is expected to have a great impact on
the survival and development of companies. Tak-
ing this as an opportunity for growth, companies
should strive to advance manufacturing and create
new value for humanity.
Implications for the Asian Steel Industry
Not resting on its exemplary success in manu-
facturing, POSCO will strive for relentless, long-
Slab
Figure 2. Surface Defect Traceability
Mother plate
Product 3 Product 2 Product 1TailCrop
HeadCrop
Side TrimmingAdvancing direction
100mm
Surface Defect Detector (SDD)
Crack
THE FOURTH WAVE OF MANUFACTURING:WHAT IT MEANS TO THE ASIAN STEEL INDUSTRY
Accelerating Digital Transformation with Smart Factory to Unlock New Value: Case of POSCO
Vol.02 October 2016 23
term innovation in order to become a role model
for the advancement of global manufacturing.
Many Asian steelmakers are also actively devel-
oping advanced technologies to respond to the
massive paradigm shift caused by the Fourth
Industrial Revolution. In cooperation with indus-
try, academia and research, the leading steel mills
will continue to develop technologies such as AI
and virtual factories and apply them to produc-
tion sites. They will strengthen integration along
value chains by connecting clients and suppliers
through smart factories.
Figure 3. Slab Quality Prediction Using Big Data Analytics
Quality Prediction Model
1) HCR: Hot Charge Rolling, 2) CCR: Cold Charge Rolling
Pass
Fail
Downstream process data
ScarfingCCR² Shift
Feed forward control (Work guidance)
Rolling/ShearingHCR¹ injection
Big data analysis(Data learning)
Quality prediction/determination
(Prediction model)
Operational guide(Smart Control)
Moltensteel
Slab
Feed back control (Remove root cause of defect)
Upstream process data
Steel-making Continuous castingSteel-making
Figure 4. Training and Commissioning in a Virtual Factory
Real Plant
Virtual Plant
PLC

24 Asian Steel Watch
Dr. Kim Chang-doSenior Principal Researcher, POSCO Research [email protected]
China is Shifting to the “Smart Factory of the World”
China’s manufacturing industry has maintained
high growth over the past thirty years, and China
became the world’s largest manufacturing nation
in 2010. In many industries, including steel, half
of global production comes from China. China
became the “factory of the world.” Grappling with
issues like rising labor costs, export slowdown,
and overcapacity, however, the growth of China’s
manufacturing slowed significantly in the last
several years. In some industries struggling with
overcapacity, including steel and shipbuilding,
operation rate is just 60-70% and profitability has
fallen. Some companies have massive profit loss-
es. Under these circumstances, the Chinese gov-
ernment and companies have taken great pains
to tackle the difficult situation, turning their eyes
to the Fourth Industrial Revolution and the rise
of smart factories in advanced manufacturing
countries.
“Made in China 2025” and “Internet Plus”
To prepare for the Fourth Industrial Revolution,
represented by “Industry 4.0” in Germany and
“Industrial Internet” in the USA, the Chinese
government released the “Made in China 2025”
policy in May 2015 and the “Internet Plus” ac-
tion plan two months later. Chinese companies
have a growing interest in Industry 4.0, smart
factories, and cyber-physical systems (CPS) and
are following government policy directions.
The concept of “Internet Plus” was first pro-
posed by Premier Li Keqiang in his government
work report at the meeting of the National Peo-
ple’s Congress of the People’s Republic of China
on March 5, 2015. According to the Xinhua News,
the official press agency of China, the action plan
will integrate mobile Internet, cloud computing,
big data and the Internet of Things(IoT) with
modern manufacturing to encourage the healthy
development of e-commerce, industrial networks,
and Internet finance, and to help Internet com-
panies increase their international presence. This
means that China hopes to make the most of the
world’s largest population of Internet and mobile
phone users.
THE FOURTH WAVE OF MANUFACTURING:WHAT IT MEANS TO THE ASIAN STEEL INDUSTRY
Vol.02 October 2016 25
China is Shifting to the “Smart Factory of the World”
The “Made in China 2025” plan has five basic
directions: ▲ innovation-driven, ▲ emphasizing
quality over quantity, ▲ green development,
▲ optimizing the structure of Chinese industry,
and ▲ talent-oriented. Of these, the Chinese
government is putting the utmost emphasis on
innovation. The plan also suggests four guid-
ing principles: ▲ market-oriented and govern-
ment-guided, ▲ based on the present and having
a long-term perspective, ▲ comprehensively
pressing forward and making breakthroughs in
key areas, and ▲ independent development and
win-win cooperation. In addition, nine objectives
have been identified, including upgrading the
manufacturing sector to boost manufacturing
innovation, and deep integration of informatiza-
tion and industrialization.
The plan also sets forth implementation
guidelines for five key projects: ▲ construction
of a national manufacturing innovation center,
▲ smart manufacturing, ▲ strengthening indus-
trial base, ▲ green manufacturing, and ▲ high-
end equipment innovation. China has selected
ten priority sectors, including new advanced
information technology, high-end computer nu-
meric control (CNC) machine tools, and robotics.
To ensure the realization of the plan, the Chi-
nese government has announced eight actions
for policy improvement: ① deepening reform of
systems and mechanisms, ② creating a fair and
competitive market environment, ③ enhancing
financial support policies, ④ expanding the level
of support in fiscal and taxation policy, ⑤ devel-
oping a multi-tier personnel training system, ⑥ improving policies for small and medium-sized
enterprises, ⑦ further opening China’s man-
ufacturing sector to foreign investment, and ⑧ strengthening the mechanisms for organiza-
tion and implementation.
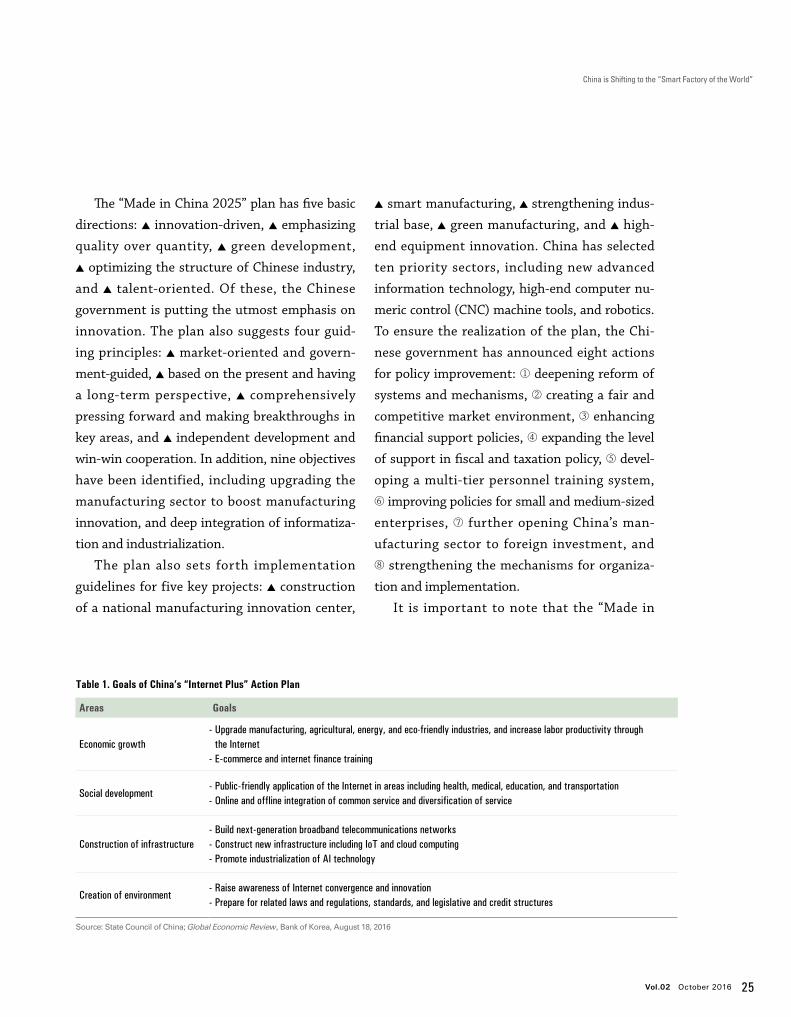
It is important to note that the “Made in
Areas Goals
Economic growth- Upgrade manufacturing, agricultural, energy, and eco-friendly industries, and increase labor productivity through the Internet- E-commerce and internet finance training
Social development- Public-friendly application of the Internet in areas including health, medical, education, and transportation- Online and offline integration of common service and diversification of service
Construction of infrastructure- Build next-generation broadband telecommunications networks- Construct new infrastructure including IoT and cloud computing- Promote industrialization of AI technology
Creation of environment- Raise awareness of Internet convergence and innovation- Prepare for related laws and regulations, standards, and legislative and credit structures
Table 1. Goals of China’s “Internet Plus” Action Plan
Source: State Council of China; Global Economic Review, Bank of Korea, August 18, 2016
26 Asian Steel Watch
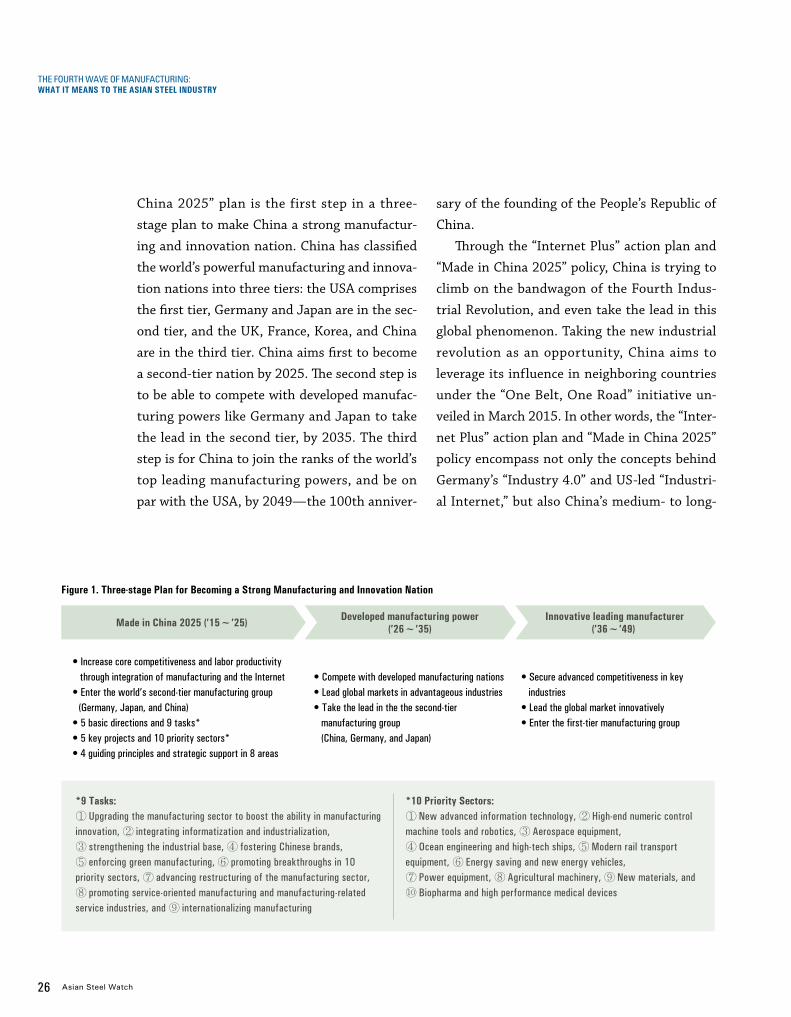
China 2025” plan is the first step in a three-
stage plan to make China a strong manufactur-
ing and innovation nation. China has classified
the world’s powerful manufacturing and innova-
tion nations into three tiers: the USA comprises
the first tier, Germany and Japan are in the sec-
ond tier, and the UK, France, Korea, and China
are in the third tier. China aims first to become
a second-tier nation by 2025. The second step is
to be able to compete with developed manufac-
turing powers like Germany and Japan to take
the lead in the second tier, by 2035. The third
step is for China to join the ranks of the world’s
top leading manufacturing powers, and be on
par with the USA, by 2049—the 100th anniver-
sary of the founding of the People’s Republic of
China.
Through the “Internet Plus” action plan and
“Made in China 2025” policy, China is trying to
climb on the bandwagon of the Fourth Indus-
trial Revolution, and even take the lead in this
global phenomenon. Taking the new industrial
revolution as an opportunity, China aims to
leverage its influence in neighboring countries
under the “One Belt, One Road” initiative un-
veiled in March 2015. In other words, the “Inter-
net Plus” action plan and “Made in China 2025”
policy encompass not only the concepts behind
Germany’s “Industry 4.0” and US-led “Industri-
al Internet,” but also China’s medium- to long-
Figure 1. Three-stage Plan for Becoming a Strong Manufacturing and Innovation Nation
*9 Tasks: ① Upgrading the manufacturing sector to boost the ability in manufacturing innovation, ② integrating informatization and industrialization, ③ strengthening the industrial base, ④ fostering Chinese brands, ⑤ enforcing green manufacturing, ⑥ promoting breakthroughs in 10 priority sectors, ⑦ advancing restructuring of the manufacturing sector, ⑧ promoting service-oriented manufacturing and manufacturing-related service industries, and ⑨ internationalizing manufacturing
*10 Priority Sectors:① New advanced information technology, ② High-end numeric control machine tools and robotics, ③ Aerospace equipment, ④ Ocean engineering and high-tech ships, ⑤ Modern rail transport equipment, ⑥ Energy saving and new energy vehicles, ⑦ Power equipment, ⑧ Agricultural machinery, ⑨ New materials, and ⑩ Biopharma and high performance medical devices
THE FOURTH WAVE OF MANUFACTURING:WHAT IT MEANS TO THE ASIAN STEEL INDUSTRY
Made in China 2025 (’15~’25) Developed manufacturing power (’26~’35)
Innovative leading manufacturer (’36~’49)
• Increase core competitiveness and labor productivity through integration of manufacturing and the Internet • Enter the world’s second-tier manufacturing group (Germany, Japan, and China) • 5 basic directions and 9 tasks* • 5 key projects and 10 priority sectors* • 4 guiding principles and strategic support in 8 areas
• Compete with developed manufacturing nations • Lead global markets in advantageous industries • Take the lead in the the second-tier manufacturing group (China, Germany, and Japan)
• Secure advanced competitiveness in key industries • Lead the global market innovatively • Enter the first-tier manufacturing group
Vol.02 October 2016 27
China is Shifting to the “Smart Factory of the World”
term strategies of boosting manufacturing and
innovation capabilities, achieving industrial
sophistication, and increasing China’s influence
overseas.
As the “factory of the world,” China has been
solidifying its position in manufacturing. If it
succeeds in integrating and utilizing the Inter-
net and artificial intelligence (AI) technology in
manufacturing, China will find new opportuni-
ties. In particular, smart factories, a key concept
of Industry 4.0, could alter the future of China’s
troubled manufacturing industry.
Potential and limitations of China’s smart factories
According to MarketsandMarkets and the Korea
Embedded Software and System Industry Associ-
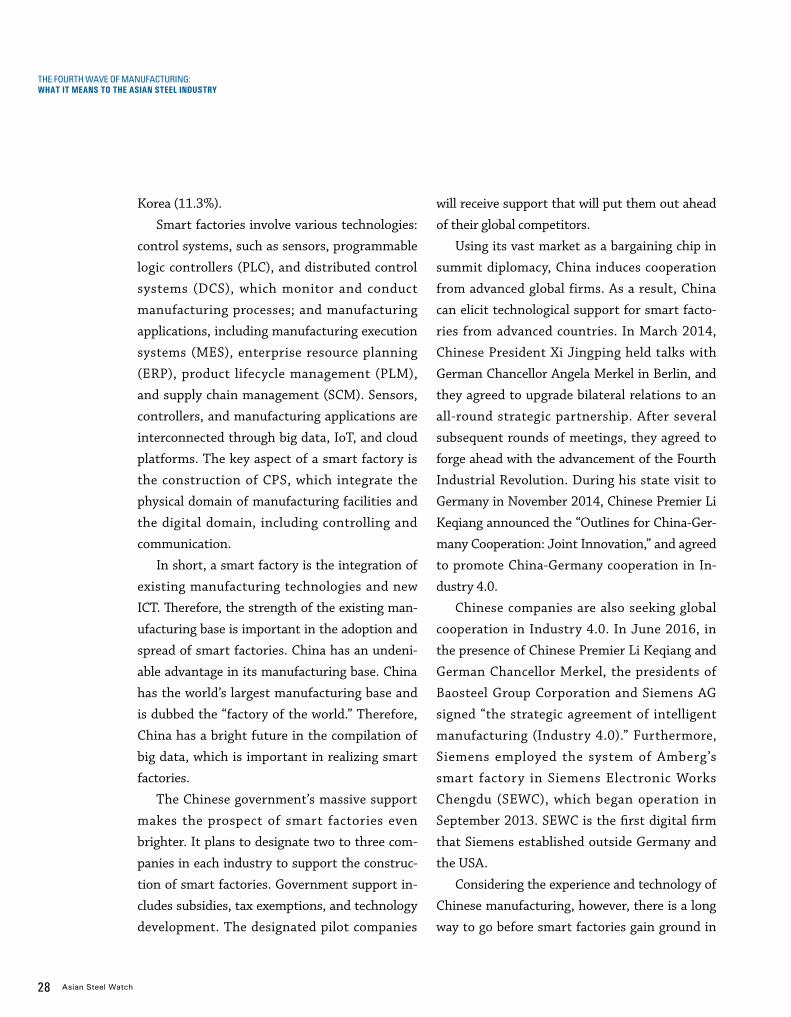
ation (KESSIA), the global smart factory market
is expected to grow at a CAGR of 5.4%, from USD
41.3 billion in 2014 to USD 56.6 billion in 2020.
By technology, telecommunications has the
highest projected growth rate, 8.1%. By country,
China had the largest share of the smart factory
market in 2013 (18.8%), followed by Germany
(15.1%), the USA (12.5%), Japan (13.3%), and
2013 2014 2015 2016 2018 2020 Annual average
Sensors, controller 45 47 49 51 56 61 4.5%
Telecommunications 32 36 39 42 49 57 8.1%
Industrial robots 278 296 313 331 336 401 5.2%
Logic and distributed control 33 34 36 38 42 47 5.3%
Total 388 413 437 462 513 566 5.4%
Table 2. Global Smart Factory Market Forecast by Technology
Source: MarketsandMarkets, KESSIA
(USD 100 million)
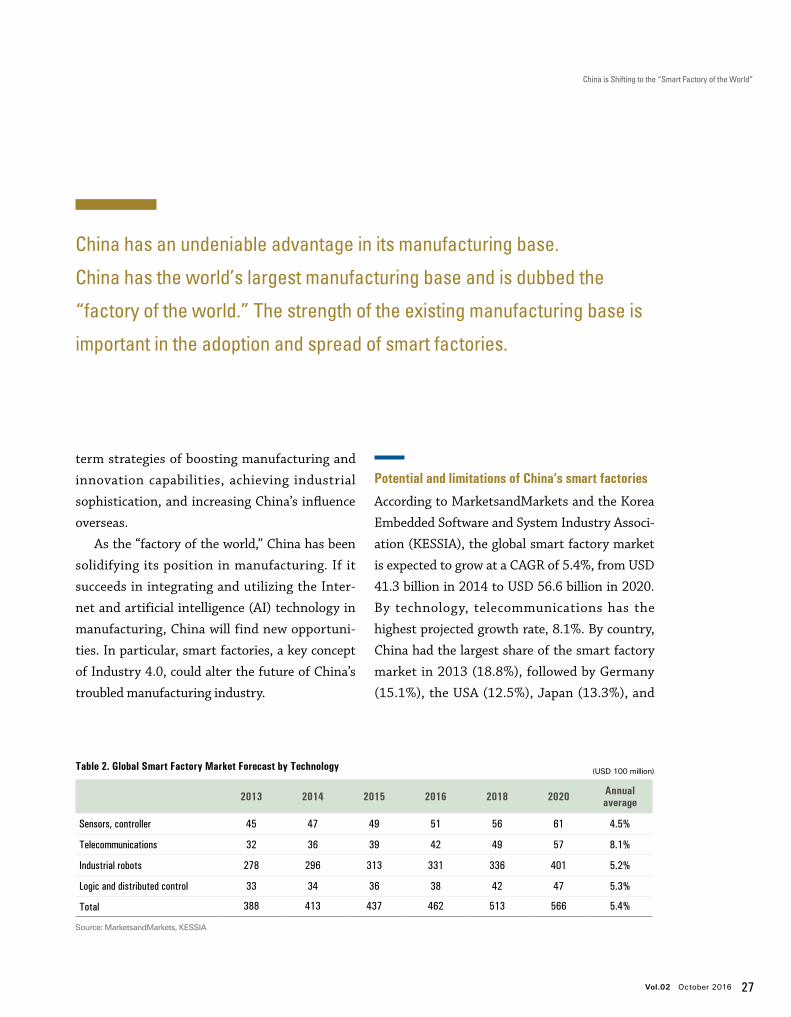
China has an undeniable advantage in its manufacturing base.
China has the world’s largest manufacturing base and is dubbed the
“factory of the world.” The strength of the existing manufacturing base is
important in the adoption and spread of smart factories.
28 Asian Steel Watch
Korea (11.3%).
Smart factories involve various technologies:
control systems, such as sensors, programmable
logic controllers (PLC), and distributed control
systems (DCS), which monitor and conduct
manufacturing processes; and manufacturing
applications, including manufacturing execution
systems (MES), enterprise resource planning
(ERP), product lifecycle management (PLM),
and supply chain management (SCM). Sensors,
controllers, and manufacturing applications are
interconnected through big data, IoT, and cloud
platforms. The key aspect of a smart factory is
the construction of CPS, which integrate the
physical domain of manufacturing facilities and
the digital domain, including controlling and
communication.
In short, a smart factory is the integration of
existing manufacturing technologies and new
ICT. Therefore, the strength of the existing man-
ufacturing base is important in the adoption and
spread of smart factories. China has an undeni-
able advantage in its manufacturing base. China
has the world’s largest manufacturing base and
is dubbed the “factory of the world.” Therefore,
China has a bright future in the compilation of
big data, which is important in realizing smart
factories.
The Chinese government’s massive support
makes the prospect of smart factories even
brighter. It plans to designate two to three com-
panies in each industry to support the construc-
tion of smart factories. Government support in-
cludes subsidies, tax exemptions, and technology
development. The designated pilot companies
will receive support that will put them out ahead
of their global competitors.
Using its vast market as a bargaining chip in
summit diplomacy, China induces cooperation
from advanced global firms. As a result, China
can elicit technological support for smart facto-
ries from advanced countries. In March 2014,
Chinese President Xi Jingping held talks with
German Chancellor Angela Merkel in Berlin, and
they agreed to upgrade bilateral relations to an
all-round strategic partnership. After several
subsequent rounds of meetings, they agreed to
forge ahead with the advancement of the Fourth
Industrial Revolution. During his state visit to
Germany in November 2014, Chinese Premier Li
Keqiang announced the “Outlines for China-Ger-
many Cooperation: Joint Innovation,” and agreed
to promote China-Germany cooperation in In-
dustry 4.0.
Chinese companies are also seeking global
cooperation in Industry 4.0. In June 2016, in
the presence of Chinese Premier Li Keqiang and
German Chancellor Merkel, the presidents of
Baosteel Group Corporation and Siemens AG
signed “the strategic agreement of intelligent
manufacturing (Industry 4.0).” Furthermore,
Siemens employed the system of Amberg’s
smart factory in Siemens Electronic Works
Chengdu (SEWC), which began operation in
September 2013. SEWC is the first digital firm
that Siemens established outside Germany and
the USA.
Considering the experience and technology of
Chinese manufacturing, however, there is a long
way to go before smart factories gain ground in
THE FOURTH WAVE OF MANUFACTURING:WHAT IT MEANS TO THE ASIAN STEEL INDUSTRY
Vol.02 October 2016 29
China is Shifting to the “Smart Factory of the World”
China. First of all, Chinese manufacturers have
different degrees of advancement when it comes
to manufacturing bases. The level of most Chi-
nese firms falls between Industry 2.0 and Indus-
try 3.0. The prevailing opinion is that it is more
urgent to upgrade to Industry 3.0 than to adopt
smart factories.
Moreover, China still lags behind advanced
countries in terms of the technological ability
to build and analyze big data and CPS. Most im-
portantly, China lacks the experts necessary to
introduce and realize smart factories. For these
reasons, the Chinese government is emphasizing
innovation and the nurturing of talent.
Phased implementation of China’s smart factory
Considering this reality, Chinese experts have
suggested the concept of smart factory 1.0 and
insisted on phased implementation. Wang Jian,
Secretary General of the China Science & Tech-
nology Automation Alliance presented “smart
factory 1-2-3” as a development model for smart
factories. The “1” means to raise capability to ac-
cumulate and analyze big data, the key element
of smart factories. The “2” is to ① form an alliance
between smart equipment manufacturers and
consumer goods manufacturers and ② integrate
digital manufacturing and smart manufactur-
ing. The “3” refers to a threefold integration—
horizontal, vertical, and lifecycle integration,
ultimately building CPS through the integration
of the physical domain and the digital domain.
Based on these steps, Wang proposes that China
announce “smart factory 1.0” for the time being,
spend the next five years building the basis for
smart factories, and implement “smart factory 2.0
and 3.0” after 2020.
A comparison with advanced countries, in-
cluding the USA and Germany, illuminates Chi-
na’s need for phased implementation of smart
factories. In the USA, enterprises formed part-
nerships with the government to build the basis
for smart factories, focusing on the development
of new ICT, including big data, data analysis, vir-
tual reality systems, and IoT. In Germany, enter-
Due to the technology gap and varying levels of advancement among
the manufacturing bases of steelmakers, the Chinese steel industry needs
to employ selection and concentration, and phased implementation
of smart factories.
30 Asian Steel Watch
prises with strong manufacturing bases led the
introduction of smart factories in the early phase,
but soon faced limitations. Motived by the coop-
eration between enterprises and the government
in the USA, Germany now seeks private-public
implementation of smart factories. On the oth-
er hand, China’s policy direction dictates that
companies implement government initiatives
for smart factories. With the different levels of
advancement among companies, the Chinese
government has adopted the selection and con-
centration strategy, concentrating support on
leading companies in each industry.
Thanks to the Chinese government’s efforts,
leading companies in some industries seem to
be close to the realization of smart factories. If
these companies see tangible results, the spread
of smart factories will be expedited and leap sev-
eral stages. According to Chinese media, China’s
largest home appliance company, Haier, is the
first home appliance company to have a smart
factory. In 2015, Haier established four inter-
net-based smart factories, including the refrig-
erator factory at Shenyang in Liaoning province.
At this plant, the 100-meter production line was
replaced by four production lines of 18 meters
each. Hundreds of parts are automatically sorted
and grouped according to pre-set data. The facto-
ry enables mass production of various products
to meet customer needs in a timely manner. As
a result, the factory has reduced its workforce by
57%, increased production capacity by 80%, and
cut time-to-market and delivery lead time by
47%. Also in the automotive sector such leading
automakers as Changchun, Yiqi, and Shanghai
Volkswagen are gearing up to introduce smart
factories.
The response of Chinese steelmakers and upcoming challenges for the global steel industry
The spread of smart factories brings new wind
to the Chinese steel industry. In a mire of over-
capacity and strict environmental regulations,
steelmakers are losing profitability, and are
threatened by drastic restructuring. Under these
Just as the explosive growth of China’s steel industry has shocked the world in the early
21st century, the world might be shocked again by China, if it successfully adopts
Industry 4.0 and smart factories in the future.
THE FOURTH WAVE OF MANUFACTURING:WHAT IT MEANS TO THE ASIAN STEEL INDUSTRY
Vol.02 October 2016 31
China is Shifting to the “Smart Factory of the World”
circumstances, smart factories could bring new
momentum to the steel industry. Some leading
Chinese steelmakers have already automated
production facilities, because these are the con-
tinuous process. They will be able to realize smart
factories simply by integrating new ICT with
existing facilities to build CPS. This is why some
steelmakers are actively trying to adopt smart
factories.
Shanghai Meishan Iron and Steel (Meigang), a
subsidiary of Baosteel Group, has already includ-
ed smart manufacturing in its medium- to long-
term strategy, and is implementing this strategy
in phases. Baosteel is poised to move beyond
smart factories to lead smart manufacturing in
the steel industry. Baosteel’s ambitious e-com-
merce platform, Ouyeel, is not just for simple
online transactions, but a platform for collecting
and analyzing big data on customers and mar-
kets. In this sense, the steel e-commerce boom
that began in China last year linked to Industry
4.0. Shanxi-based private steelmaker Shanxi Ji-
anbang Group has adopted smart factories and is
implementing the “5+1+1” online model. The “5”
refers to smart inventory, smart logistics, smart
procurement, smart sales, and smart recycling,
and the two “1”s represent smart manufacturing
and smart finance.
Due to the technology gap and varying lev-
els of advancement among the manufacturing
bases of steelmakers, the Chinese steel industry
needs to employ selection and concentration, and
phased implementation of smart factories. The
level of development with regard to smart facto-
ries depends on the relative size and competitive-
ness of the company. Small and medium -sized
steelmakers will focus on the early stages of
automation and management of manufacturing
records and defect logs. Steelmakers of middle
standing will concentrate on facility management
using sensors, and collection and management
of real-time production information. Large steel-
makers will pursue real-time system connection
and real-time automation control of their smart
factories using PLC. In addition, some mega-sized
steelmakers will aim for multifunctional intelli-
gence, wired and wireless communication with
AI, and autonomous production of facilities and
systems. In particular, leading steelmakers with
well-established manufacturing bases will in-
crease investments in smart factory-related tech-
nologies, including big data, CPS, smart sensors,
IoT, cloud computing, and gear up to develop
these technologies.
In conclusion, the phased introduction of In-
dustry 4.0 and smart factories will revitalize Chi-
nese manufacturing and create an opportunity for
China to shift from the “factory of the world” to
the “smart factory of the world.”
However, it would take much time and energy
to fully realize smart factories in China’s manu-
facturing and steel industries. Despite mounting
difficulties, a promising path lies ahead for Chi-
na. Just as the explosive growth of China’s steel
industry has shocked the world in the early 21st
century, the world might be shocked again by
China, if it successfully adopts Industry 4.0 and
smart factories in the future. Now the global steel
industry should pay close attention to the rise of
Industry 4.0 and smart factories in China.
32 Asian Steel Watch
The Rise, Prospects, and Impact of China’s Steel E-Commerce
Dr. Kim Kyeongchan Vice President of Corporate Strategy Department POSCO
Steel e-commerce is gaining ground in China.
One might overlook this as part of the global
spread of e-commerce. However, much atten-
tion is being paid to the spread of China’s steel
e-commerce that could be a renowned trading
platform in Asia though advanced countries
have already experienced the rise and fall of
steel e-commerce.
In the late 1990s when “dot-com” fever
swept the world, the first steel e-commerce
boom began. Steelmakers, steel distributors,
and venture capitalists in major steel-producing
countries, including the USA, Japan, Europe-
an countries, and Korea, led the expansion of
e-commerce.
However, the boom was short-lived for sever-
al reasons. Profit models were inadequate given
the massive investments made, and the charac-
teristics of steel trade were not fully reflected
in online trade. Moreover, entry barriers were
raised for traditional offline distributors (See
Table 1).
Background and sustainability of China’s steel e-commerce boom
Ten years later, a second steel e-commerce boom
began in China. The number of steel e-commerce
platforms increased eight-fold and the transac-
tion amount increased ten-fold from 2012 to
2015 (See Figure 1).
The rapid growth of China’s steel e-commerce
was caused by three factors that collectively in-
tensified competition in online platforms: the
changing landscape of the steel trading market
due to a slump in China’s steel industry; China’s
“Internet Plus” and other related policies; and an
online fever across the industry. The first factor
was the declining number of Chinese steel distrib-
utors giving rise to new business opportunities.
The number of Chinese steel distributors reached
200,000 in 2012, but fell by half to 100,000 in
2014. This is attributed to management difficul-
ties caused by sagging steel prices following a
decline in steel production and consumption in
THE FOURTH WAVE OF MANUFACTURING:WHAT IT MEANS TO THE ASIAN STEEL INDUSTRY
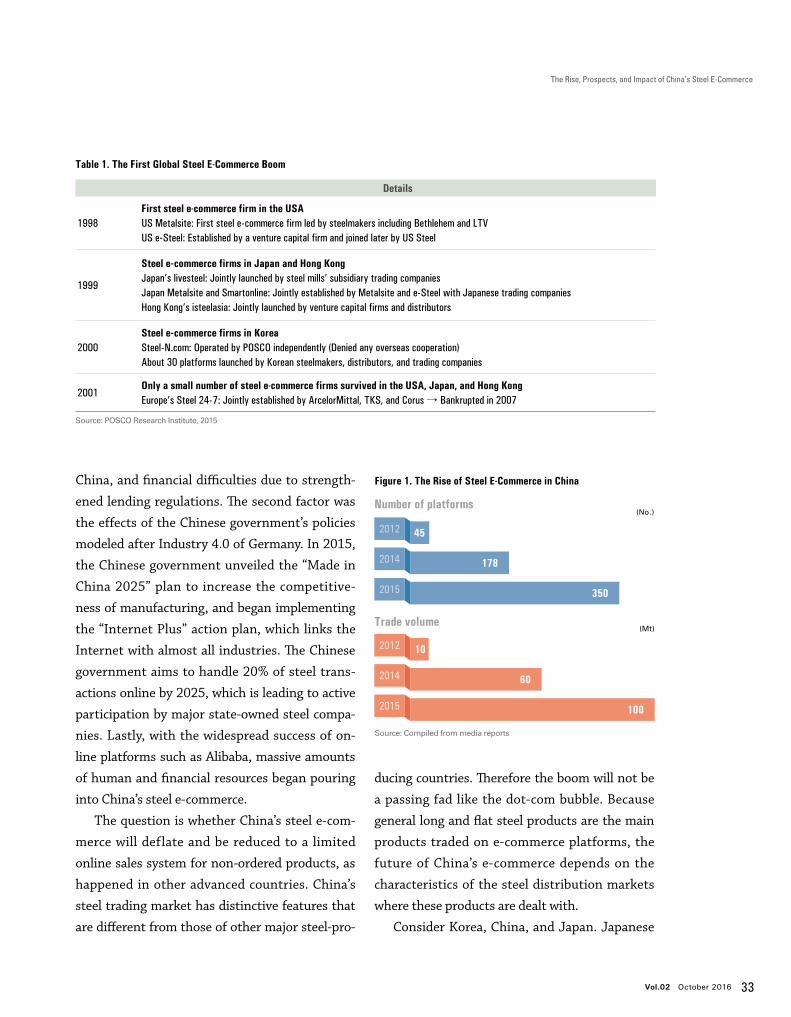
Vol.02 October 2016 33
The Rise, Prospects, and Impact of China’s Steel E-Commerce
Table 1. The First Global Steel E-Commerce Boom
Details
1998First steel e-commerce firm in the USAUS Metalsite: First steel e-commerce firm led by steelmakers including Bethlehem and LTVUS e-Steel: Established by a venture capital firm and joined later by US Steel
1999
Steel e-commerce firms in Japan and Hong KongJapan’s livesteel: Jointly launched by steel mills’ subsidiary trading companies Japan Metalsite and Smartonline: Jointly established by Metalsite and e-Steel with Japanese trading companiesHong Kong’s isteelasia: Jointly launched by venture capital firms and distributors
2000 Steel e-commerce firms in KoreaSteel-N.com: Operated by POSCO independently (Denied any overseas cooperation)About 30 platforms launched by Korean steelmakers, distributors, and trading companies
2001Only a small number of steel e-commerce firms survived in the USA, Japan, and Hong Kong Europe’s Steel 24-7: Jointly established by ArcelorMittal, TKS, and Corus → Bankrupted in 2007
Source: POSCO Research Institute, 2015
2012
2014
2015
Trade volume
10
60
100
(Mt)
Source: Compiled from media reports
Figure 1. The Rise of Steel E-Commerce in China
Number of platforms
350
2012
2014
2015
(No.)
45
178
ducing countries. Therefore the boom will not be
a passing fad like the dot-com bubble. Because
general long and flat steel products are the main
products traded on e-commerce platforms, the
future of China’s e-commerce depends on the
characteristics of the steel distribution markets
where these products are dealt with.
Consider Korea, China, and Japan. Japanese
China, and financial difficulties due to strength-
ened lending regulations. The second factor was
the effects of the Chinese government’s policies
modeled after Industry 4.0 of Germany. In 2015,
the Chinese government unveiled the “Made in
China 2025” plan to increase the competitive-
ness of manufacturing, and began implementing
the “Internet Plus” action plan, which links the
Internet with almost all industries. The Chinese
government aims to handle 20% of steel trans-
actions online by 2025, which is leading to active
participation by major state-owned steel compa-
nies. Lastly, with the widespread success of on-
line platforms such as Alibaba, massive amounts
of human and financial resources began pouring
into China’s steel e-commerce.
The question is whether China’s steel e-com-
merce will deflate and be reduced to a limited
online sales system for non-ordered products, as
happened in other advanced countries. China’s
steel trading market has distinctive features that
are different from those of other major steel-pro-
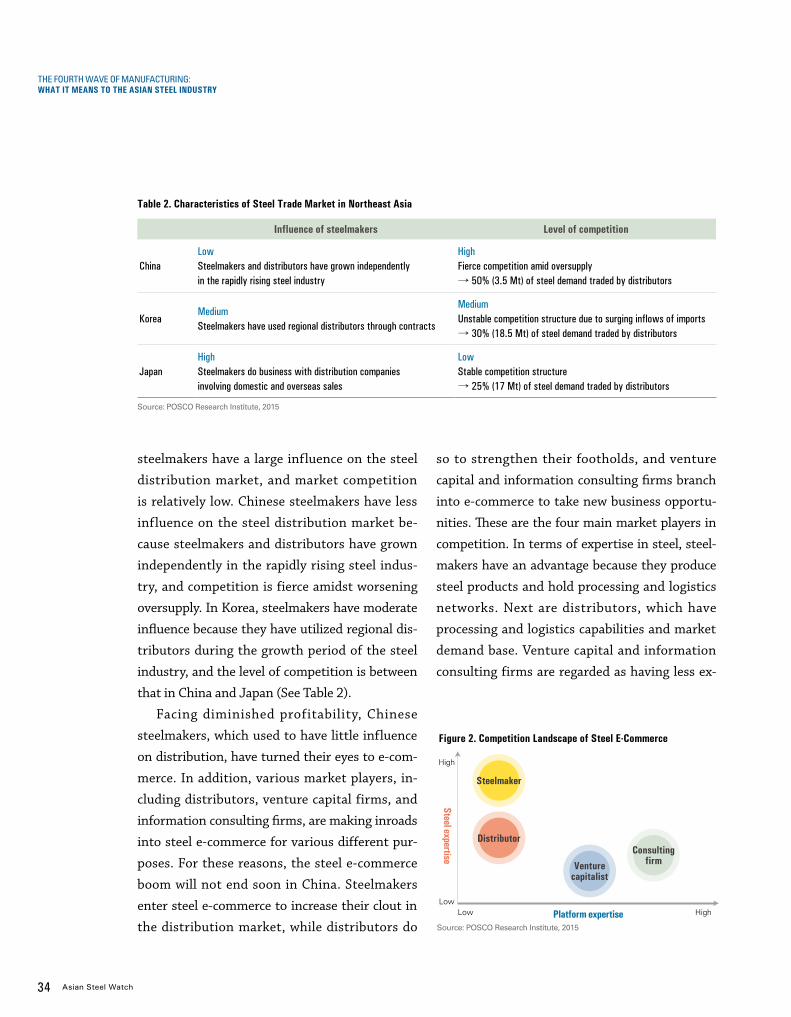
34 Asian Steel Watch
so to strengthen their footholds, and venture
capital and information consulting firms branch
into e-commerce to take new business opportu-
nities. These are the four main market players in
competition. In terms of expertise in steel, steel-
makers have an advantage because they produce
steel products and hold processing and logistics
networks. Next are distributors, which have
processing and logistics capabilities and market
demand base. Venture capital and information
consulting firms are regarded as having less ex-
Figure 2. Competition Landscape of Steel E-Commerce
Source: POSCO Research Institute, 2015
Steel expertise
Platform expertise
High
HighLow
Low
Steelmaker
Distributor
Venturecapitalist
Consultingfirm
Table 2. Characteristics of Steel Trade Market in Northeast Asia
Influence of steelmakers Level of competition
ChinaLowSteelmakers and distributors have grown independently in the rapidly rising steel industry
HighFierce competition amid oversupply → 50% (3.5 Mt) of steel demand traded by distributors
KoreaMediumSteelmakers have used regional distributors through contracts
MediumUnstable competition structure due to surging inflows of imports → 30% (18.5 Mt) of steel demand traded by distributors
JapanHighSteelmakers do business with distribution companies involving domestic and overseas sales
LowStable competition structure → 25% (17 Mt) of steel demand traded by distributors
Source: POSCO Research Institute, 2015
steelmakers have a large influence on the steel
distribution market, and market competition
is relatively low. Chinese steelmakers have less
influence on the steel distribution market be-
cause steelmakers and distributors have grown
independently in the rapidly rising steel indus-
try, and competition is fierce amidst worsening
oversupply. In Korea, steelmakers have moderate
influence because they have utilized regional dis-
tributors during the growth period of the steel
industry, and the level of competition is between
that in China and Japan (See Table 2).
Facing diminished profitability, Chinese
steelmakers, which used to have little influence
on distribution, have turned their eyes to e-com-
merce. In addition, various market players, in-
cluding distributors, venture capital firms, and
information consulting firms, are making inroads
into steel e-commerce for various different pur-
poses. For these reasons, the steel e-commerce
boom will not end soon in China. Steelmakers
enter steel e-commerce to increase their clout in
the distribution market, while distributors do
THE FOURTH WAVE OF MANUFACTURING:WHAT IT MEANS TO THE ASIAN STEEL INDUSTRY
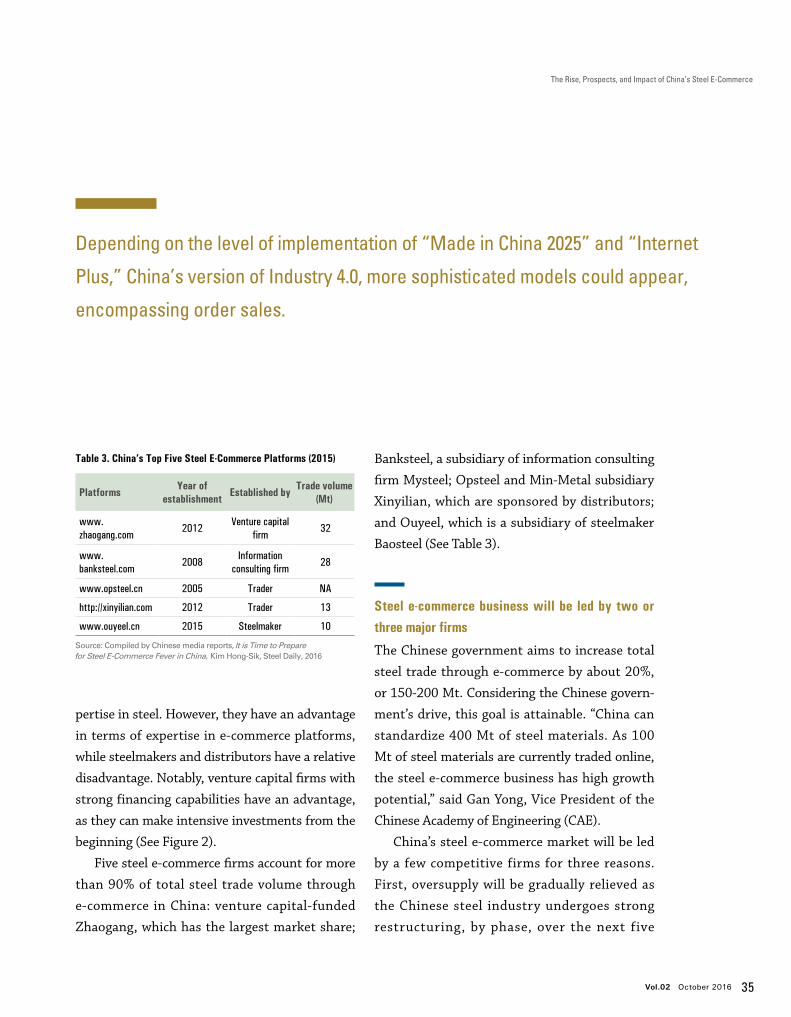
Vol.02 October 2016 35
The Rise, Prospects, and Impact of China’s Steel E-Commerce
pertise in steel. However, they have an advantage
in terms of expertise in e-commerce platforms,
while steelmakers and distributors have a relative
disadvantage. Notably, venture capital firms with
strong financing capabilities have an advantage,
as they can make intensive investments from the
beginning (See Figure 2).
Five steel e-commerce firms account for more
than 90% of total steel trade volume through
e-commerce in China: venture capital-funded
Zhaogang, which has the largest market share;
Banksteel, a subsidiary of information consulting
firm Mysteel; Opsteel and Min-Metal subsidiary
Xinyilian, which are sponsored by distributors;
and Ouyeel, which is a subsidiary of steelmaker
Baosteel (See Table 3).
Steel e-commerce business will be led by two or three major firms
The Chinese government aims to increase total
steel trade through e-commerce by about 20%,
or 150-200 Mt. Considering the Chinese govern-
ment’s drive, this goal is attainable. “China can
standardize 400 Mt of steel materials. As 100
Mt of steel materials are currently traded online,
the steel e-commerce business has high growth
potential,” said Gan Yong, Vice President of the
Chinese Academy of Engineering (CAE).
China’s steel e-commerce market will be led
by a few competitive firms for three reasons.
First, oversupply will be gradually relieved as
the Chinese steel industry undergoes strong
restructuring, by phase, over the next five
Depending on the level of implementation of “Made in China 2025” and “Internet
Plus,” China’s version of Industry 4.0, more sophisticated models could appear,
encompassing order sales.
Table 3. China’s Top Five Steel E-Commerce Platforms (2015)
Platforms Year of establishment Established by Trade volume
(Mt)
www.zhaogang.com
2012Venture capital
firm 32
www.banksteel.com
2008Information
consulting firm 28
www.opsteel.cn 2005 Trader NA
http://xinyilian.com 2012 Trader 13
www.ouyeel.cn 2015 Steelmaker 10
Source: Compiled by Chinese media reports, It is Time to Prepare for Steel E-Commerce Fever in China, Kim Hong-Sik, Steel Daily, 2016
36 Asian Steel Watch
years. Second, due to the persistence of unsta-
ble profit models, many steel e-commerce firms
face mounting difficulties. Third, as overheated
venture investment cools as a result of China’s
economic growth stabilizing at a medium rate,
companies that fail to get listed on the stock
market will rapidly disappear or be merged with
other companies.
There are various forecasts on the reorga-
nization of China’s steel e-commerce industry.
The Chinese government, which currently sup-
ports around 30 platforms, predicts that 5-10
platforms will survive over the next five years.
Zhaogang, BankSteel, and Ouyeel will become
the first-tier group, leading the reorganization
of the steel e-commerce market. The second-tier
group, mainly led by large distributors, including
Opsteel, will be the first target to be merged, and
the third-tier group, consisting of the remaining
smaller companies, will disappear or be incorpo-
rated into large platforms. Another forecast pre-
dicts that the steel e-commerce market will be led
by two big powers, considering the characteristics
of e-commerce business. Just like the e-com-
merce business for consumer goods, which is
led by two big companies, Taobao and Jingdong,
there is a possibility that the steel e-commerce
market will be led by two major parties: the steel-
makers and an alliance of third-party platforms.
China’s steel e-commerce platforms are grap-
pling with profitability, just as businesses in ad-
vanced steel-producing countries did in the past.
Except for Ouyeel, which posted a slight surplus
in 2015, Chinese steel e-commerce firms are run-
ning deficits. Their model is not to charge trans-
action fees, but to find cash cows in advertising,
logistics, finance, and information. To take the
lead in the market, they also seek quantitative
growth and plan initial public offerings (IPOs) in
one or two years. China’s steel e-commerce plat-
forms generally handle ordered and non-ordered
products of flat and long steels; and these prod-
ucts are mostly general products. They plan to
expand the scope of business from general steel
to high-quality steel, and from inventory sales to
order sales, however, this will be difficult given
Considering the size of the market, business opportunities, and profitability,
China’s steel e-commerce will not be just a fad. This will be especially true if
Chinese-style Industry 4.0 is reflected in the steel industry.
THE FOURTH WAVE OF MANUFACTURING:WHAT IT MEANS TO THE ASIAN STEEL INDUSTRY

Vol.02 October 2016 37
The Rise, Prospects, and Impact of China’s Steel E-Commerce
Types of steel e-commerce
B2B e-commerce is divided into four types de-
pending on the complexity of transactions and
degree of product involvement: e-procurement,
e-distribution, e-partnership, and e-market-
place. China’s steel e-commerce encompasses
all four types, but focuses especially on e-mar-
ketplace. In this article, e-commerce mainly
refers to e-marketplace. “E-procurement,”
which has low product involvement and high
complexity of transactions, deals with the pur-
chase of maintenance, repair, operation (MRO)
materials. “E-distribution,” which entails trans-
actions with sales channels, has low complexi-
ty but high involvement, while “e-partnership,”
which supports sales of tailored products, has
high complexity and high involvement. E-dis-
tribution and e-partnership, which have high
product involvement, are characterized by
the use of online platforms to increase offline
trade. Finally, “e-marketplace” has high com-
plexity and low involvement.
Types of B2B E-Commerce
Source: E-Commerce, Laudon and Traver, 2002, modified by the author
e-ProcurementMRO procurement
Complexity of transaction
Product involvement
e-PartnershipSales of tailored products
e-DistributionTransaction with sales
channls
High
LowLow High
e-MarketplaceSales of readymade products
the characteristics of the steel trade. Therefore,
they will likely end up being channels for inven-
tory sales of general steel products. Major firms
have already tried to move independently toward
order sales, but they have faced many difficulties,
and postponed this goal. However, depending on
the level of implementation of “Made in China
2025” and “Internet Plus,” China’s version of In-
dustry 4.0, more sophisticated steel e-commerce
models could appear, encompassing order sales.
China’s steel e-commerce firms pioneering overseas markets
China’s major steel e-commerce firms are broad-
ening their sales channels. In terms of regional
expansion, results vary by company. Zhaogang
entered Korea and Vietnam, respectively in
2014 and 2016. It is also building subsidiaries in
Thailand and Dubai. There are mixed views on
Zhaogang’s entry into the Korean market. Based
on interviews, Zhaogang entered Korea because
Korea is China’s largest steel export market, with
annual imports of 13 Mt, and steel prices are
higher in Korea than in China. As general long
and flat products are typically traded by small and
medium-sized steel traders in Korea, Zhaogang
believed it would have a competitive advantage
over Korean steel traders if it strengthened its
functions of storage, logistics, and processing, by
phase, in Korea. Ouyeel entered the Southeast
Asian market by establishing a subsidiary in Sin-
38 Asian Steel Watch
gapore in May 2016. China’s steel e-commerce
firms have entered Southeast Asia and the Middle
East mainly because they wish to stake an early
claim to distribution channels for Chinese steel
products under China’s “One Belt One Road” pol-
icy. On the other hand, BankSteel does not seek
overseas expansion, but focuses on the Chinese
market. It is preparing to operate its existing
platform in nine languages. Rather than using a
Chinese platform in foreign countries, it is build-
ing sub-platforms suitable to foreign countries
to secure demand. By doing so, it works as a steel
trader that imports and sells general long and flat
products from China.
In steel e-commerce, traders buy products
from steelmakers right after the signing of a
procurement contract and sell them to custom-
ers. When it comes to exports, however, traders
are exposed to the risk of price volatility due to
time differences, and face challenges in build-
ing networks for payment, storage, processing,
logistics, and customer claims in overseas mar-
kets. Currently, Chinese steel e-commerce firms
rent warehouses in overseas markets. However,
if they strengthen the functions of logistics,
processing, and financing in the course of over-
seas business expansion, Korean and overseas
Chinese traders who have exported Chinese
steel products will gradually lose business. With
steel price information available in real time on
Chinese steel e-commerce sites, steel traders
that used to profit from information imbalances
will lose their footing. Moreover, Chinese steel
e-commerce platforms source and supply prod-
ucts even from minor steelmakers that are not
connected to steel traders, leading to a possible
rise in export volume and a subsequent price de-
cline.
Steelmakers, distributors, venture capital
firms, and information consulting firms will
gradually expand overseas businesses. This is be-
cause trade items expand from steel bar and wire
rod to general HR, CR sheet, and plate, collabo-
ration with local distribution and logistics firms
increases, and a sales force is secured in overseas
markets.
In the short-term, e-commerce will take root as a distribution channel for general steel
products in China. In the medium- to long-term, it will become the main sales channel
for 100 million tonnes of Chinese steel exports.
THE FOURTH WAVE OF MANUFACTURING:WHAT IT MEANS TO THE ASIAN STEEL INDUSTRY

Vol.02 October 2016 39
The Rise, Prospects, and Impact of China’s Steel E-Commerce
Impact of expanding steel e-commerce in China
As Chinese steel e-commerce firms branch into
overseas markets, each step will have correspond-
ing impacts. In Korea, which is the largest importer
of Chinese steel products, Chinese platforms will
accelerate their entry into the Korean market by
building offline channels first and replace local steel
importers. In order to prepare for this situation,
Korean steel e-commerce platforms led by steel-
makers and distributors are expected to strength-
en the role and function of existing platforms and
create new platforms. This will put pressure on the
restructuring of the steel distribution market.
In the case of emerging markets, including
Southeast Asia, steel e-commerce will not spread
as fast as it did in China. Chinese platforms seek
gradual expansion, such as building offline chan-
nels first and then transferring business from
offline to online. By doing so, their influence will
become stronger in emerging markets. There will
be various forms of competition and collaboration
with large steel trading companies and small and
medium-sized steel importers doing business in
emerging markets.
Considering the size of the market, business
opportunities, and profitability, China’s steel
e-commerce will not be just a fad. This will be espe-
cially true if Chinese-style Industry 4.0 is reflected
in the steel industry. In the short-term, e-com-
merce will take root as a distribution channel for
general steel products in China. In the medium- to
long-term, it will become the main sales channel
for 100 million tonnes of Chinese steel exports. In
overseas markets, however, Chinese steel e-com-
merce firms will assume the functions of offline
steel traders, rather than seeking rapid online
expansion by building a spate of steel e-commerce
platforms as in China. They will expand their func-
tions incrementally, mainly in emerging markets.
In this process, existing steel distribution chan-
nels, which have been operated offline, will be up-
graded through integration with online channels
in each market. As a result, Chinese steel e-com-
merce platforms will be able to increase their clout
in overseas steel distribution channels.
E-COMMERCE SEARCH
SEARCHCPS
SEARCHSYST
EM
INTERNET
INTERNET INTE
RN
ET INTERNET
DATAWEB
SERVERBig DataCyber Physical System
APPLICATION
BLO
GS
MAINTENANCE
TECHNOLOGY
AD
MIN
COMPONENTBUSINESS
WEB
STEELICT
COMMUNITY

40 Asian Steel Watch
Ask the Guru: Roads Ahead for the Steel Industry
I N T E R V I E W
Dr. Edwin BassonDirector General, World Steel Association (worldsteel)
After a few years in the banking industry, Edwin Basson joined the steel
industry in 1994 as Chief Economist at Iscor Ltd. in South Africa. In 1996,
he became Business Unit Manager for coated steel products and flat
steel products. He later headed Strategic Initiatives at the company.
Edwin was transferred to Europe when Iscor became
a part of Mittal Steel (now ArcelorMittal) in 2004 as a General
Manager responsible for Marketing Strategy and was part of
the Merger & Acquisition team in Mittal steel. From 2006 until
he joined worldsteel, he was Vice President, Commercial Co-
ordination, Marketing and Trade Policy at ArcelorMittal.
Edwin joined worldsteel in August 2011 as Director General.
Edwin received his PhD in economics from Pretoria University.
He taught economics at the same university
from 1984 to 1990.
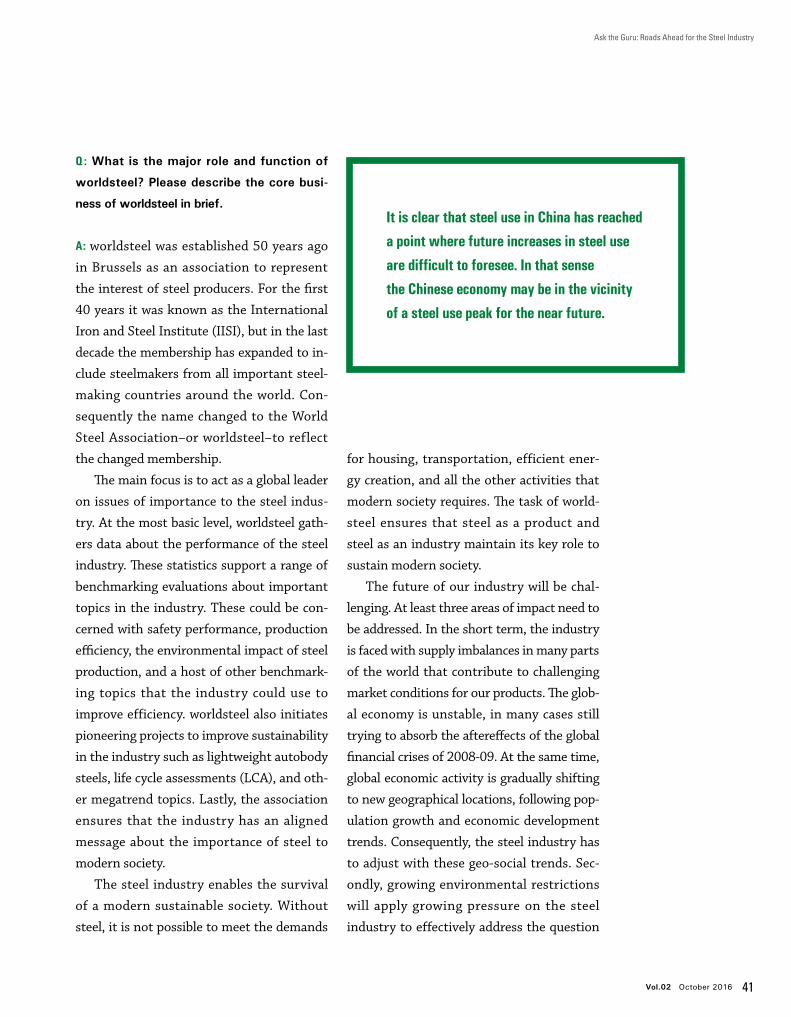
Vol.02 October 2016 41
Q: What is the major role and function of
worldsteel? Please describe the core busi-
ness of worldsteel in brief.
A: worldsteel was established 50 years ago
in Brussels as an association to represent
the interest of steel producers. For the first
40 years it was known as the International
Iron and Steel Institute (IISI), but in the last
decade the membership has expanded to in-
clude steelmakers from all important steel-
making countries around the world. Con-
sequently the name changed to the World
Steel Association–or worldsteel–to reflect
the changed membership.
The main focus is to act as a global leader
on issues of importance to the steel indus-
try. At the most basic level, worldsteel gath-
ers data about the performance of the steel
industry. These statistics support a range of
benchmarking evaluations about important
topics in the industry. These could be con-
cerned with safety performance, production
efficiency, the environmental impact of steel
production, and a host of other benchmark-
ing topics that the industry could use to
improve efficiency. worldsteel also initiates
pioneering projects to improve sustainability
in the industry such as lightweight autobody
steels, life cycle assessments (LCA), and oth-
er megatrend topics. Lastly, the association
ensures that the industry has an aligned
message about the importance of steel to
modern society.
The steel industry enables the survival
of a modern sustainable society. Without
steel, it is not possible to meet the demands
for housing, transportation, efficient ener-
gy creation, and all the other activities that
modern society requires. The task of world-
steel ensures that steel as a product and
steel as an industry maintain its key role to
sustain modern society.
The future of our industry will be chal-
lenging. At least three areas of impact need to
be addressed. In the short term, the industry
is faced with supply imbalances in many parts
of the world that contribute to challenging
market conditions for our products. The glob-
al economy is unstable, in many cases still
trying to absorb the aftereffects of the global
financial crises of 2008-09. At the same time,
global economic activity is gradually shifting
to new geographical locations, following pop-
ulation growth and economic development
trends. Consequently, the steel industry has
to adjust with these geo-social trends. Sec-
ondly, growing environmental restrictions
will apply growing pressure on the steel
industry to effectively address the question
Ask the Guru: Roads Ahead for the Steel Industry
It is clear that steel use in China has reached
a point where future increases in steel use
are difficult to foresee. In that sense
the Chinese economy may be in the vicinity
of a steel use peak for the near future.
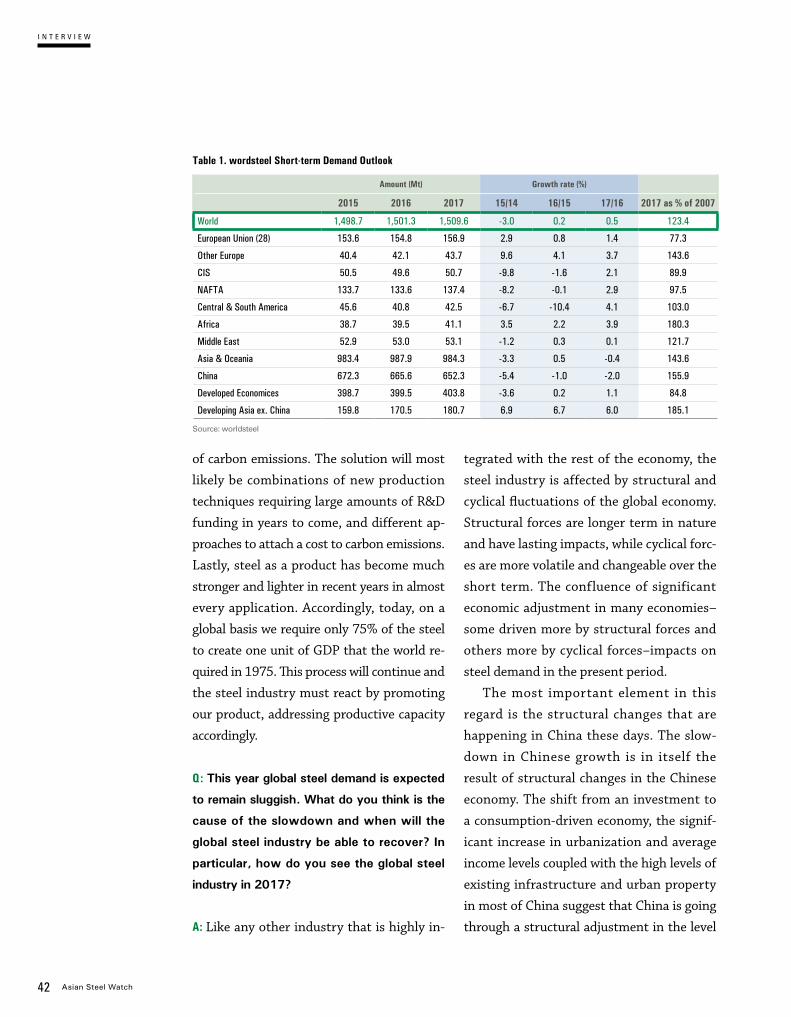
42 Asian Steel Watch
tegrated with the rest of the economy, the
steel industry is affected by structural and
cyclical fluctuations of the global economy.
Structural forces are longer term in nature
and have lasting impacts, while cyclical forc-
es are more volatile and changeable over the
short term. The confluence of significant
economic adjustment in many economies–
some driven more by structural forces and
others more by cyclical forces–impacts on
steel demand in the present period.
The most important element in this
regard is the structural changes that are
happening in China these days. The slow-
down in Chinese growth is in itself the
result of structural changes in the Chinese
economy. The shift from an investment to
a consumption-driven economy, the signif-
icant increase in urbanization and average
income levels coupled with the high levels of
existing infrastructure and urban property
in most of China suggest that China is going
through a structural adjustment in the level
I N T E R V I E W
of carbon emissions. The solution will most
likely be combinations of new production
techniques requiring large amounts of R&D
funding in years to come, and different ap-
proaches to attach a cost to carbon emissions.
Lastly, steel as a product has become much
stronger and lighter in recent years in almost
every application. Accordingly, today, on a
global basis we require only 75% of the steel
to create one unit of GDP that the world re-
quired in 1975. This process will continue and
the steel industry must react by promoting
our product, addressing productive capacity
accordingly.
Q: This year global steel demand is expected
to remain sluggish. What do you think is the
cause of the slowdown and when will the
global steel industry be able to recover? In
particular, how do you see the global steel
industry in 2017?
A: Like any other industry that is highly in-
Table 1. wordsteel Short-term Demand Outlook
Amount (Mt) Growth rate (%)
2015 2016 2017 15/14 16/15 17/16 2017 as % of 2007
World 1,498.7 1,501.3 1,509.6 -3.0 0.2 0.5 123.4
European Union (28) 153.6 154.8 156.9 2.9 0.8 1.4 77.3
Other Europe 40.4 42.1 43.7 9.6 4.1 3.7 143.6
CIS 50.5 49.6 50.7 -9.8 -1.6 2.1 89.9
NAFTA 133.7 133.6 137.4 -8.2 -0.1 2.9 97.5
Central & South America 45.6 40.8 42.5 -6.7 -10.4 4.1 103.0
Africa 38.7 39.5 41.1 3.5 2.2 3.9 180.3
Middle East 52.9 53.0 53.1 -1.2 0.3 0.1 121.7
Asia & Oceania 983.4 987.9 984.3 -3.3 0.5 -0.4 143.6
China 672.3 665.6 652.3 -5.4 -1.0 -2.0 155.9
Developed Economices 398.7 399.5 403.8 -3.6 0.2 1.1 84.8
Developing Asia ex. China 159.8 170.5 180.7 6.9 6.7 6.0 185.1
Source: worldsteel
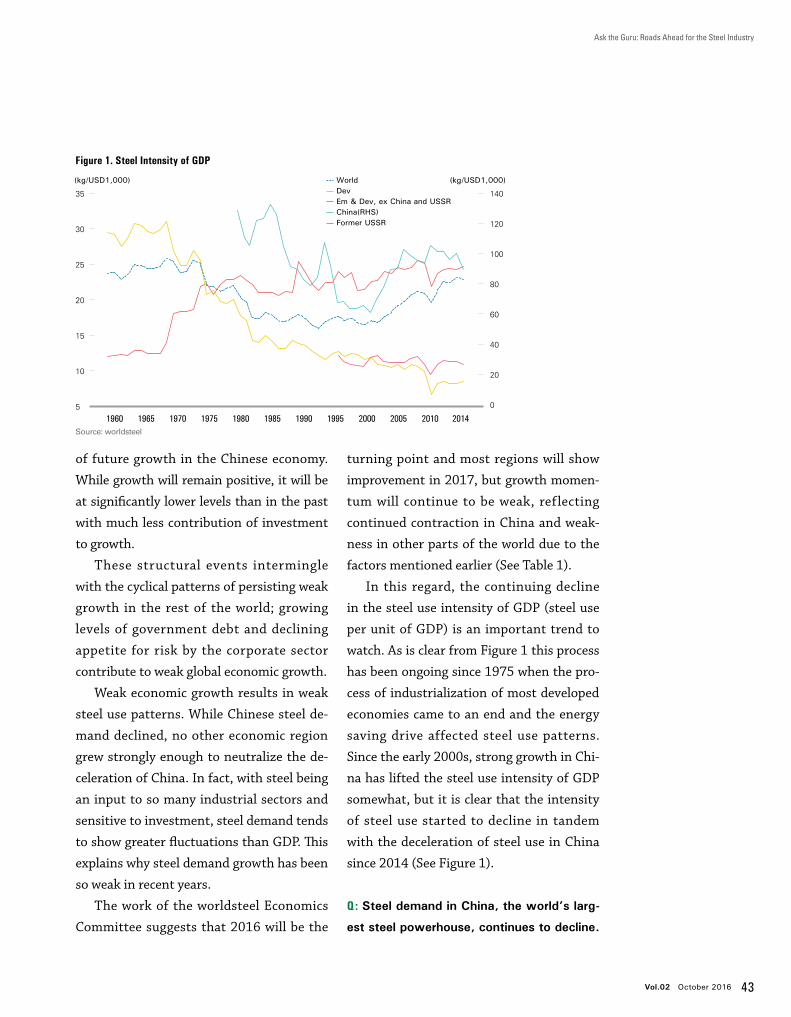
Vol.02 October 2016 43
of future growth in the Chinese economy.
While growth will remain positive, it will be
at significantly lower levels than in the past
with much less contribution of investment
to growth.
These structural events intermingle
with the cyclical patterns of persisting weak
growth in the rest of the world; growing
levels of government debt and declining
appetite for risk by the corporate sector
contribute to weak global economic growth.
Weak economic growth results in weak
steel use patterns. While Chinese steel de-
mand declined, no other economic region
grew strongly enough to neutralize the de-
celeration of China. In fact, with steel being
an input to so many industrial sectors and
sensitive to investment, steel demand tends
to show greater fluctuations than GDP. This
explains why steel demand growth has been
so weak in recent years.
The work of the worldsteel Economics
Committee suggests that 2016 will be the
turning point and most regions will show
improvement in 2017, but growth momen-
tum will continue to be weak, reflecting
continued contraction in China and weak-
ness in other parts of the world due to the
factors mentioned earlier (See Table 1).
In this regard, the continuing decline
in the steel use intensity of GDP (steel use
per unit of GDP) is an important trend to
watch. As is clear from Figure 1 this process
has been ongoing since 1975 when the pro-
cess of industrialization of most developed
economies came to an end and the energy
saving drive affected steel use patterns.
Since the early 2000s, strong growth in Chi-
na has lifted the steel use intensity of GDP
somewhat, but it is clear that the intensity
of steel use started to decline in tandem
with the deceleration of steel use in China
since 2014 (See Figure 1).
Q: Steel demand in China, the world’s larg-
est steel powerhouse, continues to decline.
1960 1970 1980 19901965 1975 1985 1995 2000 2005 2010 2014
Figure 1. Steel Intensity of GDP
(kg/USD1,000) (kg/USD1,000)
35
30
25
20
15
10
5
140
120
100
80
60
40
20
0
World Dev Em & Dev, ex China and USSR China(RHS) Former USSR
Ask the Guru: Roads Ahead for the Steel Industry
Source: worldsteel
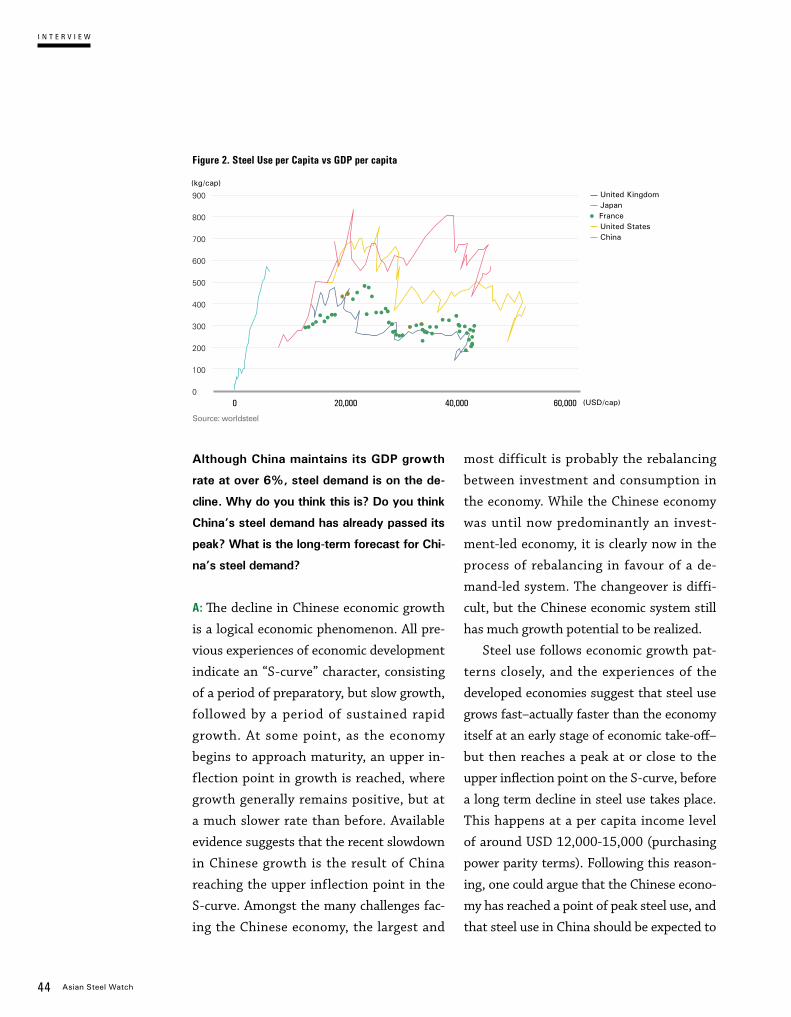
44 Asian Steel Watch
United Kingdom Japan
France United States China
I N T E R V I E W
most difficult is probably the rebalancing
between investment and consumption in
the economy. While the Chinese economy
was until now predominantly an invest-
ment-led economy, it is clearly now in the
process of rebalancing in favour of a de-
mand-led system. The changeover is diffi-
cult, but the Chinese economic system still
has much growth potential to be realized.
Steel use follows economic growth pat-
terns closely, and the experiences of the
developed economies suggest that steel use
grows fast–actually faster than the economy
itself at an early stage of economic take-off–
but then reaches a peak at or close to the
upper inflection point on the S-curve, before
a long term decline in steel use takes place.
This happens at a per capita income level
of around USD 12,000-15,000 (purchasing
power parity terms). Following this reason-
ing, one could argue that the Chinese econo-
my has reached a point of peak steel use, and
that steel use in China should be expected to
Although China maintains its GDP growth
rate at over 6%, steel demand is on the de-
cline. Why do you think this is? Do you think
China’s steel demand has already passed its
peak? What is the long-term forecast for Chi-
na’s steel demand?
A: The decline in Chinese economic growth
is a logical economic phenomenon. All pre-
vious experiences of economic development
indicate an “S-curve” character, consisting
of a period of preparatory, but slow growth,
followed by a period of sustained rapid
growth. At some point, as the economy
begins to approach maturity, an upper in-
flection point in growth is reached, where
growth generally remains positive, but at
a much slower rate than before. Available
evidence suggests that the recent slowdown
in Chinese growth is the result of China
reaching the upper inflection point in the
S-curve. Amongst the many challenges fac-
ing the Chinese economy, the largest and
Figure 2. Steel Use per Capita vs GDP per capita
(USD/cap)0 20,000 40,000 60,000
(kg/cap)
900
800
700
600
500
400
300
200
100
0
Source: worldsteel
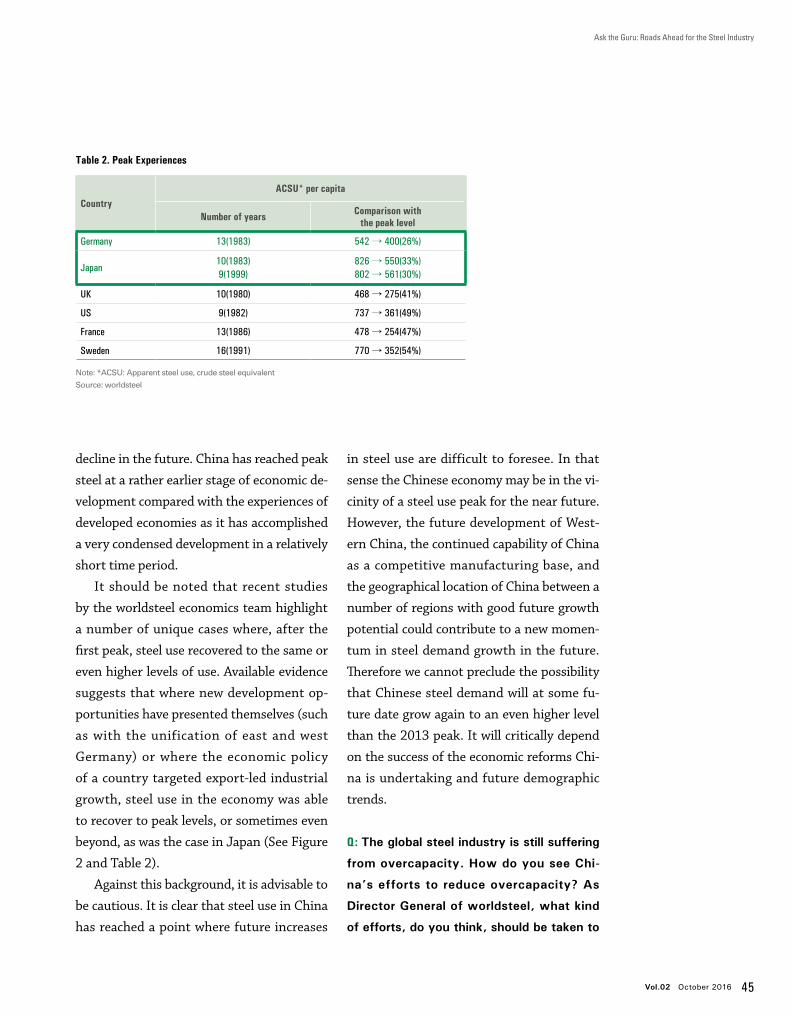
Vol.02 October 2016 45
decline in the future. China has reached peak
steel at a rather earlier stage of economic de-
velopment compared with the experiences of
developed economies as it has accomplished
a very condensed development in a relatively
short time period.
It should be noted that recent studies
by the worldsteel economics team highlight
a number of unique cases where, after the
first peak, steel use recovered to the same or
even higher levels of use. Available evidence
suggests that where new development op-
portunities have presented themselves (such
as with the unification of east and west
Germany) or where the economic policy
of a country targeted export-led industrial
growth, steel use in the economy was able
to recover to peak levels, or sometimes even
beyond, as was the case in Japan (See Figure
2 and Table 2).
Against this background, it is advisable to
be cautious. It is clear that steel use in China
has reached a point where future increases
in steel use are difficult to foresee. In that
sense the Chinese economy may be in the vi-
cinity of a steel use peak for the near future.
However, the future development of West-
ern China, the continued capability of China
as a competitive manufacturing base, and
the geographical location of China between a
number of regions with good future growth
potential could contribute to a new momen-
tum in steel demand growth in the future.
Therefore we cannot preclude the possibility
that Chinese steel demand will at some fu-
ture date grow again to an even higher level
than the 2013 peak. It will critically depend
on the success of the economic reforms Chi-
na is undertaking and future demographic
trends.
Q: The global steel industry is still suffering
from overcapacity. How do you see Chi-
na’s efforts to reduce overcapacity? As
Director General of worldsteel, what kind
of efforts, do you think, should be taken to
Table 2. Peak Experiences
CountryACSU* per capita
Number of years Comparison with the peak level
Germany 13(1983) 542 → 400(26%)
Japan10(1983) 9(1999)
826 → 550(33%)802 → 561(30%)
UK 10(1980) 468 → 275(41%)
US 9(1982) 737 → 361(49%)
France 13(1986) 478 → 254(47%)
Sweden 16(1991) 770 → 352(54%)
Ask the Guru: Roads Ahead for the Steel Industry
Source: worldsteel
Note: *ACSU: Apparent steel use, crude steel equivalent
46 Asian Steel Watch
I N T E R V I E W
cut overcapacity?
A: The key question in any discussion
around overcapacity is always how capacity
is or should be measured. The OECD, in its
effort to measure excess capacity, followed
a conservative approach by measuring
installed crude steel capacity against the
crude steel use in the same country or re-
gion. Where capacity surpassed crude steel
use, the country or region was deemed to
suffer excess capacity. While many criti-
cized this approach as too simplistic, as it
does not recognize the impact of produc-
tion yield losses, complex product routes,
maintenance, and other factors that make
it impossible to produce at full theoreti-
cal capacity, it is still the only metric that
treats all regions or countries in precisely
the same way. Against this metric, rough-
ly half of global excess capacity was to be
found in China–understandable as roughly
half of all steel production takes place in
China.
Nevertheless, reducing excess capacity is
never an easy task, largely because of many
hidden barriers to exit. Capacity reduction
can have a significant impact on the bal-
ance sheets of operating companies, and
are never popular with investors. Equally,
social impacts of capacity closure are never
popular with governments, labour unions
and the local communities and can turn out
to be very expensive in terms of redundan-
cy costs and maintaining a stable and well
trained work force. Lastly, the workforce
pays a large price in any capacity reduction,
as employment opportunities are always
reduced.
China has publically announced the
closure of up to 150 million tonnes over a
five year period–the only economy to have
publically set a target. It remains to be seen
if China will be successful, but with the de-
termination of the current government to
tackle the overcapacity problem and envi-
ronmental protection, we should trust that
China will be able to meet this target.
At worldsteel we know that excess ca-
pacity does have an adverse impact on the
steel industry. Foremost for worldsteel is
to insist that industry restructuring should
take place on a “level playing field” principle
and that restructuring should follow similar
principles wherever it is done. To that effect,
worldsteel members have agreed to the fol-
lowing principles on restructuring:
Governments should promote a swift and
timely restructuring of the steel industry
We are to a large degree already living in
an era where Asia leads the steel industry.
Today, steel use is predominantly in Asia,
which accounts for 65 % of global steel use.
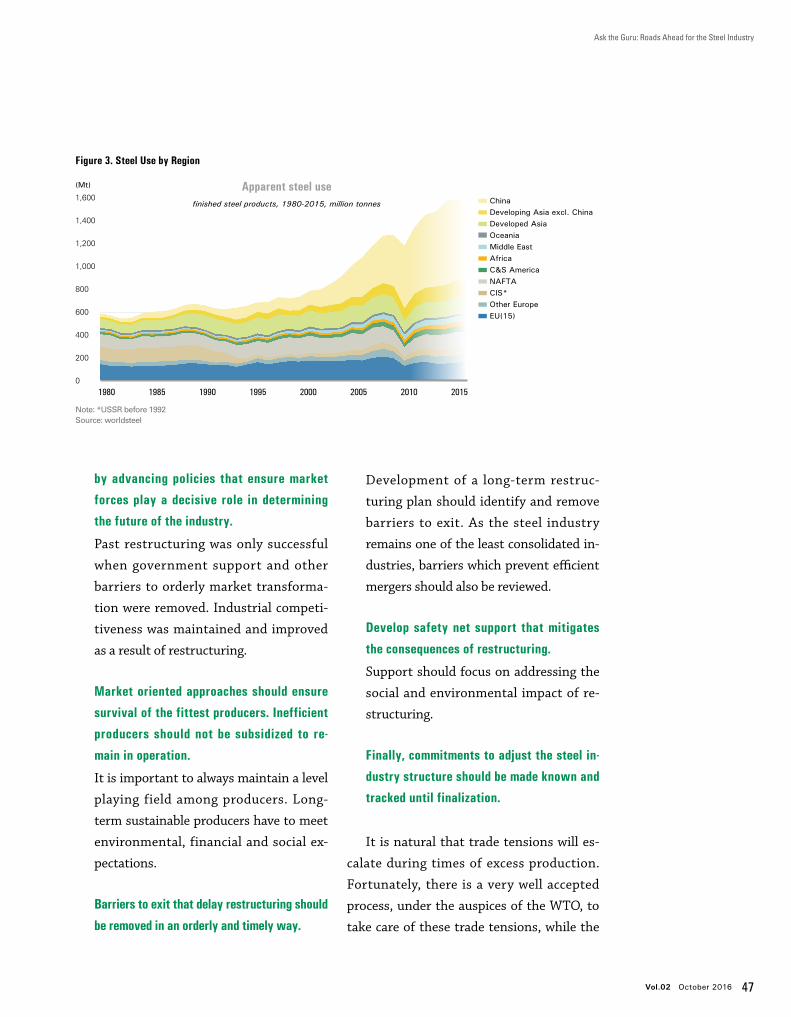
Vol.02 October 2016 47
by advancing policies that ensure market
forces play a decisive role in determining
the future of the industry.
Past restructuring was only successful
when government support and other
barriers to orderly market transforma-
tion were removed. Industrial competi-
tiveness was maintained and improved
as a result of restructuring.
Market oriented approaches should ensure
survival of the fittest producers. Inefficient
producers should not be subsidized to re-
main in operation.
It is important to always maintain a level
playing field among producers. Long-
term sustainable producers have to meet
environmental, financial and social ex-
pectations.
Barriers to exit that delay restructuring should
be removed in an orderly and timely way.
Development of a long-term restruc-
turing plan should identify and remove
barriers to exit. As the steel industry
remains one of the least consolidated in-
dustries, barriers which prevent efficient
mergers should also be reviewed.
Develop safety net support that mitigates
the consequences of restructuring.
Support should focus on addressing the
social and environmental impact of re-
structuring.
Finally, commitments to adjust the steel in-
dustry structure should be made known and
tracked until finalization.
It is natural that trade tensions will es-
calate during times of excess production.
Fortunately, there is a very well accepted
process, under the auspices of the WTO, to
take care of these trade tensions, while the
Figure 3. Steel Use by Region
1980 1985 1990 1995 2000 2005 2010 2015
(Mt)
1,600
1,400
1,200
1,000
800
600
400
200
0
China Developing Asia excl. China Developed Asia Oceania Middle East Africa C&S America NAFTA CIS* Other Europe EU(15)
Apparent steel use finished steel products, 1980-2015, million tonnes
Note: *USSR before 1992Source: worldsteel
Ask the Guru: Roads Ahead for the Steel Industry
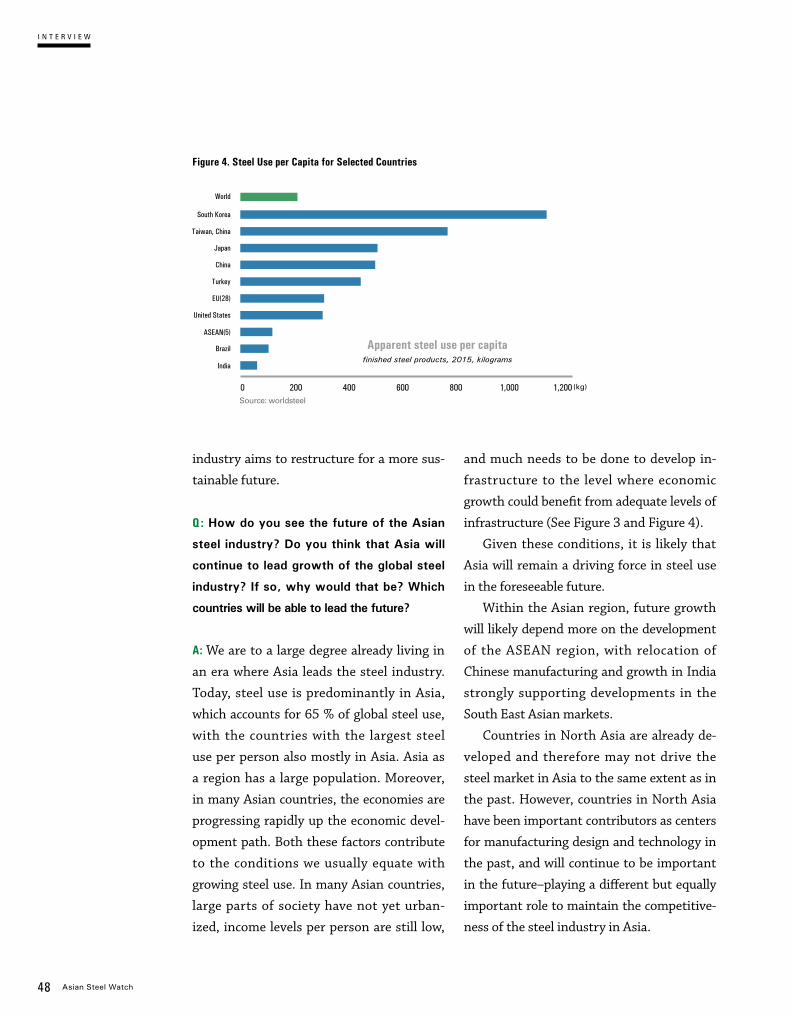
48 Asian Steel Watch
industry aims to restructure for a more sus-
tainable future.
Q: How do you see the future of the Asian
steel industry? Do you think that Asia will
continue to lead growth of the global steel
industry? If so, why would that be? Which
countries will be able to lead the future?
A: We are to a large degree already living in
an era where Asia leads the steel industry.
Today, steel use is predominantly in Asia,
which accounts for 65 % of global steel use,
with the countries with the largest steel
use per person also mostly in Asia. Asia as
a region has a large population. Moreover,
in many Asian countries, the economies are
progressing rapidly up the economic devel-
opment path. Both these factors contribute
to the conditions we usually equate with
growing steel use. In many Asian countries,
large parts of society have not yet urban-
ized, income levels per person are still low,
and much needs to be done to develop in-
frastructure to the level where economic
growth could benefit from adequate levels of
infrastructure (See Figure 3 and Figure 4).
Given these conditions, it is likely that
Asia will remain a driving force in steel use
in the foreseeable future.
Within the Asian region, future growth
will likely depend more on the development
of the ASEAN region, with relocation of
Chinese manufacturing and growth in India
strongly supporting developments in the
South East Asian markets.
Countries in North Asia are already de-
veloped and therefore may not drive the
steel market in Asia to the same extent as in
the past. However, countries in North Asia
have been important contributors as centers
for manufacturing design and technology in
the past, and will continue to be important
in the future–playing a different but equally
important role to maintain the competitive-
ness of the steel industry in Asia.
Figure 4. Steel Use per Capita for Selected Countries
(kg)0 200 400 800600 1,000 1,200
South Korea
Taiwan, China
Japan
China
Turkey
EU(28)
United States
ASEAN(5)
Brazil
India
World
Apparent steel use per capitafinished steel products, 2015, kilograms
Source: worldsteel
I N T E R V I E W
Vol.02 October 2016 49
The interlinkages in the manufacturing
capabilities between countries in the Asia
region will remain important to support
the growth of steel use in the region. An
open trade regime, allowing countries to
invest in different areas and technologies
will contribute to enduring economic de-
velopment in the region, and thereby main-
tain the leadership role for the Asian steel
industry.
Other regions, such as the Middle East
and Africa, may grow equally fast in terms of
steel use, but the present size of these mar-
kets is not sufficient to challenge the global
leadership of Asia as a region.
Q: The Fourth Industrial Revolution is herald-
ing a new future. Innovation through IoT,
big data, and smart factories will bring new
changes to manufacturing. What kind of
influence will the steel industry have from
these changes? Do you think that steel
companies will actively accommodate these
changes in the near future?
A: The steel industry has a long history of
technological adaptation and product in-
novation. Today, the industry is already
extremely efficient in iron and steel making,
as well as processing. Energy requirements
in the steel making process are the lowest of
all industrial metals, while process yields are
already high and continuously increasing.
Within this environment, the Fourth Indus-
trial Revolution could continue to play an
important role, but additional progress will
be incremental owing to the already high
level of technological achievement. Progress
is always possible.
It is rather in the field of the use of steel
in applications that the Fourth Industrial
Revolution could play an important role.
Better understanding of customer require-
ments and possible improvements in the
manufacturing processes converting steel
into consumer applications could potential-
ly have a large impact on the steel industry.
Today, after achieving high process and
quality yields in the steelmaking process,
it is not uncommon to discard as much as
30% of high quality steel as waste during
the process of using steel to produce con-
sumer products. The Fourth Industrial
Revolution may influence the design and
production of consumer goods to the extent
that waste is reduced, and the lifetime of
steel in use increases. Both these possibili-
ties may reduce the steel in use per person,
but provide opportunities for the steel in-
dustry to position its product as extremely
durable and environmentally friendly and
therefore a product to be sold and marketed
in completely new ways in the future. It is
therefore quite possible that the Fourth In-
dustrial Revolution will have little direct in-
fluence on the steel industry, other than to
make production control more disciplined.
The indirect influence through changing the
manufacturing process and product design
of items requiring steel as an input may
have a vastly more influential role in the
steel industry, as the ways that the product
is delivered to the customer could change
dramatically.
Ask the Guru: Roads Ahead for the Steel Industry
50 Asian Steel Watch
Special Report
Professor Dong Joon MINDepartment of Materials Science and EngineeringYonsei [email protected]
Executive Summary
Since the beginning of the ironmaking process at Caucasus from about 2000 B.C,
the iron and steelmaking technology has been one of the underlying foundations
responsible for the modern day civilization and human advancement. It is generally
accepted that the blast furnace technology was established to be a typical maxi-
mill process route with the implementation of the basic oxygen steelmaking
technology. However, the needs of diversification of raw materials and flexibility of
process will accelerate the development of an alternative midi-mill ironmaking route
by hybridization of individually optimized steelmaking technologies. The recent
concept for hybridization is comprised of the FINEX and CEM technologies with
particular attention for allowing a sustainable midi-mill process with high flexibility.
The hybridization of the FINEX and CEM processes can provide high versatility by
combining the advantages of their technological characteristics.
Global Competitiveness Through Hybridization of FINEX and CEM Processes
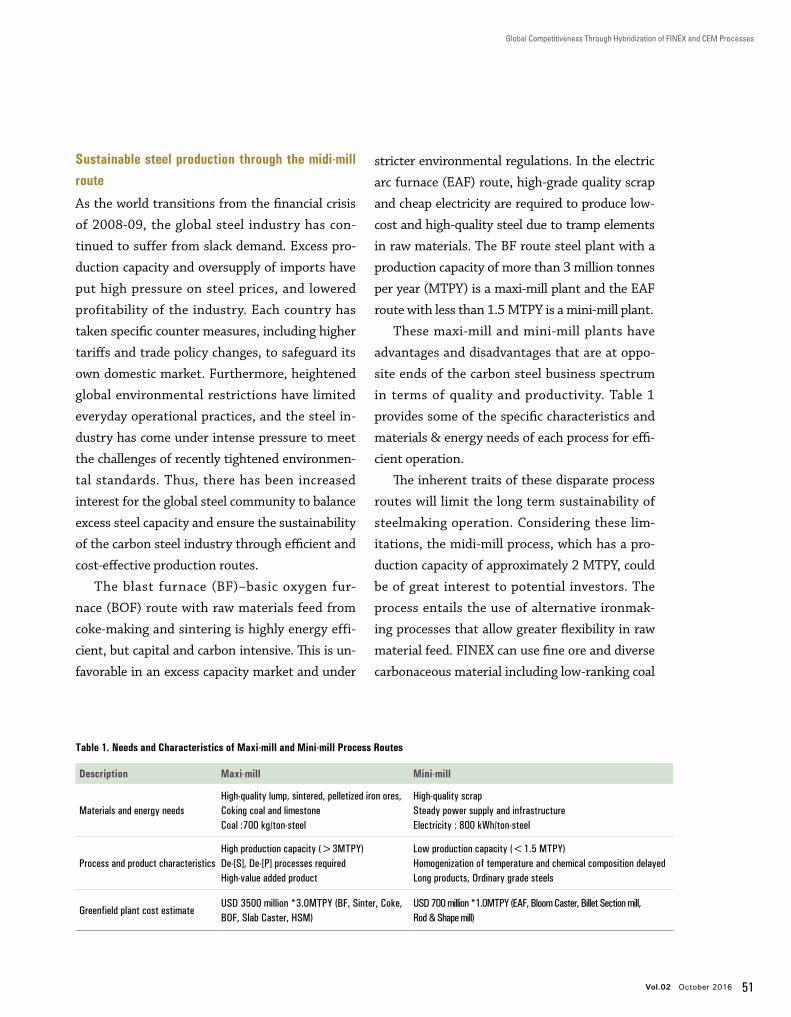
Vol.02 October 2016 51
Global Competitiveness Through Hybridization of FINEX and CEM Processes
Sustainable steel production through the midi-mill route
As the world transitions from the financial crisis
of 2008-09, the global steel industry has con-
tinued to suffer from slack demand. Excess pro-
duction capacity and oversupply of imports have
put high pressure on steel prices, and lowered
profitability of the industry. Each country has
taken specific counter measures, including higher
tariffs and trade policy changes, to safeguard its
own domestic market. Furthermore, heightened
global environmental restrictions have limited
everyday operational practices, and the steel in-
dustry has come under intense pressure to meet
the challenges of recently tightened environmen-
tal standards. Thus, there has been increased
interest for the global steel community to balance
excess steel capacity and ensure the sustainability
of the carbon steel industry through efficient and
cost-effective production routes.
The blast furnace (BF)–basic oxygen fur-
nace (BOF) route with raw materials feed from
coke-making and sintering is highly energy effi-
cient, but capital and carbon intensive. This is un-
favorable in an excess capacity market and under
stricter environmental regulations. In the electric
arc furnace (EAF) route, high-grade quality scrap
and cheap electricity are required to produce low-
cost and high-quality steel due to tramp elements
in raw materials. The BF route steel plant with a
production capacity of more than 3 million tonnes
per year (MTPY) is a maxi-mill plant and the EAF
route with less than 1.5 MTPY is a mini-mill plant.
These maxi-mill and mini-mill plants have
advantages and disadvantages that are at oppo-
site ends of the carbon steel business spectrum
in terms of quality and productivity. Table 1
provides some of the specific characteristics and
materials & energy needs of each process for effi-
cient operation.
The inherent traits of these disparate process
routes will limit the long term sustainability of
steelmaking operation. Considering these lim-
itations, the midi-mill process, which has a pro-
duction capacity of approximately 2 MTPY, could
be of great interest to potential investors. The
process entails the use of alternative ironmak-
ing processes that allow greater flexibility in raw
material feed. FINEX can use fine ore and diverse
carbonaceous material including low-ranking coal
Table 1. Needs and Characteristics of Maxi-mill and Mini-mill Process Routes
Description Maxi-mill Mini-mill
Materials and energy needsHigh-quality lump, sintered, pelletized iron ores, Coking coal and limestoneCoal :700 kg/ton-steel
High-quality scrapSteady power supply and infrastructureElectricity : 800 kWh/ton-steel
Process and product characteristicsHigh production capacity (>3MTPY)De-[S], De-[P] processes requiredHigh-value added product
Low production capacity (<1.5 MTPY)Homogenization of temperature and chemical composition delayed Long products, Ordinary grade steels
Greenfield plant cost estimateUSD 3500 million *3.0MTPY (BF, Sinter, Coke, BOF, Slab Caster, HSM)
USD 700 million *1.0MTPY (EAF, Bloom Caster, Billet Section mill, Rod & Shape mill)
52 Asian Steel Watch
Special Report
and fine coke made by 100% semi-coking coal,
which are not used in the blast furnace operation.
Therefore, a steel company which has operated
BF can create synergy by adopting FINEX. This
alternative midi-mill process route would be
highly cost effective, considering capital and envi-
ronmental costs associated with the coke-making
and sintering operations, electricity costs and
supply limit of high-quality scrap, and the de-
mand for higher value-added steels.
The commercially proven alternative iron-
making processes with 1.5-2 MTPY capacity are
the Midrex and the HYL (Hojalata y Lamina) and
the FINEX process. The Midrex and the HYL pro-
cesses typically utilize natural or shale gas, which
have been reformed into enriched H₂ and CO gas-
es that provide reducing agents for full indirect
reduction of iron ore. They are unable to treat
iron ore fines and powder and are typically oper-
ated with pellets or lumpy ores to produce solid
direct reduced iron (DRI). This DRI product can
be fed into the EAF at moderately high tempera-
tures above 600℃ with varying carbon contents
less than 3 wt% by a specialized transport system
at an additional cost. In the FINEX process, iron
ore fines are directly charged into the fluidized
bed reactor, partially reduced with CO and H₂
gases generated from the coal and oxygen reac-
tion in the melter-gasifier, and subsequently fully
reduced within the melter-gasifier. Unlike DRI
production of the Midrex and the HYL, FINEX
produces hot metal in the liquid state, which is
comparatively simpler to handle than the hot sol-
id DRI transport and expedites rapid heat trans-
fer to the scrap in the steelmaking process. While
the Midrex and the HYL are batch processes,
FINEX is a continuous process and typically yields
greater productivity. Thus, the FINEX process
can be better positioned than the Midrex and the
HYL in terms of operational flexibility and energy
consumption for producing iron.
To achieve high throughput, the midi-mill
operation can introduce high speed casting
and endless rolling technology. According to
research in the conventional batch rolling pro-
cesses, the strips at the head and tail ends are
The FINEX process can be better positioned than the Midrex and the HYL in terms of
operational flexibility and energy consumption for producing iron.
To achieve high throughput, the midi-mill operation can introduce high speed casting
and endless rolling technology.
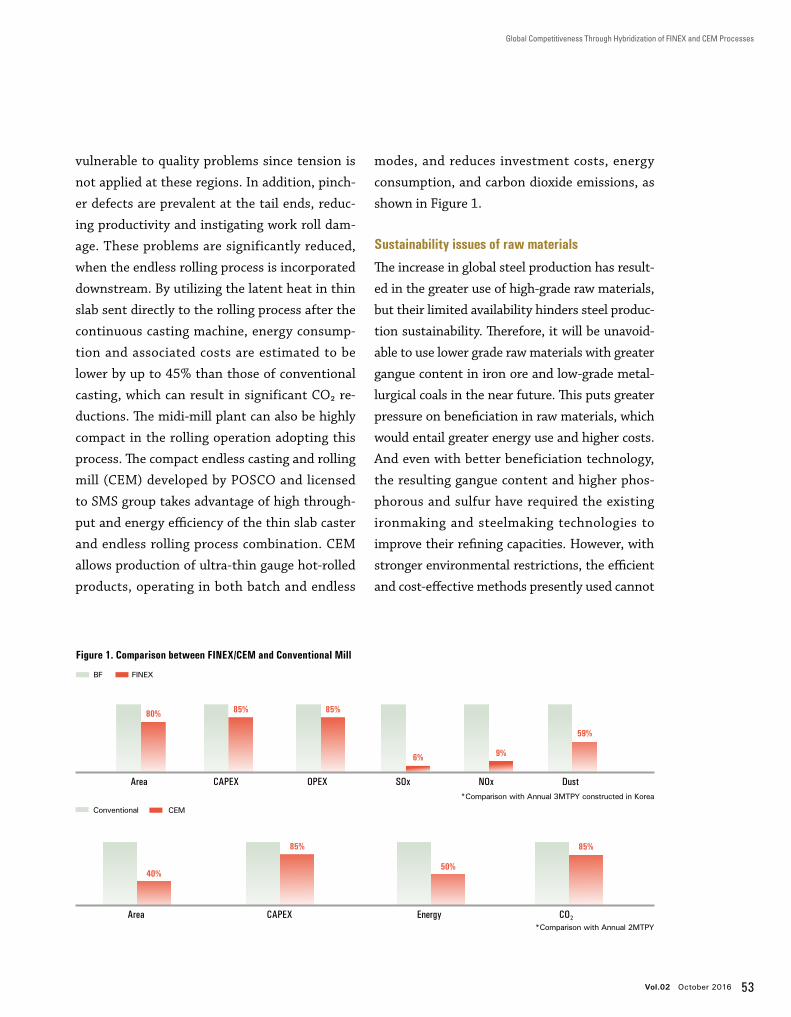
Vol.02 October 2016 53
Global Competitiveness Through Hybridization of FINEX and CEM Processes
vulnerable to quality problems since tension is
not applied at these regions. In addition, pinch-
er defects are prevalent at the tail ends, reduc-
ing productivity and instigating work roll dam-
age. These problems are significantly reduced,
when the endless rolling process is incorporated
downstream. By utilizing the latent heat in thin
slab sent directly to the rolling process after the
continuous casting machine, energy consump-
tion and associated costs are estimated to be
lower by up to 45% than those of conventional
casting, which can result in significant CO₂ re-
ductions. The midi-mill plant can also be highly
compact in the rolling operation adopting this
process. The compact endless casting and rolling
mill (CEM) developed by POSCO and licensed
to SMS group takes advantage of high through-
put and energy efficiency of the thin slab caster
and endless rolling process combination. CEM
allows production of ultra-thin gauge hot-rolled
products, operating in both batch and endless
modes, and reduces investment costs, energy
consumption, and carbon dioxide emissions, as
shown in Figure 1.
Sustainability issues of raw materials
The increase in global steel production has result-
ed in the greater use of high-grade raw materials,
but their limited availability hinders steel produc-
tion sustainability. Therefore, it will be unavoid-
able to use lower grade raw materials with greater
gangue content in iron ore and low-grade metal-
lurgical coals in the near future. This puts greater
pressure on beneficiation in raw materials, which
would entail greater energy use and higher costs.
And even with better beneficiation technology,
the resulting gangue content and higher phos-
phorous and sulfur have required the existing
ironmaking and steelmaking technologies to
improve their refining capacities. However, with
stronger environmental restrictions, the efficient
and cost-effective methods presently used cannot
Figure 1. Comparison between FINEX/CEM and Conventional Mill
80% 85% 85%
6% 9%
59%
Area CAPEX OPEX SOx NOx Dust
FINEXBF
*Comparison with Annual 2MTPY
*Comparison with Annual 3MTPY constructed in Korea
40%
Area CAPEX Energy CO2
85%
50%
85%
Conventional CEM
54 Asian Steel Watch
Special Report
overcome this increased impurity contained in
raw materials.
Higher gangue content in raw materials re-
quires greater input of limestone to counteract
and balance the composition of slag for optimal
fluidity and separation of slag from metal. Unfor-
tunately, the addition of fluxes to counteract the
increased gangue content will result in the great-
er slag volume, which will limit the production ca-
pacity of the reactor. In addition, slag will require
more heating and greater carbon usage, resulting
in lower energy efficiency and greater CO₂ emis-
sions. Also, depending on the ore particle size
and strength of low-grade raw materials in the
maxi-mill process route, significant operational
issues may arise. Thus, for the maxi-mill process
incorporating the blast furnace, the availability of
high-quality raw materials is necessary for opti-
mal and cost-effective operations.
High-quality steel scraps for the production
of higher value-added steel products must be
satisfied in the long term for sustainable mini-
mill operations. As consumer products rely more
on electronics, information technology products,
and pre-cooked foods, the available scrap can
contain significant amounts of tramp elements,
copper, and tin, which are difficult to remove un-
der the oxidizing atmosphere of typical refining
operations. Alternative iron units are typically
added to the mini-mill process to substitute
scrap, when high-quality steel products are need-
ed. Iron units of DRI or hot briquetted iron (HBI)
can be used or, if available, pig iron units can be
utilized. The addition of large amounts of iron
units with high carbon content can result in the
greater need of oxygen injection and lower ener-
gy consumption
Sustainability issues of energy and the environment
According to a report by the International Energy
Agency (IEA), global renewable energy accounts
for only 10% of power generation. The bulk of
energy production still comes from coal and oil,
which emit significant amounts of CO₂. Unlike
the maxi-mill process, where most of the CO₂ is
direct CO₂ from carbon use for energy and reduc-
Future process should adopt a process route that lies somewhere between the
maxi-mill and mini-mills, that is, a midi-mill configuration with a production capacity
over 2 MTPY and operational flexibility.

Vol.02 October 2016 55
Global Competitiveness Through Hybridization of FINEX and CEM Processes
tion, the mini-mill process utilizes electricity and
this particular process route emits indirect CO₂.
It is well established that approximately 1.8 ton
CO₂/ton-HM is generated in the maxi-mill and 1.1
ton CO₂/ton-HM is generated in the mini-mill.
During the 2015 United Nations Climate
Change Conference or COP21 held in Paris,
member countries agreed on a common carbon
trading scheme that would affect the global CO₂
emissions. The pricing of excess CO₂ would see
uniform costs charged for every ton of excess
CO₂ emitted beyond the allocated amount set
forth by the individual countries. This eventual-
ly would lead to significant cost issues due to en-
vironmental regulations and thus process routes
capable of lowering the CO₂ emissions would
be highly favored. Unfortunately for the blast
furnace, the dominance of coke as the energy
and reductant source in the maxi-mill process
limits its reducing potential of CO₂ emissions in
the long term. The recent progress with top-gas
recycling and hydrogen-containing gas injection
into the furnace allows to lower CO₂ emissions,
but its effect has yet to be tested in the commer-
cial scale.
Operational flexibility during economic up- and down-turns
Global steel production exceeded 1.6 billion
tonnes in 2015 and excess capacity has reduced
the profitability of steel companies. Excess supply
in the market has dragged down steel prices and
overcompetition has led to the dumping of steel
products into foreign markets, disrupting normal
market conditions. Thus, cost-effective reduction
in steel production is necessary during a down-
turn.
For the maxi-mill process, the BF is limited in
decreasing the capacity below 90% of total pro-
duction capacity to maintain cost-effectiveness.
The mini-mill process, on the other hand, has ro-
bust flexibility in start-up and shut-down of oper-
ations. Depending on market conditions, the EAF
can be shut down for intermittent periods and
restarted. When power outages occurred in the
late 2010, EAF was operated only during week-
ends to lower power burden. However, the mini-
mill process has a limited production capacity
during economic up-turns, when the maximum
production capacity is needed. Therefore, future
process should have sufficient production during
economic up-turns and have flexibility to control
production during economic down-turns. This
suggests that future process should adopt a pro-
cess route that lies somewhere between the maxi-
mill and mini-mills; that is, a midi-mill configura-
tion with a production capacity over 2 MTPY and
operational flexibility.
Hybridization of individually optimized processes to create synergy
In proposing the next generation midi-mill pro-
cess with high productivity and flexibility, the
FINEX alternative ironmaking technology can be
connected to the EAF or BOF, as shown in Figure
2. Hot metal produced from the melter-gasifier
of FINEX has comparable chemical composition
to the products from the BF. Table 2 shows the
typical composition of hot metal and slag of
FINEX. Similar to the BF process routes, FINEX
can be connected to the BOF for primary refin-
ing and decarburization to attain a production
capacity of approximately 2 MTPY. FINEX can
also be connected to the EAF, where hot metal is
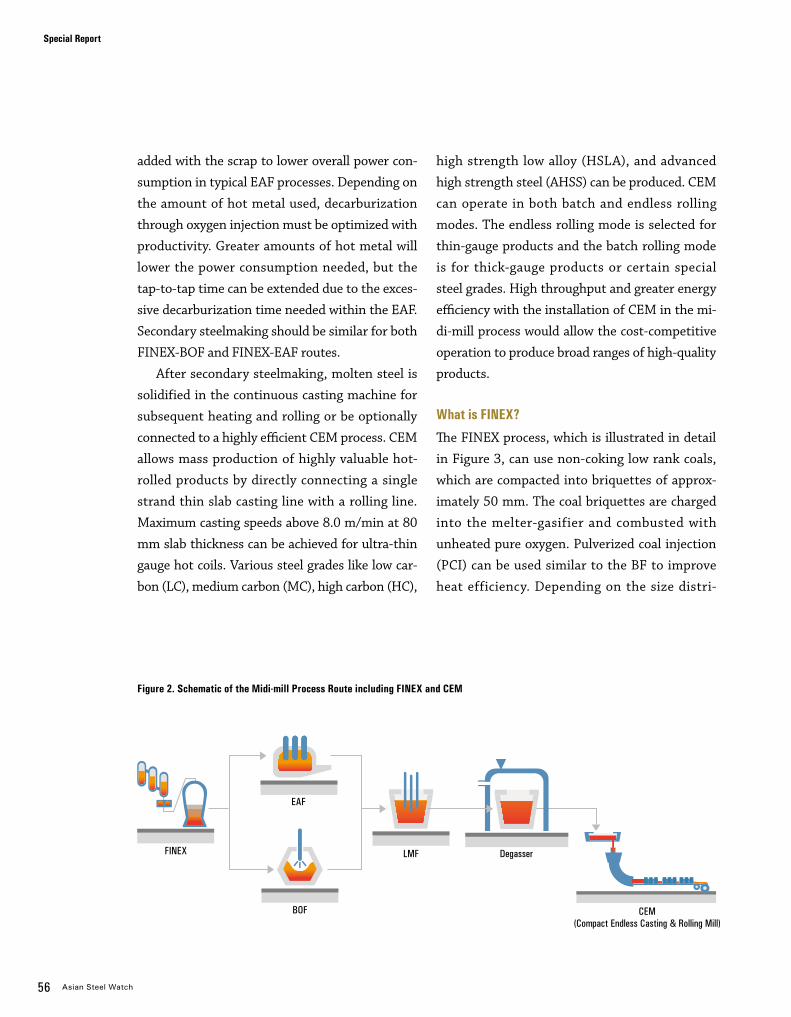
56 Asian Steel Watch
Special Report
added with the scrap to lower overall power con-
sumption in typical EAF processes. Depending on
the amount of hot metal used, decarburization
through oxygen injection must be optimized with
productivity. Greater amounts of hot metal will
lower the power consumption needed, but the
tap-to-tap time can be extended due to the exces-
sive decarburization time needed within the EAF.
Secondary steelmaking should be similar for both
FINEX-BOF and FINEX-EAF routes.
After secondary steelmaking, molten steel is
solidified in the continuous casting machine for
subsequent heating and rolling or be optionally
connected to a highly efficient CEM process. CEM
allows mass production of highly valuable hot-
rolled products by directly connecting a single
strand thin slab casting line with a rolling line.
Maximum casting speeds above 8.0 m/min at 80
mm slab thickness can be achieved for ultra-thin
gauge hot coils. Various steel grades like low car-
bon (LC), medium carbon (MC), high carbon (HC),
high strength low alloy (HSLA), and advanced
high strength steel (AHSS) can be produced. CEM
can operate in both batch and endless rolling
modes. The endless rolling mode is selected for
thin-gauge products and the batch rolling mode
is for thick-gauge products or certain special
steel grades. High throughput and greater energy
efficiency with the installation of CEM in the mi-
di-mill process would allow the cost-competitive
operation to produce broad ranges of high-quality
products.
What is FINEX?
The FINEX process, which is illustrated in detail
in Figure 3, can use non-coking low rank coals,
which are compacted into briquettes of approx-
imately 50 mm. The coal briquettes are charged
into the melter-gasifier and combusted with
unheated pure oxygen. Pulverized coal injection
(PCI) can be used similar to the BF to improve
heat efficiency. Depending on the size distri-
Figure 2. Schematic of the Midi-mill Process Route including FINEX and CEM
FINEX
BOF
EAF
LMF Degasser
CEM(Compact Endless Casting & Rolling Mill)
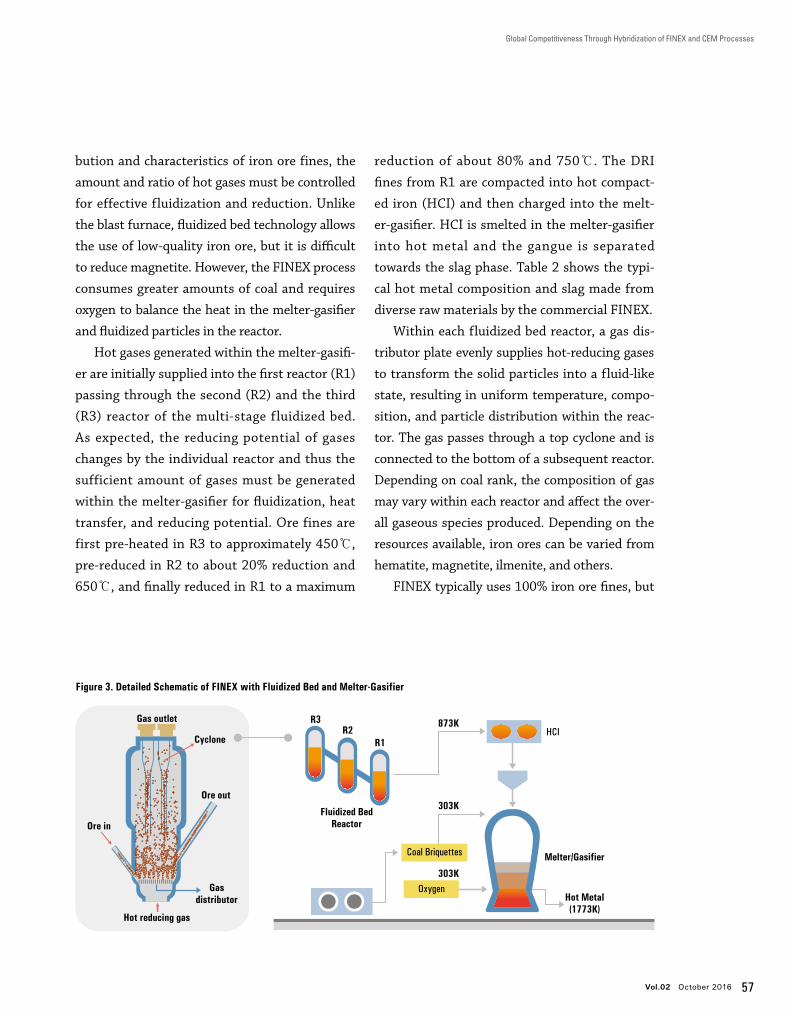
Vol.02 October 2016 57
Global Competitiveness Through Hybridization of FINEX and CEM Processes
bution and characteristics of iron ore fines, the
amount and ratio of hot gases must be controlled
for effective fluidization and reduction. Unlike
the blast furnace, fluidized bed technology allows
the use of low-quality iron ore, but it is difficult
to reduce magnetite. However, the FINEX process
consumes greater amounts of coal and requires
oxygen to balance the heat in the melter-gasifier
and fluidized particles in the reactor.
Hot gases generated within the melter-gasifi-
er are initially supplied into the first reactor (R1)
passing through the second (R2) and the third
(R3) reactor of the multi-stage fluidized bed.
As expected, the reducing potential of gases
changes by the individual reactor and thus the
sufficient amount of gases must be generated
within the melter-gasifier for fluidization, heat
transfer, and reducing potential. Ore fines are
first pre-heated in R3 to approximately 450℃,
pre-reduced in R2 to about 20% reduction and
650℃, and finally reduced in R1 to a maximum
reduction of about 80% and 750℃. The DRI
fines from R1 are compacted into hot compact-
ed iron (HCI) and then charged into the melt-
er-gasifier. HCI is smelted in the melter-gasifier
into hot metal and the gangue is separated
towards the slag phase. Table 2 shows the typi-
cal hot metal composition and slag made from
diverse raw materials by the commercial FINEX.
Within each fluidized bed reactor, a gas dis-
tributor plate evenly supplies hot-reducing gases
to transform the solid particles into a fluid-like
state, resulting in uniform temperature, compo-
sition, and particle distribution within the reac-
tor. The gas passes through a top cyclone and is
connected to the bottom of a subsequent reactor.
Depending on coal rank, the composition of gas
may vary within each reactor and affect the over-
all gaseous species produced. Depending on the
resources available, iron ores can be varied from
hematite, magnetite, ilmenite, and others.
FINEX typically uses 100% iron ore fines, but
Coal Briquettes Melter/Gasifier
Hot Metal (1773K)
Gas outlet
Cyclone
Gasdistributor
Ore out
Ore in
Figure 3. Detailed Schematic of FINEX with Fluidized Bed and Melter-Gasifier
HCI
Oxygen303K
303K
873K
Fluidized BedReactor
R1R2
R3
Hot reducing gas
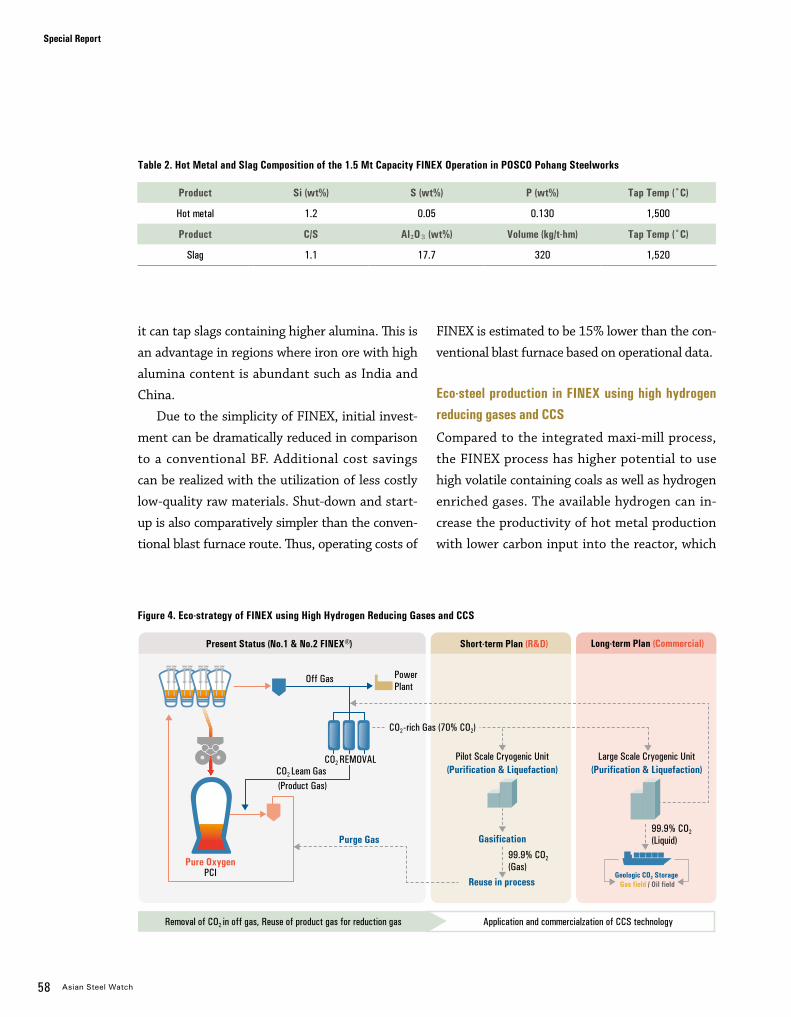
58 Asian Steel Watch
Special Report
Short-term Plan (R&D) Long-term Plan (Commercial)
Removal of CO2 in off gas, Reuse of product gas for reduction gas Application and commercialzation of CCS technology
Pure Oxygen PCI
Off Gas
CO2 Leam Gas (Product Gas)
Purge Gas
Pilot Scale Cryogenic Unit(Purification & Liquefaction)
PowerPlant
CO2 REMOVAL
Geologic CO2 Storage Gas field / Oil fieldReuse in process
Gasification
CO2 -rich Gas (70% CO2)
Large Scale Cryogenic Unit(Purification & Liquefaction)
Present Status (No.1 & No.2 FINEX®)
99.9% CO2
(Gas)
99.9% CO2
(Liquid)
Figure 4. Eco-strategy of FINEX using High Hydrogen Reducing Gases and CCS
it can tap slags containing higher alumina. This is
an advantage in regions where iron ore with high
alumina content is abundant such as India and
China.
Due to the simplicity of FINEX, initial invest-
ment can be dramatically reduced in comparison
to a conventional BF. Additional cost savings
can be realized with the utilization of less costly
low-quality raw materials. Shut-down and start-
up is also comparatively simpler than the conven-
tional blast furnace route. Thus, operating costs of
FINEX is estimated to be 15% lower than the con-
ventional blast furnace based on operational data.
Eco-steel production in FINEX using high hydrogen reducing gases and CCS
Compared to the integrated maxi-mill process,
the FINEX process has higher potential to use
high volatile containing coals as well as hydrogen
enriched gases. The available hydrogen can in-
crease the productivity of hot metal production
with lower carbon input into the reactor, which
Product Si (wt%) S (wt%) P (wt%) Tap Temp (�C)
Hot metal 1.2 0.05 0.130 1,500
Product C/S Al₂O₃(wt%) Volume (kg/t-hm) Tap Temp (�C)
Slag 1.1 17.7 320 1,520
Table 2. Hot Metal and Slag Composition of the 1.5 Mt Capacity FINEX Operation in POSCO Pohang Steelworks
Vol.02 October 2016 59
Global Competitiveness Through Hybridization of FINEX and CEM Processes
can be highly advantageous as global environ-
mental regulations become increasingly stringent
and carbon tax trading schemes become more
common.
Typical strategies for future steelmakers will
likely require alternative ironmaking units that
can supply hot metal to the converter with less
carbon footprint. The obvious choice to satisfy
these conditions will likely be the FINEX process,
as illustrated in Figure 4.
Similar to the BF process, generation of CO₂
gas from FINEX is inevitable due to the use of
coal, which is the main heat source and reducing
agent. Therefore, reducing the amount of CO₂
emissions is one of the main priorities of FINEX.
If a commercial scale, cost-effective carbon
capture and storage (CCS) technology is devel-
oped, FINEX will likely be the most favorable pro-
cess to reduce CO₂ emissions. This is due to the
simpler application of the CCS technology to the
FINEX operation since it uses pure oxygen, which
enriches the CO₂ exit-gas and the recycling tech-
nology of off-gas after separating CO₂ from the
pressure swing absorption (PSA) system which
currently exists.
What is so special about CEM?
In the early 1990s, the mini-mill process and sub-
sequently the EAF technology was in the spot-
light for its robustness in small scale production
with wide product variation at greater energy ef-
ficiency and lower carbon emissions. POSCO op-
erated the in-line strip production (ISP) mini-mill
plant for producing commercial steel from 1996
at Gwangyang Steelworks. Facing limitations in
manufacturing high-quality thin gauge products,
it underwent a revamp from a two strand to one
strand caster. This required POSCO to invest in
the development of high-speed casting technol-
ogy to balance the mass throughput of the caster
and hot-rolling mill. As a result of this effort, the
current CEM was developed in 2011 with the in-
stallation of a high speed shear that enables end-
less rolling. The details of the CEM process con-
figuration are shown in Figure 5. A single-strand
casting and a single-strand rolling are directly
Due to the simplicity of FINEX, initial investment can be dramatically reduced
in comparison to a conventional BF. Additional cost savings can be realized
with the utilization of less costly low quality raw materials.
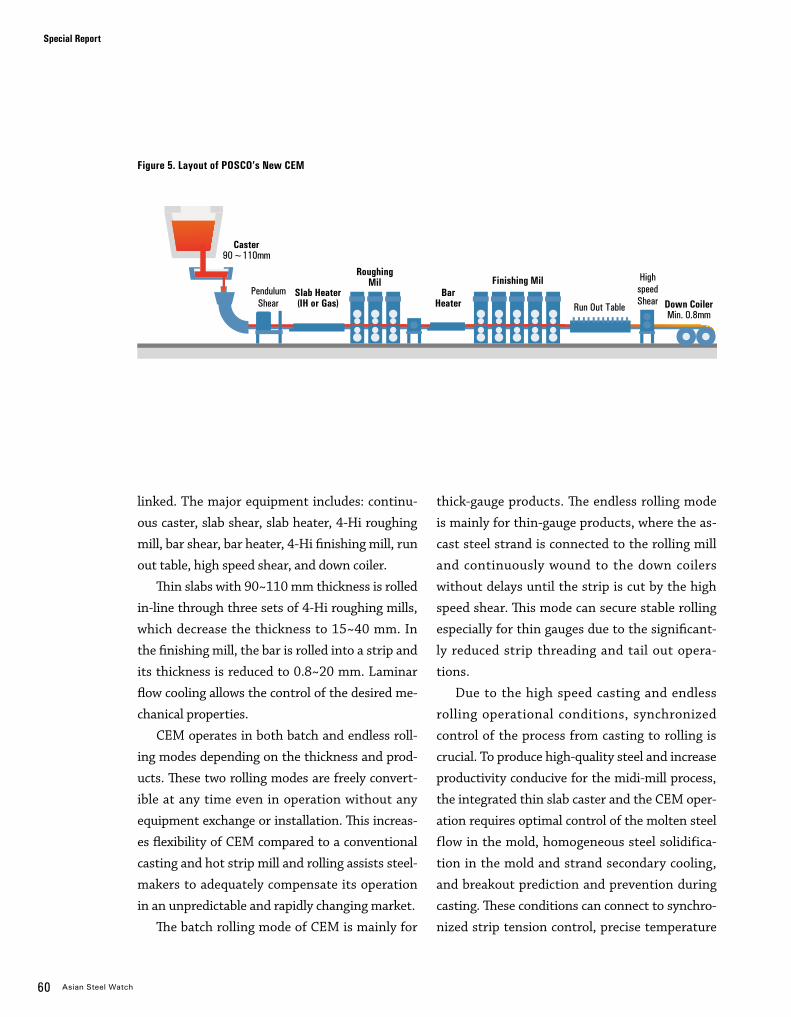
60 Asian Steel Watch
Special Report
linked. The major equipment includes: continu-
ous caster, slab shear, slab heater, 4-Hi roughing
mill, bar shear, bar heater, 4-Hi finishing mill, run
out table, high speed shear, and down coiler.
Thin slabs with 90~110 mm thickness is rolled
in-line through three sets of 4-Hi roughing mills,
which decrease the thickness to 15~40 mm. In
the finishing mill, the bar is rolled into a strip and
its thickness is reduced to 0.8~20 mm. Laminar
flow cooling allows the control of the desired me-
chanical properties.
CEM operates in both batch and endless roll-
ing modes depending on the thickness and prod-
ucts. These two rolling modes are freely convert-
ible at any time even in operation without any
equipment exchange or installation. This increas-
es flexibility of CEM compared to a conventional
casting and hot strip mill and rolling assists steel-
makers to adequately compensate its operation
in an unpredictable and rapidly changing market.
The batch rolling mode of CEM is mainly for
thick-gauge products. The endless rolling mode
is mainly for thin-gauge products, where the as-
cast steel strand is connected to the rolling mill
and continuously wound to the down coilers
without delays until the strip is cut by the high
speed shear. This mode can secure stable rolling
especially for thin gauges due to the significant-
ly reduced strip threading and tail out opera-
tions.
Due to the high speed casting and endless
rolling operational conditions, synchronized
control of the process from casting to rolling is
crucial. To produce high-quality steel and increase
productivity conducive for the midi-mill process,
the integrated thin slab caster and the CEM oper-
ation requires optimal control of the molten steel
flow in the mold, homogeneous steel solidifica-
tion in the mold and strand secondary cooling,
and breakout prediction and prevention during
casting. These conditions can connect to synchro-
nized strip tension control, precise temperature
Figure 5. Layout of POSCO’s New CEM
Down CoilerMin. 0.8mm
Caster90~110mm
HighspeedShear
PendulumShear Run Out Table
RoughingMil
Bar Heater
Slab Heater (IH or Gas)
Finishing Mil
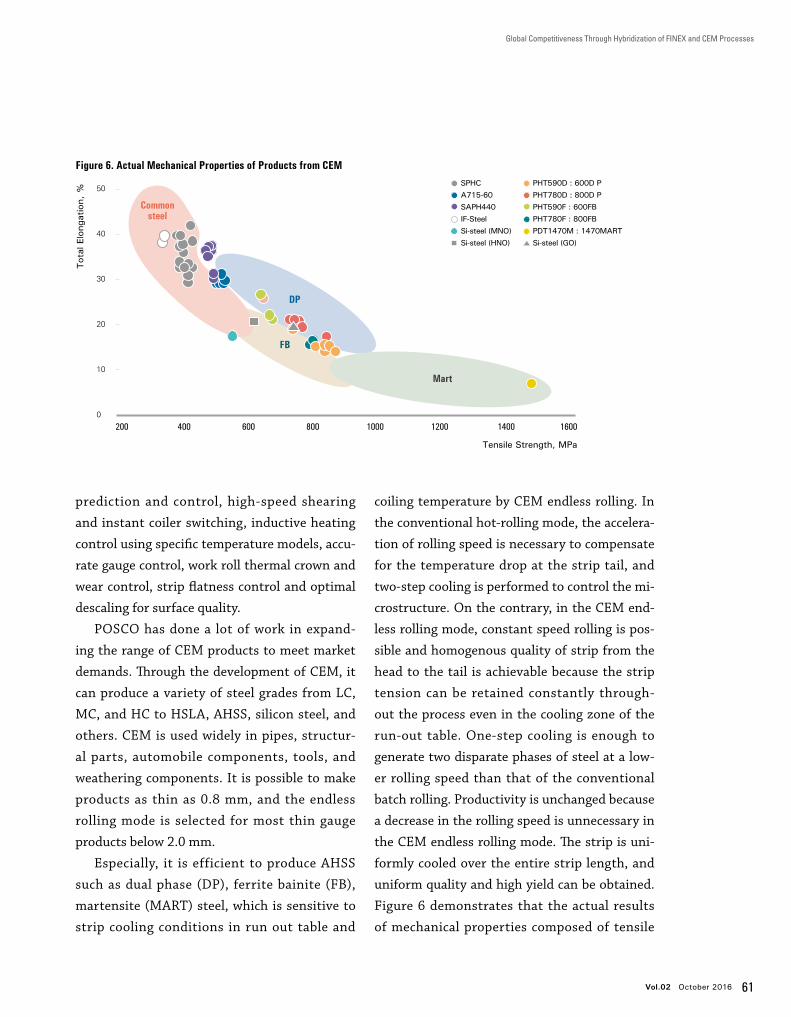
Vol.02 October 2016 61
Global Competitiveness Through Hybridization of FINEX and CEM Processes
prediction and control, high-speed shearing
and instant coiler switching, inductive heating
control using specific temperature models, accu-
rate gauge control, work roll thermal crown and
wear control, strip flatness control and optimal
descaling for surface quality.
POSCO has done a lot of work in expand-
ing the range of CEM products to meet market
demands. Through the development of CEM, it
can produce a variety of steel grades from LC,
MC, and HC to HSLA, AHSS, silicon steel, and
others. CEM is used widely in pipes, structur-
al parts, automobile components, tools, and
weathering components. It is possible to make
products as thin as 0.8 mm, and the endless
rolling mode is selected for most thin gauge
products below 2.0 mm.
Especially, it is efficient to produce AHSS
such as dual phase (DP), ferrite bainite (FB),
martensite (MART) steel, which is sensitive to
strip cooling conditions in run out table and
coiling temperature by CEM endless rolling. In
the conventional hot-rolling mode, the accelera-
tion of rolling speed is necessary to compensate
for the temperature drop at the strip tail, and
two-step cooling is performed to control the mi-
crostructure. On the contrary, in the CEM end-
less rolling mode, constant speed rolling is pos-
sible and homogenous quality of strip from the
head to the tail is achievable because the strip
tension can be retained constantly through-
out the process even in the cooling zone of the
run-out table. One-step cooling is enough to
generate two disparate phases of steel at a low-
er rolling speed than that of the conventional
batch rolling. Productivity is unchanged because
a decrease in the rolling speed is unnecessary in
the CEM endless rolling mode. The strip is uni-
formly cooled over the entire strip length, and
uniform quality and high yield can be obtained.
Figure 6 demonstrates that the actual results
of mechanical properties composed of tensile
Figure 6. Actual Mechanical Properties of Products from CEM
50
40
30
20
10
0
200 400 600 800 1000 1200 1400 1600
SPHCA715-60SAPH440IF-SteelSi-steel (MNO)Si-steel (HNO)
PHT590D : 600D PPHT780D : 800D PPHT590F : 600FBPHT780F : 800FBPDT1470M : 1470MART Si-steel (GO)
FB
DP
Common steel
Tot
al E
long
atio
n, %
Tensile Strength, MPa
Mart
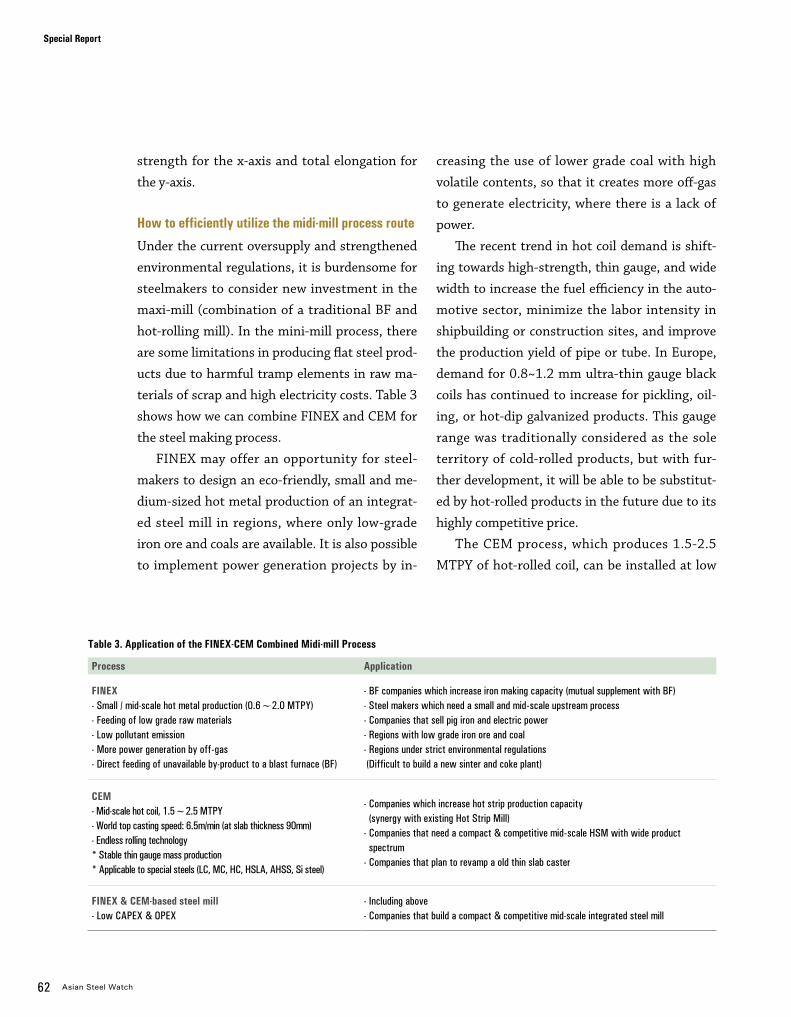
62 Asian Steel Watch
Special Report
strength for the x-axis and total elongation for
the y-axis.
How to efficiently utilize the midi-mill process route
Under the current oversupply and strengthened
environmental regulations, it is burdensome for
steelmakers to consider new investment in the
maxi-mill (combination of a traditional BF and
hot-rolling mill). In the mini-mill process, there
are some limitations in producing flat steel prod-
ucts due to harmful tramp elements in raw ma-
terials of scrap and high electricity costs. Table 3
shows how we can combine FINEX and CEM for
the steel making process.
FINEX may offer an opportunity for steel-
makers to design an eco-friendly, small and me-
dium-sized hot metal production of an integrat-
ed steel mill in regions, where only low-grade
iron ore and coals are available. It is also possible
to implement power generation projects by in-
creasing the use of lower grade coal with high
volatile contents, so that it creates more off-gas
to generate electricity, where there is a lack of
power.
The recent trend in hot coil demand is shift-
ing towards high-strength, thin gauge, and wide
width to increase the fuel efficiency in the auto-
motive sector, minimize the labor intensity in
shipbuilding or construction sites, and improve
the production yield of pipe or tube. In Europe,
demand for 0.8~1.2 mm ultra-thin gauge black
coils has continued to increase for pickling, oil-
ing, or hot-dip galvanized products. This gauge
range was traditionally considered as the sole
territory of cold-rolled products, but with fur-
ther development, it will be able to be substitut-
ed by hot-rolled products in the future due to its
highly competitive price.
The CEM process, which produces 1.5-2.5
MTPY of hot-rolled coil, can be installed at low
Process Application
FINEX- Small / mid-scale hot metal production (0.6~2.0 MTPY)- Feeding of low grade raw materials - Low pollutant emission - More power generation by off-gas- Direct feeding of unavailable by-product to a blast furnace (BF)
- BF companies which increase iron making capacity (mutual supplement with BF) - Steel makers which need a small and mid-scale upstream process- Companies that sell pig iron and electric power - Regions with low grade iron ore and coal- Regions under strict environmental regulations (Difficult to build a new sinter and coke plant)
CEM- Mid-scale hot coil, 1.5~2.5 MTPY- World top casting speed: 6.5m/min (at slab thickness 90mm)- Endless rolling technology* Stable thin gauge mass production* Applicable to special steels (LC, MC, HC, HSLA, AHSS, Si steel)
- Companies which increase hot strip production capacity (synergy with existing Hot Strip Mill) - Companies that need a compact & competitive mid-scale HSM with wide product spectrum- Companies that plan to revamp a old thin slab caster
FINEX & CEM-based steel mill- Low CAPEX & OPEX
- Including above - Companies that build a compact & competitive mid-scale integrated steel mill
Table 3. Application of the FINEX-CEM Combined Midi-mill Process

Vol.02 October 2016 63
Global Competitiveness Through Hybridization of FINEX and CEM Processes
investment costs. It also has an advantage of
stable mass production in high-quality thin
gauge steel for various steel grades like LC, MC,
HC, HSLA, AHSS and even Si steel by the utili-
zation of high speed casting and endless rolling
technology. This is difficult for a conventional
hot-rolling mill, because of the sharp decline in
productivity, added operational troubles, and
poor quality in the head and tail portion of hot
coil.
If maxi-mills that operate only convention-
al hot-rolling mills in the CEM process adopts
FINEX, productivity can be remarkably in-
creased. Through the hybridization of the FINEX
and CEM processes, a midi-mill can have strong
competiveness by lowering capital expenditures
(CAPEX) and operating expenses (OPEX), and
can have a wide range of products in steel grades
and thickness. It will also allow significant flexi-
bility of raw material feeding.
The midi-mill process creating synergy with existingprocesses
Since 2008, the global steel industry has faced
unprecedented and unpredictable challenges
such as steel oversupply, protectionism, and
strict environmental regulations. In order to
overcome these barriers and ensure continued
steel sustainability, the existing maxi-mill and
mini-mill process routes cannot be a solution.
Instead, it is necessary to take advantage from
the individual maxi- and mini-mill processes and
minimize disadvantages to make a new sustain-
able process more agile to the dynamic business
surroundings. Thus, the 1.5-2 MTPY midi-mill
process route with disruptive technologies can
be an effective alternative, as it creates synergy
with existing processes.
FINEX and CEM are compact processes by
eliminating or combining the conventional
processes. They can reduce investment costs,
operational costs, and environmental emissions.
FINEX has more flexibility in raw materials and
operations than the blast furnace route and
higher productivity than the EAF route. CEM
can achieve high throughput and meet product
requirements by converting from batch rolling
to endless rolling. The midi-mill process route
of the FINEX and CEM combination can satisfy
the needs to build a steel plant which is medi-
um-scale, economically competitive, raw materi-
al and operational flexibility, and eco-friendly.
Acknowledgements
Special appreciation is warranted to Prof. Il
Sohn of the Department of Materials Science
and Engineering at Yonsei University for his
helpful comments and suggestions finalizing
this work.
The midi-mill process route of the FINEX and
CEM combination can satisfy the needs
to build a steel plant which is medium-scale,
economically competitive, raw material
and operational flexibility, and eco-friendly.


66 The Demographic Cliff: How It Will Impact Asia’s Steel Demand Dr. Chung, Cheol-Ho
78 Restructuring of the Chinese Steel Industry: Retrospects and Prospects Frank Zhong
88 Myanmar, the Last Frontier in the ASEAN, Will See High Growth of its Steel Industry Dr. Cho, Dae-Hyun
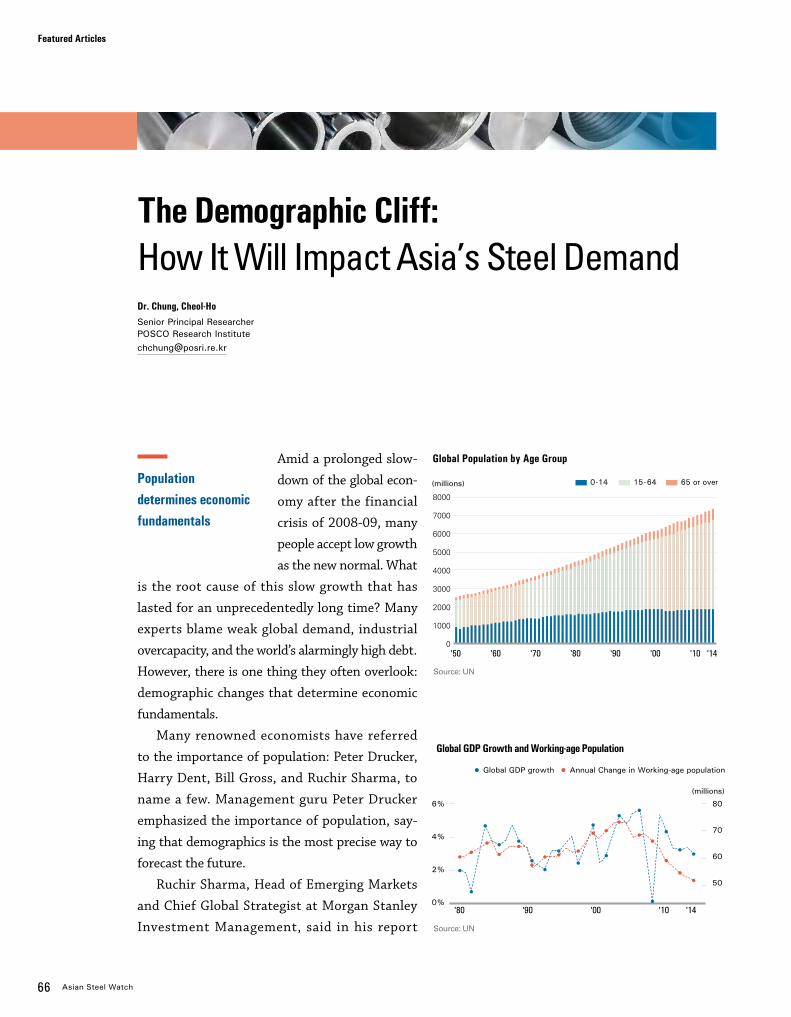
66 Asian Steel Watch
Amid a prolonged slow-
down of the global econ-
omy after the financial
crisis of 2008-09, many
people accept low growth
as the new normal. What
is the root cause of this slow growth that has
lasted for an unprecedentedly long time? Many
experts blame weak global demand, industrial
overcapacity, and the world’s alarmingly high debt.
However, there is one thing they often overlook:
demographic changes that determine economic
fundamentals.
Many renowned economists have referred
to the importance of population: Peter Drucker,
Harry Dent, Bill Gross, and Ruchir Sharma, to
name a few. Management guru Peter Drucker
emphasized the importance of population, say-
ing that demographics is the most precise way to
forecast the future.
Ruchir Sharma, Head of Emerging Markets
and Chief Global Strategist at Morgan Stanley
Investment Management, said in his report
Population determines economic fundamentals
The Demographic Cliff: How It Will Impact Asia’s Steel DemandDr. Chung, Cheol-HoSenior Principal Researcher POSCO Research [email protected]
Featured Articles
Source: UN
Source: UN
Global GDP Growth and Working-age Population
Global GDP growth Annual Change in Working-age population
(millions)
(millions)
6%
4%
2%
0%
80
70
60
50
Global Population by Age Group
0-14 15-64 65 or over
'50 '60 '70 '90'80 '00 '10 '14
8000
7000
6000
5000
4000
3000
2000
1000
0
'80 '90 '00 '10 '14
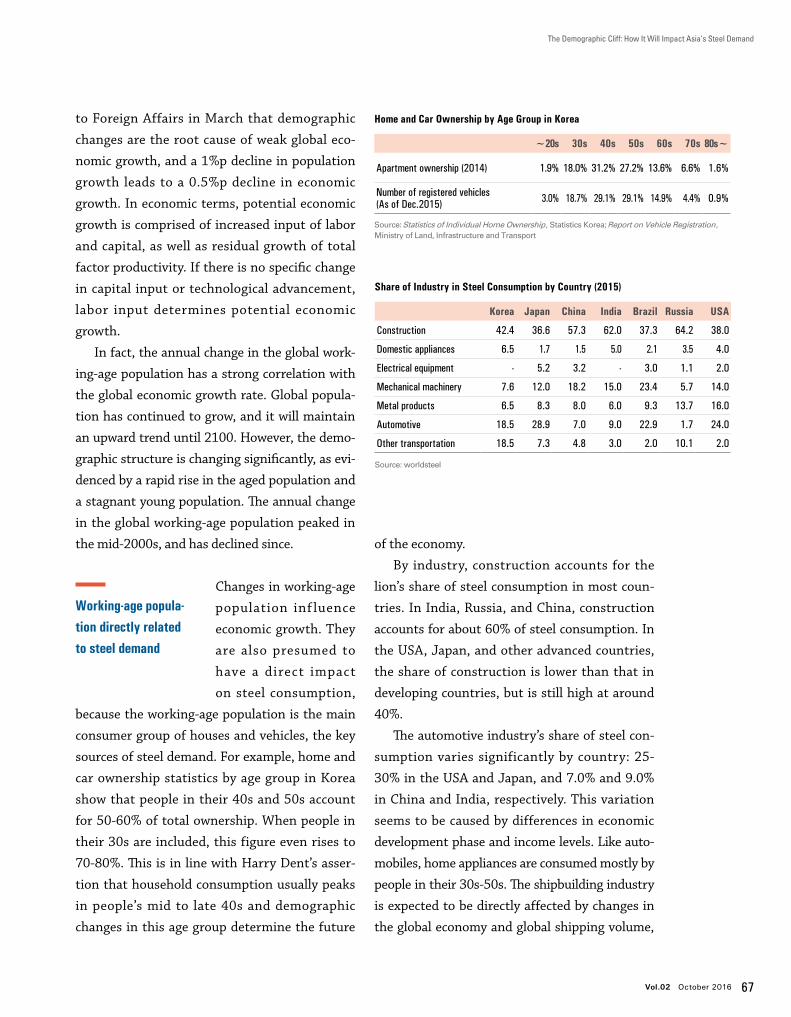
Vol.02 October 2016 67
The Demographic Cliff: How It Will Impact Asia’s Steel Demand
to Foreign Affairs in March that demographic
changes are the root cause of weak global eco-
nomic growth, and a 1%p decline in population
growth leads to a 0.5%p decline in economic
growth. In economic terms, potential economic
growth is comprised of increased input of labor
and capital, as well as residual growth of total
factor productivity. If there is no specific change
in capital input or technological advancement,
labor input determines potential economic
growth.
In fact, the annual change in the global work-
ing-age population has a strong correlation with
the global economic growth rate. Global popula-
tion has continued to grow, and it will maintain
an upward trend until 2100. However, the demo-
graphic structure is changing significantly, as evi-
denced by a rapid rise in the aged population and
a stagnant young population. The annual change
in the global working-age population peaked in
the mid-2000s, and has declined since.
Changes in working-age
population inf luence
economic growth. They
are also presumed to
have a direct impact
on steel consumption,
because the working-age population is the main
consumer group of houses and vehicles, the key
sources of steel demand. For example, home and
car ownership statistics by age group in Korea
show that people in their 40s and 50s account
for 50-60% of total ownership. When people in
their 30s are included, this figure even rises to
70-80%. This is in line with Harry Dent’s asser-
tion that household consumption usually peaks
in people’s mid to late 40s and demographic
changes in this age group determine the future
of the economy.
By industry, construction accounts for the
lion’s share of steel consumption in most coun-
tries. In India, Russia, and China, construction
accounts for about 60% of steel consumption. In
the USA, Japan, and other advanced countries,
the share of construction is lower than that in
developing countries, but is still high at around
40%.
The automotive industry’s share of steel con-
sumption varies significantly by country: 25-
30% in the USA and Japan, and 7.0% and 9.0%
in China and India, respectively. This variation
seems to be caused by differences in economic
development phase and income levels. Like auto-
mobiles, home appliances are consumed mostly by
people in their 30s-50s. The shipbuilding industry
is expected to be directly affected by changes in
the global economy and global shipping volume,
Global GDP Growth and Working-age Population
Working-age popula-tion directly related to steel demand
Home and Car Ownership by Age Group in Korea
Source: Statistics of Individual Home Ownership, Statistics Korea; Report on Vehicle Registration, Ministry of Land, Infrastructure and Transport
~20s 30s 40s 50s 60s 70s 80s~
Apartment ownership (2014) 1.9% 18.0% 31.2% 27.2% 13.6% 6.6% 1.6%
Number of registered vehicles (As of Dec.2015) 3.0% 18.7% 29.1% 29.1% 14.9% 4.4% 0.9%
Source: worldsteel
Korea Japan China India Brazil Russia USA
Construction 42.4 36.6 57.3 62.0 37.3 64.2 38.0
Domestic appliances 6.5 1.7 1.5 5.0 2.1 3.5 4.0
Electrical equipment - 5.2 3.2 - 3.0 1.1 2.0
Mechanical machinery 7.6 12.0 18.2 15.0 23.4 5.7 14.0
Metal products 6.5 8.3 8.0 6.0 9.3 13.7 16.0
Automotive 18.5 28.9 7.0 9.0 22.9 1.7 24.0
Other transportation 18.5 7.3 4.8 3.0 2.0 10.1 2.0
Share of Industry in Steel Consumption by Country (2015)
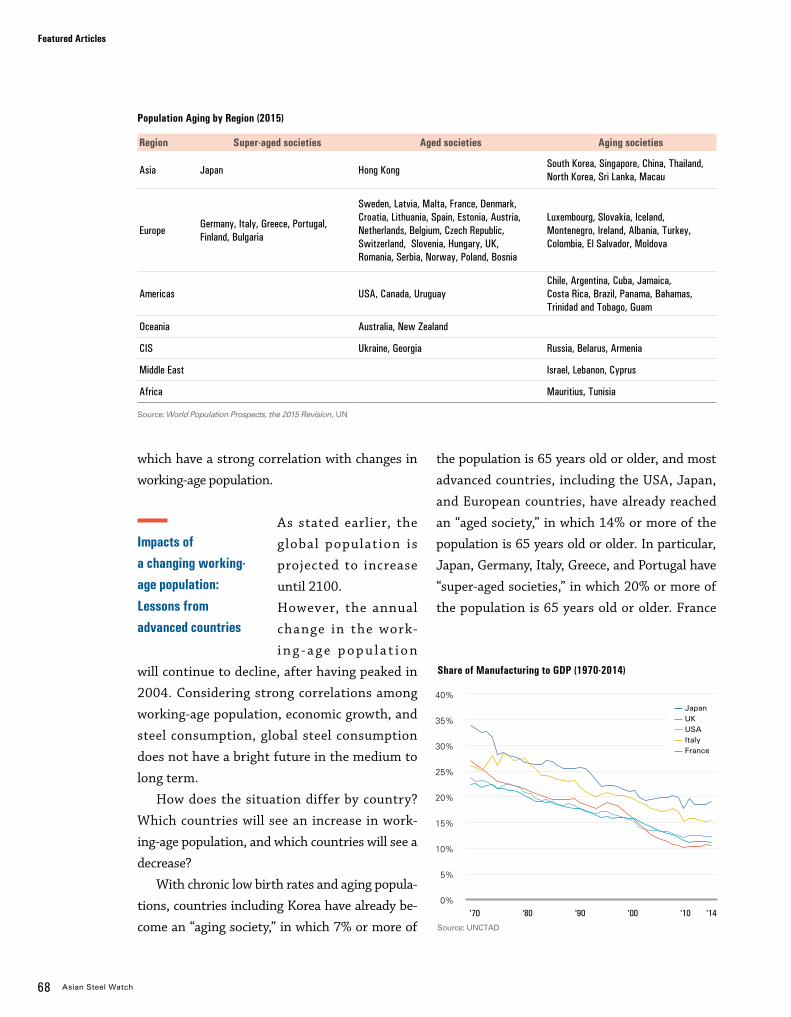
68 Asian Steel Watch
which have a strong correlation with changes in
working-age population.
As stated earlier, the
global population is
projected to increase
until 2100.
However, the annual
change in the work-
i n g - a g e p o p u l a t i o n
will continue to decline, after having peaked in
2004. Considering strong correlations among
working-age population, economic growth, and
steel consumption, global steel consumption
does not have a bright future in the medium to
long term.
How does the situation differ by country?
Which countries will see an increase in work-
ing-age population, and which countries will see a
decrease?
With chronic low birth rates and aging popula-
tions, countries including Korea have already be-
come an “aging society,” in which 7% or more of
Featured Articles
Impacts of a changing working-age population: Lessons from advanced countries
Population Aging by Region (2015)
Region Super-aged societies Aged societies Aging societies
Asia Japan Hong KongSouth Korea, Singapore, China, Thailand, North Korea, Sri Lanka, Macau
EuropeGermany, Italy, Greece, Portugal, Finland, Bulgaria
Sweden, Latvia, Malta, France, Denmark, Croatia, Lithuania, Spain, Estonia, Austria, Netherlands, Belgium, Czech Republic, Switzerland, Slovenia, Hungary, UK, Romania, Serbia, Norway, Poland, Bosnia
Luxembourg, Slovakia, Iceland, Montenegro, Ireland, Albania, Turkey, Colombia, El Salvador, Moldova
Americas USA, Canada, UruguayChile, Argentina, Cuba, Jamaica, Costa Rica, Brazil, Panama, Bahamas, Trinidad and Tobago, Guam
Oceania Australia, New Zealand
CIS Ukraine, Georgia Russia, Belarus, Armenia
Middle East Israel, Lebanon, Cyprus
Africa Mauritius, Tunisia
the population is 65 years old or older, and most
advanced countries, including the USA, Japan,
and European countries, have already reached
an “aged society,” in which 14% or more of the
population is 65 years old or older. In particular,
Japan, Germany, Italy, Greece, and Portugal have
“super-aged societies,” in which 20% or more of
the population is 65 years old or older. France
Source: World Population Prospects, the 2015 Revision, UN
Source: UNCTAD
40%
35%
30%
25%
20%
15%
10%
5%
0%
Share of Manufacturing to GDP (1970-2014)
'70 '80 '10'00'90 '14
Japan UK USA Italy France

Vol.02 October 2016 69
The Demographic Cliff: How It Will Impact Asia’s Steel Demand
participation by women. In the case of Europe,
the variation is attributed to the launch of the
EU, which has promoted economic integration
and free movement of persons. In addition, coun-
tries’ different industrial structures (i.e. share of
manufacturing) and dependence on investment
or trade can cause differences in the relationship
between steel consumption and working-age
population.
Pace of Population Aging
Country
The year reached to Years taken
Aging Society (7%)
Aged Society (14%)
Super-aged Society (20%) 7→14% 14→20%
Germany 1932 1972 2008 40 36
UK 1929 1975 2027 46 52
France 1864 1979 2018 115 39
Italy 1927 1987 2006 60 19
Portugal 1950 1990 2012 40 22
Greece 1953 1990 2012 37 22
Spain 1947 1991 2018 44 27
Japan 1970 1994 2005 24 11
Canada 1945 2008 2023 63 15
USA 1942 2014 2028 72 14
Source: Japan National Institute of Population and Social Security Research; Population Statistics (2016), UN
and Spain will have super-aged societies in 2018,
while the UK and the USA will have super-aged
societies in 2027 and 2028, respectively. These
advanced countries have already experienced var-
ious economic and social problems caused by low
birth rates and aging populations. In Europe, the
aging workforce in the steel sector has become a
major issue.
In Germany, 35.3% of the workforce (302,133)
in the steel and non-ferrous metal industries is 50
years old or older, and 19.4% is 55 years old or old-
er in 2013. The work load, safety, and health prob-
lems of aged workers are key issues in Germany.
It is hard to generalize the experience of pop-
ulation aging in advanced countries, but there
are some characteristics in common: the share of
manufacturing shrinks in the economic structure,
while the share of service increases; and steel con-
sumption declines after a peak.
However, the peak of steel consumption does
not match the peak of the working-age popu-
lation in some countries. This is attributed to
differences in immigration policies and economic
Working-age Population and Steel Consumption Peaks
Country
Working-age population peak Steel consumption peak
Population Share Total consumption
Per capita consumption
USA Not arrived 2008 1973 1973
Japan 1995 1992 1991 1973
Germany 1998 1986 2007 1970
France 2010 1986 1973 1973
UK 2013 2008 1970 1970
Source: worldsteel, UN
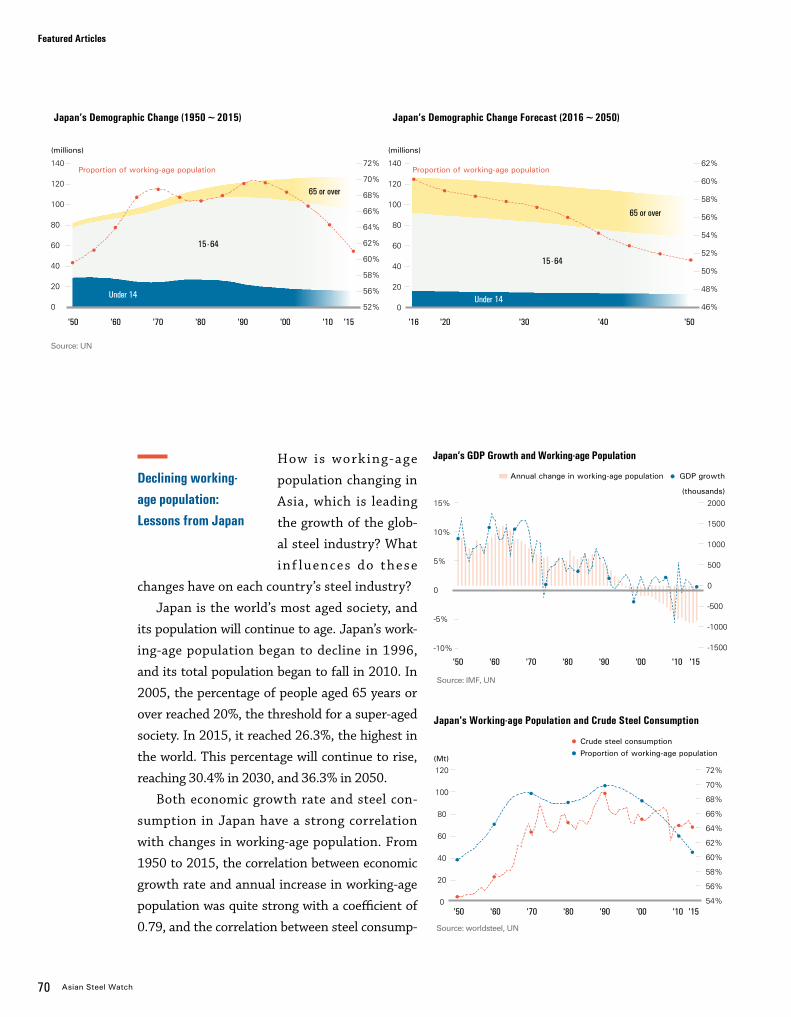
70 Asian Steel Watch
How is working-age
population changing in
Asia, which is leading
the growth of the glob-
al steel industry? What
inf luences do these
changes have on each country’s steel industry?
Japan is the world’s most aged society, and
its population will continue to age. Japan’s work-
ing-age population began to decline in 1996,
and its total population began to fall in 2010. In
2005, the percentage of people aged 65 years or
over reached 20%, the threshold for a super-aged
society. In 2015, it reached 26.3%, the highest in
the world. This percentage will continue to rise,
reaching 30.4% in 2030, and 36.3% in 2050.
Both economic growth rate and steel con-
sumption in Japan have a strong correlation
with changes in working-age population. From
1950 to 2015, the correlation between economic
growth rate and annual increase in working-age
population was quite strong with a coefficient of
0.79, and the correlation between steel consump-
Declining working-age population: Lessons from Japan
Japan’s GDP Growth and Working-age Population
Annual change in working-age population GDP growth
(thousands)
15%
10%
5%
0
-5%
-10%
2000
1500
1000
500
0
-500
-1000
-1500
Source: IMF, UN
Featured Articles
Source: worldsteel, UN
'50 '60 '90'80'70 '00 '10 '15
'15'10'50 '80'60 '70 '90 '00
Japan's Working-age Population and Crude Steel Consumption
120
100
80
60
40
20
0
72%
70%
68%
66%
64%
62%
60%
58%
56%
54%
(Mt)
Crude steel consumption Proportion of working-age population
Japan’s Demographic Change Forecast (2016~2050)
Proportion of working-age population
15-64
Under 14
140
120
100
80
60
40
20
0
62%
60%
58%
56%
54%
52%
50%
48%
46%
Japan’s Demographic Change (1950~2015)
Source: UN
140
120
100
80
60
40
20
0
65 or over
65 or over
Proportion of working-age population72%
70%
68%
66%
64%
62%
60%
58%
56%
52%
'50 '90'70 '10'60 '00'80 '15 '16 '30 '40'20 '50
(millions) (millions)
15-64
Under 14
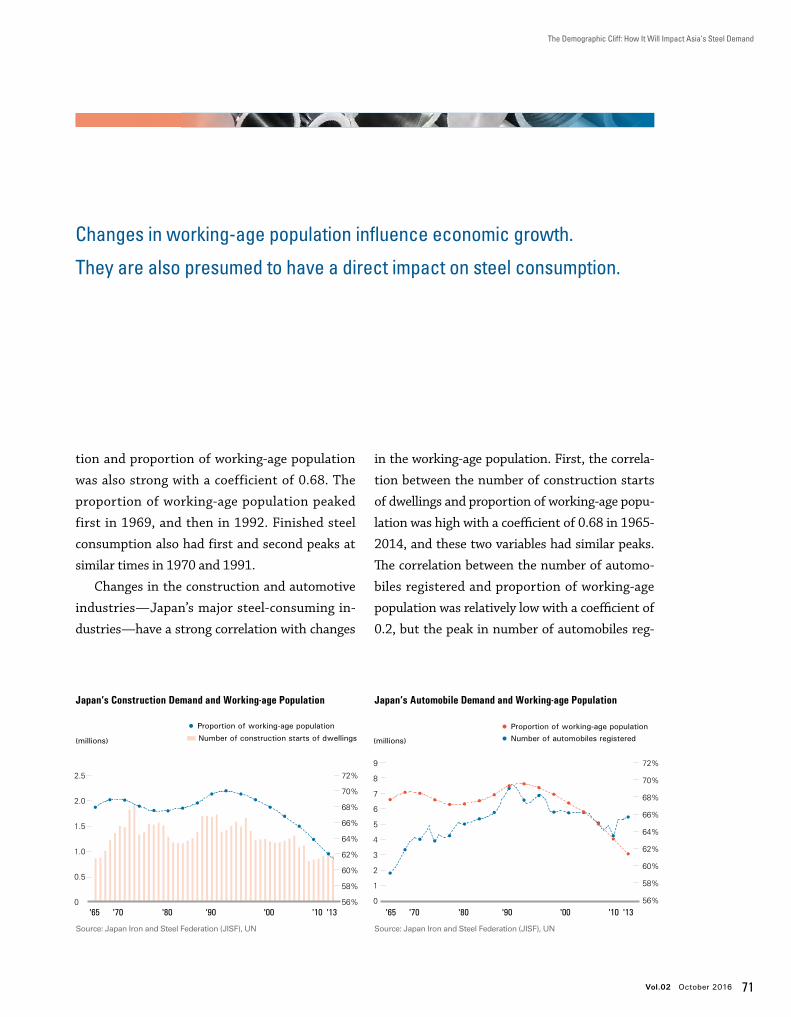
Vol.02 October 2016 71
The Demographic Cliff: How It Will Impact Asia’s Steel Demand
Japan’s Construction Demand and Working-age Population
Source: Japan Iron and Steel Federation (JISF), UN
Proportion of working-age population
Number of construction starts of dwellings
Japan’s Automobile Demand and Working-age Population
Proportion of working-age population Number of automobiles registered
tion and proportion of working-age population
was also strong with a coefficient of 0.68. The
proportion of working-age population peaked
first in 1969, and then in 1992. Finished steel
consumption also had first and second peaks at
similar times in 1970 and 1991.
Changes in the construction and automotive
industries—Japan’s major steel-consuming in-
dustries—have a strong correlation with changes
in the working-age population. First, the correla-
tion between the number of construction starts
of dwellings and proportion of working-age popu-
lation was high with a coefficient of 0.68 in 1965-
2014, and these two variables had similar peaks.
The correlation between the number of automo-
biles registered and proportion of working-age
population was relatively low with a coefficient of
0.2, but the peak in number of automobiles reg-
Changes in working-age population influence economic growth.
They are also presumed to have a direct impact on steel consumption.
72%
70%
68%
66%
64%
62%
60%
58%
56%
2.5
2.0
1.5
1.0
0.5
0'13'65 '10'70 '80 '00'90 '13'65 '10'70 '80 '00'90
Source: Japan Iron and Steel Federation (JISF), UN
9
8
7
6
5
4
3
2
1
0
72%
70%
68%
66%
64%
62%
60%
58%
56%
(millions) (millions)
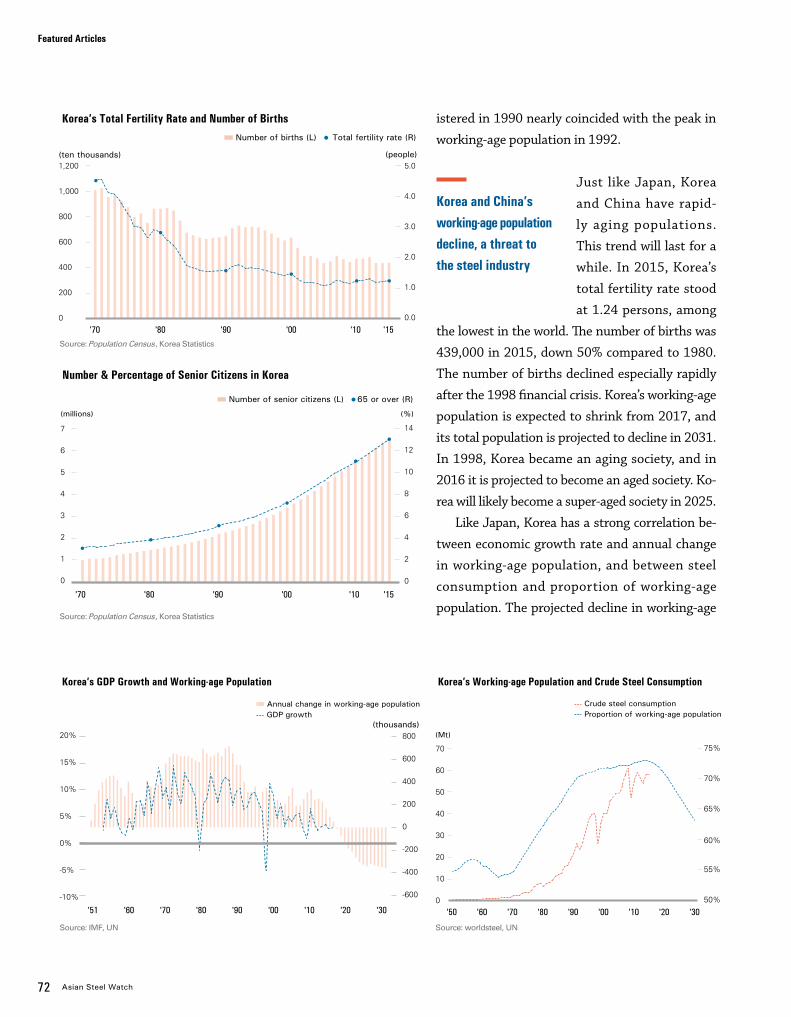
72 Asian Steel Watch
istered in 1990 nearly coincided with the peak in
working-age population in 1992.
Just like Japan, Korea
and China have rapid-
ly aging populations.
This trend will last for a
while. In 2015, Korea’s
total fertility rate stood
at 1.24 persons, among
the lowest in the world. The number of births was
439,000 in 2015, down 50% compared to 1980.
The number of births declined especially rapidly
after the 1998 financial crisis. Korea’s working-age
population is expected to shrink from 2017, and
its total population is projected to decline in 2031.
In 1998, Korea became an aging society, and in
2016 it is projected to become an aged society. Ko-
rea will likely become a super-aged society in 2025.
Like Japan, Korea has a strong correlation be-
tween economic growth rate and annual change
in working-age population, and between steel
consumption and proportion of working-age
population. The projected decline in working-age
Featured Articles
Korea and China’s working-age population decline, a threat to the steel industry
Source: IMF, UN Source: worldsteel, UN
Crude steel consumption Proportion of working-age population
(Mt)
70
60
50
40
30
20
10
0
75%
70%
65%
60%
55%
50%
'50 '90'70 '10'60 '00'80 '20 '30
Korea’s Working-age Population and Crude Steel Consumption Korea’s GDP Growth and Working-age Population
'51 '80'70 '00'60 '90 '10 '20 '30
Annual change in working-age population GDP growth
800
600
400
200
0
-200
-400
-600
20%
15%
10%
5%
0%
-5%
-10%
Korea’s Total Fertility Rate and Number of Births
(ten thousands)
(thousands)
(people)
Number of births (L) Total fertility rate (R)
1,200
1,000
800
600
400
200
0
5.0
4.0
3.0
2.0
1.0
0.0
'15'10'70 '90'80 '00
Number & Percentage of Senior Citizens in Korea
Number of senior citizens (L) 65 or over (R)
'15'10'70 '90'80 '00
7
6
5
4
3
2
1
0
14
12
10
8
6
4
2
0
Source: Population Census, Korea Statistics
Source: Population Census, Korea Statistics
(millions) (%)

Vol.02 October 2016 73
The Demographic Cliff: How It Will Impact Asia’s Steel Demand
population in 2017 and the acceleration of decline
thereafter, will have a negative impact on eco-
nomic growth and steel consumption. The future
is not bright for the construction and automotive
industries. Korea’s home ownership rate exceeded
100% in 2008. Domestic automotive production
remained stagnant after recording 4.657 million
units in 2011, standing at 4.556 million units in
2015. Korea’s urbanization rate is already con-
siderably high at 85%, and its infrastructure rate,
including railroads, roads, and airports, is also
high. Therefore, these factors have little room for
growth. The decline in the number of consumers
of houses and vehicles caused by the shrinking
working-age population will negatively impact
steel demand.
China also has bleak forecast for steel damand
given demographic trends. China’s working-age
population peaked in 2014. It has fallen since,
and will maintain a downward trend. China’s total
population is also expected to decline, after peak-
ing at 1.416 billion in 2027. The proportion of
working-age population peaked at 74.4% in 2011,
Source: Excerpt from a presentation by Jiang li at a worldsteel Economic Committee meeting
Infrastructure Comparison Between China and G7
China (A) G7 (B) A/B
Road mileage (km/1,000 people) 330 1,390 24%
Railway mileage (km/1,000 people) 8.2 53 15%
Pipeline length (km/1,000 people) 7.7 86.3 9%
Airport density (per 1,000km²) 2.1 95.1 2%
Internet bandwidth per capita (kb/s) 5 163 3%
Electricity consumption per capita (KWh) 3,475 8,826 39%
China’s GDP Growth and Anuual Change in Working-age Population
Annual change in working-age population GDP growth
25000
20000
15000
10000
2000
0
-5000
-10000
Source: IMF, UN
'79 '20'80 '90 '00 '10 '30
16%
14%
12%
10%
8%
6%
4%
2%
0%
China’s Working-age Population and Crude Steel Consumption
900
800
700
600
500
400
300
200
100
0
80%
75%
70%
65%
60%
55%
50%
Crude steel consumption Proportion of working-age population
Source: worldsteel, UN
(Mt)
'50 '10'80 '30'00'60 '20'90'70
(thousands)
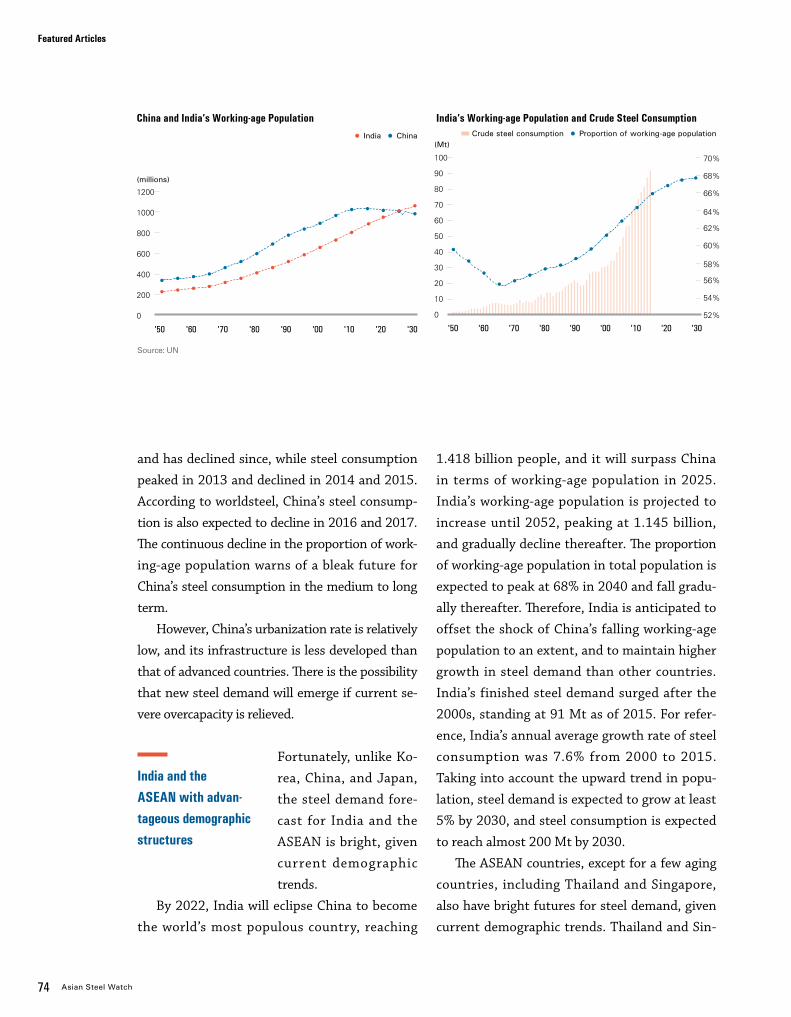
74 Asian Steel Watch
Featured Articles
and has declined since, while steel consumption
peaked in 2013 and declined in 2014 and 2015.
According to worldsteel, China’s steel consump-
tion is also expected to decline in 2016 and 2017.
The continuous decline in the proportion of work-
ing-age population warns of a bleak future for
China’s steel consumption in the medium to long
term.
However, China’s urbanization rate is relatively
low, and its infrastructure is less developed than
that of advanced countries. There is the possibility
that new steel demand will emerge if current se-
vere overcapacity is relieved.
Fortunately, unlike Ko-
rea, China, and Japan,
the steel demand fore-
cast for India and the
ASEAN is bright, given
current demographic
trends.
By 2022, India will eclipse China to become
the world’s most populous country, reaching
1.418 billion people, and it will surpass China
in terms of working-age population in 2025.
India’s working-age population is projected to
increase until 2052, peaking at 1.145 billion,
and gradually decline thereafter. The proportion
of working-age population in total population is
expected to peak at 68% in 2040 and fall gradu-
ally thereafter. Therefore, India is anticipated to
offset the shock of China’s falling working-age
population to an extent, and to maintain higher
growth in steel demand than other countries.
India’s finished steel demand surged after the
2000s, standing at 91 Mt as of 2015. For refer-
ence, India’s annual average growth rate of steel
consumption was 7.6% from 2000 to 2015.
Taking into account the upward trend in popu-
lation, steel demand is expected to grow at least
5% by 2030, and steel consumption is expected
to reach almost 200 Mt by 2030.
The ASEAN countries, except for a few aging
countries, including Thailand and Singapore,
also have bright futures for steel demand, given
current demographic trends. Thailand and Sin-
India and the ASEAN with advan-tageous demographic structures
India’s Working-age Population and Crude Steel Consumption Crude steel consumption Proportion of working-age population
China and India’s Working-age Population India China
100
90
80
70
60
50
40
30
20
10
0
70%
68%
66%
64%
62%
60%
58%
56%
54%
52%
'50 '20 '30'90'70 '00'60 '80 '10
1200
1000
800
600
400
200
0
Source: UN
'50 '90'70 '10'60 '00'80 '20 '30
(millions)
(Mt)
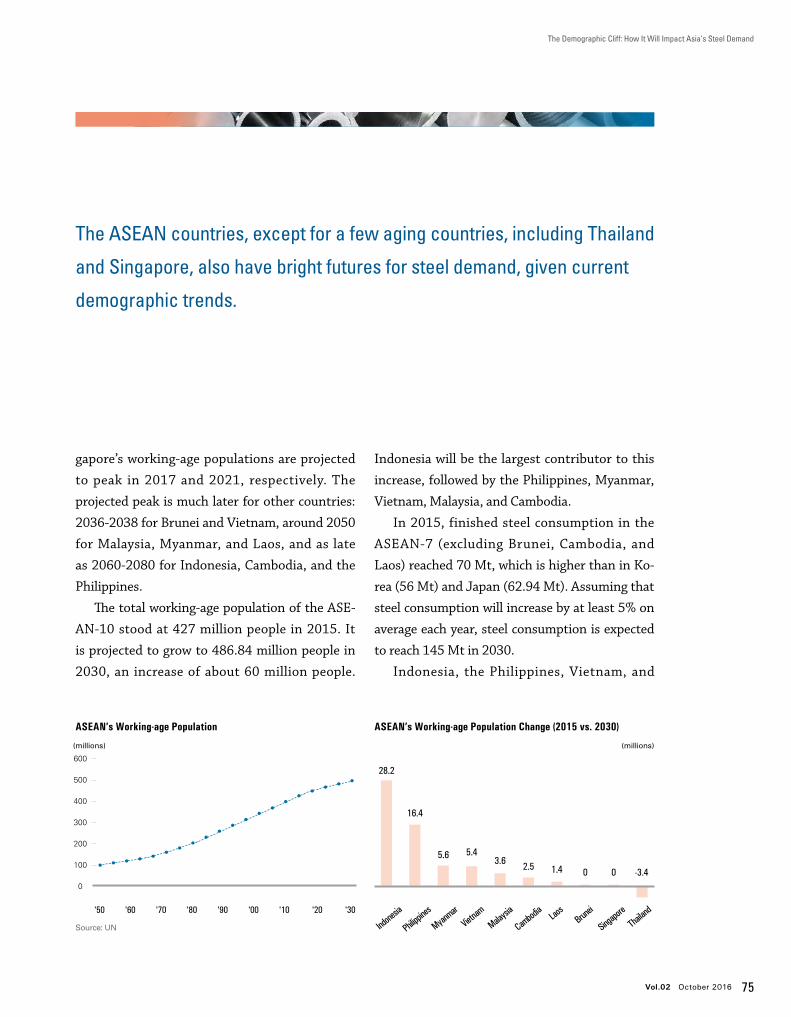
Vol.02 October 2016 75
The Demographic Cliff: How It Will Impact Asia’s Steel Demand
ASEAN’s Working-age Population
600
500
400
300
200
100
0
Source: UN
ASEAN’s Working-age Population Change (2015 vs. 2030)
gapore’s working-age populations are projected
to peak in 2017 and 2021, respectively. The
projected peak is much later for other countries:
2036-2038 for Brunei and Vietnam, around 2050
for Malaysia, Myanmar, and Laos, and as late
as 2060-2080 for Indonesia, Cambodia, and the
Philippines.
The total working-age population of the ASE-
AN-10 stood at 427 million people in 2015. It
is projected to grow to 486.84 million people in
2030, an increase of about 60 million people.
Indonesia will be the largest contributor to this
increase, followed by the Philippines, Myanmar,
Vietnam, Malaysia, and Cambodia.
In 2015, finished steel consumption in the
ASEAN-7 (excluding Brunei, Cambodia, and
Laos) reached 70 Mt, which is higher than in Ko-
rea (56 Mt) and Japan (62.94 Mt). Assuming that
steel consumption will increase by at least 5% on
average each year, steel consumption is expected
to reach 145 Mt in 2030.
Indonesia, the Philippines, Vietnam, and
The ASEAN countries, except for a few aging countries, including Thailand
and Singapore, also have bright futures for steel demand, given current
demographic trends.
'50 '80 '90 '10 '20'70 '00'60 '30
28.2
3.65.61.4 00
16.4
2.55.4
-3.4
Laos
Indone
sia
Philippin
es
Myanmar
Vietnam
Malaysia
Cambod
iaBrun
ei
Singapo
re
Thailan
d
(millions) (millions)
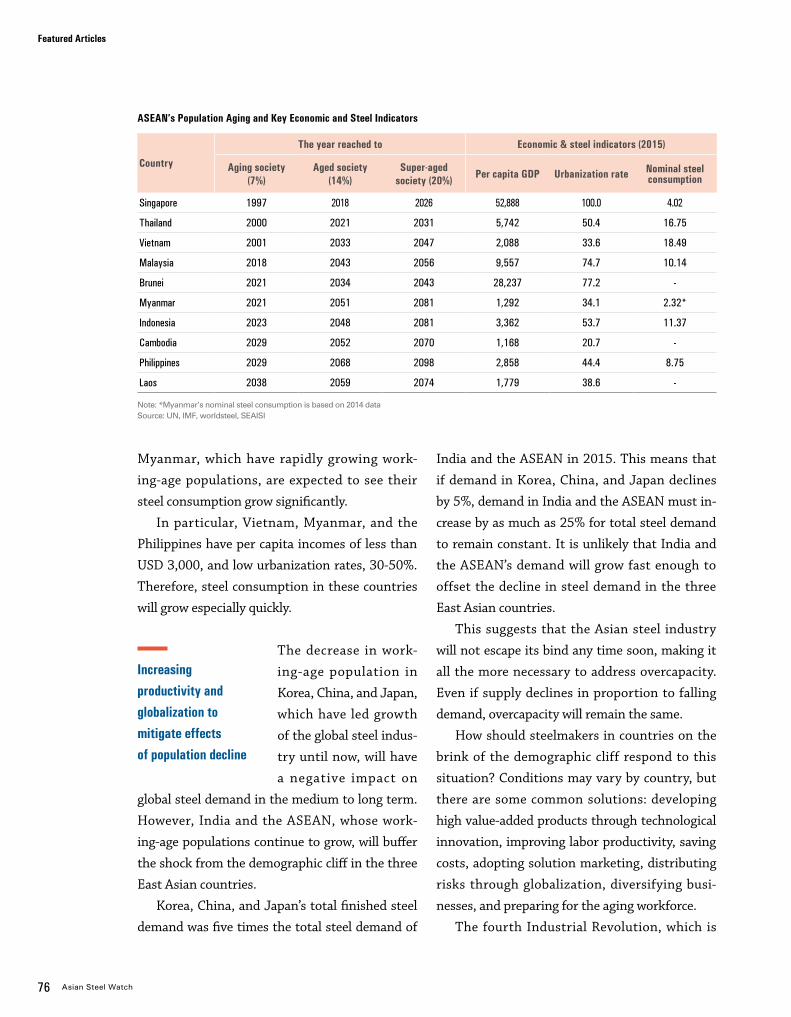
76 Asian Steel Watch
Featured Articles
India and the ASEAN in 2015. This means that
if demand in Korea, China, and Japan declines
by 5%, demand in India and the ASEAN must in-
crease by as much as 25% for total steel demand
to remain constant. It is unlikely that India and
the ASEAN’s demand will grow fast enough to
offset the decline in steel demand in the three
East Asian countries.
This suggests that the Asian steel industry
will not escape its bind any time soon, making it
all the more necessary to address overcapacity.
Even if supply declines in proportion to falling
demand, overcapacity will remain the same.
How should steelmakers in countries on the
brink of the demographic cliff respond to this
situation? Conditions may vary by country, but
there are some common solutions: developing
high value-added products through technological
innovation, improving labor productivity, saving
costs, adopting solution marketing, distributing
risks through globalization, diversifying busi-
nesses, and preparing for the aging workforce.
The fourth Industrial Revolution, which is
Myanmar, which have rapidly growing work-
ing-age populations, are expected to see their
steel consumption grow significantly.
In particular, Vietnam, Myanmar, and the
Philippines have per capita incomes of less than
USD 3,000, and low urbanization rates, 30-50%.
Therefore, steel consumption in these countries
will grow especially quickly.
The decrease in work-
ing-age population in
Korea, China, and Japan,
which have led growth
of the global steel indus-
try until now, will have
a negative impact on
global steel demand in the medium to long term.
However, India and the ASEAN, whose work-
ing-age populations continue to grow, will buffer
the shock from the demographic cliff in the three
East Asian countries.
Korea, China, and Japan’s total finished steel
demand was five times the total steel demand of
Increasing productivity and globalization to mitigate effects of population decline
ASEAN’s Population Aging and Key Economic and Steel Indicators
Country
The year reached to Economic & steel indicators (2015)
Aging society(7%)
Aged society(14%)
Super-aged society (20%) Per capita GDP Urbanization rate Nominal steel
consumption
Singapore 1997 2018 2026 52,888 100.0 4.02
Thailand 2000 2021 2031 5,742 50.4 16.75
Vietnam 2001 2033 2047 2,088 33.6 18.49
Malaysia 2018 2043 2056 9,557 74.7 10.14
Brunei 2021 2034 2043 28,237 77.2 -
Myanmar 2021 2051 2081 1,292 34.1 2.32*
Indonesia 2023 2048 2081 3,362 53.7 11.37
Cambodia 2029 2052 2070 1,168 20.7 -
Philippines 2029 2068 2098 2,858 44.4 8.75
Laos 2038 2059 2074 1,779 38.6 -
Note: *Myanmar’s nominal steel consumption is based on 2014 dataSource: UN, IMF, worldsteel, SEAISI

Vol.02 October 2016 77
The Demographic Cliff: How It Will Impact Asia’s Steel Demand
It is unlikely that India and the ASEAN’s demand will grow fast enough to
offset the decline in steel demand in the three East Asian countries.
This suggests that the Asian steel industry will not escape its bind
any time soon, making it all the more necessary to address overcapacity.
the gloomy forecast diversifying their busi-
nesses into promising industries, such as silver
and bio industries, that benefit from an aging
population. Steel companies in countries with
rapidly aging workforces can learn lessons from
European and Japanese steelmakers that have
already experienced this phenomenon.
The fates will be quite different for companies
that are prepared for the silent but massive wave
of demographic changes and those that are not.
characterized by the integration of manufactur-
ing and IoT, and smart factories, will provide
the steel industry with a new growth engine
that will mitigate the effects of population de-
cline. Companies seeking global expansion to
overcome the limitations of domestic markets
must consider the demographic trends of the
countries they wish to enter, because demo-
graphic changes determine the fundamentals of
steel demand. In addition, taking into account
78 Asian Steel Watch
Featured Articles
Restructuring of the Chinese Steel Industry: Retrospects and Prospects
Over the past 35 years, the landscape of the
global steel industry has changed dramatically
owing to the rise of the Chinese steel industry,
particularly over the past 15 years. As indicated
in Figure 1, global steel demand in 2015 was
127.7% higher than in 1980, with a CAGR of
2.4%. However, without China, global steel de-
mand would have grown by only 38.2%, with
a CAGR of only 0.9% during the same period.
China’s domestic steel demand in 2015 was 14.1
times higher than in 1980, with a CAGR of 8.3%.
China’s steel demand growth accelerated sig-
nificantly during the period from 2002 to 2013,
with a much higher CAGR of 13.4%. As a result,
China’s share in global steel demand expanded
from 10.2% in 1980 to 46.7% in 2013.
However, statistics suggest that the change
of the global steel landscape may have ap-
proached a watershed. On one hand, steel de-
mand in some emerging economies, like India
and the ASEAN, continues to grow robustly. On
the other hand, a turning point in the growth
of China’s steel demand has been observed, and
more and more people believe that China’s steel
demand may have already peaked in 2013. In-
dustry analysts believe that in the long term it
is unlikely that China’s steel demand will return
to the 2013 level, given that the Chinese econ-
omy is shifting its growth driver from invest-
ment, which is highly steel intensive, to private
consumption, which will require less steel for
the same rate of growth.
Steel demand outside China is expected to
remain stagnant because the global economy is
still struggling to achieve stable growth. It is the
consensus view that steel demand in developed
economies is unlikely to return to the pre-crisis
level recorded in 2007. The outlook is positive
for some emerging economies, including India,
the ASEAN, and MENA. There is no doubt that
steel demand in these regions will continue
to grow for decades due to strong demand in
infrastructure construction and automobiles.
However, steel demand in these regions is too
Frank ZhongChief Representative of Beijing Office World Steel Association (worldsteel)
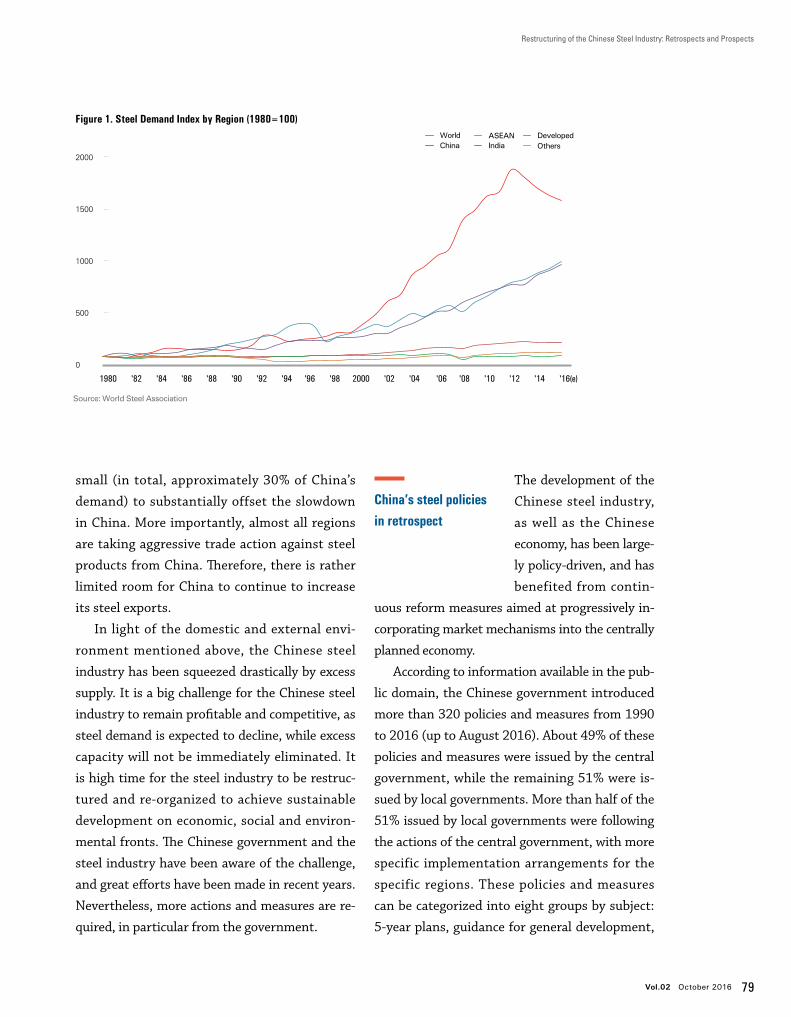
Restructuring of the Chinese Steel Industry: Retrospects and Prospects
Vol.02 October 2016 79
small (in total, approximately 30% of China’s
demand) to substantially offset the slowdown
in China. More importantly, almost all regions
are taking aggressive trade action against steel
products from China. Therefore, there is rather
limited room for China to continue to increase
its steel exports.
In light of the domestic and external envi-
ronment mentioned above, the Chinese steel
industry has been squeezed drastically by excess
supply. It is a big challenge for the Chinese steel
industry to remain profitable and competitive, as
steel demand is expected to decline, while excess
capacity will not be immediately eliminated. It
is high time for the steel industry to be restruc-
tured and re-organized to achieve sustainable
development on economic, social and environ-
mental fronts. The Chinese government and the
steel industry have been aware of the challenge,
and great efforts have been made in recent years.
Nevertheless, more actions and measures are re-
quired, in particular from the government.
The development of the
Chinese steel industry,
as well as the Chinese
economy, has been large-
ly policy-driven, and has
benefited from contin-
uous reform measures aimed at progressively in-
corporating market mechanisms into the centrally
planned economy.
According to information available in the pub-
lic domain, the Chinese government introduced
more than 320 policies and measures from 1990
to 2016 (up to August 2016). About 49% of these
policies and measures were issued by the central
government, while the remaining 51% were is-
sued by local governments. More than half of the
51% issued by local governments were following
the actions of the central government, with more
specific implementation arrangements for the
specific regions. These policies and measures
can be categorized into eight groups by subject:
5-year plans, guidance for general development,
1980 '82 '84 '86 '88 '90 '92 '94 '96 '98 2000 '02 '04 '06 '08 '10 '12 '14 '16(e)
2000
1500
1000
500
0
WorldChina
ASEAN Developed India Others
Source: World Steel Association
Figure 1. Steel Demand Index by Region (1980=100)
China’s steel policiesin retrospect
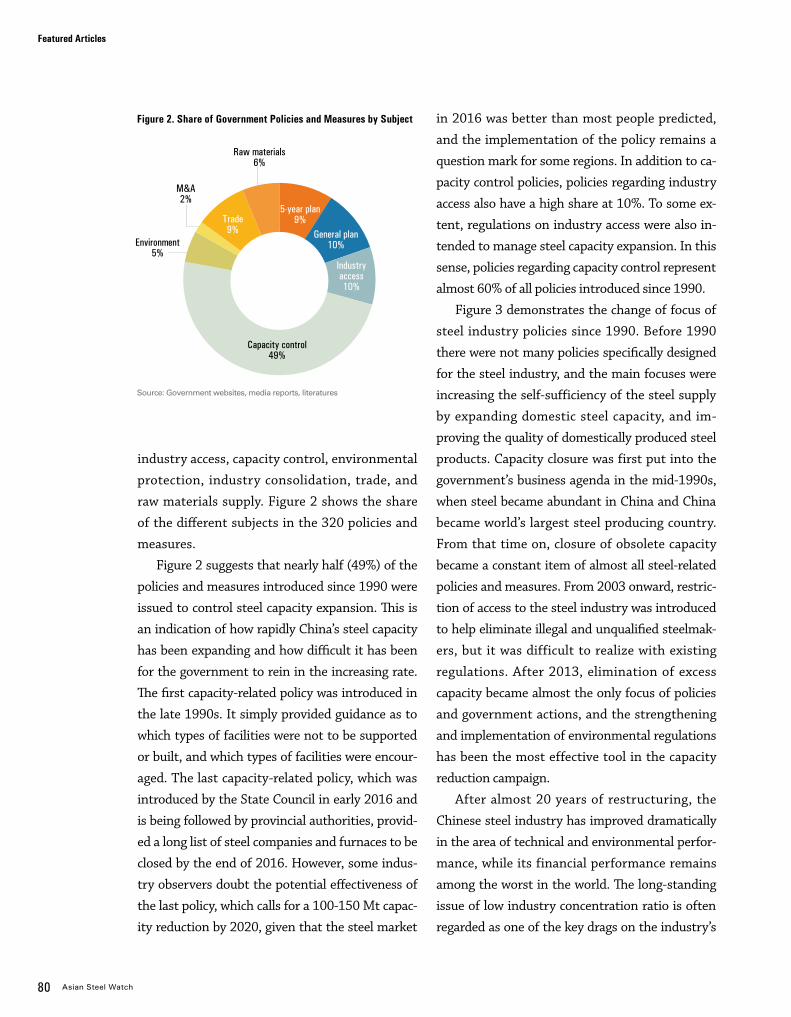
80 Asian Steel Watch
Featured Articles
Environment 5%
industry access, capacity control, environmental
protection, industry consolidation, trade, and
raw materials supply. Figure 2 shows the share
of the different subjects in the 320 policies and
measures.
Figure 2 suggests that nearly half (49%) of the
policies and measures introduced since 1990 were
issued to control steel capacity expansion. This is
an indication of how rapidly China’s steel capacity
has been expanding and how difficult it has been
for the government to rein in the increasing rate.
The first capacity-related policy was introduced in
the late 1990s. It simply provided guidance as to
which types of facilities were not to be supported
or built, and which types of facilities were encour-
aged. The last capacity-related policy, which was
introduced by the State Council in early 2016 and
is being followed by provincial authorities, provid-
ed a long list of steel companies and furnaces to be
closed by the end of 2016. However, some indus-
try observers doubt the potential effectiveness of
the last policy, which calls for a 100-150 Mt capac-
ity reduction by 2020, given that the steel market
in 2016 was better than most people predicted,
and the implementation of the policy remains a
question mark for some regions. In addition to ca-
pacity control policies, policies regarding industry
access also have a high share at 10%. To some ex-
tent, regulations on industry access were also in-
tended to manage steel capacity expansion. In this
sense, policies regarding capacity control represent
almost 60% of all policies introduced since 1990.
Figure 3 demonstrates the change of focus of
steel industry policies since 1990. Before 1990
there were not many policies specifically designed
for the steel industry, and the main focuses were
increasing the self-sufficiency of the steel supply
by expanding domestic steel capacity, and im-
proving the quality of domestically produced steel
products. Capacity closure was first put into the
government’s business agenda in the mid-1990s,
when steel became abundant in China and China
became world’s largest steel producing country.
From that time on, closure of obsolete capacity
became a constant item of almost all steel-related
policies and measures. From 2003 onward, restric-
tion of access to the steel industry was introduced
to help eliminate illegal and unqualified steelmak-
ers, but it was difficult to realize with existing
regulations. After 2013, elimination of excess
capacity became almost the only focus of policies
and government actions, and the strengthening
and implementation of environmental regulations
has been the most effective tool in the capacity
reduction campaign.
After almost 20 years of restructuring, the
Chinese steel industry has improved dramatically
in the area of technical and environmental perfor-
mance, while its financial performance remains
among the worst in the world. The long-standing
issue of low industry concentration ratio is often
regarded as one of the key drags on the industry’s
General plan10%
5-year plan 9%Trade
9%
Raw materials 6%
M&A 2%
Source: Government websites, media reports, literatures
Figure 2. Share of Government Policies and Measures by Subject
Capacity control 49%
Industry access 10%
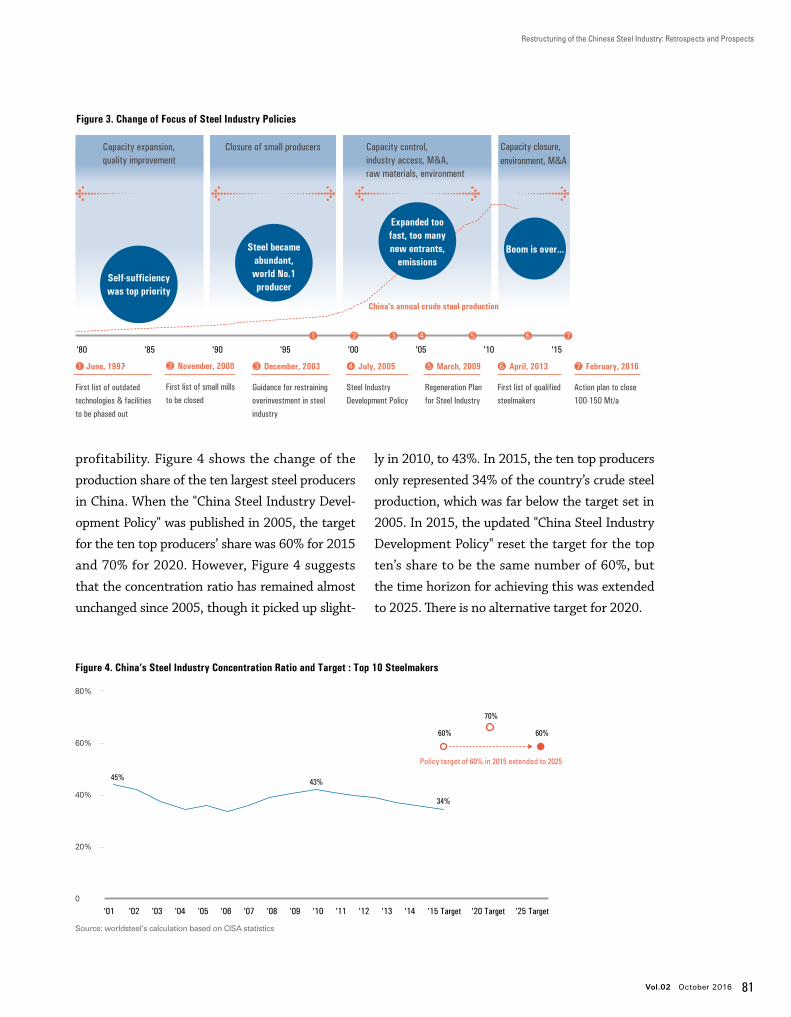
Restructuring of the Chinese Steel Industry: Retrospects and Prospects
Vol.02 October 2016 81
profitability. Figure 4 shows the change of the
production share of the ten largest steel producers
in China. When the "China Steel Industry Devel-
opment Policy" was published in 2005, the target
for the ten top producers’ share was 60% for 2015
and 70% for 2020. However, Figure 4 suggests
that the concentration ratio has remained almost
unchanged since 2005, though it picked up slight-
ly in 2010, to 43%. In 2015, the ten top producers
only represented 34% of the country’s crude steel
production, which was far below the target set in
2005. In 2015, the updated "China Steel Industry
Development Policy" reset the target for the top
ten’s share to be the same number of 60%, but
the time horizon for achieving this was extended
to 2025. There is no alternative target for 2020.
Source: worldsteel’s calculation based on CISA statistics
Figure 4. China’s Steel Industry Concentration Ratio and Target : Top 10 Steelmakers
80%
60%
40%
20%
0
45% 43%
34%
60%
70%
60%
Policy target of 60% in 2015 extended to 2025
'01 '02 '03 '04 '05 '06 '07 '08 '09 '10 '11 '12 '13 '14 '15 Target '20 Target '25 Target
Figure 3. Change of Focus of Steel Industry Policies
'80 '90 '00 '10 '15'85 '95 '05
❶ June, 1997
First list of outdated technologies & facilities to be phased out
❷ November, 2000
First list of small mills to be closed
❸ December, 2003
Guidance for restraining overinvestment in steel industry
❹ July, 2005
Steel Industry Development Policy
❺ March, 2009
Regeneration Planfor Steel Industry
❻ April, 2013
First list of qualified steelmakers
❼ February, 2016
Action plan to close 100-150 Mt/a
❶ ❷ ❸ ❺ ❻ ❼
Boom is over…
Capacity closure, environment, M&A
Steel became abundant, world No.1 producer
Closure of small producers Capacity control,industry access, M&A, raw materials, environment
Self-sufficiency was top priority
Capacity expansion, quality improvement
Expanded too fast, too many new entrants,
emissions
China's annual crude steel production
❹
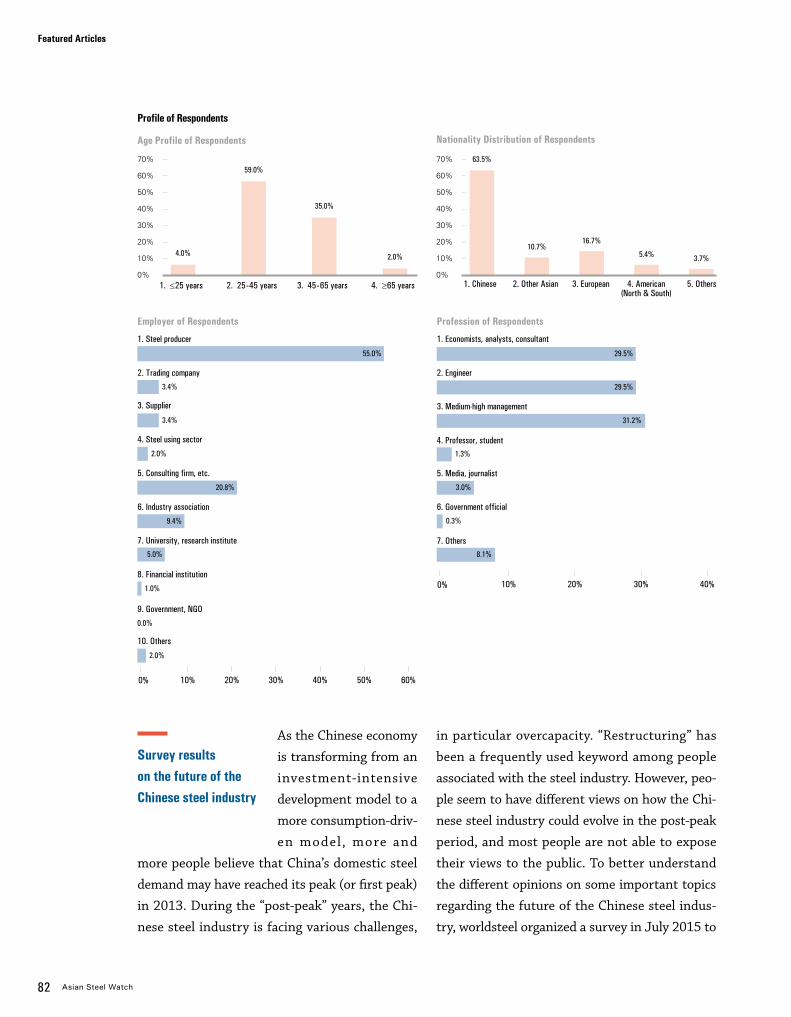
82 Asian Steel Watch
Featured Articles
As the Chinese economy
is transforming from an
investment-intensive
development model to a
more consumption-driv-
en model, more and
more people believe that China’s domestic steel
demand may have reached its peak (or first peak)
in 2013. During the “post-peak” years, the Chi-
nese steel industry is facing various challenges,
in particular overcapacity. “Restructuring” has
been a frequently used keyword among people
associated with the steel industry. However, peo-
ple seem to have different views on how the Chi-
nese steel industry could evolve in the post-peak
period, and most people are not able to expose
their views to the public. To better understand
the different opinions on some important topics
regarding the future of the Chinese steel indus-
try, worldsteel organized a survey in July 2015 to
Age Profile of Respondents Nationality Distribution of Respondents
60%
20%
40%
0%
70%
30%
50%
10%
1. ≤25 years 2. 25-45 years 3. 45-65 years 4. ≥65 years
4.0%
59.0%
35.0%
2.0%
60%
20%
40%
0%
70%
30%
50%
10%
1. Chinese 2. Other Asian 3. European 4. American(North & South)
63.5%
10.7%16.7%
5.4% 3.7%
5. Others
Profession of Respondents
1. Economists, analysts, consultant
29.5%
2. Engineer
29.5%
3. Medium-high management
31.2%
4. Professor, student1.3%
5. Media, journalist
3.0%
6. Government official
0.3%
7. Others8.1%
0% 10% 20% 30% 40%
Employer of Respondents
1. Steel producer
55.0%
2. Trading company
3.4%
3. Supplier
3.4%
4. Steel using sector
2.0%
5. Consulting firm, etc.
20.8%
6. Industry association
9.4%
7. University, research institute5.0%
8. Financial institution
1.0%
9. Government, NGO
0.0%
10. Others
2.0%
0% 10% 20% 30% 60%50%40%
Profile of Respondents
Survey results on the future of the Chinese steel industry
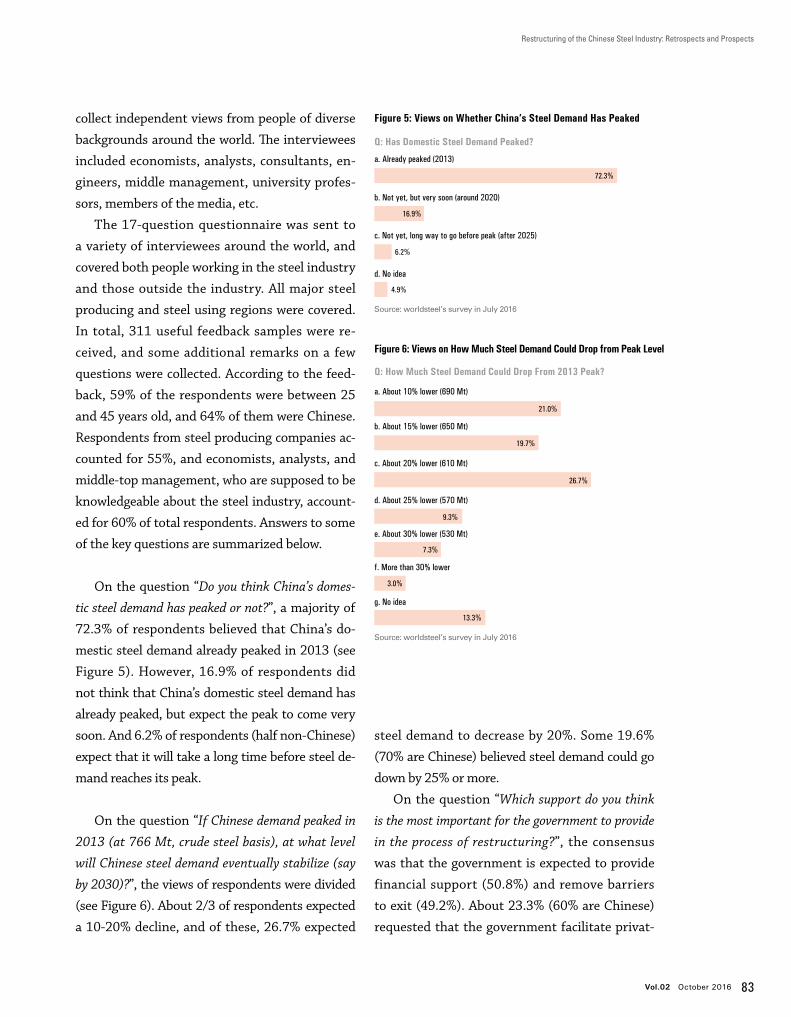
Restructuring of the Chinese Steel Industry: Retrospects and Prospects
Vol.02 October 2016 83
collect independent views from people of diverse
backgrounds around the world. The interviewees
included economists, analysts, consultants, en-
gineers, middle management, university profes-
sors, members of the media, etc.
The 17-question questionnaire was sent to
a variety of interviewees around the world, and
covered both people working in the steel industry
and those outside the industry. All major steel
producing and steel using regions were covered.
In total, 311 useful feedback samples were re-
ceived, and some additional remarks on a few
questions were collected. According to the feed-
back, 59% of the respondents were between 25
and 45 years old, and 64% of them were Chinese.
Respondents from steel producing companies ac-
counted for 55%, and economists, analysts, and
middle-top management, who are supposed to be
knowledgeable about the steel industry, account-
ed for 60% of total respondents. Answers to some
of the key questions are summarized below.
On the question “Do you think China’s domes-
tic steel demand has peaked or not?”, a majority of
72.3% of respondents believed that China’s do-
mestic steel demand already peaked in 2013 (see
Figure 5). However, 16.9% of respondents did
not think that China’s domestic steel demand has
already peaked, but expect the peak to come very
soon. And 6.2% of respondents (half non-Chinese)
expect that it will take a long time before steel de-
mand reaches its peak.
On the question “If Chinese demand peaked in
2013 (at 766 Mt, crude steel basis), at what level
will Chinese steel demand eventually stabilize (say
by 2030)?”, the views of respondents were divided
(see Figure 6). About 2/3 of respondents expected
a 10-20% decline, and of these, 26.7% expected
steel demand to decrease by 20%. Some 19.6%
(70% are Chinese) believed steel demand could go
down by 25% or more.
On the question “Which support do you think
is the most important for the government to provide
in the process of restructuring?”, the consensus
was that the government is expected to provide
financial support (50.8%) and remove barriers
to exit (49.2%). About 23.3% (60% are Chinese)
requested that the government facilitate privat-
Figure 5: Views on Whether China’s Steel Demand Has Peaked
Figure 6: Views on How Much Steel Demand Could Drop from Peak Level
e. About 30% lower (530 Mt)
7.3%
a. About 10% lower (690 Mt)
21.0%
b. About 15% lower (650 Mt)
19.7%
c. About 20% lower (610 Mt)
26.7%
d. About 25% lower (570 Mt)
9.3%
f. More than 30% lower
3.0%
13.3%
g. No idea
Source: worldsteel’s survey in July 2016
a. Already peaked (2013)
72.3%
16.9%
b. Not yet, but very soon (around 2020)
6.2%
c. Not yet, long way to go before peak (after 2025)
4.9%
d. No idea
Source: worldsteel’s survey in July 2016
Q: Has Domestic Steel Demand Peaked?
Q: How Much Steel Demand Could Drop From 2013 Peak?
84 Asian Steel Watch
Featured Articles
ization of SOE’s.
On the question “Which area do you think
Chinese steel companies should improve the most
in order to become globally competitive players?”,
views were divided, but the answer “Business
administration skills of top management” got the
highest response (43.4%), followed by the answer
“Operational technology, equipment” (27.9%)
and “Improving environmental performance”
(26.6%). Some respondents provided additional
remarks that Chinese steel companies are already
globally competitive.
On the question “If you know the history of
restructuring in other countries, which model do you
think the Chinese steel industry should follow?”,
answers were extremely divided. About 20.4%
of respondents said that they have no idea or
knowledge to answer the question. Out of the
remaining 79.6%, 31.3% believed the Japanese
model is most suitable for the restructuring of
the Chinese steel industry, and 16.4% thought
the EU model is most appropriate. However,
26.6% of respondents chose the answer “None of
the above (Japan, US, EU).” Additional remarks
suggest that China will find its own way of re-
structuring its steel industry.
To summarize the findings, the feedback from
the survey suggests that China’s domestic steel
demand peaked in 2013, and will decline 10-20%
before stabilizing. The government should lead
the restructuring process, remove barriers to exit,
provide financial support, and facilitate M&A’s
and privatization of SOE’s. There is no clear view
of which restructuring model China should follow
from among the cases of Japan, the US and the
EU. China has entered a post-peak era, but how
the steel industry should be better restructured
remains a question mark.
The Chinese steel in-
dustry is now at a crit-
ical turning point in
its development, with
“restructuring” being a
high priority for sustain-
able development in the long term. The analysis
The feedback from the survey suggests that China’s domestic steel
demand peaked in 2013, and will decline 10-20% before stabilizing.
China has entered a post-peak era, but how the steel industry should
be better restructured remains a question mark.
Suggestions for future restructuring
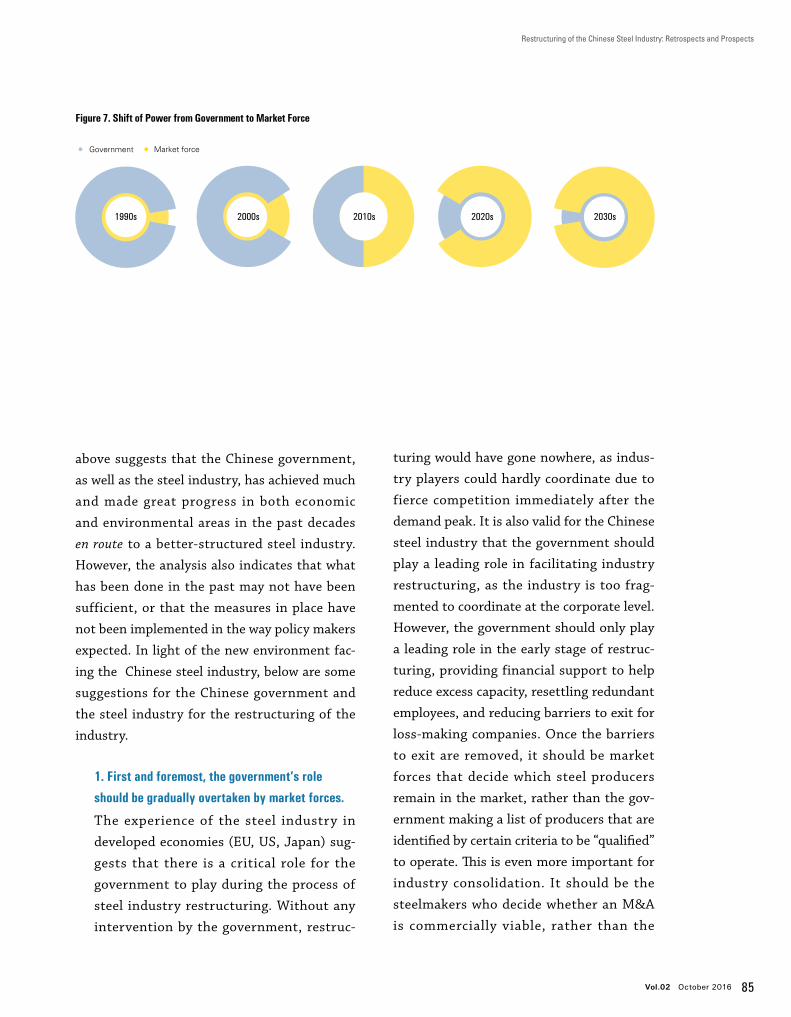
Restructuring of the Chinese Steel Industry: Retrospects and Prospects
Vol.02 October 2016 85
above suggests that the Chinese government,
as well as the steel industry, has achieved much
and made great progress in both economic
and environmental areas in the past decades
en route to a better-structured steel industry.
However, the analysis also indicates that what
has been done in the past may not have been
sufficient, or that the measures in place have
not been implemented in the way policy makers
expected. In light of the new environment fac-
ing the Chinese steel industry, below are some
suggestions for the Chinese government and
the steel industry for the restructuring of the
industry.
1. First and foremost, the government’s role
should be gradually overtaken by market forces.
The experience of the steel industry in
developed economies (EU, US, Japan) sug-
gests that there is a critical role for the
government to play during the process of
steel industry restructuring. Without any
intervention by the government, restruc-
turing would have gone nowhere, as indus-
try players could hardly coordinate due to
fierce competition immediately after the
demand peak. It is also valid for the Chinese
steel industry that the government should
play a leading role in facilitating industry
restructuring, as the industry is too frag-
mented to coordinate at the corporate level.
However, the government should only play
a leading role in the early stage of restruc-
turing, providing financial support to help
reduce excess capacity, resettling redundant
employees, and reducing barriers to exit for
loss-making companies. Once the barriers
to exit are removed, it should be market
forces that decide which steel producers
remain in the market, rather than the gov-
ernment making a list of producers that are
identified by certain criteria to be “qualified”
to operate. This is even more important for
industry consolidation. It should be the
steelmakers who decide whether an M&A
is commercially viable, rather than the
1990s 2000s 2010s 2020s 2030s
Government Market force
Figure 7. Shift of Power from Government to Market Force
86 Asian Steel Watch
Featured Articles
government forcing mergers that it feels
are workable. Figure 7 demonstrates how
government influence should be replaced by
the market forces in the future.
2. The steel industry should be consolidated to
generate better synergy in the industry, in partic-
ular in market development and R&D.
A reasonably consolidated industrial struc-
ture enables the most players to allocate the
best resources to improve the efficiency of
the supply chain and R&D. The Chinese steel
industry is currently too fragmented for pro-
ducers to generate synergy. Survival is the
top priority of nearly all producers, including
those that used to be leading players in the
market. But structural reorganization should
be conducted in a proper way. Market forces
or producers should be the decision maker
on whether a merger proposal is commer-
cially feasible or not. The government should
not force any producer to merge, or stop any
producer from being taken over by another.
Cross-regional combination of producers
usually brings better synergy and creates
new market opportunities. Industry consoli-
dation should be careful of the notion of “the
bigger, the better, the stronger.” A bigger
company means stronger bargaining power,
but the value can be significantly offset by
the huge costs of integration and inefficiency
in operation management.
3. A joint fund should be initiated to support the
restructuring.
In early 2016, the Chinese central govern-
ment committed to devoting a total budget
of RMB100 billion to deal with issues re-
lated to the capacity reduction campaign in
the coal and steel industries. According to a
statement from the government, the budget
will be mainly assigned for resettlement of
1.3 million redundant employees in the coal
industry and 0.5 million in the steel industry.
In the longer term, the government, as the controlling shareholder
of the steel companies, should guide the SOE’s in making a long-term
business plan, and importantly, the plan should not just be politically right,
but commercially viable.
Restructuring of the Chinese Steel Industry: Retrospects and Prospects
Vol.02 October 2016 87
This budget is viewed as an excellent start
that demonstrates the central government’s
determination to help the industry address
the core challenges of labor force treatment.
It is expected that the provincial govern-
ments will come up with additional money to
supplement the central government’s budget.
However, the overall budget is rather limited
compared to the magnitude of the capacity
reduction and the resettling of redundant
employees. An additional fund, which could
be jointly established by the government and
private sectors, could definitely fill the gap
between the huge demand and the limited
government budget. Such a public-private
fund could help address not only employ-
ment issues, but also help resolve bad debts,
facilitate M&A, and even be used in R&D ini-
tiatives.
4. Reform of state-owned steel enterprises (SOE’s)
should be accelerated, the sooner the better.
The Chinese steel industry was dominated
by state-owned steel companies for more
than four decades, until the late 1990s, when
private players started to emerge and grow
rapidly. However, state-owned companies nor-
mally respond to changing market conditions
at a slower pace, and the fast-growing private
steel producers have taken over a large share
of steel production. State-owned companies
urgently need to reform the way they man-
age their businesses, as well as their people.
In the longer term, the government, as the
controlling shareholder of the steel compa-
nies, should guide the SOE’s in making a long-
term business plan, and importantly, the plan
should not just be politically right, but com-
mercially viable.
5. Steel companies should be more integrated into
the global steel industry.
Integration, both internally and externally,
has become one of the most difficult problems
of nearly all Chinese steel companies. Inte-
gration into the global steel industry does not
only mean trading steel products and building
facilities in other countries, but also having
the openness to work with industry peers to
share industry-wide responsibilities, impose
influence on future industry development,
and advocate for the image of the industry.
The most critical determinant of successful
integration is the mentality of the top man-
agement, in particular CEO’s. This means that
CEO’s should be exposed to more global orga-
nizations and international events.
6. Steel companies’ human resources system
should be more open.
In contrast to the industries in other steel pro-
ducing regions, the human resources system
of Chinese steel companies is quite closed,
especially that of state-owned companies. Al-
most all Chinese steel companies recruit new-
ly graduated students from universities every
year to comply with the instructions of the
government. It is very rare that Chinese steel
companies recruit talent from the outside
when there are vacant positions. Instead, they
mostly recruit from inside the company to fill
vacancies. The exception is that many private
steel companies open their system to recruit
both fresh graduates and mature talent from
outside. This system makes it very difficult for
Chinese steel companies, in particular state-
owned companies, to attract young talent,
especially internationally competitive special-
ists.
88 Asian Steel Watch
Featured Articles
Myanmar, the Last Frontier in the ASEAN, Will See High Growth of its Steel IndustryDr. Cho, Dae-HyunSenior Principal ResearcherPOSCO Research [email protected]
A new chapter opened in Myanmar in April 2016
when the country’s first non-military govern-
ment in 54 years took office. As Aung San Suu
Kyi’s National League for Democracy (NLD) won
a landslide victory in the country’s parliamenta-
ry elections held in November 2015, Myanmar
drew global attention. Even before the landmark
elections, Myanmar has become a focus of global
attention for its geopolitical and geo-economic
importance since the Thein Sein administration,
launched in 2011, pursued active reform and
opening-up, followed by the lifting of economic
sanctions against Myanmar by the EU in 2013
and the later easing of some U.S. sanctions.
Today, Myanmar is dubbed the “last frontier”
in the ASEAN because of its high growth poten-
tial and high investment attractiveness as fol-
lows.
First, from the geopolitical perspective,
Myanmar borders three important economic re-
gions: China, India, and the ASEAN. Myanmar is
China’s gateway to the Indian Ocean and India’s
gateway to Southeast Asia. It is a strategic hub
that connects massive consumer markets. For
these reasons, Myanmar has high efficiency as a
production base and high potential as a logistics
base for these countries. Roads and ports directly
linking mainland China and the Indian Ocean,
the China-Myanmar-India Highway, and the
Thailand-Myanmar-India Highway are under con-
struction.
Second, Myanmar is a resource-rich country.
Thanks to its complex geology, Myanmar has
abundant natural resources: energy resources,
including natural gas and oil; minerals, including
copper, zinc, tin, tungsten, nickel, and lead; and
gemstones, including rubies and sapphires. How-
ever, except for some natural gas and other re-
sources, no mineral resources have been explored
since the introduction of the Burmese Way to So-
cialism in the late 1960s. Myanmar, the so-called
last bastion of natural resources, has much room
for resources exploration.
Third, Myanmar has low labor costs and high
quality labor, making it an ideal investment desti-
nation for labor-intensive industries. The average
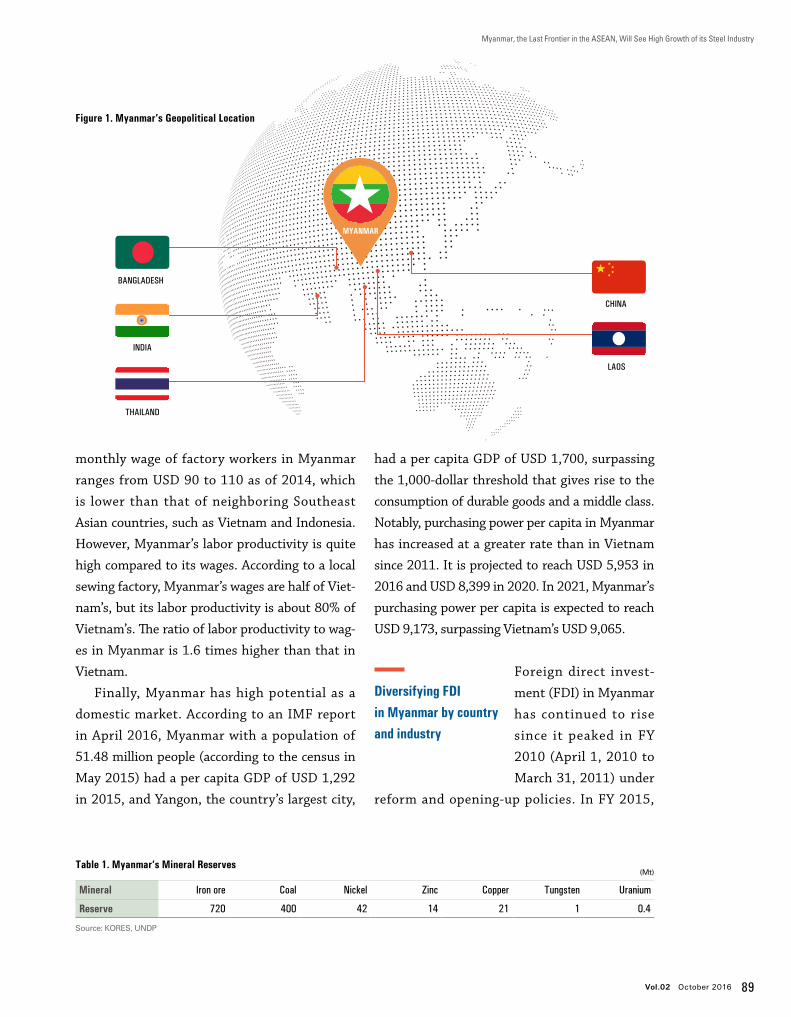
Vol.02 October 2016 89
Myanmar, the Last Frontier in the ASEAN, Will See High Growth of its Steel Industry
monthly wage of factory workers in Myanmar
ranges from USD 90 to 110 as of 2014, which
is lower than that of neighboring Southeast
Asian countries, such as Vietnam and Indonesia.
However, Myanmar’s labor productivity is quite
high compared to its wages. According to a local
sewing factory, Myanmar’s wages are half of Viet-
nam’s, but its labor productivity is about 80% of
Vietnam’s. The ratio of labor productivity to wag-
es in Myanmar is 1.6 times higher than that in
Vietnam.
Finally, Myanmar has high potential as a
domestic market. According to an IMF report
in April 2016, Myanmar with a population of
51.48 million people (according to the census in
May 2015) had a per capita GDP of USD 1,292
in 2015, and Yangon, the country’s largest city,
had a per capita GDP of USD 1,700, surpassing
the 1,000-dollar threshold that gives rise to the
consumption of durable goods and a middle class.
Notably, purchasing power per capita in Myanmar
has increased at a greater rate than in Vietnam
since 2011. It is projected to reach USD 5,953 in
2016 and USD 8,399 in 2020. In 2021, Myanmar’s
purchasing power per capita is expected to reach
USD 9,173, surpassing Vietnam’s USD 9,065.
Foreign direct invest-
ment (FDI) in Myanmar
has continued to rise
since it peaked in FY
2010 (April 1, 2010 to
March 31, 2011) under
reform and opening-up policies. In FY 2015,
Mineral Iron ore Coal Nickel Zinc Copper Tungsten Uranium
Reserve 720 400 42 14 21 1 0.4
Table 1. Myanmar’s Mineral Reserves
Source: KORES, UNDP
Figure 1. Myanmar’s Geopolitical Location
(Mt)
THAILAND
BANGLADESH
INDIA
CHINA
LAOS
MYANMAR
Diversifying FDI in Myanmar by country and industry
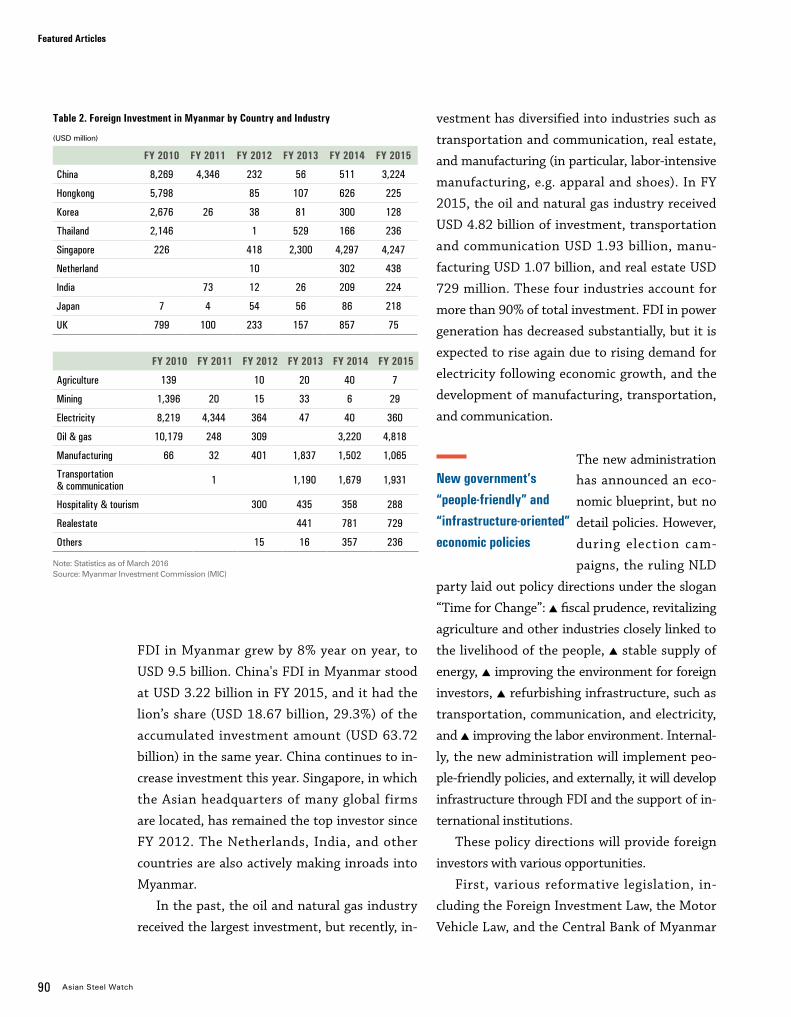
90 Asian Steel Watch
Featured Articles
FY 2010 FY 2011 FY 2012 FY 2013 FY 2014 FY 2015
Agriculture 139 10 20 40 7
Mining 1,396 20 15 33 6 29
Electricity 8,219 4,344 364 47 40 360
Oil & gas 10,179 248 309 3,220 4,818
Manufacturing 66 32 401 1,837 1,502 1,065
Transportation& communication 1 1,190 1,679 1,931
Hospitality & tourism 300 435 358 288
Realestate 441 781 729
Others 15 16 357 236
Note: Statistics as of March 2016Source: Myanmar Investment Commission (MIC)
Table 2. Foreign Investment in Myanmar by Country and Industry
FY 2010 FY 2011 FY 2012 FY 2013 FY 2014 FY 2015
China 8,269 4,346 232 56 511 3,224
Hongkong 5,798 85 107 626 225
Korea 2,676 26 38 81 300 128
Thailand 2,146 1 529 166 236
Singapore 226 418 2,300 4,297 4,247
Netherland 10 302 438
India 73 12 26 209 224
Japan 7 4 54 56 86 218
UK 799 100 233 157 857 75
(USD million)
FDI in Myanmar grew by 8% year on year, to
USD 9.5 billion. China's FDI in Myanmar stood
at USD 3.22 billion in FY 2015, and it had the
lion’s share (USD 18.67 billion, 29.3%) of the
accumulated investment amount (USD 63.72
billion) in the same year. China continues to in-
crease investment this year. Singapore, in which
the Asian headquarters of many global firms
are located, has remained the top investor since
FY 2012. The Netherlands, India, and other
countries are also actively making inroads into
Myanmar.
In the past, the oil and natural gas industry
received the largest investment, but recently, in-
vestment has diversified into industries such as
transportation and communication, real estate,
and manufacturing (in particular, labor-intensive
manufacturing, e.g. apparal and shoes). In FY
2015, the oil and natural gas industry received
USD 4.82 billion of investment, transportation
and communication USD 1.93 billion, manu-
facturing USD 1.07 billion, and real estate USD
729 million. These four industries account for
more than 90% of total investment. FDI in power
generation has decreased substantially, but it is
expected to rise again due to rising demand for
electricity following economic growth, and the
development of manufacturing, transportation,
and communication.
New government’s “people-friendly” and “infrastructure-oriented” economic policies
The new administration has announced an eco-
nomic blueprint, but no
detail policies. However,
during election cam-
paigns, the ruling NLD
party laid out policy directions under the slogan
“Time for Change”: ▲ fiscal prudence, revitalizing
agriculture and other industries closely linked to
the livelihood of the people, ▲ stable supply of
energy, ▲ improving the environment for foreign
investors, ▲ refurbishing infrastructure, such as
transportation, communication, and electricity,
and ▲ improving the labor environment. Internal-
ly, the new administration will implement peo-
ple-friendly policies, and externally, it will develop
infrastructure through FDI and the support of in-
ternational institutions.
These policy directions will provide foreign
investors with various opportunities.
First, various reformative legislation, in-
cluding the Foreign Investment Law, the Motor
Vehicle Law, and the Central Bank of Myanmar
Vol.02 October 2016 91
Myanmar, the Last Frontier in the ASEAN, Will See High Growth of its Steel Industry
Law, are expected to take effect within this
year. As a result, barriers to investment, such as
land lease and local hiring requirements, will be
lowered. Greater independence for the Central
Bank of Myanmar, and open financial policies,
will increase transparency in the financial sec-
tor.
Second, new business opportunities will arise
for medium-to-large infrastructure projects.
Rather than one-off projects, demand for long-
term large-scale projects will likely increase based
on plans: ▲ Yangon New City Project, ▲ transpor-
tation, oil refining, mining, power transmission
and distribution, and road construction projects,
▲ new opportunities for development of special
economic zones.
Third, Myanmar is expected to receive more
economic support and investment thanks to the
US lifting economic sanctions. Myanmar compa-
nies and individuals are being taken off the sanc-
tion list, and will be provided with US loans and
support. In particular, the generalized system of
preference (GSP), the US trade preference pro-
gram, will be applied on November 13, 2016, and
dollar-denominated transactions will be possible
as early as in 2016.
Lastly, the new administration considers
lack of transparency in the government to be an
obstacle to attracting foreign investment. There-
fore, the new government is expected to be more
transparent and fair in decision-making and poli-
cy implementation, for example in the allocation
of business rights.
Meanwhile, “people-friendly” policies will put
new pressures on companies. As the government
has reduced the number of goods exempt from
commercial taxes and increased public utility
rates to boost state coffers for a better labor en-
vironment, companies may need more funds to
enter Myanmar, and are highly likely to suffer
from increased corporate taxes and income taxes.
Moreover, wages are expected to rise due to some
reformative measures in the labor environment,
such as the introduction of a minimum wage,
allowing workers to form unions, and improving
labor standards. With the increased influence
With its growing geopolitical and geo-economic importance, and improved
conditions for foreign investment, Myanmar is expected to maintain
high economic growth until 2020.
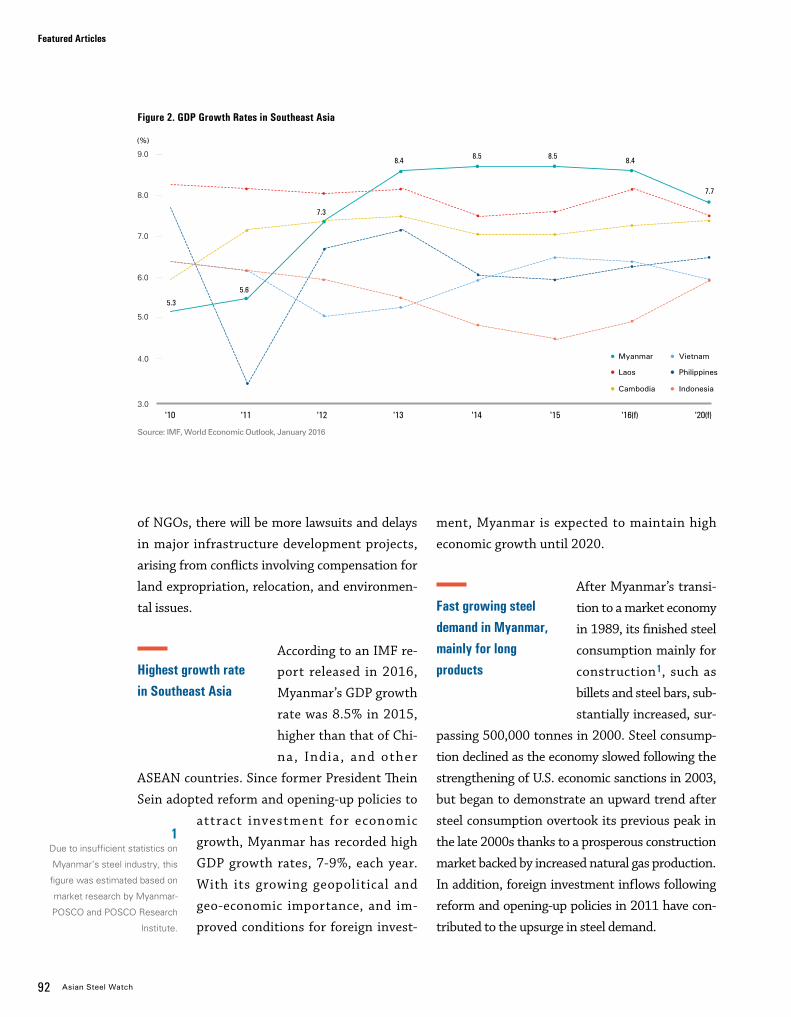
92 Asian Steel Watch
Featured Articles
of NGOs, there will be more lawsuits and delays
in major infrastructure development projects,
arising from conflicts involving compensation for
land expropriation, relocation, and environmen-
tal issues.
Highest growth rate in Southeast Asia
According to an IMF re-port released in 2016,
Myanmar’s GDP growth
rate was 8.5% in 2015,
higher than that of Chi-
na, India , and other
ASEAN countries. Since former President Thein
Sein adopted reform and opening-up policies to
attract investment for economic
growth, Myanmar has recorded high
GDP growth rates, 7-9%, each year.
With its growing geopolitical and
geo-economic importance, and im-
proved conditions for foreign invest-
1Due to insufficient statistics on
Myanmar’s steel industry, this
figure was estimated based on
market research by Myanmar-
POSCO and POSCO Research
Institute.
ment, Myanmar is expected to maintain high
economic growth until 2020.
After Myanmar’s transi-
tion to a market economy
in 1989, its finished steel
consumption mainly for
construction1, such as
billets and steel bars, sub-
stantially increased, sur-
passing 500,000 tonnes in 2000. Steel consump-
tion declined as the economy slowed following the
strengthening of U.S. economic sanctions in 2003,
but began to demonstrate an upward trend after
steel consumption overtook its previous peak in
the late 2000s thanks to a prosperous construction
market backed by increased natural gas production.
In addition, foreign investment inflows following
reform and opening-up policies in 2011 have con-
tributed to the upsurge in steel demand.
(%)
Figure 2. GDP Growth Rates in Southeast Asia
Source: IMF, World Economic Outlook, January 2016
8.0
5.0
7.0
6.0
9.0
3.0
4.0
'10 '11 '12 '13 '14 '16(f) '20(f)'15
5.3
5.6
7.3
8.4 8.5 8.5 8.4
7.7
Myanmar Vietnam
Laos Philippines
Cambodia Indonesia
Fast growing steeldemand in Myanmar, mainly for long products
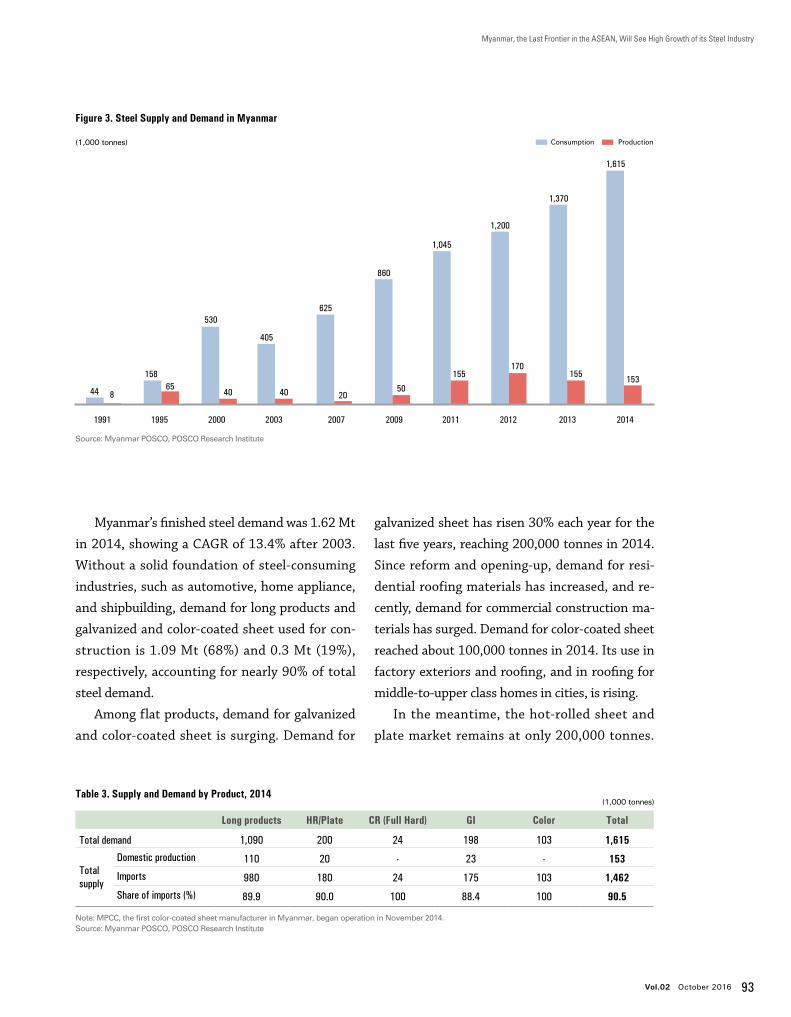
Vol.02 October 2016 93
Myanmar, the Last Frontier in the ASEAN, Will See High Growth of its Steel Industry
ProductionConsumption
Figure 3. Steel Supply and Demand in Myanmar
Table 3. Supply and Demand by Product, 2014
(1,000 tonnes)
(1,000 tonnes)
Long products HR/Plate CR (Full Hard) GI Color Total
Total demand 1,090 200 24 198 103 1,615
Total supply
Domestic production 110 20 - 23 - 153
Imports 980 180 24 175 103 1,462
Share of imports (%) 89.9 90.0 100 88.4 100 90.5
Myanmar’s finished steel demand was 1.62 Mt
in 2014, showing a CAGR of 13.4% after 2003.
Without a solid foundation of steel-consuming
industries, such as automotive, home appliance,
and shipbuilding, demand for long products and
galvanized and color-coated sheet used for con-
struction is 1.09 Mt (68%) and 0.3 Mt (19%),
respectively, accounting for nearly 90% of total
steel demand.
Among flat products, demand for galvanized
and color-coated sheet is surging. Demand for
galvanized sheet has risen 30% each year for the
last five years, reaching 200,000 tonnes in 2014.
Since reform and opening-up, demand for resi-
dential roofing materials has increased, and re-
cently, demand for commercial construction ma-
terials has surged. Demand for color-coated sheet
reached about 100,000 tonnes in 2014. Its use in
factory exteriors and roofing, and in roofing for
middle-to-upper class homes in cities, is rising.
In the meantime, the hot-rolled sheet and
plate market remains at only 200,000 tonnes.
1991 2000 2007 2011 20131995 2003 2009 2012 2014
44 8
15865
530
40 40
405
625
20
860
50
1,045
1,200
1,370
1,615
155153
170155
Source: Myanmar POSCO, POSCO Research Institute
Note: MPCC, the first color-coated sheet manufacturer in Myanmar, began operation in November 2014.Source: Myanmar POSCO, POSCO Research Institute
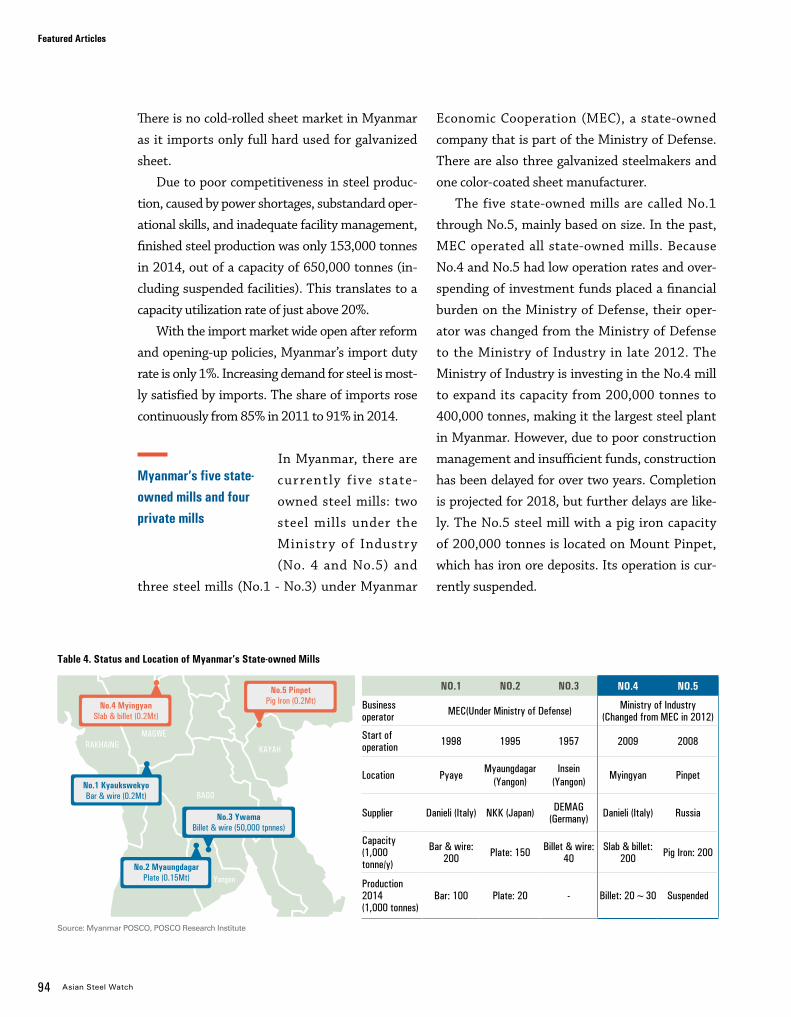
94 Asian Steel Watch
Featured Articles
There is no cold-rolled sheet market in Myanmar
as it imports only full hard used for galvanized
sheet.
Due to poor competitiveness in steel produc-
tion, caused by power shortages, substandard oper-
ational skills, and inadequate facility management,
finished steel production was only 153,000 tonnes
in 2014, out of a capacity of 650,000 tonnes (in-
cluding suspended facilities). This translates to a
capacity utilization rate of just above 20%.
With the import market wide open after reform
and opening-up policies, Myanmar’s import duty
rate is only 1%. Increasing demand for steel is most-
ly satisfied by imports. The share of imports rose
continuously from 85% in 2011 to 91% in 2014.
Myanmar’s five state-owned mills and four private mills
In Myanmar, there are
currently five state-
owned steel mills: two
steel mills under the
Ministry of Industry
(No. 4 and No.5) and
three steel mills (No.1 - No.3) under Myanmar
NO.1 NO.2 NO.3 NO.4 NO.5
Businessoperator MEC(Under Ministry of Defense) Ministry of Industry
(Changed from MEC in 2012)
Start of operation 1998 1995 1957 2009 2008
Location PyayeMyaungdagar
(Yangon)Insein
(Yangon)Myingyan Pinpet
Supplier Danieli (Italy) NKK (Japan) DEMAG(Germany) Danieli (Italy) Russia
Capacity(1,000 tonne/y)
Bar & wire: 200 Plate: 150 Billet & wire:
40Slab & billet:
200 Pig Iron: 200
Production 2014(1,000 tonnes)
Bar: 100 Plate: 20 - Billet: 20~30 Suspended
MANDALAY
SAGAING
BAGO
KAYAH
KACHIN
CHIN
RAKHAINGMAGWE
SHAN
No.2 MyaungdagarPlate (0.15Mt)
No.1 Kyaukswekyo Bar & wire (0.2Mt)
No.3 Ywama Billet & wire (50,000 tpnnes)
No.5 PinpetPig Iron (0.2Mt)No.4 Myingyan
Slab & billet (0.2Mt)
Table 4. Status and Location of Myanmar’s State-owned Mills
Source: Myanmar POSCO, POSCO Research Institute
Economic Cooperation (MEC), a state-owned
company that is part of the Ministry of Defense.
There are also three galvanized steelmakers and
one color-coated sheet manufacturer.
The five state-owned mills are called No.1
through No.5, mainly based on size. In the past,
MEC operated all state-owned mills. Because
No.4 and No.5 had low operation rates and over-
spending of investment funds placed a financial
burden on the Ministry of Defense, their oper-
ator was changed from the Ministry of Defense
to the Ministry of Industry in late 2012. The
Ministry of Industry is investing in the No.4 mill
to expand its capacity from 200,000 tonnes to
400,000 tonnes, making it the largest steel plant
in Myanmar. However, due to poor construction
management and insufficient funds, construction
has been delayed for over two years. Completion
is projected for 2018, but further delays are like-
ly. The No.5 steel mill with a pig iron capacity
of 200,000 tonnes is located on Mount Pinpet,
which has iron ore deposits. Its operation is cur-
rently suspended.
Yangon
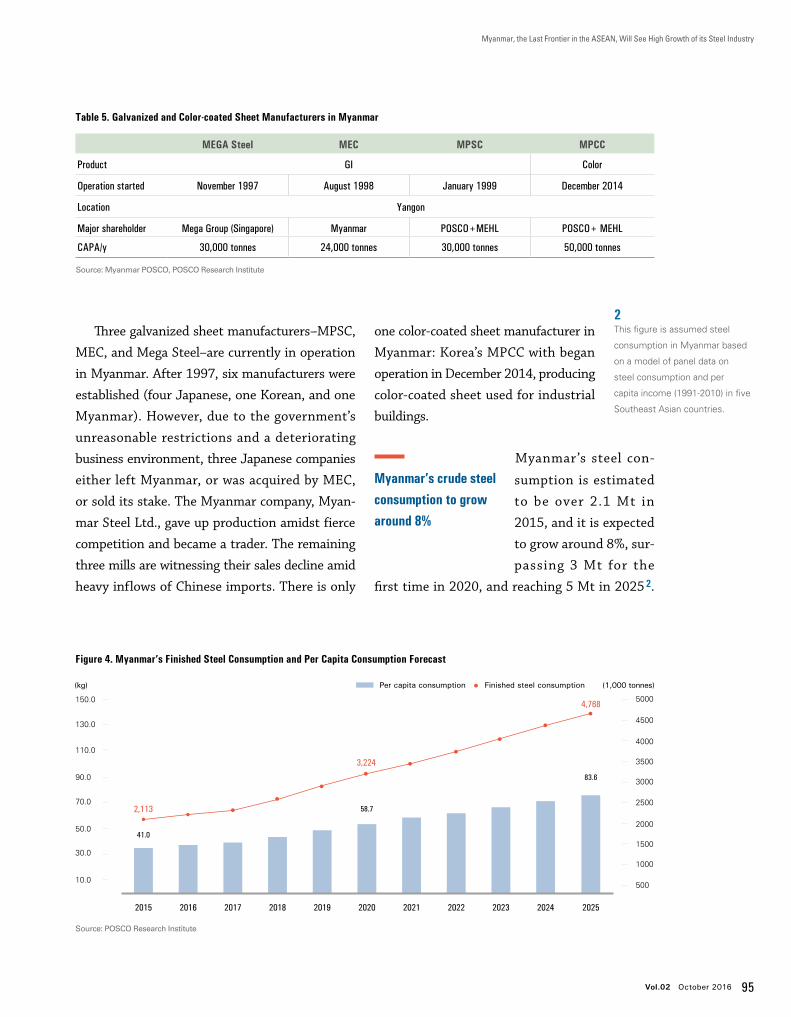
Vol.02 October 2016 95
Myanmar, the Last Frontier in the ASEAN, Will See High Growth of its Steel Industry
Table 5. Galvanized and Color-coated Sheet Manufacturers in Myanmar
Source: Myanmar POSCO, POSCO Research Institute
MEGA Steel MEC MPSC MPCC
Product GI Color
Operation started November 1997 August 1998 January 1999 December 2014
Location Yangon
Major shareholder Mega Group (Singapore) Myanmar POSCO+MEHL POSCO+ MEHL
CAPA/y 30,000 tonnes 24,000 tonnes 30,000 tonnes 50,000 tonnes
Source: POSCO Research Institute
2015 2017 2019 2021 20232016 2018 2020 2022 2024 2025
41.0
2,113
3,224
4,768
58.7
83.6
10.0500
1000
1500
2000
2500
3000
3500
4000
4500
5000
30.0
50.0
70.0
90.0
110.0
130.0
150.0
Figure 4. Myanmar’s Finished Steel Consumption and Per Capita Consumption Forecast
(1,000 tonnes) (kg)
Three galvanized sheet manufacturers–MPSC,
MEC, and Mega Steel–are currently in operation
in Myanmar. After 1997, six manufacturers were
established (four Japanese, one Korean, and one
Myanmar). However, due to the government’s
unreasonable restrictions and a deteriorating
business environment, three Japanese companies
either left Myanmar, or was acquired by MEC,
or sold its stake. The Myanmar company, Myan-
mar Steel Ltd., gave up production amidst fierce
competition and became a trader. The remaining
three mills are witnessing their sales decline amid
heavy inflows of Chinese imports. There is only
one color-coated sheet manufacturer in
Myanmar: Korea’s MPCC with began
operation in December 2014, producing
color-coated sheet used for industrial
buildings.
Myanmar’s crude steel consumption to grow around 8%
Myanmar’s steel con-
sumption is estimated
to be over 2.1 Mt in
2015, and it is expected
to grow around 8%, sur-
passing 3 Mt for the
first time in 2020, and reaching 5 Mt in 2025 2.
2This figure is assumed steel
consumption in Myanmar based
on a model of panel data on
steel consumption and per
capita income (1991-2010) in five
Southeast Asian countries.
Per capita consumption Finished steel consumption
96 Asian Steel Watch
Featured Articles
Demand for long products and flat products for construction is projected
to lead the market because Myanmar’s economic development will
be centered on infrastructure, construction, and light industries
in the short-to-mid term.
Per capita steel consumption is also expected to
increase, from 41kg in 2015 to nearly 60kg in
2020, and over 80kg in 2025.
Demand for long products and flat products
for construction is projected to lead the market
because Myanmar’s economic development will
be centered on infrastructure, construction, and
light industries in the short-to-mid term.
Amidst increasing steel
demand, the foremost
challenges for Myan-
mar ’s steel industr y
are building a stable
production system for
state-owned steel mills and increasing capacity
to defend against imports. Most importantly, it
is necessary to normalize the operation of the
Myingyan steel plant (No. 4 steel plant), which
is a small-scale upstream producer, but the only
slab and billet maker in Myanmar. The Mying-
yan steel plant has an operation rate of just
above 10%, due to troubled facilities that hinder
production, aggravated by logistics troubles
caused by the long distance between the steel
plant and Pinpet iron mine (over 200 kilometers
away) and its market, Yangon (over 500 kilome-
ters away). To make matters worse, investments
were made after 2010 in facilities for down-
stream production, including electric arc furnac-
es, hot-rolled, cold-rolled, galvanized, and long
products, but poor management of investments
delayed operations. In order to get on track, the
Myingyan steel plant needs to build a logistics
network between the Pinpet mine and Yangon,
effectively manage facilities with support from
equipment suppliers, and ensure transparency
in the management of investment projects. Re-
location nearer to Yangon and new investment
would be plausible alternatives.
Myanmar’s steel industry is greatly affected
by the overcapacity of steel powerhouse China.
Even in the local mill-dominated galvanized
sheet market, local mills are losing market
share to cheap Chinese products. For further
growth, Myanmar’s steel industry needs to
State-owned mills need to secure competitivenessand respond to imports
Vol.02 October 2016 97
Myanmar, the Last Frontier in the ASEAN, Will See High Growth of its Steel Industry
revamp management and receive active govern-
ment support until they gain competitiveness.
Myanmar was only a least developed country
recently, and it has limited markets compared
to Vietnam and other neighboring countries.
For example, in the galvanized sheet market,
according to market surveys conducted in 2011
and 2012 by POSCO Research Institute, Myan-
mar had feeble demand for channels, sandwich
panels, and guardrails, which are made from gal-
vanized sheets, and some traders did not even
Success Case of Myanmar POSCO Steel Co., Ltd. (MPSC)
know about such products. However, a recent
survey in 2015 shows that there is an increasing
number of channel processing companies in
Myanmar. After only several years, Myanmar
is witnessing the rapid growth of markets that
never existed before. Under these circumstanc-
es, Myanmar needs to seek marketing strategies
to target new markets, considering the growth
trajectory of neighboring countries, and build
new business models to ensure the sustainabili-
ty of local steel mills.
Vol.02 October 2016 97
finally removed the unfair regulations in 2006. Af-
ter operations resumed, MPSC improved product
quality and adopted premium marketing strate-
gies. Thanks to the success of TV commercials, its
product, Super Star, was established as a premium
brand. Within only 2-3 months after the TV commer-
cials aired, MPSC overwhelmed its rivals in terms
of orders and pricing. Its market share grew rapidly
each year (10% → 15% → 25%), and its selling
price is 5~20% higher than that of its competitors.
Moreover, with its diligent tax payment (20th largest
taxpayer in FY 2010 ), MPSC is regarded as an ex-
emplary foreign company by the Myanmar govern-
ment. Through various corporate social responsibil-
ity (CSR) activities, MPSC has cultivated a positive
company image. The company still maintains a
higher market share and price point than its rivals.
As the 20-year joint venture ends in 2017 (extendible
twice, for five years each), MPSC is seeking various
measures to respond to Chinese imports and make
new investments to produce high-quality products
in Myanmar.
Myanmar POSCO Steel Co., Ltd. (MPSC) is a roll-
ing mill with an annual capacity of 30,000 tonnes of
galvanized sheet for roofing, and a joint venture es-
tablished in 1997 (POSCO 70%, MEHL 30%). At that
time, four Japanese companies occupied the market,
but MPSC ventured into every corner of the country
to find new markets. In 2000, only two years after be-
ginning operation, MPSC recorded net profits.
However, cheap smuggled goods began pouring
into Myanmar after 2004, and regulations on thick-
ness became unreasonably strict in 2005. Most local
steel producers in Myanmar reduced or stopped op-
erations. MPSC also shut down operations for over
a year. Smuggled goods occupied the market.
MPSC, together with its partner, engaged in
active government relations until the government
EXAMINING THE PAST 100 YEARSWHERE IS THE STEEL SUPER CYCLE HEADED?
MARKET TREND & ANALYSIS
Dr. Moon-Kee Kong
Senior Principal ResearcherPOSCO Research [email protected]
Jiho Yoo
ResearcherPOSCO Research [email protected]
Dr. Jun H. Goh
Managing DirectorPOSCO Research [email protected]

E X A M I N I N G T H E P A S T 1 0 0 Y E A R S : W H E R E I S T H E S T E E L S U P E R C Y C L E H E A D E D ?
Vol.02 October 2016 99
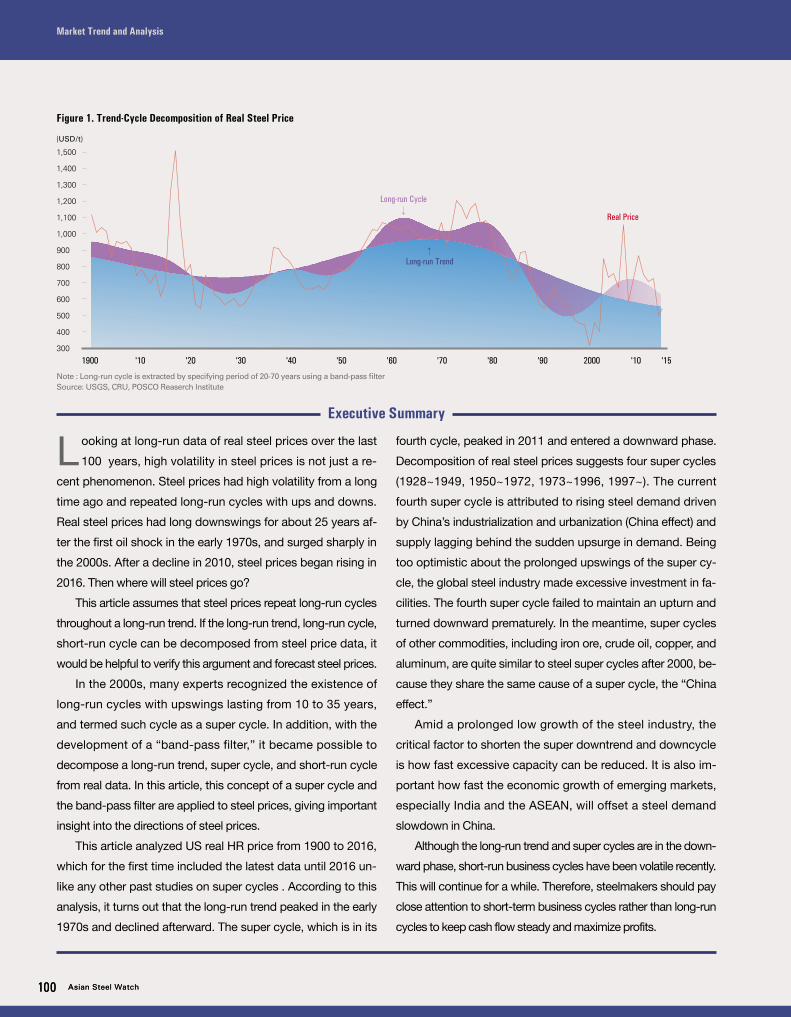
100 Asian Steel Watch
Market Trend and Analysis
L ooking at long-run data of real steel prices over the last
100 years, high volatility in steel prices is not just a re-
cent phenomenon. Steel prices had high volatility from a long
time ago and repeated long-run cycles with ups and downs.
Real steel prices had long downswings for about 25 years af-
ter the first oil shock in the early 1970s, and surged sharply in
the 2000s. After a decline in 2010, steel prices began rising in
2016. Then where will steel prices go?
This article assumes that steel prices repeat long-run cycles
throughout a long-run trend. If the long-run trend, long-run cycle,
short-run cycle can be decomposed from steel price data, it
would be helpful to verify this argument and forecast steel prices.
In the 2000s, many experts recognized the existence of
long-run cycles with upswings lasting from 10 to 35 years,
and termed such cycle as a super cycle. In addition, with the
development of a “band-pass filter,” it became possible to
decompose a long-run trend, super cycle, and short-run cycle
from real data. In this article, this concept of a super cycle and
the band-pass filter are applied to steel prices, giving important
insight into the directions of steel prices.
This article analyzed US real HR price from 1900 to 2016,
which for the first time included the latest data until 2016 un-
like any other past studies on super cycles . According to this
analysis, it turns out that the long-run trend peaked in the early
1970s and declined afterward. The super cycle, which is in its
fourth cycle, peaked in 2011 and entered a downward phase.
Decomposition of real steel prices suggests four super cycles
(1928~1949, 1950~1972, 1973~1996, 1997~). The current
fourth super cycle is attributed to rising steel demand driven
by China’s industrialization and urbanization (China effect) and
supply lagging behind the sudden upsurge in demand. Being
too optimistic about the prolonged upswings of the super cy-
cle, the global steel industry made excessive investment in fa-
cilities. The fourth super cycle failed to maintain an upturn and
turned downward prematurely. In the meantime, super cycles
of other commodities, including iron ore, crude oil, copper, and
aluminum, are quite similar to steel super cycles after 2000, be-
cause they share the same cause of a super cycle, the “China
effect.”
Amid a prolonged low growth of the steel industry, the
critical factor to shorten the super downtrend and downcycle
is how fast excessive capacity can be reduced. It is also im-
portant how fast the economic growth of emerging markets,
especially India and the ASEAN, will offset a steel demand
slowdown in China.
Although the long-run trend and super cycles are in the down-
ward phase, short-run business cycles have been volatile recently.
This will continue for a while. Therefore, steelmakers should pay
close attention to short-term business cycles rather than long-run
cycles to keep cash flow steady and maximize profits.
Executive Summary
1,500
1,100
1,300
900
700
400
1,400
1,000
1,200
800
500
600
300
Long-run Cycle
←
Real Price
←
Long-run Trend
Figure 1. Trend-Cycle Decomposition of Real Steel Price
Note : Long-run cycle is extracted by specifying period of 20-70 years using a band-pass filter Source: USGS, CRU, POSCO Reaserch Institute
1900 '10 '15'10'50'30 '70'20 '60'40 '80 '90 2000
100 Asian Steel Watch
(USD/t)
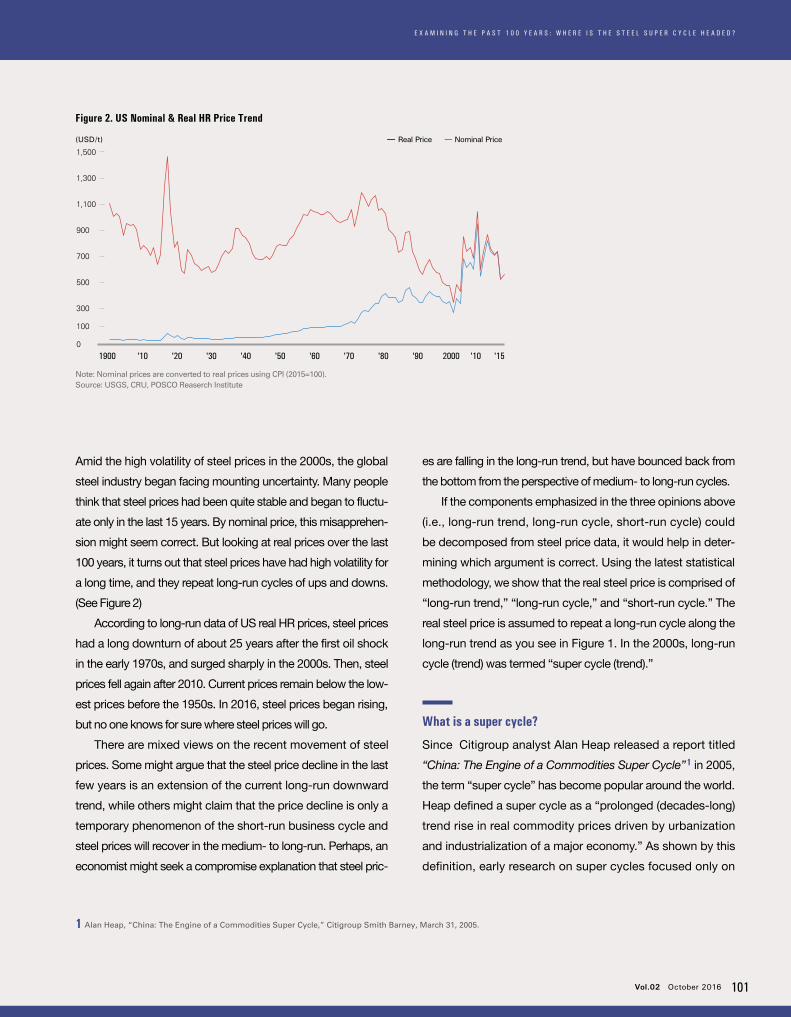
E X A M I N I N G T H E P A S T 1 0 0 Y E A R S : W H E R E I S T H E S T E E L S U P E R C Y C L E H E A D E D ?
Vol.02 October 2016 101
Amid the high volatility of steel prices in the 2000s, the global
steel industry began facing mounting uncertainty. Many people
think that steel prices had been quite stable and began to fluctu-
ate only in the last 15 years. By nominal price, this misapprehen-
sion might seem correct. But looking at real prices over the last
100 years, it turns out that steel prices have had high volatility for
a long time, and they repeat long-run cycles of ups and downs.
(See Figure 2)
According to long-run data of US real HR prices, steel prices
had a long downturn of about 25 years after the first oil shock
in the early 1970s, and surged sharply in the 2000s. Then, steel
prices fell again after 2010. Current prices remain below the low-
est prices before the 1950s. In 2016, steel prices began rising,
but no one knows for sure where steel prices will go.
There are mixed views on the recent movement of steel
prices. Some might argue that the steel price decline in the last
few years is an extension of the current long-run downward
trend, while others might claim that the price decline is only a
temporary phenomenon of the short-run business cycle and
steel prices will recover in the medium- to long-run. Perhaps, an
economist might seek a compromise explanation that steel pric-
es are falling in the long-run trend, but have bounced back from
the bottom from the perspective of medium- to long-run cycles.
If the components emphasized in the three opinions above
(i.e., long-run trend, long-run cycle, short-run cycle) could
be decomposed from steel price data, it would help in deter-
mining which argument is correct. Using the latest statistical
methodology, we show that the real steel price is comprised of
“long-run trend,” “long-run cycle,” and “short-run cycle.” The
real steel price is assumed to repeat a long-run cycle along the
long-run trend as you see in Figure 1. In the 2000s, long-run
cycle (trend) was termed “super cycle (trend).”
What is a super cycle?
Since Citigroup analyst Alan Heap released a report titled
“China: The Engine of a Commodities Super Cycle”1 in 2005,
the term “super cycle” has become popular around the world.
Heap defined a super cycle as a “prolonged (decades-long)
trend rise in real commodity prices driven by urbanization
and industrialization of a major economy.” As shown by this
definition, early research on super cycles focused only on
Figure 2. US Nominal & Real HR Price Trend
Real Price Nominal Price(USD/t)
1,500
1,100
1,300
900
700
100
0
500
300
1900 '40 '80'20 '60 2000'10 '50 '90'30 '70 '15'10
Note: Nominal prices are converted to real prices using CPI (2015=100).Source: USGS, CRU, POSCO Reaserch Institute
1 Alan Heap, “China: The Engine of a Commodities Super Cycle,” Citigroup Smith Barney, March 31, 2005.
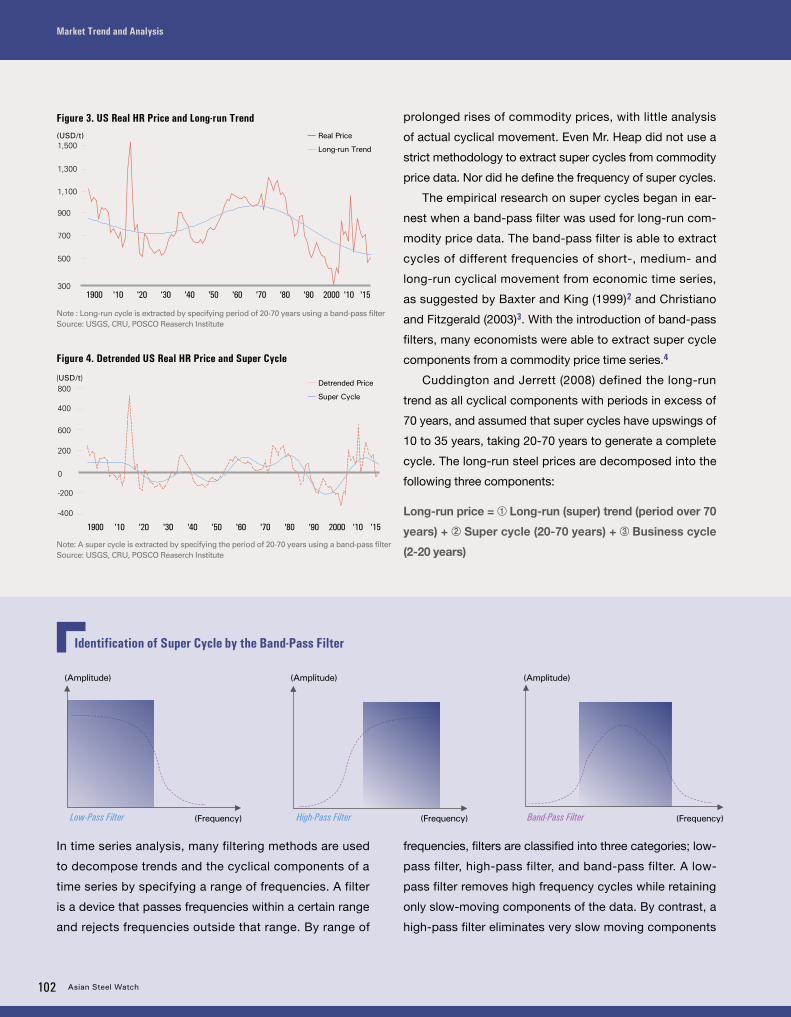
102 Asian Steel Watch
Market Trend and Analysis
Real Price
Long-run Trend
Figure 3. US Real HR Price and Long-run Trend(USD/t)1,500
1,100
1,300
900
700
500
300
Note : Long-run cycle is extracted by specifying period of 20-70 years using a band-pass filter Source: USGS, CRU, POSCO Reaserch Institute
1900 '10 '15'10'50'30 '70'20 '60'40 '80 '90 2000
1900 '10 '15'10'50'30 '70'20 '60'40 '80 '90 2000
-400
400
0
800
200
-200
600
Figure 4. Detrended US Real HR Price and Super Cycle
Note: A super cycle is extracted by specifying the period of 20-70 years using a band-pass filterSource: USGS, CRU, POSCO Reaserch Institute
Detrended Price
Super Cycle
(USD/t)
prolonged rises of commodity prices, with little analysis
of actual cyclical movement. Even Mr. Heap did not use a
strict methodology to extract super cycles from commodity
price data. Nor did he define the frequency of super cycles.
The empirical research on super cycles began in ear-
nest when a band-pass filter was used for long-run com-
modity price data. The band-pass filter is able to extract
cycles of different frequencies of short-, medium- and
long-run cyclical movement from economic time series,
as suggested by Baxter and King (1999)2 and Christiano
and Fitzgerald (2003)3. With the introduction of band-pass
filters, many economists were able to extract super cycle
components from a commodity price time series.4
Cuddington and Jerrett (2008) defined the long-run
trend as all cyclical components with periods in excess of
70 years, and assumed that super cycles have upswings of
10 to 35 years, taking 20-70 years to generate a complete
cycle. The long-run steel prices are decomposed into the
following three components:
Long-run price = ① Long-run (super) trend (period over 70
years) + ② Super cycle (20-70 years) + ③ Business cycle
(2-20 years)
In time series analysis, many filtering methods are used
to decompose trends and the cyclical components of a
time series by specifying a range of frequencies. A filter
is a device that passes frequencies within a certain range
and rejects frequencies outside that range. By range of
frequencies, filters are classified into three categories; low-
pass filter, high-pass filter, and band-pass filter. A low-
pass filter removes high frequency cycles while retaining
only slow-moving components of the data. By contrast, a
high-pass filter eliminates very slow moving components
Low-Pass Filter
(Amplitude)
(Frequency) High-Pass Filter
(Amplitude)
(Frequency) Band-Pass Filter
(Amplitude)
(Frequency)
Identification of Super Cycle by the Band-Pass Filter
102 Asian Steel Watch
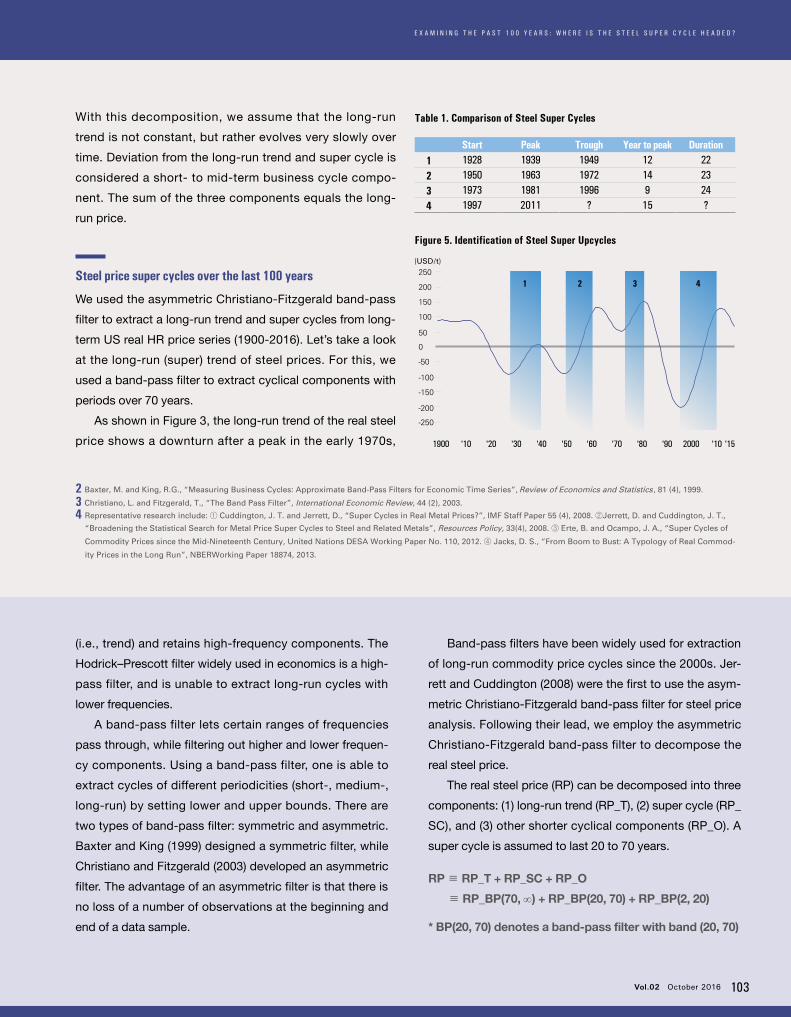
E X A M I N I N G T H E P A S T 1 0 0 Y E A R S : W H E R E I S T H E S T E E L S U P E R C Y C L E H E A D E D ?
Vol.02 October 2016 103
Table 1. Comparison of Steel Super Cycles
Start Peak Trough Year to peak Duration1 1928 1939 1949 12 222 1950 1963 1972 14 233 1973 1981 1996 9 244 1997 2011 ? 15 ?
Figure 5. Identification of Steel Super Upcycles
250
150
0
200
100
-50
-150
50
-100
-200
-250
1 2 4
(USD/t)
3
1900 '10 '15'10'50'30 '70'20 '60'40 '80 '90 2000
2 Baxter, M. and King, R.G., “Measuring Business Cycles: Approximate Band-Pass Filters for Economic Time Series”, Review of Economics and Statistics, 81 (4), 1999.
3 Christiano, L. and Fitzgerald, T., “The Band Pass Filter”, International Economic Review, 44 (2), 2003.
4 Representative research include: ① Cuddington, J. T. and Jerrett, D., “Super Cycles in Real Metal Prices?”, IMF Staff Paper 55 (4), 2008. ②Jerrett, D. and Cuddington, J. T.,
“Broadening the Statistical Search for Metal Price Super Cycles to Steel and Related Metals”, Resources Policy, 33(4), 2008. ③ Erte, B. and Ocampo, J. A., “Super Cycles of
Commodity Prices since the Mid-Nineteenth Century, United Nations DESA Working Paper No. 110, 2012. ④ Jacks, D. S., “From Boom to Bust: A Typology of Real Commod-
ity Prices in the Long Run”, NBERWorking Paper 18874, 2013.
With this decomposition, we assume that the long-run
trend is not constant, but rather evolves very slowly over
time. Deviation from the long-run trend and super cycle is
considered a short- to mid-term business cycle compo-
nent. The sum of the three components equals the long-
run price.
Steel price super cycles over the last 100 years
We used the asymmetric Christiano-Fitzgerald band-pass
filter to extract a long-run trend and super cycles from long-
term US real HR price series (1900-2016). Let’s take a look
at the long-run (super) trend of steel prices. For this, we
used a band-pass filter to extract cyclical components with
periods over 70 years.
As shown in Figure 3, the long-run trend of the real steel
price shows a downturn after a peak in the early 1970s,
(i.e., trend) and retains high-frequency components. The
Hodrick–Prescott filter widely used in economics is a high-
pass filter, and is unable to extract long-run cycles with
lower frequencies.
A band-pass filter lets certain ranges of frequencies
pass through, while filtering out higher and lower frequen-
cy components. Using a band-pass filter, one is able to
extract cycles of different periodicities (short-, medium-,
long-run) by setting lower and upper bounds. There are
two types of band-pass filter: symmetric and asymmetric.
Baxter and King (1999) designed a symmetric filter, while
Christiano and Fitzgerald (2003) developed an asymmetric
filter. The advantage of an asymmetric filter is that there is
no loss of a number of observations at the beginning and
end of a data sample.
Band-pass filters have been widely used for extraction
of long-run commodity price cycles since the 2000s. Jer-
rett and Cuddington (2008) were the first to use the asym-
metric Christiano-Fitzgerald band-pass filter for steel price
analysis. Following their lead, we employ the asymmetric
Christiano-Fitzgerald band-pass filter to decompose the
real steel price.
The real steel price (RP) can be decomposed into three
components: (1) long-run trend (RP_T), (2) super cycle (RP_
SC), and (3) other shorter cyclical components (RP_O). A
super cycle is assumed to last 20 to 70 years.
RP ≡ RP_T + RP_SC + RP_O
≡ RP_BP(70, ∞) + RP_BP(20, 70) + RP_BP(2, 20)
* BP(20, 70) denotes a band-pass filter with band (20, 70)
Vol.02 October 2016 103

104 Asian Steel Watch
Market Trend and Analysis
and the real steel price repeats a decade-long fluctuation
throughout the long-run trend. However, with this graph
alone, it is not easy to judge whether the long-run trend
has already hit bottom or will continue to fall. Therefore, in
order to more precisely predict the future direction of the
real steel price, it is necessary to see the super cycle mov-
ing along with the long-run trend.
From the detrended real steel prices (difference be-
tween actual price data and the long-run trend), we can
extract super cycles with a period of 20-70 years by using
a band-pass filter. The super cycles of the detrended real
steel prices are shown in Figure 4.
There is strong evidence of super cycles in the real
steel prices. The length of a steel price super cycle is about
20-25 years, similar to many other commodity super cy-
cles as shown later. The upward phase of past steel price
super cycles lasted for 10-15 years. Decomposition of the
real steel prices suggests that there were four long upcycle
periods from 1900 to 2016 (1928-1939, 1950-1963, 1973-
1981, 1997-2011). (see Figure 4 and Table 1).
Our results show that the current steel price super
cycle is the fourth over the past 100 years, after peaking
in 2011. The results are not sufficient to determine when
the fourth super cycle will hit bottom, but there is a strong
possibility that the downcycle will continue for the next
several years.
How does a super cycle begin?
In order to forecast the direction of a super cycle, it is
important to identify which mechanism past super cy-
cles are generated from. Alan Heap (2005) argued that
commodity super cycles are demand-driven, and highly
materials-intensive economic activity is the cause of super
cycles. However, commodity prices are decided by the
demand-supply equilibrium. For this reason, emphasizing
only demand side factors can lead to the misjudgment
of a super cycle. In keeping with Cuddington and Jerrett
(2009),5 there are three conditions necessary for the occur-
5 Cuddington, J. T. and Jerrett, D., “The Recent Metals Price Retreat: So Long Super Cycle?”, Presentation for the International Pig Iron Association, March 4, 2009
rence of a super cycle:
① Continuous high demand: Past super cycles were
driven by exponential increases in demand (e.g., US eco-
nomic growth in the early 1900s, around World War II
(1940s), post-war reconstruction after 1950s)
② Short-term supply constraints: Short-term supply
shortages trigger price increases (A short-term demand
surge in steel and non-ferrous metals is very likely to cause
supply shortages.)
③ Slow capacity adjustment in response to demand,
driving continuous price increase (The speed of long-run
supply response is critical for sustained demand expansion
to give rise to a super cycle. In the steel industry, capacity
expansion lags behind surging demand.)
The global steel market in the 2000s satisfied the three
conditions to see another super cycle. First, steel demand
in China grew explosively following industrialization and ur-
banization in the 2000s. Second, the sudden disruption in
raw materials supplies caused by natural disasters in 2005
and 2008 constrained steel production in the short term.
Third, new capacity increased only slightly until the early
2000s. Considering the demand rise in China, the supply
glut was smaller than expected in the early 2000s. After
the global financial crisis, China’s overcapacity emerged
as a serious issue in the global steel industry. Clearly, steel
prices in the fourth super cycle, which is still underway, are
affected primarily by the ups and downs of the so-called
“China effect.”
Co-movement with other commodity super cycles
How does the steel price super cycle differ from other
commodity super cycles? To answer this question, we ex-
tracted super cycles of iron ore, which is most relevant to
steel, and other commodities, including crude oil, copper,
and aluminum, using the same band-pass filter.
As shown in Figure 6, other commodity super cycles
are quite similar to steel super cycles after 2000, because
they share the same cause, the “China effect.”
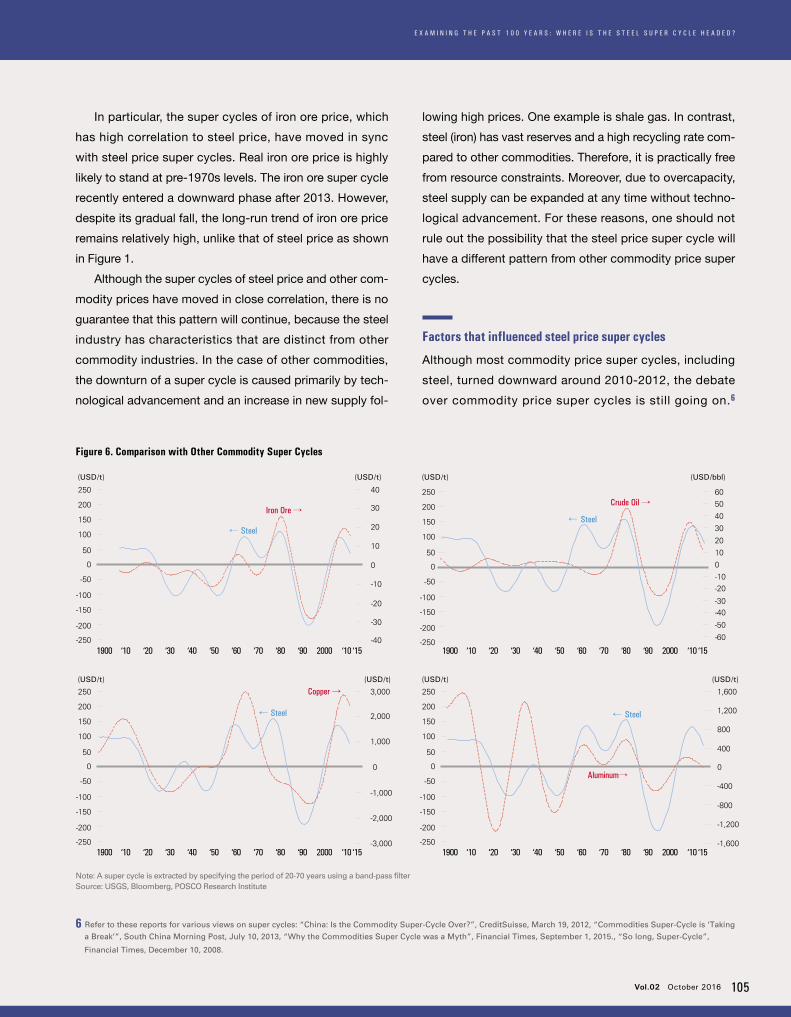
E X A M I N I N G T H E P A S T 1 0 0 Y E A R S : W H E R E I S T H E S T E E L S U P E R C Y C L E H E A D E D ?
Vol.02 October 2016 105
In particular, the super cycles of iron ore price, which
has high correlation to steel price, have moved in sync
with steel price super cycles. Real iron ore price is highly
likely to stand at pre-1970s levels. The iron ore super cycle
recently entered a downward phase after 2013. However,
despite its gradual fall, the long-run trend of iron ore price
remains relatively high, unlike that of steel price as shown
in Figure 1.
Although the super cycles of steel price and other com-
modity prices have moved in close correlation, there is no
guarantee that this pattern will continue, because the steel
industry has characteristics that are distinct from other
commodity industries. In the case of other commodities,
the downturn of a super cycle is caused primarily by tech-
nological advancement and an increase in new supply fol-
lowing high prices. One example is shale gas. In contrast,
steel (iron) has vast reserves and a high recycling rate com-
pared to other commodities. Therefore, it is practically free
from resource constraints. Moreover, due to overcapacity,
steel supply can be expanded at any time without techno-
logical advancement. For these reasons, one should not
rule out the possibility that the steel price super cycle will
have a different pattern from other commodity price super
cycles.
Factors that influenced steel price super cycles
Although most commodity price super cycles, including
steel, turned downward around 2010-2012, the debate
over commodity price super cycles is still going on.6
Note: A super cycle is extracted by specifying the period of 20-70 years using a band-pass filter Source: USGS, Bloomberg, POSCO Research Institute
Aluminum→
← Steel
(USD/t) (USD/t)
1900 ‘10 ‘50‘30 ‘70 2000‘20 ‘60 ‘90‘40 ‘80 ‘10‘15
Copper →
← Steel
(USD/t) (USD/t)
1900 ‘10 ‘50‘30 ‘70 2000‘20 ‘60 ‘90‘40 ‘80 ‘10‘15
Figure 6. Comparison with Other Commodity Super Cycles
Crude Oil →
← Steel
(USD/t) (USD/bbl)
1900 ‘10 ‘50‘30 ‘70 2000‘20 ‘60 ‘90‘40 ‘80 ‘10‘15
250
150
0
200
100
-50
-150
50
-100
-200
-250
6050
40
30
20
10
-10
0
-20
-30-40
-50
-60
Iron Ore →
← Steel
(USD/t) (USD/t)
250
150
0
200
100
-50
-150
50
-100
-200
-2501900 ‘10 ‘50‘30 ‘70 2000‘20 ‘60 ‘90‘40 ‘80 ‘10‘15
40
20
-10
30
10
-20
-40
0
-30
250
150
0
200
100
-50
-150
50
-100
-200
-250
3,000
1,000
2,000
-1,000
0
-2,000
-3,000
1,600
1,200
800
400
-400
0
-800
-1,200
-1,600
250
150
0
200
100
-50
-150
50
-100
-200
-250
6 Refer to these reports for various views on super cycles: “China: Is the Commodity Super-Cycle Over?”, CreditSuisse, March 19, 2012, “Commodities Super-Cycle is ‘Taking a Break’”, South China Morning Post, July 10, 2013, “Why the Commodities Super Cycle was a Myth”, Financial Times, September 1, 2015., “So long, Super-Cycle”,
Financial Times, December 10, 2008.
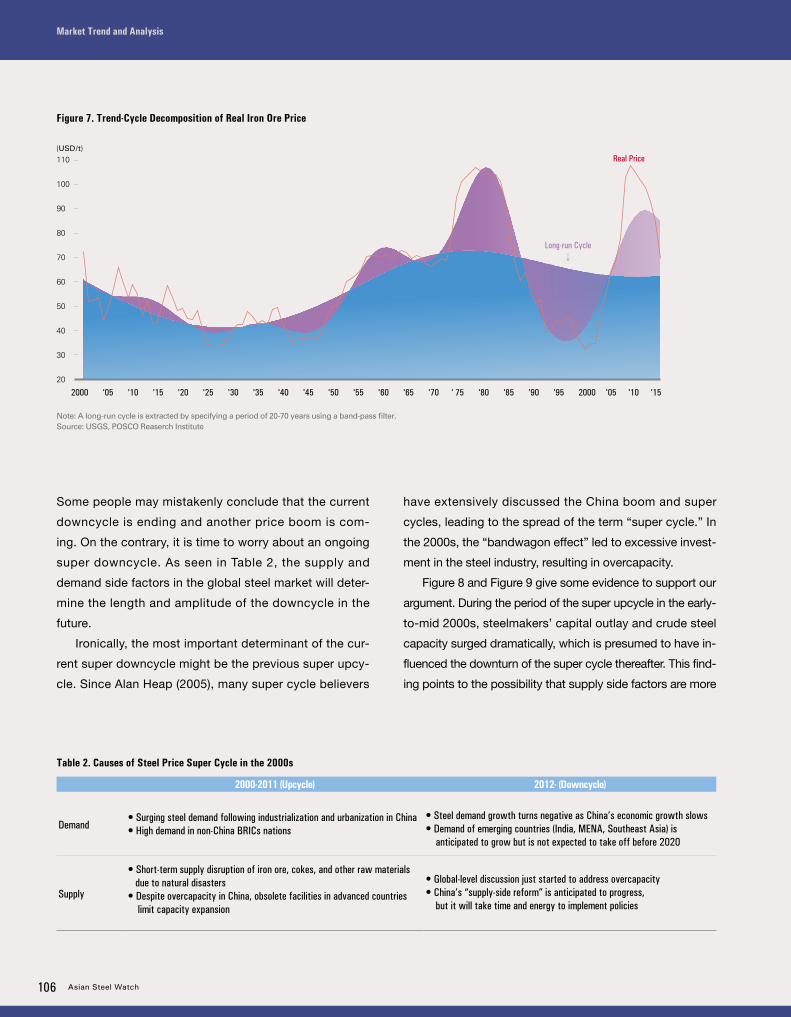
106 Asian Steel Watch
Market Trend and Analysis
Table 2. Causes of Steel Price Super Cycle in the 2000s
2000-2011 (Upcycle) 2012- (Downcycle)
Demand• Surging steel demand following industrialization and urbanization in China• High demand in non-China BRICs nations
• Steel demand growth turns negative as China’s economic growth slows• Demand of emerging countries (India, MENA, Southeast Asia) is anticipated to grow but is not expected to take off before 2020
Supply
• Short-term supply disruption of iron ore, cokes, and other raw materials due to natural disasters• Despite overcapacity in China, obsolete facilities in advanced countries limit capacity expansion
• Global-level discussion just started to address overcapacity • China’s “supply-side reform” is anticipated to progress, but it will take time and energy to implement policies
Some people may mistakenly conclude that the current
downcycle is ending and another price boom is com-
ing. On the contrary, it is time to worry about an ongoing
super downcycle. As seen in Table 2, the supply and
demand side factors in the global steel market will deter-
mine the length and amplitude of the downcycle in the
future.
Ironically, the most important determinant of the cur-
rent super downcycle might be the previous super upcy-
cle. Since Alan Heap (2005), many super cycle believers
2000 '05 '10 '15 '20 '25 '30 '35 '40 '45 '50 '55 '60 '65 '70 ' 75 '80 '85 '90 '95 2000 '05 '10 '15
100
80
110
90
70
(USD/t)
Long-run Cycle
←
Real Price
←
Long-run Trend
Figure 7. Trend-Cycle Decomposition of Real Iron Ore Price
Note: A long-run cycle is extracted by specifying a period of 20-70 years using a band-pass filter.Source: USGS, POSCO Reaserch Institute
40
50
60
20
30
have extensively discussed the China boom and super
cycles, leading to the spread of the term “super cycle.” In
the 2000s, the “bandwagon effect” led to excessive invest-
ment in the steel industry, resulting in overcapacity.
Figure 8 and Figure 9 give some evidence to support our
argument. During the period of the super upcycle in the early-
to-mid 2000s, steelmakers’ capital outlay and crude steel
capacity surged dramatically, which is presumed to have in-
fluenced the downturn of the super cycle thereafter. This find-
ing points to the possibility that supply side factors are more
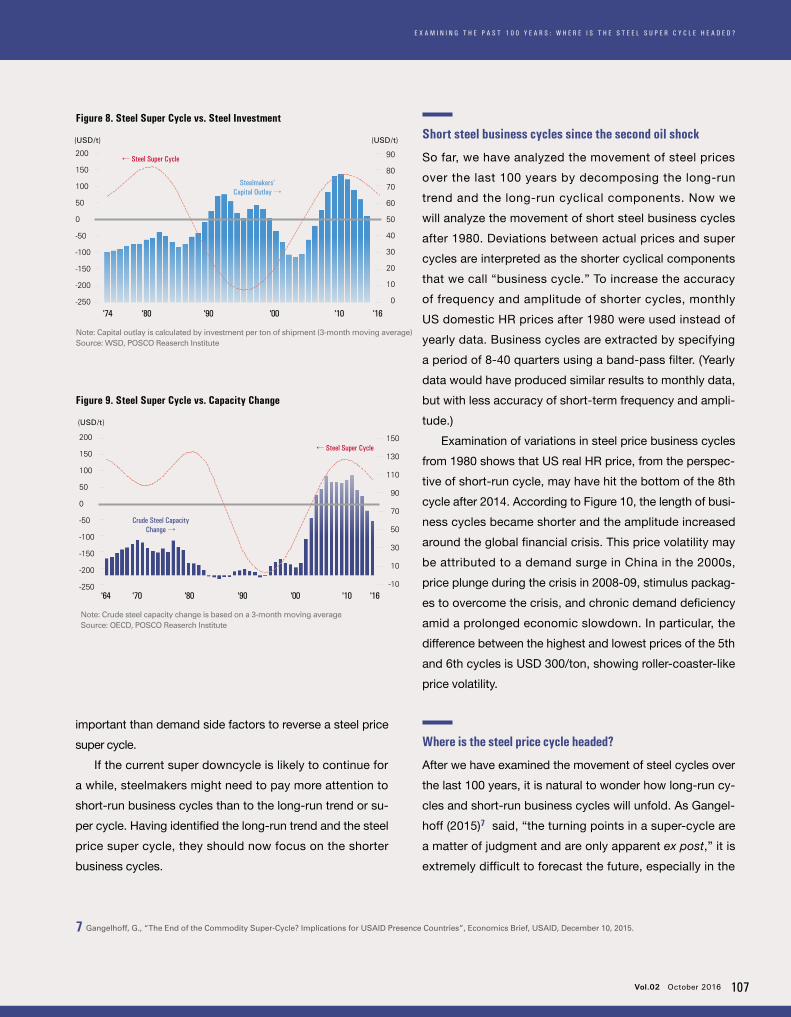
E X A M I N I N G T H E P A S T 1 0 0 Y E A R S : W H E R E I S T H E S T E E L S U P E R C Y C L E H E A D E D ?
Vol.02 October 2016 107
200
150
100
50
0
-50
-100
-150
-200
-250
90
80
70
60
50
40
30
20
10
0
Figure 8. Steel Super Cycle vs. Steel Investment
Note: Capital outlay is calculated by investment per ton of shipment (3-month moving average)Source: WSD, POSCO Reaserch Institute
Steelmakers’ Capital Outlay →
← Steel Super Cycle
(USD/t) (USD/t)
important than demand side factors to reverse a steel price
super cycle.
If the current super downcycle is likely to continue for
a while, steelmakers might need to pay more attention to
short-run business cycles than to the long-run trend or su-
per cycle. Having identified the long-run trend and the steel
price super cycle, they should now focus on the shorter
business cycles.
Short steel business cycles since the second oil shock
So far, we have analyzed the movement of steel prices
over the last 100 years by decomposing the long-run
trend and the long-run cyclical components. Now we
will analyze the movement of short steel business cycles
after 1980. Deviations between actual prices and super
cycles are interpreted as the shorter cyclical components
that we call “business cycle.” To increase the accuracy
of frequency and amplitude of shorter cycles, monthly
US domestic HR prices after 1980 were used instead of
yearly data. Business cycles are extracted by specifying
a period of 8-40 quarters using a band-pass filter. (Yearly
data would have produced similar results to monthly data,
but with less accuracy of short-term frequency and ampli-
tude.)
Examination of variations in steel price business cycles
from 1980 shows that US real HR price, from the perspec-
tive of short-run cycle, may have hit the bottom of the 8th
cycle after 2014. According to Figure 10, the length of busi-
ness cycles became shorter and the amplitude increased
around the global financial crisis. This price volatility may
be attributed to a demand surge in China in the 2000s,
price plunge during the crisis in 2008-09, stimulus packag-
es to overcome the crisis, and chronic demand deficiency
amid a prolonged economic slowdown. In particular, the
difference between the highest and lowest prices of the 5th
and 6th cycles is USD 300/ton, showing roller-coaster-like
price volatility.
Where is the steel price cycle headed?
After we have examined the movement of steel cycles over
the last 100 years, it is natural to wonder how long-run cy-
cles and short-run business cycles will unfold. As Gangel-
hoff (2015)7 said, “the turning points in a super-cycle are
a matter of judgment and are only apparent ex post,” it is
extremely difficult to forecast the future, especially in the
'74 '80 '00'90 '10 '16
200
150
100
50
0
-50
-100
-150
-200
-250
150
130
110
90
70
50
30
10
-10
Figure 9. Steel Super Cycle vs. Capacity Change
Note: Crude steel capacity change is based on a 3-month moving averageSource: OECD, POSCO Reaserch Institute
Crude Steel Capacity Change →
← Steel Super Cycle
(USD/t)
'64 '70 '00'90 '10 '16'80
7 Gangelhoff, G., “The End of the Commodity Super-Cycle? Implications for USAID Presence Countries”, Economics Brief, USAID, December 10, 2015.
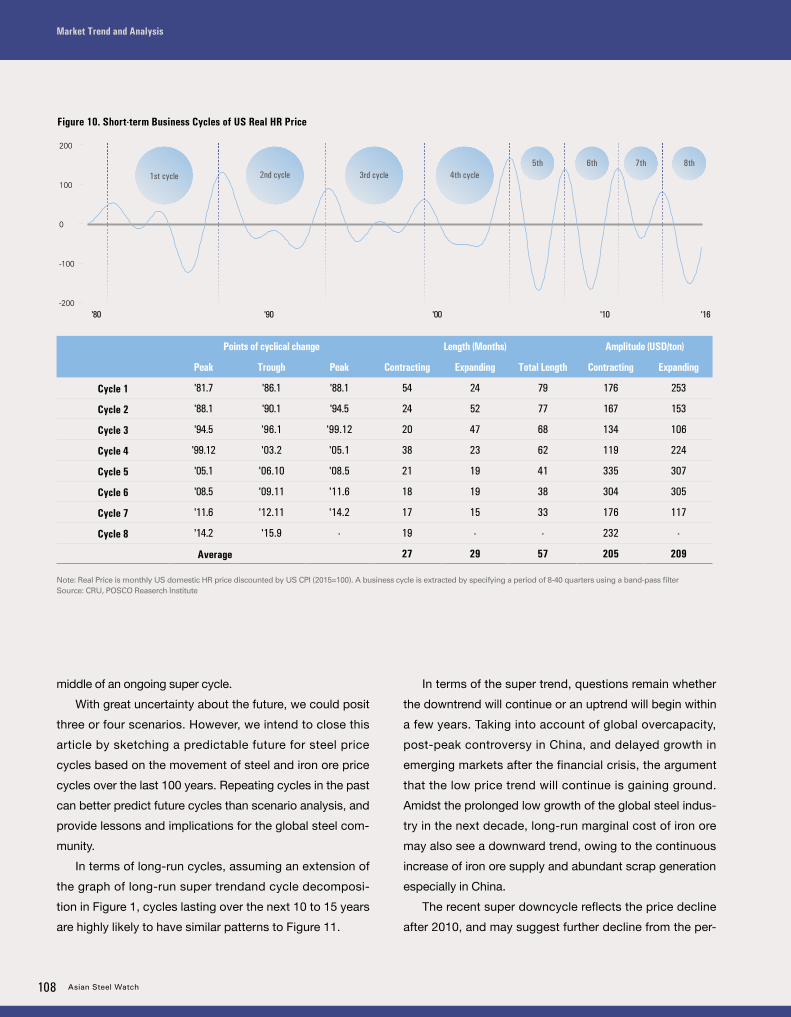
108 Asian Steel Watch
Market Trend and Analysis
200
100
0
-100
-200
Figure 10. Short-term Business Cycles of US Real HR Price
Points of cyclical change Length (Months) Amplitude (USD/ton)
Peak Trough Peak Contracting Expanding Total Length Contracting Expanding
Cycle 1 '81.7 '86.1 '88.1 54 24 79 176 253
Cycle 2 '88.1 '90.1 '94.5 24 52 77 167 153
Cycle 3 '94.5 '96.1 '99.12 20 47 68 134 106
Cycle 4 '99.12 '03.2 '05.1 38 23 62 119 224
Cycle 5 '05.1 '06.10 '08.5 21 19 41 335 307
Cycle 6 '08.5 '09.11 '11.6 18 19 38 304 305
Cycle 7 '11.6 '12.11 '14.2 17 15 33 176 117
Cycle 8 '14.2 '15.9 - 19 - - 232 -
Average 27 29 57 205 209
1st cycle 2nd cycle 3rd cycle 4th cycle5th 6th 7th 8th
Note: Real Price is monthly US domestic HR price discounted by US CPI (2015=100). A business cycle is extracted by specifying a period of 8-40 quarters using a band-pass filterSource: CRU, POSCO Reaserch Institute
middle of an ongoing super cycle.
With great uncertainty about the future, we could posit
three or four scenarios. However, we intend to close this
article by sketching a predictable future for steel price
cycles based on the movement of steel and iron ore price
cycles over the last 100 years. Repeating cycles in the past
can better predict future cycles than scenario analysis, and
provide lessons and implications for the global steel com-
munity.
In terms of long-run cycles, assuming an extension of
the graph of long-run super trendand cycle decomposi-
tion in Figure 1, cycles lasting over the next 10 to 15 years
are highly likely to have similar patterns to Figure 11.
In terms of the super trend, questions remain whether
the downtrend will continue or an uptrend will begin within
a few years. Taking into account of global overcapacity,
post-peak controversy in China, and delayed growth in
emerging markets after the financial crisis, the argument
that the low price trend will continue is gaining ground.
Amidst the prolonged low growth of the global steel indus-
try in the next decade, long-run marginal cost of iron ore
may also see a downward trend, owing to the continuous
increase of iron ore supply and abundant scrap generation
especially in China.
The recent super downcycle reflects the price decline
after 2010, and may suggest further decline from the per-
'80 '90 '00 '10 '16

E X A M I N I N G T H E P A S T 1 0 0 Y E A R S : W H E R E I S T H E S T E E L S U P E R C Y C L E H E A D E D ?
Vol.02 October 2016 109
The critical factor to shortening the super downtrend and downcycle is how fast excessive capacity can be reduced in the next five to ten years. It is also important how fast the economic growth of emerging markets, especially India and the ASEAN, will offset the steel demand slowdown in China.
2000 2005 2000 2005
Steel Price
Down Cycle
Overcapacity Reduction
Emerging Market Growth
Super Cycle
Super Trend
Figure 11. Super Trend and Super Cycle Forecast
Steel Price
China’s Scrap Generation
Consolidation Movement
Overcapacity Concern
Volatile business Cycles
Figure 12. Business Cycle Forecast
Emerging Markets’Fast Recovery
spective of long-run cycle. The critical factor to shortening
the super downtrend and downcycle is how fast excessive
capacity can be reduced in the next five to ten years. It is
also important how fast the economic growth of emerging
markets, especially India and the ASEAN, will offset the
steel demand slowdown in China.
Short-run business cycles have demonstrated high
volatility in recent years, and this volatility may last for a
considerable time. As shown in Figure 12, the amplitude
of short-run upcycles and downcycles will be determined
by facility reduction announcement and consolidation
policies in major steel-producing countries such as Chi-
na. Short-run cycles also depend on the sustainability of
China’s growth and the recovery speed of emerging mar-
kets.
Therefore, even in the overall downtrend, short-run
business cycles will show volatility, which will surely have
a massive impact on steelmakers’ strategic decision-mak-
ing. For this reason, the steel industry should pay close
attention to short-run business cycles in order to keep
cash flows maintained. Precise forecasting and insight into
short-run cycles are necessary to maximize short-run prof-
its in the downcycle.
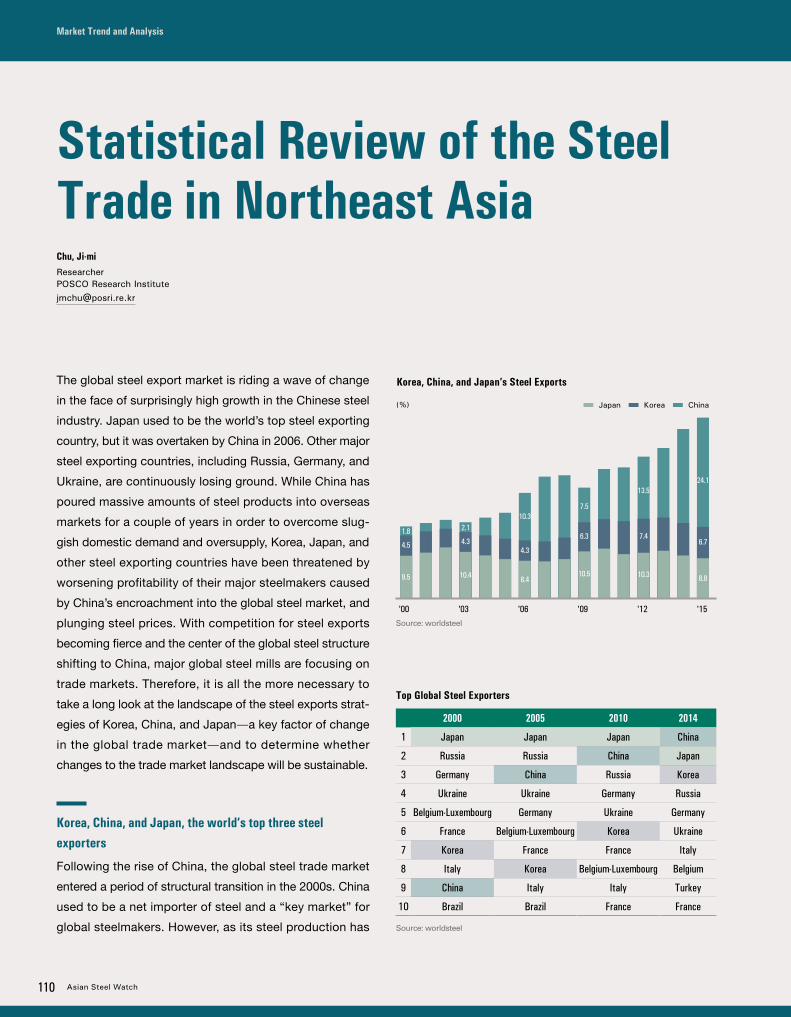
110 Asian Steel Watch
Market Trend and Analysis
The global steel export market is riding a wave of change
in the face of surprisingly high growth in the Chinese steel
industry. Japan used to be the world’s top steel exporting
country, but it was overtaken by China in 2006. Other major
steel exporting countries, including Russia, Germany, and
Ukraine, are continuously losing ground. While China has
poured massive amounts of steel products into overseas
markets for a couple of years in order to overcome slug-
gish domestic demand and oversupply, Korea, Japan, and
other steel exporting countries have been threatened by
worsening profitability of their major steelmakers caused
by China’s encroachment into the global steel market, and
plunging steel prices. With competition for steel exports
becoming fierce and the center of the global steel structure
shifting to China, major global steel mills are focusing on
trade markets. Therefore, it is all the more necessary to
take a long look at the landscape of the steel exports strat-
egies of Korea, China, and Japan—a key factor of change
in the global trade market—and to determine whether
changes to the trade market landscape will be sustainable.
Korea, China, and Japan, the world’s top three steel exporters
Following the rise of China, the global steel trade market
entered a period of structural transition in the 2000s. China
used to be a net importer of steel and a “key market” for
global steelmakers. However, as its steel production has
2000 2005 2010 2014
1 Japan Japan Japan China
2 Russia Russia China Japan
3 Germany China Russia Korea
4 Ukraine Ukraine Germany Russia
5 Belgium-Luxembourg Germany Ukraine Germany
6 France Belgium-Luxembourg Korea Ukraine
7 Korea France France Italy
8 Italy Korea Belgium-Luxembourg Belgium
9 China Italy Italy Turkey
10 Brazil Brazil France France
Source: worldsteel
'00 '03 '06 '09 '12 '15
9.5
4.5
10.4
4.3
2.1
10.58.4
4.3
10.3
10.3 8.8
6.7
24.1
Source: worldsteel
Statistical Review of the Steel Trade in Northeast AsiaChu, Ji-miResearcherPOSCO Research [email protected]
Korea, China, and Japan’s Steel Exports
Top Global Steel Exporters
(%) Japan Korea China
1.86.3
7.5
7.4
13.5
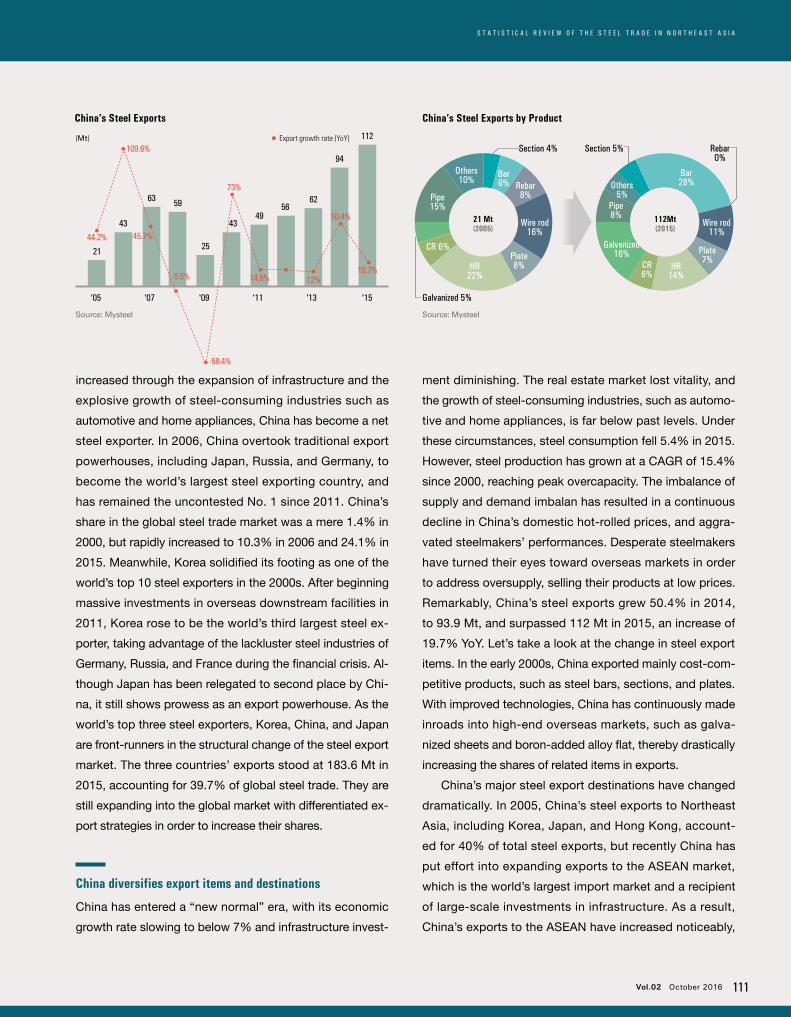
Vol.02 October 2016 111
S T A T I S T I C A L R E V I E W O F T H E S T E E L T R A D E I N N O R T H E A S T A S I A
increased through the expansion of infrastructure and the
explosive growth of steel-consuming industries such as
automotive and home appliances, China has become a net
steel exporter. In 2006, China overtook traditional export
powerhouses, including Japan, Russia, and Germany, to
become the world’s largest steel exporting country, and
has remained the uncontested No. 1 since 2011. China’s
share in the global steel trade market was a mere 1.4% in
2000, but rapidly increased to 10.3% in 2006 and 24.1% in
2015. Meanwhile, Korea solidified its footing as one of the
world’s top 10 steel exporters in the 2000s. After beginning
massive investments in overseas downstream facilities in
2011, Korea rose to be the world’s third largest steel ex-
porter, taking advantage of the lackluster steel industries of
Germany, Russia, and France during the financial crisis. Al-
though Japan has been relegated to second place by Chi-
na, it still shows prowess as an export powerhouse. As the
world’s top three steel exporters, Korea, China, and Japan
are front-runners in the structural change of the steel export
market. The three countries’ exports stood at 183.6 Mt in
2015, accounting for 39.7% of global steel trade. They are
still expanding into the global market with differentiated ex-
port strategies in order to increase their shares.
China diversifies export items and destinations
China has entered a “new normal” era, with its economic
growth rate slowing to below 7% and infrastructure invest-
ment diminishing. The real estate market lost vitality, and
the growth of steel-consuming industries, such as automo-
tive and home appliances, is far below past levels. Under
these circumstances, steel consumption fell 5.4% in 2015.
However, steel production has grown at a CAGR of 15.4%
since 2000, reaching peak overcapacity. The imbalance of
supply and demand imbalan has resulted in a continuous
decline in China’s domestic hot-rolled prices, and aggra-
vated steelmakers’ performances. Desperate steelmakers
have turned their eyes toward overseas markets in order
to address oversupply, selling their products at low prices.
Remarkably, China’s steel exports grew 50.4% in 2014,
to 93.9 Mt, and surpassed 112 Mt in 2015, an increase of
19.7% YoY. Let’s take a look at the change in steel export
items. In the early 2000s, China exported mainly cost-com-
petitive products, such as steel bars, sections, and plates.
With improved technologies, China has continuously made
inroads into high-end overseas markets, such as galva-
nized sheets and boron-added alloy flat, thereby drastically
increasing the shares of related items in exports.
China’s major steel export destinations have changed
dramatically. In 2005, China’s steel exports to Northeast
Asia, including Korea, Japan, and Hong Kong, account-
ed for 40% of total steel exports, but recently China has
put effort into expanding exports to the ASEAN market,
which is the world’s largest import market and a recipient
of large-scale investments in infrastructure. As a result,
China’s exports to the ASEAN have increased noticeably,
Source: Mysteel
China’s Steel Exports China’s Steel Exports by Product
112Mt(2015)
HR 14%
Pipe8%
Others5%
Bar 28%
Galvanized 16%
CR 6%
Plate 7%
Wire rod11%
21 Mt(2005)
HR 22%
Pipe15%
Others10%
Bar6%
CR 6%Plate 8%
Wire rod16%
Rebar8%
Rebar0%
Section 4%
Galvanized 5%
Section 5%
Source: Mysteel
44.2%
43
59 56
94
'05
21
'07
63
'09
25
'11
49
'13
62
'15
112
43
109.6%
45.7%
-5.5%
-58.4%
73%
14.9% 12%
50.4%
19.7%
(Mt) Export growth rate (YoY)

112 Asian Steel Watch
Market Trend and Analysis
‘2015 ‘2010
CAGR(Mt)
29.6%
9.2 2.5
Africa
EU
*16.9%
8.5 3.9
33.2%
34.6 8.2
ASEAN
Korea13.58.4
9.8%
29.6%
10.9 3.0
Middle East
India
7.1%
4.8 3.4
USA
19.1%
2.4 1.0
China’s Steel Export Growth
Note: *denotes CAGR from 2010 to 2015 Source: Mysteel
Brazil
1.21.7
-7.1%
China
UkraineEU(25)
Korea
at a CAGR of 33.2% since 2010. In particular, the share of
China’s steel products in the Philippines and Vietnam rose
by 52.5%p and 23.2%p, respectively from 2010 to 2015,
because Chinese products emerged as an alternative to
Russian products, on which neighboring countries im-
posed trade restrictions following the Russia-Ukraine con-
flict over Crimea. As a result, the ASEAN has become the
major neighboring export destination for Korea, China, and
Japan. The share of the three Northeast Asian countries in
the ASEAN-6 (Indonesia, Malaysia, Philippines, Singapore,
Thailand, and Vietnam) increased from 52.4% in 2005 to
70.2% in 2014.
China is also expanding its footprint in the Middle
East. China’s steel exports to Lebanon, Saudi Arabia, and
Jordan increased at CAGR of 86.1%, 73.5%, and 35.6%,
respectively, from 2010 to 2015. China’s steel exports to
India Korea India
Note: Based on the ASEAN-6Source: SEAISI
Note: Based on the ASEAN-10 Source: Mysteel, KOSIS, JISF
'10
5.68.2
11.4
'11
7.39.6
11.3
'12
7.412.912.9
'13
7.117.4
13.6
'14
6.626.3
12.8
'15
6.334.6
12.4
(Mt) Korea China Japan
Korea, China, and Japan’s Steel Exports to the ASEAN ASEAN Steel Imports by Country
Others 21%Others 20%
8%
4%
China23%
China39%
Japan23%
Japan21%
Russia13%
Russia5%
Korea, China & Japan
52.4% (2005)
2%2%
6% 11%
Korea, China & Japan
70.2% (2014)
CAGR21.4%
112.4
2015
42.6
2010
Korea 2.5%, China 33.2%, Japan 1.7%CAGR ('10-'15)
Ukraine 1%EU(25) 1%
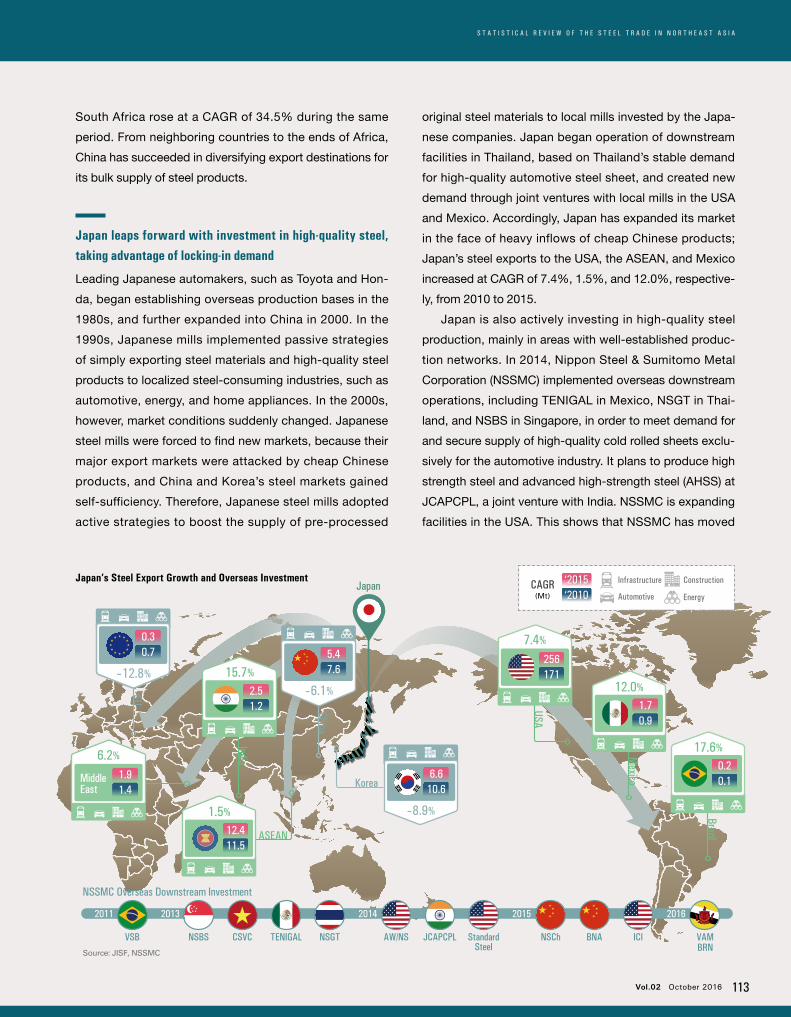
Vol.02 October 2016 113
S T A T I S T I C A L R E V I E W O F T H E S T E E L T R A D E I N N O R T H E A S T A S I A
South Africa rose at a CAGR of 34.5% during the same
period. From neighboring countries to the ends of Africa,
China has succeeded in diversifying export destinations for
its bulk supply of steel products.
Japan leaps forward with investment in high-quality steel, taking advantage of locking-in demand Leading Japanese automakers, such as Toyota and Hon-
da, began establishing overseas production bases in the
1980s, and further expanded into China in 2000. In the
1990s, Japanese mills implemented passive strategies
of simply exporting steel materials and high-quality steel
products to localized steel-consuming industries, such as
automotive, energy, and home appliances. In the 2000s,
however, market conditions suddenly changed. Japanese
steel mills were forced to find new markets, because their
major export markets were attacked by cheap Chinese
products, and China and Korea’s steel markets gained
self-sufficiency. Therefore, Japanese steel mills adopted
active strategies to boost the supply of pre-processed
original steel materials to local mills invested by the Japa-
nese companies. Japan began operation of downstream
facilities in Thailand, based on Thailand’s stable demand
for high-quality automotive steel sheet, and created new
demand through joint ventures with local mills in the USA
and Mexico. Accordingly, Japan has expanded its market
in the face of heavy inflows of cheap Chinese products;
Japan’s steel exports to the USA, the ASEAN, and Mexico
increased at CAGR of 7.4%, 1.5%, and 12.0%, respective-
ly, from 2010 to 2015.
Japan is also actively investing in high-quality steel
production, mainly in areas with well-established produc-
tion networks. In 2014, Nippon Steel & Sumitomo Metal
Corporation (NSSMC) implemented overseas downstream
operations, including TENIGAL in Mexico, NSGT in Thai-
land, and NSBS in Singapore, in order to meet demand for
and secure supply of high-quality cold rolled sheets exclu-
sively for the automotive industry. It plans to produce high
strength steel and advanced high-strength steel (AHSS) at
JCAPCPL, a joint venture with India. NSSMC is expanding
facilities in the USA. This shows that NSSMC has moved
Source: JISF, NSSMC
EU
Brazil
-12.8%
0.30.7
China
India Mexico
-6.1%
5.47.6
Korea6.6
10.6
-8.9%
15.7%
2.5 1.2
6.2%
1.9 1.4
Middle East
ASEAN
1.5%
12.4 11.5
12.0%
1.7 0.9
17.6%
0.2 0.1
Japan’s Steel Export Growth and Overseas Investment Japan
USA
7.4%
256 171
CAGR ‘2015 ‘2010(Mt) Automotive
Infrastructure Construction
Energy
2014 2015 20162011
VSB
2013
NSBS CSVC AW/NSTENIGAL JCAPCPLNSGT StandardSteel
NSCh BNA ICI VAMBRN
NSSMC Overseas Downstream Investment
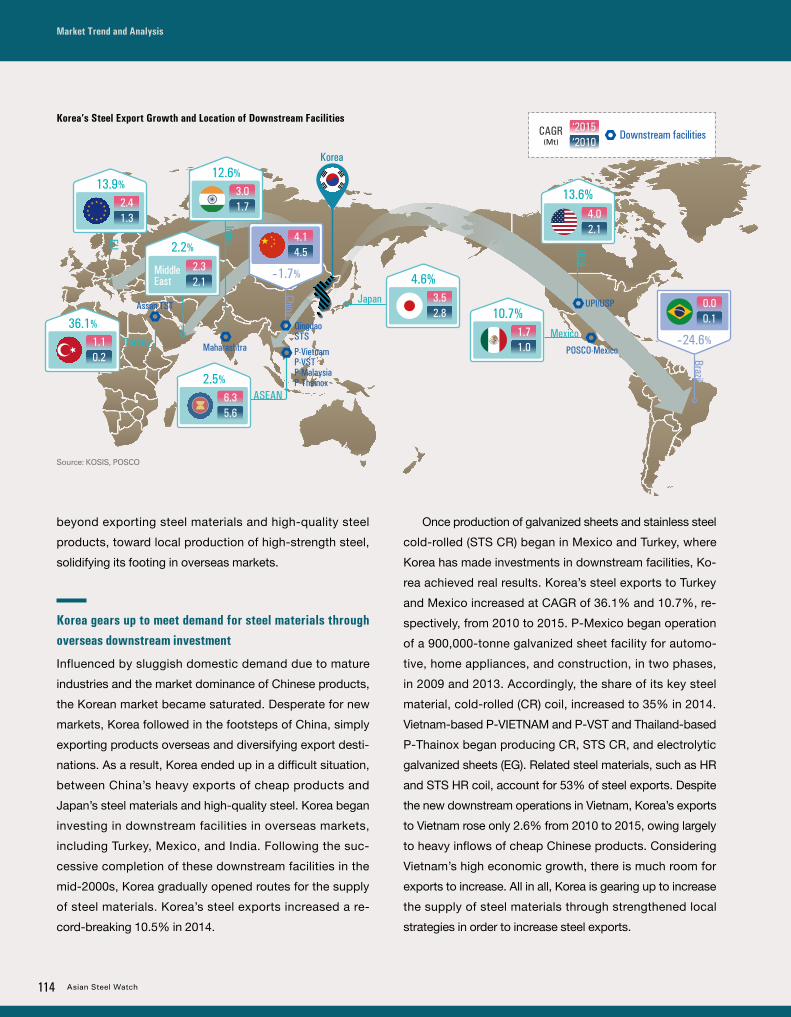
114 Asian Steel Watch
Market Trend and Analysis
Korea’s Steel Export Growth and Location of Downstream Facilities
Brazil
0.00.1
-24.6%
EU
13.9%
2.4 1.3
2.5%
6.3 5.6
ASEAN
Turkey
36.1%
1.1 0.2
Source: KOSIS, POSCO
Japan
4.6%3.5 2.8
Assan TST
P-VietnamP-VSTP-MalaysiaP-Thainox
2.2%
2.3 2.1
Middle East
India
12.6%
3.0 1.7
USA13.6%
4.0 2.1
Mexico
10.7%1.7 1.0
Korea
POSCO-Mexico
QingdaoSTS
China
-1.7%
4.14.5
Maharashtra
UPI/USP
beyond exporting steel materials and high-quality steel
products, toward local production of high-strength steel,
solidifying its footing in overseas markets.
Korea gears up to meet demand for steel materials through overseas downstream investment
Influenced by sluggish domestic demand due to mature
industries and the market dominance of Chinese products,
the Korean market became saturated. Desperate for new
markets, Korea followed in the footsteps of China, simply
exporting products overseas and diversifying export desti-
nations. As a result, Korea ended up in a difficult situation,
between China’s heavy exports of cheap products and
Japan’s steel materials and high-quality steel. Korea began
investing in downstream facilities in overseas markets,
including Turkey, Mexico, and India. Following the suc-
cessive completion of these downstream facilities in the
mid-2000s, Korea gradually opened routes for the supply
of steel materials. Korea’s steel exports increased a re-
cord-breaking 10.5% in 2014.
Once production of galvanized sheets and stainless steel
cold-rolled (STS CR) began in Mexico and Turkey, where
Korea has made investments in downstream facilities, Ko-
rea achieved real results. Korea’s steel exports to Turkey
and Mexico increased at CAGR of 36.1% and 10.7%, re-
spectively, from 2010 to 2015. P-Mexico began operation
of a 900,000-tonne galvanized sheet facility for automo-
tive, home appliances, and construction, in two phases,
in 2009 and 2013. Accordingly, the share of its key steel
material, cold-rolled (CR) coil, increased to 35% in 2014.
Vietnam-based P-VIETNAM and P-VST and Thailand-based
P-Thainox began producing CR, STS CR, and electrolytic
galvanized sheets (EG). Related steel materials, such as HR
and STS HR coil, account for 53% of steel exports. Despite
the new downstream operations in Vietnam, Korea’s exports
to Vietnam rose only 2.6% from 2010 to 2015, owing largely
to heavy inflows of cheap Chinese products. Considering
Vietnam’s high economic growth, there is much room for
exports to increase. All in all, Korea is gearing up to increase
the supply of steel materials through strengthened local
strategies in order to increase steel exports.
CAGR(Mt)
‘2015 ‘2010
Downstream facilities
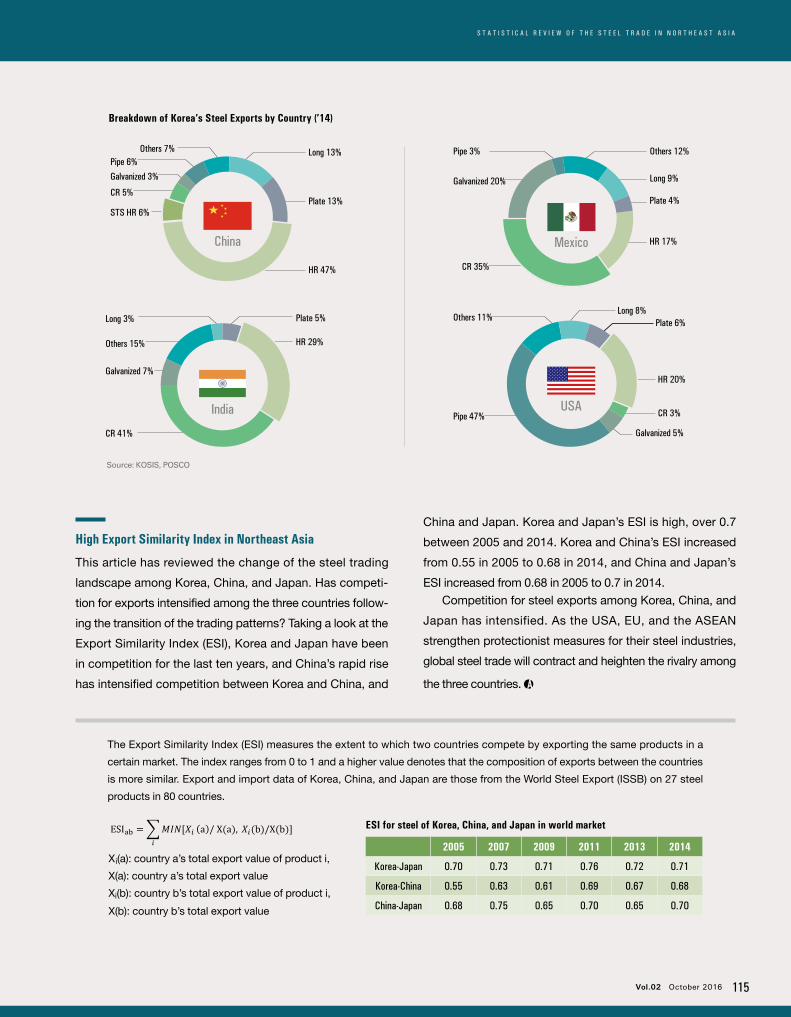
Vol.02 October 2016 115
S T A T I S T I C A L R E V I E W O F T H E S T E E L T R A D E I N N O R T H E A S T A S I A
High Export Similarity Index in Northeast Asia
This article has reviewed the change of the steel trading
landscape among Korea, China, and Japan. Has competi-
tion for exports intensified among the three countries follow-
ing the transition of the trading patterns? Taking a look at the
Export Similarity Index (ESI), Korea and Japan have been
in competition for the last ten years, and China’s rapid rise
has intensified competition between Korea and China, and
Galvanized 5%
CR 3%Pipe 47%
HR 20%
Others 11% Plate 6%Long 8%
USA
Pipe 3% Others 12%
Long 9%
Plate 4%
HR 17%
Galvanized 20% 3%
Mexico
CR 35%
Source: KOSIS, POSCO
CR 41%
Long 3% Plate 5%
India
Galvanized 7%
HR 29%Others 15%
STS HR 6%
CR 5%
Galvanized 3%
Pipe 6%Others 7% Long 13%
HR 47%
Plate 13%
China
countries is more similar. Export and import data of Korea, China, and Japan are those from the World Steel Export
(ISSB) on 27 steel products in 80 countries.
ESIab = �𝑀𝑀𝑀𝑀𝑀𝑀𝑀𝑀𝑀𝑀𝑀𝑀[𝑋𝑋𝑋𝑋𝑖𝑖𝑖𝑖𝑖𝑖𝑖𝑖
(a)/ X(a), 𝑋𝑋𝑋𝑋𝑖𝑖𝑖𝑖(b)/X(b)]
Xi(a): country a’s total export value of product i,
X(a): country a’s total export value
𝑋𝑋𝑋𝑋𝑖𝑖𝑖𝑖(b): country b’s total export value of product i,
𝑋𝑋𝑋𝑋(b): country b’s total export value
< ESI for steel of Korea, China, and Japan in world
market >
2005 2007 2009 2011 2013 2014
Korea
-
Japan
0.70 0.73 0.71 0.76 0.72 0.71
Korea
-
China
0.55 0.63 0.61 0.69 0.67 0.68
China
-
Japan
0.68 0.75 0.65 0.70 0.65 0.70
Xi(a): country a’s total export value of product i,
X(a): country a’s total export value
Xi(b): country b’s total export value of product i,
X(b): country b’s total export value
Breakdown of Korea’s Steel Exports by Country (’14)
China and Japan. Korea and Japan’s ESI is high, over 0.7
between 2005 and 2014. Korea and China’s ESI increased
from 0.55 in 2005 to 0.68 in 2014, and China and Japan’s
ESI increased from 0.68 in 2005 to 0.7 in 2014.
Competition for steel exports among Korea, China, and
Japan has intensified. As the USA, EU, and the ASEAN
strengthen protectionist measures for their steel industries,
global steel trade will contract and heighten the rivalry among
the three countries.
ESI for steel of Korea, China, and Japan in world market
2005 2007 2009 2011 2013 2014
Korea-Japan 0.70 0.73 0.71 0.76 0.72 0.71
Korea-China 0.55 0.63 0.61 0.69 0.67 0.68
China-Japan 0.68 0.75 0.65 0.70 0.65 0.70
The Export Similarity Index (ESI) measures the extent to which two countries compete by exporting the same products in a
certain market. The index ranges from 0 to 1 and a higher value denotes that the composition of exports between the countries
is more similar. Export and import data of Korea, China, and Japan are those from the World Steel Export (ISSB) on 27 steel
products in 80 countries.


The information, opinions, and analyses herein belong to the authors and do not necessarily represent the official views of POSCO Research Institute
(POSRI). To the best of our knowledge, the information contained herein is accurate and reliable as of the date of publication; however, we do not as-
sume any liability whatsoever for the accuracy and completeness of the information, opinions, or analysis.
We believe the information used in the preparation of this publication to be reliable; however, the reliability of this information cannot be guaranteed.
Although this publication has been made with all possible care and diligence, POSRI cannot guarantee the accuracy, completeness, or correctness of
any information included. This publication is intended for general information and is not intended to be relied upon by readers in making any specific
investment or decision.
POSRI shall not be responsible for any errors or omissions, or any loss, damage, or expenses incurred by reliance on any information or statement
contained herein. For more information, please contact POSCO Research Institute at [email protected], or 1 82 2 3457 8000.
Disclaimer
O C T O B E R 2 0 1 6
ASIAN STEEL WATCH
02
OC
TO
BE
R
20
16
02IN
DU
STRY 4.0 AND THE A
SIAN
STEEL IND
USTRY
POSRI Bldg., 514 Bongeunsa-ro (147 Samseong-dong), Gangnam-gu, Seoul, 06163 Korea | www.posri.re.kr 9 7 7 2 4 6 6 0 3 3 0 0 7
02
ISSN 2466-0337
O C TO B E R 2 01 6
ASIAN STEEL WATCH
02
INDUSTRY 4.0 AND THE ASIAN STEEL INDUSTRY
WINDS OF CHANGE ARE BLOWING
INTERVIEW
Ask the Guru: Roads Ahead for the Steel IndustryEdwin Basson, Director General of worldsteel
ON THE COVER
Accelerating Digital Transformation with Smart Factory to Unlock New ValueJeong, Duk-Kyun, POSCO ICT
FEATURED ARTICLES
Restructuring of the Chinese Steel Industry:Retrospects and ProspectsSPECIAL REPORT
Global Competitiveness Through Hybridization of FINEX and CEM ProcessesDong Joon MIN, Professor of Yonsei University
MARKET TREND AND ANALYSIS
Examining the Past 100 Years:Where is the Steel Super Cycle Headed?