Embed Size (px)
Citation preview

October 21, 2014, Dallas, TX
Joanna Hornig FoxVeronique Zimmerman-Brown
Overcoming Implementation Challenges to Early Warning Systems and Seizing Opportunities
The National Graduation Rate Challenge and Opportunities
• Challenge: Approximately 20 percent of America’s students drop out of high school and do not receive a standard diploma in four years
• Opportunity: There has been general improvement in the last decade, of about 10 percent nationally, to an 80-81 percent average
• Opportunity: Gains have been driven by a 15-percentage point increase for Hispanic students and a 9-percentage point increase for African-American students
Averages Mask Differences
• State graduation rates vary from the low 60 percent range to 90
percent. And as one sub-group example, for special education
students, the national average is 20 percentage points lower than that
for general education students, with a range of 24 percent in Nevada
to 81 percent in Montana. Similar variations are often encountered
among districts in a state, schools in the
same district, and between subgroups at
many levels.
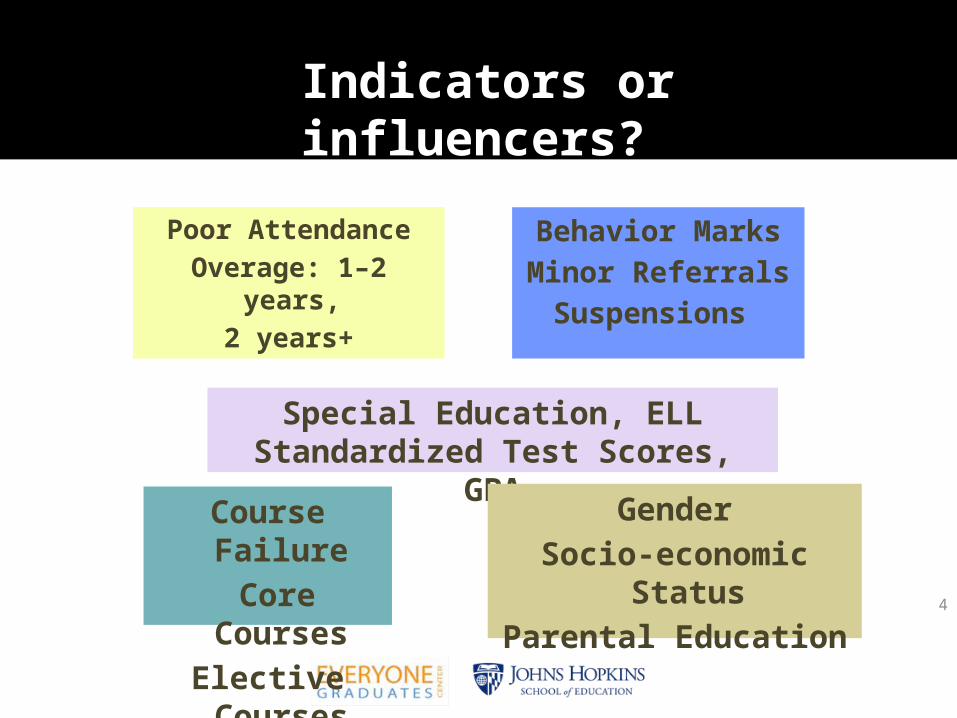
Indicators or influencers?
Special Education, ELLStandardized Test Scores, GPA
4
Course Failure Core Courses
Elective Courses
Poor AttendanceOverage: 1–2 years,
2 years+
Behavior MarksMinor Referrals
Suspensions
GenderSocio-economic Status
Parental Education
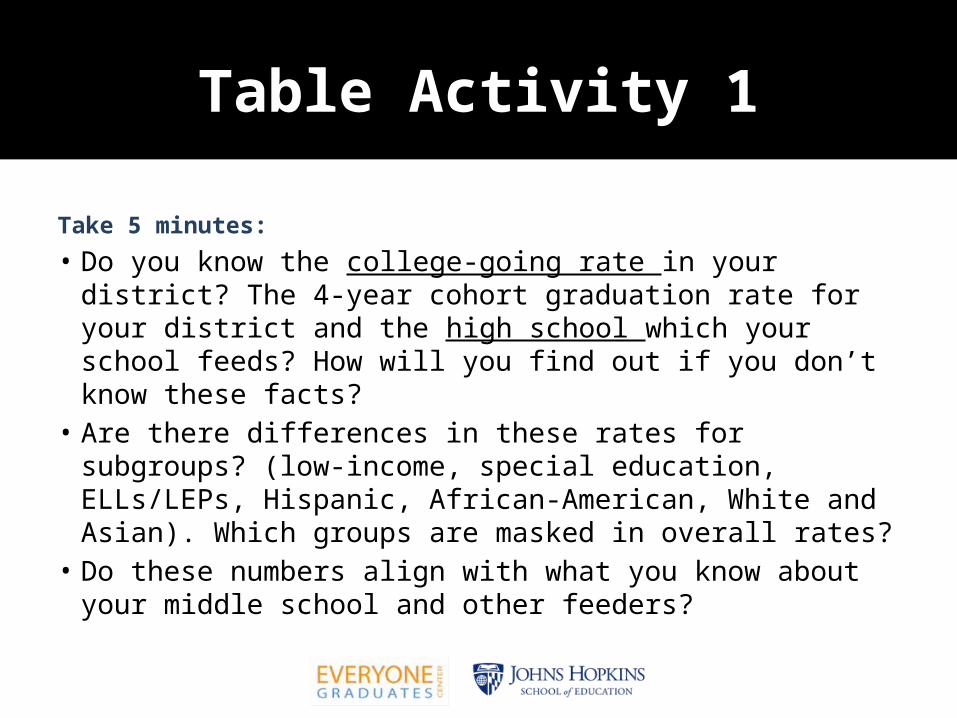
Table Activity 1
Take 5 minutes:
• Do you know the college-going rate in your district? The 4-year cohort graduation rate for your district and the high school which your school feeds? How will you find out if you don’t know these facts?
• Are there differences in these rates for subgroups? (low-income, special education, ELLs/LEPs, Hispanic, African-American, White and Asian). Which groups are masked in overall rates?
• Do these numbers align with what you know about your middle school and other feeders?
Table Activity 1
• What do you suspect are the main “influencer and indicator” contributors
to students’ struggles?
Session Objectives
• Why: Understand the need for EWS• What: Learn more about what an EWS is, in
practice• How: Understand some of the challenges and
opportunities that are implicit in an EWS• Next: Identify a few steps that can be taken in
your school or district to start an EWS
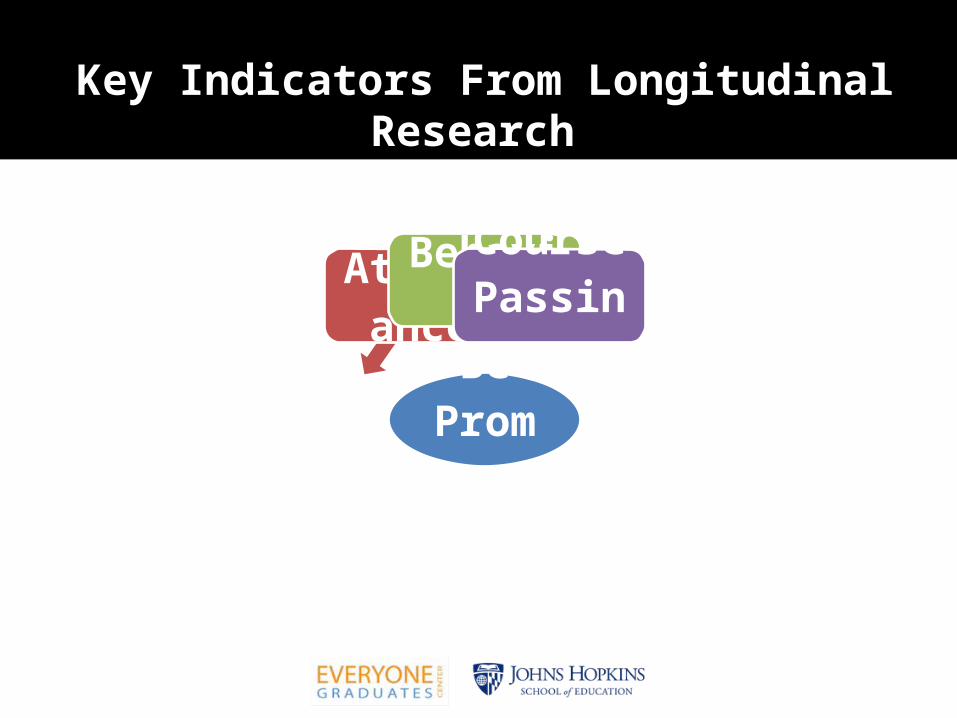
Be Promoted
AttendanceBehaviorCourse
Passing
Key Indicators From Longitudinal Research
9
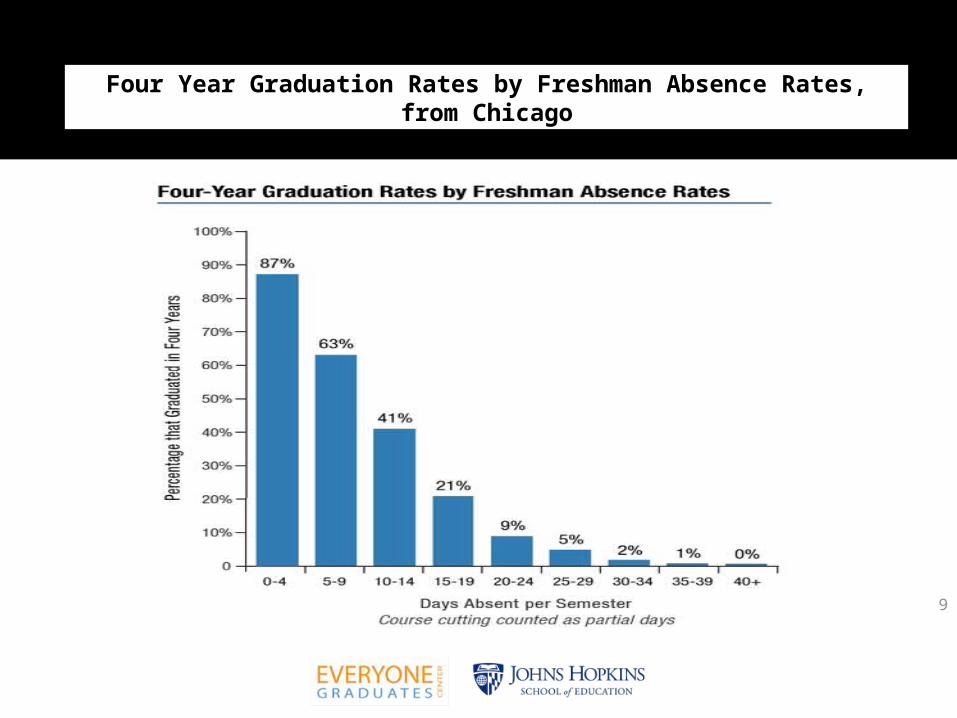
Four Year Graduation Rates by Freshman Absence Rates, from Chicago
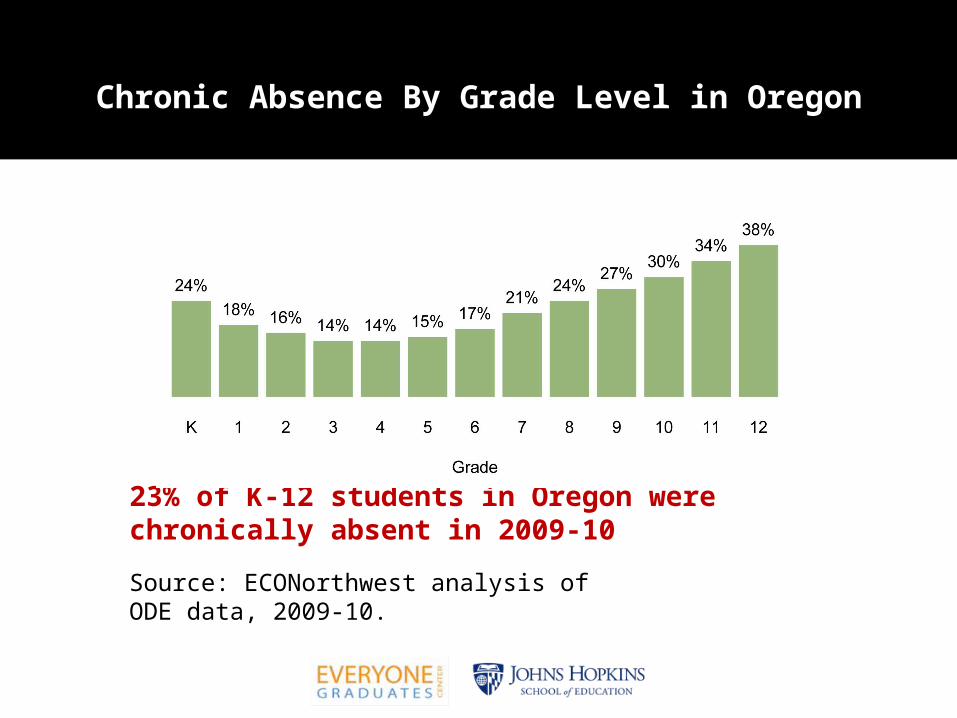
23% of K-12 students in Oregon were chronically absent in 2009-10
Source: ECONorthwest analysis of ODE data, 2009-10.
Chronic Absence By Grade Level in Oregon
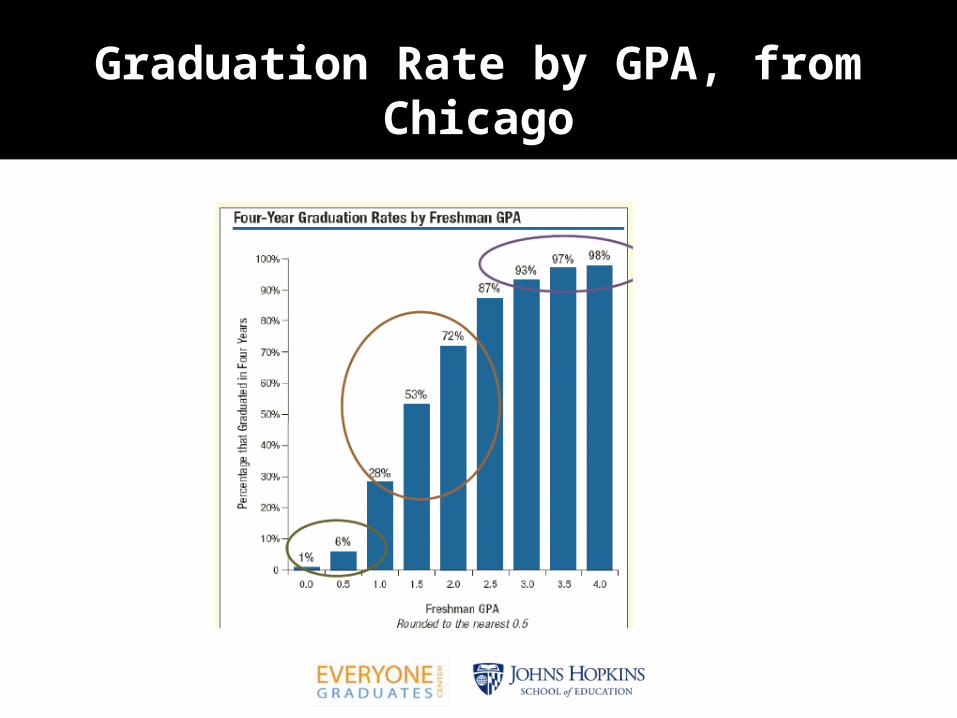
Graduation Rate by GPA, from Chicago
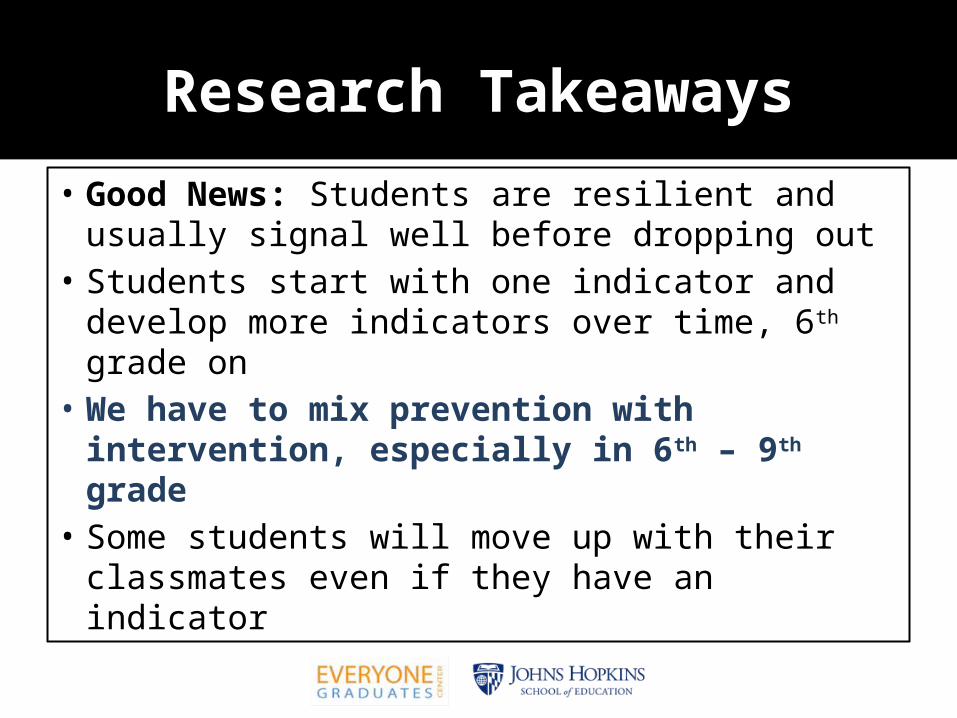
Research Takeaways
• Good News: Students are resilient and usually signal well before dropping out
• Students start with one indicator and develop more indicators over time, 6th grade on
• We have to mix prevention with intervention, especially in 6th – 9th grade
• Some students will move up with their classmates even if they have an indicator
Fundamental Question from the Research
What do we need to do differently and better in middle schools to
better prepare students for success in high school, college and
careers?
Our choice: Can we or can’t we change student outcomes?
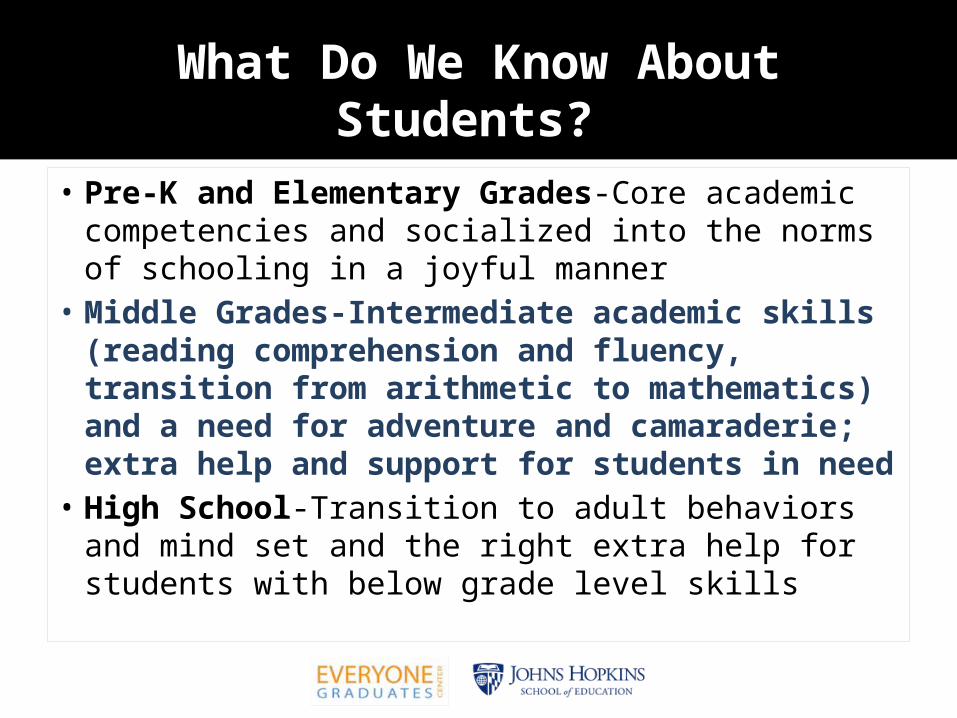
What Do We Know About Students?
• Pre-K and Elementary Grades-Core academic competencies and socialized into the norms of schooling in a joyful manner
• Middle Grades-Intermediate academic skills (reading comprehension and fluency, transition from arithmetic to mathematics) and a need for adventure and camaraderie; extra help and support for students in need
• High School-Transition to adult behaviors and mind set and the right extra help for students with below grade level skills
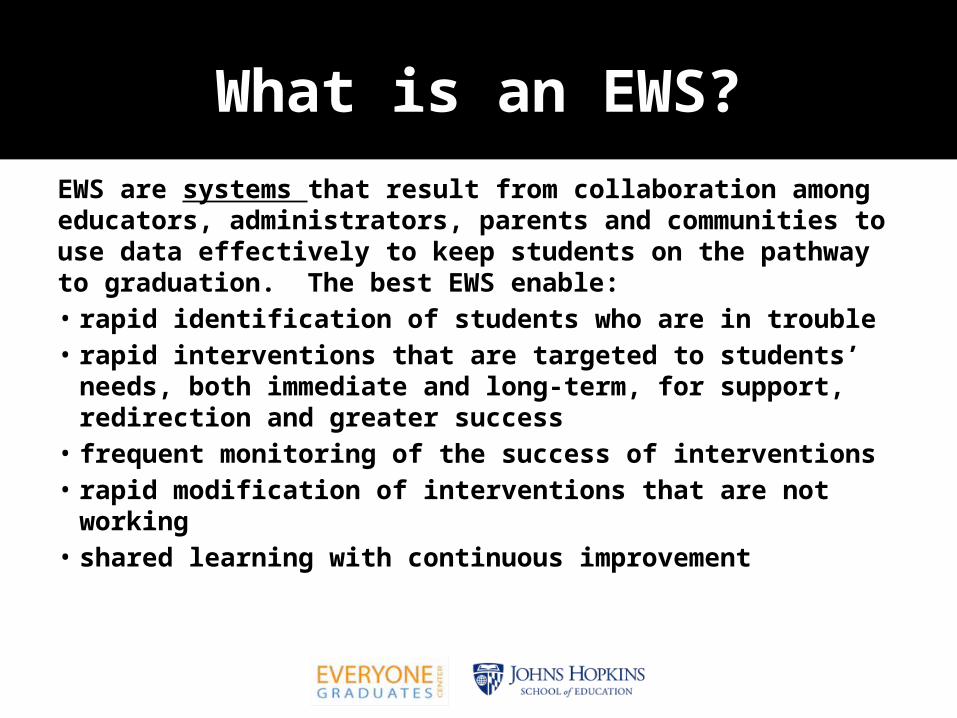
What is an EWS?
EWS are systems that result from collaboration among educators, administrators, parents and communities to use data effectively to keep students on the pathway to graduation. The best EWS enable:• rapid identification of students who are in trouble• rapid interventions that are targeted to students’ needs,
both immediate and long-term, for support, redirection and greater success
• frequent monitoring of the success of interventions• rapid modification of interventions that are not working • shared learning with continuous improvement
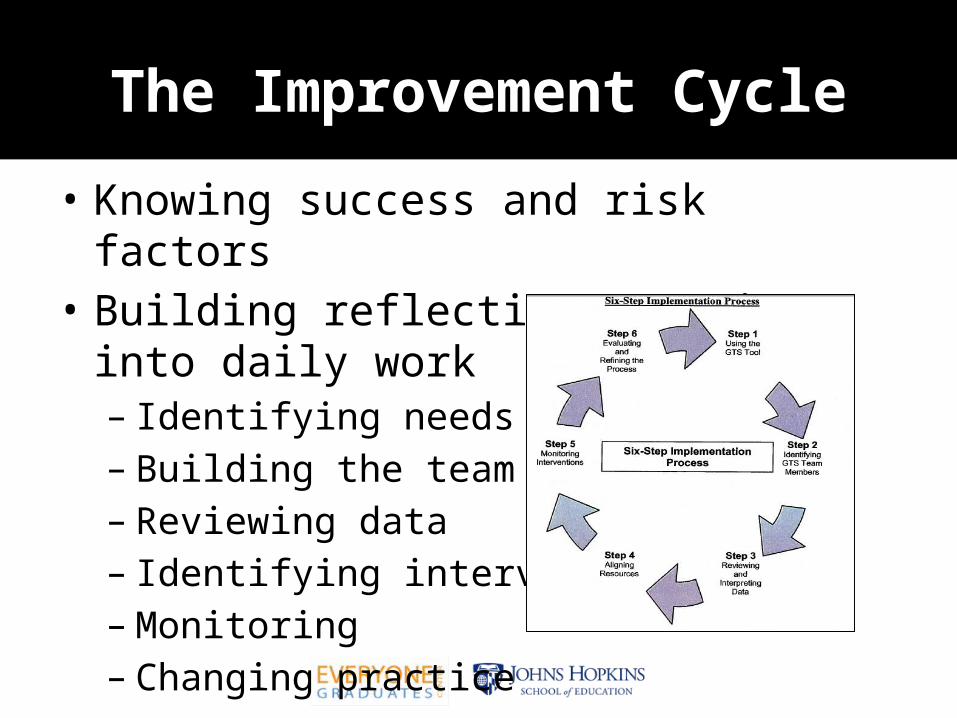
The Improvement Cycle
• Knowing success and risk factors• Building reflective practice into daily work– Identifying needs– Building the team– Reviewing data– Identifying interventions– Monitoring– Changing practice
What’s a Good Start?
• An EWS team organized around keeping students on-track organizing data, organizing adults, and applying interventions
• Improving interventions • Developing new ones
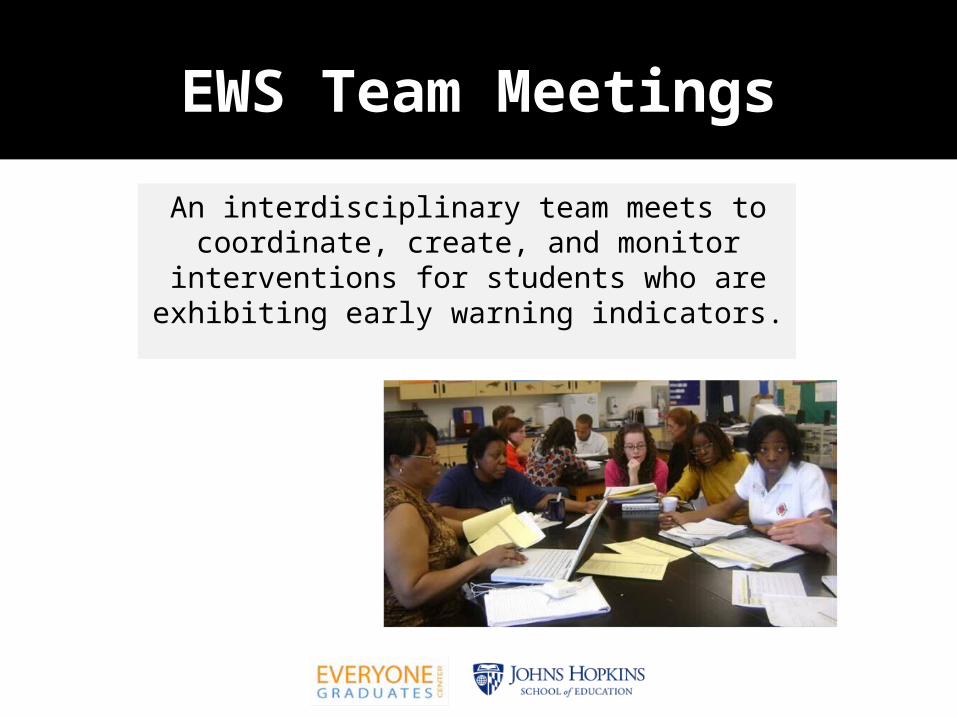
EWS Team Meetings
An interdisciplinary team meets to coordinate, create, and monitor
interventions for students who are exhibiting early warning indicators.
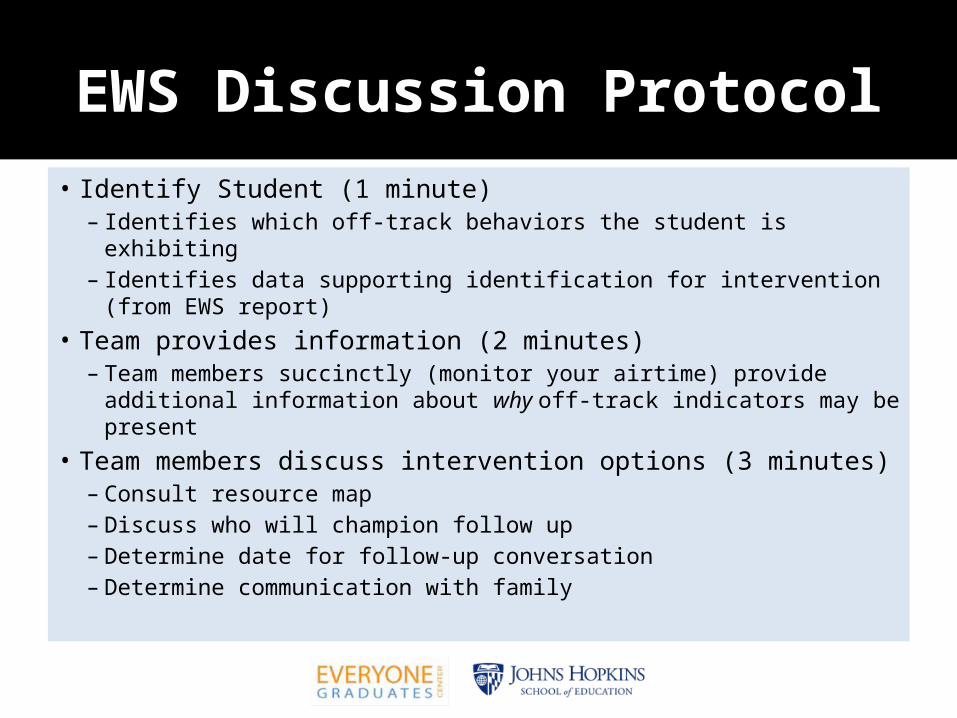
EWS Discussion Protocol
• Identify Student (1 minute) – Identifies which off-track behaviors the student is exhibiting – Identifies data supporting identification for intervention (from EWS
report) • Team provides information (2 minutes)
– Team members succinctly (monitor your airtime) provide additional information about why off-track indicators may be present
• Team members discuss intervention options (3 minutes) – Consult resource map – Discuss who will champion follow up – Determine date for follow-up conversation – Determine communication with family
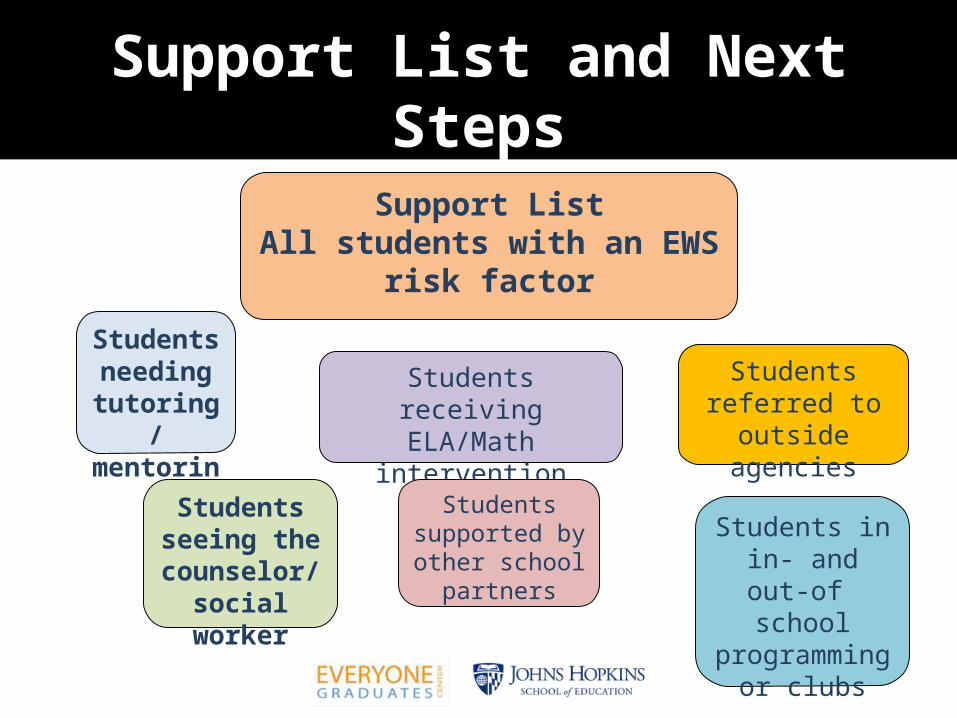
Support List and Next Steps
Support ListAll students with an EWS
risk factor
Students
needing tutoring
/ mentori
ngStudents
seeing the counselor/
social worker
Students receiving ELA/Math
intervention class
Students referred to
outside agencies
Students supported by other school
partners
Students in in- and out-of
school programming
or clubs
Challenges and
Opportunities
Challenges
• Large numbers of students with indicators overwhelm resources
• Large numbers of students increase the challenge for teachers and other school adults
• Differentiation within classrooms becomes more difficult
Data
• Is attendance data entered frequently and consistently by the data entry person in the front office? By each teacher? By each person responsible for discipline/behavior reporting? By others?
• Does the data system enable adults to view the ABCs for all students in a class? A grade? All students in a school? Longitudinally?
• Can student “support” lists be produced easily (eg identify “at-risk” students based on indicators, not demographics)?
• Are reports relating to ABC patterns (students, subgroups, groups) available frequently? (weekly, bi-weekly, monthly?) Who has responsibility for analyzing these reports?
Data Use
• Is the data accurate, complete and consistent (for instance, is there a school-wide grading policy that holds teachers accountable for giving so-many gradable items per week? Is there consistency in the type of items that are graded? Are teachers entering grades at the same intervals? Etc.)
• Is there a team structure that enables groups of adults to consider student data together?
• Is there a set meeting time for the team (bi-weekly, one hour at a minimum) that is built into the schedule?
• Does school administration value the team meeting, and set expectations and hold team members accountable for participating?
Teaming
• Does school administration participate, so that accountability is implicit?
• Is it understood that there is a team leader who will facilitate discussion?
• Are there norms for team meetings? • Is there a protocol for team meetings?• Is there common understanding about the criteria for “at risk”
students?• Is a student “support list” prepared in advance of the meeting?• Is the “right” combination of adults included on the team to
give multiple perspectives on students?
• Has the team defined what an “intervention” is?
• Have you asked, “What will we accomplish with this intervention?”
• Or, “Who will carry this intervention out”
• Or, “Which students are we not reaching?”
• Or, “Are there students in this school who do not have a relationship with an adult? With a peer?“
• Or, “Do we recognize students for improvement as well as achievement?”
• Or, “How can we encourage more improvement?”
Interventions
Interventions
• Have available interventions been inventoried?• Does the term “intervention” bring to mind
only negative connotations or does it include comprehensive, school wide efforts to build student motivation and enthusiasm?
• Are interventions categorized by level? (how many students, how serious are the challenges, how big are the opportunities, and how many adults are needed for success, for instance?)
Policy and Practices
• Do policies and practices support promotion and graduation, specifically supporting students in staying in school, motivating students to learn and engaging them in learning at high levels?
• Do policies and practices support efforts to overcome difficult-to-change adult as well as student attitudes?
Communications Across Transitions
• Do middle grades personnel – many or all of them, beyond the counselors – communicate with high schools to understand that and how academic and behavioral expectations differ between grades 8 and 9?
• Are students frequently exposed to the differing expectations before they run into them head on in grade 9? Are they prepared?
• What is the appropriate balance between expectations and support?
• What do each of those words mean in the context of your school?
• Do adults in your school show through their actions that it is part of their professional role to support students and not simply evaluate them – non-academically as well as academically?
Adult Attitudes – Hard Questions
Broadening the Circle of Support
• Are you drawing in school adults who represent many different perspectives on students (academic and elective teachers, counselors, school nurse, social workers, cafeteria workers, building engineers, etc.)
• Are you drawing in older students as mentors and tutors? As examples? From the high school? From local colleges?
• Are you drawing in community adults?
Broadening the Circle of Support
• Are you capitalizing on youth-engaged community resources? (retired teachers, alumni, librarians, folks who work at youth serving community and health agencies, local judges and law enforcement representatives, for example)
• Are you capitalizing on business and higher-education related resources in or near your community? (the admissions and outreach folks at the community college, the chamber of commerce, the local economic development agency, etc.)
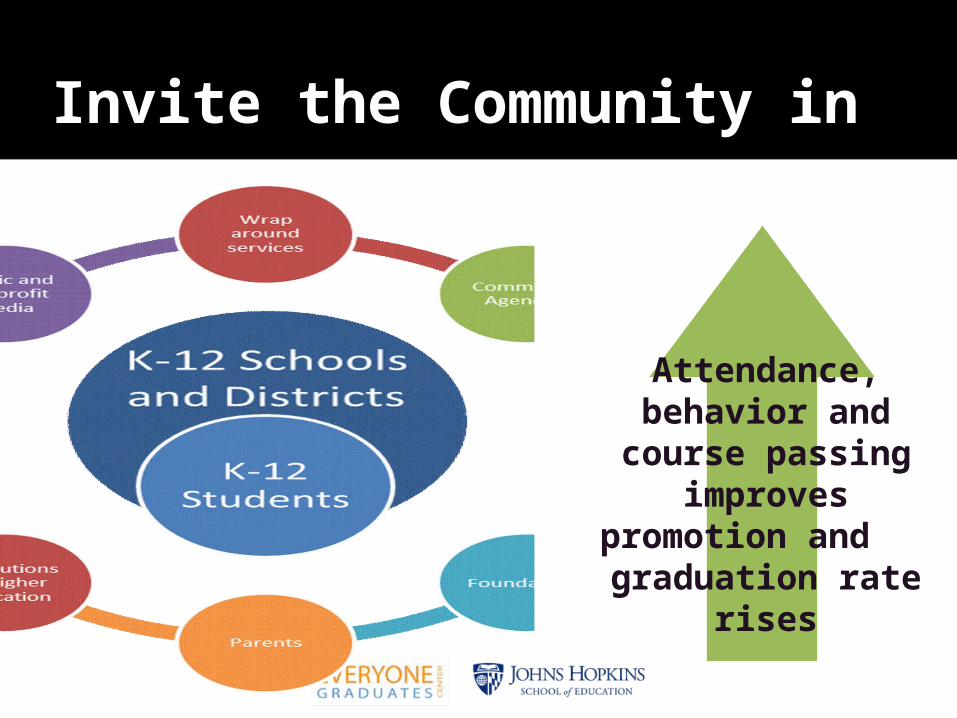
Invite the Community in
Attendance, behavior and course passing
improvespromotion and
graduation rate rises
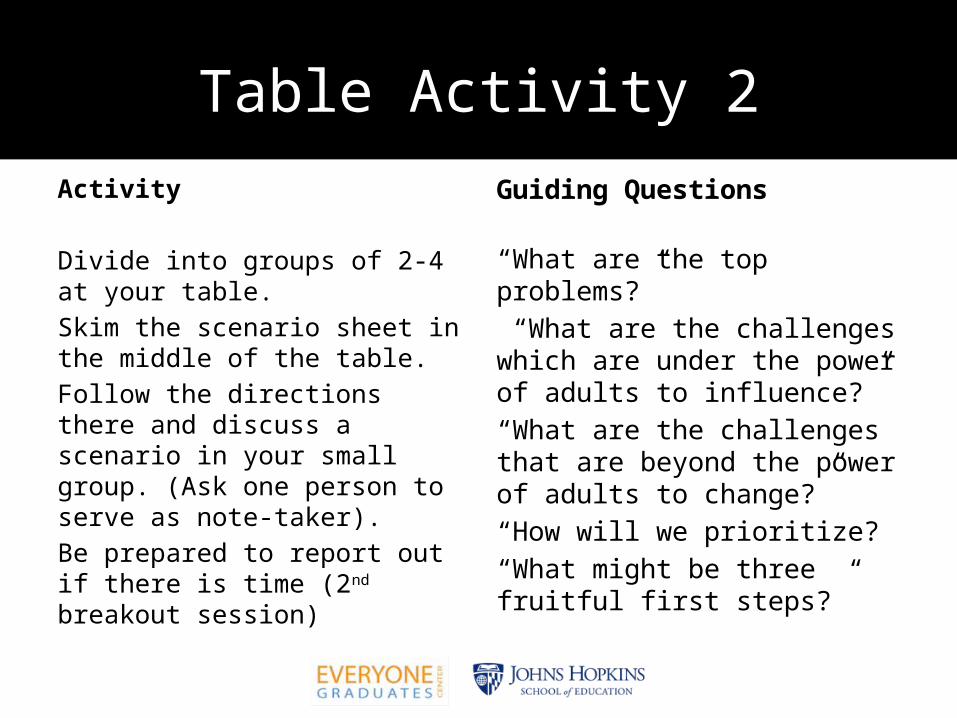
Activity
Divide into groups of 2-4 at your table.Skim the scenario sheet in the middle of the table.Follow the directions there and discuss a scenario in your small group. (Ask one person to serve as note-taker).Be prepared to report out if there is time (2nd breakout session)
Guiding Questions
“What are the top problems?” “What are the challenges which are under the power of adults to influence?”“What are the challenges that are beyond the power of adults to change?”“How will we prioritize?“What might be three fruitful first steps?”
Table Activity 2
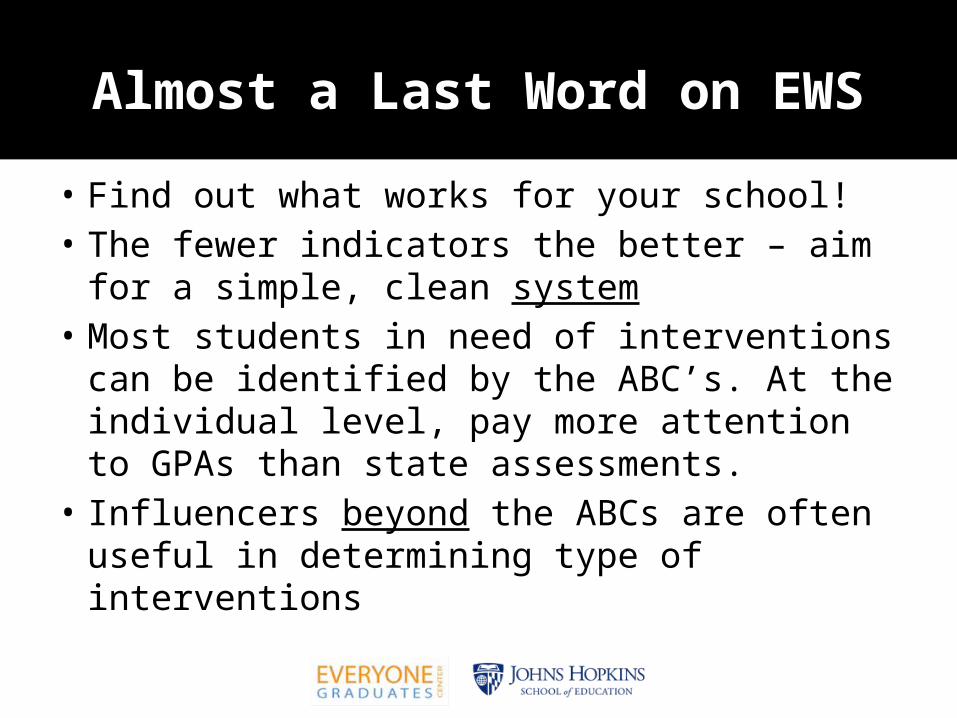
Almost a Last Word on EWS
• Find out what works for your school!• The fewer indicators the better – aim for a
simple, clean system• Most students in need of interventions can be
identified by the ABC’s. At the individual level, pay more attention to GPAs than state assessments.
• Influencers beyond the ABCs are often useful in determining type of interventions
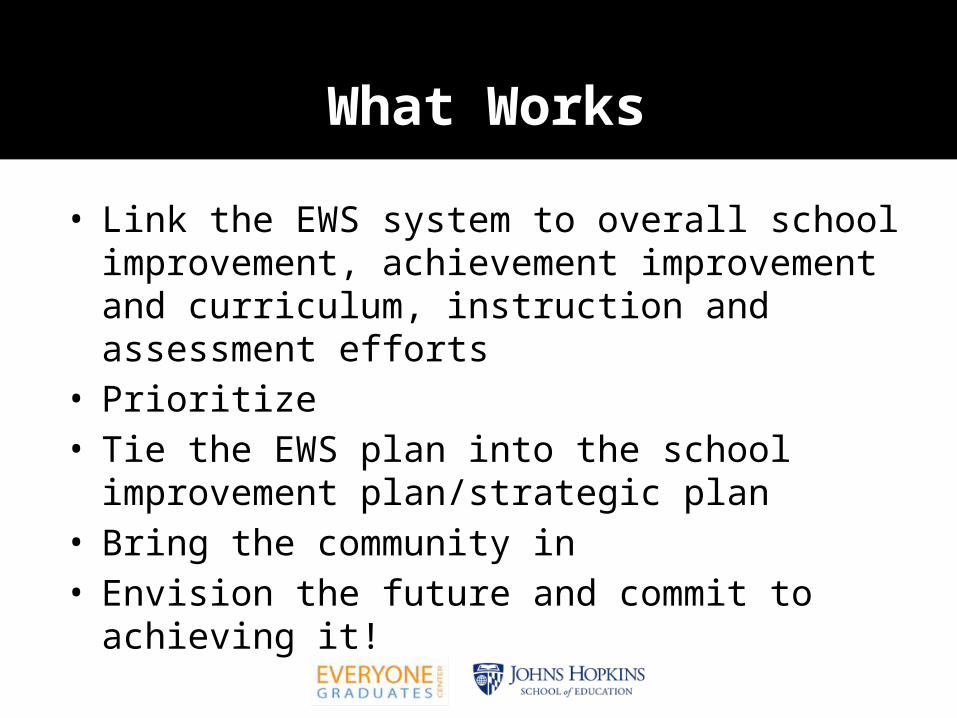
What Works
• Link the EWS system to overall school improvement, achievement improvement and curriculum, instruction and assessment efforts
• Prioritize• Tie the EWS plan into the school improvement
plan/strategic plan• Bring the community in• Envision the future and commit to achieving it!

Contact InformationJoanna Hornig Fox
Deputy DirectorEveryone Graduates Center
Johns Hopkins [email protected] (410) 516-4338
Veronique Zimmerman-BrownProject Director
GEAR UP AlabamaUniversity of Alabama, Birmingham
[email protected](205) 231-2421